monitoring the citrix provisioning server - eg measurements manuals... · monitoring the citrix...
TRANSCRIPT

Monitoring the Citrix Provisioning Server
eG Enterprise v6.0
Restricted Rights Legend
The information contained in this document is confidential and subject to change without notice. No part of this
document may be reproduced or disclosed to others without the prior permission of eG Innovations, Inc. eG
Innovations, Inc. makes no warranty of any kind with regard to the software and documentation, including, but not
limited to, the implied warranties of merchantability and fitness for a particular purpose.
Trademarks
Microsoft Windows, Windows NT, Windows 2000, Windows 2003 and Windows 2008 are either registered trademarks
or trademarks of Microsoft Corporation in United States and/or other countries.
The names of actual companies and products mentioned herein may be the trademarks of their respective owners.
Copyright
© 2014 eG Innovations, Inc. All rights reserved.
The copyright in this document belongs to eG Innovations, Inc. Complying with all applicable copyright laws is the
responsibility of the user.

Table of Contents
MONITORING CITRIX PROVISIONING SERVERS.............................................................................................................. 1
1.1 The Operating System Layer ............................................................................................................................................ 6
1.2 The Network Layer ........................................................................................................................................................... 7
1.3 The Tcp Layer ................................................................................................................................................................... 7
1.4 The Application Processes Layer ...................................................................................................................................... 7
1.5 The Windows Service Layer ............................................................................................................................................. 8
1.6 The PVS Platform Layer ................................................................................................................................................... 9
1.6.1 PVS Farm Test .......................................................................................................................................................... 9
1.6.2 PVS Servers Test .................................................................................................................................................... 14
1.6.3 PVS Sites Test ......................................................................................................................................................... 20
1.6.4 PVS vDisk Pool Test ............................................................................................................................................... 24
1.6.5 PVS Log Test .......................................................................................................................................................... 28
1.6.6 PVS Availability Check Test .................................................................................................................................. 33
1.7 The PVS Stores Layer ..................................................................................................................................................... 35
1.7.1 PVS Stores Test ...................................................................................................................................................... 35
1.7.2 PVS Default Store Path Test ................................................................................................................................... 45
1.7.3 PVS Default Write Cache Paths Test ...................................................................................................................... 47
1.8 The PVS Devices Layer .................................................................................................................................................. 50
1.8.1 Device Collections Test .......................................................................................................................................... 50
1.8.2 PVS Target Devices Test ........................................................................................................................................ 52
CONCLUSION ............................................................................................................................................................................. 62
Table of Figures
Figure 1: The layer model of the Citrix Provisioning server ...................................................................................................................................... 2 Figure 2: The Citrix PVS Console ............................................................................................................................................................................. 3 Figure 3: Selecting the Properties option ................................................................................................................................................................... 3 Figure 4: Viewing the Security Group that is allowed access to the PVS farm by default ......................................................................................... 4 Figure 5: Adding a new Security Group to PVS ........................................................................................................................................................ 4 Figure 6: Selecting the new group to set it as the Security Group that is allowed access to the PVS farm ................................................................ 5 Figure 7: Granting 'Farm Administrator' access to the newly added Security group.................................................................................................. 5 Figure 8: The tests mapped to the Operating System layer ........................................................................................................................................ 6 Figure 9: The tests mapped to the Network layer ...................................................................................................................................................... 7 Figure 10: The test mapped to the Tcp layer ............................................................................................................................................................. 7 Figure 11: The tests mapped to the Application Processes layer ............................................................................................................................... 8 Figure 12: The tests mapped to the Windows Service layer ...................................................................................................................................... 8 Figure 13: The tests mapped to the PVS Platform layer ............................................................................................................................................ 9 Figure 14: The detailed diagnosis of the License server availability measure ........................................................................................................ 13 Figure 15: The detailed diagnosis of the Database server availability measure ....................................................................................................... 13 Figure 16: The detailed diagnosis of the Site count measure ................................................................................................................................... 14 Figure 17: The detailed diagnosis of the Server count measure ............................................................................................................................... 14 Figure 18: The detailed diagnosis of the Stores count measure ............................................................................................................................... 14 Figure 19: The detailed diagnosis of the Farm views defined measure.................................................................................................................... 14 Figure 20: The detailed diagnosis of the Active servers measure ............................................................................................................................ 23 Figure 21: The detailed diagnosis of the Active vDisks measure ............................................................................................................................ 23 Figure 22: The detailed diagnosis of the Num messages measure ........................................................................................................................... 32 Figure 23: The tests mapped to the PVS Stores layer .............................................................................................................................................. 35 Figure 24: The detailed diagnosis of the Is vDisk locked? measure ........................................................................................................................ 45 Figure 25: The test mapped to the PVS Devices layer ............................................................................................................................................. 50 Figure 26: The detailed diagnosis of the Inactive devices measure ......................................................................................................................... 52

Monitor ing C it r ix Prov is ion ing Servers
1
Monitoring Citrix Provisioning Servers The Citrix Provisioning Server enables organizations to reduce the number of systems that they manage,
even as the number of computers continues to grow. This solution simultaneously provides the efficiencies
of a centrally managed solution with the benefits of distributed processing.
This solution’s infrastructure is based on software-streaming technology. Using Provisioning Server,
administrators prepare a device (Master Target Device) for imaging by installing any required software on
that device. A vDisk image is then created from the Master Target Device’s hard drive and saved to the
network (on a Provisioning Server or storage device). Once the vDisk is available from the network, the
target device no longer needs its local hard drive to operate; it boots directly across the network. The
Provisioning Server streams the contents of the vDisk to the target device on demand, in real time. The
target device behaves as if it is running from its local drive.
Snags in the normal functioning of the Provisioning server – for instance, the inability of the server to
connect to the database/License server, or, the existence of corrupt image files on the server – can not only
delay virtual desktop provisioning in XenDesktop environments, but can also cause inexplicable errors in the
streaming of vDisk contents to target devices.
To ensure that such anomalies do not scar the user experience with the Provisioning server, 24 x 7
monitoring of the server is essential. Besides promptly capturing current performance issues, periodic
monitoring can also provide early warning signals of probable issues.
eG Enterprise offers a 100%, web-based Citrix Provisioning Server monitoring model that periodically
monitors the Citrix provisioning servers in a farm, and promptly updates the administrator with the status of
the Provisioning servers, the target devices they manage, the vDisks they create, and the licensing and
database servers they communicate with.
Monitor ing C it r ix Prov is ion ing Servers
2
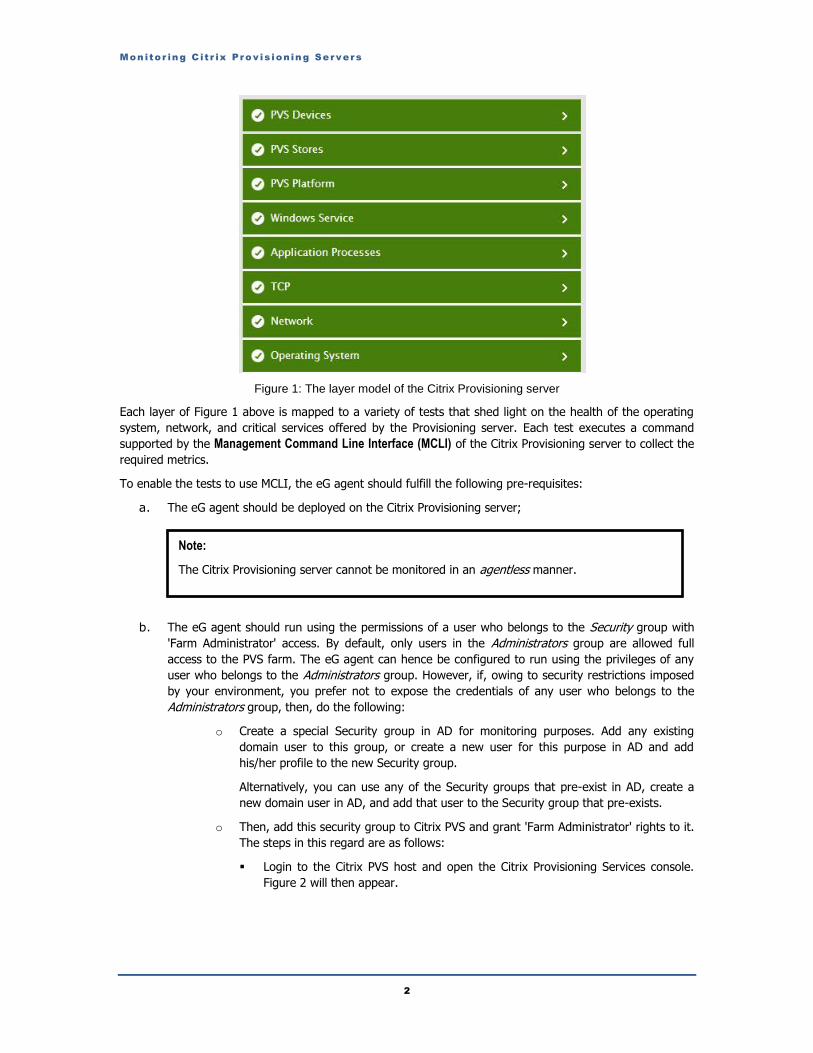
Figure 1: The layer model of the Citrix Provisioning server
Each layer of Figure 1 above is mapped to a variety of tests that shed light on the health of the operating
system, network, and critical services offered by the Provisioning server. Each test executes a command
supported by the Management Command Line Interface (MCLI) of the Citrix Provisioning server to collect the
required metrics.
To enable the tests to use MCLI, the eG agent should fulfill the following pre-requisites:
a. The eG agent should be deployed on the Citrix Provisioning server;
b. The eG agent should run using the permissions of a user who belongs to the Security group with
'Farm Administrator' access. By default, only users in the Administrators group are allowed full
access to the PVS farm. The eG agent can hence be configured to run using the privileges of any
user who belongs to the Administrators group. However, if, owing to security restrictions imposed
by your environment, you prefer not to expose the credentials of any user who belongs to the
Administrators group, then, do the following:
o Create a special Security group in AD for monitoring purposes. Add any existing
domain user to this group, or create a new user for this purpose in AD and add
his/her profile to the new Security group.
Alternatively, you can use any of the Security groups that pre-exist in AD, create a
new domain user in AD, and add that user to the Security group that pre-exists.
o Then, add this security group to Citrix PVS and grant 'Farm Administrator' rights to it.
The steps in this regard are as follows:
Login to the Citrix PVS host and open the Citrix Provisioning Services console.
Figure 2 will then appear.
Note:
The Citrix Provisioning server cannot be monitored in an agentless manner.
Monitor ing C it r ix Prov is ion ing Servers
3
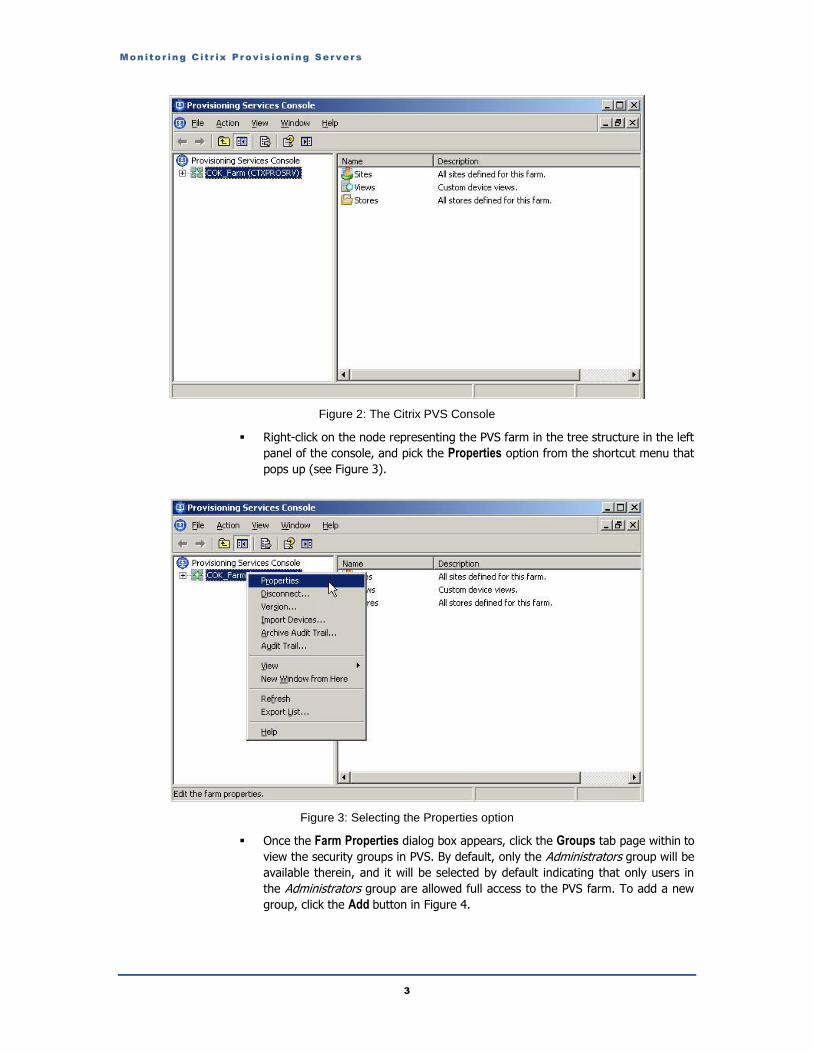
Figure 2: The Citrix PVS Console
Right-click on the node representing the PVS farm in the tree structure in the left
panel of the console, and pick the Properties option from the shortcut menu that
pops up (see Figure 3).
Figure 3: Selecting the Properties option
Once the Farm Properties dialog box appears, click the Groups tab page within to
view the security groups in PVS. By default, only the Administrators group will be
available therein, and it will be selected by default indicating that only users in
the Administrators group are allowed full access to the PVS farm. To add a new
group, click the Add button in Figure 4.
Monitor ing C it r ix Prov is ion ing Servers
4
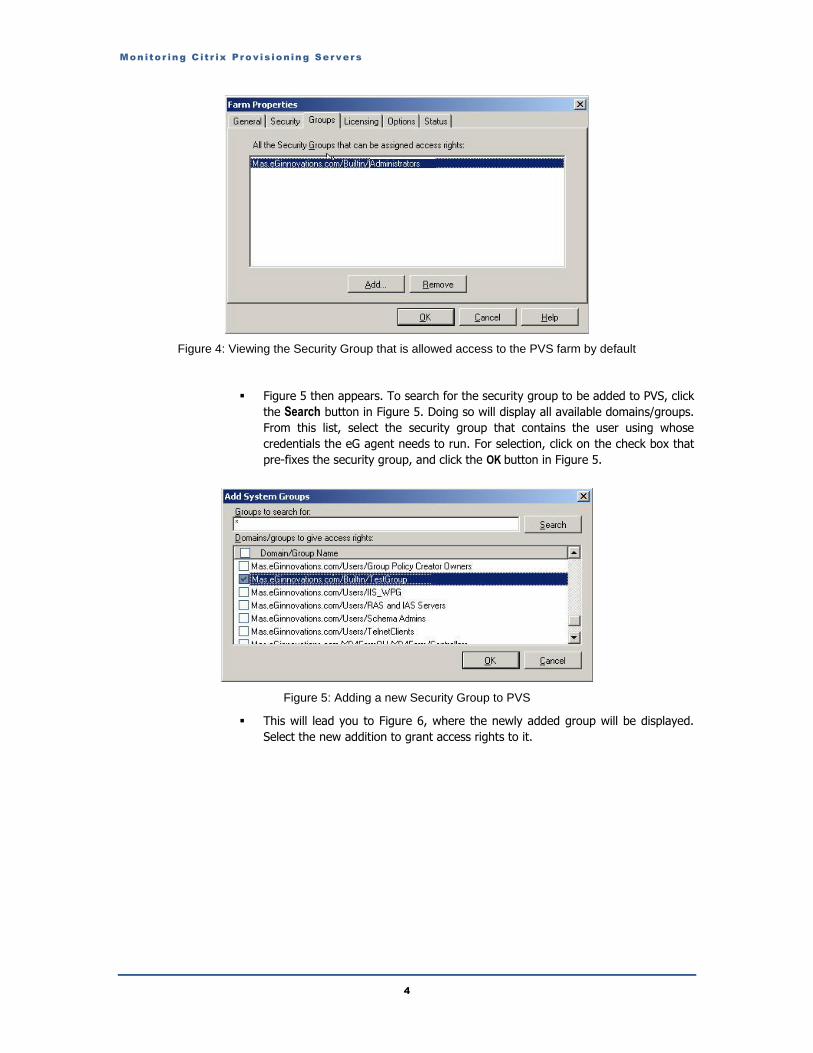
Figure 4: Viewing the Security Group that is allowed access to the PVS farm by default
Figure 5 then appears. To search for the security group to be added to PVS, click
the Search button in Figure 5. Doing so will display all available domains/groups.
From this list, select the security group that contains the user using whose
credentials the eG agent needs to run. For selection, click on the check box that
pre-fixes the security group, and click the OK button in Figure 5.
Figure 5: Adding a new Security Group to PVS
This will lead you to Figure 6, where the newly added group will be displayed.
Select the new addition to grant access rights to it.
Monitor ing C it r ix Prov is ion ing Servers
5
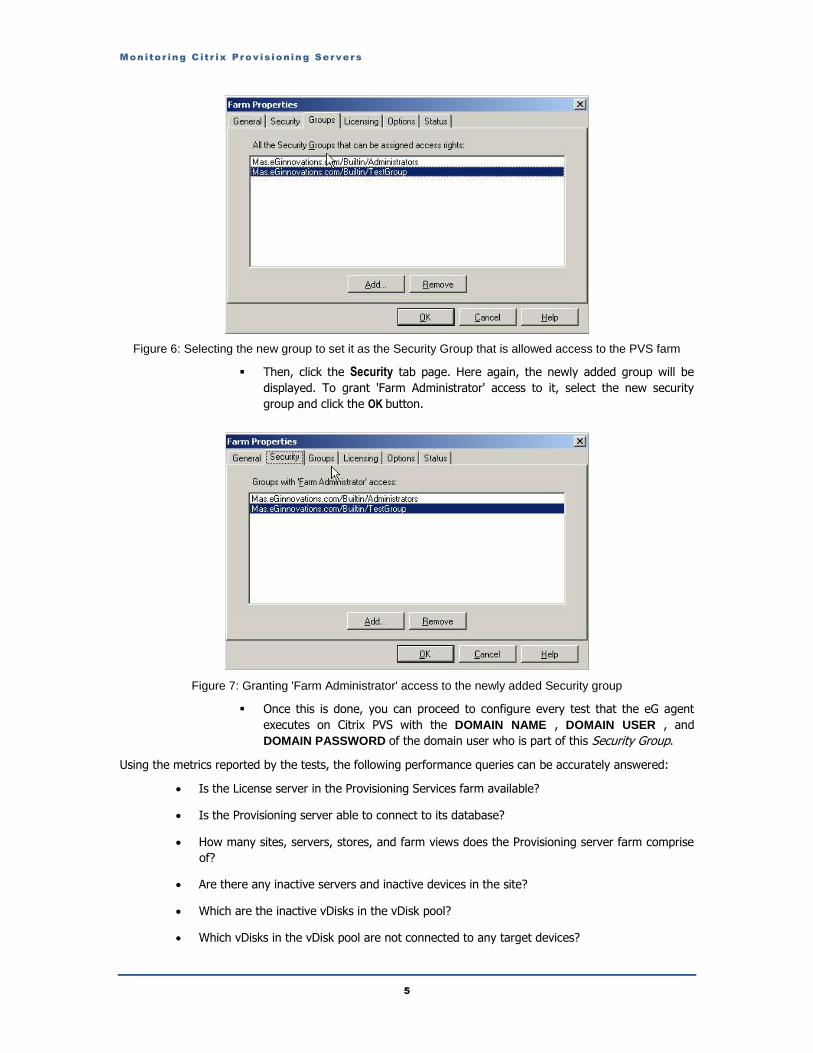
Figure 6: Selecting the new group to set it as the Security Group that is allowed access to the PVS farm
Then, click the Security tab page. Here again, the newly added group will be
displayed. To grant 'Farm Administrator' access to it, select the new security
group and click the OK button.
Figure 7: Granting 'Farm Administrator' access to the newly added Security group
Once this is done, you can proceed to configure every test that the eG agent
executes on Citrix PVS with the DOMAIN NAME , DOMAIN USER , and
DOMAIN PASSWORD of the domain user who is part of this Security Group.
Using the metrics reported by the tests, the following performance queries can be accurately answered:
Is the License server in the Provisioning Services farm available?
Is the Provisioning server able to connect to its database?
How many sites, servers, stores, and farm views does the Provisioning server farm comprise
of?
Are there any inactive servers and inactive devices in the site?
Which are the inactive vDisks in the vDisk pool?
Which vDisks in the vDisk pool are not connected to any target devices?
Monitor ing C it r ix Prov is ion ing Servers
6
Are any vDisks locked? Are any target devices mapped to such vDisks?
Is the write-cache of any vDisk growing at an alarming rate?
Have any errors been recently captured by the error log?
Which device collection consists of the maximum number of inactive devices? Which devices
in the collection are inactive?
The sections that follow will discuss each layer of Figure 1 in great detail.
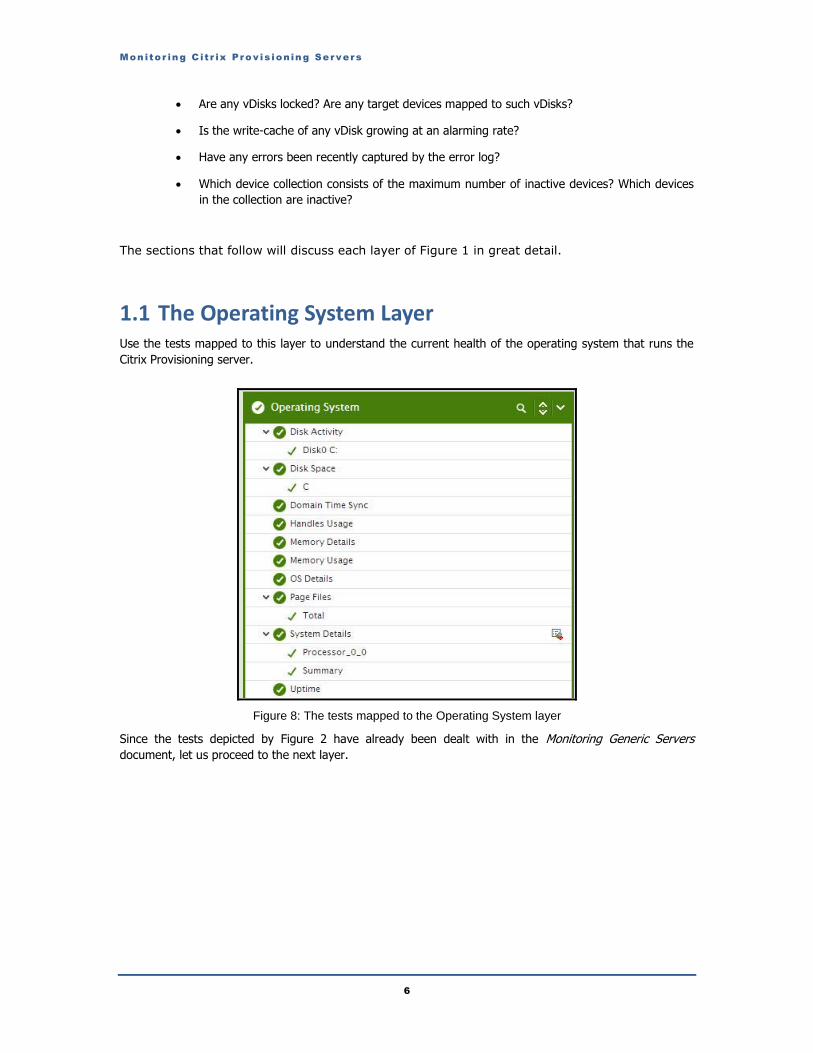
1.1 The Operating System Layer Use the tests mapped to this layer to understand the current health of the operating system that runs the
Citrix Provisioning server.
Figure 8: The tests mapped to the Operating System layer
Since the tests depicted by Figure 2 have already been dealt with in the Monitoring Generic Servers
document, let us proceed to the next layer.
Monitor ing C it r ix Prov is ion ing Servers
7
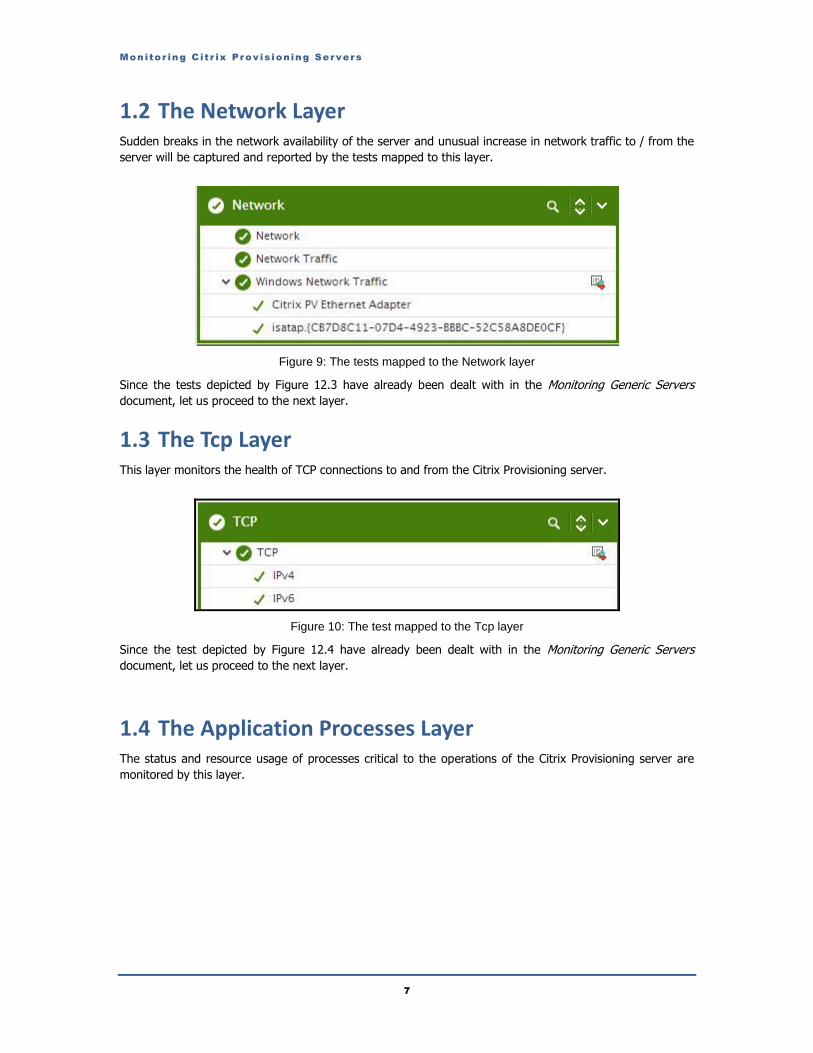
1.2 The Network Layer Sudden breaks in the network availability of the server and unusual increase in network traffic to / from the
server will be captured and reported by the tests mapped to this layer.
Figure 9: The tests mapped to the Network layer
Since the tests depicted by Figure 12.3 have already been dealt with in the Monitoring Generic Servers
document, let us proceed to the next layer.
1.3 The Tcp Layer This layer monitors the health of TCP connections to and from the Citrix Provisioning server.
Figure 10: The test mapped to the Tcp layer
Since the test depicted by Figure 12.4 have already been dealt with in the Monitoring Generic Servers
document, let us proceed to the next layer.
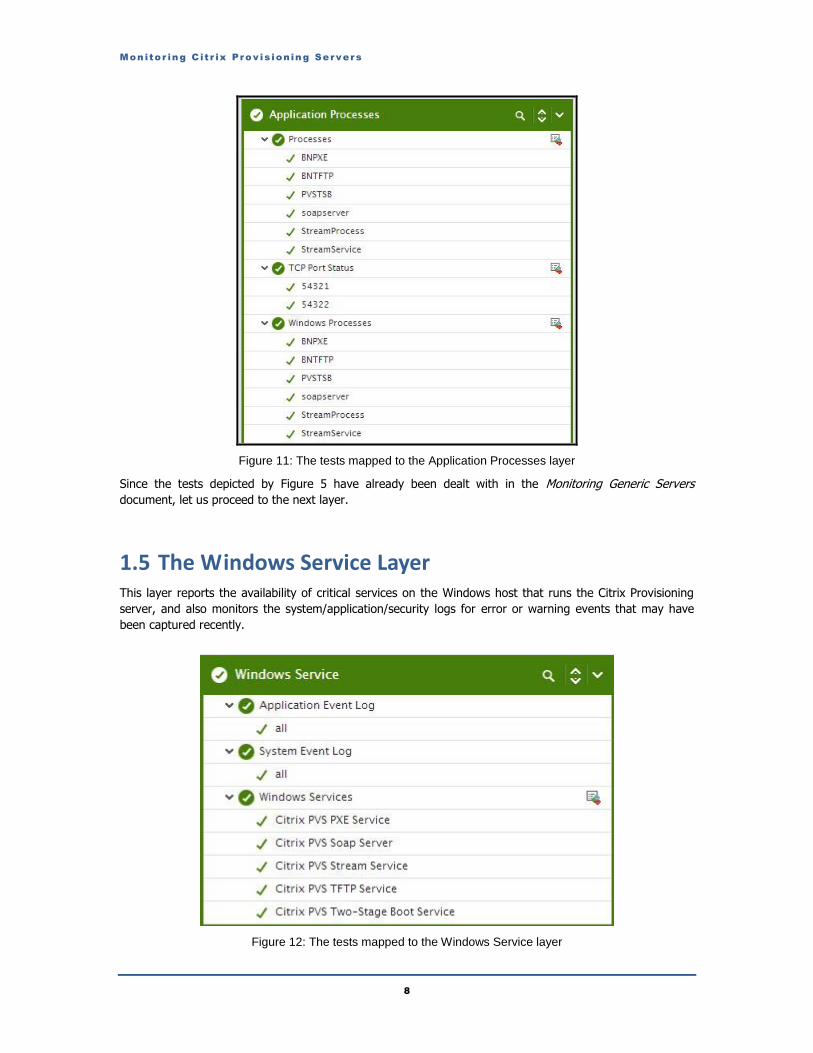
1.4 The Application Processes Layer The status and resource usage of processes critical to the operations of the Citrix Provisioning server are
monitored by this layer.
Monitor ing C it r ix Prov is ion ing Servers
8
Figure 11: The tests mapped to the Application Processes layer
Since the tests depicted by Figure 5 have already been dealt with in the Monitoring Generic Servers
document, let us proceed to the next layer.
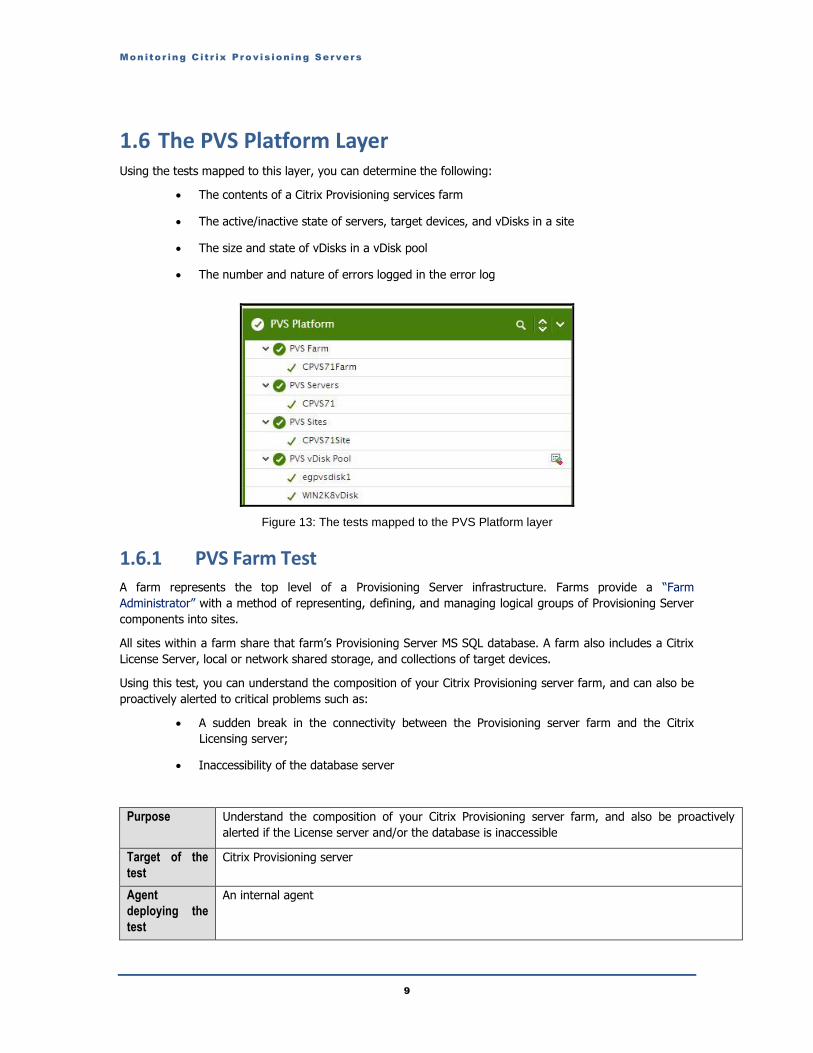
1.5 The Windows Service Layer This layer reports the availability of critical services on the Windows host that runs the Citrix Provisioning
server, and also monitors the system/application/security logs for error or warning events that may have
been captured recently.
Figure 12: The tests mapped to the Windows Service layer
Monitor ing C it r ix Prov is ion ing Servers
9
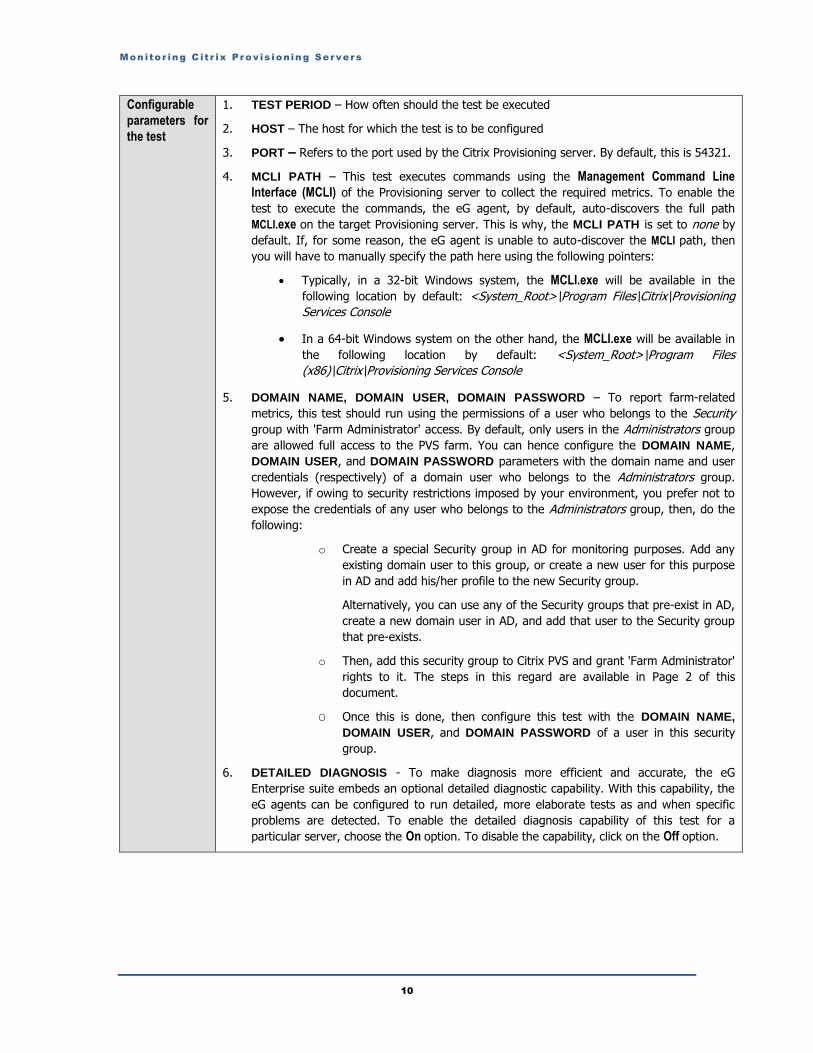
1.6 The PVS Platform Layer Using the tests mapped to this layer, you can determine the following:
The contents of a Citrix Provisioning services farm
The active/inactive state of servers, target devices, and vDisks in a site
The size and state of vDisks in a vDisk pool
The number and nature of errors logged in the error log
Figure 13: The tests mapped to the PVS Platform layer
1.6.1 PVS Farm Test
A farm represents the top level of a Provisioning Server infrastructure. Farms provide a “Farm
Administrator” with a method of representing, defining, and managing logical groups of Provisioning Server
components into sites.
All sites within a farm share that farm’s Provisioning Server MS SQL database. A farm also includes a Citrix
License Server, local or network shared storage, and collections of target devices.
Using this test, you can understand the composition of your Citrix Provisioning server farm, and can also be
proactively alerted to critical problems such as:
A sudden break in the connectivity between the Provisioning server farm and the Citrix
Licensing server;
Inaccessibility of the database server
Purpose Understand the composition of your Citrix Provisioning server farm, and also be proactively
alerted if the License server and/or the database is inaccessible
Target of the
test
Citrix Provisioning server
Agent
deploying the
test
An internal agent
Monitor ing C it r ix Prov is ion ing Servers
10
Configurable
parameters for
the test
1. TEST PERIOD – How often should the test be executed
2. HOST – The host for which the test is to be configured
3. PORT – Refers to the port used by the Citrix Provisioning server. By default, this is 54321.
4. MCLI PATH – This test executes commands using the Management Command Line
Interface (MCLI) of the Provisioning server to collect the required metrics. To enable the
test to execute the commands, the eG agent, by default, auto-discovers the full path
MCLI.exe on the target Provisioning server. This is why, the MCLI PATH is set to none by
default. If, for some reason, the eG agent is unable to auto-discover the MCLI path, then
you will have to manually specify the path here using the following pointers:
Typically, in a 32-bit Windows system, the MCLI.exe will be available in the
following location by default: <System_Root>\Program Files\Citrix\Provisioning
Services Console
In a 64-bit Windows system on the other hand, the MCLI.exe will be available in
the following location by default: <System_Root>\Program Files
(x86)\Citrix\Provisioning Services Console
5. DOMAIN NAME, DOMAIN USER, DOMAIN PASSWORD – To report farm-related
metrics, this test should run using the permissions of a user who belongs to the Security
group with 'Farm Administrator' access. By default, only users in the Administrators group
are allowed full access to the PVS farm. You can hence configure the DOMAIN NAME,
DOMAIN USER, and DOMAIN PASSWORD parameters with the domain name and user
credentials (respectively) of a domain user who belongs to the Administrators group.
However, if owing to security restrictions imposed by your environment, you prefer not to
expose the credentials of any user who belongs to the Administrators group, then, do the
following:
o Create a special Security group in AD for monitoring purposes. Add any
existing domain user to this group, or create a new user for this purpose
in AD and add his/her profile to the new Security group.
Alternatively, you can use any of the Security groups that pre-exist in AD,
create a new domain user in AD, and add that user to the Security group
that pre-exists.
o Then, add this security group to Citrix PVS and grant 'Farm Administrator'
rights to it. The steps in this regard are available in Page 2 of this
document.
O Once this is done, then configure this test with the DOMAIN NAME,
DOMAIN USER, and DOMAIN PASSWORD of a user in this security
group.
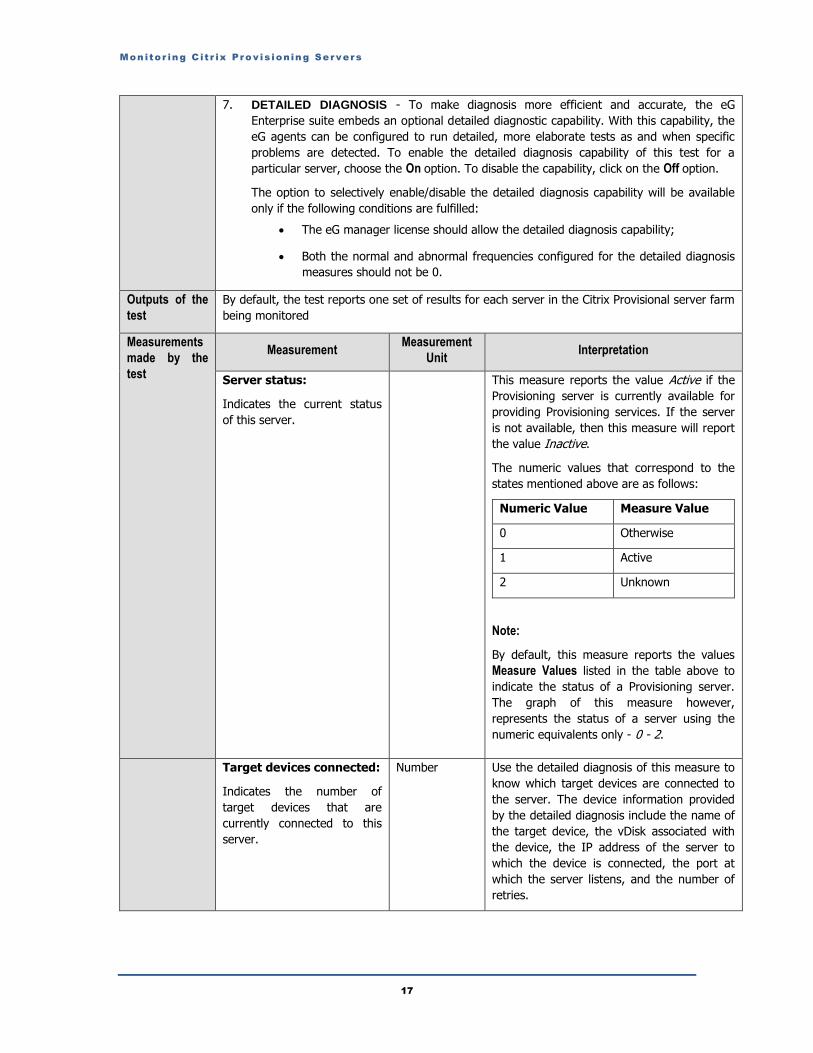
6. DETAILED DIAGNOSIS - To make diagnosis more efficient and accurate, the eG
Enterprise suite embeds an optional detailed diagnostic capability. With this capability, the
eG agents can be configured to run detailed, more elaborate tests as and when specific
problems are detected. To enable the detailed diagnosis capability of this test for a
particular server, choose the On option. To disable the capability, click on the Off option.
Monitor ing C it r ix Prov is ion ing Servers
11
The option to selectively enable/disable the detailed diagnosis capability will be available
only if the following conditions are fulfilled:
The eG manager license should allow the detailed diagnosis capability;
Both the normal and abnormal frequencies configured for the detailed diagnosis
measures should not be 0.
Outputs of the
test
One set of results for every Citrix Provisional server farm being monitored
Measurements
made by the
test
Measurement Measurement
Unit Interpretation
License server
availability:
Indicates the availability of
the Citrix License Server
which is used to hold the
Citrix Provisioning Server
licenses.
Percent If the value returned is 0, it indicates that the
farm is not able to reach the Citrix License
server. The value 100 indicates that the
License server is accessible.
If a Citrix License server is suddenly rendered
unavailable, then all active Provisioning
Services clients will continue working until a
restart occurs. If the License server continues
to remain unavailable during startup, then
the clients go to grace period; till the end of
the grace period of 720 hours, the
Provisioning Services clients continue
working. Once the grace period ends, the
clients restart again. If the Citrix License
server is still unavailable, then the clients
receive a five-minute shutdown-warning
message; at the end of the 5 minutes, the
clients shutdown.
If the License server is unavailable, you may
want to use the detailed diagnosis of this
measure to determine the IP address and
port number of the License server, so that
further investigations can be performed.
Monitor ing C it r ix Prov is ion ing Servers
12
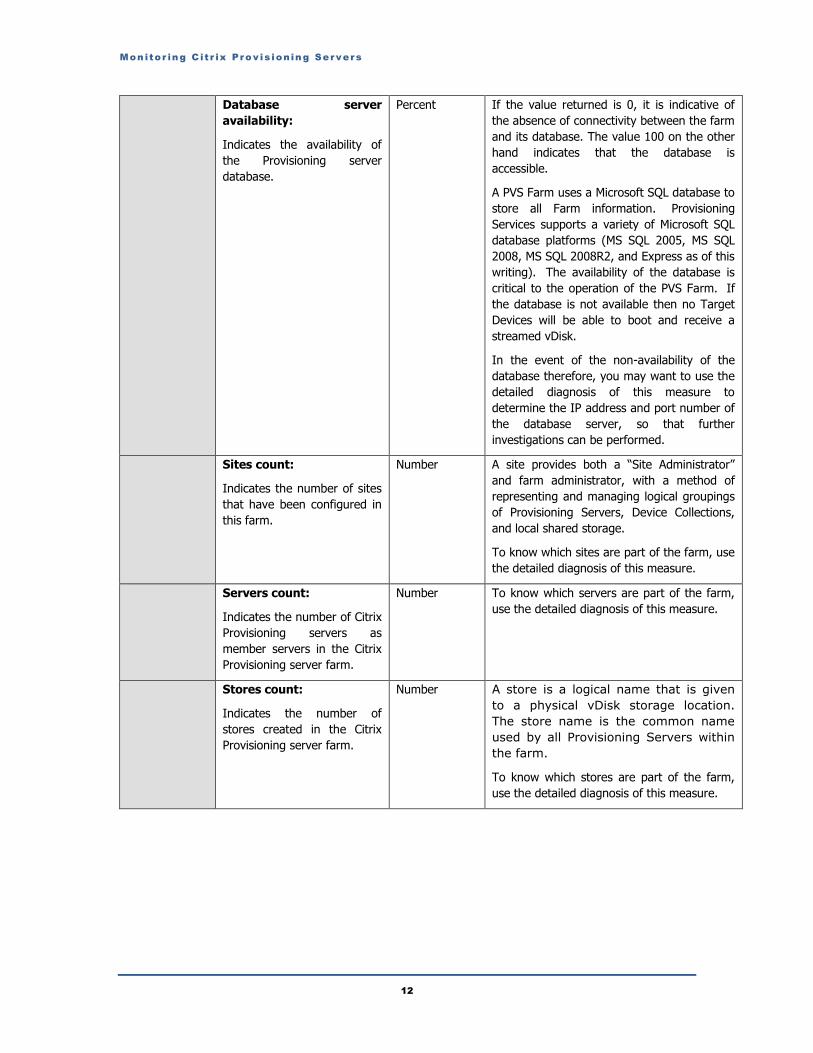
Database server
availability:
Indicates the availability of
the Provisioning server
database.
Percent If the value returned is 0, it is indicative of
the absence of connectivity between the farm
and its database. The value 100 on the other
hand indicates that the database is
accessible.
A PVS Farm uses a Microsoft SQL database to
store all Farm information. Provisioning
Services supports a variety of Microsoft SQL
database platforms (MS SQL 2005, MS SQL
2008, MS SQL 2008R2, and Express as of this
writing). The availability of the database is
critical to the operation of the PVS Farm. If
the database is not available then no Target
Devices will be able to boot and receive a
streamed vDisk.
In the event of the non-availability of the
database therefore, you may want to use the
detailed diagnosis of this measure to
determine the IP address and port number of
the database server, so that further
investigations can be performed.
Sites count:
Indicates the number of sites
that have been configured in
this farm.
Number A site provides both a “Site Administrator”
and farm administrator, with a method of
representing and managing logical groupings
of Provisioning Servers, Device Collections,
and local shared storage.
To know which sites are part of the farm, use
the detailed diagnosis of this measure.
Servers count:
Indicates the number of Citrix
Provisioning servers as
member servers in the Citrix
Provisioning server farm.
Number To know which servers are part of the farm,
use the detailed diagnosis of this measure.
Stores count:
Indicates the number of
stores created in the Citrix
Provisioning server farm.
Number A store is a logical name that is given
to a physical vDisk storage location.
The store name is the common name
used by all Provisioning Servers within
the farm.
To know which stores are part of the farm,
use the detailed diagnosis of this measure.

Monitor ing C it r ix Prov is ion ing Servers
13
Farm views defined:
Indicates the number of
views created in the Citrix
Provisioning server.
Number You can create views containing target
devices to display only those target
devices that you are currently
interested in viewing or performing
tasks on. Adding target devices to a
view provides a quick and easy way to
perform a task on members of that
view, such as:
c. Boot
d. Restart
e. Shutdown
f. Send message
Views can be created at the site level or
at the farm level.
To know which views are part of the farm,
use the detailed diagnosis of this measure.
The detailed diagnosis of the License server availability measure allows you to view the IP address and port
number of the License server used by a farm. If the License server is unavailable, you may want to use the
detailed diagnosis of this measure to determine the IP address and port number of the License server, so
that further investigations can be performed.
Figure 14: The detailed diagnosis of the License server availability measure
The detailed diagnosis of the Database server availability measure reveals the IP address, port number and
database instance of the database server used for storing the configuration settings of the farm. In the
event of the non-availability of the database therefore, you may want to use the detailed diagnosis of this
measure to determine the IP address and port number of the database server, so that further investigations
can be performed.
Figure 15: The detailed diagnosis of the Database server availability measure
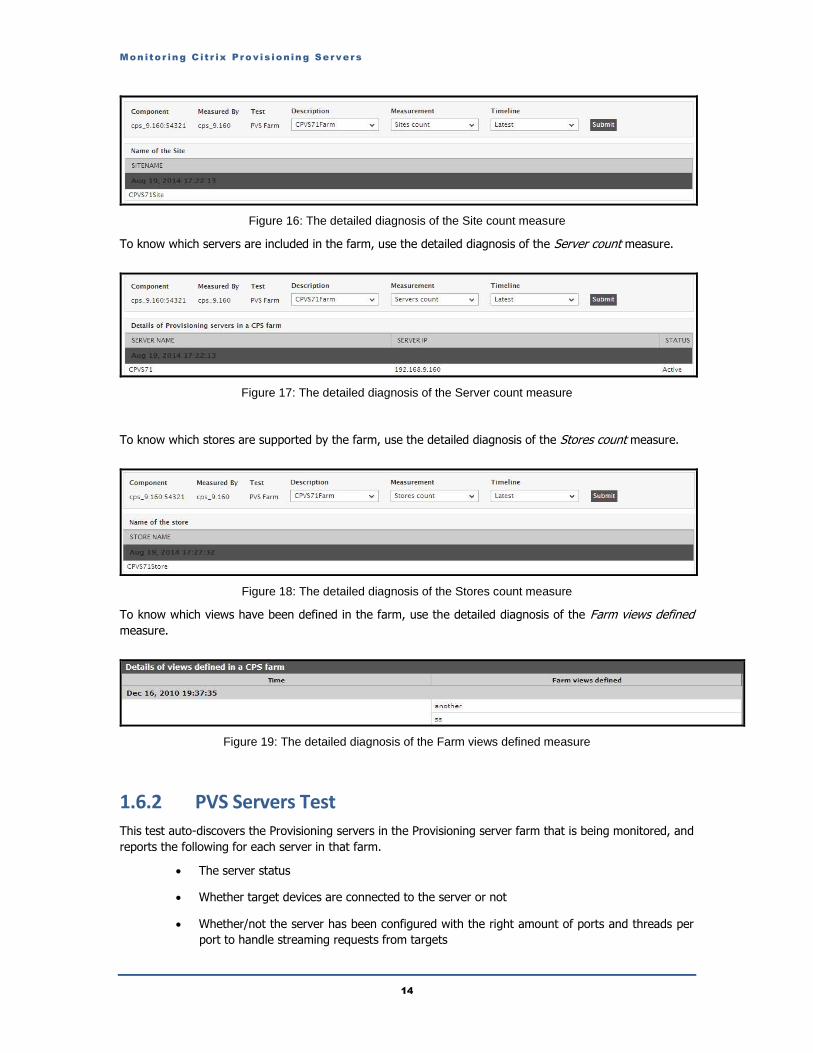
To know which sites have been configured in the farm, use the detailed diagnosis of the Site count
measure.
Monitor ing C it r ix Prov is ion ing Servers
14
Figure 16: The detailed diagnosis of the Site count measure
To know which servers are included in the farm, use the detailed diagnosis of the Server count measure.
Figure 17: The detailed diagnosis of the Server count measure
To know which stores are supported by the farm, use the detailed diagnosis of the Stores count measure.
Figure 18: The detailed diagnosis of the Stores count measure
To know which views have been defined in the farm, use the detailed diagnosis of the Farm views defined
measure.
Figure 19: The detailed diagnosis of the Farm views defined measure
1.6.2 PVS Servers Test
This test auto-discovers the Provisioning servers in the Provisioning server farm that is being monitored, and
reports the following for each server in that farm.
The server status
Whether target devices are connected to the server or not
Whether/not the server has been configured with the right amount of ports and threads per
port to handle streaming requests from targets

Monitor ing C it r ix Prov is ion ing Servers
15
Purpose Auto-discovers the Provisioning servers in the Provisioning server farm that is being monitored,
and reports the following for each server in that farm
The server status
Whether target devices are connected to the server or not
Whether/not the server has been configured with the right amount of ports and
threads per port to handle streaming requests from targets
Target of the
test
A Citrix Provisioning server
Agent
deploying the
test
An internal agent

Monitor ing C it r ix Prov is ion ing Servers
16
Configurable
parameters for
the test
1. TEST PERIOD – How often should the test be executed
2. HOST – The host for which the test is to be configured
3. PORT – Refers to the port used by the Citrix Provisioning server. By default, this is 54321.
4. MCLI PATH – This test executes commands using the Management Command Line
Interface (MCLI) of the Provisioning server to collect the required metrics. To enable the
test to execute the commands, the eG agent, by default, auto-discovers the full path
MCLI.exe on the target Provisioning server. This is why, the MCLI PATH is set to none by
default. If, for some reason, the eG agent is unable to auto-discover the MCLI path, then
you will have to manually specify the path here using the following pointers:
Typically, in a 32-bit Windows system, the MCLI.exe will be available in the
following location by default: <System_Root>\Program Files\Citrix\Provisioning
Services Console
In a 64-bit Windows system on the other hand, the MCLI.exe will be available in
the following location by default: <System_Root>\Program Files
(x86)\Citrix\Provisioning Services Console
5. DOMAIN NAME, DOMAIN USER, DOMAIN PASSWORD – To report the desired metrics,
this test should run using the permissions of a user who belongs to the Security group with
'Farm Administrator' access. By default, only users in the Administrators group are allowed
full access to the PVS farm. You can hence configure the DOMAIN NAME, DOMAIN
USER, and DOMAIN PASSWORD parameters with the domain name and user credentials
(respectively) of a domain user who belongs to the Administrators group. However, if
owing to security restrictions imposed by your environment, you prefer not to expose the
credentials of any user who belongs to the Administrators group, then, do the following:
o Create a special Security group in AD for monitoring purposes. Add any
existing domain user to this group, or create a new user for this purpose
in AD and add his/her profile to the new Security group.
Alternatively, you can use any of the Security groups that pre-exist in AD,
create a new domain user in AD, and add that user to the Security group
that pre-exists.
o Then, add this security group to Citrix PVS and grant 'Farm Administrator'
rights to it. The steps in this regard are available in Page 2 of this
document.
O ONCE THIS IS DONE, THEN CONFIGURE THIS TEST WITH THE
DOMAIN NAME, DOMAIN USER, and DOMAIN PASSWORD of a user
in this security group.
6. LOCAL HOST ONLY - By default, this flag is set to No. This implies that, by default, the
test auto-discovers all the servers that are part of the PVS farm, and reports metrics for
each server. Setting the flag to Yes ensures that the test reports metrics for only that
server, which is being monitored.
Monitor ing C it r ix Prov is ion ing Servers
17
7. DETAILED DIAGNOSIS - To make diagnosis more efficient and accurate, the eG
Enterprise suite embeds an optional detailed diagnostic capability. With this capability, the
eG agents can be configured to run detailed, more elaborate tests as and when specific
problems are detected. To enable the detailed diagnosis capability of this test for a
particular server, choose the On option. To disable the capability, click on the Off option.
The option to selectively enable/disable the detailed diagnosis capability will be available
only if the following conditions are fulfilled:
The eG manager license should allow the detailed diagnosis capability;
Both the normal and abnormal frequencies configured for the detailed diagnosis
measures should not be 0.
Outputs of the
test
By default, the test reports one set of results for each server in the Citrix Provisional server farm
being monitored
Measurements
made by the
test
Measurement Measurement
Unit Interpretation
Server status:
Indicates the current status
of this server.
This measure reports the value Active if the
Provisioning server is currently available for
providing Provisioning services. If the server
is not available, then this measure will report
the value Inactive.
The numeric values that correspond to the
states mentioned above are as follows:
Numeric Value Measure Value
0 Otherwise
1 Active
2 Unknown
Note:
By default, this measure reports the values
Measure Values listed in the table above to
indicate the status of a Provisioning server.
The graph of this measure however,
represents the status of a server using the
numeric equivalents only - 0 - 2.
Target devices connected:
Indicates the number of
target devices that are
currently connected to this
server.
Number Use the detailed diagnosis of this measure to
know which target devices are connected to
the server. The device information provided
by the detailed diagnosis include the name of
the target device, the vDisk associated with
the device, the IP address of the server to
which the device is connected, the port at
which the server listens, and the number of
retries.

Monitor ing C it r ix Prov is ion ing Servers
18
Current target devices
connections:
Indicates the number of
streaming requests from
target devices currently
serviced by this server.
Number This measure serves as a good indicator of
the current workload of the Citrix PVS server.
Threads per port:
Indicates the number of
threads in the thread pool
that this server should use to
service UDP packets received
on a given UDP port.
Number The value of these two measures are in fact
server configurations, which if not set
correctly, can adversely impact the
performance of the PVS server.
The Ports measure for instance denotes the
number of ports in the Port Range set for the
server. The Port Range is nothing but a range
of ports used by the Stream Service for
target device communications. By default, 20
ports are configured for target device
communications.
You can also configure the number of threads
that each of the configured ports can use to
service requests. This is configured using the
Threads per port server setting and the same
is reported by the Threads per port measure.
Larger numbers of threads allow more target
device requests to be processed
simultaneously, but it consumes more system
resources.
Together, the two settings discussed above
help compute the number of concurrent
requests that the PVS server can service. By
default, this will be 160 concurrent
requests (20 ports * 8 threads per port =
160 requests).
In an optimal scenario, you should configure
a ports / threads combination that equals the
amount of active target devices. So in short,
for best performance,
“# of ports” x “# of threads/port” =
“max clients”.
Also, make sure that your Threads per port
setting is not greater than the number of
cores available on the PVS server.
Ports:
Indicates the difference
between last port and first
port in the port range
configured for the
Provisioning server.
Number
Monitor ing C it r ix Prov is ion ing Servers
19
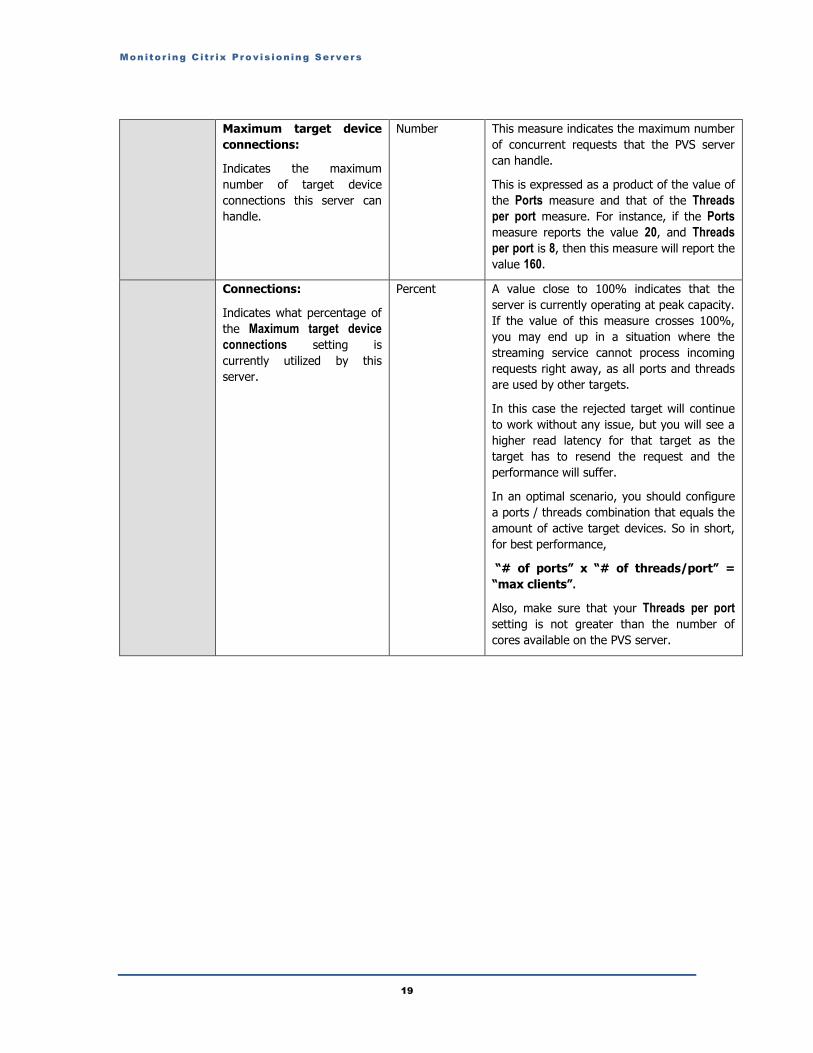
Maximum target device
connections:
Indicates the maximum
number of target device
connections this server can
handle.
Number This measure indicates the maximum number
of concurrent requests that the PVS server
can handle.
This is expressed as a product of the value of
the Ports measure and that of the Threads
per port measure. For instance, if the Ports
measure reports the value 20, and Threads
per port is 8, then this measure will report the
value 160.
Connections:
Indicates what percentage of
the Maximum target device
connections setting is
currently utilized by this
server.
Percent A value close to 100% indicates that the
server is currently operating at peak capacity.
If the value of this measure crosses 100%,
you may end up in a situation where the
streaming service cannot process incoming
requests right away, as all ports and threads
are used by other targets.
In this case the rejected target will continue
to work without any issue, but you will see a
higher read latency for that target as the
target has to resend the request and the
performance will suffer.
In an optimal scenario, you should configure
a ports / threads combination that equals the
amount of active target devices. So in short,
for best performance,
“# of ports” x “# of threads/port” =
“max clients”.
Also, make sure that your Threads per port
setting is not greater than the number of
cores available on the PVS server.
Monitor ing C it r ix Prov is ion ing Servers
20
Remaining target devices
connections:
Indicates how many more
requests this server can
handle.
Number The value of this measure is calculated using
the following formula:
Maximum target device connections –
[(Connections * Maximum target device
connections)/100]
For example, if the Maximum target device
connections measure reports the value 160
and the Target device connections measure
reports the value 20%, then the value of this
measure will be:
160 – (20/100 * 160) = 128
Ideally, the value of this measure should be
high. A low value or a negative value for this
measure implies that all/most of the threads
and ports of the server are already in use.
Subsequent streaming requests will hence
not be serviced right away by the port. This
will increase the read latency of the target
and cause performance to suffer. You may
hence want to allocate more threads and
ports to the server using the Port range and
Threads per port server properties.
1.6.3 PVS Sites Test
A site provides both a “Site Administrator” and farm administrator, with a method of representing and
managing logical groupings of Provisioning Servers, Device Collections, and local shared storage.
Provisioning Servers within a site, communicate with farm components to obtain the information necessary
to boot target devices and to provide target devices with the appropriate vDisk.
This test auto-discovers the sites configured within a Provisioning server farm, and reports the number and
status of servers, target devices, and vDisks managed by the site.
Purpose Auto-discovers the sites configured within a Provisioning server farm, and reports the number
and status of servers, target devices, and vDisks managed by the site
Target of the
test
A Citrix Provisioning server
Agent
deploying the
test
An internal agent
Monitor ing C it r ix Prov is ion ing Servers
21
Configurable
parameters for
the test
1. TEST PERIOD – How often should the test be executed
2. HOST – The host for which the test is to be configured
3. PORT – Refers to the port used by the Citrix Provisioning server. By default, this is 54321.
4. MCLI PATH – This test executes commands using the Management Command Line
Interface (MCLI) of the Provisioning server to collect the required metrics. To enable the
test to execute the commands, the eG agent, by default, auto-discovers the full path
MCLI.exe on the target Provisioning server. This is why, the MCLI PATH is set to none by
default. If, for some reason, the eG agent is unable to auto-discover the MCLI path, then
you will have to manually specify the path here using the following pointers:
Typically, in a 32-bit Windows system, the MCLI.exe will be available in the
following location by default: <System_Root>\Program Files\Citrix\Provisioning
Services Console
In a 64-bit Windows system on the other hand, the MCLI.exe will be available in
the following location by default: <System_Root>\Program Files
(x86)\Citrix\Provisioning Services Console
5. DOMAIN NAME, DOMAIN USER, DOMAIN PASSWORD – To report the desired metrics,
this test should run using the permissions of a user who belongs to the Security group with
'Farm Administrator' access. By default, only users in the Administrators group are allowed
full access to the PVS farm. You can hence configure the DOMAIN NAME, DOMAIN
USER, and DOMAIN PASSWORD parameters with the domain name and user credentials
(respectively) of a domain user who belongs to the Administrators group. However, if
owing to security restrictions imposed by your environment, you prefer not to expose the
credentials of any user who belongs to the Administrators group, then, do the following:
o Create a special Security group in AD for monitoring purposes. Add any
existing domain user to this group, or create a new user for this purpose
in AD and add his/her profile to the new Security group.
Alternatively, you can use any of the Security groups that pre-exist in AD,
create a new domain user in AD, and add that user to the Security group
that pre-exists.
o Then, add this security group to Citrix PVS and grant 'Farm Administrator'
rights to it. The steps in this regard are available in Page 2 of this
document.
O ONCE THIS IS DONE, THEN CONFIGURE THIS TEST WITH THE
DOMAIN NAME, DOMAIN USER, and DOMAIN PASSWORD of a user
in this security group.
6. LOCAL HOST ONLY - By default, this flag is set to No. This implies that, by default, the
test auto-discovers all the servers that are part of the PVS farm, and reports metrics for
each server. Setting the flag to Yes ensures that the test reports metrics for only that
server, which is being monitored.
Monitor ing C it r ix Prov is ion ing Servers
22
7. ENABLED DEVICE DD – By default, this flag is set to No. This means that, by default,
this test will not report detailed diagnostics for the Enabled devices measure – i.e., you will
not be able to view the list of enabled devices. To enable the ability of the test to collect
and report the list of enabled devices, set this flag to Yes.
8. DISABLED DEVICE DD - By default, this flag is set to No. This means that, by default,
this test will not report detailed diagnostics for the Disabled devices measure – i.e., you
will not be able to view the list of disabled devices. To enable the ability of the test to
collect and report the list of disable devices, set this flag to Yes.
9. DETAILED DIAGNOSIS - To make diagnosis more efficient and accurate, the eG
Enterprise suite embeds an optional detailed diagnostic capability. With this capability, the
eG agents can be configured to run detailed, more elaborate tests as and when specific
problems are detected. To enable the detailed diagnosis capability of this test for a
particular server, choose the On option. To disable the capability, click on the Off option.
The option to selectively enable/disable the detailed diagnosis capability will be available
only if the following conditions are fulfilled:
The eG manager license should allow the detailed diagnosis capability;
Both the normal and abnormal frequencies configured for the detailed diagnosis
measures should not be 0.
Outputs of the
test
By default, the test reports one set of results for every site configured in the Citrix Provisional
server farm being monitored
Measurements
made by the
test
Measurement Measurement
Unit Interpretation
Total servers:
Indicates the total number of
Provisioning servers managed
by this site.
Number
Active servers:
Indicates the number of
Provisioning servers that are
currently active in this site.
Number Use the detailed diagnosis of this measure to
know which servers in the site are active.
Inactive servers:
Indicates the number of
inactive servers in this site.
Number Use the detailed diagnosis of this measure to
know which servers in the site are inactive.
Total devices:
Indicates the total number of
target devices managed by
this site.
Number A target device is a device, such as a desktop
computer or server, in a Provisioning services
farm, that boots and gets software from a
vDisk on the network.
Enabled devices:
Indicates the number of
target devices in this site that
are connected to vDisks.
Number You can instantly identify the active target
devices in a site with the help of the detailed
diagnosis of this measure.
Monitor ing C it r ix Prov is ion ing Servers
23
Disabled devices:
Indicates the number of
target devices in this site that
are not connected to vDisks.
Number Use the detailed diagnosis of this measure to
know which target devices in the site are
inactive.
Total vDisks:
Indicates the total number of
vDisks managed by this disk.
Number vDisks exist as disk image files on a
Provisioning Server or on a shared storage
device.
Active vDisks:
Indicates the number of
vDisks in this site that are
used by target devices.
Number Use the detailed diagnosis of this measure to
know which vDisks are being actively used by
target devices.
Inactive vDisks:
Indicates the number of
vDisks in this site that are not
used by target devices.
Number Use the detailed diagnosis of this measure to
know which vDisks are inactive in the site.
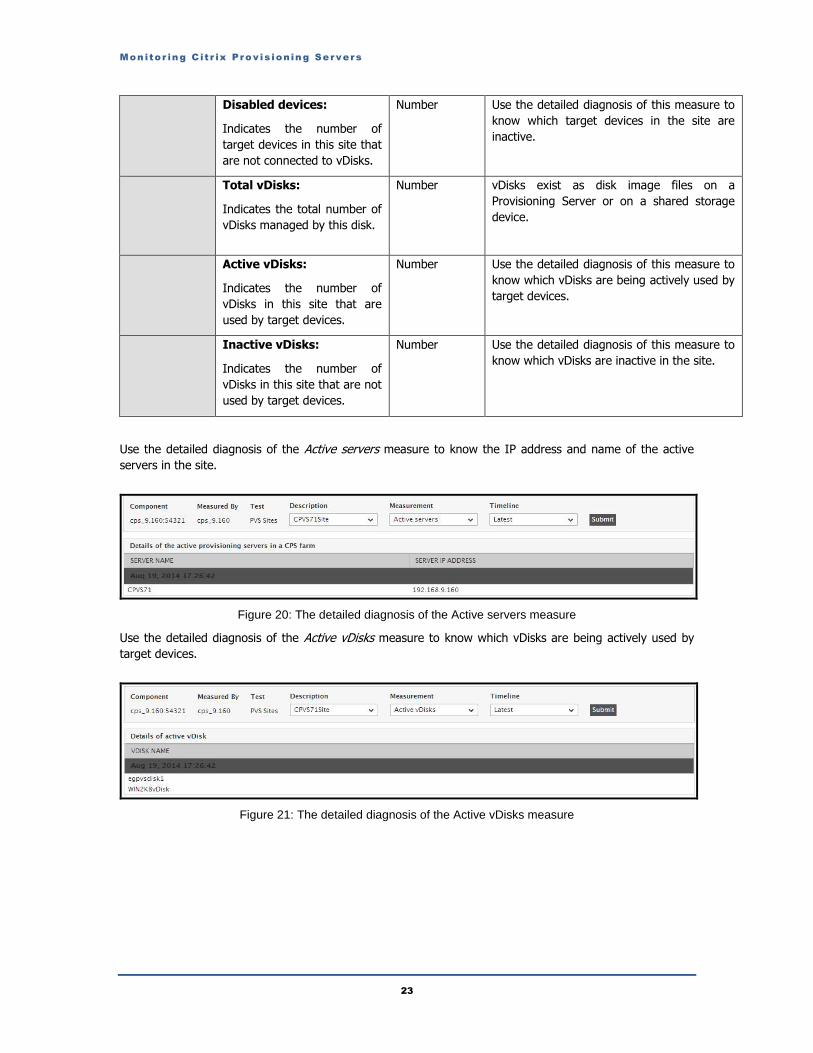
Use the detailed diagnosis of the Active servers measure to know the IP address and name of the active
servers in the site.
Figure 20: The detailed diagnosis of the Active servers measure
Use the detailed diagnosis of the Active vDisks measure to know which vDisks are being actively used by
target devices.
Figure 21: The detailed diagnosis of the Active vDisks measure
Monitor ing C it r ix Prov is ion ing Servers
24
1.6.4 PVS vDisk Pool Test
A vDisk is an image file stored on a Provisioning Server or remote storage location, which acts as a hard
disk for a target device.
vDisk pools are the collection of all vDisks available to a site. There is only one vDisk pool per site.
For each vDisk in the vDisk pool, this test reports the size, status, and locked duration.
Purpose For each vDisk in the vDisk pool, this test reports the size, status, and locked duration
Target of the
test
A Citrix Provisioning server
Agent
deploying the
test
An internal agent

Monitor ing C it r ix Prov is ion ing Servers
25
Configurable
parameters for
the test
1. TEST PERIOD – How often should the test be executed
2. HOST – The host for which the test is to be configured
3. PORT – Refers to the port used by the Citrix Provisioning server. By default, this is 54321.
4. MCLI PATH – This test executes commands using the Management Command Line
Interface (MCLI) of the Provisioning server to collect the required metrics. To enable the
test to execute the commands, the eG agent, by default, auto-discovers the full path
MCLI.exe on the target Provisioning server. This is why, the MCLI PATH is set to none by
default. If, for some reason, the eG agent is unable to auto-discover the MCLI path, then
you will have to manually specify the path here using the following pointers:
Typically, in a 32-bit Windows system, the MCLI.exe will be available in the
following location by default: <System_Root>\Program Files\Citrix\Provisioning
Services Console
In a 64-bit Windows system on the other hand, the MCLI.exe will be available in
the following location by default: <System_Root>\Program Files
(x86)\Citrix\Provisioning Services Console
5. DOMAIN NAME, DOMAIN USER, DOMAIN PASSWORD – To report the desired metrics,
this test should run using the permissions of a user who belongs to the Security group with
'Farm Administrator' access. By default, only users in the Administrators group are allowed
full access to the PVS farm. You can hence configure the DOMAIN NAME, DOMAIN
USER, and DOMAIN PASSWORD parameters with the domain name and user credentials
(respectively) of a domain user who belongs to the Administrators group. However, if
owing to security restrictions imposed by your environment, you prefer not to expose the
credentials of any user who belongs to the Administrators group, then, do the following:
o Create a special Security group in AD for monitoring purposes. Add any
existing domain user to this group, or create a new user for this purpose
in AD and add his/her profile to the new Security group.
Alternatively, you can use any of the Security groups that pre-exist in AD,
create a new domain user in AD, and add that user to the Security group
that pre-exists.
o Then, add this security group to Citrix PVS and grant 'Farm Administrator'
rights to it. The steps in this regard are available in Page 2 of this
document.
O ONCE THIS IS DONE, THEN CONFIGURE THIS TEST WITH THE
DOMAIN NAME, DOMAIN USER, and DOMAIN PASSWORD of a user
in this security group.
6. LOCAL HOST ONLY - By default, this flag is set to No. This implies that, by default, the
test auto-discovers all the vDisks in all vDisk pools that are part of the PVS farm, and
reports metrics for each vDisk. Setting the flag to Yes ensures that the test reports metrics
for only that vDisk pool that belongs to the site in which the target PVS server operates.
Monitor ing C it r ix Prov is ion ing Servers
26
7. DETAILED DIAGNOSIS - To make diagnosis more efficient and accurate, the eG
Enterprise suite embeds an optional detailed diagnostic capability. With this capability, the
eG agents can be configured to run detailed, more elaborate tests as and when specific
problems are detected. To enable the detailed diagnosis capability of this test for a
particular server, choose the On option. To disable the capability, click on the Off option.
The option to selectively enable/disable the detailed diagnosis capability will be available
only if the following conditions are fulfilled:
The eG manager license should allow the detailed diagnosis capability;
Both the normal and abnormal frequencies configured for the detailed diagnosis
measures should not be 0.
Outputs of the
test
By default, the test reports one set of results for every vDisk in each vDisk pool in the PVS farm
being monitored
Measurements
made by the
test
Measurement Measurement
Unit Interpretation
Disk state:
Indicates the current state of
this vDisk.
If the value of this measure is Active, it
indicates that the vDisk is active and can be
used by the target devices connected to it. If
the value of this measure is Inactive, it
implies that the vDisk is not active and
hence, cannot be used by the target devices.
vDisk size:
Indicates the size of this
vDisk.
GB Depending upon the file system used to store
the vDisk, the maximum size of a vDisk is 2
terabytes (NTFS) or 4096MB (FAT).
Target device
connections:
Indicates the number of
target devices that are
currently connected to this
vDisk.
Number To know the names of the devices that are
currently connected to a vDisk, their IP
address, the site in which they operate, and
the store they use, take the help of the
detailed diagnosis of this measure.
Monitor ing C it r ix Prov is ion ing Servers
27
Lock status:
Indicates whether this vDisk
is currently locked or
unlocked.
Since multiple target devices and Provisioning
Servers can gain access to a single vDisk
image file, it is necessary to control access to
prevent corruption of the image. Should a
user accidentally assign a private image to
multiple target devices, and then try to boot
those target devices, a corrupt image would
result. Therefore, the image becomes locked
appropriately for a given configuration.
If a vDisk is locked, then the value of this
measure will be Locked. If the lock on a vDisk
has been released, then, the value of this
measure will be Unlocked.
The numeric values that correspond to the
states mentioned above are as follows:
State Numeric Value
Locked 1
Unlocked 0
Note:
By default, this measure reports the values
Locked or Unlocked to indicate the lock status
of a vDisk. The graph of this measure
however, represents the lock status using the
numeric equivalents - 0 or 1.
Be aware that under certain circumstances
these locks may not be released properly. A
lock on a vDisk image may not be released
properly when a target device machine is
booted from a vDisk, and then fails (or power
is lost). If the same target device boots
again, the same lock is used and no problem
occurs. However, if an administrator tries to
mount the drive on the Provisioning Server
after the target device has failed, the
Provisioning Server will not be able to mount
that vDisk because a lock is still held by the
failed target device. The Administrator has
the capability to release these locks.
Locked duration:
Indicates how long this vDisk
has been locked.
Mins If the value of the Lock status measure is
Locked for a vDisk, then you can use this
measure to determine the duration for which
that vDisk was locked. As long as a vDisk
remains locked, target devices for which that
vDisk has been assigned will not even be able
to boot. Hence, a very low value is desired
for this measure.
Monitor ing C it r ix Prov is ion ing Servers
28
1.6.5 PVS Log Test
This test monitors the Citrix Provisioning server’s error logs for errors/warnings of configured patterns, and
reports the number of such errors/warnings that have been logged in the log file.
Purpose Monitors the Citrix Provisioning server’s error logs for errors/warnings of configured patterns,
and reports the number of such errors/warnings that have been logged in the log file
Target of the
test
A Citrix Provisioning server
Agent
deploying the
test
An internal agent
Monitor ing C it r ix Prov is ion ing Servers
29
Configurable
parameters for
the test
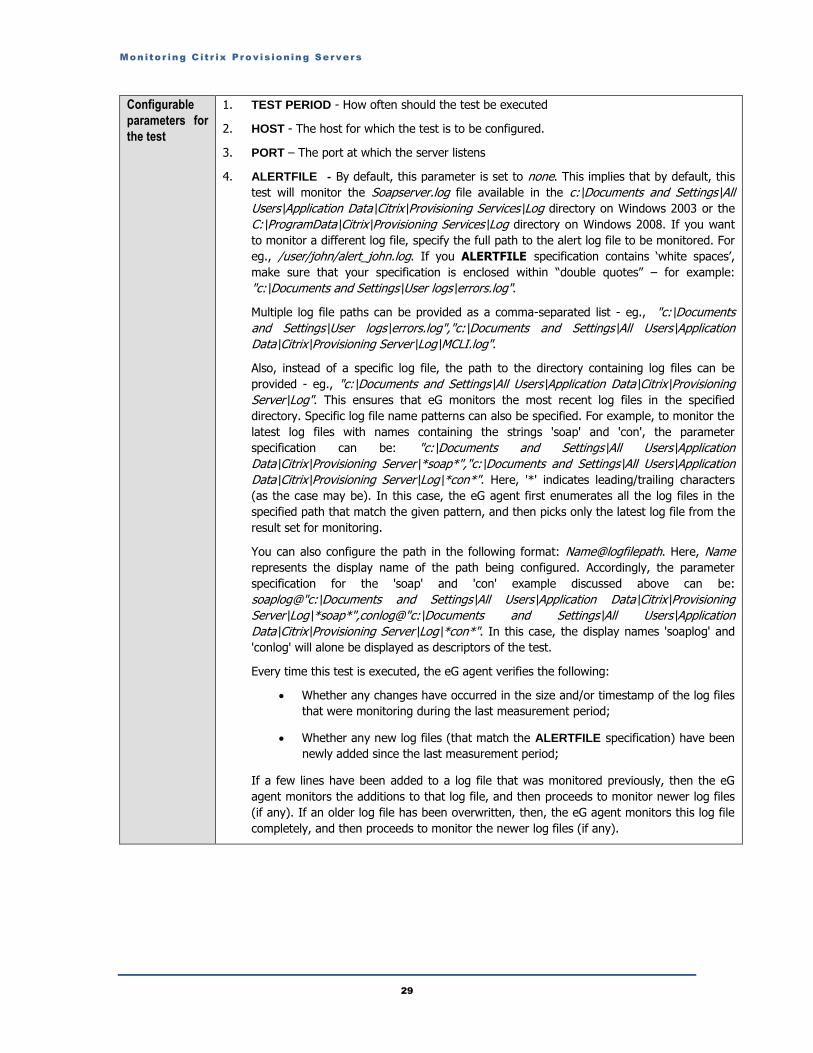
1. TEST PERIOD - How often should the test be executed
2. HOST - The host for which the test is to be configured.
3. PORT – The port at which the server listens
4. ALERTFILE - By default, this parameter is set to none. This implies that by default, this
test will monitor the Soapserver.log file available in the c:\Documents and Settings\All
Users\Application Data\Citrix\Provisioning Services\Log directory on Windows 2003 or the
C:\ProgramData\Citrix\Provisioning Services\Log directory on Windows 2008. If you want
to monitor a different log file, specify the full path to the alert log file to be monitored. For
eg., /user/john/alert_john.log. If you ALERTFILE specification contains ‘white spaces’,
make sure that your specification is enclosed within “double quotes” – for example:
"c:\Documents and Settings\User logs\errors.log".
Multiple log file paths can be provided as a comma-separated list - eg., "c:\Documents
and Settings\User logs\errors.log","c:\Documents and Settings\All Users\Application
Data\Citrix\Provisioning Server\Log\MCLI.log".
Also, instead of a specific log file, the path to the directory containing log files can be
provided - eg., "c:\Documents and Settings\All Users\Application Data\Citrix\Provisioning
Server\Log". This ensures that eG monitors the most recent log files in the specified
directory. Specific log file name patterns can also be specified. For example, to monitor the
latest log files with names containing the strings 'soap' and 'con', the parameter
specification can be: "c:\Documents and Settings\All Users\Application
Data\Citrix\Provisioning Server\*soap*","c:\Documents and Settings\All Users\Application
Data\Citrix\Provisioning Server\Log\*con*". Here, '*' indicates leading/trailing characters
(as the case may be). In this case, the eG agent first enumerates all the log files in the
specified path that match the given pattern, and then picks only the latest log file from the
result set for monitoring.
You can also configure the path in the following format: Name@logfilepath. Here, Name
represents the display name of the path being configured. Accordingly, the parameter
specification for the 'soap' and 'con' example discussed above can be:
soaplog@"c:\Documents and Settings\All Users\Application Data\Citrix\Provisioning
Server\Log\*soap*",conlog@"c:\Documents and Settings\All Users\Application
Data\Citrix\Provisioning Server\Log\*con*". In this case, the display names 'soaplog' and
'conlog' will alone be displayed as descriptors of the test.
Every time this test is executed, the eG agent verifies the following:
Whether any changes have occurred in the size and/or timestamp of the log files
that were monitoring during the last measurement period;
Whether any new log files (that match the ALERTFILE specification) have been
newly added since the last measurement period;
If a few lines have been added to a log file that was monitored previously, then the eG
agent monitors the additions to that log file, and then proceeds to monitor newer log files
(if any). If an older log file has been overwritten, then, the eG agent monitors this log file
completely, and then proceeds to monitor the newer log files (if any).

Monitor ing C it r ix Prov is ion ing Servers
30
5. SEARCHPATTERN - Enter the specific patterns of alerts to be monitored. The pattern
should be in the following format: <PatternName>:<Pattern>, where <PatternName> is
the pattern name that will be displayed in the monitor interface and <Pattern> is an
expression of the form - *expr* or expr or *expr or expr*, etc. A leading '*' signifies any
number of leading characters, while a trailing '*' signifies any number of trailing characters.
For example, say your SEARCHPATTERN specification is as follows: DEBUG:DEBUG*.
This indicates that "DEBUG" is the pattern name to be displayed in the monitor interface.
"DEBUG*" indicates that the test will monitor only those lines in the specified log file which
start with the string "DEBUG". Similarly, if your pattern specification reads:
ERROR:*ERROR, then it means that the pattern name is ERROR and that the test will
monitor those lines in the log which end with the term ERROR.
A single pattern may also be of the form e1+e2, where + signifies an OR condition. That
is, the <PatternName> is matched if either e1 is true or e2 is true.
Multiple search patterns can be specified as a comma-separated list. For example:
DEBUG:*DEBUG*,ERROR:*ERROR*,INFO:*INFO*,ERROR:*ERROR*,WARNING:*WARN*,F
ATAL:*FATAL*
If the ALERTFILE specification is of the format Name@logfilepath, then the descriptor for
this test in the eG monitor interface will be of the format: Name:PatternName. On the
other hand, if the ALERTFILE specification consists only of a comma-separated list of log
file paths, then the descriptors will be of the format: LogFilePath:PatternName.
If you want all the messages in a log file to be monitored, then your specification would
be: <PatternName>:*.
6. LINES - Specify two numbers in the format x:y. This means that when a line in the alert
file matches a particular pattern, then x lines before the matched line and y lines after the
matched line will be reported in the detail diagnosis output (in addition to the matched
line). The default value here is 0:0. Multiple entries can be provided as a comma-separated
list.
If you give 1:1 as the value for LINES, then this value will be applied to all the patterns
specified in the SEARCHPATTERN field. If you give 0:0,1:1,2:1 as the value for LINES
and if the corresponding value in the SEARCHPATTERN filed is like
DEBUG:*DEBUG*,ERROR:*ERROR*,INFO:*INFO*, then:
0:0 will be applied to DEBUG:*DEBUG* pattern
1:1 will be applied to ERROR:*ERROR* pattern
2:1 will be applied to INFO:*INFO* pattern
7. EXCLUDEPATTERN - Provide a comma-separated list of patterns to be excluded from
monitoring in the EXCLUDEPATTERN text box. For example *critical*, *exception*. By
default, this parameter is set to 'none'.

Monitor ing C it r ix Prov is ion ing Servers
31
8. UNIQUEMATCH - By default, the UNIQUEMATCH parameter is set to FALSE, indicating
that, by default, the test checks every line in the log file for the existence of each of the
configured SEARCHPATTERNS. By setting this parameter to TRUE, you can instruct the
test to ignore a line and move to the next as soon as a match for one of the configured
patterns is found in that line. For example, assume that
Pattern1:*FATAL*,Pattern2:*ERROR* is the SEARCHPATTERN that has been configured.
If UNIQUEMATCH is set to FALSE, then the test will read every line in the log file
completely to check for the existence of messages embedding the strings 'FATAL' and
'ERROR'. If both the patterns are detected in the same line, then the number of matches
will be incremented by 2. On the other hand, if UNIQUEMATCH is set to TRUE, then the
test will read a line only until a match for one of the configured patterns is found and not
both. This means that even if the strings 'FATAL' and 'ERROR' follow one another in the
same line, the test will consider only the first match and not the next. The match count in
this case will therefore be incremented by only 1.
9. ROTATINGFILE - This flag governs the display of descriptors for this test in the eG
monitoring console.
If this flag is set to true and the ALERTFILE text box contains the full path to a specific
(log/text) file, then, the descriptors of this test will be displayed in the following format:
Directory_containing_monitored_file:<SearchPattern>. For instance, if the ALERTFILE
parameter is set to "C:\ProgramData\Citrix\Provisioning Services\Log\Soapserver.log", and
ROTATINGFILE is set to true, then, your descriptor will be of the following format:
C:\ProgramData\Citrix\Provisioning Services\Log:<SearchPattern>. On the other hand, if
the ROTATINGFILE flag had been set to false, then the descriptors will be of the following
format: <FileName>:<SearchPattern> - i.e., Soapserver.log:<SearchPattern> in the case
of the example above.
If this flag is set to true and the ALERTFILE parameter is set to the directory containing
log files, then, the descriptors of this test will be displayed in the format:
Configured_directory_path:<SearchPattern>. For instance, if the ALERTFILE parameter is
set to "C:\ProgramData\Citrix\Provisioning Services\Log", and ROTATINGFILE is set to
true, then, your descriptor will be: C:\ProgramData\Citrix\Provisioning
Services\Log:<SearchPattern>. On the other hand, if the ROTATINGFILE parameter had
been set to false, then the descriptors will be of the following format:
Configured_directory:<SearchPattern> - i.e., Log:<SearchPattern> in the case of the
example above.
If this flag is set to true and the ALERTFILE parameter is set to a specific file pattern,
then, the descriptors of this test will be of the following format:
<FilePattern>:<SearchPattern>. For instance, if the ALERTFILE parameter is set to
"C:\ProgramData\Citrix\Provisioning Services\Log\*con*", and ROTATINGFILE is set to
true, then, your descriptor will be: *con*:<SearchPattern>. In this case, the descriptor
format will not change even if the ROTATINGFILE flag status is changed.
Monitor ing C it r ix Prov is ion ing Servers
32
10. USEUTF16 - If UTF-16 encoding is to be used for reading the specified log file, then, set
the USEUTF16 flag to true. By default, this flag is set to true. If multiple log files are
being monitored, then, for each file, you will have to indicate whether UTF-16 encoding is
to be used for reading that file or not. For instance, assume that the ALERTFILE
parameter is set to soaplog@"C:\ProgramData\Citrix\Provisioning
Services\Log\*soap*",conlogs@"C:\ProgramData\Citrix\Provisioning Services\Log\*con*".
Now, to instruct the test to use UTF-16 encoding for reading the 'soaplog' log file and not
to use the UTF-16 encoding while reading the 'conlogs' log file, your USEUTF16 setting
should be as follows: true,false. Note that the number of values provided against the
USEUTF8 parameter should be equal to the number of log files being monitored.
11. DD FREQUENCY - Refers to the frequency with which detailed diagnosis measures are to
be generated for this test. The default is 1:1. This indicates that, by default, detailed
measures will be generated every time this test runs, and also every time the test detects
a problem. You can modify this frequency, if you so desire. Also, if you intend to disable
the detailed diagnosis capability for this test, you can do so by specifying none against DD
FREQUENCY.
12. DETAILED DIAGNOSIS - To make diagnosis more efficient and accurate, the eG
Enterprise suite embeds an optional detailed diagnostic capability. With this capability, the
eG agents can be configured to run detailed, more elaborate tests as and when specific
problems are detected. To enable the detailed diagnosis capability of this test for a
particular server, choose the On option. To disable the capability, click on the Off option.
The option to selectively enable/disable the detailed diagnosis capability will be available
only if the following conditions are fulfilled:
The eG manager license should allow the detailed diagnosis capability
Both the normal and abnormal frequencies configured for the detailed diagnosis
measures should not be 0.
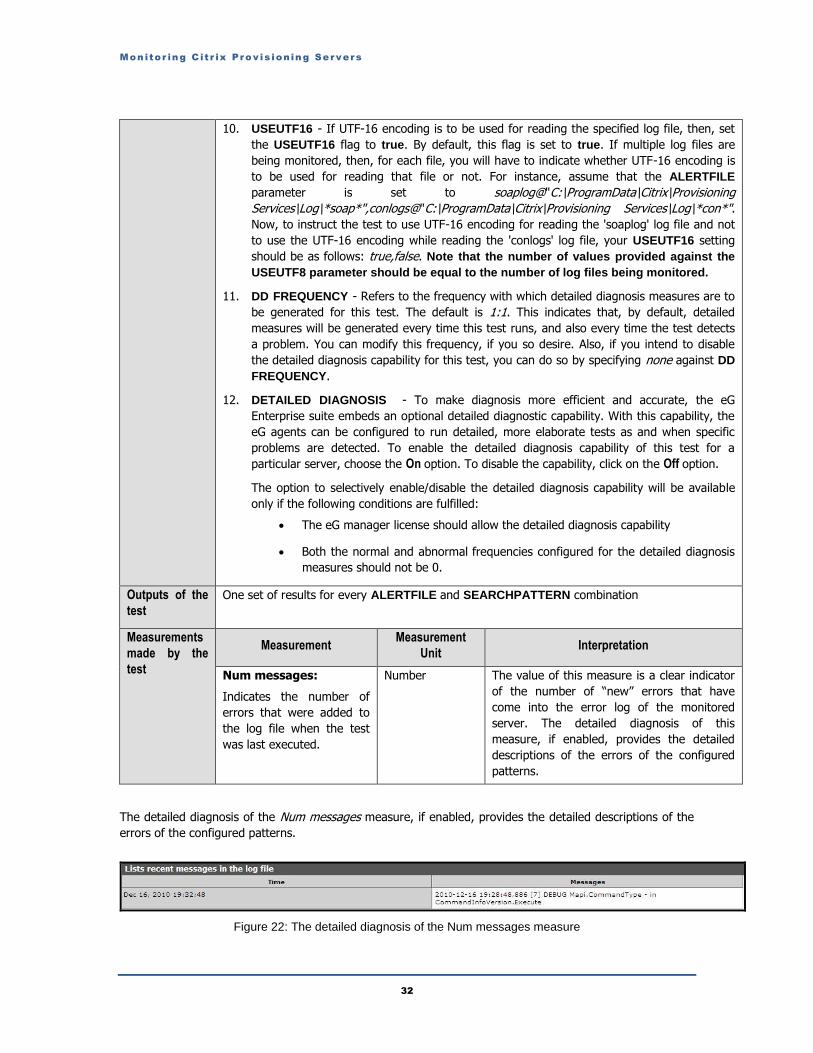
Outputs of the
test
One set of results for every ALERTFILE and SEARCHPATTERN combination
Measurements
made by the
test
Measurement Measurement
Unit Interpretation
Num messages:
Indicates the number of
errors that were added to
the log file when the test
was last executed.
Number The value of this measure is a clear indicator
of the number of “new” errors that have
come into the error log of the monitored
server. The detailed diagnosis of this
measure, if enabled, provides the detailed
descriptions of the errors of the configured
patterns.
The detailed diagnosis of the Num messages measure, if enabled, provides the detailed descriptions of the
errors of the configured patterns.
Figure 22: The detailed diagnosis of the Num messages measure
Monitor ing C it r ix Prov is ion ing Servers
33
1.6.6 PVS Availability Check Test
This test reports whether/not the PVS server is up and running. If so, the test additionally reports the
responsiveness of the server.
Purpose Reports whether/not the PVS server is up and running. If so, the test additionally reports the
responsiveness of the server
Target of the
test
A Citrix Provisioning server
Agent
deploying the
test
An internal agent

Monitor ing C it r ix Prov is ion ing Servers
34
Configurable
parameters for
the test
1. TEST PERIOD – How often should the test be executed
2. HOST – The host for which the test is to be configured
3. PORT – Refers to the port used by the Citrix Provisioning server. By default, this is 54321.
4. MCLI PATH – This test executes commands using the Management Command Line
Interface (MCLI) of the Provisioning server to collect the required metrics. To enable the
test to execute the commands, the eG agent, by default, auto-discovers the full path
MCLI.exe on the target Provisioning server. This is why, the MCLI PATH is set to none by
default. If, for some reason, the eG agent is unable to auto-discover the MCLI path, then
you will have to manually specify the path here using the following pointers:
Typically, in a 32-bit Windows system, the MCLI.exe will be available in the
following location by default: <System_Root>\Program Files\Citrix\Provisioning
Services Console
In a 64-bit Windows system on the other hand, the MCLI.exe will be available in
the following location by default: <System_Root>\Program Files
(x86)\Citrix\Provisioning Services Console
5. DOMAIN NAME, DOMAIN USER, DOMAIN PASSWORD – To report the desired metrics,
this test should run using the permissions of a user who belongs to the Security group with
'Farm Administrator' access. By default, only users in the Administrators group are allowed
full access to the PVS farm. You can hence configure the DOMAIN NAME, DOMAIN
USER, and DOMAIN PASSWORD parameters with the domain name and user credentials
(respectively) of a domain user who belongs to the Administrators group. However, if
owing to security restrictions imposed by your environment, you prefer not to expose the
credentials of any user who belongs to the Administrators group, then, do the following:
o Create a special Security group in AD for monitoring purposes. Add any
existing domain user to this group, or create a new user for this purpose
in AD and add his/her profile to the new Security group.
Alternatively, you can use any of the Security groups that pre-exist in AD,
create a new domain user in AD, and add that user to the Security group
that pre-exists.
o Then, add this security group to Citrix PVS and grant 'Farm Administrator'
rights to it. The steps in this regard are available in Page 2 of this
document.
O Once this is done, then configure this test with the DOMAIN NAME,
DOMAIN USER, and DOMAIN PASSWORD of a user in this security
group.
6. TARGET PORT – This test connects to the port at which the PVS server listens and
checks its availability. By default, the port number displayed against the PORT parameter
of the test will be displayed as the TARGET PORT. However, If the PVS server in your
environment is listening on a different port, modify the TARGET PORT setting to reflect
the new port.
Outputs of the
test
By default, the test reports one set of results for each server in the Citrix Provisional server farm
being monitored
Measurements
made by the
test Measurement
Measurement
Unit Interpretation
Monitor ing C it r ix Prov is ion ing Servers
35
Availability:
Indicates whether/not the
PVS server is available.
Percent The value 100 indicates that the PVS server is
available. The value 0 for this measure
indicates that the PVS server is not available.
Response time:
Indicates the time taken by
the PVS server to respond to
client requests.
Secs Ideally, the value of this measure should be
low. A high value or a steady increase in the
value of this measure is a cause for concern,
as it indicates poor responsiveness. This can
be caused by factors such as a server
bottleneck or a configuration problem.
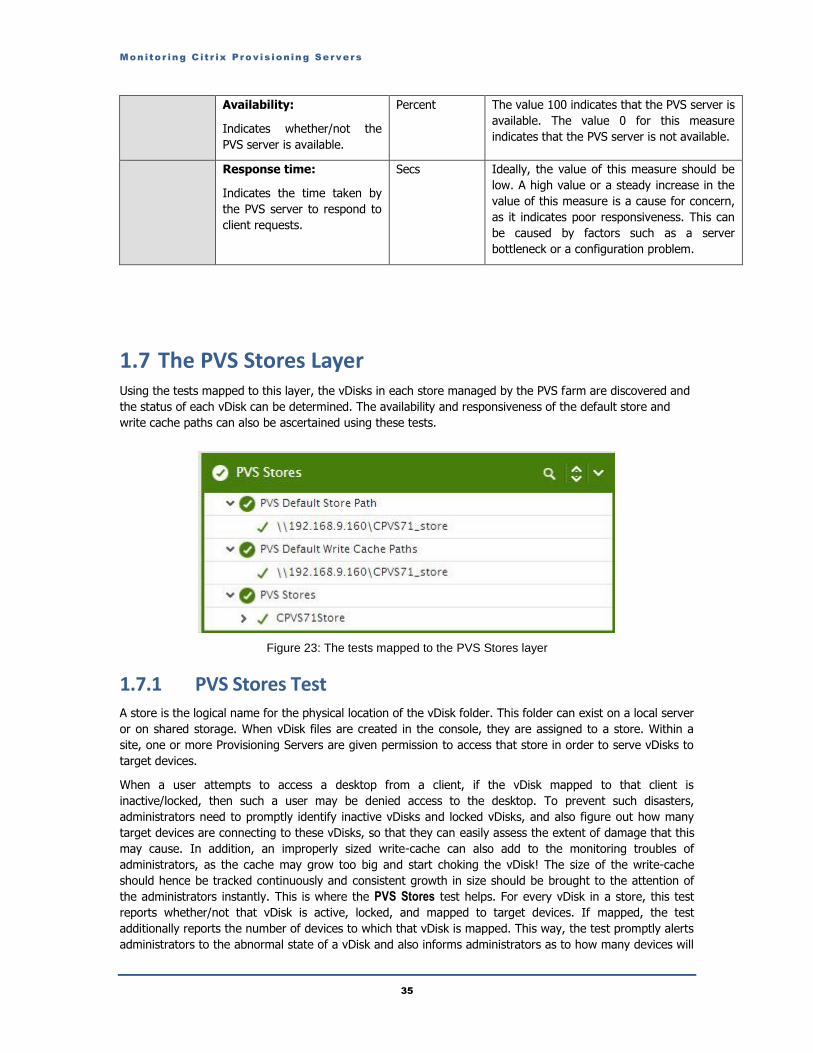
1.7 The PVS Stores Layer Using the tests mapped to this layer, the vDisks in each store managed by the PVS farm are discovered and
the status of each vDisk can be determined. The availability and responsiveness of the default store and
write cache paths can also be ascertained using these tests.
Figure 23: The tests mapped to the PVS Stores layer
1.7.1 PVS Stores Test A store is the logical name for the physical location of the vDisk folder. This folder can exist on a local server
or on shared storage. When vDisk files are created in the console, they are assigned to a store. Within a
site, one or more Provisioning Servers are given permission to access that store in order to serve vDisks to
target devices.
When a user attempts to access a desktop from a client, if the vDisk mapped to that client is
inactive/locked, then such a user may be denied access to the desktop. To prevent such disasters,
administrators need to promptly identify inactive vDisks and locked vDisks, and also figure out how many
target devices are connecting to these vDisks, so that they can easily assess the extent of damage that this
may cause. In addition, an improperly sized write-cache can also add to the monitoring troubles of
administrators, as the cache may grow too big and start choking the vDisk! The size of the write-cache
should hence be tracked continuously and consistent growth in size should be brought to the attention of
the administrators instantly. This is where the PVS Stores test helps. For every vDisk in a store, this test
reports whether/not that vDisk is active, locked, and mapped to target devices. If mapped, the test
additionally reports the number of devices to which that vDisk is mapped. This way, the test promptly alerts
administrators to the abnormal state of a vDisk and also informs administrators as to how many devices will
Monitor ing C it r ix Prov is ion ing Servers
36
be affected by this abnormality. Additionally, the test also periodically reports the write cache size and type
of every vDisk, thus quickly intimating administrators of unexpected growth in the write-cache size, and
enabling them to rapidly initiate investigations.
Purpose For every vDisk in a store, this test reports whether/not that vDisk is active, locked, and mapped
to target devices. If mapped, the test additionally reports the number of devices to which that
vDisk is mapped. This way, the test promptly alerts administrators to the abnormal state of a
vDisk and also informs administrators as to how many devices will be affected by this
abnormality. Additionally, the test also periodically reports the write cache size and type of every
vDisk, thus quickly intimating administrators of unexpected growth in the write-cache size, and
enabling them to rapidly initiate investigations.
Target of the
test
A Citrix Provisioning server
Agent
deploying the
test
An internal agent

Monitor ing C it r ix Prov is ion ing Servers
37
Configurable
parameters for
the test
1. TEST PERIOD – How often should the test be executed
2. HOST – The host for which the test is to be configured
3. PORT – Refers to the port used by the Citrix Provisioning server. By default, this is 54321.
4. MCLI PATH – This test executes commands using the Management Command Line
Interface (MCLI) of the Provisioning server to collect the required metrics. To enable the
test to execute the commands, the eG agent, by default, auto-discovers the full path
MCLI.exe on the target Provisioning server. This is why, the MCLI PATH is set to none by
default. If, for some reason, the eG agent is unable to auto-discover the MCLI path, then
you will have to manually specify the path here using the following pointers:
Typically, in a 32-bit Windows system, the MCLI.exe will be available in the
following location by default: <System_Root>\Program Files\Citrix\Provisioning
Services Console
In a 64-bit Windows system on the other hand, the MCLI.exe will be available in
the following location by default: <System_Root>\Program Files
(x86)\Citrix\Provisioning Services Console
5. DOMAIN NAME, DOMAIN USER, DOMAIN PASSWORD – To report the desired metrics,
this test should run using the permissions of a user who belongs to the Security group with
'Farm Administrator' access. By default, only users in the Administrators group are allowed
full access to the PVS farm. You can hence configure the DOMAIN NAME, DOMAIN
USER, and DOMAIN PASSWORD parameters with the domain name and user credentials
(respectively) of a domain user who belongs to the Administrators group. However, if
owing to security restrictions imposed by your environment, you prefer not to expose the
credentials of any user who belongs to the Administrators group, then, do the following:
o Create a special Security group in AD for monitoring purposes. Add any
existing domain user to this group, or create a new user for this purpose
in AD and add his/her profile to the new Security group.
Alternatively, you can use any of the Security groups that pre-exist in AD,
create a new domain user in AD, and add that user to the Security group
that pre-exists.
o Then, add this security group to Citrix PVS and grant 'Farm Administrator'
rights to it. The steps in this regard are available in Page 2 of this
document.
O ONCE THIS IS DONE, THEN CONFIGURE THIS TEST WITH THE
DOMAIN NAME, DOMAIN USER, and DOMAIN PASSWORD of a user
in this security group.
6. LOCAL HOST ONLY – By default, this flag is set to No. This implies that, by default, the
test auto-discovers all the stores used by all Citrix Provisioning servers in the farm, and
reports metrics for each store. Setting this flag to Yes ensures that the test reports metrics
for only those stores that the monitored Citrix Provisioning server is allowed to access.
Monitor ing C it r ix Prov is ion ing Servers
38
7. DETAILED DIAGNOSIS - To make diagnosis more efficient and accurate, the eG
Enterprise suite embeds an optional detailed diagnostic capability. With this capability, the
eG agents can be configured to run detailed, more elaborate tests as and when specific
problems are detected. To enable the detailed diagnosis capability of this test for a
particular server, choose the On option. To disable the capability, click on the Off option.
The option to selectively enable/disable the detailed diagnosis capability will be available
only if the following conditions are fulfilled:
The eG manager license should allow the detailed diagnosis capability
Both the normal and abnormal frequencies configured for the detailed diagnosis
measures should not be 0.
Outputs of the
test
By default, the test reports one set of results for every vDisk in every store in the PVS farm
being monitored
Measurements
made by the Measurement
Measurement
Unit Interpretation
Monitor ing C it r ix Prov is ion ing Servers
39
test Is vDisk locked?:
Indicates whether/not this
vDisk is locked.
Since multiple target devices and Provisioning
Servers can gain access to a single vDisk
image file, it is necessary to control access to
prevent corruption of the image. Should a
user accidentally assign a private image to
multiple target devices, and then try to boot
those target devices, a corrupt image would
result. Therefore, the image becomes locked
appropriately for a given configuration.
Target devices/Provisioning servers cannot
access locked vDisks.
If the vDisk is locked, then this measure will
report the value Yes. If not, it will report the
value No.
These measure values and their
corresponding numeric values are listed in
the table below:
Measure Value Numeric Value
Yes 1
No 0
Note:
By default, this measure reports the values
Yes or No to indicate the lock status of a
vDisk. The graph of this measure however,
represents the lock status using the numeric
equivalents - 0 or 1.
Be aware that under certain circumstances
these locks may not be released properly. A
lock on a vDisk image may not be released
properly when a target device machine is
booted from a vDisk, and then fails (or power
is lost). If the same target device boots
again, the same lock is used and no problem
occurs. However, if an administrator tries to
mount the drive on the Provisioning Server
after the target device has failed, the
Provisioning Server will not be able to mount
that vDisk because a lock is still held by the
failed target device. The Administrator has
the capability to release these locks.
To view the details of the lock, use the
detailed diagnosis of this measure.

Monitor ing C it r ix Prov is ion ing Servers
40
Is device active?:
Indicates whether/not this
vDisk is active.
If the vDisk is active, then this measure will
report the value Yes. If not, it will report the
value No.
These measure values and their
corresponding numeric values are listed in
the table below:
Measure Value Numeric Value
Yes 1
No 0
Note:
By default, this measure reports the
values Yes or No to indicate the current
state of a vDisk. The graph of this
measure however, represents the same
using the numeric equivalents - 0 or 1.
Is device mapped?:
Indicates whether/not this
vDisk is mapped to a target
device.
If the vDisk is mapped to a target device,
then this measure will report the value Yes. If
not, it will report the value No.
These measure values and their
corresponding numeric values are listed in
the table below:
Measure Value Numeric Value
Yes 1
No 0
Note:
By default, this measure reports the
values Yes or No to indicate whether/not
the vDisk is mapped. The graph of this
measure however, represents the same
using the numeric equivalents - 0 or 1.
vDisk size:
Indicates the size of this
vDisk.
MB Depending upon the file system used to
store the vDisk, the maximum size of a
vDisk is 2 terabytes (NTFS) or 4096MB
(FAT).
Target device
connections:
Indicates the number of
target devices that are
currently connected to this
vDisk.
Number To know the names of the devices that are
currently connected to a vDisk, their IP
address, the site in which they operate, and
the store they use, take the help of the
detailed diagnosis of this measure.
Monitor ing C it r ix Prov is ion ing Servers
41
Write cache size:
Indicates the current size of
the write cache of this vDisk.
MB When using Citrix Provisioning Services with
the vDisk in standard mode you have a write-
cache drive location that holds all the writes
for the operating system. If the write-cache
file is not properly sized, it may fill up
unexpectedly; in this case, the operating
system will behave the same as if the drive
ran out of space without any warning, in
other words it will blue screen.
The optimum size of write-cache drive
depends on several factors:
Frequency of server reboots. The
write-cache file is reset upon each server
boot so the size only needs to be large
enough to handle the volume between
reboots.
Amount of free space available on
the c: drive. The space that will be
used for new files written to the c: drive
is considered the free space available.
This is a key value when determining the
write-cache drive size.
Amount of data being saved to the
c: drive. Data that is written to the c:
drive during operation will get stored
automatically in the write-cache drive.
New files will be stored in the write-
cache file and decrease the amount of
available space. Replacements for
existing files will also be written to the
write-cache file but will not marginally
affect the amount of free space. For
instance, a service pack install on a
standard-mode disk will result in the
write-cache file holding all the updated
files, with very little change in available
space.
Size and location of the pagefile.
When a local NTFS-formatted drive is
found, Provisioning Services moves the
Windows pagefile off of the c: drive to
the first available NTFS drive, which is
also the location of the write-cache file.
Therefore, in the default configuration,
the write-
Monitor ing C it r ix Prov is ion ing Servers
42
cache drive will end up holding both the
write-cache file and the pagefile.
Location of the write-cache file. The
location of the write-cache file is also a
factor in determining its size. The write-
cache file can be held on the target
device’s local disk, the target device’s
RAM, or on the streaming server.
o Target device disk: If the write-
cache file is held on the target
device’s disk, it could be a local
disk to client, local disk to the
hypervisor, network storage to
the hypervisor, or SAN storage
to the hypervisor.
o Target device RAM: If the write-
cache file is held in the target
device’s RAM the response time
will be faster and in some cases
the additional RAM is less
expensive than SAN disk.
o Streaming Server: If the write-
cache file is on the server, no
preset size is necessary. When
using server-side write-cache
file, the Provisioning Services
streaming server must have
enough disk space to hold the
write-cache files for all target
devices managed.

Monitor ing C it r ix Prov is ion ing Servers
43
Below are a few guidelines for right-sizing the
client-side write-cache drive.
Write-cache drive = write-cache file +
pagefile (if pagefile is stored on the
write-cache drive)
Write-cache file size should be equal to
the amount of free space left on the
vDisk image. This will work in most
situations, except those where servers
receive large file updates immediately
after booting. As a rule, your vDisk
should not be getting updated while
running in standard-mode.
Always account for the pagefile location
and size. If it is configured to reside on
the c: or d: drive, include it in all size
calculations.
Set the pagefile to a predetermined size
to make it easier to account for it.
Letting Windows manage the pagefile
size starts with 1x RAM but it could vary.
Manually setting it to a known value will
provide a static number to use for
calculations.
During the pilot, use server-side write
caching to get an idea of the maximum
size you might see a file reach between
server reboots. Obviously, the server
should have a full load and should be
subject to the normal production reboot
cycle for this to be of value.
In most situations, the recommended write-
cache drive size will be free space available
on vDisk image plus the pagefile size. For
instance, if you have a 30GB Windows Server
2008 R2 vDisk with 16GB used (14GB free)
and are running with an 8GB pagefile, it
would be good practice to use a write-cache
drive of 22GB calculated as 14GB free space
+ 8GB for the pagefile. If space doesn’t
permit, you have a few options, not all of
which may be available to you.
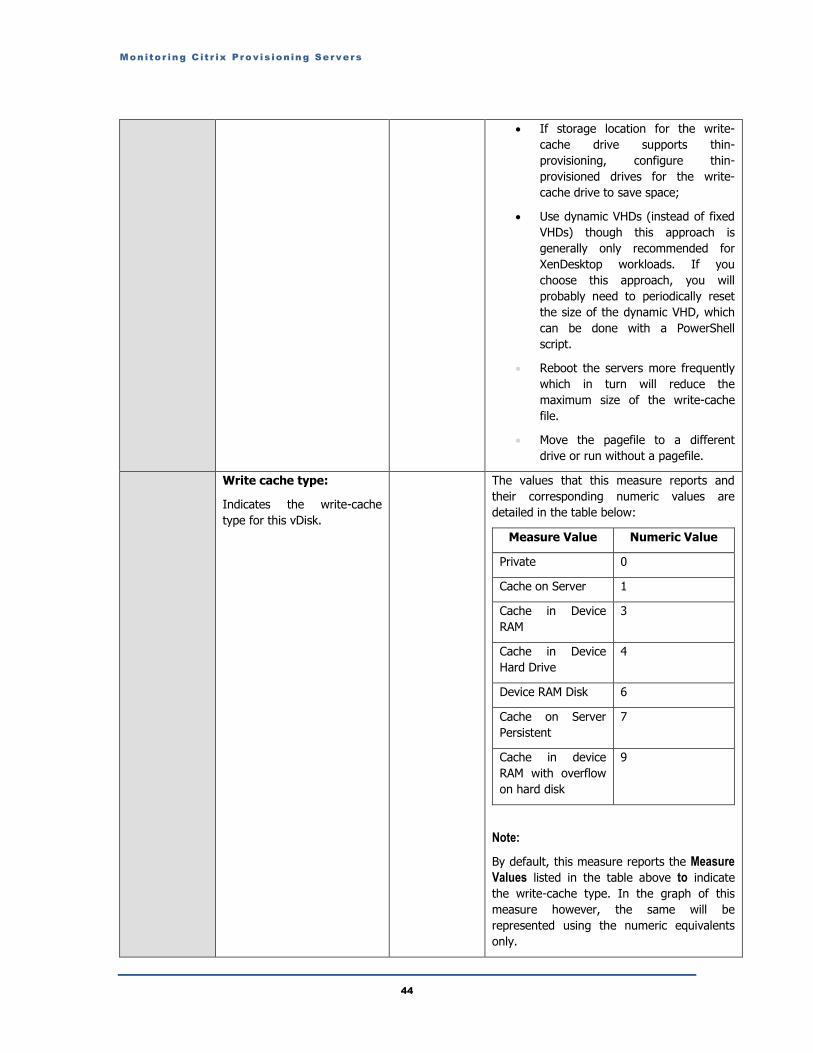
Monitor ing C it r ix Prov is ion ing Servers
44
If storage location for the write-
cache drive supports thin-
provisioning, configure thin-
provisioned drives for the write-
cache drive to save space;
Use dynamic VHDs (instead of fixed
VHDs) though this approach is
generally only recommended for
XenDesktop workloads. If you
choose this approach, you will
probably need to periodically reset
the size of the dynamic VHD, which
can be done with a PowerShell
script.
Reboot the servers more frequently
which in turn will reduce the
maximum size of the write-cache
file.
Move the pagefile to a different
drive or run without a pagefile.
Write cache type:
Indicates the write-cache
type for this vDisk.
The values that this measure reports and
their corresponding numeric values are
detailed in the table below:
Measure Value Numeric Value
Private 0
Cache on Server 1
Cache in Device
RAM
3
Cache in Device
Hard Drive
4
Device RAM Disk 6
Cache on Server
Persistent
7
Cache in device
RAM with overflow
on hard disk
9
Note:
By default, this measure reports the Measure
Values listed in the table above to indicate
the write-cache type. In the graph of this
measure however, the same will be
represented using the numeric equivalents
only.
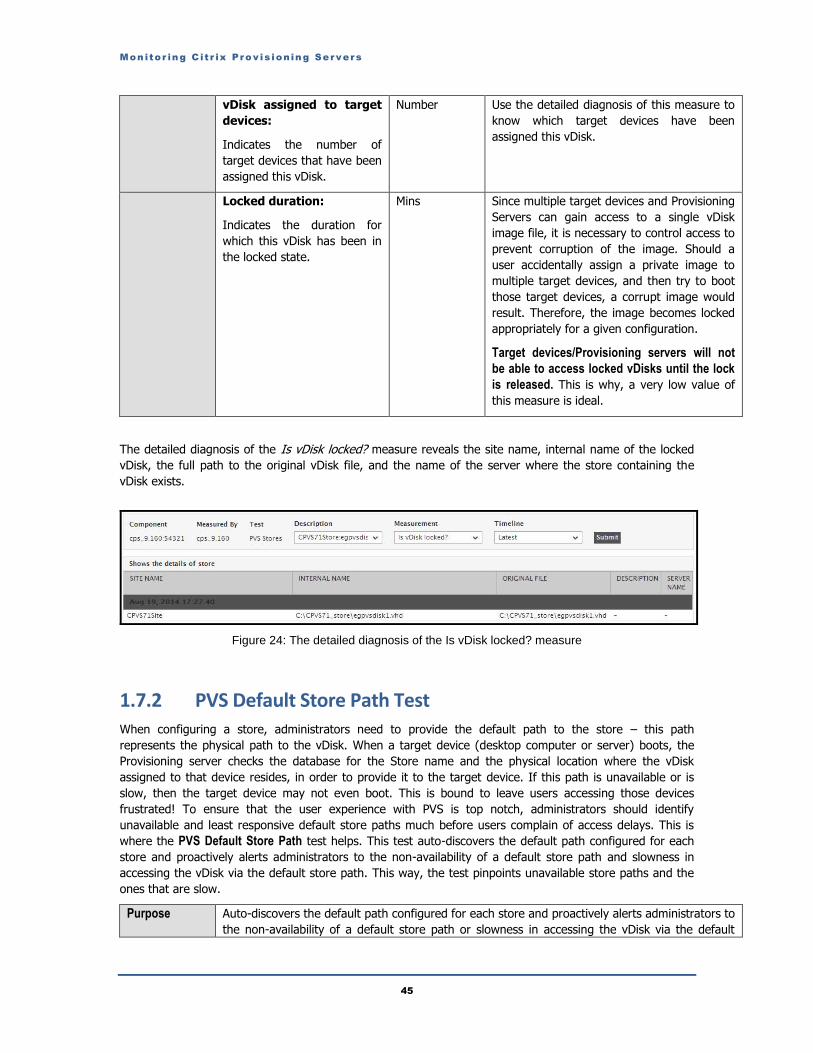
Monitor ing C it r ix Prov is ion ing Servers
45
vDisk assigned to target
devices:
Indicates the number of
target devices that have been
assigned this vDisk.
Number Use the detailed diagnosis of this measure to
know which target devices have been
assigned this vDisk.
Locked duration:
Indicates the duration for
which this vDisk has been in
the locked state.
Mins Since multiple target devices and Provisioning
Servers can gain access to a single vDisk
image file, it is necessary to control access to
prevent corruption of the image. Should a
user accidentally assign a private image to
multiple target devices, and then try to boot
those target devices, a corrupt image would
result. Therefore, the image becomes locked
appropriately for a given configuration.
Target devices/Provisioning servers will not
be able to access locked vDisks until the lock
is released. This is why, a very low value of
this measure is ideal.
The detailed diagnosis of the Is vDisk locked? measure reveals the site name, internal name of the locked
vDisk, the full path to the original vDisk file, and the name of the server where the store containing the
vDisk exists.
Figure 24: The detailed diagnosis of the Is vDisk locked? measure
1.7.2 PVS Default Store Path Test
When configuring a store, administrators need to provide the default path to the store – this path
represents the physical path to the vDisk. When a target device (desktop computer or server) boots, the
Provisioning server checks the database for the Store name and the physical location where the vDisk
assigned to that device resides, in order to provide it to the target device. If this path is unavailable or is
slow, then the target device may not even boot. This is bound to leave users accessing those devices
frustrated! To ensure that the user experience with PVS is top notch, administrators should identify
unavailable and least responsive default store paths much before users complain of access delays. This is
where the PVS Default Store Path test helps. This test auto-discovers the default path configured for each
store and proactively alerts administrators to the non-availability of a default store path and slowness in
accessing the vDisk via the default store path. This way, the test pinpoints unavailable store paths and the
ones that are slow.
Purpose Auto-discovers the default path configured for each store and proactively alerts administrators to
the non-availability of a default store path or slowness in accessing the vDisk via the default
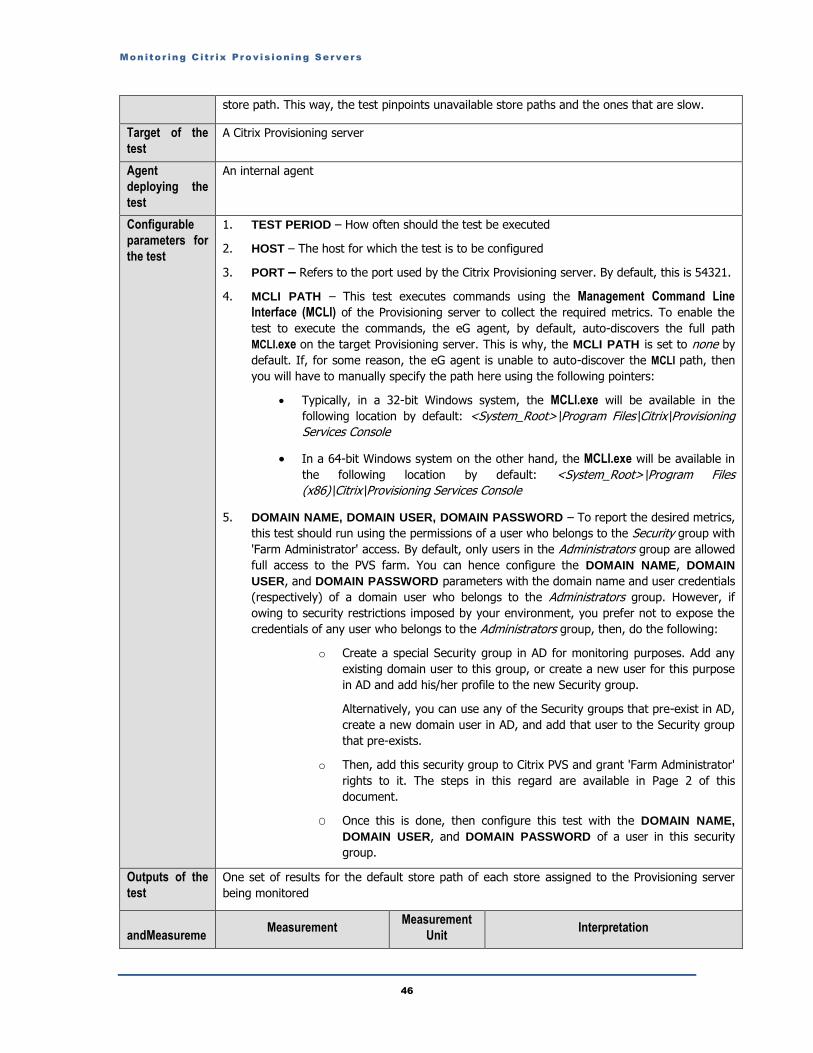
Monitor ing C it r ix Prov is ion ing Servers
46
store path. This way, the test pinpoints unavailable store paths and the ones that are slow.
Target of the
test
A Citrix Provisioning server
Agent
deploying the
test
An internal agent
Configurable
parameters for
the test
1. TEST PERIOD – How often should the test be executed
2. HOST – The host for which the test is to be configured
3. PORT – Refers to the port used by the Citrix Provisioning server. By default, this is 54321.
4. MCLI PATH – This test executes commands using the Management Command Line
Interface (MCLI) of the Provisioning server to collect the required metrics. To enable the
test to execute the commands, the eG agent, by default, auto-discovers the full path
MCLI.exe on the target Provisioning server. This is why, the MCLI PATH is set to none by
default. If, for some reason, the eG agent is unable to auto-discover the MCLI path, then
you will have to manually specify the path here using the following pointers:
Typically, in a 32-bit Windows system, the MCLI.exe will be available in the
following location by default: <System_Root>\Program Files\Citrix\Provisioning
Services Console
In a 64-bit Windows system on the other hand, the MCLI.exe will be available in
the following location by default: <System_Root>\Program Files
(x86)\Citrix\Provisioning Services Console
5. DOMAIN NAME, DOMAIN USER, DOMAIN PASSWORD – To report the desired metrics,
this test should run using the permissions of a user who belongs to the Security group with
'Farm Administrator' access. By default, only users in the Administrators group are allowed
full access to the PVS farm. You can hence configure the DOMAIN NAME, DOMAIN
USER, and DOMAIN PASSWORD parameters with the domain name and user credentials
(respectively) of a domain user who belongs to the Administrators group. However, if
owing to security restrictions imposed by your environment, you prefer not to expose the
credentials of any user who belongs to the Administrators group, then, do the following:
o Create a special Security group in AD for monitoring purposes. Add any
existing domain user to this group, or create a new user for this purpose
in AD and add his/her profile to the new Security group.
Alternatively, you can use any of the Security groups that pre-exist in AD,
create a new domain user in AD, and add that user to the Security group
that pre-exists.
o Then, add this security group to Citrix PVS and grant 'Farm Administrator'
rights to it. The steps in this regard are available in Page 2 of this
document.
O Once this is done, then configure this test with the DOMAIN NAME,
DOMAIN USER, and DOMAIN PASSWORD of a user in this security
group.
Outputs of the
test
One set of results for the default store path of each store assigned to the Provisioning server
being monitored
andMeasuremeMeasurement
Measurement
Unit Interpretation

Monitor ing C it r ix Prov is ion ing Servers
47
nts made by
the test
Store path availability:
Indicates whether/not this
default store path is available.
Percent This measure reports the value 100 if the
store path is available, and 0 if it is not.
Compare the value of this measure across
store paths to identify those that are
currently unavailable.
Breaks in network connection and absence of
required access permissions are some of the
common reasons for the non-availability of a
store path.
For high availability of store paths, you may
want to configure an override store path for
each store. This way, it the default store path
is unavailable for any reason, Provisioning
services will automatically look up the
override path to deliver vDisks to users.
Store path access time:
Indicates the time taken to
access the vDisk via this
default store path.
Secs A low value is desired for this measure. A
consistent increase in this value is a cause for
concern, as it indicates that responsiveness
of the default store path is deteriorating. This
could be owing to a flaky network
connection. It could also be due to the
concurrent usage of the store path by
multiple target devices.
1.7.3 PVS Default Write Cache Paths Test The write cache includes data written by the target device. If data is written to the PVS server vDisk in a
caching mode, the data is not written back to the base vDisk. Instead, it is written to a write cache file.
If the default path to this write cache file is unavailable, then the client would hang. Similarly if the write
cache path is available but cannot be accessed quickly, then target devices may not be able to write
changes to the cache as fast as they occur. Naturally therefore, the base vDisk will be updated with the
changes only much later. Until then, target devices will be provided with an outdated vDisk upon boot.
To avoid such anomalies, administrators must be able to tell which write cache path is unavailable and
which takes a long time to access, well before they impact user experience. This is where the PVS Default
Write Cache Paths test helps. For each default write cache path it auto-discovers, this test reports the
availability of the path and its access time. In the process, it pinpoints unavailable write cache paths and
those that take too long to be accessed. Once the problematic paths are isolated, administrators can rapidly
initiate investigations into the root-cause and swiftly resolve it.
Purpose For each default write cache path it auto-discovers, this test reports the availability of the path
and its access time. In the process, it pinpoints unavailable write cache paths and those that
take too long to be accessed. Once the problematic paths are isolated, administrators can
rapidly initiate investigations into the root-cause and swiftly resolve it.
Target of the
test
A Citrix Provisioning server
Agent
deploying the
An internal agent
Monitor ing C it r ix Prov is ion ing Servers
48
test
Configurable
parameters for
the test
1. TEST PERIOD – How often should the test be executed
2. HOST – The host for which the test is to be configured
3. PORT – Refers to the port used by the Citrix Provisioning server. By default, this is 54321.
4. MCLI PATH – This test executes commands using the Management Command Line
Interface (MCLI) of the Provisioning server to collect the required metrics. To enable the
test to execute the commands, the eG agent, by default, auto-discovers the full path
MCLI.exe on the target Provisioning server. This is why, the MCLI PATH is set to none by
default. If, for some reason, the eG agent is unable to auto-discover the MCLI path, then
you will have to manually specify the path here using the following pointers:
Typically, in a 32-bit Windows system, the MCLI.exe will be available in the
following location by default: <System_Root>\Program Files\Citrix\Provisioning
Services Console
In a 64-bit Windows system on the other hand, the MCLI.exe will be available in
the following location by default: <System_Root>\Program Files
(x86)\Citrix\Provisioning Services Console
5. DOMAIN NAME, DOMAIN USER, DOMAIN PASSWORD – To report the desired metrics,
this test should run using the permissions of a user who belongs to the Security group with
'Farm Administrator' access. By default, only users in the Administrators group are allowed
full access to the PVS farm. You can hence configure the DOMAIN NAME, DOMAIN
USER, and DOMAIN PASSWORD parameters with the domain name and user credentials
(respectively) of a domain user who belongs to the Administrators group. However, if
owing to security restrictions imposed by your environment, you prefer not to expose the
credentials of any user who belongs to the Administrators group, then, do the following:
o Create a special Security group in AD for monitoring purposes. Add any
existing domain user to this group, or create a new user for this purpose
in AD and add his/her profile to the new Security group.
Alternatively, you can use any of the Security groups that pre-exist in AD,
create a new domain user in AD, and add that user to the Security group
that pre-exists.
o Then, add this security group to Citrix PVS and grant 'Farm Administrator'
rights to it. The steps in this regard are available in Page 2 of this
document.
O Once this is done, then configure this test with the DOMAIN NAME,
DOMAIN USER, and DOMAIN PASSWORD of a user in this security
group.
Outputs of the
test
One set of results for the default write cache path of each store assigned to the Provisioning
server being monitored
andMeasuremeMeasurement
Measurement
Unit Interpretation
Monitor ing C it r ix Prov is ion ing Servers
49
nts made by
the test
Write path availability:
Indicates whether/not this
default write cache path is
available.
Percent This measure reports the value 100 if the
write cache path is available, and 0 if it is
not.
Compare the value of this measure across
write cache paths to identify those that are
currently unavailable.
For high availability of write cache paths, you
may want to use the ‘multiple write cache
paths’ option that Citrix PVS offers. The
multiple write cache paths (for a store)
option provides the capability of distributing
the write cache files across multiple physical
media. When a target device starts the server
chooses one of the write cache paths from
the list based upon the MAC address of the
client. The goal of selecting a path based on
the MAC address is to get an even
distribution of the clients across the available
paths. The algorithm selects the same path
for a given client each time that client is
booted.
This functionality is needed to ensure that
during a High Availability (HA) failover the
(new) server would choose the same write
cache for the client (otherwise it would not
be able to find the write cache file and the
client would hang). If the defined write cache
path is not available to a server, the server
falls back to the standard vDisk path.
Write path access time:
Indicates the time taken to
access the write cache file in
this path.
Secs A low value is desired for this measure. A
consistent increase in this value is a cause for
concern, as it indicates that responsiveness
of the default store path is deteriorating. This
could be owing to a flaky network
connection. It could also be because the path
is overloaded with write requests from target
devices. In case of the latter, you may want
to consider using the ‘multiple write cache
paths’ feature offered by Citrix PVS. This
capability enables write cache files to be
distributed across multiple physical media.
This feature helps to improve I/O throughput
for heavily loaded servers, and thus improves
the responsiveness of write cache paths.
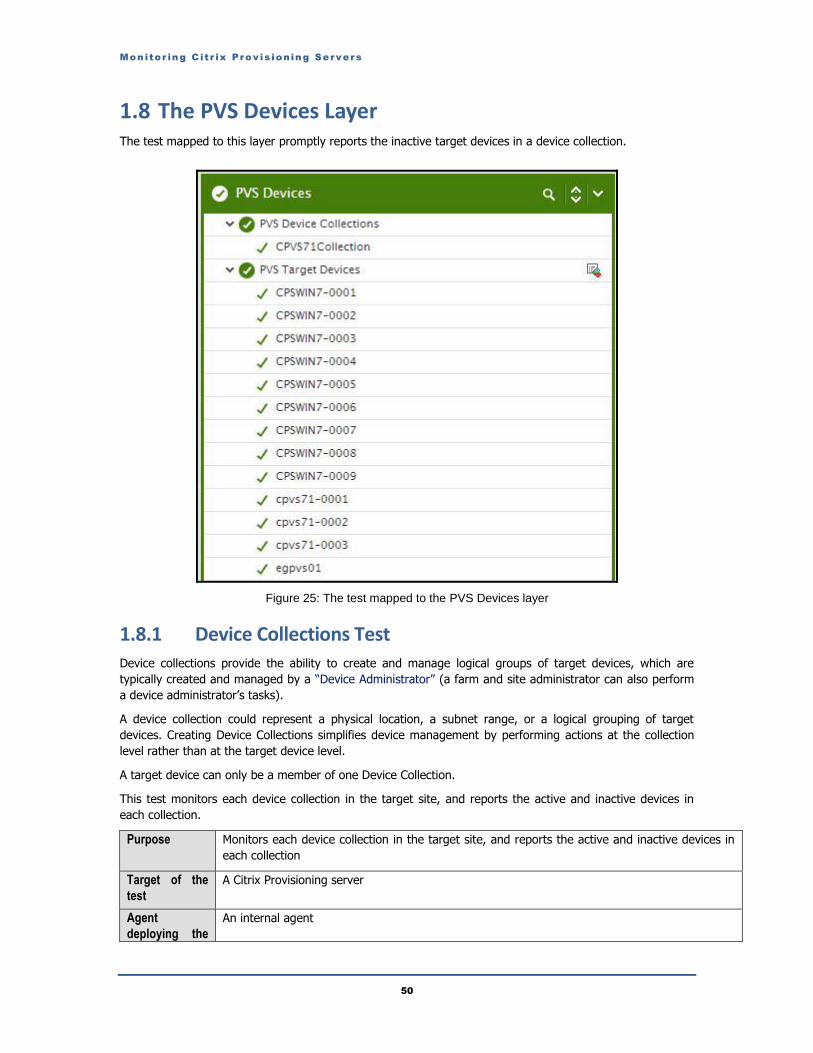
Monitor ing C it r ix Prov is ion ing Servers
50
1.8 The PVS Devices Layer The test mapped to this layer promptly reports the inactive target devices in a device collection.
Figure 25: The test mapped to the PVS Devices layer
1.8.1 Device Collections Test
Device collections provide the ability to create and manage logical groups of target devices, which are
typically created and managed by a “Device Administrator” (a farm and site administrator can also perform
a device administrator’s tasks).
A device collection could represent a physical location, a subnet range, or a logical grouping of target
devices. Creating Device Collections simplifies device management by performing actions at the collection
level rather than at the target device level.
A target device can only be a member of one Device Collection.
This test monitors each device collection in the target site, and reports the active and inactive devices in
each collection.
Purpose Monitors each device collection in the target site, and reports the active and inactive devices in
each collection
Target of the
test
A Citrix Provisioning server
Agent
deploying the
An internal agent
Monitor ing C it r ix Prov is ion ing Servers
51
test
Configurable
parameters for
the test
1. TEST PERIOD – How often should the test be executed
2. HOST – The host for which the test is to be configured
3. PORT – Refers to the port used by the Citrix Provisioning server. By default, this is 54321.
4. MCLI PATH – This test executes commands using the Management Command Line
Interface (MCLI) of the Provisioning server to collect the required metrics. To enable the
test to execute the commands, the eG agent, by default, auto-discovers the full path
MCLI.exe on the target Provisioning server. This is why, the MCLI PATH is set to none by
default. If, for some reason, the eG agent is unable to auto-discover the MCLI path, then
you will have to manually specify the path here using the following pointers:
Typically, in a 32-bit Windows system, the MCLI.exe will be available in the
following location by default: <System_Root>\Program Files\Citrix\Provisioning
Services Console
In a 64-bit Windows system on the other hand, the MCLI.exe will be available in
the following location by default: <System_Root>\Program Files
(x86)\Citrix\Provisioning Services Console
5. DOMAIN NAME, DOMAIN USER, DOMAIN PASSWORD – To report the desired metrics,
this test should run using the permissions of a user who belongs to the Security group with
'Farm Administrator' access. By default, only users in the Administrators group are allowed
full access to the PVS farm. You can hence configure the DOMAIN NAME, DOMAIN
USER, and DOMAIN PASSWORD parameters with the domain name and user credentials
(respectively) of a domain user who belongs to the Administrators group. However, if
owing to security restrictions imposed by your environment, you prefer not to expose the
credentials of any user who belongs to the Administrators group, then, do the following:
o Create a special Security group in AD for monitoring purposes. Add any
existing domain user to this group, or create a new user for this purpose
in AD and add his/her profile to the new Security group.
Alternatively, you can use any of the Security groups that pre-exist in AD,
create a new domain user in AD, and add that user to the Security group
that pre-exists.
o Then, add this security group to Citrix PVS and grant 'Farm Administrator'
rights to it. The steps in this regard are available in Page 2 of this
document.
O ONCE THIS IS DONE, THEN CONFIGURE THIS TEST WITH THE
DOMAIN NAME, DOMAIN USER, and DOMAIN PASSWORD of a user
in this security group.
6. DETAILED DIAGNOSIS - To make diagnosis more efficient and accurate, the eG
Enterprise suite embeds an optional detailed diagnostic capability. With this capability, the
eG agents can be configured to run detailed, more elaborate tests as and when specific
problems are detected. To enable the detailed diagnosis capability of this test for a
particular server, choose the On option. To disable the capability, click on the Off option.

Monitor ing C it r ix Prov is ion ing Servers
52
The option to selectively enable/disable the detailed diagnosis capability will be available
only if the following conditions are fulfilled:
The eG manager license should allow the detailed diagnosis capability
Both the normal and abnormal frequencies configured for the detailed diagnosis
measures should not be 0.
Outputs of the
test
One set of results for every device collection configured in the target site
Measurements
made by the
test
Measurement Measurement
Unit Interpretation
Total devices:
Indicates the total number of
target devices in this device
collection.
Number
Active devices:
Indicates the number of
target devices in this device
collection that are currently
connected to a vDisk.
Number Use the detailed diagnosis of this measure to
know which target devices in the collection
are currently active.
Inactive devices:
Indicates the target devices
in this collection that are not
connected to any vDisk.
Number Use the detailed diagnosis of this measure to
know which target devices in the collection
are currently inactive.
Use the detailed diagnosis of the Inactive devices measure to know which target devices in the collection
are currently inactive. For each inactive device, the detailed diagnosis will reveal the device name, the MAC
address, whether the device is booting from a vDisk or not and if so which vDisk, which server is associated
with the device, and whether the server IP address is down/up.
Figure 26: The detailed diagnosis of the Inactive devices measure
1.8.2 PVS Target Devices Test
Provisioning Services provides administrators the ability to virtualize a hard disk or workload and then
stream it back out to multiple devices. The workloads, which can be server or desktop, are ripped from a
physical or virtual disk into Microsoft’s virtual hard disk (VHD) format and treated as a golden master image
called a vDisk. This master image is then streamed over the network from a Windows server running the
stream service to multiple target devices that were PXE booted. When a vDisk is in private mode, the vDisk
can be edited. When a vDisk is in standard mode, it is read-only and no changes can be made to it. Instead
all disk write operations are redirected to what is referred to as a write-cache file. The intelligent device
drivers are smart enough to redirect writes to the write-cache file and read newly written files from the
Monitor ing C it r ix Prov is ion ing Servers
53
write-cache file instead of the server when necessary. When using Citrix Provisioning Services with the vDisk
in standard mode you have a write-cache drive location that holds all the writes for the operating system. If
the write-cache file fills up unexpectedly, the operating system will behave the same as if the drive ran out
of space without any warning - in other words, it will blue screen. To avoid this, it is imperative to
continuously track the usage of the write-cache, so that you can be forewarned of a probable space crunch
in the write-cache and can resize the write-cache file to accommodate subsequent writes. The PVS Target
Devices test enables this analysis. This test helps administrators keep tabs on the usage of the write-cache
of every target device that is connected to the Provisioning server, and sends out proactive alerts to
administrators if it finds that a write-cache file is rapidly filling up. This way, the test aids in averting
operating system crashes that may occur owing to lack of space in the write-cache. Moreover, in the
process of monitoring the I/O activity on the Citrix PVS, the test also promptly captures I/O transaction
failures and reports the number of times each target device had to retry an I/O transaction on the PVS. This
will shed light on communication issues that may exist between the target device and the PVS.
Purpose Helps administrators keep tabs on the usage of the write-cache of every target device that is
connected to the Provisioning server, and sends out proactive alerts to administrators if it finds
that a write-cache file is rapidly filling up. Also, promptly captures I/O transaction failures and
reports the number of times each target device had to retry an I/O transaction on the PVS
Target of the
test
A Citrix Provisioning server
Agent
deploying the
test
An internal agent
Monitor ing C it r ix Prov is ion ing Servers
54
Configurable
parameters for
the test
1. TEST PERIOD – How often should the test be executed
7. HOST – The host for which the test is to be configured
8. PORT – Refers to the port used by the Citrix Provisioning server. By default, this is 54321.
9. MCLI PATH – This test executes commands using the Management Command Line
Interface (MCLI) of the Provisioning server to collect the required metrics. To enable the
test to execute the commands, the eG agent, by default, auto-discovers the full path
MCLI.exe on the target Provisioning server. This is why, the MCLI PATH is set to none by
default. If, for some reason, the eG agent is unable to auto-discover the MCLI path, then
you will have to manually specify the path here using the following pointers:
Typically, in a 32-bit Windows system, the MCLI.exe will be available in the
following location by default: <System_Root>\Program Files\Citrix\Provisioning
Services Console
In a 64-bit Windows system on the other hand, the MCLI.exe will be available in
the following location by default: <System_Root>\Program Files
(x86)\Citrix\Provisioning Services Console
10. DOMAIN NAME, DOMAIN USER, DOMAIN PASSWORD – To report the desired metrics,
this test should run using the permissions of a user who belongs to the Security group with
'Farm Administrator' access. By default, only users in the Administrators group are allowed
full access to the PVS farm. You can hence configure the DOMAIN NAME, DOMAIN
USER, and DOMAIN PASSWORD parameters with the domain name and user credentials
(respectively) of a domain user who belongs to the Administrators group. However, if
owing to security restrictions imposed by your environment, you prefer not to expose the
credentials of any user who belongs to the Administrators group, then, do the following:
o Create a special Security group in AD for monitoring purposes. Add any
existing domain user to this group, or create a new user for this purpose
in AD and add his/her profile to the new Security group.
Alternatively, you can use any of the Security groups that pre-exist in AD,
create a new domain user in AD, and add that user to the Security group
that pre-exists.
o Then, add this security group to Citrix PVS and grant 'Farm Administrator'
rights to it. The steps in this regard are available in Page 2 of this
document.
O ONCE THIS IS DONE, THEN CONFIGURE THIS TEST WITH THE
DOMAIN NAME, DOMAIN USER, and DOMAIN PASSWORD of a user
in this security group.
11. LOCAL HOST ONLY – By default, this flag is set to No. This implies that, by default, the
test auto-discovers all the target devices mapped to all vDisks in the PVS farm, and reports
metrics per device. Setting the flag to Yes ensures that the test reports metrics for only
those target devices that are mapped to the monitored PVS server only.
Monitor ing C it r ix Prov is ion ing Servers
55
12. DETAILED DIAGNOSIS - To make diagnosis more efficient and accurate, the eG
Enterprise suite embeds an optional detailed diagnostic capability. With this capability, the
eG agents can be configured to run detailed, more elaborate tests as and when specific
problems are detected. To enable the detailed diagnosis capability of this test for a
particular server, choose the On option. To disable the capability, click on the Off option.
The option to selectively enable/disable the detailed diagnosis capability will be available
only if the following conditions are fulfilled:
The eG manager license should allow the detailed diagnosis capability
Both the normal and abnormal frequencies configured for the detailed diagnosis
measures should not be 0.
Outputs of the
test
By default, the test reports one set of results for each target device mapped to every PVS server
in the farm being monitored
Measurements
made by the Measurement
Measurement
Unit Interpretation
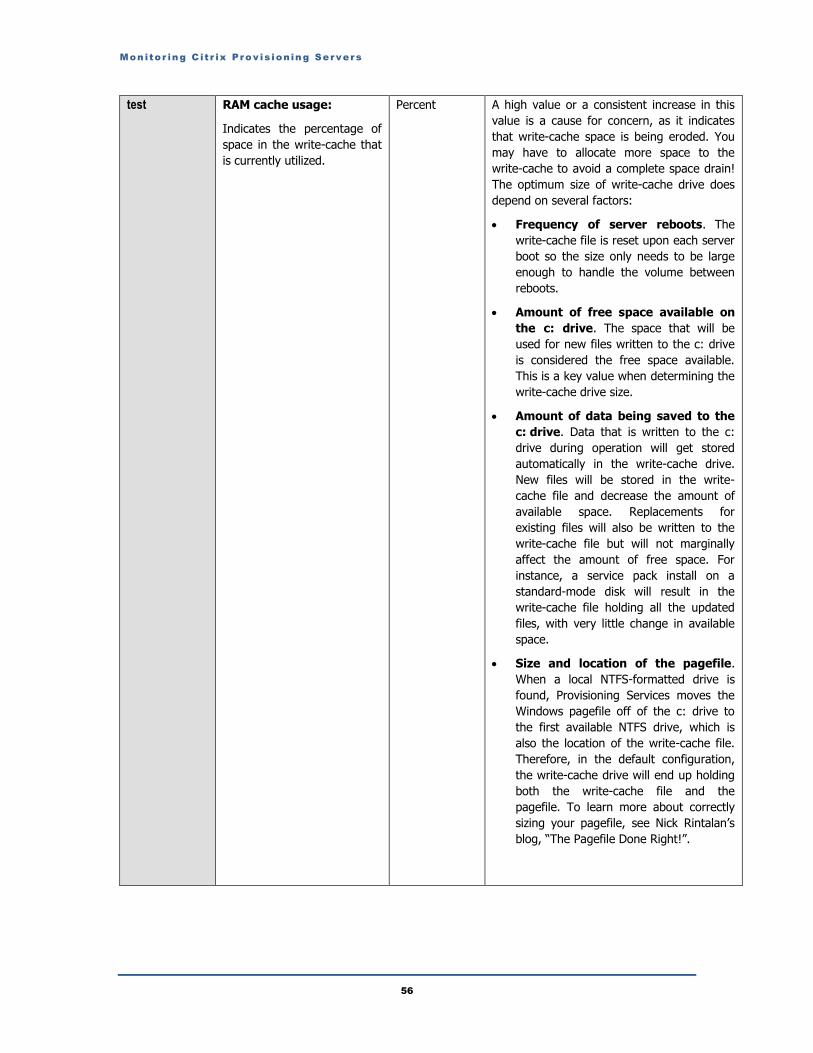
Monitor ing C it r ix Prov is ion ing Servers
56
test RAM cache usage:
Indicates the percentage of
space in the write-cache that
is currently utilized.
Percent A high value or a consistent increase in this
value is a cause for concern, as it indicates
that write-cache space is being eroded. You
may have to allocate more space to the
write-cache to avoid a complete space drain!
The optimum size of write-cache drive does
depend on several factors:
Frequency of server reboots. The
write-cache file is reset upon each server
boot so the size only needs to be large
enough to handle the volume between
reboots.
Amount of free space available on
the c: drive. The space that will be
used for new files written to the c: drive
is considered the free space available.
This is a key value when determining the
write-cache drive size.
Amount of data being saved to the
c: drive. Data that is written to the c:
drive during operation will get stored
automatically in the write-cache drive.
New files will be stored in the write-
cache file and decrease the amount of
available space. Replacements for
existing files will also be written to the
write-cache file but will not marginally
affect the amount of free space. For
instance, a service pack install on a
standard-mode disk will result in the
write-cache file holding all the updated
files, with very little change in available
space.
Size and location of the pagefile.
When a local NTFS-formatted drive is
found, Provisioning Services moves the
Windows pagefile off of the c: drive to
the first available NTFS drive, which is
also the location of the write-cache file.
Therefore, in the default configuration,
the write-cache drive will end up holding
both the write-cache file and the
pagefile. To learn more about correctly
sizing your pagefile, see Nick Rintalan’s
blog, “The Pagefile Done Right!”.
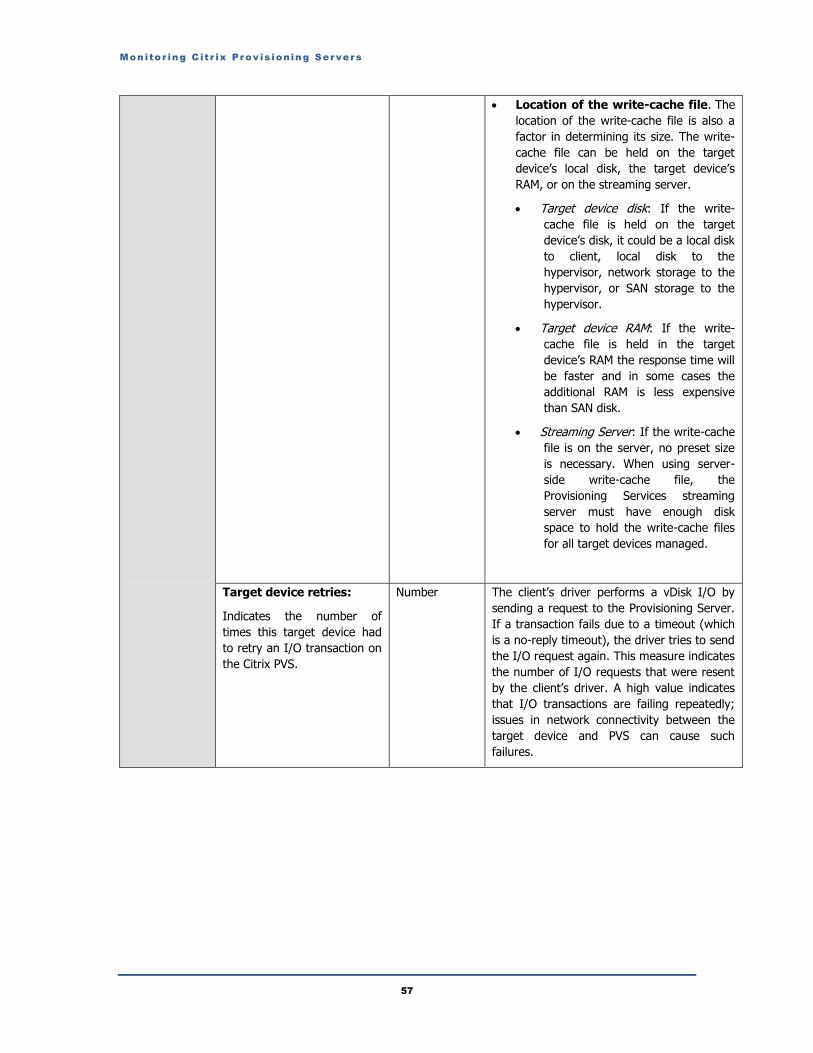
Monitor ing C it r ix Prov is ion ing Servers
57
Location of the write-cache file. The
location of the write-cache file is also a
factor in determining its size. The write-
cache file can be held on the target
device’s local disk, the target device’s
RAM, or on the streaming server.
Target device disk: If the write-
cache file is held on the target
device’s disk, it could be a local disk
to client, local disk to the
hypervisor, network storage to the
hypervisor, or SAN storage to the
hypervisor.
Target device RAM: If the write-
cache file is held in the target
device’s RAM the response time will
be faster and in some cases the
additional RAM is less expensive
than SAN disk.
Streaming Server: If the write-cache
file is on the server, no preset size
is necessary. When using server-
side write-cache file, the
Provisioning Services streaming
server must have enough disk
space to hold the write-cache files
for all target devices managed.
Target device retries:
Indicates the number of
times this target device had
to retry an I/O transaction on
the Citrix PVS.
Number The client’s driver performs a vDisk I/O by
sending a request to the Provisioning Server.
If a transaction fails due to a timeout (which
is a no-reply timeout), the driver tries to send
the I/O request again. This measure indicates
the number of I/O requests that were resent
by the client’s driver. A high value indicates
that I/O transactions are failing repeatedly;
issues in network connectivity between the
target device and PVS can cause such
failures.

Monitor ing C it r ix Prov is ion ing Servers
58
Write cache size:
Indicates the current size of
the write cache of this target
device.
MB When using Citrix Provisioning Services with
the vDisk in standard mode you have a write-
cache drive location that holds all the writes
for the operating system. If the write-cache
file is not properly sized, it may fill up
unexpectedly; in this case, the operating
system will behave the same as if the drive
ran out of space without any warning, in
other words it will blue screen.
The optimum size of write-cache drive
depends on several factors:
Frequency of server reboots. The
write-cache file is reset upon each server
boot so the size only needs to be large
enough to handle the volume between
reboots.
Amount of free space available on
the c: drive. The space that will be
used for new files written to the c: drive
is considered the free space available.
This is a key value when determining the
write-cache drive size.
Amount of data being saved to the
c: drive. Data that is written to the c:
drive during operation will get stored
automatically in the write-cache drive.
New files will be stored in the write-
cache file and decrease the amount of
available space. Replacements for
existing files will also be written to the
write-cache file but will not marginally
affect the amount of free space. For
instance, a service pack install on a
standard-mode disk will result in the
write-cache file holding all the updated
files, with very little change in available
space.
Size and location of the pagefile.
When a local NTFS-formatted drive is
found, Provisioning Services moves the
Windows pagefile off of the c: drive to
the first available NTFS drive, which is
also the location of the write-cache file.
Therefore, in the default configuration,
the write-

Monitor ing C it r ix Prov is ion ing Servers
59
cache drive will end up holding both the
write-cache file and the pagefile.
Location of the write-cache file. The
location of the write-cache file is also a
factor in determining its size. The write-
cache file can be held on the target
device’s local disk, the target device’s
RAM, or on the streaming server.
o Target device disk: If the write-
cache file is held on the target
device’s disk, it could be a local
disk to client, local disk to the
hypervisor, network storage to
the hypervisor, or SAN storage
to the hypervisor.
o Target device RAM: If the write-
cache file is held in the target
device’s RAM the response time
will be faster and in some cases
the additional RAM is less
expensive than SAN disk.
o Streaming Server: If the write-
cache file is on the server, no
preset size is necessary. When
using server-side write-cache
file, the Provisioning Services
streaming server must have
enough disk space to hold the
write-cache files for all target
devices managed.
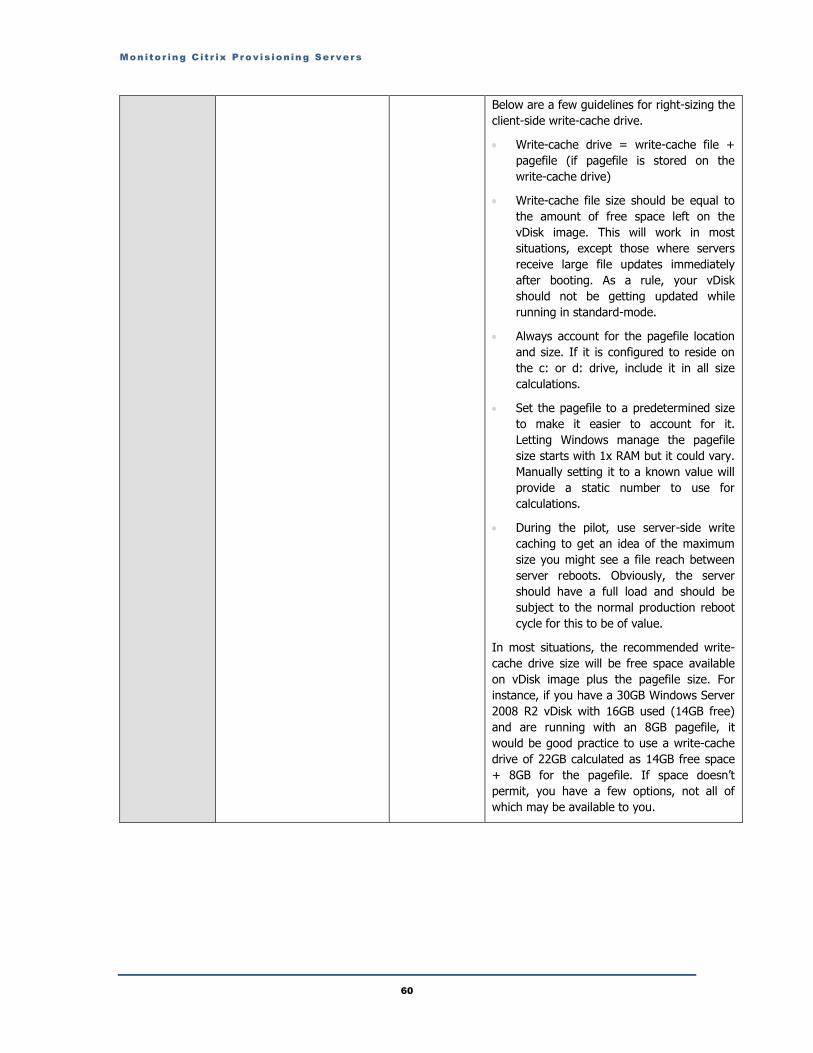
Monitor ing C it r ix Prov is ion ing Servers
60
Below are a few guidelines for right-sizing the
client-side write-cache drive.
Write-cache drive = write-cache file +
pagefile (if pagefile is stored on the
write-cache drive)
Write-cache file size should be equal to
the amount of free space left on the
vDisk image. This will work in most
situations, except those where servers
receive large file updates immediately
after booting. As a rule, your vDisk
should not be getting updated while
running in standard-mode.
Always account for the pagefile location
and size. If it is configured to reside on
the c: or d: drive, include it in all size
calculations.
Set the pagefile to a predetermined size
to make it easier to account for it.
Letting Windows manage the pagefile
size starts with 1x RAM but it could vary.
Manually setting it to a known value will
provide a static number to use for
calculations.
During the pilot, use server-side write
caching to get an idea of the maximum
size you might see a file reach between
server reboots. Obviously, the server
should have a full load and should be
subject to the normal production reboot
cycle for this to be of value.
In most situations, the recommended write-
cache drive size will be free space available
on vDisk image plus the pagefile size. For
instance, if you have a 30GB Windows Server
2008 R2 vDisk with 16GB used (14GB free)
and are running with an 8GB pagefile, it
would be good practice to use a write-cache
drive of 22GB calculated as 14GB free space
+ 8GB for the pagefile. If space doesn’t
permit, you have a few options, not all of
which may be available to you.
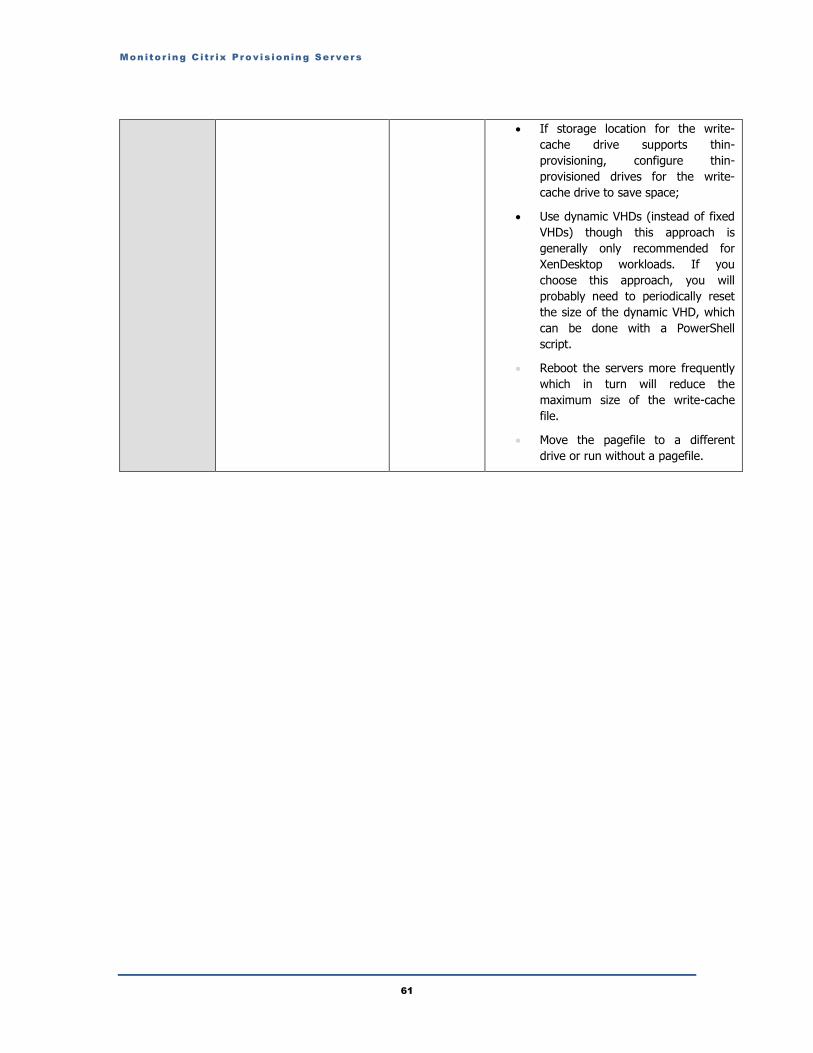
Monitor ing C it r ix Prov is ion ing Servers
61
If storage location for the write-
cache drive supports thin-
provisioning, configure thin-
provisioned drives for the write-
cache drive to save space;
Use dynamic VHDs (instead of fixed
VHDs) though this approach is
generally only recommended for
XenDesktop workloads. If you
choose this approach, you will
probably need to periodically reset
the size of the dynamic VHD, which
can be done with a PowerShell
script.
Reboot the servers more frequently
which in turn will reduce the
maximum size of the write-cache
file.
Move the pagefile to a different
drive or run without a pagefile.
Conc lus ion
62
Conclusion This document has described in detail the monitoring paradigm used and the measurement capabilities of
the eG Enterprise suite of products with respect to the Citrix Provisioning Server. For details of how to
administer and use the eG Enterprise suite of products, refer to the user manuals.
We will be adding new measurement capabilities into the future versions of the eG Enterprise suite. If you
can identify new capabilities that you would like us to incorporate in the eG Enterprise suite of products,
please contact [email protected]. We look forward to your support and cooperation. Any
feedback regarding this manual or any other aspects of the eG Enterprise suite can be forwarded to