monitoring the future occasional ppaper...
TRANSCRIPT

monitoring the futureoccasional ppaper sseries
paper 60
DEMOGRAPHIC SUBGROUP TRENDS FOR VARIOUSLICIT AND ILLICIT DRUGS
1975-2003
Lloyd D. JohnstonPatrick M. O’MalleyJerald G. Bachman
John E. Schulenberg
paper 67
DEMOGRAPHIC SUBGROUP TRENDS FOR VARIOUS LICIT AND ILLICIT DRUGS, 1975–2006
Lloyd D. JohnstonPatrick M. O’MalleyJerald G. Bachman
John E. Schulenberg

Monitoring the Future: A Continuing Study of the Lifestyles and Values of Youth
As its title suggests, this study is intended to assess the changing lifestyles, values, and preferences of American youth on a continuing basis. Each year since 1975 about 17,000 seniors have participated in the annual survey, which is conducted in some 130 high schools nationwide. In addition, subsamples of seniors from previously participating classes receive follow-up questionnaires by mail each year.
This Occasional Paper Series is intended to disseminate a variety of products from the study, including pre-publication (and somewhat more detailed) versions of journal articles, other substantive articles, and methodological papers.
A full listing of occasional papers and other study reports is available from Monitoring the Future, Institute for Social Research, The University of Michigan, P.O. Box 1248, Ann Arbor, MI 48106.
Recommended Citation Johnston, L. D., O’Malley, P. M., Bachman, J. G., & Schulenberg, J. E. (2004). Demographic subgroup trends for various licit and illicit drugs, 1975-2003.(Monitoring the Future Occasional Paper No. 60) [On-line]. Ann Arbor, MI: Institute for Social Research. Available: http://monitoringthefuture.org/
Johnston, L. D., O’Malley, P. M., Bachman, J. G., & Schulenberg, J. E. (2007). Demographic subgroup trends for various licit and illicit drugs, 1975–2006 (Monitoring the Future Occasional Paper No. 67) [Online]. Ann Arbor, MI: Institute for Social Research. Available: http://monitoringthefuture.org/

Demographic Subgroup Trends for Various Licit and Illicit Drugs
1975–2006
Monitoring the Future Occasional Paper 67
Lloyd D. Johnston, Ph.D. Patrick M. O’Malley, Ph.D. Jerald G. Bachman, Ph.D.
John E. Schulenberg, Ph.D.
The University of Michigan Institute for Social Research
Ann Arbor, MI 2007

Recommended Citation: Johnston, L. D., O’Malley, P. M., Bachman, J. G., & Schulenberg, J. E. (2007). Demographic subgroup trends for various licit and illicit drugs, 1975–2006 (Monitoring the Future Occasional Paper No. 67) [Online]. Ann Arbor, MI: Institute for Social Research. Available: http://www.monitoringthefuture.org/

iii
CONTENTS
LIST OF FIGURES ......................................................................................................... iv
INTRODUCTION..............................................................................................................1
FIGURES............................................................................................................................2
DEFINITION OF BACKGROUND AND DEMOGRAPHIC SUBGROUPS Appendix B of Monitoring the Future National Survey Results on Drug Use, 1975–2006, Volume I: Secondary School Students .........................................................254
SUPPLEMENTAL TABLES FOR SECONDARY SCHOOL STUDENTS: TRENDS BY SUBGROUP Appendix D of Monitoring the Future National Survey Results on Drug Use, 1975–2006, Volume I: Secondary School Students .........................................................258
LIST OF TABLES .........................................................................................................259
TABLES..........................................................................................................................260

iv
LIST OF FIGURES Any Illicit Drug: Trends in Annual Prevalence
By Gender ................................................................................................................2 By College Plans......................................................................................................3 By Region ................................................................................................................4 By Population Density .............................................................................................5 By Parents’ Average Education ...............................................................................6 By Race/Ethnicity ....................................................................................................7
Any Illicit Drug Other Than Marijuana: Trends in Annual Prevalence By Gender ................................................................................................................8 By College Plans......................................................................................................9 By Region ..............................................................................................................10 By Population Density ...........................................................................................11 By Parents’ Average Education .............................................................................12 By Race/Ethnicity ..................................................................................................13
Marijuana: Trends in Annual Prevalence By Gender ..............................................................................................................14 By College Plans....................................................................................................15 By Region ..............................................................................................................16 By Population Density ...........................................................................................17 By Parents’ Average Education .............................................................................18 By Race/Ethnicity ..................................................................................................19
Inhalants: Trends in Annual Prevalence By Gender ..............................................................................................................20 By College Plans....................................................................................................21 By Region ..............................................................................................................22 By Population Density ...........................................................................................23 By Parents’ Average Education .............................................................................24 By Race/Ethnicity ..................................................................................................25
Hallucinogens: Trends in Annual Prevalence By Gender ..............................................................................................................26 By College Plans....................................................................................................27 By Region ..............................................................................................................28 By Population Density ...........................................................................................29 By Parents’ Average Education .............................................................................30 By Race/Ethnicity ..................................................................................................31

v
LIST OF FIGURES (continued) LSD: Trends in Annual Prevalence By Gender ..............................................................................................................32 By College Plans....................................................................................................33 By Region ..............................................................................................................34 By Population Density ...........................................................................................35 By Parents’ Average Education .............................................................................36 By Race/Ethnicity ..................................................................................................37
Other Hallucinogens: Trends in Annual Prevalence By Gender ..............................................................................................................38 By College Plans....................................................................................................39 By Region ..............................................................................................................40 By Population Density ...........................................................................................41 By Parents’ Average Education .............................................................................42 By Race/Ethnicity ..................................................................................................43
MDMA (Ecstasy): Trends in Annual Prevalence By Gender ..............................................................................................................44 By College Plans....................................................................................................45 By Region ..............................................................................................................46 By Population Density ...........................................................................................47 By Parents’ Average Education .............................................................................48 By Race/Ethnicity ..................................................................................................49
Cocaine: Trends in Annual Prevalence By Gender ..............................................................................................................50 By College Plans....................................................................................................51 By Region ..............................................................................................................52 By Population Density ...........................................................................................53 By Parents’ Average Education .............................................................................54 By Race/Ethnicity ..................................................................................................55
Crack: Trends in Annual Prevalence By Gender ..............................................................................................................56 By College Plans....................................................................................................57 By Region ..............................................................................................................58 By Population Density ...........................................................................................59 By Parents’ Average Education .............................................................................60 By Race/Ethnicity ..................................................................................................61
vi
LIST OF FIGURES (continued) Other Cocaine: Trends in Annual Prevalence By Gender ..............................................................................................................62 By College Plans....................................................................................................63 By Region ..............................................................................................................64 By Population Density ...........................................................................................65 By Parents’ Average Education .............................................................................66 By Race/Ethnicity ..................................................................................................67
Heroin: Trends in Annual Prevalence By Gender ..............................................................................................................68 By College Plans....................................................................................................69 By Region ..............................................................................................................70 By Population Density ...........................................................................................71 By Parents’ Average Education .............................................................................72 By Race/Ethnicity ..................................................................................................73
Heroin With a Needle: Trends in Annual Prevalence By Gender ..............................................................................................................74 By College Plans....................................................................................................75 By Region ..............................................................................................................76 By Population Density ...........................................................................................77 By Parents’ Average Education .............................................................................78 By Race/Ethnicity ..................................................................................................79
Heroin Without a Needle: Trends in Annual Prevalence By Gender ..............................................................................................................80 By College Plans....................................................................................................81 By Region ..............................................................................................................82 By Population Density ...........................................................................................83 By Parents’ Average Education .............................................................................84 By Race/Ethnicity ..................................................................................................85
Other Narcotics: Trends in Annual Prevalence By Gender ..............................................................................................................86 By College Plans....................................................................................................87 By Region ..............................................................................................................88 By Population Density ...........................................................................................89 By Parents’ Average Education .............................................................................90 By Race/Ethnicity ..................................................................................................91

vii
LIST OF FIGURES (continued) OxyContin: Trends in Annual Prevalence By Gender ..............................................................................................................92 By College Plans....................................................................................................93 By Region ..............................................................................................................94 By Population Density ...........................................................................................95 By Parents’ Average Education .............................................................................96 By Race/Ethnicity ..................................................................................................97
Vicodin: Trends in Annual Prevalence By Gender ..............................................................................................................98 By College Plans....................................................................................................99 By Region ............................................................................................................100 By Population Density .........................................................................................101 By Parents’ Average Education ...........................................................................102 By Race/Ethnicity ................................................................................................103
Amphetamines: Trends in Annual Prevalence By Gender ............................................................................................................104 By College Plans..................................................................................................105 By Region ............................................................................................................106 By Population Density .........................................................................................107 By Parents’ Average Education ...........................................................................108 By Race/Ethnicity ................................................................................................109
Ritalin: Trends in Annual Prevalence By Gender ............................................................................................................110 By College Plans..................................................................................................111 By Region ............................................................................................................112 By Population Density .........................................................................................113 By Parents’ Average Education ...........................................................................114 By Race/Ethnicity ................................................................................................115
Methamphetamine: Trends in Annual Prevalence By Gender ............................................................................................................116 By College Plans..................................................................................................117 By Region ............................................................................................................118 By Population Density .........................................................................................119 By Parents’ Average Education ...........................................................................120 By Race/Ethnicity ................................................................................................121

viii
LIST OF FIGURES (continued) Ice: Trends in Annual Prevalence By Gender ............................................................................................................122 By College Plans..................................................................................................123 By Region ............................................................................................................124 By Population Density .........................................................................................125 By Parents’ Average Education ...........................................................................126 By Race/Ethnicity ................................................................................................127
Sedatives (Barbiturates): Trends in Annual Prevalence By Gender ............................................................................................................128 By College Plans..................................................................................................129 By Region ............................................................................................................130 By Population Density .........................................................................................131 By Parents’ Average Education ...........................................................................132 By Race/Ethnicity ................................................................................................133
Tranquilizers: Trends in Annual Prevalence By Gender ............................................................................................................134 By College Plans..................................................................................................135 By Region ............................................................................................................136 By Population Density .........................................................................................137 By Parents’ Average Education ...........................................................................138 By Race/Ethnicity ................................................................................................139
Rohypnol: Trends in Annual Prevalence By Gender ............................................................................................................140 By College Plans..................................................................................................141 By Region ............................................................................................................142 By Population Density .........................................................................................143 By Parents’ Average Education ...........................................................................144 By Race/Ethnicity ................................................................................................145
Alcohol: Trends in 30-Day Prevalence By Gender ............................................................................................................146 By College Plans..................................................................................................147 By Region ............................................................................................................148 By Population Density .........................................................................................149 By Parents’ Average Education ...........................................................................150 By Race/Ethnicity ................................................................................................151

ix
LIST OF FIGURES (continued) Alcohol: Trends in 30-Day Prevalence of Having Been Drunk By Gender ............................................................................................................152 By College Plans..................................................................................................153 By Region ............................................................................................................154 By Population Density .........................................................................................155 By Parents’ Average Education ...........................................................................156 By Race/Ethnicity ................................................................................................157
Alcohol: Trends in Two-Week Prevalence of Five or More Drinks in a Row By Gender ............................................................................................................158 By College Plans..................................................................................................159 By Region ............................................................................................................160 By Population Density .........................................................................................161 By Parents’ Average Education ...........................................................................162 By Race/Ethnicity ................................................................................................163
Beer: Trends in 30-Day Prevalence By Gender ............................................................................................................164 By College Plans..................................................................................................165 By Region ............................................................................................................166 By Population Density .........................................................................................167 By Parents’ Average Education ...........................................................................168 By Race/Ethnicity ................................................................................................169
Beer: Trends in Two-Week Prevalence of Five or More Drinks in a Row By Gender ............................................................................................................170 By College Plans..................................................................................................171 By Region ............................................................................................................172 By Population Density .........................................................................................173 By Parents’ Average Education ...........................................................................174 By Race/Ethnicity ................................................................................................175
Liquor: Trends in 30-Day Prevalence By Gender ............................................................................................................176 By College Plans..................................................................................................177 By Region ............................................................................................................178 By Population Density .........................................................................................179 By Parents’ Average Education ...........................................................................180 By Race/Ethnicity ................................................................................................181

x
LIST OF FIGURES (continued) Liquor: Trends in Two-Week Prevalence of Five or More Drinks in a Row By Gender ............................................................................................................182 By College Plans..................................................................................................183 By Region ............................................................................................................184 By Population Density .........................................................................................185 By Parents’ Average Education ...........................................................................186 By Race/Ethnicity ................................................................................................187
Wine: Trends in 30-Day Prevalence By Gender ............................................................................................................188 By College Plans..................................................................................................189 By Region ............................................................................................................190 By Population Density .........................................................................................191 By Parents’ Average Education ...........................................................................192 By Race/Ethnicity ................................................................................................193
Wine: Trends in Two-Week Prevalence of Five or More Drinks in a Row By Gender ............................................................................................................194 By College Plans..................................................................................................195 By Region ............................................................................................................196 By Population Density .........................................................................................197 By Parents’ Average Education ...........................................................................198 By Race/Ethnicity ................................................................................................199
Wine Coolers: Trends in 30-Day Prevalence
By Gender ............................................................................................................200 By College Plans..................................................................................................201 By Region ............................................................................................................202 By Population Density .........................................................................................203 By Parents’ Average Education ...........................................................................204 By Race/Ethnicity ................................................................................................205
Wine Coolers: Trends in Two-Week Prevalence of Five or More Drinks in a Row
By Gender ............................................................................................................206 By College Plans..................................................................................................207 By Region ............................................................................................................208 By Population Density .........................................................................................209 By Parents’ Average Education ...........................................................................210 By Race/Ethnicity ................................................................................................211

xi
LIST OF FIGURES (continued) Flavored Alcoholic Beverages: Trends in 30-Day Prevalence By Gender ............................................................................................................212 By College Plans..................................................................................................213 By Region ............................................................................................................214 By Population Density .........................................................................................215 By Parents’ Average Education ...........................................................................216 By Race/Ethnicity ................................................................................................217
Cigarettes: Trends in 30-Day Prevalence By Gender ............................................................................................................218 By College Plans..................................................................................................219 By Region ............................................................................................................220 By Population Density .........................................................................................221 By Parents’ Average Education ...........................................................................222 By Race/Ethnicity ................................................................................................223
Cigarettes: Trends in 30-Day Prevalence of Daily Use By Gender ............................................................................................................224 By College Plans..................................................................................................225 By Region ............................................................................................................226 By Population Density .........................................................................................227 By Parents’ Average Education ...........................................................................228 By Race/Ethnicity ................................................................................................229
Cigarettes: Trends in 30-Day Prevalence of Use of Half-Pack a Day or More By Gender ............................................................................................................230 By College Plans..................................................................................................231 By Region ............................................................................................................232 By Population Density .........................................................................................233 By Parents’ Average Education ...........................................................................234 By Race/Ethnicity ................................................................................................235
Smokeless Tobacco: Trends in 30-Day Prevalence By Gender ............................................................................................................236 By College Plans..................................................................................................237 By Region ............................................................................................................238 By Population Density .........................................................................................239 By Parents’ Average Education ...........................................................................240 By Race/Ethnicity ................................................................................................241

xii
LIST OF FIGURES (continued) Smokeless Tobacco: Trends in 30-Day Prevalence of Daily Use By Gender ............................................................................................................242 By College Plans..................................................................................................243 By Region ............................................................................................................244 By Population Density .........................................................................................245 By Parents’ Average Education ...........................................................................246 By Race/Ethnicity ................................................................................................247
Steroids: Trends in Annual Prevalence By Gender ............................................................................................................248 By College Plans..................................................................................................249 By Region ............................................................................................................250 By Population Density .........................................................................................251 By Parents’ Average Education ...........................................................................252 By Race/Ethnicity ................................................................................................253

INTRODUCTION
This occasional paper serves as a supplement to the first of two annual monographs from the Monitoring the Future study, published by the study’s sponsor, the National Institute on Drug Abuse. The full 2006 survey results are reported in Monitoring the Future National Survey Results on Drug Use, 1975–2006: Volume I, Secondary School Students.1 That monograph, which can be accessed on the Monitoring the Future Web site, contains a description of the design and purposes of the Monitoring the Future study, so that information is not repeated here.
Volume I also contains (in appendix D) tabular data on trends in drug use for various
demographic subgroups for each of the many drugs under study. The present occasional paper contains the graphic presentations of those subgroup trends because graphic presentations are much easier to comprehend. (Showing the trends in color greatly facilitates the differentiation of the various trend lines in each graph.) The graphic presentations have not been included in Volume I due both to their length and the cost of printing them in color.
The demographic subgroups covered here (identical to those covered in Volume I) are based on:
• Gender • College plans • Region of the country • Population density • Education level of the parents (a proxy for socioeconomic level) • Racial/ethnic identification
Trend data are presented for 12th-grade respondents beginning with 1975, the first year in
which nationally representative samples of high school seniors were surveyed. Trend data for 8th and 10th grades are presented beginning with 1991, when those grade levels were added to the study design. The numerical information upon which these graphics are based is contained in the relevant appendix D tables of the full volume. Detailed definitions of the demographic categories are given in appendix B of that volume. For the reader’s convenience, both appendix B and appendix D from Volume I have also been included in this occasional paper.
This occasional paper is available only in electronic form. The larger Volume I, which it supplements, is available both on the Web site and in printed form.
1Johnston, L. D., O’Malley, P. M., Bachman, J. G., & Schulenberg, J. E. (2007). Monitoring the Future national survey results on drug use, 1975-2006. Volume 1: Secondary school students (NIH Publication No. 07-6205). Bethesda, MD: National Institute on Drug Abuse. (Also available online at www.monitoringthefuture.org. Look under “Publications,” and then under “Monographs.”) This monograph should be available in hard-copy form in August 2007.
1

Any Illicit Drug: Trends in Annual Prevalence by Gender
0
10
20
30
40
50
60
70
80
90
100
'76 '78 '80 '82 '84 '86 '88 '90 '92 '94 '96 '98 '00 '02 '04 '06
Year
Male
Female
Perc
ent
0
10
20
30
40
50
60
70
80
90
100
'76 '78 '80 '82 '84 '86 '88 '90 '92 '94 '96 '98 '00 '02 '04 '06
Year
Male
Female
0
10
20
30
40
50
60
70
80
90
100
'76 '78 '80 '82 '84 '86 '88 '90 '92 '94 '96 '98 '00 '02 '04 '06
Year
Male
Female
Perc
ent
Perc
ent
8th Graders 10th Graders 12th Graders
2

Any Illicit Drug: Trends in Annual Prevalence by College Plans
0
10
20
30
40
50
60
70
80
90
100
'76 '78 '80 '82 '84 '86 '88 '90 '92 '94 '96 '98 '00 '02 '04 '06
Year
< 4 yrs
Complete 4 yr
Perc
ent
0
10
20
30
40
50
60
70
80
90
100
'76 '78 '80 '82 '84 '86 '88 '90 '92 '94 '96 '98 '00 '02 '04 '06
Year
< 4 yrs
Complete 4 yr
0
10
20
30
40
50
60
70
80
90
100
'76 '78 '80 '82 '84 '86 '88 '90 '92 '94 '96 '98 '00 '02 '04 '06
Year
< 4 yrs
Complete 4 yr
Perc
ent
Perc
ent
8th Graders 10th Graders 12th Graders
3

Any Illicit Drug: Trends in Annual Prevalence by Region
0
10
20
30
40
50
60
70
80
90
100
'76 '78 '80 '82 '84 '86 '88 '90 '92 '94 '96 '98 '00 '02 '04 '06
Year
NortheastNorth CentralSouthWest
Perc
ent
0
10
20
30
40
50
60
70
80
90
100
'76 '78 '80 '82 '84 '86 '88 '90 '92 '94 '96 '98 '00 '02 '04 '06
Year
NortheastNorth CentralSouthWest
0
10
20
30
40
50
60
70
80
90
100
'76 '78 '80 '82 '84 '86 '88 '90 '92 '94 '96 '98 '00 '02 '04 '06
Year
NortheastNorth CentralSouthWest
Perc
ent
Perc
ent
8th Graders 10th Graders 12th Graders
4

Any Illicit Drug: Trends in Annual Prevalence by Population Density
0
10
20
30
40
50
60
70
80
90
100
'76 '78 '80 '82 '84 '86 '88 '90 '92 '94 '96 '98 '00 '02 '04 '06
Year
Large MSAOther MSANon-MSA
Perc
ent
0
10
20
30
40
50
60
70
80
90
100
'76 '78 '80 '82 '84 '86 '88 '90 '92 '94 '96 '98 '00 '02 '04 '06
Year
Large MSAOther MSANon-MSA
0
10
20
30
40
50
60
70
80
90
100
'76 '78 '80 '82 '84 '86 '88 '90 '92 '94 '96 '98 '00 '02 '04 '06
Year
Large MSAOther MSANon-MSA
Perc
ent
Perc
ent
8th Graders 10th Graders 12th Graders
5

Any Illicit Drug: Trends in Annual Prevalence by Parents' Average Education
0
10
20
30
40
50
60
70
80
90
100
'76 '78 '80 '82 '84 '86 '88 '90 '92 '94 '96 '98 '00 '02 '04 '06
Year
1 (Low)2345 (High)
Perc
ent
0
10
20
30
40
50
60
70
80
90
100
'76 '78 '80 '82 '84 '86 '88 '90 '92 '94 '96 '98 '00 '02 '04 '06
Year
1 (Low)2345 (High)
0
10
20
30
40
50
60
70
80
90
100
'76 '78 '80 '82 '84 '86 '88 '90 '92 '94 '96 '98 '00 '02 '04 '06
Year
1 (Low)2345 (High)
Perc
ent
Perc
ent
8th Graders 10th Graders 12th Graders
6

Any Illicit Drug: Trends in Annual Prevalence by Race/Ethnicity*
observation from the previous year).*These graphs contain two-year moving averages (i.e., the mean of the observation in the indicated year plus the corresponding
0
10
20
30
40
50
60
70
80
90
100
'76 '78 '80 '82 '84 '86 '88 '90 '92 '94 '96 '98 '00 '02 '04 '06
Year
WhiteBlackHispanic
Perc
ent
0
10
20
30
40
50
60
70
80
90
100
'76 '78 '80 '82 '84 '86 '88 '90 '92 '94 '96 '98 '00 '02 '04 '06
Year
WhiteBlackHispanic
0
10
20
30
40
50
60
70
80
90
100
'76 '78 '80 '82 '84 '86 '88 '90 '92 '94 '96 '98 '00 '02 '04 '06
Year
WhiteBlackHispanic
Perc
ent
Perc
ent
8th Graders 10th Graders 12th Graders
7

Any Illicit Drug Other than Marijuana:* Trends in Annual Prevalence by Gender
than marijuana" are affected by these changes. Refer to corresponding tables for further details.*Beginning in 2001, revised sets of questions on other hallucinogen and tranquilizer use were introduced. Data for "any illicit drug other
0
10
20
30
40
50
'76 '78 '80 '82 '84 '86 '88 '90 '92 '94 '96 '98 '00 '02 '04 '06
Year
Male
Female
Perc
ent
0
10
20
30
40
50
'76 '78 '80 '82 '84 '86 '88 '90 '92 '94 '96 '98 '00 '02 '04 '06
Year
Male
Female
0
10
20
30
40
50
'76 '78 '80 '82 '84 '86 '88 '90 '92 '94 '96 '98 '00 '02 '04 '06
Year
Male
Female
Perc
ent
Perc
ent
8th Graders 10th Graders 12th Graders
8

Any Illicit Drug Other than Marijuana:* Trends in Annual Prevalence by College Plans
than marijuana" are affected by these changes. Refer to corresponding tables for further details.*Beginning in 2001, revised sets of questions on other hallucinogen and tranquilizer use were introduced. Data for "any illicit drug other
0
10
20
30
40
50
'76 '78 '80 '82 '84 '86 '88 '90 '92 '94 '96 '98 '00 '02 '04 '06
Year
< 4 yrs
Complete 4 yr
Perc
ent
0
10
20
30
40
50
'76 '78 '80 '82 '84 '86 '88 '90 '92 '94 '96 '98 '00 '02 '04 '06
Year
< 4 yrs
Complete 4 yr
0
10
20
30
40
50
'76 '78 '80 '82 '84 '86 '88 '90 '92 '94 '96 '98 '00 '02 '04 '06
Year
< 4 yrs
Complete 4 yr
Perc
ent
Perc
ent
8th Graders 10th Graders 12th Graders
9

Any Illicit Drug Other than Marijuana:* Trends in Annual Prevalence by Region
than marijuana" are affected by these changes. Refer to corresponding tables for further details.*Beginning in 2001, revised sets of questions on other hallucinogen and tranquilizer use were introduced. Data for "any illicit drug other
0
10
20
30
40
50
'76 '78 '80 '82 '84 '86 '88 '90 '92 '94 '96 '98 '00 '02 '04 '06
Year
NortheastNorth CentralSouthWest
Perc
ent
0
10
20
30
40
50
'76 '78 '80 '82 '84 '86 '88 '90 '92 '94 '96 '98 '00 '02 '04 '06
Year
NortheastNorth CentralSouthWest
0
10
20
30
40
50
'76 '78 '80 '82 '84 '86 '88 '90 '92 '94 '96 '98 '00 '02 '04 '06
Year
NortheastNorth CentralSouthWest
Perc
ent
Perc
ent
8th Graders 10th Graders 12th Graders
10

Any Illicit Drug Other than Marijuana:* Trends in Annual Prevalence by Population Density
than marijuana" are affected by these changes. Refer to corresponding tables for further details.*Beginning in 2001, revised sets of questions on other hallucinogen and tranquilizer use were introduced. Data for "any illicit drug other
0
10
20
30
40
50
'76 '78 '80 '82 '84 '86 '88 '90 '92 '94 '96 '98 '00 '02 '04 '06
Year
Large MSAOther MSANon-MSA
Perc
ent
0
10
20
30
40
50
'76 '78 '80 '82 '84 '86 '88 '90 '92 '94 '96 '98 '00 '02 '04 '06
Year
Large MSAOther MSANon-MSA
0
10
20
30
40
50
'76 '78 '80 '82 '84 '86 '88 '90 '92 '94 '96 '98 '00 '02 '04 '06
Year
Large MSAOther MSANon-MSA
Perc
ent
Perc
ent
8th Graders 10th Graders 12th Graders
11

Any Illicit Drug Other than Marijuana:* Trends in Annual Prevalence by Parents' Average Education
than marijuana" are affected by these changes. Refer to corresponding tables for further details.*Beginning in 2001, revised sets of questions on other hallucinogen and tranquilizer use were introduced. Data for "any illicit drug other
0
10
20
30
40
50
'76 '78 '80 '82 '84 '86 '88 '90 '92 '94 '96 '98 '00 '02 '04 '06
Year
1 (Low)2345 (High)
Perc
ent
0
10
20
30
40
50
'76 '78 '80 '82 '84 '86 '88 '90 '92 '94 '96 '98 '00 '02 '04 '06
Year
1 (Low)2345 (High)
0
10
20
30
40
50
'76 '78 '80 '82 '84 '86 '88 '90 '92 '94 '96 '98 '00 '02 '04 '06
Year
1 (Low)2345 (High)
Perc
ent
Perc
ent
8th Graders 10th Graders 12th Graders
12

*Beginning in 2001, revised sets of questions on other hallucinogen and tranquilizer use were introduced. Data for "any illicit drug other
observation from the previous year).
Any Illicit Drug Other than Marijuana:* Trends in Annual Prevalence by Race/Ethnicity**
**These graphs contain two-year moving averages (i.e., the mean of the observation in the indicated year plus the corresponding
than marijuana" are affected by these changes. Refer to corresponding tables for further details.
0
10
20
30
40
50
'76 '78 '80 '82 '84 '86 '88 '90 '92 '94 '96 '98 '00 '02 '04 '06
Year
WhiteBlackHispanic
Perc
ent
0
10
20
30
40
50
'76 '78 '80 '82 '84 '86 '88 '90 '92 '94 '96 '98 '00 '02 '04 '06
Year
WhiteBlackHispanic
0
10
20
30
40
50
'76 '78 '80 '82 '84 '86 '88 '90 '92 '94 '96 '98 '00 '02 '04 '06
Year
WhiteBlackHispanic
Perc
ent
Perc
ent
8th Graders 10th Graders 12th Graders
13

Marijuana: Trends in Annual Prevalence by Gender
0
10
20
30
40
50
60
70
'76 '78 '80 '82 '84 '86 '88 '90 '92 '94 '96 '98 '00 '02 '04 '06
Year
Male
Female
Perc
ent
0
10
20
30
40
50
60
70
'76 '78 '80 '82 '84 '86 '88 '90 '92 '94 '96 '98 '00 '02 '04 '06
Year
Male
Female
0
10
20
30
40
50
60
70
'76 '78 '80 '82 '84 '86 '88 '90 '92 '94 '96 '98 '00 '02 '04 '06
Year
Male
Female
Perc
ent
Perc
ent
8th Graders 10th Graders 12th Graders
14

Marijuana: Trends in Annual Prevalence by College Plans
0
10
20
30
40
50
60
70
'76 '78 '80 '82 '84 '86 '88 '90 '92 '94 '96 '98 '00 '02 '04 '06
Year
< 4 yrs
Complete 4 yr
Perc
ent
0
10
20
30
40
50
60
70
'76 '78 '80 '82 '84 '86 '88 '90 '92 '94 '96 '98 '00 '02 '04 '06
Year
< 4 yrs
Complete 4 yr
0
10
20
30
40
50
60
70
'76 '78 '80 '82 '84 '86 '88 '90 '92 '94 '96 '98 '00 '02 '04 '06
Year
< 4 yrs
Complete 4 yr
Perc
ent
Perc
ent
8th Graders 10th Graders 12th Graders
15

Marijuana: Trends in Annual Prevalence by Region
0
10
20
30
40
50
60
70
'76 '78 '80 '82 '84 '86 '88 '90 '92 '94 '96 '98 '00 '02 '04 '06
Year
NortheastNorth CentralSouthWest
Perc
ent
0
10
20
30
40
50
60
70
'76 '78 '80 '82 '84 '86 '88 '90 '92 '94 '96 '98 '00 '02 '04 '06
Year
NortheastNorth CentralSouthWest
0
10
20
30
40
50
60
70
'76 '78 '80 '82 '84 '86 '88 '90 '92 '94 '96 '98 '00 '02 '04 '06
Year
NortheastNorth CentralSouthWest
Perc
ent
Perc
ent
8th Graders 10th Graders 12th Graders
16
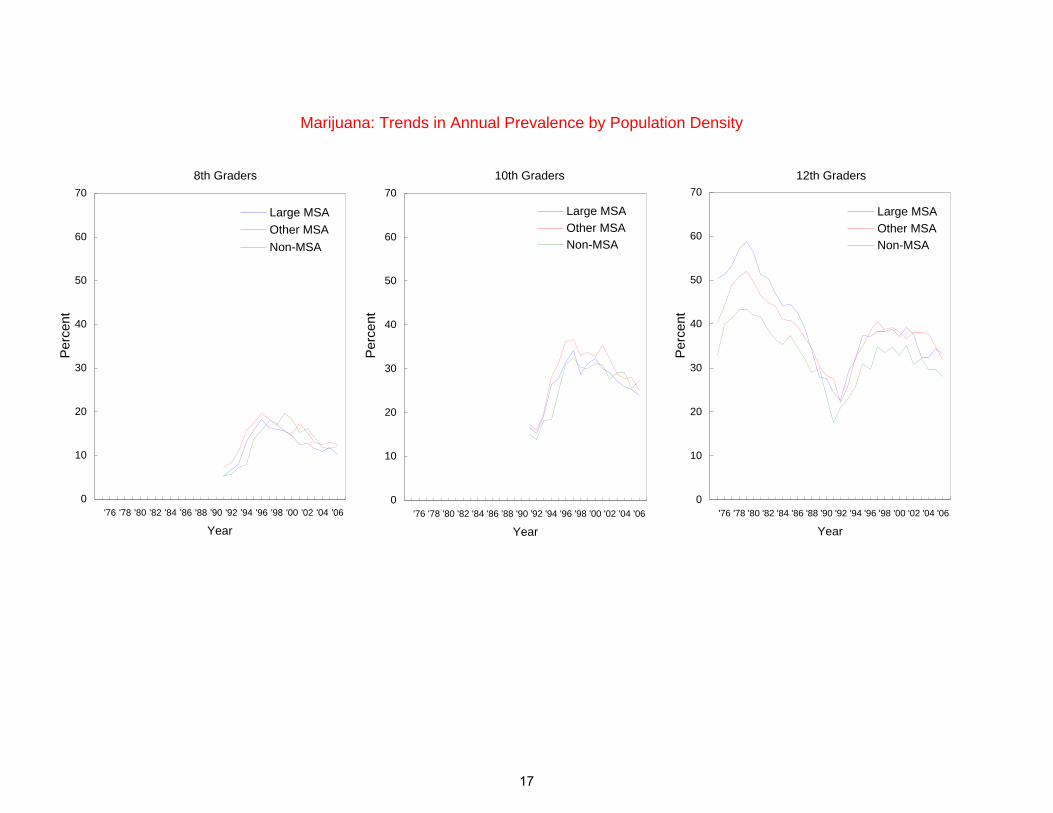
Marijuana: Trends in Annual Prevalence by Population Density
0
10
20
30
40
50
60
70
'76 '78 '80 '82 '84 '86 '88 '90 '92 '94 '96 '98 '00 '02 '04 '06
Year
Large MSAOther MSANon-MSA
Perc
ent
0
10
20
30
40
50
60
70
'76 '78 '80 '82 '84 '86 '88 '90 '92 '94 '96 '98 '00 '02 '04 '06
Year
Large MSAOther MSANon-MSA
0
10
20
30
40
50
60
70
'76 '78 '80 '82 '84 '86 '88 '90 '92 '94 '96 '98 '00 '02 '04 '06
Year
Large MSAOther MSANon-MSA
Perc
ent
Perc
ent
8th Graders 10th Graders 12th Graders
17

Marijuana: Trends in Annual Prevalence by Parent's Average Education
0
10
20
30
40
50
60
70
'76 '78 '80 '82 '84 '86 '88 '90 '92 '94 '96 '98 '00 '02 '04 '06
Year
1 (Low)2345 (High)
Perc
ent
0
10
20
30
40
50
60
70
'76 '78 '80 '82 '84 '86 '88 '90 '92 '94 '96 '98 '00 '02 '04 '06
Year
1 (Low)2345 (High)
0
10
20
30
40
50
60
70
'76 '78 '80 '82 '84 '86 '88 '90 '92 '94 '96 '98 '00 '02 '04 '06
Year
1 (Low)2345 (High)
Perc
ent
Perc
ent
8th Graders 10th Graders 12th Graders
18

Marijuana: Trends in Annual Prevalence by Race/Ethnicity*
observation from the previous year).*These graphs contain two-year moving averages (i.e., the mean of the observation in the indicated year plus the corresponding
0
10
20
30
40
50
60
70
'76 '78 '80 '82 '84 '86 '88 '90 '92 '94 '96 '98 '00 '02 '04 '06
Year
WhiteBlackHispanic
Perc
ent
0
10
20
30
40
50
60
70
'76 '78 '80 '82 '84 '86 '88 '90 '92 '94 '96 '98 '00 '02 '04 '06
Year
WhiteBlackHispanic
0
10
20
30
40
50
60
70
'76 '78 '80 '82 '84 '86 '88 '90 '92 '94 '96 '98 '00 '02 '04 '06
Year
WhiteBlackHispanic
Perc
ent
Perc
ent
8th Graders 10th Graders 12th Graders
19

Inhalants: Trends in Annual Prevalence by Gender
0
5
10
15
20
'76 '78 '80 '82 '84 '86 '88 '90 '92 '94 '96 '98 '00 '02 '04 '06
Year
Male
Female
Perc
ent
0
5
10
15
20
'76 '78 '80 '82 '84 '86 '88 '90 '92 '94 '96 '98 '00 '02 '04 '06
Year
Male
Female
0
5
10
15
20
'76 '78 '80 '82 '84 '86 '88 '90 '92 '94 '96 '98 '00 '02 '04 '06
Year
Male
Female
Perc
ent
Perc
ent
8th Graders 10th Graders 12th Graders
20

Inhalants: Trends in Annual Prevalence by College Plans
0
5
10
15
20
25
'76 '78 '80 '82 '84 '86 '88 '90 '92 '94 '96 '98 '00 '02 '04 '06
Year
< 4 yrs
Complete 4 yr
Perc
ent
0
5
10
15
20
25
'76 '78 '80 '82 '84 '86 '88 '90 '92 '94 '96 '98 '00 '02 '04 '06
Year
< 4 yrs
Complete 4 yr
0
5
10
15
20
25
'76 '78 '80 '82 '84 '86 '88 '90 '92 '94 '96 '98 '00 '02 '04 '06
Year
< 4 yrs
Complete 4 yr
Perc
ent
Perc
ent
8th Graders 10th Graders 12th Graders
21

Inhalants: Trends in Annual Prevalence by Region
0
5
10
15
20
'76 '78 '80 '82 '84 '86 '88 '90 '92 '94 '96 '98 '00 '02 '04 '06
Year
NortheastNorth CentralSouthWest
Perc
ent
0
5
10
15
20
'76 '78 '80 '82 '84 '86 '88 '90 '92 '94 '96 '98 '00 '02 '04 '06
Year
NortheastNorth CentralSouthWest
0
5
10
15
20
'76 '78 '80 '82 '84 '86 '88 '90 '92 '94 '96 '98 '00 '02 '04 '06
Year
NortheastNorth CentralSouthWest
Perc
ent
Perc
ent
8th Graders 10th Graders 12th Graders
22

Inhalants: Trends in Annual Prevalence by Population Density
0
5
10
15
20
'76 '78 '80 '82 '84 '86 '88 '90 '92 '94 '96 '98 '00 '02 '04 '06
Year
Large MSAOther MSANon-MSA
Perc
ent
0
5
10
15
20
'76 '78 '80 '82 '84 '86 '88 '90 '92 '94 '96 '98 '00 '02 '04 '06
Year
Large MSAOther MSANon-MSA
0
5
10
15
20
'76 '78 '80 '82 '84 '86 '88 '90 '92 '94 '96 '98 '00 '02 '04 '06
Year
Large MSAOther MSANon-MSA
Perc
ent
Perc
ent
8th Graders 10th Graders 12th Graders
23

Inhalants: Trends in Annual Prevalence by Parents' Average Education
0
5
10
15
20
'76 '78 '80 '82 '84 '86 '88 '90 '92 '94 '96 '98 '00 '02 '04 '06
Year
1 (Low)2345 (High)
Perc
ent
0
5
10
15
20
'76 '78 '80 '82 '84 '86 '88 '90 '92 '94 '96 '98 '00 '02 '04 '06
Year
1 (Low)2345 (High)
0
5
10
15
20
'76 '78 '80 '82 '84 '86 '88 '90 '92 '94 '96 '98 '00 '02 '04 '06
Year
1 (Low)2345 (High)
Perc
ent
Perc
ent
8th Graders 10th Graders 12th Graders
24

Inhalants: Trends in Annual Prevalence by Race/Ethnicity*
observation from the previous year).*These graphs contain two-year moving averages (i.e., the mean of the observation in the indicated year plus the corresponding
0
5
10
15
20
'76 '78 '80 '82 '84 '86 '88 '90 '92 '94 '96 '98 '00 '02 '04 '06
Year
WhiteBlackHispanic
Perc
ent
0
5
10
15
20
'76 '78 '80 '82 '84 '86 '88 '90 '92 '94 '96 '98 '00 '02 '04 '06
Year
WhiteBlackHispanic
0
5
10
15
20
'76 '78 '80 '82 '84 '86 '88 '90 '92 '94 '96 '98 '00 '02 '04 '06
Year
WhiteBlackHispanic
Perc
ent
Perc
ent
8th Graders 10th Graders 12th Graders
25

Hallucinogens:* Trends in Annual Prevalence by Gender
by these changes. Refer to corresponding tables for further details.*Beginning in 2001, a revised set of questions on other hallucinogen use was introduced. Data for hallucinogens are affected
0
5
10
15
20
'76 '78 '80 '82 '84 '86 '88 '90 '92 '94 '96 '98 '00 '02 '04 '06
Year
Male
Female
Perc
ent
0
5
10
15
20
'76 '78 '80 '82 '84 '86 '88 '90 '92 '94 '96 '98 '00 '02 '04 '06
Year
Male
Female
0
5
10
15
20
'76 '78 '80 '82 '84 '86 '88 '90 '92 '94 '96 '98 '00 '02 '04 '06
Year
Male
Female
Perc
ent
Perc
ent
8th Graders 10th Graders 12th Graders
26

Hallucinogens:* Trends in Annual Prevalence by College Plans
by these changes. Refer to corresponding tables for further details.*Beginning in 2001, a revised set of questions on other hallucinogen use was introduced. Data for hallucinogens are affected
0
5
10
15
20
'76 '78 '80 '82 '84 '86 '88 '90 '92 '94 '96 '98 '00 '02 '04 '06
Year
< 4 yrs
Complete 4 yr
Perc
ent
0
5
10
15
20
'76 '78 '80 '82 '84 '86 '88 '90 '92 '94 '96 '98 '00 '02 '04 '06
Year
< 4 yrs
Complete 4 yr
0
5
10
15
20
'76 '78 '80 '82 '84 '86 '88 '90 '92 '94 '96 '98 '00 '02 '04 '06
Year
< 4 yrs
Complete 4 yr
Perc
ent
Perc
ent
8th Graders 10th Graders 12th Graders
27

Hallucinogens:* Trends in Annual Prevalence by Region
by these changes. Refer to corresponding tables for further details.*Beginning in 2001, a revised set of questions on other hallucinogen use was introduced. Data for hallucinogens are affected
0
5
10
15
20
'76 '78 '80 '82 '84 '86 '88 '90 '92 '94 '96 '98 '00 '02 '04 '06
Year
NortheastNorth CentralSouthWest
Perc
ent
0
5
10
15
20
'76 '78 '80 '82 '84 '86 '88 '90 '92 '94 '96 '98 '00 '02 '04 '06
Year
NortheastNorth CentralSouthWest
0
5
10
15
20
'76 '78 '80 '82 '84 '86 '88 '90 '92 '94 '96 '98 '00 '02 '04 '06
Year
NortheastNorth CentralSouthWest
Perc
ent
Perc
ent
8th Graders 10th Graders 12th Graders
28

Hallucinogens:* Trends in Annual Prevalence by Population Density
by these changes. Refer to corresponding tables for further details.*Beginning in 2001, a revised set of questions on other hallucinogen use was introduced. Data for hallucinogens are affected
0
5
10
15
20
'76 '78 '80 '82 '84 '86 '88 '90 '92 '94 '96 '98 '00 '02 '04 '06
Year
Large MSAOther MSANon-MSA
Perc
ent
0
5
10
15
20
'76 '78 '80 '82 '84 '86 '88 '90 '92 '94 '96 '98 '00 '02 '04 '06
Year
Large MSAOther MSANon-MSA
0
5
10
15
20
'76 '78 '80 '82 '84 '86 '88 '90 '92 '94 '96 '98 '00 '02 '04 '06
Year
Large MSAOther MSANon-MSA
Perc
ent
Perc
ent
8th Graders 10th Graders 12th Graders
29

Hallucinogens:* Trends in Annual Prevalence by Parents' Average Education
by these changes. Refer to corresponding tables for further details.*Beginning in 2001, a revised set of questions on other hallucinogen use was introduced. Data for hallucinogens are affected
0
5
10
15
20
'76 '78 '80 '82 '84 '86 '88 '90 '92 '94 '96 '98 '00 '02 '04 '06
Year
1 (Low)2345 (High)
Perc
ent
0
5
10
15
20
'76 '78 '80 '82 '84 '86 '88 '90 '92 '94 '96 '98 '00 '02 '04 '06
Year
1 (Low)2345 (High)
0
5
10
15
20
'76 '78 '80 '82 '84 '86 '88 '90 '92 '94 '96 '98 '00 '02 '04 '06
Year
1 (Low)2345 (High)
Perc
ent
Perc
ent
8th Graders 10th Graders 12th Graders
30

*Beginning in 2001, a revised set of questions on other hallucinogen use was introduced. Data for hallucinogens are affected
observation from the previous year).
Hallucinogens:* Trends in Annual Prevalence by Race/Ethnicity**
**These graphs contain two-year moving averages (i.e., the mean of the observation in the indicated year plus the corresponding
by these changes. Refer to corresponding tables for further details.
0
5
10
15
20
'76 '78 '80 '82 '84 '86 '88 '90 '92 '94 '96 '98 '00 '02 '04 '06
Year
WhiteBlackHispanic
Perc
ent
0
5
10
15
20
'76 '78 '80 '82 '84 '86 '88 '90 '92 '94 '96 '98 '00 '02 '04 '06
Year
WhiteBlackHispanic
0
5
10
15
20
'76 '78 '80 '82 '84 '86 '88 '90 '92 '94 '96 '98 '00 '02 '04 '06
Year
WhiteBlackHispanic
Perc
ent
Perc
ent
8th Graders 10th Graders 12th Graders
31

LSD: Trends in Annual Prevalence by Gender
0
5
10
15
20
'76 '78 '80 '82 '84 '86 '88 '90 '92 '94 '96 '98 '00 '02 '04 '06
Year
Male
Female
Perc
ent
0
5
10
15
20
'76 '78 '80 '82 '84 '86 '88 '90 '92 '94 '96 '98 '00 '02 '04 '06
Year
Male
Female
0
5
10
15
20
'76 '78 '80 '82 '84 '86 '88 '90 '92 '94 '96 '98 '00 '02 '04 '06
Year
Male
Female
Perc
ent
Perc
ent
8th Graders 10th Graders 12th Graders
32

LSD: Trends in Annual Prevalence by College Plans
0
5
10
15
20
'76 '78 '80 '82 '84 '86 '88 '90 '92 '94 '96 '98 '00 '02 '04 '06
Year
< 4 yrs
Complete 4 yr
Perc
ent
0
5
10
15
20
'76 '78 '80 '82 '84 '86 '88 '90 '92 '94 '96 '98 '00 '02 '04 '06
Year
< 4 yrs
Complete 4 yr
0
5
10
15
20
'76 '78 '80 '82 '84 '86 '88 '90 '92 '94 '96 '98 '00 '02 '04 '06
Year
< 4 yrs
Complete 4 yr
Perc
ent
Perc
ent
8th Graders 10th Graders 12th Graders
33

LSD: Trends in Annual Prevalence by Region
0
5
10
15
20
'76 '78 '80 '82 '84 '86 '88 '90 '92 '94 '96 '98 '00 '02 '04 '06
Year
NortheastNorth CentralSouthWest
Perc
ent
0
5
10
15
20
'76 '78 '80 '82 '84 '86 '88 '90 '92 '94 '96 '98 '00 '02 '04 '06
Year
NortheastNorth CentralSouthWest
0
5
10
15
20
'76 '78 '80 '82 '84 '86 '88 '90 '92 '94 '96 '98 '00 '02 '04 '06
Year
NortheastNorth CentralSouthWest
Perc
ent
Perc
ent
8th Graders 10th Graders 12th Graders
34

LSD: Trends in Annual Prevalence by Population Density
0
5
10
15
20
'76 '78 '80 '82 '84 '86 '88 '90 '92 '94 '96 '98 '00 '02 '04 '06
Year
Large MSAOther MSANon-MSA
Perc
ent
0
5
10
15
20
'76 '78 '80 '82 '84 '86 '88 '90 '92 '94 '96 '98 '00 '02 '04 '06
Year
Large MSAOther MSANon-MSA
0
5
10
15
20
'76 '78 '80 '82 '84 '86 '88 '90 '92 '94 '96 '98 '00 '02 '04 '06
Year
Large MSAOther MSANon-MSA
Perc
ent
Perc
ent
8th Graders 10th Graders 12th Graders
35

LSD: Trends in Annual Prevalence by Parents' Average Education
0
5
10
15
20
'76 '78 '80 '82 '84 '86 '88 '90 '92 '94 '96 '98 '00 '02 '04 '06
Year
1 (Low)2345 (High)
Perc
ent
0
5
10
15
20
'76 '78 '80 '82 '84 '86 '88 '90 '92 '94 '96 '98 '00 '02 '04 '06
Year
1 (Low)2345 (High)
0
5
10
15
20
'76 '78 '80 '82 '84 '86 '88 '90 '92 '94 '96 '98 '00 '02 '04 '06
Year
1 (Low)2345 (High)
Perc
ent
Perc
ent
8th Graders 10th Graders 12th Graders
36

LSD: Trends in Annual Prevalence by Race/Ethnicity*
observation from the previous year).*These graphs contain two-year moving averages (i.e., the mean of the observation in the indicated year plus the corresponding
0
5
10
15
20
'76 '78 '80 '82 '84 '86 '88 '90 '92 '94 '96 '98 '00 '02 '04 '06
Year
WhiteBlackHispanic
Perc
ent
0
5
10
15
20
'76 '78 '80 '82 '84 '86 '88 '90 '92 '94 '96 '98 '00 '02 '04 '06
Year
WhiteBlackHispanic
0
5
10
15
20
'76 '78 '80 '82 '84 '86 '88 '90 '92 '94 '96 '98 '00 '02 '04 '06
Year
WhiteBlackHispanic
Perc
ent
Perc
ent
8th Graders 10th Graders 12th Graders
37

*Beginnning in 2001, a revised set of questions on other hallucinogen use was introduced. Refer to corresponding tables for further details.
Other Hallucinogens:* Trends in Annual Prevalence by Gender
0
5
10
15
20
'76 '78 '80 '82 '84 '86 '88 '90 '92 '94 '96 '98 '00 '02 '04 '06
Year
Male
Female
Perc
ent
0
5
10
15
20
'76 '78 '80 '82 '84 '86 '88 '90 '92 '94 '96 '98 '00 '02 '04 '06
Year
Male
Female
0
5
10
15
20
'76 '78 '80 '82 '84 '86 '88 '90 '92 '94 '96 '98 '00 '02 '04 '06
Year
Male
Female
Perc
ent
Perc
ent
8th Graders 10th Graders 12th Graders
38

*Beginnning in 2001, a revised set of questions on other hallucinogen use was introduced. Refer to corresponding tables for further details.
Other Hallucinogens:* Trends in Annual Prevalence by College Plans
0
5
10
15
20
'76 '78 '80 '82 '84 '86 '88 '90 '92 '94 '96 '98 '00 '02 '04 '06
Year
< 4 yrs
Complete 4 yr
Perc
ent
0
5
10
15
20
'76 '78 '80 '82 '84 '86 '88 '90 '92 '94 '96 '98 '00 '02 '04 '06
Year
< 4 yrs
Complete 4 yr
0
5
10
15
20
'76 '78 '80 '82 '84 '86 '88 '90 '92 '94 '96 '98 '00 '02 '04 '06
Year
< 4 yrs
Complete 4 yr
Perc
ent
Perc
ent
8th Graders 10th Graders 12th Graders
39

*Beginnning in 2001, a revised set of questions on other hallucinogen use was introduced. Refer to corresponding tables for further details.
Other Hallucinogens:* Trends in Annual Prevalence by Region
0
5
10
15
20
'76 '78 '80 '82 '84 '86 '88 '90 '92 '94 '96 '98 '00 '02 '04 '06
Year
NortheastNorth CentralSouthWest
Perc
ent
0
5
10
15
20
'76 '78 '80 '82 '84 '86 '88 '90 '92 '94 '96 '98 '00 '02 '04 '06
Year
NortheastNorth CentralSouthWest
0
5
10
15
20
'76 '78 '80 '82 '84 '86 '88 '90 '92 '94 '96 '98 '00 '02 '04 '06
Year
NortheastNorth CentralSouthWest
Perc
ent
Perc
ent
8th Graders 10th Graders 12th Graders
40

*Beginnning in 2001, a revised set of questions on other hallucinogen use was introduced. Refer to corresponding tables for further details.
Other Hallucinogens:* Trends in Annual Prevalence by Population Density
0
5
10
15
20
'76 '78 '80 '82 '84 '86 '88 '90 '92 '94 '96 '98 '00 '02 '04 '06
Year
Large MSAOther MSANon-MSA
Perc
ent
0
5
10
15
20
'76 '78 '80 '82 '84 '86 '88 '90 '92 '94 '96 '98 '00 '02 '04 '06
Year
Large MSAOther MSANon-MSA
0
5
10
15
20
'76 '78 '80 '82 '84 '86 '88 '90 '92 '94 '96 '98 '00 '02 '04 '06
Year
Large MSAOther MSANon-MSA
Perc
ent
Perc
ent
8th Graders 10th Graders 12th Graders
41

*Beginnning in 2001, a revised set of questions on other hallucinogen use was introduced. Refer to corresponding tables for further details.
Other Hallucinogens:* Trends in Annual Prevalence by Parents' Average Education
0
5
10
15
20
'76 '78 '80 '82 '84 '86 '88 '90 '92 '94 '96 '98 '00 '02 '04 '06
Year
1 (Low)2345 (High)
Perc
ent
0
5
10
15
20
'76 '78 '80 '82 '84 '86 '88 '90 '92 '94 '96 '98 '00 '02 '04 '06
Year
1 (Low)2345 (High)
0
5
10
15
20
'76 '78 '80 '82 '84 '86 '88 '90 '92 '94 '96 '98 '00 '02 '04 '06
Year
1 (Low)2345 (High)
Perc
ent
Perc
ent
8th Graders 10th Graders 12th Graders
42
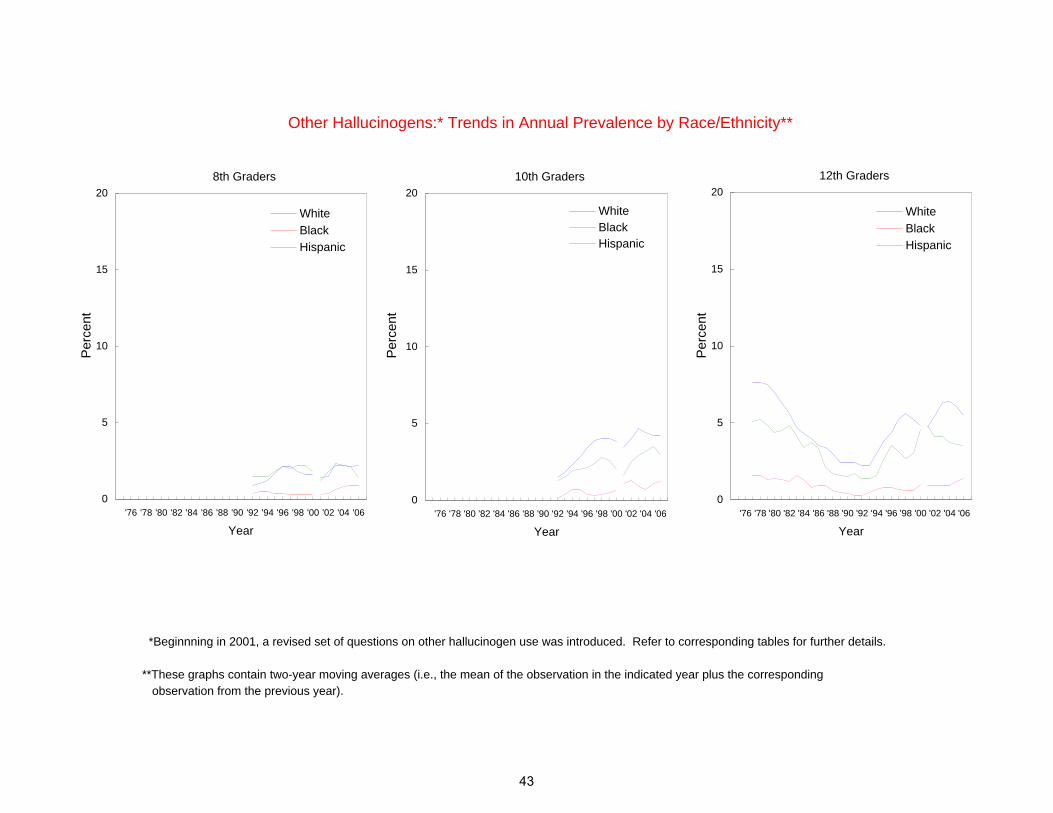
Other Hallucinogens:* Trends in Annual Prevalence by Race/Ethnicity**
observation from the previous year).**These graphs contain two-year moving averages (i.e., the mean of the observation in the indicated year plus the corresponding
*Beginnning in 2001, a revised set of questions on other hallucinogen use was introduced. Refer to corresponding tables for further details.
0
5
10
15
20
'76 '78 '80 '82 '84 '86 '88 '90 '92 '94 '96 '98 '00 '02 '04 '06
Year
WhiteBlackHispanic
Perc
ent
0
5
10
15
20
'76 '78 '80 '82 '84 '86 '88 '90 '92 '94 '96 '98 '00 '02 '04 '06
Year
WhiteBlackHispanic
0
5
10
15
20
'76 '78 '80 '82 '84 '86 '88 '90 '92 '94 '96 '98 '00 '02 '04 '06
Year
WhiteBlackHispanic
Perc
ent
Perc
ent
8th Graders 10th Graders 12th Graders
43

MDMA (Ecstasy): Trends in Annual Prevalence by Gender
0
5
10
15
20
'76 '78 '80 '82 '84 '86 '88 '90 '92 '94 '96 '98 '00 '02 '04 '06
Year
Male
Female
Perc
ent
0
5
10
15
20
'76 '78 '80 '82 '84 '86 '88 '90 '92 '94 '96 '98 '00 '02 '04 '06
Year
Male
Female
0
5
10
15
20
'76 '78 '80 '82 '84 '86 '88 '90 '92 '94 '96 '98 '00 '02 '04 '06
Year
Male
Female
Perc
ent
Perc
ent
8th Graders 10th Graders 12th Graders
44

MDMA (Ecstasy): Trends in Annual Prevalence by College Plans
0
5
10
15
20
'76 '78 '80 '82 '84 '86 '88 '90 '92 '94 '96 '98 '00 '02 '04 '06
Year
< 4 yrs
Complete 4 yr
Perc
ent
0
5
10
15
20
'76 '78 '80 '82 '84 '86 '88 '90 '92 '94 '96 '98 '00 '02 '04 '06
Year
< 4 yrs
Complete 4 yr
0
5
10
15
20
'76 '78 '80 '82 '84 '86 '88 '90 '92 '94 '96 '98 '00 '02 '04 '06
Year
< 4 yrs
Complete 4 yr
Perc
ent
Perc
ent
8th Graders 10th Graders 12th Graders
45

MDMA (Ecstasy): Trends in Annual Prevalence by Region
0
5
10
15
20
'76 '78 '80 '82 '84 '86 '88 '90 '92 '94 '96 '98 '00 '02 '04 '06
Year
NortheastNorth CentralSouthWest
Perc
ent
0
5
10
15
20
'76 '78 '80 '82 '84 '86 '88 '90 '92 '94 '96 '98 '00 '02 '04 '06
Year
NortheastNorth CentralSouthWest
0
5
10
15
20
'76 '78 '80 '82 '84 '86 '88 '90 '92 '94 '96 '98 '00 '02 '04 '06
Year
NortheastNorth CentralSouthWest
Perc
ent
Perc
ent
8th Graders 10th Graders 12th Graders
46

MDMA (Ecstasy): Trends in Annual Prevalence by Population Density
0
5
10
15
20
'76 '78 '80 '82 '84 '86 '88 '90 '92 '94 '96 '98 '00 '02 '04 '06
Year
Large MSAOther MSANon-MSA
Perc
ent
0
5
10
15
20
'76 '78 '80 '82 '84 '86 '88 '90 '92 '94 '96 '98 '00 '02 '04 '06
Year
Large MSAOther MSANon-MSA
0
5
10
15
20
'76 '78 '80 '82 '84 '86 '88 '90 '92 '94 '96 '98 '00 '02 '04 '06
Year
Large MSAOther MSANon-MSA
Perc
ent
Perc
ent
8th Graders 10th Graders 12th Graders
47

MDMA (Ecstasy): Trends in Annual Prevalence by Parents' Average Education
0
5
10
15
20
'76 '78 '80 '82 '84 '86 '88 '90 '92 '94 '96 '98 '00 '02 '04 '06
Year
1 (Low)2345 (High)
Perc
ent
0
5
10
15
20
'76 '78 '80 '82 '84 '86 '88 '90 '92 '94 '96 '98 '00 '02 '04 '06
Year
1 (Low)2345 (High)
0
5
10
15
20
'76 '78 '80 '82 '84 '86 '88 '90 '92 '94 '96 '98 '00 '02 '04 '06
Year
1 (Low)2345 (High)
Perc
ent
Perc
ent
8th Graders 10th Graders 12th Graders
48

MDMA (Ecstasy): Trends in Annual Prevalence by Race/Ethnicity*
observation from the previous year).*These graphs contain two-year moving averages (i.e., the mean of the observation in the indicated year plus the corresponding
0
5
10
15
20
'76 '78 '80 '82 '84 '86 '88 '90 '92 '94 '96 '98 '00 '02 '04 '06
Year
WhiteBlackHispanic
Perc
ent
0
5
10
15
20
'76 '78 '80 '82 '84 '86 '88 '90 '92 '94 '96 '98 '00 '02 '04 '06
Year
WhiteBlackHispanic
0
5
10
15
20
'76 '78 '80 '82 '84 '86 '88 '90 '92 '94 '96 '98 '00 '02 '04 '06
Year
WhiteBlackHispanic
Perc
ent
Perc
ent
8th Graders 10th Graders 12th Graders
49

Cocaine: Trends in Annual Prevalence by Gender
0
5
10
15
20
25
30
'76 '78 '80 '82 '84 '86 '88 '90 '92 '94 '96 '98 '00 '02 '04 '06
Year
Male
Female
Perc
ent
0
5
10
15
20
25
30
'76 '78 '80 '82 '84 '86 '88 '90 '92 '94 '96 '98 '00 '02 '04 '06
Year
Male
Female
0
5
10
15
20
25
30
'76 '78 '80 '82 '84 '86 '88 '90 '92 '94 '96 '98 '00 '02 '04 '06
Year
Male
Female
Perc
ent
Perc
ent
8th Graders 10th Graders 12th Graders
50
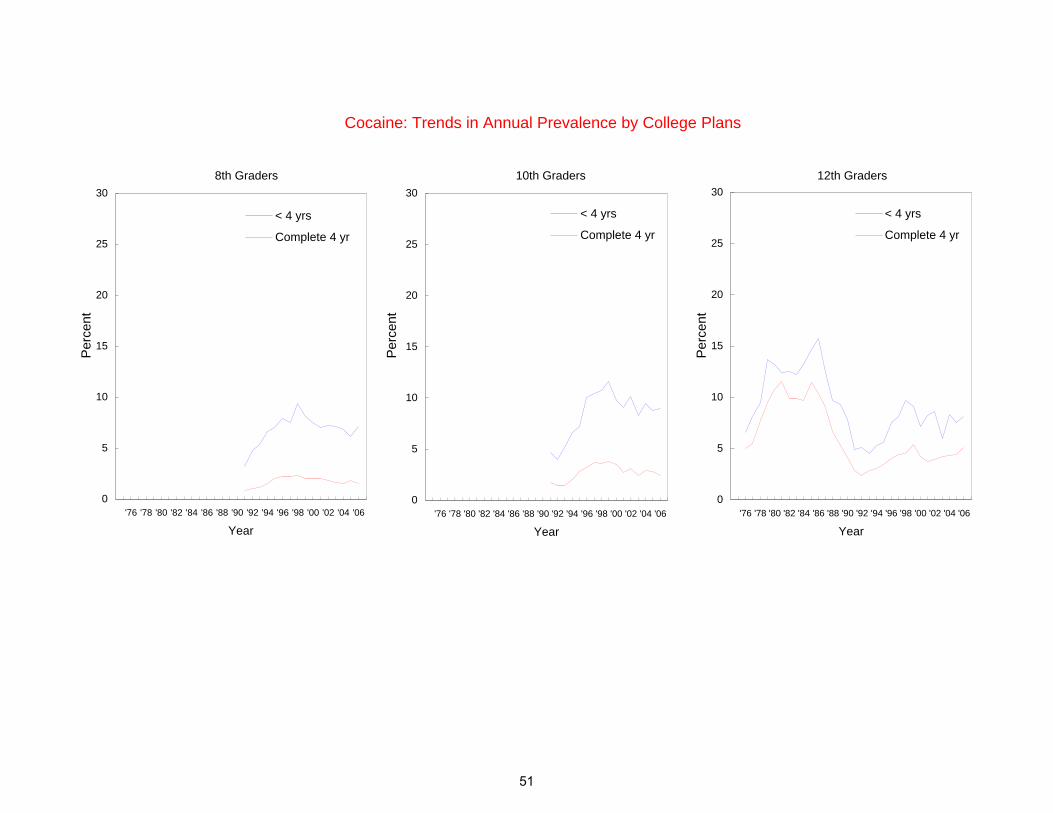
Cocaine: Trends in Annual Prevalence by College Plans
0
5
10
15
20
25
30
'76 '78 '80 '82 '84 '86 '88 '90 '92 '94 '96 '98 '00 '02 '04 '06
Year
< 4 yrs
Complete 4 yr
Perc
ent
0
5
10
15
20
25
30
'76 '78 '80 '82 '84 '86 '88 '90 '92 '94 '96 '98 '00 '02 '04 '06
Year
< 4 yrs
Complete 4 yr
0
5
10
15
20
25
30
'76 '78 '80 '82 '84 '86 '88 '90 '92 '94 '96 '98 '00 '02 '04 '06
Year
< 4 yrs
Complete 4 yr
Perc
ent
Perc
ent
8th Graders 10th Graders 12th Graders
51

Cocaine: Trends in Annual Prevalence by Region
0
5
10
15
20
25
30
'76 '78 '80 '82 '84 '86 '88 '90 '92 '94 '96 '98 '00 '02 '04 '06
Year
NortheastNorth CentralSouthWest
Perc
ent
0
5
10
15
20
25
30
'76 '78 '80 '82 '84 '86 '88 '90 '92 '94 '96 '98 '00 '02 '04 '06
Year
NortheastNorth CentralSouthWest
0
5
10
15
20
25
30
'76 '78 '80 '82 '84 '86 '88 '90 '92 '94 '96 '98 '00 '02 '04 '06
Year
NortheastNorth CentralSouthWest
Perc
ent
Perc
ent
8th Graders 10th Graders 12th Graders
52

Cocaine: Trends in Annual Prevalence by Population Density
0
5
10
15
20
25
30
'76 '78 '80 '82 '84 '86 '88 '90 '92 '94 '96 '98 '00 '02 '04 '06
Year
Large MSAOther MSANon-MSA
Perc
ent
0
5
10
15
20
25
30
'76 '78 '80 '82 '84 '86 '88 '90 '92 '94 '96 '98 '00 '02 '04 '06
Year
Large MSAOther MSANon-MSA
0
5
10
15
20
25
30
'76 '78 '80 '82 '84 '86 '88 '90 '92 '94 '96 '98 '00 '02 '04 '06
Year
Large MSAOther MSANon-MSA
Perc
ent
Perc
ent
8th Graders 10th Graders 12th Graders
53

Cocaine: Trends in Annual Prevalence by Parents' Average Education
0
5
10
15
20
25
30
'76 '78 '80 '82 '84 '86 '88 '90 '92 '94 '96 '98 '00 '02 '04 '06
Year
1 (Low)2345 (High)
Perc
ent
0
5
10
15
20
25
30
'76 '78 '80 '82 '84 '86 '88 '90 '92 '94 '96 '98 '00 '02 '04 '06
Year
1 (Low)2345 (High)
0
5
10
15
20
25
30
'76 '78 '80 '82 '84 '86 '88 '90 '92 '94 '96 '98 '00 '02 '04 '06
Year
1 (Low)2345 (High)
Perc
ent
Perc
ent
8th Graders 10th Graders 12th Graders
54

Cocaine: Trends in Annual Prevalence by Race/Ethnicity*
observation from the previous year).*These graphs contain two-year moving averages (i.e., the mean of the observation in the indicated year plus the corresponding
0
5
10
15
20
25
30
'76 '78 '80 '82 '84 '86 '88 '90 '92 '94 '96 '98 '00 '02 '04 '06
Year
WhiteBlackHispanic
Perc
ent
0
5
10
15
20
25
30
'76 '78 '80 '82 '84 '86 '88 '90 '92 '94 '96 '98 '00 '02 '04 '06
Year
WhiteBlackHispanic
0
5
10
15
20
25
30
'76 '78 '80 '82 '84 '86 '88 '90 '92 '94 '96 '98 '00 '02 '04 '06
Year
WhiteBlackHispanic
Perc
ent
Perc
ent
8th Graders 10th Graders 12th Graders
55
Crack: Trends in Annual Prevalence by Gender
0
2
4
6
8
10
'76 '78 '80 '82 '84 '86 '88 '90 '92 '94 '96 '98 '00 '02 '04 '06
Year
Male
Female
Perc
ent
0
2
4
6
8
10
'76 '78 '80 '82 '84 '86 '88 '90 '92 '94 '96 '98 '00 '02 '04 '06
Year
Male
Female
0
2
4
6
8
10
'76 '78 '80 '82 '84 '86 '88 '90 '92 '94 '96 '98 '00 '02 '04 '06
Year
Male
Female
Perc
ent
Perc
ent
8th Graders 10th Graders 12th Graders
56

Crack: Trends in Annual Prevalence by College Plans
0
2
4
6
8
10
'76 '78 '80 '82 '84 '86 '88 '90 '92 '94 '96 '98 '00 '02 '04 '06
Year
< 4 yrs
Complete 4 yr
Perc
ent
0
2
4
6
8
10
'76 '78 '80 '82 '84 '86 '88 '90 '92 '94 '96 '98 '00 '02 '04 '06
Year
< 4 yrs
Complete 4 yr
0
2
4
6
8
10
'76 '78 '80 '82 '84 '86 '88 '90 '92 '94 '96 '98 '00 '02 '04 '06
Year
< 4 yrs
Complete 4 yr
Perc
ent
Perc
ent
8th Graders 10th Graders 12th Graders
57

Crack: Trends in Annual Prevalence by Region
0
2
4
6
8
10
'76 '78 '80 '82 '84 '86 '88 '90 '92 '94 '96 '98 '00 '02 '04 '06
Year
NortheastNorth CentralSouthWest
Perc
ent
0
2
4
6
8
10
'76 '78 '80 '82 '84 '86 '88 '90 '92 '94 '96 '98 '00 '02 '04 '06
Year
NortheastNorth CentralSouthWest
0
2
4
6
8
10
'76 '78 '80 '82 '84 '86 '88 '90 '92 '94 '96 '98 '00 '02 '04 '06
Year
NortheastNorth CentralSouthWest
Perc
ent
Perc
ent
8th Graders 10th Graders 12th Graders
58

Crack: Trends in Annual Prevalence by Population Density
0
2
4
6
8
10
'76 '78 '80 '82 '84 '86 '88 '90 '92 '94 '96 '98 '00 '02 '04 '06
Year
Large MSAOther MSANon-MSA
Perc
ent
0
2
4
6
8
10
'76 '78 '80 '82 '84 '86 '88 '90 '92 '94 '96 '98 '00 '02 '04 '06
Year
Large MSAOther MSANon-MSA
0
2
4
6
8
10
'76 '78 '80 '82 '84 '86 '88 '90 '92 '94 '96 '98 '00 '02 '04 '06
Year
Large MSAOther MSANon-MSA
Perc
ent
Perc
ent
8th Graders 10th Graders 12th Graders
59

Crack: Trends in Annual Prevalence by Parents' Average Education
0
2
4
6
8
10
'76 '78 '80 '82 '84 '86 '88 '90 '92 '94 '96 '98 '00 '02 '04 '06
Year
1 (Low)2345 (High)
Perc
ent
0
2
4
6
8
10
'76 '78 '80 '82 '84 '86 '88 '90 '92 '94 '96 '98 '00 '02 '04 '06
Year
1 (Low)2345 (High)
0
2
4
6
8
10
'76 '78 '80 '82 '84 '86 '88 '90 '92 '94 '96 '98 '00 '02 '04 '06
Year
1 (Low)2345 (High)
Perc
ent
Perc
ent
8th Graders 10th Graders 12th Graders
60

Crack: Trends in Annual Prevalence by Race/Ethnicity*
observation from the previous year).*These graphs contain two-year moving averages (i.e., the mean of the observation in the indicated year plus the corresponding
0
2
4
6
8
10
'76 '78 '80 '82 '84 '86 '88 '90 '92 '94 '96 '98 '00 '02 '04 '06
Year
WhiteBlackHispanic
Perc
ent
0
2
4
6
8
10
'76 '78 '80 '82 '84 '86 '88 '90 '92 '94 '96 '98 '00 '02 '04 '06
Year
WhiteBlackHispanic
0
2
4
6
8
10
'76 '78 '80 '82 '84 '86 '88 '90 '92 '94 '96 '98 '00 '02 '04 '06
Year
WhiteBlackHispanic
Perc
ent
Perc
ent
8th Graders 10th Graders 12th Graders
61

Other Cocaine: Trends in Annual Prevalence by Gender
0
5
10
15
20
'76 '78 '80 '82 '84 '86 '88 '90 '92 '94 '96 '98 '00 '02 '04 '06
Year
Male
Female
Perc
ent
0
5
10
15
20
'76 '78 '80 '82 '84 '86 '88 '90 '92 '94 '96 '98 '00 '02 '04 '06
Year
Male
Female
0
5
10
15
20
'76 '78 '80 '82 '84 '86 '88 '90 '92 '94 '96 '98 '00 '02 '04 '06
Year
Male
Female
Perc
ent
Perc
ent
8th Graders 10th Graders 12th Graders
62

Other Cocaine: Trends in Annual Prevalence by College Plans
0
5
10
15
20
'76 '78 '80 '82 '84 '86 '88 '90 '92 '94 '96 '98 '00 '02 '04 '06
Year
< 4 yrs
Complete 4 yr
Perc
ent
0
5
10
15
20
'76 '78 '80 '82 '84 '86 '88 '90 '92 '94 '96 '98 '00 '02 '04 '06
Year
< 4 yrs
Complete 4 yr
0
5
10
15
20
'76 '78 '80 '82 '84 '86 '88 '90 '92 '94 '96 '98 '00 '02 '04 '06
Year
< 4 yrs
Complete 4 yr
Perc
ent
Perc
ent
8th Graders 10th Graders 12th Graders
63

Other Cocaine: Trends in Annual Prevalence by Region
0
5
10
15
20
'76 '78 '80 '82 '84 '86 '88 '90 '92 '94 '96 '98 '00 '02 '04 '06
Year
NortheastNorth CentralSouthWest
Perc
ent
0
5
10
15
20
'76 '78 '80 '82 '84 '86 '88 '90 '92 '94 '96 '98 '00 '02 '04 '06
Year
NortheastNorth CentralSouthWest
0
5
10
15
20
'76 '78 '80 '82 '84 '86 '88 '90 '92 '94 '96 '98 '00 '02 '04 '06
Year
NortheastNorth CentralSouthWest
Perc
ent
Perc
ent
8th Graders 10th Graders 12th Graders
64

Other Cocaine: Trends in Annual Prevalence by Population Density
0
5
10
15
20
'76 '78 '80 '82 '84 '86 '88 '90 '92 '94 '96 '98 '00 '02 '04 '06
Year
Large MSAOther MSANon-MSA
Perc
ent
0
5
10
15
20
'76 '78 '80 '82 '84 '86 '88 '90 '92 '94 '96 '98 '00 '02 '04 '06
Year
Large MSAOther MSANon-MSA
0
5
10
15
20
'76 '78 '80 '82 '84 '86 '88 '90 '92 '94 '96 '98 '00 '02 '04 '06
Year
Large MSAOther MSANon-MSA
Perc
ent
Perc
ent
8th Graders 10th Graders 12th Graders
65

Other Cocaine: Trends in Annual Prevalence by Parents' Average Education
0
5
10
15
20
'76 '78 '80 '82 '84 '86 '88 '90 '92 '94 '96 '98 '00 '02 '04 '06
Year
1 (Low)2345 (High)
Perc
ent
0
5
10
15
20
'76 '78 '80 '82 '84 '86 '88 '90 '92 '94 '96 '98 '00 '02 '04 '06
Year
1 (Low)2345 (High)
0
5
10
15
20
'76 '78 '80 '82 '84 '86 '88 '90 '92 '94 '96 '98 '00 '02 '04 '06
Year
1 (Low)2345 (High)
Perc
ent
Perc
ent
8th Graders 10th Graders 12th Graders
66
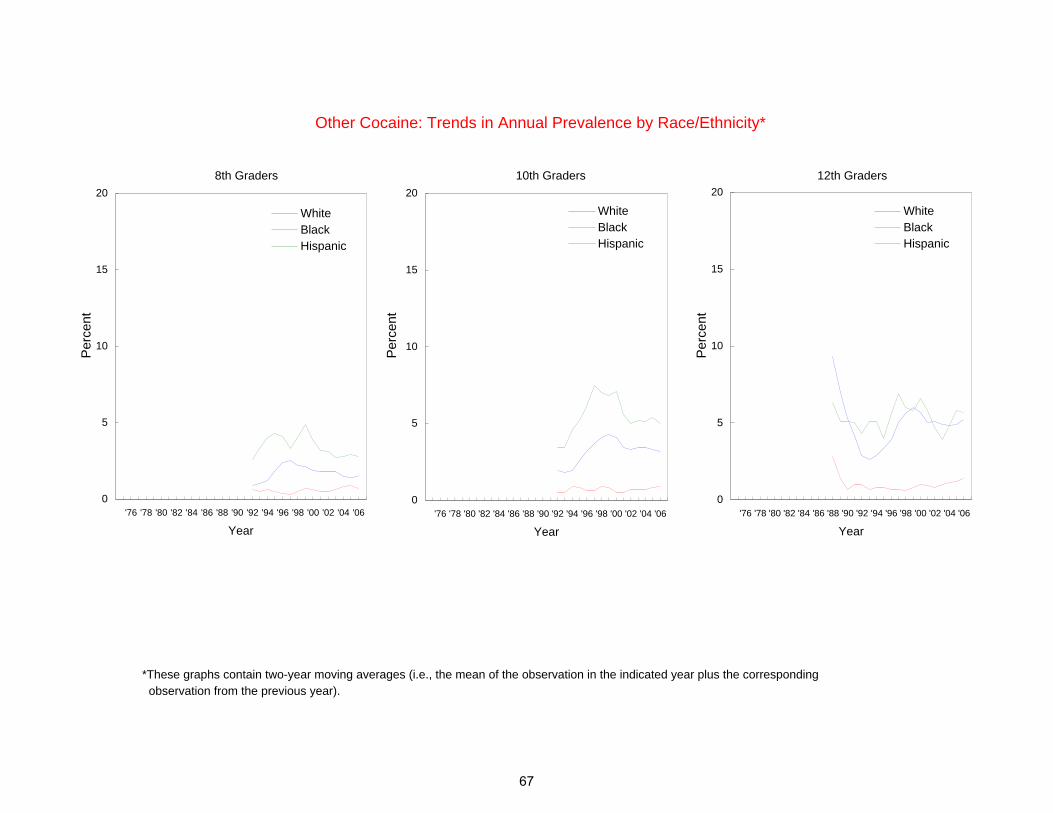
Other Cocaine: Trends in Annual Prevalence by Race/Ethnicity*
observation from the previous year).*These graphs contain two-year moving averages (i.e., the mean of the observation in the indicated year plus the corresponding
0
5
10
15
20
'76 '78 '80 '82 '84 '86 '88 '90 '92 '94 '96 '98 '00 '02 '04 '06
Year
WhiteBlackHispanic
Perc
ent
0
5
10
15
20
'76 '78 '80 '82 '84 '86 '88 '90 '92 '94 '96 '98 '00 '02 '04 '06
Year
WhiteBlackHispanic
0
5
10
15
20
'76 '78 '80 '82 '84 '86 '88 '90 '92 '94 '96 '98 '00 '02 '04 '06
Year
WhiteBlackHispanic
Perc
ent
Perc
ent
8th Graders 10th Graders 12th Graders
67

Heroin: Trends in Annual Prevalence by Gender
0
3
6
9
12
15
'76 '78 '80 '82 '84 '86 '88 '90 '92 '94 '96 '98 '00 '02 '04 '06
Year
Male
Female
Perc
ent
0
3
6
9
12
15
'76 '78 '80 '82 '84 '86 '88 '90 '92 '94 '96 '98 '00 '02 '04 '06
Year
Male
Female
0
3
6
9
12
15
'76 '78 '80 '82 '84 '86 '88 '90 '92 '94 '96 '98 '00 '02 '04 '06
Year
Male
Female
Perc
ent
Perc
ent
8th Graders 10th Graders 12th Graders
68

Heroin: Trends in Annual Prevalence by College Plans
0
3
6
9
12
15
'76 '78 '80 '82 '84 '86 '88 '90 '92 '94 '96 '98 '00 '02 '04 '06
Year
< 4 yrs
Complete 4 yr
Perc
ent
0
3
6
9
12
15
'76 '78 '80 '82 '84 '86 '88 '90 '92 '94 '96 '98 '00 '02 '04 '06
Year
< 4 yrs
Complete 4 yr
0
3
6
9
12
15
'76 '78 '80 '82 '84 '86 '88 '90 '92 '94 '96 '98 '00 '02 '04 '06
Year
< 4 yrs
Complete 4 yr
Perc
ent
Perc
ent
8th Graders 10th Graders 12th Graders
69

Heroin: Trends in Annual Prevalence by Region
0
3
6
9
12
15
'76 '78 '80 '82 '84 '86 '88 '90 '92 '94 '96 '98 '00 '02 '04 '06
Year
NortheastNorth CentralSouthWest
Perc
ent
0
3
6
9
12
15
'76 '78 '80 '82 '84 '86 '88 '90 '92 '94 '96 '98 '00 '02 '04 '06
Year
NortheastNorth CentralSouthWest
0
3
6
9
12
15
'76 '78 '80 '82 '84 '86 '88 '90 '92 '94 '96 '98 '00 '02 '04 '06
Year
NortheastNorth CentralSouthWest
Perc
ent
Perc
ent
8th Graders 10th Graders 12th Graders
70

Heroin: Trends in Annual Prevalence by Population Density
0
3
6
9
12
15
'76 '78 '80 '82 '84 '86 '88 '90 '92 '94 '96 '98 '00 '02 '04 '06
Year
Large MSAOther MSANon-MSA
Perc
ent
0
3
6
9
12
15
'76 '78 '80 '82 '84 '86 '88 '90 '92 '94 '96 '98 '00 '02 '04 '06
Year
Large MSAOther MSANon-MSA
0
3
6
9
12
15
'76 '78 '80 '82 '84 '86 '88 '90 '92 '94 '96 '98 '00 '02 '04 '06
Year
Large MSAOther MSANon-MSA
Perc
ent
Perc
ent
8th Graders 10th Graders 12th Graders
71

Heroin: Trends in Annual Prevalence by Parents' Average Education
0
3
6
9
12
15
'76 '78 '80 '82 '84 '86 '88 '90 '92 '94 '96 '98 '00 '02 '04 '06
Year
1 (Low)2345 (High)
Perc
ent
0
3
6
9
12
15
'76 '78 '80 '82 '84 '86 '88 '90 '92 '94 '96 '98 '00 '02 '04 '06
Year
1 (Low)2345 (High)
0
3
6
9
12
15
'76 '78 '80 '82 '84 '86 '88 '90 '92 '94 '96 '98 '00 '02 '04 '06
Year
1 (Low)2345 (High)
Perc
ent
Perc
ent
8th Graders 10th Graders 12th Graders
72

Heroin: Trends in Annual Prevalence by Race/Ethnicity*
observation from the previous year).*These graphs contain two-year moving averages (i.e., the mean of the observation in the indicated year plus the corresponding
0
3
6
9
12
15
'76 '78 '80 '82 '84 '86 '88 '90 '92 '94 '96 '98 '00 '02 '04 '06
Year
WhiteBlackHispanic
Perc
ent
0
3
6
9
12
15
'76 '78 '80 '82 '84 '86 '88 '90 '92 '94 '96 '98 '00 '02 '04 '06
Year
WhiteBlackHispanic
0
3
6
9
12
15
'76 '78 '80 '82 '84 '86 '88 '90 '92 '94 '96 '98 '00 '02 '04 '06
Year
WhiteBlackHispanic
Perc
ent
Perc
ent
8th Graders 10th Graders 12th Graders
73

Heroin With a Needle: Trends in Annual Prevalence by Gender
0
3
6
9
12
15
'76 '78 '80 '82 '84 '86 '88 '90 '92 '94 '96 '98 '00 '02 '04 '06
Year
Male
Female
Perc
ent
0
3
6
9
12
15
'76 '78 '80 '82 '84 '86 '88 '90 '92 '94 '96 '98 '00 '02 '04 '06
Year
Male
Female
0
3
6
9
12
15
'76 '78 '80 '82 '84 '86 '88 '90 '92 '94 '96 '98 '00 '02 '04 '06
Year
Male
Female
Perc
ent
Perc
ent
8th Graders 10th Graders 12th Graders
74

Heroin With a Needle: Trends in Annual Prevalence by College Plans
0
3
6
9
12
15
'76 '78 '80 '82 '84 '86 '88 '90 '92 '94 '96 '98 '00 '02 '04 '06
Year
< 4 yrs
Complete 4 yr
Perc
ent
0
3
6
9
12
15
'76 '78 '80 '82 '84 '86 '88 '90 '92 '94 '96 '98 '00 '02 '04 '06
Year
< 4 yrs
Complete 4 yr
0
3
6
9
12
15
'76 '78 '80 '82 '84 '86 '88 '90 '92 '94 '96 '98 '00 '02 '04 '06
Year
< 4 yrs
Complete 4 yr
Perc
ent
Perc
ent
8th Graders 10th Graders 12th Graders
75
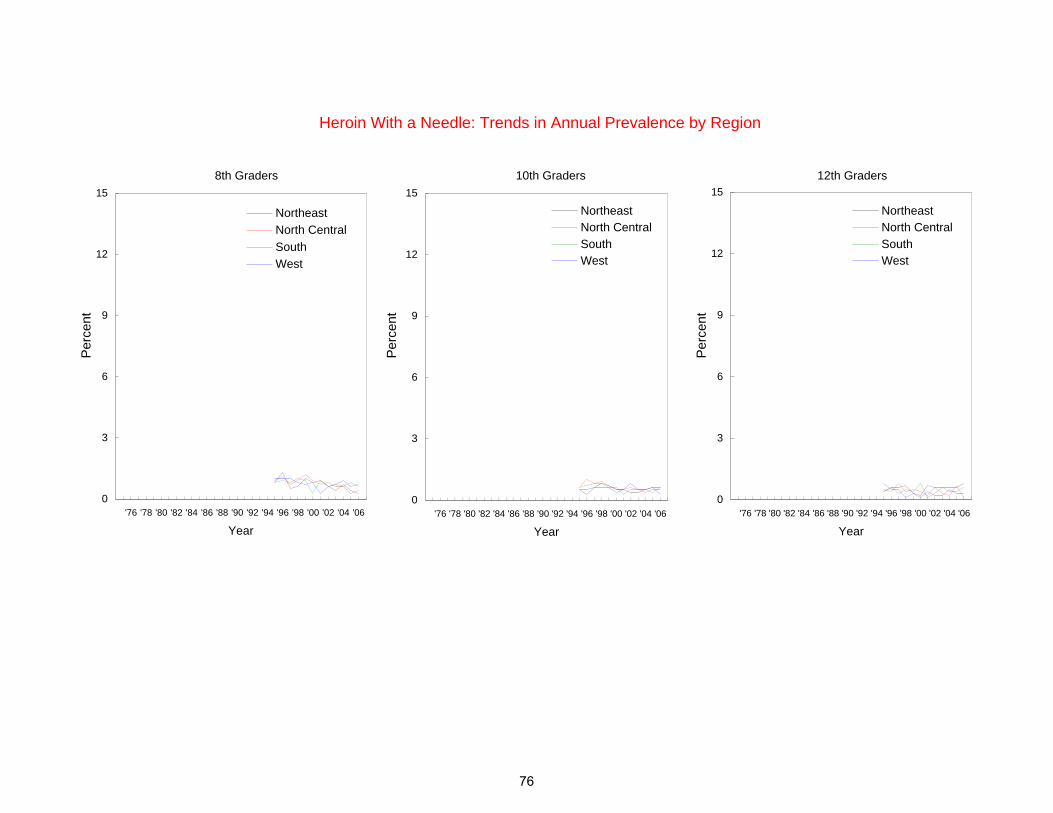
Heroin With a Needle: Trends in Annual Prevalence by Region
0
3
6
9
12
15
'76 '78 '80 '82 '84 '86 '88 '90 '92 '94 '96 '98 '00 '02 '04 '06
Year
NortheastNorth CentralSouthWest
Perc
ent
0
3
6
9
12
15
'76 '78 '80 '82 '84 '86 '88 '90 '92 '94 '96 '98 '00 '02 '04 '06
Year
NortheastNorth CentralSouthWest
0
3
6
9
12
15
'76 '78 '80 '82 '84 '86 '88 '90 '92 '94 '96 '98 '00 '02 '04 '06
Year
NortheastNorth CentralSouthWest
Perc
ent
Perc
ent
8th Graders 10th Graders 12th Graders
76

Heroin With a Needle: Trends in Annual Prevalence by Population Density
0
3
6
9
12
15
'76 '78 '80 '82 '84 '86 '88 '90 '92 '94 '96 '98 '00 '02 '04 '06
Year
Large MSAOther MSANon-MSA
Perc
ent
0
3
6
9
12
15
'76 '78 '80 '82 '84 '86 '88 '90 '92 '94 '96 '98 '00 '02 '04 '06
Year
Large MSAOther MSANon-MSA
0
3
6
9
12
15
'76 '78 '80 '82 '84 '86 '88 '90 '92 '94 '96 '98 '00 '02 '04 '06
Year
Large MSAOther MSANon-MSA
Perc
ent
Perc
ent
8th Graders 10th Graders 12th Graders
77

Heroin With a Needle: Trends in Annual Prevalence by Parents' Average Education
0
3
6
9
12
15
'76 '78 '80 '82 '84 '86 '88 '90 '92 '94 '96 '98 '00 '02 '04 '06
Year
1 (Low)2345 (High)
Perc
ent
0
3
6
9
12
15
'76 '78 '80 '82 '84 '86 '88 '90 '92 '94 '96 '98 '00 '02 '04 '06
Year
1 (Low)2345 (High)
0
3
6
9
12
15
'76 '78 '80 '82 '84 '86 '88 '90 '92 '94 '96 '98 '00 '02 '04 '06
Year
1 (Low)2345 (High)
Perc
ent
Perc
ent
8th Graders 10th Graders 12th Graders
78

Heroin With a Needle: Trends in Annual Prevalence by Race/Ethnicity*
observation from the previous year).*These graphs contain two-year moving averages (i.e., the mean of the observation in the indicated year plus the corresponding
0
3
6
9
12
15
'76 '78 '80 '82 '84 '86 '88 '90 '92 '94 '96 '98 '00 '02 '04 '06
Year
WhiteBlackHispanic
Perc
ent
0
3
6
9
12
15
'76 '78 '80 '82 '84 '86 '88 '90 '92 '94 '96 '98 '00 '02 '04 '06
Year
WhiteBlackHispanic
0
3
6
9
12
15
'76 '78 '80 '82 '84 '86 '88 '90 '92 '94 '96 '98 '00 '02 '04 '06
Year
WhiteBlackHispanic
Perc
ent
Perc
ent
8th Graders 10th Graders 12th Graders
79

Heroin Without a Needle: Trends in Annual Prevalence by Gender
0
3
6
9
12
15
'76 '78 '80 '82 '84 '86 '88 '90 '92 '94 '96 '98 '00 '02 '04 '06
Year
Male
Female
Perc
ent
0
3
6
9
12
15
'76 '78 '80 '82 '84 '86 '88 '90 '92 '94 '96 '98 '00 '02 '04 '06
Year
Male
Female
0
3
6
9
12
15
'76 '78 '80 '82 '84 '86 '88 '90 '92 '94 '96 '98 '00 '02 '04 '06
Year
Male
Female
Perc
ent
Perc
ent
8th Graders 10th Graders 12th Graders
80

Heroin Without a Needle: Trends in Annual Prevalence by College Plans
0
3
6
9
12
15
'76 '78 '80 '82 '84 '86 '88 '90 '92 '94 '96 '98 '00 '02 '04 '06
Year
< 4 yrs
Complete 4 yr
Perc
ent
0
3
6
9
12
15
'76 '78 '80 '82 '84 '86 '88 '90 '92 '94 '96 '98 '00 '02 '04 '06
Year
< 4 yrs
Complete 4 yr
0
3
6
9
12
15
'76 '78 '80 '82 '84 '86 '88 '90 '92 '94 '96 '98 '00 '02 '04 '06
Year
< 4 yrs
Complete 4 yr
Perc
ent
Perc
ent
8th Graders 10th Graders 12th Graders
81

Heroin Without a Needle: Trends in Annual Prevalence by Region
0
3
6
9
12
15
'76 '78 '80 '82 '84 '86 '88 '90 '92 '94 '96 '98 '00 '02 '04 '06
Year
NortheastNorth CentralSouthWest
Perc
ent
0
3
6
9
12
15
'76 '78 '80 '82 '84 '86 '88 '90 '92 '94 '96 '98 '00 '02 '04 '06
Year
NortheastNorth CentralSouthWest
0
3
6
9
12
15
'76 '78 '80 '82 '84 '86 '88 '90 '92 '94 '96 '98 '00 '02 '04 '06
Year
NortheastNorth CentralSouthWest
Perc
ent
Perc
ent
8th Graders 10th Graders 12th Graders
82

Heroin Without a Needle: Trends in Annual Prevalence by Population Density
0
3
6
9
12
15
'76 '78 '80 '82 '84 '86 '88 '90 '92 '94 '96 '98 '00 '02 '04 '06
Year
Large MSAOther MSANon-MSA
Perc
ent
0
3
6
9
12
15
'76 '78 '80 '82 '84 '86 '88 '90 '92 '94 '96 '98 '00 '02 '04 '06
Year
Large MSAOther MSANon-MSA
0
3
6
9
12
15
'76 '78 '80 '82 '84 '86 '88 '90 '92 '94 '96 '98 '00 '02 '04 '06
Year
Large MSAOther MSANon-MSA
Perc
ent
Perc
ent
8th Graders 10th Graders 12th Graders
83

Heroin Without a Needle: Trends in Annual Prevalence by Parents' Average Education
0
3
6
9
12
15
'76 '78 '80 '82 '84 '86 '88 '90 '92 '94 '96 '98 '00 '02 '04 '06
Year
1 (Low)2345 (High)
Perc
ent
0
3
6
9
12
15
'76 '78 '80 '82 '84 '86 '88 '90 '92 '94 '96 '98 '00 '02 '04 '06
Year
1 (Low)2345 (High)
0
3
6
9
12
15
'76 '78 '80 '82 '84 '86 '88 '90 '92 '94 '96 '98 '00 '02 '04 '06
Year
1 (Low)2345 (High)
Perc
ent
Perc
ent
8th Graders 10th Graders 12th Graders
84

Heroin Without a Needle: Trends in Annual Prevalence by Race/Ethnicity*
observation from the previous year).*These graphs contain two-year moving averages (i.e., the mean of the observation in the indicated year plus the corresponding
0
3
6
9
12
15
'76 '78 '80 '82 '84 '86 '88 '90 '92 '94 '96 '98 '00 '02 '04 '06
Year
WhiteBlackHispanic
Perc
ent
0
3
6
9
12
15
'76 '78 '80 '82 '84 '86 '88 '90 '92 '94 '96 '98 '00 '02 '04 '06
Year
WhiteBlackHispanic
0
3
6
9
12
15
'76 '78 '80 '82 '84 '86 '88 '90 '92 '94 '96 '98 '00 '02 '04 '06
Year
WhiteBlackHispanic
Perc
ent
Perc
ent
8th Graders 10th Graders 12th Graders
85

*Beginnning in 2002, a revised set of questions on other narcotics use was introduced. Refer to corresponding tables for further details.
Other Narcotics:* Trends in Annual Prevalence by Gender
0
5
10
15
20
'76 '78 '80 '82 '84 '86 '88 '90 '92 '94 '96 '98 '00 '02 '04 '06
Year
Male
Female
Perc
ent
12th Graders
86

*Beginnning in 2002, a revised set of questions on other narcotics use was introduced. Refer to corresponding tables for further details.
Other Narcotics:* Trends in Annual Prevalence by College Plans
0
5
10
15
20
'76 '78 '80 '82 '84 '86 '88 '90 '92 '94 '96 '98 '00 '02 '04 '06
Year
< 4 yrs
Complete 4 yr
Perc
ent
12th Graders
87

*Beginnning in 2002, a revised set of questions on other narcotics use was introduced. Refer to corresponding tables for further details.
Other Narcotics:* Trends in Annual Prevalence by Region
0
5
10
15
20
'76 '78 '80 '82 '84 '86 '88 '90 '92 '94 '96 '98 '00 '02 '04 '06
Year
NortheastNorth CentralSouthWest
Perc
ent
12th Graders
88
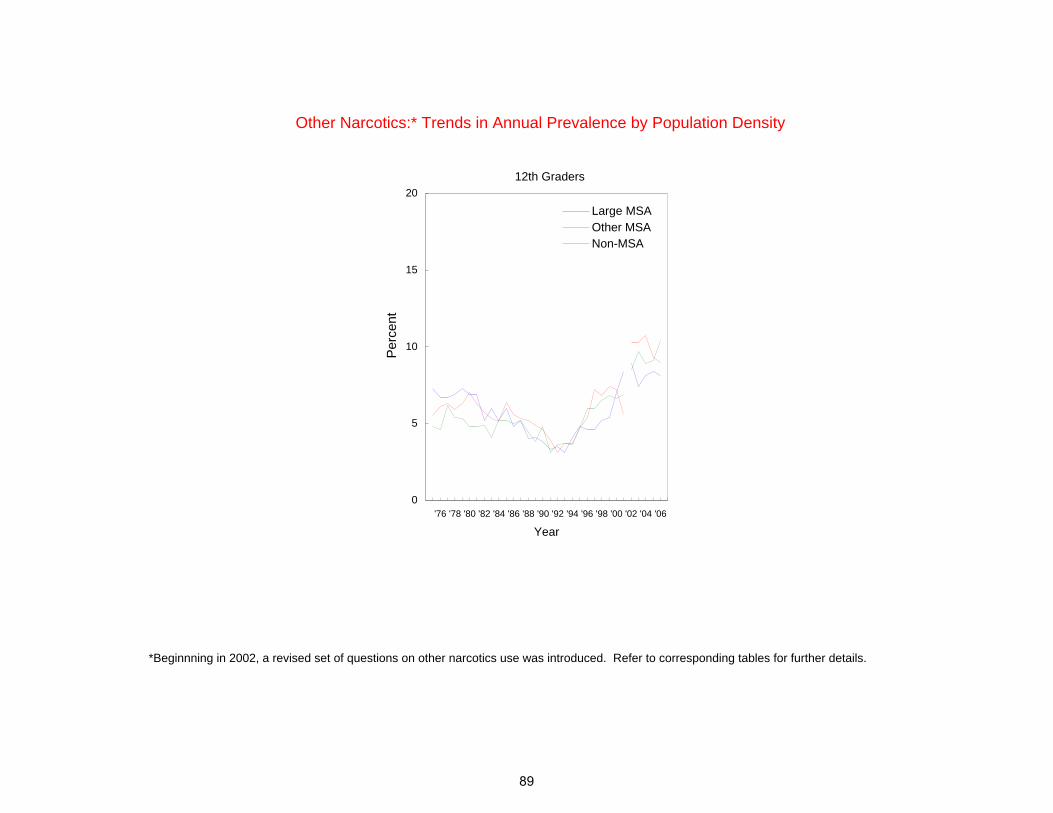
*Beginnning in 2002, a revised set of questions on other narcotics use was introduced. Refer to corresponding tables for further details.
Other Narcotics:* Trends in Annual Prevalence by Population Density
0
5
10
15
20
'76 '78 '80 '82 '84 '86 '88 '90 '92 '94 '96 '98 '00 '02 '04 '06
Year
Large MSAOther MSANon-MSA
Perc
ent
12th Graders
89

*Beginnning in 2002, a revised set of questions on other narcotics use was introduced. Refer to corresponding tables for further details.
Other Narcotics:* Trends in Annual Prevalence by Parents' Average Education
0
5
10
15
20
'76 '78 '80 '82 '84 '86 '88 '90 '92 '94 '96 '98 '00 '02 '04 '06
Year
1 (Low)2345 (High)
Perc
ent
12th Graders
90

Other Narcotics:* Trends in Annual Prevalence by Race/Ethnicity**
observation from the previous year).**These graphs contain two-year moving averages (i.e., the mean of the observation in the indicated year plus the corresponding
*Beginnning in 2002, a revised set of questions on other narcotics use was introduced. Refer to corresponding tables for further details.
0
5
10
15
20
'76 '78 '80 '82 '84 '86 '88 '90 '92 '94 '96 '98 '00 '02 '04 '06
Year
WhiteBlackHispanic
Perc
ent
12th Graders
91

OxyContin: Trends in Annual Prevalence by Gender
0
5
10
15
20
'76 '78 '80 '82 '84 '86 '88 '90 '92 '94 '96 '98 '00 '02 '04 '06
Year
Male
Female
Perc
ent
0
5
10
15
20
'76 '78 '80 '82 '84 '86 '88 '90 '92 '94 '96 '98 '00 '02 '04 '06
Year
Male
Female
0
5
10
15
20
'76 '78 '80 '82 '84 '86 '88 '90 '92 '94 '96 '98 '00 '02 '04 '06
Year
Male
Female
Perc
ent
Perc
ent
8th Graders 10th Graders 12th Graders
92

OxyContin: Trends in Annual Prevalence by College Plans
0
5
10
15
20
'76 '78 '80 '82 '84 '86 '88 '90 '92 '94 '96 '98 '00 '02 '04 '06
Year
< 4 yrs
Complete 4 yr
Perc
ent
0
5
10
15
20
'76 '78 '80 '82 '84 '86 '88 '90 '92 '94 '96 '98 '00 '02 '04 '06
Year
< 4 yrs
Complete 4 yr
0
5
10
15
20
'76 '78 '80 '82 '84 '86 '88 '90 '92 '94 '96 '98 '00 '02 '04 '06
Year
< 4 yrs
Complete 4 yr
Perc
ent
Perc
ent
8th Graders 10th Graders 12th Graders
93

OxyContin: Trends in Annual Prevalence by Region
0
5
10
15
20
'76 '78 '80 '82 '84 '86 '88 '90 '92 '94 '96 '98 '00 '02 '04 '06
Year
NortheastNorth CentralSouthWest
Perc
ent
0
5
10
15
20
'76 '78 '80 '82 '84 '86 '88 '90 '92 '94 '96 '98 '00 '02 '04 '06
Year
NortheastNorth CentralSouthWest
0
5
10
15
20
'76 '78 '80 '82 '84 '86 '88 '90 '92 '94 '96 '98 '00 '02 '04 '06
Year
NortheastNorth CentralSouthWest
Perc
ent
Perc
ent
8th Graders 10th Graders 12th Graders
94

OxyContin: Trends in Annual Prevalence by Population Density
0
5
10
15
20
'76 '78 '80 '82 '84 '86 '88 '90 '92 '94 '96 '98 '00 '02 '04 '06
Year
Large MSAOther MSANon-MSA
Perc
ent
0
5
10
15
20
'76 '78 '80 '82 '84 '86 '88 '90 '92 '94 '96 '98 '00 '02 '04 '06
Year
Large MSAOther MSANon-MSA
0
5
10
15
20
'76 '78 '80 '82 '84 '86 '88 '90 '92 '94 '96 '98 '00 '02 '04 '06
Year
Large MSAOther MSANon-MSA
Perc
ent
Perc
ent
8th Graders 10th Graders 12th Graders
95

OxyContin: Trends in Annual Prevalence by Parents' Average Education
0
5
10
15
20
'76 '78 '80 '82 '84 '86 '88 '90 '92 '94 '96 '98 '00 '02 '04 '06
Year
1 (Low)2345 (High)
Perc
ent
0
5
10
15
20
'76 '78 '80 '82 '84 '86 '88 '90 '92 '94 '96 '98 '00 '02 '04 '06
Year
1 (Low)2345 (High)
0
5
10
15
20
'76 '78 '80 '82 '84 '86 '88 '90 '92 '94 '96 '98 '00 '02 '04 '06
Year
1 (Low)2345 (High)
Perc
ent
Perc
ent
8th Graders 10th Graders 12th Graders
96

*These graphs contain two-year moving averages (i.e., the mean of the observation in the indicated year plus the corresponding observation from the previous year).
OxyContin: Trends in Annual Prevalence by Race/Ethnicity*
0
5
10
15
20
'76 '78 '80 '82 '84 '86 '88 '90 '92 '94 '96 '98 '00 '02 '04 '06
Year
WhiteBlackHispanic
Perc
ent
0
5
10
15
20
'76 '78 '80 '82 '84 '86 '88 '90 '92 '94 '96 '98 '00 '02 '04 '06
Year
WhiteBlackHispanic
0
5
10
15
20
'76 '78 '80 '82 '84 '86 '88 '90 '92 '94 '96 '98 '00 '02 '04 '06
Year
WhiteBlackHispanic
Perc
ent
Perc
ent
8th Graders 10th Graders 12th Graders
97

Vicodin: Trends in Annual Prevalence by Gender
0
5
10
15
20
'76 '78 '80 '82 '84 '86 '88 '90 '92 '94 '96 '98 '00 '02 '04 '06
Year
Male
Female
Perc
ent
0
5
10
15
20
'76 '78 '80 '82 '84 '86 '88 '90 '92 '94 '96 '98 '00 '02 '04 '06
Year
Male
Female
0
5
10
15
20
'76 '78 '80 '82 '84 '86 '88 '90 '92 '94 '96 '98 '00 '02 '04 '06
Year
Male
Female
Perc
ent
Perc
ent
8th Graders 10th Graders 12th Graders
98

Vicodin: Trends in Annual Prevalence by College Plans
0
5
10
15
20
'76 '78 '80 '82 '84 '86 '88 '90 '92 '94 '96 '98 '00 '02 '04 '06
Year
< 4 yrs
Complete 4 yr
Perc
ent
0
5
10
15
20
'76 '78 '80 '82 '84 '86 '88 '90 '92 '94 '96 '98 '00 '02 '04 '06
Year
< 4 yrs
Complete 4 yr
0
5
10
15
20
'76 '78 '80 '82 '84 '86 '88 '90 '92 '94 '96 '98 '00 '02 '04 '06
Year
< 4 yrs
Complete 4 yr
Perc
ent
Perc
ent
8th Graders 10th Graders 12th Graders
99

Vicodin: Trends in Annual Prevalence by Region
0
5
10
15
20
'76 '78 '80 '82 '84 '86 '88 '90 '92 '94 '96 '98 '00 '02 '04 '06
Year
NortheastNorth CentralSouthWest
Perc
ent
0
5
10
15
20
'76 '78 '80 '82 '84 '86 '88 '90 '92 '94 '96 '98 '00 '02 '04 '06
Year
NortheastNorth CentralSouthWest
0
5
10
15
20
'76 '78 '80 '82 '84 '86 '88 '90 '92 '94 '96 '98 '00 '02 '04 '06
Year
NortheastNorth CentralSouthWest
Perc
ent
Perc
ent
8th Graders 10th Graders 12th Graders
100

Vicodin: Trends in Annual Prevalence by Population Density
0
5
10
15
20
'76 '78 '80 '82 '84 '86 '88 '90 '92 '94 '96 '98 '00 '02 '04 '06
Year
Large MSAOther MSANon-MSA
Perc
ent
0
5
10
15
20
'76 '78 '80 '82 '84 '86 '88 '90 '92 '94 '96 '98 '00 '02 '04 '06
Year
Large MSAOther MSANon-MSA
0
5
10
15
20
'76 '78 '80 '82 '84 '86 '88 '90 '92 '94 '96 '98 '00 '02 '04 '06
Year
Large MSAOther MSANon-MSA
Perc
ent
Perc
ent
8th Graders 10th Graders 12th Graders
101

Vicodin: Trends in Annual Prevalence by Parents' Average Education
0
5
10
15
20
'76 '78 '80 '82 '84 '86 '88 '90 '92 '94 '96 '98 '00 '02 '04 '06
Year
1 (Low)2345 (High)
Perc
ent
0
5
10
15
20
'76 '78 '80 '82 '84 '86 '88 '90 '92 '94 '96 '98 '00 '02 '04 '06
Year
1 (Low)2345 (High)
0
5
10
15
20
'76 '78 '80 '82 '84 '86 '88 '90 '92 '94 '96 '98 '00 '02 '04 '06
Year
1 (Low)2345 (High)
Perc
ent
Perc
ent
8th Graders 10th Graders 12th Graders
102

*These graphs contain two-year moving averages (i.e., the mean of the observation in the indicated year plus the corresponding observation from the previous year).
Vicodin: Trends in Annual Prevalence by Race/Ethnicity*
0
5
10
15
20
'76 '78 '80 '82 '84 '86 '88 '90 '92 '94 '96 '98 '00 '02 '04 '06
Year
WhiteBlackHispanic
Perc
ent
0
5
10
15
20
'76 '78 '80 '82 '84 '86 '88 '90 '92 '94 '96 '98 '00 '02 '04 '06
Year
WhiteBlackHispanic
0
5
10
15
20
'76 '78 '80 '82 '84 '86 '88 '90 '92 '94 '96 '98 '00 '02 '04 '06
Year
WhiteBlackHispanic
Perc
ent
Perc
ent
8th Graders 10th Graders 12th Graders
103

Amphetamines:* Trends in Annual Prevalence by Gender
in the answers. *After 1982 the question about amphetamine use was revised to further clarify that non-prescription stimulants should not be included
0
10
20
30
40
50
'76 '78 '80 '82 '84 '86 '88 '90 '92 '94 '96 '98 '00 '02 '04 '06
Year
Male
Female
8th Graders
Perc
ent
0
10
20
30
40
50
'76 '78 '80 '82 '84 '86 '88 '90 '92 '94 '96 '98 '00 '02 '04 '06
Year
Male
Female
0
10
20
30
40
50
'76 '78 '80 '82 '84 '86 '88 '90 '92 '94 '96 '98 '00 '02 '04 '06
Year
Male, unadjusted
Female, unadjusted
Male, adjusted
Female, adjusted
Perc
ent
Perc
ent
10th Graders 12th Graders
104

Amphetamines:* Trends in Annual Prevalence by College Plans
in the answers. *After 1982 the question about amphetamine use was revised to further clarify that non-prescription stimulants should not be included
0
10
20
30
40
50
'76 '78 '80 '82 '84 '86 '88 '90 '92 '94 '96 '98 '00 '02 '04 '06
Year
< 4 yrs
Complete 4 yr
8th Graders
Perc
ent
0
10
20
30
40
50
'76 '78 '80 '82 '84 '86 '88 '90 '92 '94 '96 '98 '00 '02 '04 '06
Year
< 4 yrs
Complete 4 yr
0
10
20
30
40
50
'76 '78 '80 '82 '84 '86 '88 '90 '92 '94 '96 '98 '00 '02 '04 '06
Year
< 4 yrs, unadjusted
Complete 4 yr, unadjusted
< 4 yrs, adjusted
Complete 4 yr, adjusted
Perc
ent
Perc
ent
10th Graders 12th Graders
105

Amphetamines:* Trends in Annual Prevalence by Region
in the answers. *After 1982 the question about amphetamine use was revised to further clarify that non-prescription stimulants should not be included
0
10
20
30
40
50
'76 '78 '80 '82 '84 '86 '88 '90 '92 '94 '96 '98 '00 '02 '04 '06
Year
NortheastNorth CentralSouthWest
8th Graders
Perc
ent
0
10
20
30
40
50
'76 '78 '80 '82 '84 '86 '88 '90 '92 '94 '96 '98 '00 '02 '04 '06
Year
NortheastNorth CentralSouthWest
0
10
20
30
40
50
'76 '78 '80 '82 '84 '86 '88 '90 '92 '94 '96 '98 '00 '02 '04 '06
Year
Northeast, unadj.North Central, unadj.South, unadj.West, unadj.Northeast, adj.North Central, adj.South, adj.West, adj.
Perc
ent
Perc
ent
10th Graders 12th Graders
106

Amphetamines:* Trends in Annual Prevalence by Population Density
in the answers. *After 1982 the question about amphetamine use was revised to further clarify that non-prescription stimulants should not be included
0
10
20
30
40
50
'76 '78 '80 '82 '84 '86 '88 '90 '92 '94 '96 '98 '00 '02 '04 '06
Year
Large MSAOther MSANon-MSA
8th Graders
Perc
ent
0
10
20
30
40
50
'76 '78 '80 '82 '84 '86 '88 '90 '92 '94 '96 '98 '00 '02 '04 '06
Year
Large MSAOther MSANon-MSA
0
10
20
30
40
50
'76 '78 '80 '82 '84 '86 '88 '90 '92 '94 '96 '98 '00 '02 '04 '06
Year
Large MSA, unadj.Other MSA, unadj.Non-MSA, unadj.Large MSA, adj.Other MSA, adj.Non-MSA, adj.
Perc
ent
Perc
ent
10th Graders 12th Graders
107

Amphetamines:* Trends in Annual Prevalence by Parents' Average Education
in the answers. *After 1982 the question about amphetamine use was revised to further clarify that non-prescription stimulants should not be included
0
10
20
30
40
50
'76 '78 '80 '82 '84 '86 '88 '90 '92 '94 '96 '98 '00 '02 '04 '06
Year
1 (Low)2345 (High)
8th Graders
Perc
ent
0
10
20
30
40
50
'76 '78 '80 '82 '84 '86 '88 '90 '92 '94 '96 '98 '00 '02 '04 '06
Year
1 (Low)2345 (High)
0
10
20
30
40
50
'76 '78 '80 '82 '84 '86 '88 '90 '92 '94 '96 '98 '00 '02 '04 '06
Year
1 (Low)2345 (High)
Perc
ent
Perc
ent
10th Graders 12th Graders
108

*After 1982 the question about amphetamine use was revised to further clarify that non-prescription stimulants should not be included
observation from the previous year).
Amphetamines:* Trends in Annual Prevalence by Race/Ethnicity**
**These graphs contain two-year moving averages (i.e., the mean of the observation in the indicated year plus the corresponding
in the answers.
0
10
20
30
40
50
'76 '78 '80 '82 '84 '86 '88 '90 '92 '94 '96 '98 '00 '02 '04 '06
Year
WhiteBlackHispanic
8th Graders
Perc
ent
0
10
20
30
40
50
'76 '78 '80 '82 '84 '86 '88 '90 '92 '94 '96 '98 '00 '02 '04 '06
Year
WhiteBlackHispanic
0
10
20
30
40
50
'76 '78 '80 '82 '84 '86 '88 '90 '92 '94 '96 '98 '00 '02 '04 '06
Year
WhiteBlackHispanic
Perc
ent
Perc
ent
10th Graders 12th Graders
109

Ritalin: Trends in Annual Prevalence by Gender
0
5
10
15
20
'76 '78 '80 '82 '84 '86 '88 '90 '92 '94 '96 '98 '00 '02 '04 '06
Year
Male
Female
Perc
ent
0
5
10
15
20
'76 '78 '80 '82 '84 '86 '88 '90 '92 '94 '96 '98 '00 '02 '04 '06
Year
Male
Female
0
5
10
15
20
'76 '78 '80 '82 '84 '86 '88 '90 '92 '94 '96 '98 '00 '02 '04 '06
Year
Male
Female
Perc
ent
Perc
ent
8th Graders 10th Graders 12th Graders
110
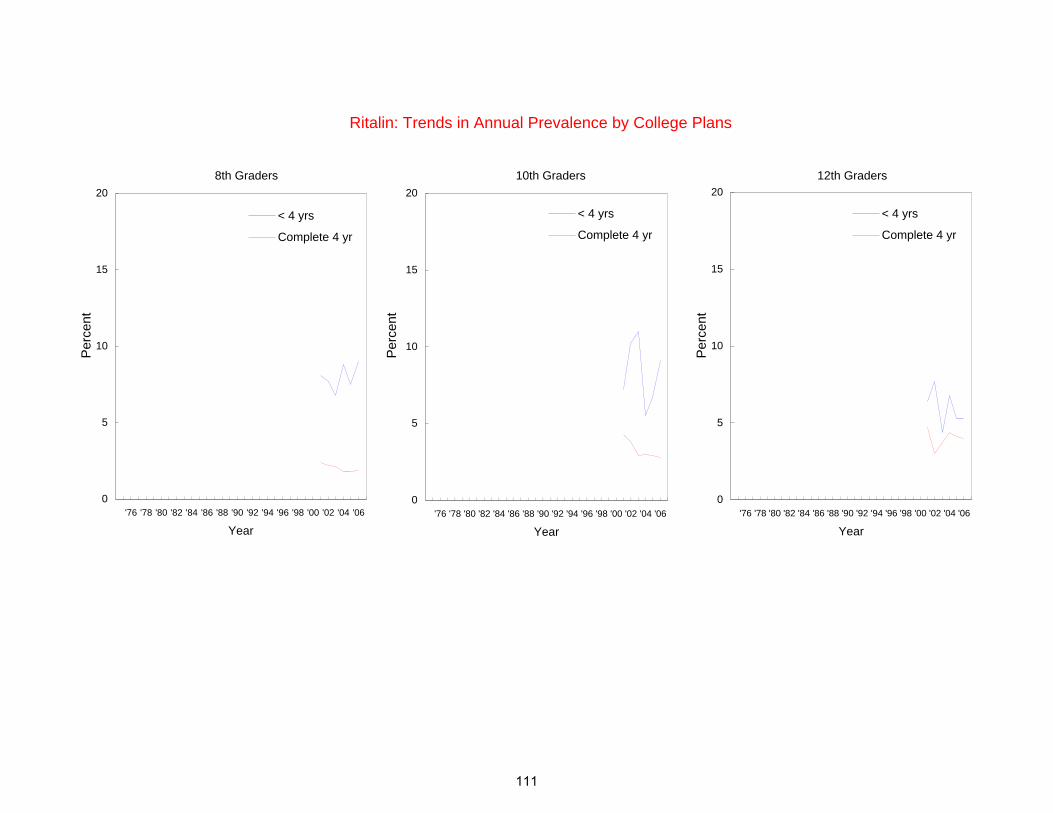
Ritalin: Trends in Annual Prevalence by College Plans
0
5
10
15
20
'76 '78 '80 '82 '84 '86 '88 '90 '92 '94 '96 '98 '00 '02 '04 '06
Year
< 4 yrs
Complete 4 yr
Perc
ent
0
5
10
15
20
'76 '78 '80 '82 '84 '86 '88 '90 '92 '94 '96 '98 '00 '02 '04 '06
Year
< 4 yrs
Complete 4 yr
0
5
10
15
20
'76 '78 '80 '82 '84 '86 '88 '90 '92 '94 '96 '98 '00 '02 '04 '06
Year
< 4 yrs
Complete 4 yr
Perc
ent
Perc
ent
8th Graders 10th Graders 12th Graders
111

Ritalin: Trends in Annual Prevalence by Region
0
5
10
15
20
'76 '78 '80 '82 '84 '86 '88 '90 '92 '94 '96 '98 '00 '02 '04 '06
Year
NortheastNorth CentralSouthWest
Perc
ent
0
5
10
15
20
'76 '78 '80 '82 '84 '86 '88 '90 '92 '94 '96 '98 '00 '02 '04 '06
Year
NortheastNorth CentralSouthWest
0
5
10
15
20
'76 '78 '80 '82 '84 '86 '88 '90 '92 '94 '96 '98 '00 '02 '04 '06
Year
NortheastNorth CentralSouthWest
Perc
ent
Perc
ent
8th Graders 10th Graders 12th Graders
112

Ritalin: Trends in Annual Prevalence by Population Density
0
5
10
15
20
'76 '78 '80 '82 '84 '86 '88 '90 '92 '94 '96 '98 '00 '02 '04 '06
Year
Large MSAOther MSANon-MSA
Perc
ent
0
5
10
15
20
'76 '78 '80 '82 '84 '86 '88 '90 '92 '94 '96 '98 '00 '02 '04 '06
Year
Large MSAOther MSANon-MSA
0
5
10
15
20
'76 '78 '80 '82 '84 '86 '88 '90 '92 '94 '96 '98 '00 '02 '04 '06
Year
Large MSAOther MSANon-MSA
Perc
ent
Perc
ent
8th Graders 10th Graders 12th Graders
113

Ritalin: Trends in Annual Prevalence by Parents' Average Education
0
5
10
15
20
'76 '78 '80 '82 '84 '86 '88 '90 '92 '94 '96 '98 '00 '02 '04 '06
Year
1 (Low)2345 (High)
Perc
ent
0
5
10
15
20
'76 '78 '80 '82 '84 '86 '88 '90 '92 '94 '96 '98 '00 '02 '04 '06
Year
1 (Low)2345 (High)
0
5
10
15
20
'76 '78 '80 '82 '84 '86 '88 '90 '92 '94 '96 '98 '00 '02 '04 '06
Year
1 (Low)2345 (High)
Perc
ent
Perc
ent
8th Graders 10th Graders 12th Graders
114
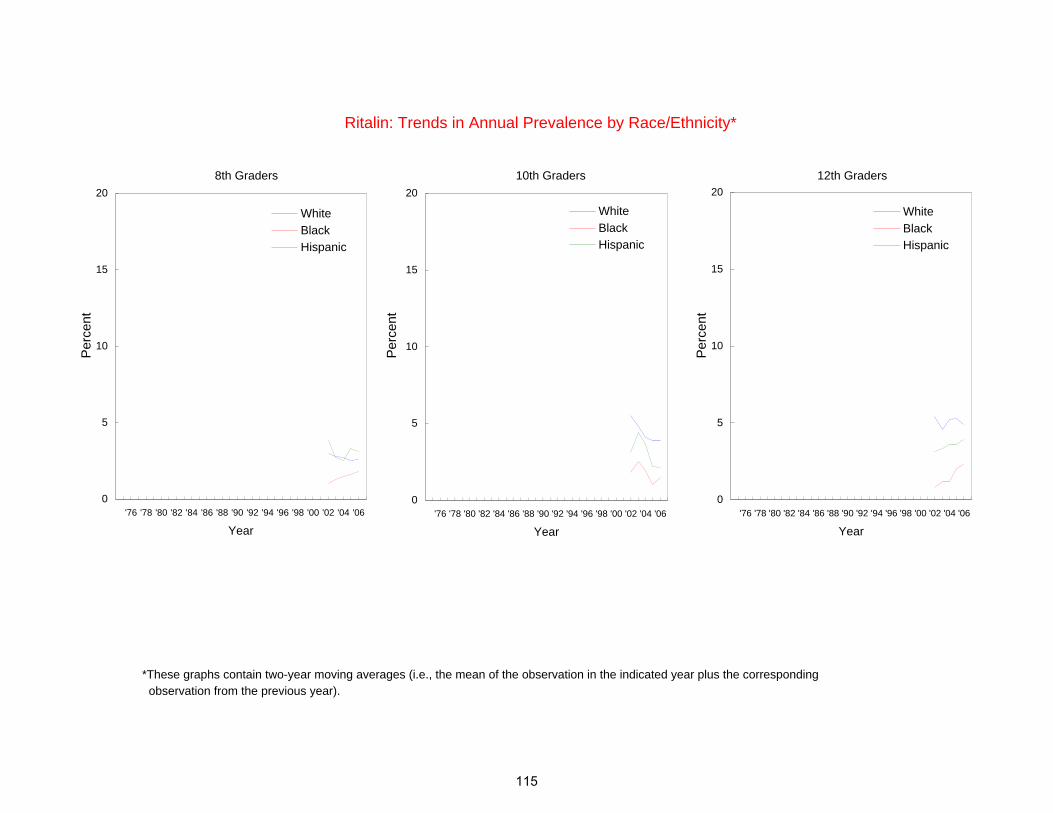
*These graphs contain two-year moving averages (i.e., the mean of the observation in the indicated year plus the corresponding observation from the previous year).
Ritalin: Trends in Annual Prevalence by Race/Ethnicity*
0
5
10
15
20
'76 '78 '80 '82 '84 '86 '88 '90 '92 '94 '96 '98 '00 '02 '04 '06
Year
WhiteBlackHispanic
Perc
ent
0
5
10
15
20
'76 '78 '80 '82 '84 '86 '88 '90 '92 '94 '96 '98 '00 '02 '04 '06
Year
WhiteBlackHispanic
0
5
10
15
20
'76 '78 '80 '82 '84 '86 '88 '90 '92 '94 '96 '98 '00 '02 '04 '06
Year
WhiteBlackHispanic
Perc
ent
Perc
ent
8th Graders 10th Graders 12th Graders
115

Methamphetamine: Trends in Annual Prevalence by Gender
0
5
10
15
20
'76 '78 '80 '82 '84 '86 '88 '90 '92 '94 '96 '98 '00 '02 '04 '06
Year
Male
Female
Perc
ent
0
5
10
15
20
'76 '78 '80 '82 '84 '86 '88 '90 '92 '94 '96 '98 '00 '02 '04 '06
Year
Male
Female
0
5
10
15
20
'76 '78 '80 '82 '84 '86 '88 '90 '92 '94 '96 '98 '00 '02 '04 '06
Year
Male
Female
Perc
ent
Perc
ent
8th Graders 10th Graders 12th Graders
116

Methamphetamine: Trends in Annual Prevalence by College Plans
0
5
10
15
20
'76 '78 '80 '82 '84 '86 '88 '90 '92 '94 '96 '98 '00 '02 '04 '06
Year
< 4 yrs
Complete 4 yr
Perc
ent
0
5
10
15
20
'76 '78 '80 '82 '84 '86 '88 '90 '92 '94 '96 '98 '00 '02 '04 '06
Year
< 4 yrs
Complete 4 yr
0
5
10
15
20
'76 '78 '80 '82 '84 '86 '88 '90 '92 '94 '96 '98 '00 '02 '04 '06
Year
< 4 yrs
Complete 4 yr
Perc
ent
Perc
ent
8th Graders 10th Graders 12th Graders
117

Methamphetamine: Trends in Annual Prevalence by Region
0
5
10
15
20
'76 '78 '80 '82 '84 '86 '88 '90 '92 '94 '96 '98 '00 '02 '04 '06
Year
NortheastNorth CentralSouthWest
Perc
ent
0
5
10
15
20
'76 '78 '80 '82 '84 '86 '88 '90 '92 '94 '96 '98 '00 '02 '04 '06
Year
NortheastNorth CentralSouthWest
0
5
10
15
20
'76 '78 '80 '82 '84 '86 '88 '90 '92 '94 '96 '98 '00 '02 '04 '06
Year
NortheastNorth CentralSouthWest
Perc
ent
Perc
ent
8th Graders 10th Graders 12th Graders
118

Methamphetamine: Trends in Annual Prevalence by Population Density
0
5
10
15
20
'76 '78 '80 '82 '84 '86 '88 '90 '92 '94 '96 '98 '00 '02 '04 '06
Year
Large MSAOther MSANon-MSA
Perc
ent
0
5
10
15
20
'76 '78 '80 '82 '84 '86 '88 '90 '92 '94 '96 '98 '00 '02 '04 '06
Year
Large MSAOther MSANon-MSA
0
5
10
15
20
'76 '78 '80 '82 '84 '86 '88 '90 '92 '94 '96 '98 '00 '02 '04 '06
Year
Large MSAOther MSANon-MSA
Perc
ent
Perc
ent
8th Graders 10th Graders 12th Graders
119

Methamphetamine: Trends in Annual Prevalence by Parents' Average Education
0
5
10
15
20
'76 '78 '80 '82 '84 '86 '88 '90 '92 '94 '96 '98 '00 '02 '04 '06
Year
1 (Low)2345 (High)
Perc
ent
0
5
10
15
20
'76 '78 '80 '82 '84 '86 '88 '90 '92 '94 '96 '98 '00 '02 '04 '06
Year
1 (Low)2345 (High)
0
5
10
15
20
'76 '78 '80 '82 '84 '86 '88 '90 '92 '94 '96 '98 '00 '02 '04 '06
Year
1 (Low)2345 (High)
Perc
ent
Perc
ent
8th Graders 10th Graders 12th Graders
120

Methamphetamine: Trends in Annual Prevalence by Race/Ethnicity*
observation from the previous year).*These graphs contain two-year moving averages (i.e., the mean of the observation in the indicated year plus the corresponding
0
5
10
15
20
'76 '78 '80 '82 '84 '86 '88 '90 '92 '94 '96 '98 '00 '02 '04 '06
Year
WhiteBlackHispanic
Perc
ent
0
5
10
15
20
'76 '78 '80 '82 '84 '86 '88 '90 '92 '94 '96 '98 '00 '02 '04 '06
Year
WhiteBlackHispanic
0
5
10
15
20
'76 '78 '80 '82 '84 '86 '88 '90 '92 '94 '96 '98 '00 '02 '04 '06
Year
WhiteBlackHispanic
Perc
ent
Perc
ent
8th Graders 10th Graders 12th Graders
121

Ice: Trends in Annual Prevalence by Gender
0
5
10
15
'76 '78 '80 '82 '84 '86 '88 '90 '92 '94 '96 '98 '00 '02 '04 '06
Year
Male
Female
Perc
ent
12th Graders
122

Ice: Trends in Annual Prevalence by College Plans
0
5
10
15
'76 '78 '80 '82 '84 '86 '88 '90 '92 '94 '96 '98 '00 '02 '04 '06
Year
< 4 yrs
Complete 4 yr
Perc
ent
12th Graders
123

Ice: Trends in Annual Prevalence by Region
0
5
10
15
'76 '78 '80 '82 '84 '86 '88 '90 '92 '94 '96 '98 '00 '02 '04 '06
Year
NortheastNorth CentralSouthWest
Perc
ent
12th Graders
124

Ice: Trends in Annual Prevalence by Population Density
0
5
10
15
'76 '78 '80 '82 '84 '86 '88 '90 '92 '94 '96 '98 '00 '02 '04 '06
Year
Large MSAOther MSANon-MSA
Perc
ent
12th Graders
125

Ice: Trends in Annual Prevalence by Parents' Average Education
0
5
10
15
'76 '78 '80 '82 '84 '86 '88 '90 '92 '94 '96 '98 '00 '02 '04 '06
Year
1 (Low)2345 (High)
Perc
ent
12th Graders
126

Ice: Trends in Annual Prevalence by Race/Ethnicity*
observation from the previous year).*These graphs contain two-year moving averages (i.e., the mean of the observation in the indicated year plus the corresponding
0
5
10
15
'76 '78 '80 '82 '84 '86 '88 '90 '92 '94 '96 '98 '00 '02 '04 '06
Year
WhiteBlackHispanic
Perc
ent
12th Graders
127

*Beginnning in 2004, a revised set of questions on sedatives (barbiturates) was introduced. Refer to corresponding tables for further details.
Sedatives (Barbiturates):* Trends in Annual Prevalence by Gender
0
5
10
15
20
'76 '78 '80 '82 '84 '86 '88 '90 '92 '94 '96 '98 '00 '02 '04 '06
Year
Male
Female
Perc
ent
12th Graders
128
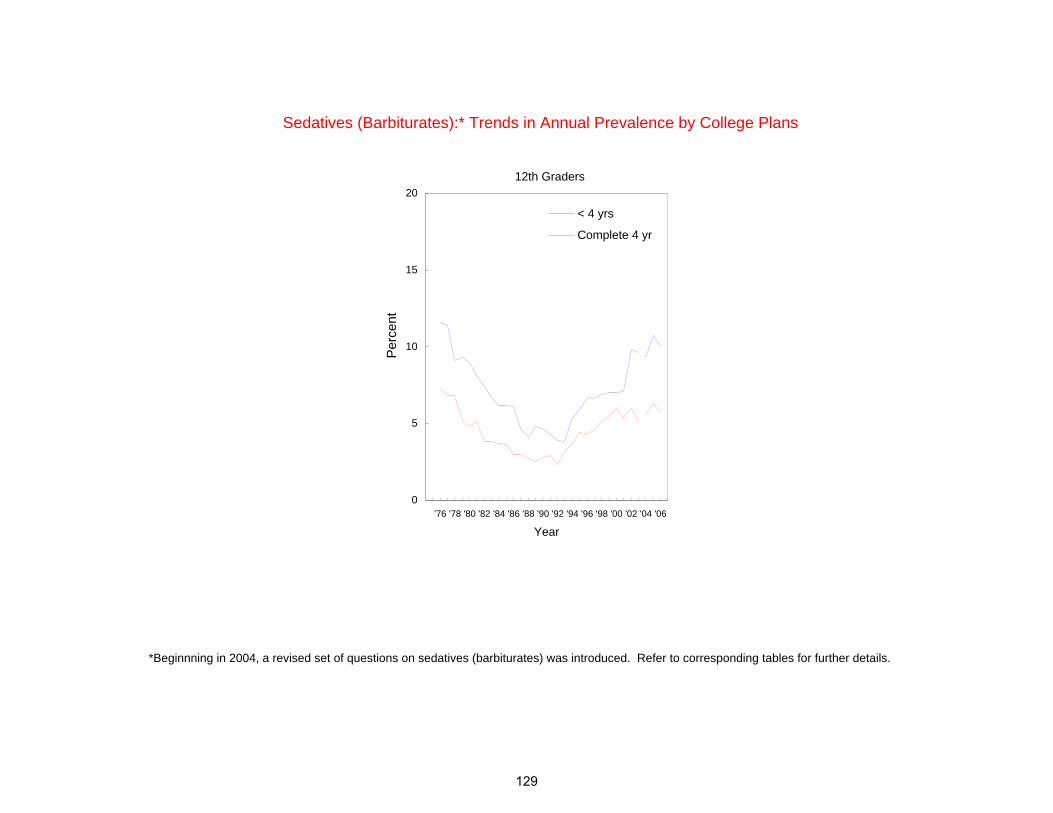
*Beginnning in 2004, a revised set of questions on sedatives (barbiturates) was introduced. Refer to corresponding tables for further details.
Sedatives (Barbiturates):* Trends in Annual Prevalence by College Plans
0
5
10
15
20
'76 '78 '80 '82 '84 '86 '88 '90 '92 '94 '96 '98 '00 '02 '04 '06
Year
< 4 yrs
Complete 4 yr
Perc
ent
12th Graders
129

*Beginnning in 2004, a revised set of questions on sedatives (barbiturates) was introduced. Refer to corresponding tables for further details.
Sedatives (Barbiturates):* Trends in Annual Prevalence by Region
0
5
10
15
20
'76 '78 '80 '82 '84 '86 '88 '90 '92 '94 '96 '98 '00 '02 '04 '06
Year
NortheastNorth CentralSouthWest
Perc
ent
12th Graders
130

*Beginnning in 2004, a revised set of questions on sedatives (barbiturates) was introduced. Refer to corresponding tables for further details.
Sedatives (Barbiturates):* Trends in Annual Prevalence by Population Density
0
5
10
15
20
'76 '78 '80 '82 '84 '86 '88 '90 '92 '94 '96 '98 '00 '02 '04 '06
Year
Large MSAOther MSANon-MSA
Perc
ent
12th Graders
131

*Beginnning in 2004, a revised set of questions on sedatives (barbiturates) was introduced. Refer to corresponding tables for further details.
Sedatives (Barbiturates):* Trends in Annual Prevalence by Parents' Average Education
0
5
10
15
20
'76 '78 '80 '82 '84 '86 '88 '90 '92 '94 '96 '98 '00 '02 '04 '06
Year
1 (Low)2345 (High)
Perc
ent
12th Graders
132

*Beginnning in 2004, a revised set of questions on sedatives (barbiturates) was introduced. Refer to corresponding tables for further details.
observation from the previous year).
Sedatives (Barbiturates):* Trends in Annual Prevalence by Race/Ethnicity**
**These graphs contain two-year moving averages (i.e., the mean of the observation in the indicated year plus the corresponding
0
5
10
15
20
'76 '78 '80 '82 '84 '86 '88 '90 '92 '94 '96 '98 '00 '02 '04 '06
Year
WhiteBlackHispanic
Perc
ent
12th Graders
133

*Beginnning in 2001, a revised set of questions on tranquilizer use was introduced. Refer to corresponding tables for further details.
Tranquilizers:* Trends in Annual Prevalence by Gender
0
5
10
15
20
'76 '78 '80 '82 '84 '86 '88 '90 '92 '94 '96 '98 '00 '02 '04 '06
Year
Male
Female
Perc
ent
0
5
10
15
20
'76 '78 '80 '82 '84 '86 '88 '90 '92 '94 '96 '98 '00 '02 '04 '06
Year
Male
Female
0
5
10
15
20
'76 '78 '80 '82 '84 '86 '88 '90 '92 '94 '96 '98 '00 '02 '04 '06
Year
Male
Female
Perc
ent
Perc
ent
8th Graders 10th Graders 12th Graders
134

*Beginnning in 2001, a revised set of questions on tranquilizer use was introduced. Refer to corresponding tables for further details.
Tranquilizers:* Trends in Annual Prevalence by College Plans
0
5
10
15
20
'76 '78 '80 '82 '84 '86 '88 '90 '92 '94 '96 '98 '00 '02 '04 '06
Year
< 4 yrs
Complete 4 yr
Perc
ent
0
5
10
15
20
'76 '78 '80 '82 '84 '86 '88 '90 '92 '94 '96 '98 '00 '02 '04 '06
Year
< 4 yrs
Complete 4 yr
0
5
10
15
20
'76 '78 '80 '82 '84 '86 '88 '90 '92 '94 '96 '98 '00 '02 '04 '06
Year
< 4 yrs
Complete 4 yr
Perc
ent
Perc
ent
8th Graders 10th Graders 12th Graders
135
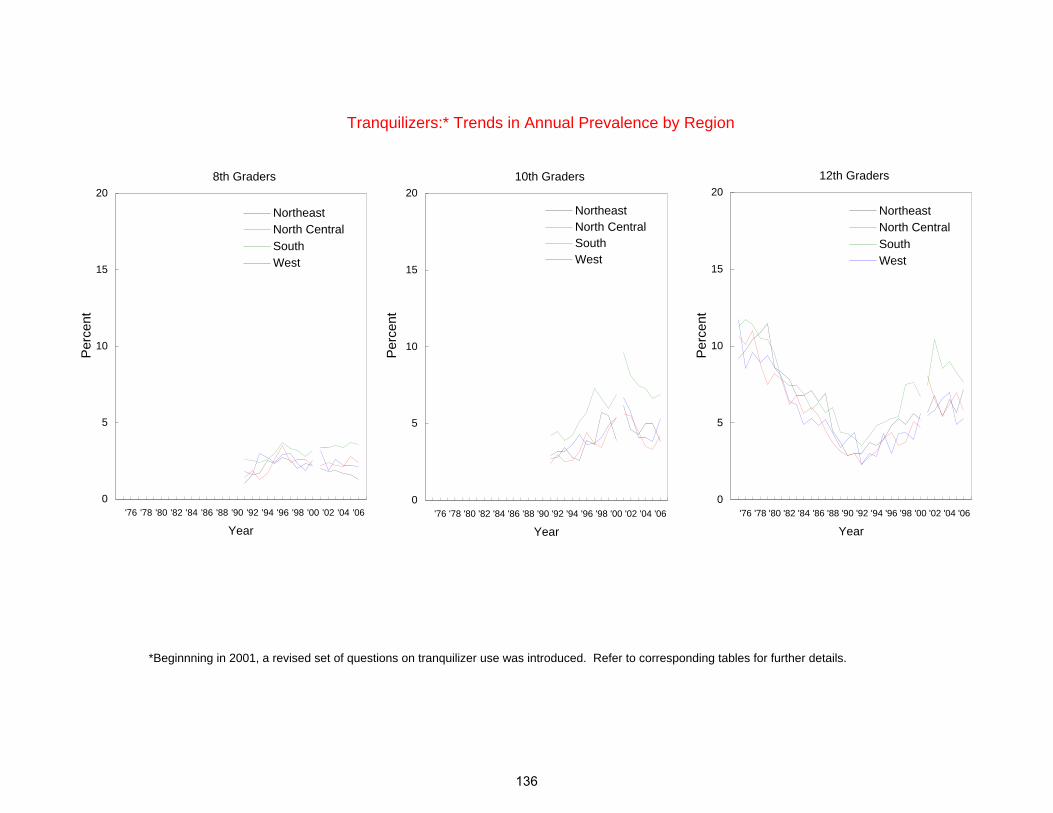
*Beginnning in 2001, a revised set of questions on tranquilizer use was introduced. Refer to corresponding tables for further details.
Tranquilizers:* Trends in Annual Prevalence by Region
0
5
10
15
20
'76 '78 '80 '82 '84 '86 '88 '90 '92 '94 '96 '98 '00 '02 '04 '06
Year
NortheastNorth CentralSouthWest
Perc
ent
0
5
10
15
20
'76 '78 '80 '82 '84 '86 '88 '90 '92 '94 '96 '98 '00 '02 '04 '06
Year
NortheastNorth CentralSouthWest
0
5
10
15
20
'76 '78 '80 '82 '84 '86 '88 '90 '92 '94 '96 '98 '00 '02 '04 '06
Year
NortheastNorth CentralSouthWest
Perc
ent
Perc
ent
8th Graders 10th Graders 12th Graders
136

*Beginnning in 2001, a revised set of questions on tranquilizer use was introduced. Refer to corresponding tables for further details.
Tranquilizers:* Trends in Annual Prevalence by Population Density
0
5
10
15
20
'76 '78 '80 '82 '84 '86 '88 '90 '92 '94 '96 '98 '00 '02 '04 '06
Year
Large MSAOther MSANon-MSA
Perc
ent
0
5
10
15
20
'76 '78 '80 '82 '84 '86 '88 '90 '92 '94 '96 '98 '00 '02 '04 '06
Year
Large MSAOther MSANon-MSA
0
5
10
15
20
'76 '78 '80 '82 '84 '86 '88 '90 '92 '94 '96 '98 '00 '02 '04 '06
Year
Large MSAOther MSANon-MSA
Perc
ent
Perc
ent
8th Graders 10th Graders 12th Graders
137

*Beginnning in 2001, a revised set of questions on tranquilizer use was introduced. Refer to corresponding tables for further details.
Tranquilizers:* Trends in Annual Prevalence by Parents' Average Education
0
5
10
15
20
'76 '78 '80 '82 '84 '86 '88 '90 '92 '94 '96 '98 '00 '02 '04 '06
Year
1 (Low)2345 (High)
Perc
ent
0
5
10
15
20
'76 '78 '80 '82 '84 '86 '88 '90 '92 '94 '96 '98 '00 '02 '04 '06
Year
1 (Low)2345 (High)
0
5
10
15
20
'76 '78 '80 '82 '84 '86 '88 '90 '92 '94 '96 '98 '00 '02 '04 '06
Year
1 (Low)2345 (High)
Perc
ent
Perc
ent
8th Graders 10th Graders 12th Graders
138

*Beginnning in 2001, a revised set of questions on tranquilizer use was introduced. Refer to corresponding tables for further details.
observation from the previous year).
Tranquilizers:* Trends in Annual Prevalence by Race/Ethnicity**
**These graphs contain two-year moving averages (i.e., the mean of the observation in the indicated year plus the corresponding
0
5
10
15
20
'76 '78 '80 '82 '84 '86 '88 '90 '92 '94 '96 '98 '00 '02 '04 '06
Year
WhiteBlackHispanic
Perc
ent
0
5
10
15
20
'76 '78 '80 '82 '84 '86 '88 '90 '92 '94 '96 '98 '00 '02 '04 '06
Year
WhiteBlackHispanic
0
5
10
15
20
'76 '78 '80 '82 '84 '86 '88 '90 '92 '94 '96 '98 '00 '02 '04 '06
Year
WhiteBlackHispanic
Perc
ent
Perc
ent
8th Graders 10th Graders 12th Graders
139

Rohypnol: Trends in Annual Prevalence by Gender
*The 2001 and 2002 data are not comparable due to changes in the questionnaire forms.
0
3
6
9
12
15
'76 '78 '80 '82 '84 '86 '88 '90 '92 '94 '96 '98 '00 '02 '04 '06
Year
Male
Female
Perc
ent
0
3
6
9
12
15
'76 '78 '80 '82 '84 '86 '88 '90 '92 '94 '96 '98 '00 '02 '04 '06
Year
Male
Female
0
3
6
9
12
15
'76 '78 '80 '82 '84 '86 '88 '90 '92 '94 '96 '98 '00 '02 '04 '06
Year
Male
Female
Perc
ent
Perc
ent
8th Graders 10th Graders 12th Graders*
140

Rohypnol: Trends in Annual Prevalence by College Plans
*The 2001 and 2002 data are not comparable due to changes in the questionnaire forms.
0
3
6
9
12
15
'76 '78 '80 '82 '84 '86 '88 '90 '92 '94 '96 '98 '00 '02 '04 '06
Year
< 4 yrs
Complete 4 yr
Perc
ent
0
3
6
9
12
15
'76 '78 '80 '82 '84 '86 '88 '90 '92 '94 '96 '98 '00 '02 '04 '06
Year
< 4 yrs
Complete 4 yr
0
3
6
9
12
15
'76 '78 '80 '82 '84 '86 '88 '90 '92 '94 '96 '98 '00 '02 '04 '06
Year
< 4 yrs
Complete 4 yr
Perc
ent
Perc
ent
8th Graders 10th Graders 12th Graders*
141

Rohypnol: Trends in Annual Prevalence by Region
*The 2001 and 2002 data are not comparable due to changes in the questionnaire forms.
0
3
6
9
12
15
'76 '78 '80 '82 '84 '86 '88 '90 '92 '94 '96 '98 '00 '02 '04 '06
Year
NortheastNorth CentralSouthWest
Perc
ent
0
3
6
9
12
15
'76 '78 '80 '82 '84 '86 '88 '90 '92 '94 '96 '98 '00 '02 '04 '06
Year
NortheastNorth CentralSouthWest
0
3
6
9
12
15
'76 '78 '80 '82 '84 '86 '88 '90 '92 '94 '96 '98 '00 '02 '04 '06
Year
NortheastNorth CentralSouthWest
Perc
ent
Perc
ent
8th Graders 10th Graders 12th Graders*
142

Rohypnol: Trends in Annual Prevalence by Population Density
*The 2001 and 2002 data are not comparable due to changes in the questionnaire forms.
0
3
6
9
12
15
'76 '78 '80 '82 '84 '86 '88 '90 '92 '94 '96 '98 '00 '02 '04 '06
Year
Large MSAOther MSANon-MSA
Perc
ent
0
3
6
9
12
15
'76 '78 '80 '82 '84 '86 '88 '90 '92 '94 '96 '98 '00 '02 '04 '06
Year
Large MSAOther MSANon-MSA
0
3
6
9
12
15
'76 '78 '80 '82 '84 '86 '88 '90 '92 '94 '96 '98 '00 '02 '04 '06
Year
Large MSAOther MSANon-MSA
Perc
ent
Perc
ent
8th Graders 10th Graders 12th Graders*
143

Rohypnol: Trends in Annual Prevalence by Parents' Average Education
*The 2001 and 2002 data are not comparable due to changes in the questionnaire forms.
0
3
6
9
12
15
'76 '78 '80 '82 '84 '86 '88 '90 '92 '94 '96 '98 '00 '02 '04 '06
Year
1 (Low)2345 (High)
Perc
ent
0
3
6
9
12
15
'76 '78 '80 '82 '84 '86 '88 '90 '92 '94 '96 '98 '00 '02 '04 '06
Year
1 (Low)2345 (High)
0
3
6
9
12
15
'76 '78 '80 '82 '84 '86 '88 '90 '92 '94 '96 '98 '00 '02 '04 '06
Year
1 (Low)2345 (High)
Perc
ent
Perc
ent
8th Graders 10th Graders 12th Graders*
144

observation from the previous year).
Rohypnol: Trends in Annual Prevalence by Race/Ethnicity**
**These graphs contain two-year moving averages (i.e., the mean of the observation in the indicated year plus the corresponding
*The 2001 and 2003 data are not comparable due to changes in the questionnaire forms.
0
3
6
9
12
15
'76 '78 '80 '82 '84 '86 '88 '90 '92 '94 '96 '98 '00 '02 '04 '06
Year
WhiteBlackHispanic
Perc
ent
0
3
6
9
12
15
'76 '78 '80 '82 '84 '86 '88 '90 '92 '94 '96 '98 '00 '02 '04 '06
Year
WhiteBlackHispanic
0
3
6
9
12
15
'76 '78 '80 '82 '84 '86 '88 '90 '92 '94 '96 '98 '00 '02 '04 '06
Year
WhiteBlackHispanic
Perc
ent
Perc
ent
8th Graders 10th Graders 12th Graders*
145

*Beginnning in 1993, a revised set of questions on alcohol use was introduced. Refer to corresponding tables for further details.
Alcohol:* Trends in 30-Day Prevalence by Gender
0
10
20
30
40
50
60
70
80
90
100
'76 '78 '80 '82 '84 '86 '88 '90 '92 '94 '96 '98 '00 '02 '04 '06
Year
Male
Female
Perc
ent
0
10
20
30
40
50
60
70
80
90
100
'76 '78 '80 '82 '84 '86 '88 '90 '92 '94 '96 '98 '00 '02 '04 '06
Year
Male
Female
0
10
20
30
40
50
60
70
80
90
100
'76 '78 '80 '82 '84 '86 '88 '90 '92 '94 '96 '98 '00 '02 '04 '06
Year
Male
Female
Perc
ent
Perc
ent
8th Graders 10th Graders 12th Graders
146

*Beginnning in 1993, a revised set of questions on alcohol use was introduced. Refer to corresponding tables for further details.
Alcohol:* Trends in 30-Day Prevalence by College Plans
0
10
20
30
40
50
60
70
80
90
100
'76 '78 '80 '82 '84 '86 '88 '90 '92 '94 '96 '98 '00 '02 '04 '06
Year
< 4 yrs
Complete 4 yr
Perc
ent
0
10
20
30
40
50
60
70
80
90
100
'76 '78 '80 '82 '84 '86 '88 '90 '92 '94 '96 '98 '00 '02 '04 '06
Year
< 4 yrs
Complete 4 yr
0
10
20
30
40
50
60
70
80
90
100
'76 '78 '80 '82 '84 '86 '88 '90 '92 '94 '96 '98 '00 '02 '04 '06
Year
< 4 yrs
Complete 4 yr
Perc
ent
Perc
ent
8th Graders 10th Graders 12th Graders
147

*Beginnning in 1993, a revised set of questions on alcohol use was introduced. Refer to corresponding tables for further details.
Alcohol:* Trends in 30-Day Prevalence by Region
0
10
20
30
40
50
60
70
80
90
100
'76 '78 '80 '82 '84 '86 '88 '90 '92 '94 '96 '98 '00 '02 '04 '06
Year
NortheastNorth CentralSouthWest
Perc
ent
0
10
20
30
40
50
60
70
80
90
100
'76 '78 '80 '82 '84 '86 '88 '90 '92 '94 '96 '98 '00 '02 '04 '06
Year
NortheastNorth CentralSouthWest
0
10
20
30
40
50
60
70
80
90
100
'76 '78 '80 '82 '84 '86 '88 '90 '92 '94 '96 '98 '00 '02 '04 '06
Year
NortheastNorth CentralSouthWest
Perc
ent
Perc
ent
8th Graders 10th Graders 12th Graders
148

*Beginnning in 1993, a revised set of questions on alcohol use was introduced. Refer to corresponding tables for further details.
Alcohol:* Trends in 30-Day Prevalence by Population Density
0
10
20
30
40
50
60
70
80
90
100
'76 '78 '80 '82 '84 '86 '88 '90 '92 '94 '96 '98 '00 '02 '04 '06
Year
Large MSAOther MSANon-MSA
Perc
ent
0
10
20
30
40
50
60
70
80
90
100
'76 '78 '80 '82 '84 '86 '88 '90 '92 '94 '96 '98 '00 '02 '04 '06
Year
Large MSAOther MSANon-MSA
0
10
20
30
40
50
60
70
80
90
100
'76 '78 '80 '82 '84 '86 '88 '90 '92 '94 '96 '98 '00 '02 '04 '06
Year
Large MSAOther MSANon-MSA
Perc
ent
Perc
ent
8th Graders 10th Graders 12th Graders
149

*Beginnning in 1993, a revised set of questions on alcohol use was introduced. Refer to corresponding tables for further details.
Alcohol:* Trends in 30-Day Prevalence by Parents' Average Education
0
10
20
30
40
50
60
70
80
90
100
'76 '78 '80 '82 '84 '86 '88 '90 '92 '94 '96 '98 '00 '02 '04 '06
Year
1 (Low)2345 (High)
Perc
ent
0
10
20
30
40
50
60
70
80
90
100
'76 '78 '80 '82 '84 '86 '88 '90 '92 '94 '96 '98 '00 '02 '04 '06
Year
1 (Low)2345 (High)
0
10
20
30
40
50
60
70
80
90
100
'76 '78 '80 '82 '84 '86 '88 '90 '92 '94 '96 '98 '00 '02 '04 '06
Year
1 (Low)2345 (High)
Perc
ent
Perc
ent
8th Graders 10th Graders 12th Graders
150

*Beginnning in 1993, a revised set of questions on alcohol use was introduced. Refer to corresponding tables for further details.
observation from the previous year).
Alcohol:* Trends in 30-Day Prevalence by Race/Ethnicity**
**These graphs contain two-year moving averages (i.e., the mean of the observation in the indicated year plus the corresponding
0
10
20
30
40
50
60
70
80
90
100
'76 '78 '80 '82 '84 '86 '88 '90 '92 '94 '96 '98 '00 '02 '04 '06
Year
WhiteBlackHispanic
Perc
ent
0
10
20
30
40
50
60
70
80
90
100
'76 '78 '80 '82 '84 '86 '88 '90 '92 '94 '96 '98 '00 '02 '04 '06
Year
WhiteBlackHispanic
0
10
20
30
40
50
60
70
80
90
100
'76 '78 '80 '82 '84 '86 '88 '90 '92 '94 '96 '98 '00 '02 '04 '06
Year
WhiteBlackHispanic
Perc
ent
Perc
ent
8th Graders 10th Graders 12th Graders
151

Alcohol: Trends in 30-Day Prevalence of Having Been Drunk by Gender
0
10
20
30
40
50
60
70
'76 '78 '80 '82 '84 '86 '88 '90 '92 '94 '96 '98 '00 '02 '04 '06
Year
Male
Female
Perc
ent
0
10
20
30
40
50
60
70
'76 '78 '80 '82 '84 '86 '88 '90 '92 '94 '96 '98 '00 '02 '04 '06
Year
Male
Female
0
10
20
30
40
50
60
70
'76 '78 '80 '82 '84 '86 '88 '90 '92 '94 '96 '98 '00 '02 '04 '06
Year
Male
Female
Perc
ent
Perc
ent
8th Graders 10th Graders 12th Graders
152

Alcohol: Trends in 30-Day Prevalence of Having Been Drunk by College Plans
0
10
20
30
40
50
60
70
'76 '78 '80 '82 '84 '86 '88 '90 '92 '94 '96 '98 '00 '02 '04 '06
Year
< 4 yrs
Complete 4 yr
Perc
ent
0
10
20
30
40
50
60
70
'76 '78 '80 '82 '84 '86 '88 '90 '92 '94 '96 '98 '00 '02 '04 '06
Year
< 4 yrs
Complete 4 yr
0
10
20
30
40
50
60
70
'76 '78 '80 '82 '84 '86 '88 '90 '92 '94 '96 '98 '00 '02 '04 '06
Year
< 4 yrs
Complete 4 yr
Perc
ent
Perc
ent
8th Graders 10th Graders 12th Graders
153

Alcohol: Trends in 30-Day Prevalence of Having Been Drunk by Region
0
10
20
30
40
50
60
70
'76 '78 '80 '82 '84 '86 '88 '90 '92 '94 '96 '98 '00 '02 '04 '06
Year
NortheastNorth CentralSouthWest
Perc
ent
0
10
20
30
40
50
60
70
'76 '78 '80 '82 '84 '86 '88 '90 '92 '94 '96 '98 '00 '02 '04 '06
Year
NortheastNorth CentralSouthWest
0
10
20
30
40
50
60
70
'76 '78 '80 '82 '84 '86 '88 '90 '92 '94 '96 '98 '00 '02 '04 '06
Year
NortheastNorth CentralSouthWest
Perc
ent
Perc
ent
8th Graders 10th Graders 12th Graders
154

Alcohol: Trends in 30-Day Prevalence of Having Been Drunk by Population Density
0
10
20
30
40
50
60
70
'76 '78 '80 '82 '84 '86 '88 '90 '92 '94 '96 '98 '00 '02 '04 '06
Year
Large MSAOther MSANon-MSA
Perc
ent
0
10
20
30
40
50
60
70
'76 '78 '80 '82 '84 '86 '88 '90 '92 '94 '96 '98 '00 '02 '04 '06
Year
Large MSAOther MSANon-MSA
0
10
20
30
40
50
60
70
'76 '78 '80 '82 '84 '86 '88 '90 '92 '94 '96 '98 '00 '02 '04 '06
Year
Large MSAOther MSANon-MSA
Perc
ent
Perc
ent
8th Graders 10th Graders 12th Graders
155

Alcohol: Trends in 30-Day Prevalence of Having Been Drunk by Parents' Average Education
0
10
20
30
40
50
60
70
'76 '78 '80 '82 '84 '86 '88 '90 '92 '94 '96 '98 '00 '02 '04 '06
Year
1 (Low)2345 (High)
Perc
ent
0
10
20
30
40
50
60
70
'76 '78 '80 '82 '84 '86 '88 '90 '92 '94 '96 '98 '00 '02 '04 '06
Year
1 (Low)2345 (High)
0
10
20
30
40
50
60
70
'76 '78 '80 '82 '84 '86 '88 '90 '92 '94 '96 '98 '00 '02 '04 '06
Year
1 (Low)2345 (High)
Perc
ent
Perc
ent
8th Graders 10th Graders 12th Graders
156

Alcohol: Trends in 30-Day Prevalence of Having Been Drunk by Race/Ethnicity*
observation from the previous year).*These graphs contain two-year moving averages (i.e., the mean of the observation in the indicated year plus the corresponding
0
10
20
30
40
50
60
70
'76 '78 '80 '82 '84 '86 '88 '90 '92 '94 '96 '98 '00 '02 '04 '06
Year
WhiteBlackHispanic
Perc
ent
0
10
20
30
40
50
60
70
'76 '78 '80 '82 '84 '86 '88 '90 '92 '94 '96 '98 '00 '02 '04 '06
Year
WhiteBlackHispanic
0
10
20
30
40
50
60
70
'76 '78 '80 '82 '84 '86 '88 '90 '92 '94 '96 '98 '00 '02 '04 '06
Year
WhiteBlackHispanic
Perc
ent
Perc
ent
8th Graders 10th Graders 12th Graders
157

Alcohol: Trends in Two-Week Prevalence of 5 or More Drinks in a Row by Gender
0
10
20
30
40
50
60
'76 '78 '80 '82 '84 '86 '88 '90 '92 '94 '96 '98 '00 '02 '04 '06
Year
Male
Female
Perc
ent
0
10
20
30
40
50
60
'76 '78 '80 '82 '84 '86 '88 '90 '92 '94 '96 '98 '00 '02 '04 '06
Year
Male
Female
0
10
20
30
40
50
60
'76 '78 '80 '82 '84 '86 '88 '90 '92 '94 '96 '98 '00 '02 '04 '06
Year
Male
Female
Perc
ent
Perc
ent
8th Graders 10th Graders 12th Graders
158

Alcohol: Trends in Two-Week Prevalence of 5 or More Drinks in a Row by College Plans
0
10
20
30
40
50
60
'76 '78 '80 '82 '84 '86 '88 '90 '92 '94 '96 '98 '00 '02 '04 '06
Year
< 4 yrs
Complete 4 yr
Perc
ent
0
10
20
30
40
50
60
'76 '78 '80 '82 '84 '86 '88 '90 '92 '94 '96 '98 '00 '02 '04 '06
Year
< 4 yrs
Complete 4 yr
0
10
20
30
40
50
60
'76 '78 '80 '82 '84 '86 '88 '90 '92 '94 '96 '98 '00 '02 '04 '06
Year
< 4 yrs
Complete 4 yr
Perc
ent
Perc
ent
8th Graders 10th Graders 12th Graders
159

Alcohol: Trends in Two-Week Prevalence of 5 or More Drinks in a Row by Region
0
10
20
30
40
50
60
'76 '78 '80 '82 '84 '86 '88 '90 '92 '94 '96 '98 '00 '02 '04 '06
Year
NortheastNorth CentralSouthWest
Perc
ent
0
10
20
30
40
50
60
'76 '78 '80 '82 '84 '86 '88 '90 '92 '94 '96 '98 '00 '02 '04 '06
Year
NortheastNorth CentralSouthWest
0
10
20
30
40
50
60
'76 '78 '80 '82 '84 '86 '88 '90 '92 '94 '96 '98 '00 '02 '04 '06
Year
NortheastNorth CentralSouthWest
Perc
ent
Perc
ent
8th Graders 10th Graders 12th Graders
160

Alcohol: Trends in Two-Week Prevalence of 5 or More Drinks in a Row by Population Density
0
10
20
30
40
50
60
'76 '78 '80 '82 '84 '86 '88 '90 '92 '94 '96 '98 '00 '02 '04 '06
Year
Large MSAOther MSANon-MSA
Perc
ent
0
10
20
30
40
50
60
'76 '78 '80 '82 '84 '86 '88 '90 '92 '94 '96 '98 '00 '02 '04 '06
Year
Large MSAOther MSANon-MSA
0
10
20
30
40
50
60
'76 '78 '80 '82 '84 '86 '88 '90 '92 '94 '96 '98 '00 '02 '04 '06
Year
Large MSAOther MSANon-MSA
Perc
ent
Perc
ent
8th Graders 10th Graders 12th Graders
161

Alcohol: Trends in Two-Week Prevalence of 5 or More Drinks in a Row by Parents' Average Education
0
10
20
30
40
50
60
'76 '78 '80 '82 '84 '86 '88 '90 '92 '94 '96 '98 '00 '02 '04 '06
Year
1 (Low)2345 (High)
Perc
ent
0
10
20
30
40
50
60
'76 '78 '80 '82 '84 '86 '88 '90 '92 '94 '96 '98 '00 '02 '04 '06
Year
1 (Low)2345 (High)
0
10
20
30
40
50
60
'76 '78 '80 '82 '84 '86 '88 '90 '92 '94 '96 '98 '00 '02 '04 '06
Year
1 (Low)2345 (High)
Perc
ent
Perc
ent
8th Graders 10th Graders 12th Graders
162
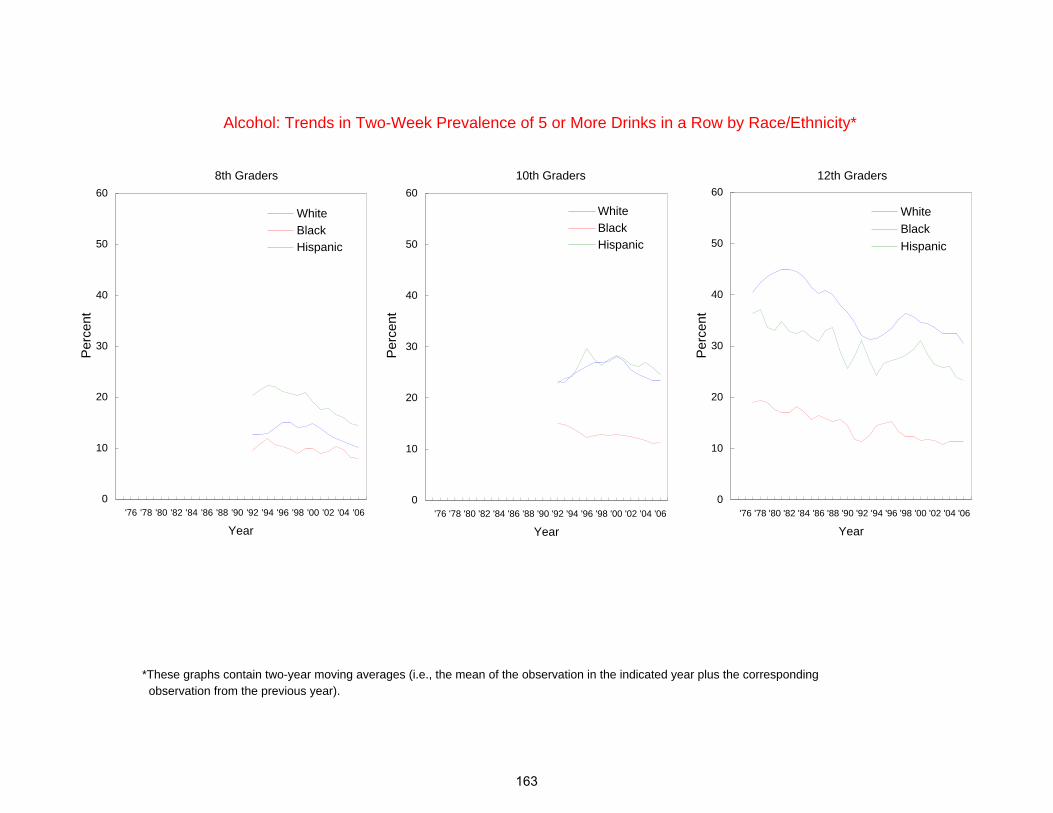
Alcohol: Trends in Two-Week Prevalence of 5 or More Drinks in a Row by Race/Ethnicity*
observation from the previous year).*These graphs contain two-year moving averages (i.e., the mean of the observation in the indicated year plus the corresponding
0
10
20
30
40
50
60
'76 '78 '80 '82 '84 '86 '88 '90 '92 '94 '96 '98 '00 '02 '04 '06
Year
WhiteBlackHispanic
Perc
ent
0
10
20
30
40
50
60
'76 '78 '80 '82 '84 '86 '88 '90 '92 '94 '96 '98 '00 '02 '04 '06
Year
WhiteBlackHispanic
0
10
20
30
40
50
60
'76 '78 '80 '82 '84 '86 '88 '90 '92 '94 '96 '98 '00 '02 '04 '06
Year
WhiteBlackHispanic
Perc
ent
Perc
ent
8th Graders 10th Graders 12th Graders
163

Beer: Trends in 30-Day Prevalence by Gender
0
10
20
30
40
50
60
70
80
90
100
'76 '78 '80 '82 '84 '86 '88 '90 '92 '94 '96 '98 '00 '02 '04 '06
Year
Male
Female
Perc
ent
0
10
20
30
40
50
60
70
80
90
100
'76 '78 '80 '82 '84 '86 '88 '90 '92 '94 '96 '98 '00 '02 '04 '06
Year
Male
Female
0
10
20
30
40
50
60
70
80
90
100
'76 '78 '80 '82 '84 '86 '88 '90 '92 '94 '96 '98 '00 '02 '04 '06
Year
Male
Female
Perc
ent
Perc
ent
8th Graders 10th Graders 12th Graders
164

Beer: Trends in 30-Day Prevalence by College Plans
0
10
20
30
40
50
60
70
80
90
100
'76 '78 '80 '82 '84 '86 '88 '90 '92 '94 '96 '98 '00 '02 '04 '06
Year
< 4 yrs
Complete 4 yr
Perc
ent
0
10
20
30
40
50
60
70
80
90
100
'76 '78 '80 '82 '84 '86 '88 '90 '92 '94 '96 '98 '00 '02 '04 '06
Year
< 4 yrs
Complete 4 yr
0
10
20
30
40
50
60
70
80
90
100
'76 '78 '80 '82 '84 '86 '88 '90 '92 '94 '96 '98 '00 '02 '04 '06
Year
< 4 yrs
Complete 4 yr
Perc
ent
Perc
ent
8th Graders 10th Graders 12th Graders
165

Beer: Trends in 30-Day Prevalence by Region
0
10
20
30
40
50
60
70
80
90
100
'76 '78 '80 '82 '84 '86 '88 '90 '92 '94 '96 '98 '00 '02 '04 '06
Year
NortheastNorth CentralSouthWest
Perc
ent
0
10
20
30
40
50
60
70
80
90
100
'76 '78 '80 '82 '84 '86 '88 '90 '92 '94 '96 '98 '00 '02 '04 '06
Year
NortheastNorth CentralSouthWest
0
10
20
30
40
50
60
70
80
90
100
'76 '78 '80 '82 '84 '86 '88 '90 '92 '94 '96 '98 '00 '02 '04 '06
Year
NortheastNorth CentralSouthWest
Perc
ent
Perc
ent
8th Graders 10th Graders 12th Graders
166

Beer: Trends in 30-Day Prevalence by Population Density
0
10
20
30
40
50
60
70
80
90
100
'76 '78 '80 '82 '84 '86 '88 '90 '92 '94 '96 '98 '00 '02 '04 '06
Year
Large MSAOther MSANon-MSA
Perc
ent
0
10
20
30
40
50
60
70
80
90
100
'76 '78 '80 '82 '84 '86 '88 '90 '92 '94 '96 '98 '00 '02 '04 '06
Year
Large MSAOther MSANon-MSA
0
10
20
30
40
50
60
70
80
90
100
'76 '78 '80 '82 '84 '86 '88 '90 '92 '94 '96 '98 '00 '02 '04 '06
Year
Large MSAOther MSANon-MSA
Perc
ent
Perc
ent
8th Graders 10th Graders 12th Graders
167

Beer: Trends in 30-Day Prevalence by Parents' Average Education
0
10
20
30
40
50
60
70
80
90
100
'76 '78 '80 '82 '84 '86 '88 '90 '92 '94 '96 '98 '00 '02 '04 '06
Year
1 (Low)2345 (High)
Perc
ent
0
10
20
30
40
50
60
70
80
90
100
'76 '78 '80 '82 '84 '86 '88 '90 '92 '94 '96 '98 '00 '02 '04 '06
Year
1 (Low)2345 (High)
0
10
20
30
40
50
60
70
80
90
100
'76 '78 '80 '82 '84 '86 '88 '90 '92 '94 '96 '98 '00 '02 '04 '06
Year
1 (Low)2345 (High)
Perc
ent
Perc
ent
8th Graders 10th Graders 12th Graders
168

Beer: Trends in 30-Day Prevalence by Race/Ethnicity*
observation from the previous year).*These graphs contain two-year moving averages (i.e., the mean of the observation in the indicated year plus the corresponding
0
10
20
30
40
50
60
70
80
90
100
'76 '78 '80 '82 '84 '86 '88 '90 '92 '94 '96 '98 '00 '02 '04 '06
Year
WhiteBlackHispanic
Perc
ent
0
10
20
30
40
50
60
70
80
90
100
'76 '78 '80 '82 '84 '86 '88 '90 '92 '94 '96 '98 '00 '02 '04 '06
Year
WhiteBlackHispanic
0
10
20
30
40
50
60
70
80
90
100
'76 '78 '80 '82 '84 '86 '88 '90 '92 '94 '96 '98 '00 '02 '04 '06
Year
WhiteBlackHispanic
Perc
ent
Perc
ent
8th Graders 10th Graders 12th Graders
169

Beer: Trends in Two-Week Prevalence of Five or More Drinks in a Row by Gender
0
10
20
30
40
50
60
'76 '78 '80 '82 '84 '86 '88 '90 '92 '94 '96 '98 '00 '02 '04 '06
Year
Male
Female
Perc
ent
0
10
20
30
40
50
60
'76 '78 '80 '82 '84 '86 '88 '90 '92 '94 '96 '98 '00 '02 '04 '06
Year
Male
Female
0
10
20
30
40
50
60
'76 '78 '80 '82 '84 '86 '88 '90 '92 '94 '96 '98 '00 '02 '04 '06
Year
Male
Female
Perc
ent
Perc
ent
8th Graders 10th Graders 12th Graders
170

Beer: Trends in Two-Week Prevalence of Five or More Drinks in a Row by College Plans
0
10
20
30
40
50
60
'76 '78 '80 '82 '84 '86 '88 '90 '92 '94 '96 '98 '00 '02 '04 '06
Year
< 4 yrs
Complete 4 yr
Perc
ent
0
10
20
30
40
50
60
'76 '78 '80 '82 '84 '86 '88 '90 '92 '94 '96 '98 '00 '02 '04 '06
Year
< 4 yrs
Complete 4 yr
0
10
20
30
40
50
60
'76 '78 '80 '82 '84 '86 '88 '90 '92 '94 '96 '98 '00 '02 '04 '06
Year
< 4 yrs
Complete 4 yr
Perc
ent
Perc
ent
8th Graders 10th Graders 12th Graders
171

Beer: Trends in Two-Week Prevalence of Five or More Drinks in a Row by Region
0
10
20
30
40
50
60
'76 '78 '80 '82 '84 '86 '88 '90 '92 '94 '96 '98 '00 '02 '04 '06
Year
NortheastNorth CentralSouthWest
Perc
ent
0
10
20
30
40
50
60
'76 '78 '80 '82 '84 '86 '88 '90 '92 '94 '96 '98 '00 '02 '04 '06
Year
NortheastNorth CentralSouthWest
0
10
20
30
40
50
60
'76 '78 '80 '82 '84 '86 '88 '90 '92 '94 '96 '98 '00 '02 '04 '06
Year
NortheastNorth CentralSouthWest
Perc
ent
Perc
ent
8th Graders 10th Graders 12th Graders
172

Beer: Trends in Two-Week Prevalence of Five or More Drinks in a Row by Population Density
0
10
20
30
40
50
60
'76 '78 '80 '82 '84 '86 '88 '90 '92 '94 '96 '98 '00 '02 '04 '06
Year
Large MSAOther MSANon-MSA
Perc
ent
0
10
20
30
40
50
60
'76 '78 '80 '82 '84 '86 '88 '90 '92 '94 '96 '98 '00 '02 '04 '06
Year
Large MSAOther MSANon-MSA
0
10
20
30
40
50
60
'76 '78 '80 '82 '84 '86 '88 '90 '92 '94 '96 '98 '00 '02 '04 '06
Year
Large MSAOther MSANon-MSA
Perc
ent
Perc
ent
8th Graders 10th Graders 12th Graders
173

Beer: Trends in Two-Week Prevalence of Five or More Drinks in a Row by Parents' Average Education
0
10
20
30
40
50
60
'76 '78 '80 '82 '84 '86 '88 '90 '92 '94 '96 '98 '00 '02 '04 '06
Year
1 (Low)2345 (High)
Perc
ent
0
10
20
30
40
50
60
'76 '78 '80 '82 '84 '86 '88 '90 '92 '94 '96 '98 '00 '02 '04 '06
Year
1 (Low)2345 (High)
0
10
20
30
40
50
60
'76 '78 '80 '82 '84 '86 '88 '90 '92 '94 '96 '98 '00 '02 '04 '06
Year
1 (Low)2345 (High)
Perc
ent
Perc
ent
8th Graders 10th Graders 12th Graders
174

Beer: Trends in Two-Week Prevalence of Five or More Drinks in a Row by Race/Ethnicity*
observation from the previous year).*These graphs contain two-year moving averages (i.e., the mean of the observation in the indicated year plus the corresponding
0
10
20
30
40
50
60
'76 '78 '80 '82 '84 '86 '88 '90 '92 '94 '96 '98 '00 '02 '04 '06
Year
WhiteBlackHispanic
Perc
ent
0
10
20
30
40
50
60
'76 '78 '80 '82 '84 '86 '88 '90 '92 '94 '96 '98 '00 '02 '04 '06
Year
WhiteBlackHispanic
0
10
20
30
40
50
60
'76 '78 '80 '82 '84 '86 '88 '90 '92 '94 '96 '98 '00 '02 '04 '06
Year
WhiteBlackHispanic
Perc
ent
Perc
ent
8th Graders 10th Graders 12th Graders
175

Liquor: Trends in 30-Day Prevalence by Gender
0
10
20
30
40
50
60
70
80
90
100
'76 '78 '80 '82 '84 '86 '88 '90 '92 '94 '96 '98 '00 '02 '04 '06
Year
Male
Female
Perc
ent
12th Graders
176

Liquor: Trends in 30-Day Prevalence by College Plans
0
10
20
30
40
50
60
70
80
90
100
'76 '78 '80 '82 '84 '86 '88 '90 '92 '94 '96 '98 '00 '02 '04 '06
Year
< 4 yrs
Complete 4 yr
Perc
ent
12th Graders
177

Liquor: Trends in 30-Day Prevalence by Region
0
10
20
30
40
50
60
70
80
90
100
'76 '78 '80 '82 '84 '86 '88 '90 '92 '94 '96 '98 '00 '02 '04 '06
Year
NortheastNorth CentralSouthWest
Perc
ent
12th Graders
178

Liquor: Trends in 30-Day Prevalence by Population Density
0
10
20
30
40
50
60
70
80
90
100
'76 '78 '80 '82 '84 '86 '88 '90 '92 '94 '96 '98 '00 '02 '04 '06
Year
Large MSAOther MSANon-MSA
Perc
ent
12th Graders
179

Liquor: Trends in 30-Day Prevalence by Parents' Average Education
0
10
20
30
40
50
60
70
80
90
100
'76 '78 '80 '82 '84 '86 '88 '90 '92 '94 '96 '98 '00 '02 '04 '06
Year
1 (Low)2345 (High)
Perc
ent
12th Graders
180
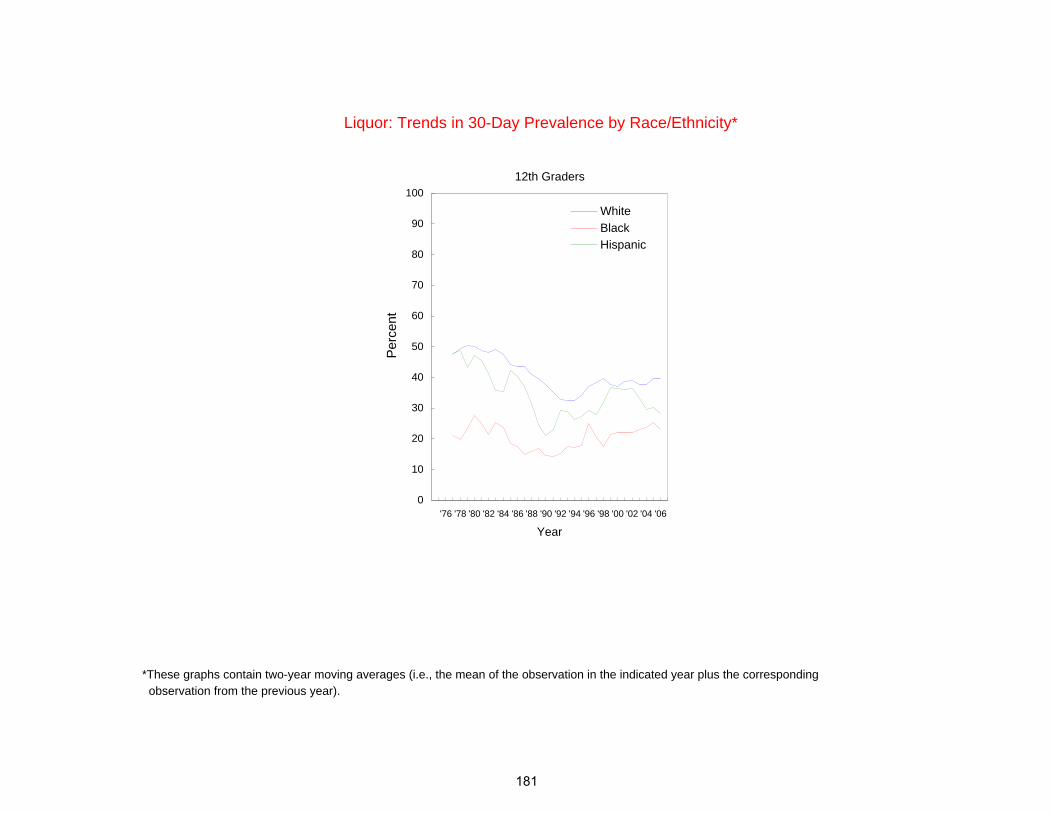
Liquor: Trends in 30-Day Prevalence by Race/Ethnicity*
observation from the previous year).*These graphs contain two-year moving averages (i.e., the mean of the observation in the indicated year plus the corresponding
0
10
20
30
40
50
60
70
80
90
100
'76 '78 '80 '82 '84 '86 '88 '90 '92 '94 '96 '98 '00 '02 '04 '06
Year
WhiteBlackHispanic
Perc
ent
12th Graders
181

Liquor: Trends in Two-Week Prevalence of Having 5 or More Drinks in a Row by Gender
0
10
20
30
40
50
60
'76 '78 '80 '82 '84 '86 '88 '90 '92 '94 '96 '98 '00 '02 '04 '06
Year
Male
Female
Perc
ent
12th Graders
182

Liquor: Trends in Two-Week Prevalence of Having 5 or More Drinks in a Row by College Plans
0
10
20
30
40
50
60
'76 '78 '80 '82 '84 '86 '88 '90 '92 '94 '96 '98 '00 '02 '04 '06
Year
< 4 yrs
Complete 4 yr
Perc
ent
12th Graders
183

Liquor: Trends in Two-Week Prevalence of Having 5 or More Drinks in a Row by Region
0
10
20
30
40
50
60
'76 '78 '80 '82 '84 '86 '88 '90 '92 '94 '96 '98 '00 '02 '04 '06
Year
NortheastNorth CentralSouthWest
Perc
ent
12th Graders
184

Liquor: Trends in Two-Week Prevalence of Having 5 or More Drinks in a Row by Population Density
0
10
20
30
40
50
60
'76 '78 '80 '82 '84 '86 '88 '90 '92 '94 '96 '98 '00 '02 '04 '06
Year
Large MSAOther MSANon-MSA
Perc
ent
12th Graders
185

Liquor: Trends in Two-Week Prevalence of Having 5 or More Drinks in a Row by Parents' Average Education
0
10
20
30
40
50
60
'76 '78 '80 '82 '84 '86 '88 '90 '92 '94 '96 '98 '00 '02 '04 '06
Year
1 (Low)2345 (High)
Perc
ent
12th Graders
186
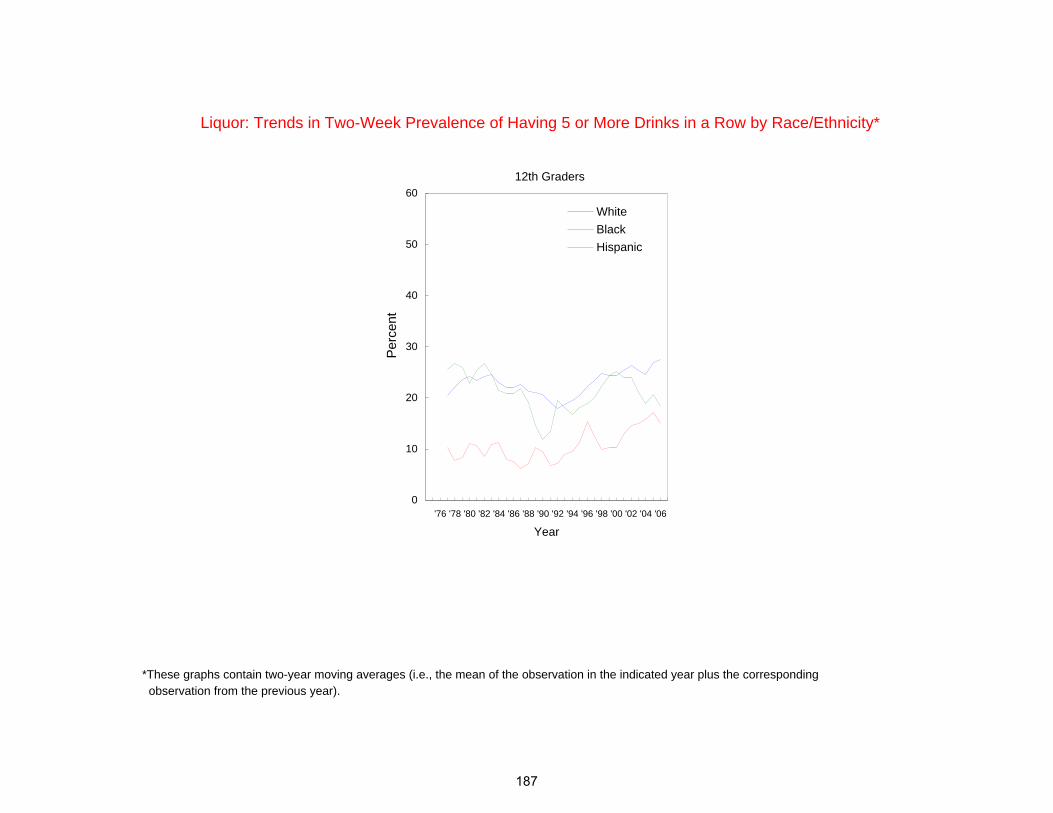
Liquor: Trends in Two-Week Prevalence of Having 5 or More Drinks in a Row by Race/Ethnicity*
observation from the previous year).*These graphs contain two-year moving averages (i.e., the mean of the observation in the indicated year plus the corresponding
0
10
20
30
40
50
60
'76 '78 '80 '82 '84 '86 '88 '90 '92 '94 '96 '98 '00 '02 '04 '06
Year
WhiteBlackHispanic
Perc
ent
12th Graders
187

Wine:* Trends in 30-Day Prevalence by Gender
1987 and 1988 use rates for wine. *In the 1988 questionnaires, a question on the use of wine coolers was added. This change may account for the discontinuity between the
0
10
20
30
40
50
60
70
80
90
100
'76 '78 '80 '82 '84 '86 '88 '90 '92 '94 '96 '98 '00 '02 '04 '06
Year
Male
Female
Perc
ent
12th Graders
188

Wine:* Trends in 30-Day Prevalence by College Plans
1987 and 1988 use rates for wine. *In the 1988 questionnaires, a question on the use of wine coolers was added. This change may account for the discontinuity between the
0
10
20
30
40
50
60
70
80
90
100
'76 '78 '80 '82 '84 '86 '88 '90 '92 '94 '96 '98 '00 '02 '04 '06
Year
< 4 yrs
Complete 4 yr
Perc
ent
12th Graders
189

Wine:* Trends in 30-Day Prevalence by Region
1987 and 1988 use rates for wine. *In the 1988 questionnaires, a question on the use of wine coolers was added. This change may account for the discontinuity between the
0
10
20
30
40
50
60
70
80
90
100
'76 '78 '80 '82 '84 '86 '88 '90 '92 '94 '96 '98 '00 '02 '04 '06
Year
NortheastNorth CentralSouthWest
Perc
ent
12th Graders
190

Wine:* Trends in 30-Day Prevalence by Population Density
1987 and 1988 use rates for wine. *In the 1988 questionnaires, a question on the use of wine coolers was added. This change may account for the discontinuity between the
0
10
20
30
40
50
60
70
80
90
100
'76 '78 '80 '82 '84 '86 '88 '90 '92 '94 '96 '98 '00 '02 '04 '06
Year
Large MSAOther MSANon-MSA
Perc
ent
12th Graders
191

Wine:* Trends in 30-Day Prevalence by Parents' Average Education
1987 and 1988 use rates for wine. *In the 1988 questionnaires, a question on the use of wine coolers was added. This change may account for the discontinuity between the
0
10
20
30
40
50
60
70
80
90
100
'76 '78 '80 '82 '84 '86 '88 '90 '92 '94 '96 '98 '00 '02 '04 '06
Year
1 (Low)2345 (High)
Perc
ent
12th Graders
192

observation from the previous year).
Wine:* Trends in 30-Day Prevalence by Race/Ethnicity**
**These graphs contain two-year moving averages (i.e., the mean of the observation in the indicated year plus the corresponding
*In the 1988 questionnaires, a question on the use of wine coolers was added. This change may account for the discontinuity between the 1987 and 1988 use rates for wine.
0
10
20
30
40
50
60
70
80
90
100
'76 '78 '80 '82 '84 '86 '88 '90 '92 '94 '96 '98 '00 '02 '04 '06
Year
WhiteBlackHispanic
Perc
ent
12th Graders
193

Wine:* Trends in Two-Week Prevalence of Having 5 or More Drinks in a Row by Gender
1987 and 1988 use rates for wine. *In the 1988 questionnaires, a question on the use of wine coolers was added. This change may account for the discontinuity between the
0
10
20
30
40
50
60
'76 '78 '80 '82 '84 '86 '88 '90 '92 '94 '96 '98 '00 '02 '04 '06
Year
Male
Female
Perc
ent
12th Graders
194

Wine:* Trends in Two-Week Prevalence of Having 5 or More Drinks in a Row by College Plans
1987 and 1988 use rates for wine. *In the 1988 questionnaires, a question on the use of wine coolers was added. This change may account for the discontinuity between the
0
10
20
30
40
50
60
'76 '78 '80 '82 '84 '86 '88 '90 '92 '94 '96 '98 '00 '02 '04 '06
Year
< 4 yrs
Complete 4 yr
Perc
ent
12th Graders
195

Wine:* Trends in Two-Week Prevalence of Having 5 or More Drinks in a Row by Region
1987 and 1988 use rates for wine. *In the 1988 questionnaires, a question on the use of wine coolers was added. This change may account for the discontinuity between the
0
10
20
30
40
50
60
'76 '78 '80 '82 '84 '86 '88 '90 '92 '94 '96 '98 '00 '02 '04 '06
Year
NortheastNorth CentralSouthWest
Perc
ent
12th Graders
196

Wine:* Trends in Two-Week Prevalence of Having 5 or More Drinks in a Row by Population Density
1987 and 1988 use rates for wine. *In the 1988 questionnaires, a question on the use of wine coolers was added. This change may account for the discontinuity between the
0
10
20
30
40
50
60
'76 '78 '80 '82 '84 '86 '88 '90 '92 '94 '96 '98 '00 '02 '04 '06
Year
Large MSAOther MSANon-MSA
Perc
ent
12th Graders
197

Wine:* Trends in Two-Week Prevalence of Having 5 or More Drinks in a Row by Parents' Average Education
1987 and 1988 use rates for wine. *In the 1988 questionnaires, a question on the use of wine coolers was added. This change may account for the discontinuity between the
0
10
20
30
40
50
60
'76 '78 '80 '82 '84 '86 '88 '90 '92 '94 '96 '98 '00 '02 '04 '06
Year
1 (Low)2345 (High)
Perc
ent
12th Graders
198

observation from the previous year).
Wine:* Trends in Two-Week Prevalence of Having 5 or More Drinks in a Row by Race/Ethnicity**
**These graphs contain two-year moving averages (i.e., the mean of the observation in the indicated year plus the corresponding
*In the 1988 questionnaires, a question on the use of wine coolers was added. This change may account for the discontinuity between the 1987 and 1988 use rates for wine.
0
10
20
30
40
50
60
'76 '78 '80 '82 '84 '86 '88 '90 '92 '94 '96 '98 '00 '02 '04 '06
Year
WhiteBlackHispanic
Perc
ent
12th Graders
199

Wine Coolers: Trends in 30-Day Prevalence by Gender
*Question discontinued for eighth and tenth graders in 2004.
0
10
20
30
40
50
60
70
80
90
100
'76 '78 '80 '82 '84 '86 '88 '90 '92 '94 '96 '98 '00 '02 '04 '06
Year
Male
Female
Perc
ent
0
10
20
30
40
50
60
70
80
90
100
'76 '78 '80 '82 '84 '86 '88 '90 '92 '94 '96 '98 '00 '02 '04 '06
Year
Male
Female
0
10
20
30
40
50
60
70
80
90
100
'76 '78 '80 '82 '84 '86 '88 '90 '92 '94 '96 '98 '00 '02 '04 '06
Year
Male
Female
Perc
ent
Perc
ent
8th Graders* 10th Graders* 12th Graders
200

Wine Coolers: Trends in 30-Day Prevalence by College Plans
*Question discontinued for eighth and tenth graders in 2004.
0
10
20
30
40
50
60
70
80
90
100
'76 '78 '80 '82 '84 '86 '88 '90 '92 '94 '96 '98 '00 '02 '04 '06
Year
< 4 yrs
Complete 4 yr
Perc
ent
0
10
20
30
40
50
60
70
80
90
100
'76 '78 '80 '82 '84 '86 '88 '90 '92 '94 '96 '98 '00 '02 '04 '06
Year
< 4 yrs
Complete 4 yr
0
10
20
30
40
50
60
70
80
90
100
'76 '78 '80 '82 '84 '86 '88 '90 '92 '94 '96 '98 '00 '02 '04 '06
Year
< 4 yrs
Complete 4 yr
Perc
ent
Perc
ent
8th Graders* 10th Graders* 12th Graders
201

Wine Coolers: Trends in 30-Day Prevalence by Region
*Question discontinued for eighth and tenth graders in 2004.
0
10
20
30
40
50
60
70
80
90
100
'76 '78 '80 '82 '84 '86 '88 '90 '92 '94 '96 '98 '00 '02 '04 '06
Year
NortheastNorth CentralSouthWest
Perc
ent
0
10
20
30
40
50
60
70
80
90
100
'76 '78 '80 '82 '84 '86 '88 '90 '92 '94 '96 '98 '00 '02 '04 '06
Year
NortheastNorth CentralSouthWest
0
10
20
30
40
50
60
70
80
90
100
'76 '78 '80 '82 '84 '86 '88 '90 '92 '94 '96 '98 '00 '02 '04 '06
Year
NortheastNorth CentralSouthWest
Perc
ent
Perc
ent
8th Graders* 10th Graders* 12th Graders
202

Wine Coolers: Trends in 30-Day Prevalence by Population Density
*Question discontinued for eighth and tenth graders in 2004.
0
10
20
30
40
50
60
70
80
90
100
'76 '78 '80 '82 '84 '86 '88 '90 '92 '94 '96 '98 '00 '02 '04 '06
Year
Large MSAOther MSANon-MSA
Perc
ent
0
10
20
30
40
50
60
70
80
90
100
'76 '78 '80 '82 '84 '86 '88 '90 '92 '94 '96 '98 '00 '02 '04 '06
Year
Large MSAOther MSANon-MSA
0
10
20
30
40
50
60
70
80
90
100
'76 '78 '80 '82 '84 '86 '88 '90 '92 '94 '96 '98 '00 '02 '04 '06
Year
Large MSAOther MSANon-MSA
Perc
ent
Perc
ent
8th Graders* 10th Graders* 12th Graders
203

Wine Coolers: Trends in 30-Day Prevalence by Parents' Average Education
*Question discontinued for eighth and tenth graders in 2004.
0
10
20
30
40
50
60
70
80
90
100
'76 '78 '80 '82 '84 '86 '88 '90 '92 '94 '96 '98 '00 '02 '04 '06
Year
1 (Low)2345 (High)
Perc
ent
0
10
20
30
40
50
60
70
80
90
100
'76 '78 '80 '82 '84 '86 '88 '90 '92 '94 '96 '98 '00 '02 '04 '06
Year
1 (Low)2345 (High)
0
10
20
30
40
50
60
70
80
90
100
'76 '78 '80 '82 '84 '86 '88 '90 '92 '94 '96 '98 '00 '02 '04 '06
Year
1 (Low)2345 (High)
Perc
ent
Perc
ent
8th Graders* 10th Graders* 12th Graders
204

observation from the previous year).
Wine Coolers: Trends in 30-Day Prevalence by Race/Ethnicity**
**These graphs contain two-year moving averages (i.e., the mean of the observation in the indicated year plus the corresponding
*Question discontinued for eighth and tenth graders in 2004.
0
10
20
30
40
50
60
70
80
90
100
'76 '78 '80 '82 '84 '86 '88 '90 '92 '94 '96 '98 '00 '02 '04 '06
Year
WhiteBlackHispanic
Perc
ent
0
10
20
30
40
50
60
70
80
90
100
'76 '78 '80 '82 '84 '86 '88 '90 '92 '94 '96 '98 '00 '02 '04 '06
Year
WhiteBlackHispanic
0
10
20
30
40
50
60
70
80
90
100
'76 '78 '80 '82 '84 '86 '88 '90 '92 '94 '96 '98 '00 '02 '04 '06
Year
WhiteBlackHispanic
Perc
ent
Perc
ent
8th Graders* 10th Graders* 12th Graders
205

Wine Coolers: Trends in Two-Week Prevalence of Having 5 or More Drinks in a Row by Gender
0
10
20
30
40
50
60
'76 '78 '80 '82 '84 '86 '88 '90 '92 '94 '96 '98 '00 '02 '04 '06
Year
Male
Female
Perc
ent
12th Graders
206

Wine Coolers: Trends in Two-Week Prevalence of Having 5 or More Drinks in a Row by College Plans
0
10
20
30
40
50
60
'76 '78 '80 '82 '84 '86 '88 '90 '92 '94 '96 '98 '00 '02 '04 '06
Year
< 4 yrs
Complete 4 yr
Perc
ent
12th Graders
207

Wine Coolers: Trends in Two-Week Prevalence of Having 5 or More Drinks in a Row by Region
0
10
20
30
40
50
60
'76 '78 '80 '82 '84 '86 '88 '90 '92 '94 '96 '98 '00 '02 '04 '06
Year
NortheastNorth CentralSouthWest
Perc
ent
12th Graders
208
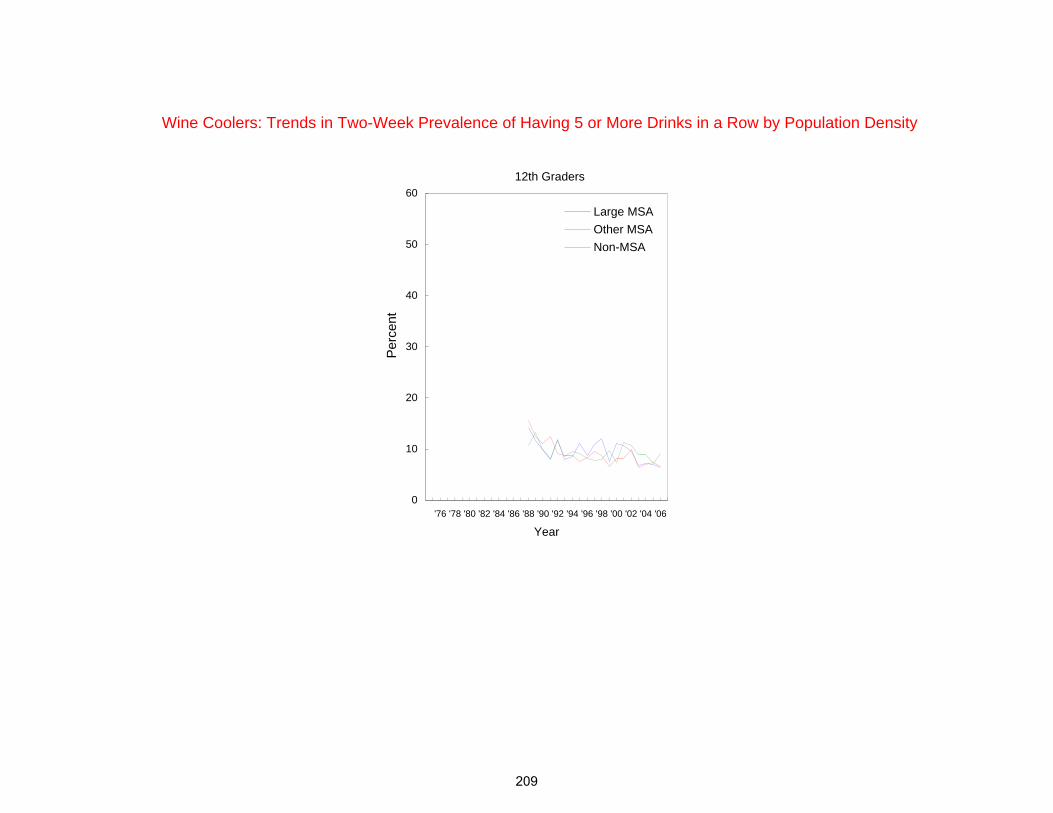
Wine Coolers: Trends in Two-Week Prevalence of Having 5 or More Drinks in a Row by Population Density
0
10
20
30
40
50
60
'76 '78 '80 '82 '84 '86 '88 '90 '92 '94 '96 '98 '00 '02 '04 '06
Year
Large MSAOther MSANon-MSA
Perc
ent
12th Graders
209
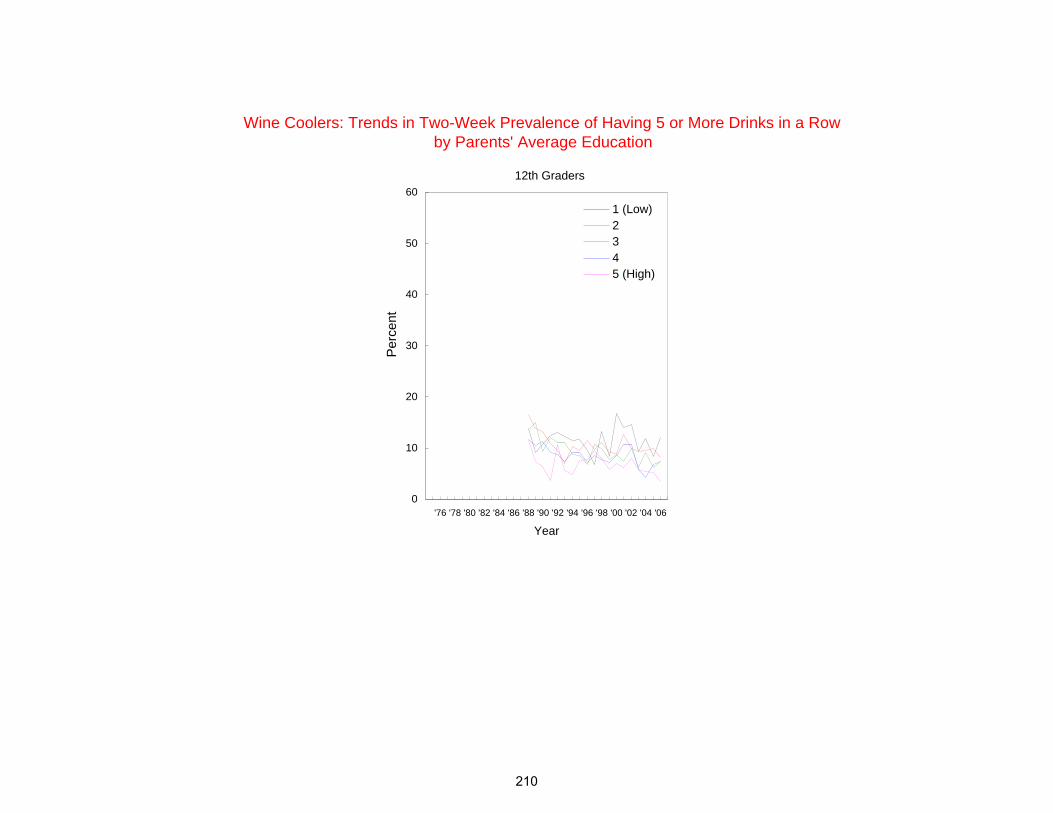
Wine Coolers: Trends in Two-Week Prevalence of Having 5 or More Drinks in a Rowby Parents' Average Education
0
10
20
30
40
50
60
'76 '78 '80 '82 '84 '86 '88 '90 '92 '94 '96 '98 '00 '02 '04 '06
Year
1 (Low)2345 (High)
Perc
ent
12th Graders
210

*These graphs contain two-year moving averages (i.e., the mean of the observation in the indicated year plus the corresponding observation from the previous year).
Wine Coolers: Trends in Two-Week Prevalence of Having 5 or More Drinks in a Row by Race/Ethnicity*
0
10
20
30
40
50
60
'76 '78 '80 '82 '84 '86 '88 '90 '92 '94 '96 '98 '00 '02 '04 '06
Year
WhiteBlackHispanic
Perc
ent
12th Graders
211

Flavored Alcoholic Beverages: Trends in 30-Day Prevalence by Gender
0
10
20
30
40
50
60
70
80
90
100
'76 '78 '80 '82 '84 '86 '88 '90 '92 '94 '96 '98 '00 '02 '04 '06
Year
Male
Female
Perc
ent
0
10
20
30
40
50
60
70
80
90
100
'76 '78 '80 '82 '84 '86 '88 '90 '92 '94 '96 '98 '00 '02 '04 '06
Year
Male
Female
0
10
20
30
40
50
60
70
80
90
100
'76 '78 '80 '82 '84 '86 '88 '90 '92 '94 '96 '98 '00 '02 '04 '06
Year
Male
Female
Perc
ent
Perc
ent
8th Graders 10th Graders 12th Graders
212

Flavored Alcoholic Bevarages: Trends in 30-Day Prevalence by College Plans
0
10
20
30
40
50
60
70
80
90
100
'76 '78 '80 '82 '84 '86 '88 '90 '92 '94 '96 '98 '00 '02 '04 '06
Year
< 4 yrs
Complete 4 yr
Perc
ent
0
10
20
30
40
50
60
70
80
90
100
'76 '78 '80 '82 '84 '86 '88 '90 '92 '94 '96 '98 '00 '02 '04 '06
Year
< 4 yrs
Complete 4 yr
0
10
20
30
40
50
60
70
80
90
100
'76 '78 '80 '82 '84 '86 '88 '90 '92 '94 '96 '98 '00 '02 '04 '06
Year
< 4 yrs
Complete 4 yr
Perc
ent
Perc
ent
8th Graders* 10th Graders* 12th Graders
213

Flavored Alcoholic Beverages: Trends in 30-Day Prevalence by Region
0
10
20
30
40
50
60
70
80
90
100
'76 '78 '80 '82 '84 '86 '88 '90 '92 '94 '96 '98 '00 '02 '04 '06
Year
NortheastNorth CentralSouthWest
Perc
ent
0
10
20
30
40
50
60
70
80
90
100
'76 '78 '80 '82 '84 '86 '88 '90 '92 '94 '96 '98 '00 '02 '04 '06
Year
NortheastNorth CentralSouthWest
0
10
20
30
40
50
60
70
80
90
100
'76 '78 '80 '82 '84 '86 '88 '90 '92 '94 '96 '98 '00 '02 '04 '06
Year
NortheastNorth CentralSouthWest
Perc
ent
Perc
ent
8th Graders 10th Graders 12th Graders
214

Flavored Alcoholic Beverages: Trends in 30-Day Prevalence by Population Density
0
10
20
30
40
50
60
70
80
90
100
'76 '78 '80 '82 '84 '86 '88 '90 '92 '94 '96 '98 '00 '02 '04 '06
Year
Large MSAOther MSANon-MSA
Perc
ent
0
10
20
30
40
50
60
70
80
90
100
'76 '78 '80 '82 '84 '86 '88 '90 '92 '94 '96 '98 '00 '02 '04 '06
Year
Large MSAOther MSANon-MSA
0
10
20
30
40
50
60
70
80
90
100
'76 '78 '80 '82 '84 '86 '88 '90 '92 '94 '96 '98 '00 '02 '04 '06
Year
Large MSAOther MSANon-MSA
Perc
ent
Perc
ent
8th Graders 10th Graders 12th Graders
215

Flavored Alcoholic Beverages: Trends in 30-Day Prevalence by Parents' Average Education
0
10
20
30
40
50
60
70
80
90
100
'76 '78 '80 '82 '84 '86 '88 '90 '92 '94 '96 '98 '00 '02 '04 '06
Year
1 (Low)2345 (High)
Perc
ent
0
10
20
30
40
50
60
70
80
90
100
'76 '78 '80 '82 '84 '86 '88 '90 '92 '94 '96 '98 '00 '02 '04 '06
Year
1 (Low)2345 (High)
0
10
20
30
40
50
60
70
80
90
100
'76 '78 '80 '82 '84 '86 '88 '90 '92 '94 '96 '98 '00 '02 '04 '06
Year
1 (Low)2345 (High)
Perc
ent
Perc
ent
8th Graders* 10th Graders* 12th Graders
216

observation from the previous year).
Flavored Alcoholic Beverages: Trends in 30-Day Prevalence by Race/Ethnicity**
**These graphs contain two-year moving averages (i.e., the mean of the observation in the indicated year plus the corresponding
0
10
20
30
40
50
60
70
80
90
100
'76 '78 '80 '82 '84 '86 '88 '90 '92 '94 '96 '98 '00 '02 '04 '06
Year
WhiteBlackHispanic
Perc
ent
0
10
20
30
40
50
60
70
80
90
100
'76 '78 '80 '82 '84 '86 '88 '90 '92 '94 '96 '98 '00 '02 '04 '06
Year
WhiteBlackHispanic
0
10
20
30
40
50
60
70
80
90
100
'76 '78 '80 '82 '84 '86 '88 '90 '92 '94 '96 '98 '00 '02 '04 '06
Year
WhiteBlackHispanic
Perc
ent
Perc
ent
8th Graders* 10th Graders* 12th Graders
217

Cigarettes: Trends in 30-Day Prevalence by Gender
0
10
20
30
40
50
'76 '78 '80 '82 '84 '86 '88 '90 '92 '94 '96 '98 '00 '02 '04 '06
Year
Male
Female
Perc
ent
0
10
20
30
40
50
'76 '78 '80 '82 '84 '86 '88 '90 '92 '94 '96 '98 '00 '02 '04 '06
Year
Male
Female
0
10
20
30
40
50
'76 '78 '80 '82 '84 '86 '88 '90 '92 '94 '96 '98 '00 '02 '04 '06
Year
Male
Female
Perc
ent
Perc
ent
8th Graders 10th Graders 12th Graders
218

Cigarettes: Trends in 30-Day Prevalence by College Plans
0
10
20
30
40
50
'76 '78 '80 '82 '84 '86 '88 '90 '92 '94 '96 '98 '00 '02 '04 '06
Year
< 4 yrs
Complete 4 yr
Perc
ent
0
10
20
30
40
50
'76 '78 '80 '82 '84 '86 '88 '90 '92 '94 '96 '98 '00 '02 '04 '06
Year
< 4 yrs
Complete 4 yr
0
10
20
30
40
50
'76 '78 '80 '82 '84 '86 '88 '90 '92 '94 '96 '98 '00 '02 '04 '06
Year
< 4 yrs
Complete 4 yr
Perc
ent
Perc
ent
8th Graders 10th Graders 12th Graders
219

Cigarettes: Trends in 30-Day Prevalence by Region
0
10
20
30
40
50
'76 '78 '80 '82 '84 '86 '88 '90 '92 '94 '96 '98 '00 '02 '04 '06
Year
NortheastNorth CentralSouthWest
Perc
ent
0
10
20
30
40
50
'76 '78 '80 '82 '84 '86 '88 '90 '92 '94 '96 '98 '00 '02 '04 '06
Year
NortheastNorth CentralSouthWest
0
10
20
30
40
50
'76 '78 '80 '82 '84 '86 '88 '90 '92 '94 '96 '98 '00 '02 '04 '06
Year
NortheastNorth CentralSouthWest
Perc
ent
Perc
ent
8th Graders 10th Graders 12th Graders
220

Cigarettes: Trends in 30-Day Prevalence by Population Density
0
10
20
30
40
50
'76 '78 '80 '82 '84 '86 '88 '90 '92 '94 '96 '98 '00 '02 '04 '06
Year
Large MSAOther MSANon-MSA
Perc
ent
0
10
20
30
40
50
'76 '78 '80 '82 '84 '86 '88 '90 '92 '94 '96 '98 '00 '02 '04 '06
Year
Large MSAOther MSANon-MSA
0
10
20
30
40
50
'76 '78 '80 '82 '84 '86 '88 '90 '92 '94 '96 '98 '00 '02 '04 '06
Year
Large MSAOther MSANon-MSA
Perc
ent
Perc
ent
8th Graders 10th Graders 12th Graders
221

Cigarettes: Trends in 30-Day Prevalence by Parents' Average Education
0
10
20
30
40
50
'76 '78 '80 '82 '84 '86 '88 '90 '92 '94 '96 '98 '00 '02 '04 '06
Year
1 (Low)2345 (High)
Perc
ent
0
10
20
30
40
50
'76 '78 '80 '82 '84 '86 '88 '90 '92 '94 '96 '98 '00 '02 '04 '06
Year
1 (Low)2345 (High)
0
10
20
30
40
50
'76 '78 '80 '82 '84 '86 '88 '90 '92 '94 '96 '98 '00 '02 '04 '06
Year
1 (Low)2345 (High)
Perc
ent
Perc
ent
8th Graders 10th Graders 12th Graders
222

Cigarettes: Trends in 30-Day Prevalence by Race/Ethnicity*
observation from the previous year).*These graphs contain two-year moving averages (i.e., the mean of the observation in the indicated year plus the corresponding
0
10
20
30
40
50
'76 '78 '80 '82 '84 '86 '88 '90 '92 '94 '96 '98 '00 '02 '04 '06
Year
WhiteBlackHispanic
Perc
ent
0
10
20
30
40
50
'76 '78 '80 '82 '84 '86 '88 '90 '92 '94 '96 '98 '00 '02 '04 '06
Year
WhiteBlackHispanic
0
10
20
30
40
50
'76 '78 '80 '82 '84 '86 '88 '90 '92 '94 '96 '98 '00 '02 '04 '06
Year
WhiteBlackHispanic
Perc
ent
Perc
ent
8th Graders 10th Graders 12th Graders
223
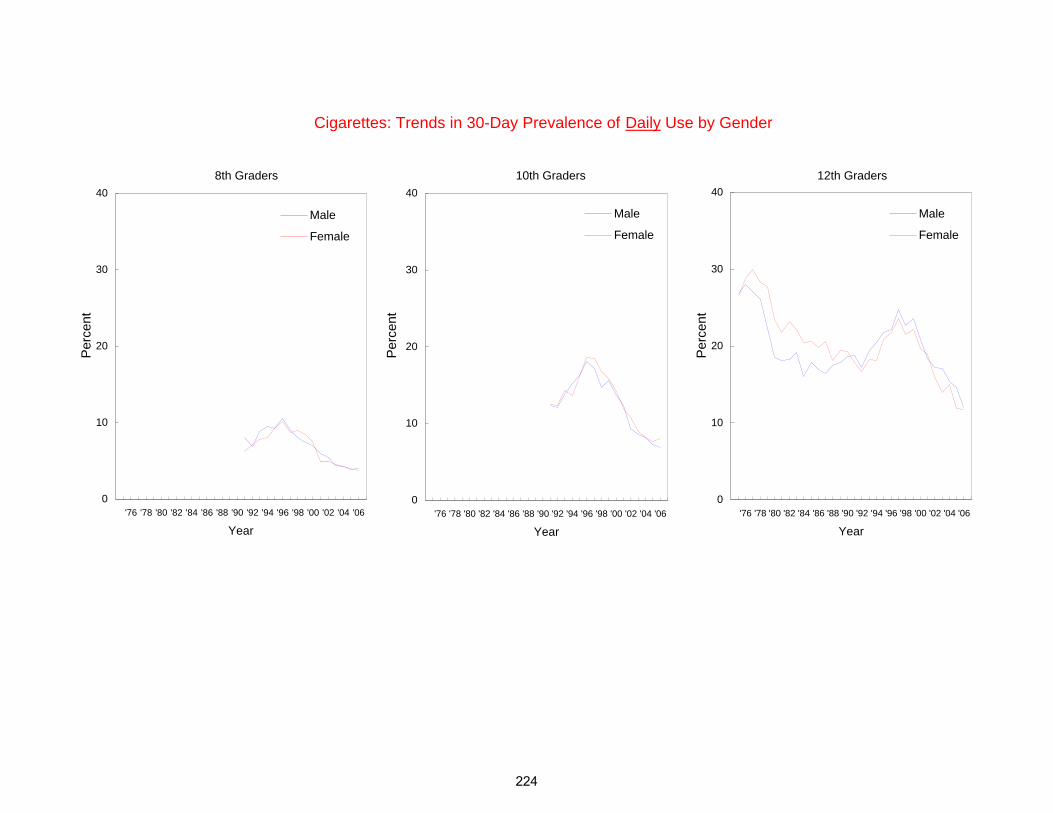
Cigarettes: Trends in 30-Day Prevalence of Daily Use by Gender
0
10
20
30
40
'76 '78 '80 '82 '84 '86 '88 '90 '92 '94 '96 '98 '00 '02 '04 '06
Year
Male
Female
Perc
ent
0
10
20
30
40
'76 '78 '80 '82 '84 '86 '88 '90 '92 '94 '96 '98 '00 '02 '04 '06
Year
Male
Female
0
10
20
30
40
'76 '78 '80 '82 '84 '86 '88 '90 '92 '94 '96 '98 '00 '02 '04 '06
Year
Male
Female
Perc
ent
Perc
ent
8th Graders 10th Graders 12th Graders
224

Cigarettes: Trends in 30-Day Prevalence of Daily Use by College Plans
0
10
20
30
40
'76 '78 '80 '82 '84 '86 '88 '90 '92 '94 '96 '98 '00 '02 '04 '06
Year
< 4 yrs
Complete 4 yr
Perc
ent
0
10
20
30
40
'76 '78 '80 '82 '84 '86 '88 '90 '92 '94 '96 '98 '00 '02 '04 '06
Year
< 4 yrs
Complete 4 yr0
10
20
30
40
'76 '78 '80 '82 '84 '86 '88 '90 '92 '94 '96 '98 '00 '02 '04 '06
Year
< 4 yrs
Complete 4 yr
Perc
ent
Perc
ent
8th Graders 10th Graders 12th Graders
225

Cigarettes: Trends in 30-Day Prevalence of Daily Use by Region
0
10
20
30
40
'76 '78 '80 '82 '84 '86 '88 '90 '92 '94 '96 '98 '00 '02 '04 '06
Year
NortheastNorth CentralSouthWest
Perc
ent
0
10
20
30
40
'76 '78 '80 '82 '84 '86 '88 '90 '92 '94 '96 '98 '00 '02 '04 '06
Year
NortheastNorth CentralSouthWest
0
10
20
30
40
'76 '78 '80 '82 '84 '86 '88 '90 '92 '94 '96 '98 '00 '02 '04 '06
Year
NortheastNorth CentralSouthWest
Perc
ent
Perc
ent
8th Graders 10th Graders 12th Graders
226

Cigarettes: Trends in 30-Day Prevalence of Daily Use by Population Density
0
10
20
30
40
'76 '78 '80 '82 '84 '86 '88 '90 '92 '94 '96 '98 '00 '02 '04 '06
Year
Large MSAOther MSANon-MSA
Perc
ent
0
10
20
30
40
'76 '78 '80 '82 '84 '86 '88 '90 '92 '94 '96 '98 '00 '02 '04 '06
Year
Large MSAOther MSANon-MSA
0
10
20
30
40
'76 '78 '80 '82 '84 '86 '88 '90 '92 '94 '96 '98 '00 '02 '04 '06
Year
Large MSAOther MSANon-MSA
Perc
ent
Perc
ent
8th Graders 10th Graders 12th Graders
227

Cigarettes: Trends in 30-Day Prevalence of Daily Use by Parents' Average Education
0
10
20
30
40
'76 '78 '80 '82 '84 '86 '88 '90 '92 '94 '96 '98 '00 '02 '04 '06
Year
1 (Low)2345 (High)
Perc
ent
0
10
20
30
40
'76 '78 '80 '82 '84 '86 '88 '90 '92 '94 '96 '98 '00 '02 '04 '06
Year
1 (Low)2345 (High)
0
10
20
30
40
'76 '78 '80 '82 '84 '86 '88 '90 '92 '94 '96 '98 '00 '02 '04 '06
Year
1 (Low)2345 (High)
Perc
ent
Perc
ent
8th Graders 10th Graders 12th Graders
228

Cigarettes: Trends in 30-Day Prevalence of Daily Use by Race/Ethnicity*
observation from the previous year).*These graphs contain two-year moving averages (i.e., the mean of the observation in the indicated year plus the corresponding
0
10
20
30
40
'76 '78 '80 '82 '84 '86 '88 '90 '92 '94 '96 '98 '00 '02 '04 '06
Year
WhiteBlackHispanic
Perc
ent
0
10
20
30
40
'76 '78 '80 '82 '84 '86 '88 '90 '92 '94 '96 '98 '00 '02 '04 '06
Year
WhiteBlackHispanic
0
10
20
30
40
'76 '78 '80 '82 '84 '86 '88 '90 '92 '94 '96 '98 '00 '02 '04 '06
Year
WhiteBlackHispanic
Perc
ent
Perc
ent
8th Graders 10th Graders 12th Graders
229

Cigarettes: Trends in 30-Day Prevalence of Use of Half-Pack a Day or More by Gender
0
10
20
30
40
'76 '78 '80 '82 '84 '86 '88 '90 '92 '94 '96 '98 '00 '02 '04 '06
Year
Male
Female
Perc
ent
0
10
20
30
40
'76 '78 '80 '82 '84 '86 '88 '90 '92 '94 '96 '98 '00 '02 '04 '06
Year
Male
Female
0
10
20
30
40
'76 '78 '80 '82 '84 '86 '88 '90 '92 '94 '96 '98 '00 '02 '04 '06
Year
Male
Female
Perc
ent
Perc
ent
8th Graders 10th Graders 12th Graders
230

Cigarettes: Trends in 30-Day Prevalence of Use of Half-Pack a Day or More by College Plans
0
10
20
30
40
'76 '78 '80 '82 '84 '86 '88 '90 '92 '94 '96 '98 '00 '02 '04 '06
Year
< 4 yrs
Complete 4 yr
Perc
ent
0
10
20
30
40
'76 '78 '80 '82 '84 '86 '88 '90 '92 '94 '96 '98 '00 '02 '04 '06
Year
< 4 yrs
Complete 4 yr
0
10
20
30
40
'76 '78 '80 '82 '84 '86 '88 '90 '92 '94 '96 '98 '00 '02 '04 '06
Year
< 4 yrs
Complete 4 yr
Perc
ent
Perc
ent
8th Graders 10th Graders 12th Graders
231

Cigarettes: Trends in 30-Day Prevalence of Use of Half-Pack a Day or More by Region
0
10
20
30
40
'76 '78 '80 '82 '84 '86 '88 '90 '92 '94 '96 '98 '00 '02 '04 '06
Year
NortheastNorth CentralSouthWest
Perc
ent
0
10
20
30
40
'76 '78 '80 '82 '84 '86 '88 '90 '92 '94 '96 '98 '00 '02 '04 '06
Year
NortheastNorth CentralSouthWest
0
10
20
30
40
'76 '78 '80 '82 '84 '86 '88 '90 '92 '94 '96 '98 '00 '02 '04 '06
Year
NortheastNorth CentralSouthWest
Perc
ent
Perc
ent
8th Graders 10th Graders 12th Graders
232

Cigarettes: Trends in 30-Day Prevalence of Use of Half-Pack a Day or More by Population Density
0
10
20
30
40
'76 '78 '80 '82 '84 '86 '88 '90 '92 '94 '96 '98 '00 '02 '04 '06
Year
Large MSAOther MSANon-MSA
Perc
ent
0
10
20
30
40
'76 '78 '80 '82 '84 '86 '88 '90 '92 '94 '96 '98 '00 '02 '04 '06
Year
Large MSAOther MSANon-MSA
0
10
20
30
40
'76 '78 '80 '82 '84 '86 '88 '90 '92 '94 '96 '98 '00 '02 '04 '06
Year
Large MSAOther MSANon-MSA
Perc
ent
Perc
ent
8th Graders 10th Graders 12th Graders
233

Cigarettes: Trends in 30-Day Prevalence of Use of Half-Pack a Day or More byParents' Average Education
0
10
20
30
40
'76 '78 '80 '82 '84 '86 '88 '90 '92 '94 '96 '98 '00 '02 '04 '06
Year
1 (Low)2345 (High)
Perc
ent
0
10
20
30
40
'76 '78 '80 '82 '84 '86 '88 '90 '92 '94 '96 '98 '00 '02 '04 '06
Year
1 (Low)2345 (High)
0
10
20
30
40
'76 '78 '80 '82 '84 '86 '88 '90 '92 '94 '96 '98 '00 '02 '04 '06
Year
1 (Low)2345 (High)
Perc
ent
Perc
ent
8th Graders 10th Graders 12th Graders
234

Cigarettes: Trends in 30-Day Prevalence of Use of Half-Pack a Day or More by Race/Ethnicity*
observation from the previous year).*These graphs contain two-year moving averages (i.e., the mean of the observation in the indicated year plus the corresponding
0
10
20
30
40
'76 '78 '80 '82 '84 '86 '88 '90 '92 '94 '96 '98 '00 '02 '04 '06
Year
WhiteBlackHispanic
Perc
ent
0
10
20
30
40
'76 '78 '80 '82 '84 '86 '88 '90 '92 '94 '96 '98 '00 '02 '04 '06
Year
WhiteBlackHispanic
0
10
20
30
40
'76 '78 '80 '82 '84 '86 '88 '90 '92 '94 '96 '98 '00 '02 '04 '06
Year
WhiteBlackHispanic
Perc
ent
Perc
ent
8th Graders 10th Graders 12th Graders
235

Smokeless Tobacco: Trends in 30-Day Prevalence by Gender
0
5
10
15
20
25
30
'76 '78 '80 '82 '84 '86 '88 '90 '92 '94 '96 '98 '00 '02 '04 '06
Year
Male
Female
Perc
ent
0
5
10
15
20
25
30
'76 '78 '80 '82 '84 '86 '88 '90 '92 '94 '96 '98 '00 '02 '04 '06
Year
Male
Female
0
5
10
15
20
25
30
'76 '78 '80 '82 '84 '86 '88 '90 '92 '94 '96 '98 '00 '02 '04 '06
Year
Male
Female
Perc
ent
Perc
ent
8th Graders 10th Graders 12th Graders
236

Smokeless Tobacco: Trends in 30-Day Prevalence by College Plans
0
5
10
15
20
25
30
'76 '78 '80 '82 '84 '86 '88 '90 '92 '94 '96 '98 '00 '02 '04 '06
Year
< 4 yrs
Complete 4 yr
Perc
ent
0
5
10
15
20
25
30
'76 '78 '80 '82 '84 '86 '88 '90 '92 '94 '96 '98 '00 '02 '04 '06
Year
< 4 yrs
Complete 4 yr
0
5
10
15
20
25
30
'76 '78 '80 '82 '84 '86 '88 '90 '92 '94 '96 '98 '00 '02 '04 '06
Year
< 4 yrs
Complete 4 yr
Perc
ent
Perc
ent
8th Graders 10th Graders 12th Graders
237

Smokeless Tobacco: Trends in 30-Day Prevalence by Region
0
5
10
15
20
25
30
'76 '78 '80 '82 '84 '86 '88 '90 '92 '94 '96 '98 '00 '02 '04 '06
Year
NortheastNorth CentralSouthWest
Perc
ent
0
5
10
15
20
25
30
'76 '78 '80 '82 '84 '86 '88 '90 '92 '94 '96 '98 '00 '02 '04 '06
Year
NortheastNorth CentralSouthWest
0
5
10
15
20
25
30
'76 '78 '80 '82 '84 '86 '88 '90 '92 '94 '96 '98 '00 '02 '04 '06
Year
NortheastNorth CentralSouthWest
Perc
ent
Perc
ent
8th Graders 10th Graders 12th Graders
238

Smokeless Tobacco: Trends in 30-Day Prevalence by Population Density
0
5
10
15
20
25
30
'76 '78 '80 '82 '84 '86 '88 '90 '92 '94 '96 '98 '00 '02 '04 '06
Year
Large MSAOther MSANon-MSA
Perc
ent
0
5
10
15
20
25
30
'76 '78 '80 '82 '84 '86 '88 '90 '92 '94 '96 '98 '00 '02 '04 '06
Year
Large MSAOther MSANon-MSA
0
5
10
15
20
25
30
'76 '78 '80 '82 '84 '86 '88 '90 '92 '94 '96 '98 '00 '02 '04 '06
Year
Large MSAOther MSANon-MSA
Perc
ent
Perc
ent
8th Graders 10th Graders 12th Graders
239

Smokeless Tobacco: Trends in 30-Day Prevalence by Parents' Average Education
0
5
10
15
20
25
30
'76 '78 '80 '82 '84 '86 '88 '90 '92 '94 '96 '98 '00 '02 '04 '06
Year
1 (Low)2345 (High)
Perc
ent
0
5
10
15
20
25
30
'76 '78 '80 '82 '84 '86 '88 '90 '92 '94 '96 '98 '00 '02 '04 '06
Year
1 (Low)2345 (High)
0
5
10
15
20
25
30
'76 '78 '80 '82 '84 '86 '88 '90 '92 '94 '96 '98 '00 '02 '04 '06
Year
1 (Low)2345 (High)
Perc
ent
Perc
ent
8th Graders 10th Graders 12th Graders
240

*These graphs contain two-year moving averages (i.e., the mean of the observation in the indicated year plus the corresponding observation from the previous year).
Smokeless Tobacco: Trends in 30-Day Prevalence by Race/Ethnicity*
0
5
10
15
20
25
30
'76 '78 '80 '82 '84 '86 '88 '90 '92 '94 '96 '98 '00 '02 '04 '06
Year
WhiteBlackHispanic
Perc
ent
0
5
10
15
20
25
30
'76 '78 '80 '82 '84 '86 '88 '90 '92 '94 '96 '98 '00 '02 '04 '06
Year
WhiteBlackHispanic
0
5
10
15
20
25
30
'76 '78 '80 '82 '84 '86 '88 '90 '92 '94 '96 '98 '00 '02 '04 '06
Year
WhiteBlackHispanic
Perc
ent
Perc
ent
8th Graders 10th Graders 12th Graders
241

Smokeless Tobacco: Trends in 30-Day Prevalence of Daily Use by Gender
0
5
10
15
20
'76 '78 '80 '82 '84 '86 '88 '90 '92 '94 '96 '98 '00 '02 '04 '06
Year
Male
Female
Perc
ent
0
5
10
15
20
'76 '78 '80 '82 '84 '86 '88 '90 '92 '94 '96 '98 '00 '02 '04 '06
Year
Male
Female
0
5
10
15
20
'76 '78 '80 '82 '84 '86 '88 '90 '92 '94 '96 '98 '00 '02 '04 '06
Year
Male
Female
Perc
ent
Perc
ent
8th Graders 10th Graders 12th Graders
242

Smokeless Tobacco: Trends in 30-Day Prevalence of Daily Use by College Plans
0
5
10
15
20
'76 '78 '80 '82 '84 '86 '88 '90 '92 '94 '96 '98 '00 '02 '04 '06
Year
< 4 yrs
Complete 4 yr
Perc
ent
0
5
10
15
20
'76 '78 '80 '82 '84 '86 '88 '90 '92 '94 '96 '98 '00 '02 '04 '06
Year
< 4 yrs
Complete 4 yr
0
5
10
15
20
'76 '78 '80 '82 '84 '86 '88 '90 '92 '94 '96 '98 '00 '02 '04 '06
Year
< 4 yrs
Complete 4 yr
Perc
ent
Perc
ent
8th Graders 10th Graders 12th Graders
243

Smokeless Tobacco: Trends in 30-Day Prevalence of Daily Use by Region
0
5
10
15
20
'76 '78 '80 '82 '84 '86 '88 '90 '92 '94 '96 '98 '00 '02 '04 '06
Year
NortheastNorth CentralSouthWest
Perc
ent
0
5
10
15
20
'76 '78 '80 '82 '84 '86 '88 '90 '92 '94 '96 '98 '00 '02 '04 '06
Year
NortheastNorth CentralSouthWest
0
5
10
15
20
'76 '78 '80 '82 '84 '86 '88 '90 '92 '94 '96 '98 '00 '02 '04 '06
Year
NortheastNorth CentralSouthWest
Perc
ent
Perc
ent
8th Graders 10th Graders 12th Graders
244

Smokeless Tobacco: Trends in 30-Day Prevalence of Daily Use by Population Density
0
5
10
15
20
'76 '78 '80 '82 '84 '86 '88 '90 '92 '94 '96 '98 '00 '02 '04 '06
Year
Large MSAOther MSANon-MSA
Perc
ent
0
5
10
15
20
'76 '78 '80 '82 '84 '86 '88 '90 '92 '94 '96 '98 '00 '02 '04 '06
Year
Large MSAOther MSANon-MSA
0
5
10
15
20
'76 '78 '80 '82 '84 '86 '88 '90 '92 '94 '96 '98 '00 '02 '04 '06
Year
Large MSAOther MSANon-MSA
Perc
ent
Perc
ent
8th Graders 10th Graders 12th Graders
245

Smokeless Tobacco: Trends in 30-Day Prevalence of Daily Use by Parents' Average Education
0
5
10
15
20
'76 '78 '80 '82 '84 '86 '88 '90 '92 '94 '96 '98 '00 '02 '04 '06
Year
1 (Low)2345 (High)
Perc
ent
0
5
10
15
20
'76 '78 '80 '82 '84 '86 '88 '90 '92 '94 '96 '98 '00 '02 '04 '06
Year
1 (Low)2345 (High)
0
5
10
15
20
'76 '78 '80 '82 '84 '86 '88 '90 '92 '94 '96 '98 '00 '02 '04 '06
Year
1 (Low)2345 (High)
Perc
ent
Perc
ent
8th Graders 10th Graders 12th Graders
246

*These graphs contain two-year moving averages (i.e., the mean of the observation in the indicated year plus the corresponding observation from the previous year).
Smokeless Tobacco: Trends in 30-Day Prevalence of Daily Use by Race/Ethnicity*
0
5
10
15
20
'76 '78 '80 '82 '84 '86 '88 '90 '92 '94 '96 '98 '00 '02 '04 '06
Year
WhiteBlackHispanic
Perc
ent
0
5
10
15
20
'76 '78 '80 '82 '84 '86 '88 '90 '92 '94 '96 '98 '00 '02 '04 '06
Year
WhiteBlackHispanic
0
5
10
15
20
'76 '78 '80 '82 '84 '86 '88 '90 '92 '94 '96 '98 '00 '02 '04 '06
Year
WhiteBlackHispanic
Perc
ent
Perc
ent
8th Graders 10th Graders 12th Graders
247

Steroids: Trends in Annual Prevalence by Gender
0
2
4
6
8
10
'76 '78 '80 '82 '84 '86 '88 '90 '92 '94 '96 '98 '00 '02 '04 '06
Year
Male
Female
Perc
ent
0
2
4
6
8
10
'76 '78 '80 '82 '84 '86 '88 '90 '92 '94 '96 '98 '00 '02 '04 '06
Year
Male
Female
0
2
4
6
8
10
'76 '78 '80 '82 '84 '86 '88 '90 '92 '94 '96 '98 '00 '02 '04 '06
Year
Male
Female
Perc
ent
Perc
ent
8th Graders 10th Graders 12th Graders
248

Steroids: Trends in Annual Prevalence by College Plans
0
2
4
6
8
10
'76 '78 '80 '82 '84 '86 '88 '90 '92 '94 '96 '98 '00 '02 '04 '06
Year
< 4 yrs
Complete 4 yr
Perc
ent
0
2
4
6
8
10
'76 '78 '80 '82 '84 '86 '88 '90 '92 '94 '96 '98 '00 '02 '04 '06
Year
< 4 yrs
Complete 4 yr
0
2
4
6
8
10
'76 '78 '80 '82 '84 '86 '88 '90 '92 '94 '96 '98 '00 '02 '04 '06
Year
< 4 yrs
Complete 4 yr
Perc
ent
Perc
ent
8th Graders 10th Graders 12th Graders
249

Steroids: Trends in Annual Prevalence by Region
0
2
4
6
8
10
'76 '78 '80 '82 '84 '86 '88 '90 '92 '94 '96 '98 '00 '02 '04 '06
Year
NortheastNorth CentralSouthWest
Perc
ent
0
2
4
6
8
10
'76 '78 '80 '82 '84 '86 '88 '90 '92 '94 '96 '98 '00 '02 '04 '06
Year
NortheastNorth CentralSouthWest
0
2
4
6
8
10
'76 '78 '80 '82 '84 '86 '88 '90 '92 '94 '96 '98 '00 '02 '04 '06
Year
NortheastNorth CentralSouthWest
Perc
ent
Perc
ent
8th Graders 10th Graders 12th Graders
250

Steroids: Trends in Annual Prevalence by Population Density
0
2
4
6
8
10
'76 '78 '80 '82 '84 '86 '88 '90 '92 '94 '96 '98 '00 '02 '04 '06
Year
Large MSAOther MSANon-MSA
Perc
ent
0
2
4
6
8
10
'76 '78 '80 '82 '84 '86 '88 '90 '92 '94 '96 '98 '00 '02 '04 '06
Year
Large MSAOther MSANon-MSA
0
2
4
6
8
10
'76 '78 '80 '82 '84 '86 '88 '90 '92 '94 '96 '98 '00 '02 '04 '06
Year
Large MSAOther MSANon-MSA
Perc
ent
Perc
ent
8th Graders 10th Graders 12th Graders
251

Steroids: Trends in Annual Prevalence by Parents' Average Education
0
2
4
6
8
10
'76 '78 '80 '82 '84 '86 '88 '90 '92 '94 '96 '98 '00 '02 '04 '06
Year
1 (Low)2345 (High)
Perc
ent
0
2
4
6
8
10
'76 '78 '80 '82 '84 '86 '88 '90 '92 '94 '96 '98 '00 '02 '04 '06
Year
1 (Low)2345 (High)
0
2
4
6
8
10
'76 '78 '80 '82 '84 '86 '88 '90 '92 '94 '96 '98 '00 '02 '04 '06
Year
1 (Low)2345 (High)
Perc
ent
Perc
ent
8th Graders 10th Graders 12th Graders
252

*These graphs contain two-year moving averages (i.e., the mean of the observation in the indicated year plus the corresponding observation from the previous year).
Steroids: Trends in Annual Prevalence by Race/Ethnicity*
0
2
4
6
8
10
'76 '78 '80 '82 '84 '86 '88 '90 '92 '94 '96 '98 '00 '02 '04 '06
Year
WhiteBlackHispanic
Perc
ent
0
2
4
6
8
10
'76 '78 '80 '82 '84 '86 '88 '90 '92 '94 '96 '98 '00 '02 '04 '06
Year
WhiteBlackHispanic
0
2
4
6
8
10
'76 '78 '80 '82 '84 '86 '88 '90 '92 '94 '96 '98 '00 '02 '04 '06
Year
WhiteBlackHispanic
Perc
ent
Perc
ent
8th Graders 10th Graders 12th Graders
253

Appendix B
DEFINITION OF BACKGROUND AND DEMOGRAPHIC SUBGROUPS
Throughout this volume, data are presented for the total sample of 8th, 10th, and 12th graders. Data are also presented for many subgroups of students. The following are brief descriptions of the background and demographic subgroups used in this volume. (Note: All case counts provided in the tables are based on weighted Ns.)
Total: The total sample of respondents in a given year of the study. Gender: Male and female. Respondents with missing data on the question asking the
respondent’s gender are omitted from the data presented by gender. College Plans: Respondents not answering the college plans question are omitted from both
groupings. College plans groupings are defined as follows, based on the respondent’s answer to the question about his or her expectation of graduating from a four-year college:
None or under four years. Respondents who indicate they “definitely won’t” or
“probably won’t” graduate from a four-year college program. (Note that, among those who do not expect to complete a four-year college program, a number still expect to get some postsecondary education.)
Complete four years. Respondents who indicate they “definitely will” or
“probably will” graduate from a four-year college program. Region: Region of the country in which the respondent’s school is located. There are four
mutually exclusive regions of the country based on Census categories, defined as follows:
Northeast. Census classifications of New England and Middle Atlantic states
consist of Maine, New Hampshire, Vermont, Massachusetts, Rhode Island, Connecticut, New York, New Jersey, and Pennsylvania.
North Central (Midwest). Census classifications of East North Central and West
North Central states consist of Ohio, Indiana, Illinois, Michigan, Wisconsin, Minnesota, Iowa, Missouri, North Dakota, South Dakota, Nebraska, and Kansas.
South. Census classifications of South Atlantic, East South Central, and West
South Central states consist of Delaware, Maryland, District of Columbia, Virginia, West Virginia, North Carolina, South Carolina, Georgia, Florida, Kentucky, Tennessee, Alabama, Mississippi, Arkansas, Louisiana, Oklahoma, and Texas.
254

West. Census classifications of Mountain and Pacific states consist of Montana, Idaho, Wyoming, Colorado, New Mexico, Arizona, Utah, Nevada, Washington, Oregon, and California.
Population Density: Population density of the area in which the schools are located. There are three
mutually exclusive groups that have been variously defined, as described below. (The 1975–1985 samples were based on the 1970 Census; in 1986 one half of the sample was based on the 1970 Census, and the other half of the sample was based on the 1980 Census. In 1987 through 1993 the samples were based on the 1980 Census; in 1994 half of the sample was based on the 1980 Census and half on the 1990 Census. The 2006 first-year schools come from a sample design that utilizes 2000 Census counts as the measure of size for first-stage units. The three levels of population density were defined in terms of Standard Metropolitan Statistical Area (SMSA) designations through 1985, and then changed to the new Census Bureau classifications of Metropolitan Statistical Areas (MSAs), as described here:
Large MSA. These were the 12 largest Standard Metropolitan Statistical Areas
(SMSAs) as of the 1970 Census and were used for the 1975–1985 samples: New York, Los Angeles, Chicago, Philadelphia, Detroit, San Francisco, Washington, Boston, Pittsburgh, St. Louis, Baltimore, and Cleveland. As of the 1980 Census, the “large MSA” group consisted of the 16 largest MSAs. This new structure was used for the 1986–1994 samples. These 16 MSAs include all of the MSAs mentioned above (except Cleveland) plus the MSAs of Dallas-Fort Worth, Houston, Nassau-Suffolk, Minneapolis-St. Paul, and Atlanta.
A new sample design was developed, based on the 1990 Census, beginning with the first-year half-sample of schools chosen in 1994. In the 1990s sample, only the eight largest MSAs are represented with certainty at all three grade levels; 16 other large MSAs are divided into pairs, with half randomly assigned to the 12th- and 8th-grade samples and the other half assigned to the 10th-grade sample. The eight largest MSAs are New York, Los Angeles, Chicago, Philadelphia PA-NJ, Detroit, Washington DC-MD-VA, Dallas-Ft. Worth, and Boston. The other 16 large MSAs are Houston, Atlanta, Seattle-Tacoma, Minneapolis MN-WI, St. Louis MO-IL, San Diego, Baltimore, Pittsburgh, Phoenix, Oakland, Cleveland, Miami, Newark, Denver, San Francisco, and Kansas City MO-KS.
Other MSAs. This category consists of all other Metropolitan Statistical Areas, as
defined by the Census, except those listed previously. Except in the New England states, an MSA is a county or group of contiguous counties that contain at least one city of 50,000 inhabitants or more, or “twin cities” with a combined population of at least 50,000. In the New England states, MSAs consisted of towns and cities instead of counties until 1994, after which New England Consolidated Metropolitan Areas (NECMAs) were used to define MSAs. Each MSA must include at least one central city, and the complete title of an MSA
255
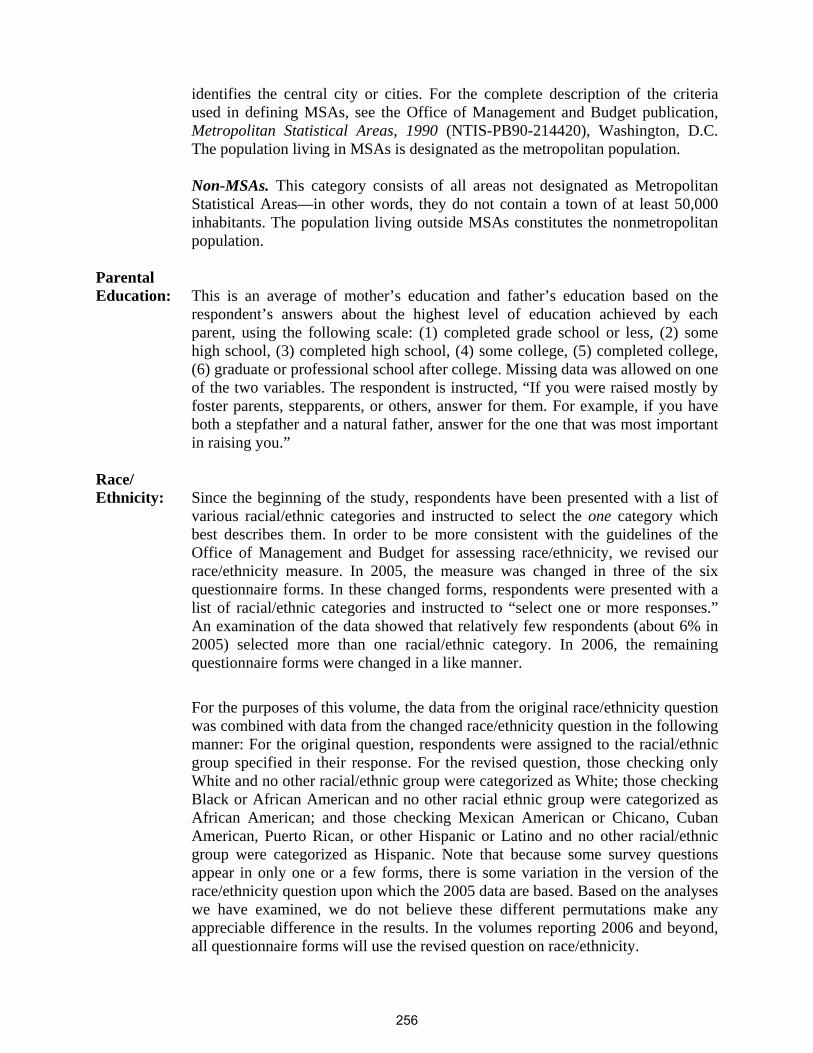
identifies the central city or cities. For the complete description of the criteria used in defining MSAs, see the Office of Management and Budget publication, Metropolitan Statistical Areas, 1990 (NTIS-PB90-214420), Washington, D.C. The population living in MSAs is designated as the metropolitan population.
Non-MSAs. This category consists of all areas not designated as Metropolitan
Statistical Areas—in other words, they do not contain a town of at least 50,000 inhabitants. The population living outside MSAs constitutes the nonmetropolitan population.
Parental Education: This is an average of mother’s education and father’s education based on the
respondent’s answers about the highest level of education achieved by each parent, using the following scale: (1) completed grade school or less, (2) some high school, (3) completed high school, (4) some college, (5) completed college, (6) graduate or professional school after college. Missing data was allowed on one of the two variables. The respondent is instructed, “If you were raised mostly by foster parents, stepparents, or others, answer for them. For example, if you have both a stepfather and a natural father, answer for the one that was most important in raising you.”
Race/ Ethnicity: Since the beginning of the study, respondents have been presented with a list of
various racial/ethnic categories and instructed to select the one category which best describes them. In order to be more consistent with the guidelines of the Office of Management and Budget for assessing race/ethnicity, we revised our race/ethnicity measure. In 2005, the measure was changed in three of the six questionnaire forms. In these changed forms, respondents were presented with a list of racial/ethnic categories and instructed to “select one or more responses.” An examination of the data showed that relatively few respondents (about 6% in 2005) selected more than one racial/ethnic category. In 2006, the remaining questionnaire forms were changed in a like manner.
For the purposes of this volume, the data from the original race/ethnicity question was combined with data from the changed race/ethnicity question in the following manner: For the original question, respondents were assigned to the racial/ethnic group specified in their response. For the revised question, those checking only White and no other racial/ethnic group were categorized as White; those checking Black or African American and no other racial ethnic group were categorized as African American; and those checking Mexican American or Chicano, Cuban American, Puerto Rican, or other Hispanic or Latino and no other racial/ethnic group were categorized as Hispanic. Note that because some survey questions appear in only one or a few forms, there is some variation in the version of the race/ethnicity question upon which the 2005 data are based. Based on the analyses we have examined, we do not believe these different permutations make any appreciable difference in the results. In the volumes reporting 2006 and beyond, all questionnaire forms will use the revised question on race/ethnicity.
256

White. Consists of those respondents who describe themselves as White or Caucasian in 1975–2004. In 2005 the unchanged questionnaire forms were treated in a similar manner and the changed forms were treated in the manner described above. Beginning in 2006 all forms were treated in the manner described above.
African American. Consists of those respondents who in 1975–1990 describe
themselves as Black or Afro-American or who, in 1991–2004, describe themselves as Black or African American. In 2005 the unchanged questionnaire forms were treated in a similar manner and the changed forms were treated in the manner described above. Beginning in 2006 all forms were treated in the manner described above.
Hispanic. Consists of those respondents who in 1975–1990 describe themselves
as Mexican American or Chicano, or Puerto Rican or other Latin American. After 1990 this group includes those respondents who describe themselves as Mexican American or Chicano, Cuban American, Puerto Rican American, or other Latin American. After 1994, the term “Puerto Rican American” was shortened to “Puerto Rican.” In 2005 the unchanged questionnaire forms were treated in a similar manner and the changed forms were treated in the manner described above. Beginning in 2006 all forms were treated in the manner described above.
257

Appendix D
TRENDS BY SUBGROUP:
SUPPLEMENTAL TABLES FOR SECONDARY SCHOOL STUDENTS Trend data for the population subgroups discussed in this volume (defined by gender, college plans, region, community size, level of parental education, and racial/ethnic group) are presented here for all of the major classes of licit and illicit drugs. Due to the sheer quantity of information such trend tables generate for each prevalence measure (e.g., lifetime, annual, 30-day, daily), we have selected the prevalence periods that seem most useful for understanding differences by subgroup. Thus, for most drugs, we include only annual prevalence; but rates for different prevalence periods are provided for alcohol, cigarettes, and smokeless tobacco because of their more frequent use.
The subgroups distinguished in these tables are the standard ones used throughout this volume and are operationally defined in appendix B. The reader should note that two-year moving averages are given for the three major racial/ethnic groups included here in order to damp down random fluctuations in the trends for the minority groups, particularly among Hispanics. A footnote in each table describes the procedure. A question change was introduced in half of the questionnaire forms in 2005 for the race/ethnicity variable, allowing respondents to select multiple categories of race/ethnicity rather than just one. It is described in appendix B. In 2006, the remaining questionnaire forms were changed in a like manner. However, we believe that this change has had little or no effect on the results because so few respondents selected more than one of the categories offered.
For nearly all drugs there is one table presenting the subgroup trends for 8th graders, a second table for 10th graders, and a third table (usually running to two pages in length) giving the longer term trends for 12th graders. However, for two of the drugs—sedatives (barbiturates) and narcotics other than heroin—the 8th- and 10th-grade data have been omitted, as they have been throughout the volume, because we are less certain about the validity of the answers provided by those younger students. Specifically, we believe that they often fail to omit substances that should be omitted (e.g., nonprescription substances). Usage questions for a few other drugs are simply not asked of 8th and 10th graders; thus only 12th-grade tables are presented.
Sample sizes, provided in tables at the end of this appendix, should be taken into account when interpreting the importance of any changes observed, of course. The reader should be aware that the numbers provided in those tables assume that all respondents were asked about their use of the drug. Some of the drugs were not contained in all questionnaire forms, meaning that the subgroup and total Ns must be adjusted accordingly. The “Notes” section at the bottom of each table will indicate if only a fraction of the sample received the question.
258

8th 10th 12th Annual 30-Day DailyAny illicit drug D-1 D-2 D-3 XAny illicit drug other than marijuana D-4 D-5 D-6 XMarijuana D-7 D-8 D-9 XInhalants D-10 D-11 D-12 XHallucinogens D-13 D-14 D-15 X LSD D-16 D-17 D-18 X Hallucinogens other than LSD D-19 D-20 D-21 X MDMA (ecstasy) D-22 D-23 D-24 XCocaine D-25 D-26 D-27 X Crack D-28 D-29 D-30 X Other cocaine D-31 D-32 D-33 XHeroin D-34 D-35 D-36 X Heroin with a needle D-37 D-38 D-39 X Heroin without a needle D-40 D-41 D-42 XOther narcotics — — D-43 X OxyContin D-44 D-44 D-45 X Vicodin D-46 D-46 D-47 XAmphetamines D-48 D-49 D-50 X Ritalin D-51 D-51 D-52 X Methamphetamine D-53 D-54 D-55 X Crystal meth. (ice) — — D-56 XSedatives (barbiturates) — — D-57 XTranquilizers D-58 D-59 D-60 XRohypnol D-61 D-62 D-63 XAlcohol D-64 D-65 D-66 X Been drunk D-67 D-68 D-69 X 5+ drinks in a row D-70 D-71 D-72 X Beer D-73 D-74 D-75 X 5+ drinks in a row D-76 D-77 D-78 X Liquor — — D-79 X 5+ drinks in a row — — D-80 X Wine — — D-81 X 5+ drinks in a row — — D-82 X Wine coolers D-83 D-84 D-85 X 5+ drinks in a row — — D-86 X Flavored alcoholic beverages D-87 D-87 D-87 XCigarettes D-88 D-89 D-90 X Daily D-91 D-92 D-93 X 1/2 pack+/day D-94 D-95 D-96 XSmokeless tobacco D-97 D-98 D-99 X Daily D-100 D-101 D-102 XSteroids D-103 D-104 D-105 XWeighted Ns by subgroups D-106 D-107 D-108
Table Number Time PeriodSubstance
List of 2006 Appendix D Tables
259

1991 1992 1993 1994 1995 1996 1997 1998 1999 2000 2001 2002 2003 2004 2005 2006Approx. N = 17,500 18,600 18,300 17,300 17,500 17,800 18,600 18,100 16,700 16,700 16,200 15,100 16,500 17,000 16,800 16,500
Total 11.3 12.9 15.1 18.5 21.4 23.6 22.1 21.0 20.5 19.5 19.5 17.7 16.1 15.2 15.5 14.8 -0.7Gender: Male 11.7 11.9 15.2 19.4 22.3 23.6 22.6 21.3 21.3 19.7 21.3 19.2 16.4 15.0 15.2 15.1 -0.1 Female 11.0 13.6 14.9 17.6 20.2 23.3 21.3 20.4 19.7 19.0 17.5 16.3 15.5 15.2 15.6 14.2 -1.4College Plans: None or under 4 years 22.8 25.6 30.7 34.6 38.4 40.3 39.6 41.3 39.9 38.9 38.5 36.8 34.7 33.6 35.2 33.1 -2.1 Complete 4 years 9.5 10.9 12.8 16.3 19.1 21.0 19.9 18.4 18.0 17.1 17.2 15.7 14.0 13.2 13.3 13.0 -0.3Region: Northeast 9.3 10.6 11.5 16.6 17.9 20.3 20.2 16.0 18.2 16.6 18.1 13.8 13.1 13.0 12.3 10.8 -1.5 North Central 11.2 13.0 13.9 17.2 23.3 24.7 22.3 21.9 22.6 20.6 18.0 17.0 15.7 14.2 15.9 13.9 -2.1 South 11.5 12.9 15.1 17.6 20.8 22.5 21.6 22.3 21.0 19.2 21.5 20.1 18.1 16.8 17.4 17.7 +0.3 West 13.3 15.0 21.1 23.7 23.3 27.1 24.4 22.0 19.2 21.0 18.9 18.4 15.6 15.5 14.5 13.9 -0.6Population Density: Large MSA 10.5 12.0 13.1 16.2 15.2 23.4 20.5 19.8 19.1 18.1 16.4 15.9 14.3 14.0 14.9 13.5 -1.4 Other MSA 12.1 14.4 17.3 21.5 23.7 24.9 22.6 21.4 19.5 18.8 21.5 18.3 16.2 15.9 16.2 15.6 -0.6 Non-MSA 10.8 11.2 12.9 14.0 20.3 21.4 22.9 21.6 24.3 22.7 19.1 18.9 18.1 15.3 15.0 15.2 +0.2Parental Education:b
1.0-2.0 (Low) 19.5 18.5 20.8 26.1 29.8 26.7 29.5 30.4 30.2 30.9 29.9 27.3 26.4 25.7 24.9 23.7 -1.2 2.5-3.0 11.7 14.1 17.1 20.2 24.3 25.7 25.5 24.2 24.9 23.9 23.3 22.4 20.4 18.5 20.5 18.6 -1.9 3.5-4.0 11.6 13.6 15.4 19.7 23.4 26.2 23.8 21.8 21.0 20.1 21.5 18.5 16.9 16.7 16.7 16.5 -0.2 4.5-5.0 8.7 10.2 12.8 15.7 17.4 21.3 19.3 17.8 15.6 14.6 15.0 14.5 12.0 12.1 11.4 11.0 -0.4 5.5-6.0 (High) 10.2 10.1 11.8 14.9 17.7 19.8 16.8 17.1 15.8 15.0 13.4 12.1 11.0 10.9 9.8 9.9 +0.1Race (2-year average):c
White — 11.8 13.6 15.7 19.2 22.4 23.0 21.5 19.9 19.1 19.0 18.3 16.5 14.9 14.4 14.1 -0.2 Black — 7.9 9.3 13.0 15.8 17.5 18.1 18.1 18.6 18.3 16.7 15.1 14.6 14.6 15.6 14.9 -0.6 Hispanic — 18.1 20.6 24.6 26.7 26.9 26.5 26.7 27.4 25.1 24.3 24.8 22.8 20.9 18.8 17.9 -0.9
they include the use of nonprescription drugs in their answers).bParental education is an average score of mother’s education and father’s education. See Appendix B for details.
Any Illicit Drug:a Trends in Annual Prevalence of Use by Subgroups for Eighth Graders
Notes: Level of significance of difference between the two most recent classes: s = .05, ss = .01, sss = .001. ‘—’ indicates data not available.
See Table D-106 for the number of subgroup cases. See Appendix B for definition of variables in table.
Source: The Monitoring the Future Study, the University of Michigan.
TABLE D-1
more stable estimates. For the data beginning in 2005, see the race/ethnicity note at the end of Appendix D.
Percentage who used in last twelve months’05–’06change
Any apparent inconsistency between the change estimate and the prevalence-of-use estimates for the two most recent classes is due to rounding error.
aUse of "any illicit drug" includes any use of marijuana, LSD, other hallucinogens, crack, other cocaine, or heroin, or any use of amphetamines or tranquilizers not under a
doctor’s orders. The use of other narcotics and sedatives (barbiturates) has been excluded because 8th and 10th graders appear to overreport their use (perhaps because
cTo derive percentages for each racial subgroup, data for the specified year and the previous year have been combined to increase subgroup sample sizes and thus provide
260

1991 1992 1993 1994 1995 1996 1997 1998 1999 2000 2001 2002 2003 2004 2005 2006Approx. N = 14,800 14,800 15,300 15,800 17,000 15,600 15,500 15,000 13,600 14,300 14,000 14,300 15,800 16,400 16,200 16,200
Total 21.4 20.4 24.7 30.0 33.3 37.5 38.5 35.0 35.9 36.41 37.2 34.8 32.0 31.1 29.8 28.7 -1.0Gender: Male 21.6 20.4 25.1 31.8 33.7 38.8 40.1 35.3 37.0 39.4 39.6 35.9 33.2 32.0 30.5 29.3 -1.2 Female 21.1 20.1 24.0 28.0 32.5 36.3 36.8 34.7 34.6 33.5 35.0 33.7 30.8 30.2 28.9 28.1 -0.8College Plans: None or under 4 years 32.7 32.0 37.7 43.2 47.3 52.4 55.2 50.5 51.8 53.5 52.7 51.5 48.6 46.9 45.8 46.2 +0.5 Complete 4 years 18.9 17.8 21.9 27.0 30.8 35.0 35.7 32.2 33.2 33.9 34.6 32.1 29.2 28.9 27.6 26.4 -1.2Region: Northeast 21.8 19.0 26.9 29.6 32.4 37.7 37.8 39.0 38.2 34.0 37.4 35.2 32.6 32.8 31.3 27.8 -3.6 North Central 21.7 20.7 22.4 28.5 32.1 37.6 37.7 32.0 35.2 34.8 35.9 33.7 28.8 28.8 29.1 28.2 -0.9 South 19.2 17.9 23.3 29.2 33.2 37.9 38.7 35.1 34.8 36.0 36.7 33.9 34.0 32.9 31.1 29.7 -1.5 West 23.7 25.5 28.9 34.4 36.1 36.8 40.2 34.5 36.0 41.6 40.7 37.7 32.3 29.8 26.9 29.0 +2.0Population Density: Large MSA 21.4 19.9 24.0 29.4 28.7 35.5 37.2 32.6 35.0 36.5 34.0 33.0 30.5 28.9 28.0 27.3 -0.7 Other MSA 22.0 20.8 25.1 32.7 35.5 40.0 40.0 36.9 37.3 36.6 39.0 36.9 32.4 32.0 31.1 28.6 -2.5 Non-MSA 20.4 20.1 24.4 24.7 30.7 35.1 37.2 34.5 33.9 35.8 37.4 32.8 33.5 32.3 29.5 31.4 +1.9Parental Education:b
1.0-2.0 (Low) 25.5 24.8 29.2 32.6 38.2 39.5 38.3 36.6 42.2 42.4 39.0 39.4 38.8 37.7 33.2 36.2 +3.0 2.5-3.0 23.0 21.3 25.4 31.1 37.1 39.1 40.8 39.1 39.4 39.2 41.6 39.4 36.4 34.0 34.3 33.7 -0.7 3.5-4.0 21.2 20.6 24.9 30.5 34.7 40.1 41.6 35.6 35.4 39.5 38.2 35.5 33.3 33.6 30.6 30.6 0.0 4.5-5.0 19.4 18.7 22.5 28.1 30.9 35.5 36.3 31.9 32.8 32.6 35.1 31.9 27.8 27.7 27.6 24.6 -2.9 s 5.5-6.0 (High) 21.1 18.5 23.6 27.2 26.6 33.6 33.7 31.5 34.6 31.3 32.7 29.1 27.5 26.2 25.9 24.3 -1.6Race (2-year average):c
White — 22.4 23.7 27.9 32.6 36.5 39.3 38.2 36.4 36.9 37.6 37.6 35.0 32.2 31.0 30.2 -0.8 Black — 10.8 11.9 18.5 23.6 27.3 30.2 28.9 28.4 29.7 30.5 28.5 27.3 29.3 29.0 26.2 -2.8 Hispanic — 23.6 26.3 30.3 34.3 40.0 41.3 38.1 38.4 39.3 38.8 36.2 33.8 34.5 32.8 28.5 -4.4
TABLE D-2
aUse of "any illicit drug" includes any use of marijuana, LSD, other hallucinogens, crack, other cocaine, or heroin, or any use of amphetamines or tranquilizers not under a
doctor’s orders. The use of other narcotics and sedatives (barbiturates) has been excluded because 8th and 10th graders appear to overreport their use (perhaps because
Percentage who used in last twelve months’05–’06change
Any Illicit Drug:a Trends in Annual Prevalence of Use by Subgroups for Tenth Graders
Notes: Level of significance of difference between the two most recent classes: s = .05, ss = .01, sss = .001. ‘—’ indicates data not available.
Source: The Monitoring the Future Study, the University of Michigan.
cTo derive percentages for each racial subgroup, data for the specified year and the previous year have been combined to increase subgroup sample sizes and thus provide
more stable estimates. For the data beginning in 2005, see the race/ethnicity note at the end of Appendix D.
Any apparent inconsistency between the change estimate and the prevalence-of-use estimates for the two most recent classes is due to rounding error.
See Table D-107 for the number of subgroup cases. See Appendix B for definition of variables in table.
they include the use of nonprescription drugs in their answers).bParental education is an average score of mother’s education and father’s education. See Appendix B for details.
261

1975 1976 1977 1978 1979 1980 1981 1982 1983 1984 1985 1986 1987 1988 1989 1990Approx. N = 9,400 15,400 17,100 17,800 15,500 15,900 17,500 17,700 16,300 15,900 16,000 15,200 16,300 16,300 16,700 15,200
Total 45.0 48.1 51.1 53.8 54.2 53.1 52.1 49.4 47.4 45.8 46.3 44.3 41.7 38.5 35.4 32.5Gender: Male 49.0 52.6 55.4 58.6 58.1 56.0 53.6 51.8 49.7 48.0 48.3 45.7 43.2 40.6 37.7 34.3 Female 41.4 43.0 46.7 48.7 50.1 49.8 50.8 46.3 44.4 42.8 43.8 42.3 39.7 36.1 32.8 30.1College Plans: None or under 4 years — 50.6 54.3 55.5 56.8 56.5 55.8 53.4 50.8 50.3 50.1 48.6 46.7 42.0 40.9 37.8 Complete 4 years — 44.3 46.8 50.5 50.5 49.7 48.6 45.5 43.7 41.4 43.1 41.2 39.0 36.5 32.6 29.6Region: Northeast 51.5 55.3 56.8 61.6 62.9 58.9 58.8 55.1 53.8 54.7 53.2 49.7 45.8 41.2 36.0 36.4 North Central 45.5 47.6 51.9 54.6 55.0 53.1 53.4 50.3 46.9 42.4 45.7 45.0 42.7 39.7 38.7 34.0 South 38.1 42.3 46.2 47.5 45.4 47.0 43.7 42.2 41.3 41.4 37.2 37.4 35.9 34.2 30.7 27.6 West 48.3 49.7 50.0 53.2 56.4 55.8 55.5 51.7 50.7 49.1 53.3 47.8 45.7 41.8 39.5 34.4Population Density: Large MSA 54.5 54.6 56.3 60.3 61.3 59.9 57.8 54.8 52.0 49.7 49.9 48.0 43.9 39.1 32.9 32.6 Other MSA 45.0 47.8 52.4 54.5 55.2 53.8 52.1 49.8 49.6 46.7 46.5 45.1 42.7 40.5 36.3 33.5 Non-MSA 38.8 43.7 45.2 47.4 47.6 47.0 47.6 44.0 41.1 41.4 43.0 40.0 37.6 34.3 36.0 30.1Parental Education:c
1.0-2.0 (Low) — 43.4 45.3 47.7 50.2 49.5 48.1 44.3 45.1 42.7 42.8 38.1 35.4 35.8 28.4 26.6 2.5-3.0 — 49.2 51.8 53.3 53.2 53.0 51.2 48.8 46.3 45.7 46.0 44.8 41.8 37.2 35.3 32.7 3.5-4.0 — 48.9 53.1 55.1 56.1 54.2 52.8 50.8 46.5 47.6 47.2 45.6 42.2 38.6 37.7 33.8 4.5-5.0 — 50.8 51.7 56.3 57.1 54.0 53.4 49.7 48.9 44.9 48.4 44.7 43.1 40.0 35.5 33.1 5.5-6.0 (High) — 51.3 51.8 59.1 54.3 55.0 54.8 48.5 46.1 45.5 44.5 44.5 43.5 40.6 36.3 33.3Race (2-year average):d
White — — 50.4 53.5 55.2 54.9 54.4 50.7 49.3 47.4 47.6 47.2 45.2 43.0 40.3 37.5 Black — — 40.8 42.8 41.5 40.5 39.0 36.4 38.5 37.8 35.9 33.3 28.9 25.0 21.3 17.0 Hispanic — — 49.9 49.5 48.4 48.1 46.8 42.7 42.0 43.1 43.9 42.8 38.9 35.4 30.1 26.4
Any apparent inconsistency between the change estimate and the prevalence-of-use estimates for the two most recent classes is due to rounding error.
See Table D-108 for the number of subgroup cases. See Appendix B for definition of variables in table.
TABLE D-3Any Illicit Drug:a,b Trends in Annual Prevalence of Use by Subgroups for Twelfth Graders
Notes: Level of significance of difference between the two most recent classes: s = .05, ss = .01, sss = .001. ‘—’ indicates data not available.
Percentage who used in last twelve monthsClass of:
Source: The Monitoring the Future Study, the University of Michigan.
Cont'd
262

1991 1992 1993 1994 1995 1996 1997 1998 1999 2000 2001 2002 2003 2004 2005 2006Approx. N = 15,000 15,800 16,300 15,400 15,400 14,300 15,400 15,200 13,600 12,800 12,800 12,900 14,600 14,600 14,700 14,200
Total 29.4 27.1 31.0 35.8 39.0 40.2 42.4 41.4 42.1 40.9 41.4 41.0 39.3 38.8 38.4 36.5 -1.9Gender: Male 32.1 29.0 33.5 38.6 41.5 43.4 44.1 45.2 45.0 43.4 43.8 43.5 41.3 41.4 42.1 37.5 -4.6 ss Female 26.2 24.7 27.9 32.7 35.8 36.2 40.0 37.2 38.9 38.0 38.4 37.8 36.7 35.9 34.5 35.0 +0.5College Plans: None or under 4 years 33.9 33.5 34.9 40.8 44.1 46.2 48.8 47.3 47.9 45.1 46.2 46.2 46.8 44.4 46.5 46.1 -0.4 Complete 4 years 27.1 24.4 29.2 33.6 36.7 37.8 40.1 39.1 40.3 38.8 39.6 39.3 36.6 36.8 36.1 33.8 -2.4Region: Northeast 31.9 28.7 36.1 39.4 41.7 44.6 47.7 46.2 42.5 46.2 47.4 45.7 43.7 43.9 43.2 42.0 -1.2 North Central 31.3 27.8 30.8 36.5 40.9 40.9 40.6 38.1 42.1 38.9 42.0 41.6 40.0 38.2 38.8 36.3 -2.5 South 24.5 23.7 28.2 34.1 36.4 37.6 38.8 40.5 40.8 35.3 37.3 38.1 34.8 35.7 36.6 34.9 -1.7 West 32.6 31.1 31.8 34.7 38.2 39.1 45.9 43.1 44.2 47.4 41.9 40.5 41.4 39.6 36.3 34.6 -1.7Population Density: Large MSA 28.6 26.8 32.9 36.4 41.7 41.3 42.1 42.0 42.4 41.1 43.9 41.9 35.7 36.3 38.5 38.2 -0.3 Other MSA 33.0 27.3 31.7 37.8 39.0 42.3 44.2 42.1 43.3 42.6 41.0 42.4 42.7 42.4 39.8 36.7 -3.1 Non-MSA 23.8 27.0 28.4 31.6 35.9 35.4 39.2 39.3 39.9 37.5 39.4 37.1 37.6 34.9 35.5 33.5 -1.9Parental Education:c
1.0-2.0 (Low) 28.7 27.7 29.5 32.9 37.7 36.6 40.3 38.9 40.9 41.3 38.8 35.3 35.8 34.7 32.0 37.6 +5.6 2.5-3.0 28.7 26.4 29.2 35.4 38.3 39.9 40.8 40.5 43.7 40.5 41.9 39.3 39.0 37.7 38.9 38.2 -0.7 3.5-4.0 29.6 28.1 31.6 36.4 38.8 40.4 42.0 42.9 42.9 41.6 42.7 43.2 41.3 42.1 41.3 37.1 -4.2 s 4.5-5.0 28.7 26.2 31.5 36.5 39.0 40.5 43.6 40.9 40.0 39.6 41.3 42.0 38.9 38.2 38.8 33.2 -5.6 ss 5.5-6.0 (High) 31.9 26.8 33.4 35.7 40.7 40.6 44.0 41.8 42.3 41.1 40.1 40.6 36.5 37.4 36.0 37.3 +1.3Race (2-year average):d
White 33.9 30.5 31.4 35.5 39.0 40.8 42.8 44.0 43.3 42.8 43.1 43.6 42.8 42.0 41.6 40.0 -1.6 Black 14.7 14.5 16.6 23.5 29.6 32.4 33.0 32.3 32.8 32.7 31.7 30.4 28.3 27.7 29.0 30.0 +1.0 Hispanic 29.4 30.3 28.8 31.2 35.5 38.0 41.2 41.9 42.5 44.8 41.8 39.0 35.8 34.4 34.5 34.2 -0.4
more stable estimates. For the data beginning in 2005, see the race/ethnicity note at the end of Appendix D.
’05–’06change
aUse of "any illicit drug" includes any use of marijuana, LSD, other hallucinogens, crack, other cocaine, or heroin, or any use of other narcotics, amphetamines, sedatives
(barbiturates), methaqualone (excluded since 1990), or tranquilizers not under a doctor’s orders.bBeginning in 1982 the question about amphetamine use was revised to get respondents to exclude the inappropriate reporting of nonprescription amphetamines. The
prevalence-of-use rate dropped slightly as a result of this methodological change.cParental education is an average score of mother’s education and father’s education. See Appendix B for details.
TABLE D-3 (cont'd)Any Illicit Drug:a,b Trends in Annual Prevalence of Use by Subgroups for Twelfth Graders
dTo derive percentages for each racial subgroup, data for the specified year and the previous year have been combined to increase subgroup sample sizes and thus provide
Percentage who used in last twelve monthsClass of:
263

1991 1992 1993 1994 1995 1996 1997 1998 1999 2000 2001b 2002b 2003 2004 2005 2006Approx. N = 17,500 18,600 18,300 17,300 17,500 17,800 18,600 18,100 16,700 16,700 16,200 15,100 16,500 17,000 16,800 16,500
Total 8.4 9.3 10.4 11.3 12.6 13.1 11.8 11.0 10.5 10.2‡ 10.8 8.8 8.8 7.9 8.1 7.7 -0.3Gender: Male 8.0 8.0 9.2 10.1 11.5 11.0 10.8 9.6 9.7 9.1‡ 10.0 8.1 7.9 7.0 6.6 6.5 0.0 Female 8.8 10.4 11.5 12.3 13.5 14.7 12.6 12.1 11.2 10.9‡ 11.2 9.3 9.4 8.8 9.3 8.7 -0.7College Plans: None or under 4 years 16.3 18.5 21.3 21.2 25.3 23.0 22.1 23.8 23.4 22.7‡ 21.5 19.7 20.0 18.0 18.2 17.7 -0.6 Complete 4 years 7.2 8.0 8.9 9.9 10.9 11.6 10.6 9.4 9.0 8.7‡ 9.5 7.6 7.5 6.9 7.0 6.7 -0.3Region: Northeast 6.8 6.6 8.2 10.3 10.7 11.3 9.5 8.5 8.5 8.0‡ 9.5 5.8 7.1 5.9 5.8 4.4 -1.4 North Central 8.6 10.4 9.4 10.2 14.0 14.3 12.5 10.5 11.9 11.2‡ 9.9 8.7 8.7 7.7 8.1 7.1 -1.0 South 8.6 9.7 11.0 11.7 12.5 12.6 11.8 12.5 11.2 10.3‡ 12.4 10.6 10.0 9.0 9.5 9.8 +0.3 West 9.3 9.8 13.4 12.7 12.7 14.0 13.0 11.1 9.3 10.5‡ 10.1 8.4 7.9 8.2 7.7 7.4 -0.2Population Density: Large MSA 8.0 8.1 8.8 9.8 8.7 12.3 9.9 8.9 8.4 8.5‡ 9.7 7.4 7.1 6.9 7.1 6.6 -0.5 Other MSA 8.6 10.4 11.8 12.5 13.5 14.1 12.2 11.2 10.7 10.1‡ 11.8 9.2 8.7 8.5 8.8 8.0 -0.8 Non-MSA 8.6 8.9 9.8 9.8 13.2 12.1 13.0 12.8 12.8 12.3‡ 10.3 9.8 11.0 8.0 8.1 8.8 +0.7Parental Education:c
1.0-2.0 (Low) 12.9 12.9 14.4 15.6 18.0 15.5 14.8 17.3 16.0 15.8‡ 14.3 13.0 14.1 15.2 14.3 12.3 -2.0 2.5-3.0 8.5 10.1 11.8 12.4 14.2 13.9 12.9 12.2 12.1 12.2‡ 13.2 10.9 10.9 8.8 10.3 9.4 -0.9 3.5-4.0 8.7 10.1 10.6 11.8 14.2 14.5 12.5 11.2 11.3 10.6‡ 11.7 9.0 9.0 8.4 9.0 8.4 -0.7 4.5-5.0 7.1 7.5 9.1 9.5 9.7 12.0 10.6 9.4 8.5 7.7‡ 8.9 7.6 6.7 6.8 5.7 6.0 +0.4 5.5-6.0 (High) 7.8 8.0 8.2 9.4 10.1 11.7 10.3 9.5 8.3 8.4‡ 8.0 6.5 6.8 5.9 5.3 6.2 +1.0Race (2-year average):d
White — 9.0 10.0 10.8 12.6 13.9 13.5 12.5 11.5 11.1 10.6‡ 10.3e 9.3 8.7 8.1 8.1 0.0 Black — 4.9 5.0 5.9 5.7 5.3 4.7 4.0 4.1 3.8 3.9‡ 4.4e 4.4 4.4 4.2 3.9 -0.4 Hispanic — 12.2 13.7 15.2 15.3 14.7 13.6 13.5 14.5 13.9 12.2‡ 11.9e 10.8 10.4 9.9 9.2 -0.8
(Table continued on next page)
TABLE D-4 Any Illicit Drug Other Than Marijuana:a Trends in Annual Prevalence of Use
by Subgroups for Eighth Graders
Percentage who used in last twelve months’05–’06change
264

changed forms only; N is one-half of N indicated. In 2002 the remaining forms were changed. Beginning in 2002, the data are based on all forms. Data for “hallucinogens” and “hallucinogens other than LSD” are also affected by these changes and have been treated in a parallel manner.
or tranquilizers not under a doctor’s orders. The use of other narcotics and sedatives (barbiturates) has been excluded because 8th and 10th graders appear to overreport their use (perhaps because they include the use of nonprescription drugs in their answers).
eThe 2002 data comprise half of the 2001 sample data double-weighted and all of the 2002 sample data.
cParental education is an average score of mother’s education and father’s education. See Appendix B for details.dTo derive percentages for each racial subgroup, data for the specified year and the previous year have been combined to increase subgroupsample sizes and thus provide more stable estimates. For the data beginning in 2005, see the race/ethnicity note at the end of Appendix D.
bIn 2001 the question text was changed on half of the questionnaire forms. “Other psychedelics” was changed to “other hallucinogens,” and “shrooms” was added to the list of examples. For the tranquilizer list of examples, Miltown was replaced with Xanax. The 2001 data are based on the
See Table D-106 for the number of subgroup cases. See Appendix B for definition of variables in table.
aUse of "any illicit drug other than marijuana" includes any use of LSD, other hallucinogens, crack, other cocaine, or heroin, or any use of amphetamines
Level of significance of difference between the two most recent classes: s = .05, ss = .01, sss = .001. ‘—’ indicates data not available. Any apparent inconsistency between the change estimate and the prevalence-of-use estimates for the two most recent classes is due to rounding error.
Notes: ‘‡’ indicates some change in the question. See relevant footnote. See relevant figure to assess the impact of the wording changes. Source: The Monitoring the Future Study, the University of Michigan.
TABLE D-4 (cont'd) Any Illicit Drug Other Than Marijuana:a Trends in Annual Prevalence of Use
by Subgroups for Eighth Graders
265

1991 1992 1993 1994 1995 1996 1997 1998 1999 2000 2001b 2002b 2003 2004 2005 2006Approx. N = 14,800 14,800 15,300 15,800 17,000 15,600 15,500 15,000 13,600 14,300 14,000 14,300 15,800 16,400 16,200 16,200
Total 12.2 12.3 13.9 15.2 17.5 18.4 18.2 16.6 16.7 16.7‡ 17.9 15.7 13.8 13.5 12.9 12.7 -0.2Gender: Male 11.2 11.1 13.4 14.1 15.8 17.2 17.2 15.6 15.9 16.7‡ 18.3 15.1 13.0 12.7 12.0 12.0 0.0 Female 13.1 13.2 14.3 16.0 18.9 19.6 19.1 17.5 17.3 16.6‡ 17.4 16.4 14.3 14.2 13.6 13.1 -0.5College Plans: None or under 4 years 19.6 20.2 23.1 24.0 27.5 29.5 29.6 27.8 27.3 27.7‡ 32.1 27.1 23.8 25.3 24.0 24.7 +0.7 Complete 4 years 10.7 10.5 12.0 13.3 15.7 16.5 16.3 14.6 15.0 15.0‡ 15.5 14.0 12.1 11.9 11.4 11.1 -0.3Region: Northeast 10.6 9.6 12.8 13.7 14.1 17.2 16.0 17.2 18.2 14.7‡ 16.2 13.4 11.7 13.7 13.0 10.4 -2.6 North Central 13.2 12.9 12.8 14.8 19.0 20.0 16.2 14.4 16.1 15.8‡ 16.5 15.3 13.1 12.0 12.2 12.7 +0.5 South 11.9 12.2 14.7 15.3 18.4 18.6 20.8 18.3 16.8 17.5‡ 19.5 16.8 15.7 14.8 13.9 13.7 -0.2 West 12.7 14.1 15.6 17.2 17.2 17.4 18.7 15.8 15.7 18.5‡ 19.0 16.7 13.8 13.5 12.0 13.3 +1.3Population Density: Large MSA 11.8 11.4 12.2 13.1 13.5 16.8 16.3 14.6 15.0 17.2‡ 15.6 14.3 10.8 10.4 10.9 11.5 +0.6 Other MSA 12.3 12.3 14.1 16.1 18.5 19.5 18.0 16.6 17.3 15.6‡ 17.4 16.5 14.2 15.1 13.2 12.9 -0.4 Non-MSA 12.4 13.1 15.0 14.6 17.6 18.3 20.8 18.9 17.55 18.1‡ 21.5 16.1 17.2 14.5 14.7 14.1 -0.6Parental Education:c
1.0-2.0 (Low) 14.4 16.6 18.1 17.1 20.8 22.7 19.1 21.5 19.2 20.4‡ 19.6 21.0 19.1 16.5 15.9 16.0 +0.2 2.5-3.0 13.7 12.5 14.6 16.3 19.7 19.4 19.9 19.1 19.1 19.4‡ 20.3 18.3 16.7 15.6 14.4 14.9 +0.5 3.5-4.0 12.1 12.7 14.8 15.9 18.3 19.9 19.8 16.4 16.5 17.4‡ 19.7 16.1 14.5 14.6 13.7 13.4 -0.3 4.5-5.0 11.0 10.9 11.7 13.3 15.9 16.6 16.5 14.1 15.4 14.5‡ 15.6 13.7 11.2 11.6 11.5 10.7 -0.9 5.5-6.0 (High) 11.6 10.7 12.2 12.8 13.4 15.4 15.4 14.4 15.6 14.5‡ 14.6 12.2 10.5 11.0 10.8 11.1 +0.2Race (2-year average):d
White — 13.7 14.4 15.4 17.7 20.0 20.5 19.7 18.7 18.6 19.2‡ 18.9e 17.2 15.7 14.9 14.4 -0.5 Black — 4.3 4.6 5.4 5.4 4.5 4.8 4.7 4.5 4.2 4.7‡ 5.7e 4.7 4.6 4.8 4.9 0.0 Hispanic — 11.8 13.7 16.1 16.9 18.8 19.1 17.5 17.9 17.8 15.8‡ 15.7e 15.2 15.1 14.9 13.0 -1.9
TABLE D-5 Any Illicit Drug Other Than Marijuana:a Trends in Annual Prevalence of Use
Percentage who used in last twelve months
by Subgroups for Tenth Graders
’05–’06change
(Table continued on next page)
266

Source: The Monitoring the Future Study, the University of Michigan.Notes: ‘‡’ indicates some change in the question. See relevant footnote. See relevant figure to assess the impact of the wording changes. Level of significance of difference between the two most recent classes: s = .05, ss = .01, sss = .001. ‘—’ indicates data not available.
cParental education is an average score of mother’s education and father’s education. See Appendix B for details.dTo derive percentages for each racial subgroup, data for the specified year and the previous year have been combined to increase subgroup
TABLE D-5 (cont'd) Any Illicit Drug Other Than Marijuana:a Trends in Annual Prevalence of Use
by Subgroups for Tenth Graders
Any apparent inconsistency between the change estimate and the prevalence-of-use estimates for the two most recent classes is due to rounding error. See Table D-107 for the number of subgroup cases. See Appendix B for definition of variables in table.
changed forms only; N is one-half of N indicated. In 2002 the remaining forms were changed. Beginning in 2002, the data are based on all forms.
sample sizes and thus provide more stable estimates. For the data beginning in 2005, see the race/ethnicity note at the end of Appendix D.eThe 2002 data comprise half of the 2001 sample data double-weighted and all of the 2002 sample data.
aUse of "any illicit drug other than marijuana" includes any use of LSD, other hallucinogens, crack, other cocaine, or heroin, or any use of amphetamines or tranquilizers not under a doctor’s orders. The use of other narcotics and sedatives (barbiturates) has been excluded because 8th and 10th graders appear to overreport their use (perhaps because they include the use of nonprescription drugs in their answers).bIn 2001 the question text was changed on half of the questionnaire forms. “Other psychedelics” was changed to “other hallucinogens,” and
Data for “hallucinogens” and “hallucinogens other than LSD” are also affected by these changes and have been treated in a parallel manner.
“shrooms” was added to the list of examples. For the tranquilizer list of examples, Miltown was replaced with Xanax. The 2001 data are based on the
267

1975 1976 1977 1978 1979 1980 1981 1982 1983 1984 1985 1986 1987 1988 1989 1990Approx. N = 9,400 15,400 17,100 17,800 15,500 15,900 17,500 17,700 16,300 15,900 16,000 15,200 16,300 16,300 16,700 15,200
Total 26.2 25.4 26.0 27.1 28.2 30.4 34.0 30.1 28.4 28.0 27.4 25.9 24.1 21.1 20.0 17.9Gender: Male 25.9 25.7 26.3 27.9 29.4 30.2 32.8 31.0 28.9 28.2 27.9 26.2 24.3 22.2 21.0 19.2 Female 26.2 24.4 25.3 25.7 26.3 30.0 34.3 28.3 27.3 26.9 26.2 24.8 23.3 19.3 18.5 16.0College Plans: None or under 4 years — 28.7 30.1 30.0 31.8 35.5 38.3 34.0 32.3 32.9 31.6 31.3 28.8 24.5 25.5 23.1 Complete 4 years — 20.9 20.8 22.7 23.5 25.5 30.1 26.0 24.7 23.3 24.1 22.2 21.3 19.0 17.2 15.2Region: Northeast 26.0 26.1 27.8 30.7 32.0 32.1 38.0 33.5 31.2 33.8 32.9 29.5 25.5 20.2 19.2 17.1 North Central 29.2 26.1 27.7 26.8 27.6 30.9 36.1 31.1 28.6 26.1 25.9 25.1 22.7 20.3 21.5 18.0 South 22.5 23.4 22.9 24.0 23.2 25.8 26.1 24.7 23.8 24.2 21.0 20.6 21.1 20.0 18.1 16.9 West 28.2 26.6 26.0 28.8 33.3 35.2 38.7 32.7 33.0 31.3 33.0 31.6 29.5 24.8 22.3 20.4Population Density: Large MSA 30.3 27.5 27.1 30.2 32.1 34.6 38.3 33.8 31.5 30.5 30.4 28.3 24.5 20.7 16.9 16.0 Other MSA 26.3 25.8 26.8 27.3 28.7 30.1 33.3 30.0 29.7 27.8 26.9 26.4 24.5 22.7 20.9 18.5 Non-MSA 23.4 23.3 24.2 24.2 24.7 27.5 31.4 27.0 24.4 26.2 25.5 23.1 23.0 18.4 21.1 18.4Parental Education:d
1.0-2.0 (Low) — 23.2 23.2 24.7 25.2 28.2 29.2 25.7 25.6 27.3 25.8 23.2 21.5 19.7 18.2 15.2 2.5-3.0 — 25.6 27.0 26.4 27.6 30.7 33.5 30.4 28.1 28.2 27.4 27.0 24.2 20.5 20.0 17.9 3.5-4.0 — 26.1 26.2 27.8 29.2 30.7 34.7 30.9 28.6 29.3 28.9 26.6 24.7 20.5 21.4 19.1 4.5-5.0 — 27.2 25.9 27.3 28.7 29.9 34.8 29.4 30.0 26.2 27.1 24.9 23.8 21.7 19.3 17.5 5.5-6.0 (High) — 25.6 24.8 28.6 30.4 30.8 36.7 31.3 29.0 26.2 23.8 23.8 24.9 22.0 19.6 17.2Race (2-year average):e
White — — 26.6 27.7 28.8 30.6 34.5 32.1 31.2 30.2 29.6 28.2 26.6 24.4 22.5 21.0 Black — — 14.2 13.4 13.0 13.8 13.2 14.5 15.2 12.9 12.0 12.1 11.1 10.3 8.6 6.5 Hispanic — — 23.8 23.5 23.3 24.7 27.6 25.5 25.2 26.2 27.2 26.2 23.0 20.5 17.7 15.6
Class of:
TABLE D-6Any Illicit Drug Other Than Marijuana:a,b Trends in Annual Prevalence of Use
by Subgroups for Twelfth Graders
Percentage who used in last twelve monthsCont'd
268

1991 1992 1993 1994 1995 1996 1997 1998 1999 2000 2001c 2002c 2003 2004 2005 2006Approx. N = 15,000 15,800 16,300 15,400 15,400 14,300 15,400 15,200 13,600 12,800 12,800 12,900 14,600 14,600 14,700 14,200
Total 16.2 14.9 17.1 18.0 19.4 19.8 20.7 20.2 20.7 20.4‡ 21.6 20.9 19.8 20.5 19.7 19.2 -0.5Gender: Male 17.0 15.5 17.8 18.5 20.7 21.7 21.7 21.7 22.5 21.5‡ 23.3 22.0 21.1 21.5 21.4 19.7 -1.7 Female 14.8 13.8 15.8 16.9 17.3 16.8 18.8 18.0 18.5 18.6‡ 19.0 19.0 17.9 18.7 17.5 18.3 +0.7College Plans: None or under 4 years 20.1 19.5 19.8 22.9 23.9 24.2 25.8 26.5 24.4 24.7‡ 24.5 27.2 26.5 26.0 25.3 25.4 +0.1 Complete 4 years 14.3 13.0 15.9 16.0 17.5 17.9 18.4 17.8 19.4 18.5‡ 19.9 19.0 17.4 18.4 18.0 17.4 -0.6Region: Northeast 15.6 14.7 18.6 17.2 20.2 22.9 24.1 20.7 19.5 21.7‡ 22.4 21.5 19.3 20.4 18.0 20.3 +2.3 North Central 17.4 15.5 16.4 20.1 19.1 19.2 18.9 19.8 20.9 18.9‡ 24.0 19.9 18.7 19.1 21.4 17.9 -3.5 South 14.4 14.0 16.0 17.3 19.0 18.6 19.8 20.3 21.2 19.0‡ 18.6 21.3 19.4 20.8 20.5 19.7 -0.8 West 17.9 15.8 18.5 17.3 19.9 19.2 20.9 20.0 20.8 23.2‡ 22.6 21.1 22.4 21.9 18.0 19.1 +1.1Population Density: Large MSA 14.2 13.5 15.1 16.7 20.2 18.9 18.6 19.0 17.6 19.4‡ 23.6 20.6 15.9 18.0 18.6 20.1 +1.4 Other MSA 17.9 14.9 18.2 19.2 19.2 20.2 21.5 20.4 21.6 20.9‡ 21.2 21.6 22.0 22.3 20.6 18.7 -1.8 Non-MSA 14.9 16.1 16.8 17.21 18.7 19.8 21.2 21.3 22.4 20.7‡ 20.3 20.2 20.9 19.7 19.3 18.9 -0.4Parental Education:d
1.0-2.0 (Low) 17.4 14.9 15.6 17.8 19.4 16.9 19.9 20.0 22.2 20.0‡ 17.3 17.8 19.4 18.7 14.8 19.7 +4.9 s 2.5-3.0 16.8 15.0 16.1 18.5 19.4 19.7 19.4 20.1 21.0 19.9‡ 20.9 20.3 19.6 20.0 20.5 19.4 -1.2 3.5-4.0 16.3 15.0 17.8 17.6 19.2 19.8 20.4 21.0 21.9 20.5‡ 24.5 22.0 21.7 23.0 21.5 20.2 -1.3 4.5-5.0 14.6 14.3 17.5 18.4 19.4 19.3 21.0 19.1 19.3 20.1‡ 20.1 21.2 18.5 19.7 19.7 18.6 -1.1 5.5-6.0 (High) 14.9 14.3 17.6 16.5 18.3 20.2 21.7 18.9 19.4 20.3‡ 18.7 19.8 17.0 17.6 17.5 18.0 +0.5Race (2-year average):e
White 18.7 17.1 17.9 19.4 20.3 21.2 22.3 23.1 22.9 22.7 23.0‡ 24.1f 23.0 22.8 22.7 22.0 -0.7 Black 5.7 5.3 4.8 6.1 6.9 6.0 6.4 7.1 6.8 6.4 6.3‡ 6.0f 6.3 6.5 7.1 7.2 +0.1 Hispanic 15.8 15.1 15.6 16.5 17.9 19.7 18.9 17.5 18.5 21.2 18.2‡ 16.1f 16.0 16.2 16.7 17.3 +0.6
TABLE D-6 (cont'd)Any Illicit Drug Other Than Marijuana:a,b Trends in Annual Prevalence of Use
by Subgroups for Twelfth Graders
(Table continued on next page)
’05–’06change
Percentage who used in last twelve monthsClass of:
269

sample sizes and thus provide more stable estimates. For the data beginning in 2005, see the race/ethnicity note at the end of Appendix D.
Any Illicit Drug Other Than Marijuana:a,b Trends in Annual Prevalence of Useby Subgroups for Twelfth Graders
Notes: ‘‡’ indicates some change in the question. See relevant footnote. See relevant figure to assess the impact of the wording changes.
TABLE D-6 (cont'd)
Level of significance of difference between the two most recent classes: s = .05, ss = .01, sss = .001. ‘—’ indicates data not available.
Source: The Monitoring the Future Study, the University of Michigan.
rounding error.
dParental education is an average score of mother’s education and father’s education. See Appendix B for details.eTo derive percentages for each racial subgroup, data for the specified year and the previous year have been combined to increase subgroup
See Table D-108 for the number of subgroup cases. See Appendix B for definition of variables in table.
aUse of "any illicit drug other than marijuana" includes any use of LSD, other hallucinogens, crack, other cocaine, or heroin, or any use of other narcotics, amphetamines, sedatives (barbiturates), methaqualone (excluded since 1990), or tranquilizers not under a doctor’s orders.
fThe 2002 data comprise half of the 2001 sample data double-weighted and all of the 2002 sample data.
bBeginning in 1982 the question about amphetamine use was revised to get respondents to exclude the inappropriate reporting of nonprescription amphetamines. The prevalence-of-use rate dropped slightly as a result of this methodological change.cIn 2001 the question text was changed on half of the questionnaire forms. “Other psychedelics” was changed to “other hallucinogens” and“shrooms” was added to the list of examples. For the tranquilizer list of examples, Miltown was replaced with Xanax. The 2001 data are based on the changed forms only; N is one-half of N indicated. In 2002 the remaining forms were changed. Beginning in 2002, the data are based on all forms. Data for “hallucinogens” and “hallucinogens other than LSD” are also affected by these changes and have been treated in a parallel manner.
Any apparent inconsistency between the change estimate and the prevalence-of-use estimates for the two most recent classes is due to
270

1991 1992 1993 1994 1995 1996 1997 1998 1999 2000 2001 2002 2003 2004 2005 2006Approx. N = 17,500 18,600 18,300 17,300 17,500 17,800 18,600 18,100 16,700 16,700 16,200 15,100 16,500 17,000 16,800 16,500
Total 6.2 7.2 9.2 13.0 15.8 18.3 17.7 16.9 16.5 15.6 15.4 14.6 12.8 11.8 12.2 11.7 -0.5Gender: Male 7.3 7.4 10.5 15.1 17.7 19.6 19.2 18.0 18.1 16.7 18.1 17.0 13.9 12.3 13.0 12.7 -0.3 Female 5.1 6.9 8.0 10.9 13.7 16.9 16.1 15.3 14.9 14.3 12.8 12.4 11.5 11.2 11.4 10.4 -0.9College Plans: None or under 4 years 15.8 17.5 22.4 27.7 30.3 34.6 34.5 35.0 34.9 33.6 34.4 33.1 31.3 29.0 30.5 28.8 -1.7 Complete 4 years 4.6 5.5 7.3 11.0 13.8 15.8 15.5 14.5 14.0 13.4 13.2 12.7 10.7 10.0 10.2 10.0 -0.2Region: Northeast 5.0 5.8 6.2 12.1 13.0 15.3 16.2 11.7 14.4 13.2 14.5 11.3 10.0 10.2 9.8 9.3 -0.6 North Central 5.9 6.0 8.0 12.0 17.5 18.6 17.0 18.1 18.5 16.6 14.1 14.3 12.3 10.9 12.8 11.0 -1.9 South 6.1 7.3 9.0 11.4 14.7 17.1 17.2 17.9 16.7 15.2 16.8 16.3 14.4 12.9 13.5 13.8 +0.3 West 7.8 10.3 14.8 18.1 18.4 22.5 20.6 18.2 15.6 16.9 15.5 15.3 12.9 12.3 11.4 10.6 -0.8Population Density: Large MSA 5.2 6.7 8.0 13.1 15.6 18.3 16.4 16.0 15.6 14.5 12.4 12.7 11.5 10.8 11.7 10.3 -1.4 Other MSA 7.2 8.3 10.9 15.7 17.2 19.5 18.2 17.4 15.4 14.8 17.4 15.2 12.9 12.4 12.9 12.5 -0.3 Non-MSA 5.3 5.7 7.2 8.0 13.7 15.8 18.0 16.9 19.7 18.5 15.3 16.1 14.1 11.9 11.6 12.0 +0.3Parental Education:a
1.0-2.0 (Low) 13.2 12.7 13.6 18.7 23.0 20.2 24.8 25.0 25.8 26.2 26.0 24.2 22.5 19.7 18.2 19.4 +1.3 2.5-3.0 7.0 7.7 10.7 14.5 17.9 20.6 20.3 20.0 20.8 19.4 19.5 18.7 16.5 15.4 17.4 15.1 -2.2 3.5-4.0 6.2 7.0 9.7 13.2 17.2 20.2 19.5 17.7 16.3 15.9 16.7 15.4 13.7 12.8 12.8 13.1 +0.2 4.5-5.0 3.7 5.4 7.4 10.9 12.7 16.2 15.7 13.7 11.7 10.8 11.1 11.4 8.9 9.0 8.9 8.0 -0.8 5.5-6.0 (High) 4.6 5.2 6.4 11.0 13.0 14.7 12.1 12.7 12.4 11.5 9.4 9.7 8.0 7.7 7.1 7.1 -0.1Race (2-year average):b
White — 6.4 7.8 10.0 13.5 16.7 17.8 16.7 15.4 14.9 14.7 14.5 13.0 11.5 11.1 10.9 -0.2 Black — 4.1 5.7 8.9 11.9 14.0 15.3 16.0 16.3 16.1 14.6 12.7 12.6 12.8 13.6 12.9 -0.6 Hispanic — 11.9 13.9 18.1 20.4 20.8 21.8 22.7 22.8 20.1 19.9 21.1 19.1 16.7 14.7 14.3 -0.4
change
more stable estimates. For the data beginning in 2005, see the race/ethnicity note at the end of Appendix D.
Source: The Monitoring the Future Study, the University of Michigan.
TABLE D-7
aParental education is an average score of mother’s education and father’s education. See Appendix B for details.bTo derive percentages for each racial subgroup, data for the specified year and the previous year have been combined to increase subgroup sample sizes and thus provide
Marijuana: Trends in Annual Prevalence of Use by Subgroups for Eighth Graders
Notes: Level of significance of difference between the two most recent classes: s = .05, ss = .01, sss = .001. ‘—’ indicates data not available.
Any apparent inconsistency between the change estimate and the prevalence-of-use estimates for the two most recent classes is due to rounding error.
See Table D-106 for the number of subgroup cases. See Appendix B for definition of variables in table.
Percentage who used in last twelve months’05–’06
271

1991 1992 1993 1994 1995 1996 1997 1998 1999 2000 2001 2002 2003 2004 2005 2006Approx. N = 14,800 14,800 15,300 15,800 17,000 15,600 15,500 15,000 13,600 14,300 14,000 14,300 15,800 16,400 16,200 16,200
Total 16.5 15.2 19.2 25.2 28.7 33.6 34.8 31.1 32.1 32.2 32.7 30.3 28.2 27.5 26.6 25.2 -1.4Gender: Male 17.7 16.3 21.2 28.2 30.6 36.0 37.3 32.2 34.3 36.1 36.0 32.3 30.0 29.0 28.1 26.3 -1.8 Female 15.1 13.9 16.9 21.9 26.5 31.4 32.3 30.1 29.7 28.4 29.6 28.4 26.4 25.8 24.9 24.0 -0.9College Plans: None or under 4 years 26.9 25.1 31.5 37.3 41.8 48.9 51.5 46.8 48.3 48.8 47.4 46.6 44.6 41.9 41.4 42.0 +0.6 Complete 4 years 14.2 13.0 16.5 22.4 26.4 31.0 32.0 28.2 29.3 29.7 30.3 27.7 25.5 25.4 24.6 23.0 -1.6Region: Northeast 17.1 14.9 22.4 25.6 28.8 34.8 34.6 35.4 34.4 30.3 34.1 31.7 29.5 29.2 28.7 24.9 -3.7 North Central 15.8 14.8 17.4 23.4 26.6 33.1 34.4 28.5 31.6 31.1 31.7 29.0 25.0 25.3 26.4 24.8 -1.6 South 14.5 12.5 16.4 23.8 28.4 33.9 34.4 30.7 30.9 31.4 31.2 28.9 29.6 29.0 27.4 25.5 -1.9 West 19.4 20.4 24.0 30.0 32.2 32.4 36.5 30.7 32.0 37.1 36.4 33.4 28.8 26.4 23.4 25.3 +2.0Population Density: Large MSA 16.5 15.1 19.0 26.3 27.8 31.5 34.1 28.7 31.2 32.4 30.0 29.0 27.1 25.9 25.3 24.0 -1.4 Other MSA 17.3 15.9 19.8 28.2 31.2 36.2 36.6 33.1 33.6 32.8 35.2 32.4 28.7 27.8 28.0 25.1 -2.9 Non-MSA 14.9 13.9 18.2 18.5 24.8 30.9 32.5 30.2 30.0 31.1 30.9 27.6 29.0 29.0 25.5 27.4 +1.9Parental Education:a
1.0-2.0 (Low) 20.3 18.9 22.4 25.8 32.0 32.9 34.5 31.7 38.1 37.1 33.6 33.5 33.7 33.2 28.6 31.9 +3.3 2.5-3.0 17.8 16.0 19.7 26.3 31.8 35.6 36.8 35.3 35.4 34.9 37.1 35.1 32.2 30.6 31.1 29.6 -1.5 3.5-4.0 16.2 15.1 19.3 25.6 30.0 36.4 37.8 31.6 31.9 35.0 32.6 30.1 29.4 29.5 27.1 26.6 -0.4 4.5-5.0 14.9 14.1 17.6 23.8 27.0 31.7 33.1 28.3 28.8 28.9 31.4 27.9 24.3 24.3 24.5 21.8 -2.8 s 5.5-6.0 (High) 15.9 13.7 18.5 23.3 23.4 30.3 30.5 27.7 30.6 27.3 29.4 25.8 24.3 22.5 23.6 21.2 -2.4Race (2-year average):b
White — 17.0 18.0 22.6 27.7 32.0 35.3 34.2 32.5 32.6 32.9 32.7 30.6 28.2 27.3 26.6 -0.7 Black — 7.6 8.7 15.3 20.9 25.7 28.4 26.9 26.3 27.6 28.7 26.5 25.1 27.0 27.2 24.5 -2.6 Hispanic — 18.9 21.3 25.1 29.2 34.6 36.8 34.4 34.0 34.8 34.9 31.6 28.8 29.8 28.6 24.9 -3.7
change
Notes: Level of significance of difference between the two most recent classes: s = .05, ss = .01, sss = .001. ‘—’ indicates data not available.
Any apparent inconsistency between the change estimate and the prevalence-of-use estimates for the two most recent classes is due to rounding error.
See Table D-107 for the number of subgroup cases. See Appendix B for definition of variables in table.
TABLE D-8 Marijuana: Trends in Annual Prevalence of Use by Subgroups for Tenth Graders
Percentage who used in last twelve months’05–’06
Source: The Monitoring the Future Study, the University of Michigan.
aParental education is an average score of mother’s education and father’s education. See Appendix B for details.bTo derive percentages for each racial subgroup, data for the specified year and the previous year have been combined to increase subgroup sample sizes and thus provide
more stable estimates. For the data beginning in 2005, see the race/ethnicity note at the end of Appendix D.
272

1975 1976 1977 1978 1979 1980 1981 1982 1983 1984 1985 1986 1987 1988 1989 1990Approx. N = 9,400 15,400 17,100 17,800 15,500 15,900 17,500 17,700 16,300 15,900 16,000 15,200 16,300 16,300 16,700 15,200
Total 40.0 44.5 47.6 50.2 50.8 48.8 46.1 44.3 42.3 40.0 40.6 38.8 36.3 33.1 29.6 27.0Gender: Male 45.8 50.6 53.2 55.9 55.8 53.4 49.2 47.2 45.7 43.2 43.1 41.2 38.6 35.8 32.8 29.4 Female 34.9 37.8 42.0 44.3 45.7 44.1 42.5 40.8 38.4 36.0 37.8 36.0 33.8 30.3 26.3 24.2College Plans: None or under 4 years — 46.8 50.7 51.6 53.1 51.7 49.7 48.2 46.0 44.2 44.0 42.7 40.6 36.2 34.4 31.1 Complete 4 years — 40.7 43.4 47.1 47.3 45.9 42.6 40.6 38.3 35.9 37.5 36.1 34.0 31.3 27.3 24.7Region: Northeast 47.4 52.7 53.5 59.2 60.6 55.5 53.2 50.9 49.3 49.6 48.2 44.6 41.2 36.7 31.3 32.2 North Central 40.1 44.0 48.1 51.6 52.2 48.9 46.8 45.6 42.0 36.4 40.8 40.2 37.4 34.3 33.0 28.7 South 32.4 37.9 42.5 42.7 41.2 42.0 38.0 36.7 36.1 35.6 31.0 31.7 30.2 28.7 25.0 21.4 West 44.1 45.8 46.8 49.1 51.9 51.7 49.6 45.5 44.8 43.2 46.2 41.2 39.6 35.6 32.3 28.3Population Density: Large MSA 50.4 51.3 53.2 57.2 58.7 56.3 51.4 50.4 47.0 44.2 44.4 42.6 39.3 34.3 27.8 27.7 Other MSA 40.3 44.2 48.9 50.8 51.9 49.8 46.4 44.8 44.0 41.0 40.7 39.4 36.9 34.7 30.3 28.3 Non-MSA 32.9 39.8 41.2 43.3 43.3 41.9 41.6 38.5 36.5 35.3 37.3 34.7 32.2 29.0 30.0 23.5Parental Education:a
1.0-2.0 (Low) 35.2 38.9 41.0 42.5 46.0 43.7 41.8 38.9 39.7 35.7 37.1 33.4 30.7 30.7 23.3 21.0 2.5-3.0 39.2 46.1 48.2 50.3 50.0 49.0 45.3 44.5 42.2 40.1 40.6 38.8 36.3 31.1 29.6 26.9 3.5-4.0 38.5 44.9 49.5 51.4 52.7 49.8 47.0 46.5 42.2 41.4 41.0 40.1 36.8 33.4 31.4 27.6 4.5-5.0 40.6 46.8 49.3 53.2 53.7 50.5 47.6 45.9 43.5 39.6 43.2 39.9 37.5 35.1 29.7 28.5 5.5-6.0 (High) 38.7 47.5 48.6 55.2 51.2 52.0 48.5 45.7 43.7 39.9 37.9 38.9 38.6 35.9 30.7 29.4Race (2-year average):b
White — — 46.8 50.1 51.8 51.2 49.1 47.1 44.6 42.0 41.6 41.4 39.7 37.6 34.5 31.6 Black — — 37.9 39.6 38.4 37.5 36.1 35.5 37.4 36.4 33.4 30.6 25.7 21.2 17.8 13.7 Hispanic — — 45.8 43.4 42.1 44.1 41.2 38.8 38.3 38.8 37.8 36.7 33.3 29.6 25.0 21.6
TABLE D-9Marijuana: Trends in Annual Prevalence of Use by Subgroups for Twelfth Graders
Percentage who used in last twelve monthsClass of:
Notes: Level of significance of difference between the two most recent classes: s = .05, ss = .01, sss = .001. ‘—’ indicates data not available.
Any apparent inconsistency between the change estimate and the prevalence-of-use estimates for the two most recent classes is due to rounding error.
See Table D-108 for the number of subgroup cases. See Appendix B for definition of variables in table.
Source: The Monitoring the Future Study, the University of Michigan.
Cont'd
273

1991 1992 1993 1994 1995 1996 1997 1998 1999 2000 2001 2002 2003 2004 2005 2006Approx. N = 15,000 15,800 16,300 15,400 15,400 14,300 15,400 15,200 13,600 12,800 12,800 12,900 14,600 14,600 14,700 14,200
Total 23.9 21.9 26.0 30.7 34.7 35.8 38.5 37.5 37.8 36.5 37.0 36.2 34.9 34.3 33.6 31.5 -2.1Gender: Male 27.2 24.4 29.0 35.1 38.1 39.4 40.9 41.7 41.4 39.2 40.1 39.9 37.8 37.4 37.6 32.7 -4.8 ss Female 20.1 18.9 22.4 26.4 30.6 31.6 35.5 33.0 34.1 33.4 33.6 32.4 31.6 30.8 29.6 29.7 +0.2College Plans: None or under 4 years 27.6 27.5 29.1 34.4 39.0 41.7 44.6 43.0 43.2 40.3 41.5 40.9 42.1 39.0 41.3 39.9 -1.4 Complete 4 years 22.0 19.4 24.4 29.1 32.6 33.4 36.4 35.2 35.9 34.6 35.3 34.7 32.3 32.6 31.5 29.1 -2.4Region: Northeast 28.2 23.9 31.2 36.0 37.7 40.0 43.5 43.0 39.0 42.3 43.8 41.9 40.5 40.1 39.6 38.1 -1.5 North Central 26.1 22.7 26.0 30.5 36.9 36.9 36.5 33.8 38.0 34.5 36.9 37.5 36.5 34.0 33.7 32.0 -1.6 South 18.1 18.1 23.2 28.7 31.8 32.8 35.0 36.5 36.0 30.7 32.4 32.6 29.4 30.1 31.2 29.4 -1.9 West 26.8 26.1 26.4 30.0 33.8 35.6 42.6 39.0 39.8 43.1 38.4 35.2 36.2 35.6 32.0 28.8 -3.2Population Density: Large MSA 24.3 22.6 29.1 32.0 37.5 37.2 38.3 38.4 38.7 37.1 39.2 37.7 32.3 32.3 34.5 33.4 -1.1 Other MSA 27.5 22.1 26.2 32.7 34.9 38.6 40.5 38.8 39.1 38.1 36.7 38.0 38.1 37.9 35.0 31.9 -3.1 Non-MSA 17.5 21.0 23.1 25.8 31.0 29.6 34.9 33.5 34.7 32.9 35.1 30.8 32.2 29.7 29.7 28.1 -1.6Parental Education:a
1.0-2.0 (Low) 22.4 21.2 23.0 26.3 30.9 31.3 34.8 34.2 35.5 36.5 33.9 30.8 31.4 28.7 27.3 32.0 +4.7 2.5-3.0 22.5 21.1 24.1 29.7 33.8 35.1 37.4 36.1 38.6 35.1 37.0 34.9 34.2 33.1 34.8 33.2 -1.6 3.5-4.0 24.0 22.7 26.6 31.5 34.2 36.1 38.1 39.0 38.6 36.8 38.4 38.5 36.2 36.9 35.5 31.6 -3.9 s 4.5-5.0 23.8 20.8 27.2 32.0 35.0 36.6 40.1 37.4 35.9 35.8 37.4 37.0 35.4 34.4 33.9 28.4 -5.5 ss 5.5-6.0 (High) 28.2 22.6 28.0 32.3 37.5 36.7 39.7 38.3 39.2 38.0 35.2 36.1 32.6 34.0 32.3 32.9 +0.6Race (2-year average):b
White 28.2 24.9 25.9 30.2 34.2 36.4 38.7 39.9 39.1 38.2 38.5 38.7 37.9 37.3 36.6 34.8 -1.7 Black 11.4 11.5 14.2 20.7 26.8 30.2 30.4 30.0 30.4 30.0 29.0 27.3 26.3 25.5 26.3 27.7 +1.4 Hispanic 23.6 24.7 23.5 25.7 29.7 32.3 36.4 37.2 37.8 40.5 37.6 34.6 31.1 29.5 29.6 28.7 -1.0
more stable estimates. For the data beginning in 2005, see the race/ethnicity note at the end of Appendix D.
’05–’06change
TABLE D-9 (cont'd)Marijuana: Trends in Annual Prevalence of Use by Subgroups for Twelfth Graders
aParental education is an average score of mother’s education and father’s education. See Appendix B for details.bTo derive percentages for each racial subgroup, data for the specified year and the previous year have been combined to increase subgroup sample sizes and thus provide
Percentage who used in last twelve monthsClass of:
274

1991 1992 1993 1994 1995 1996 1997 1998 1999 2000 2001 2002 2003 2004 2005 2006Approx. N = 17,500 18,600 18,300 17,300 17,500 17,800 18,600 18,100 16,700 16,700 16,200 15,100 16,500 17,000 16,800 16,500
Total 9.0 9.5 11.0 11.7 12.8 12.2 11.8 11.1 10.3 9.4 9.1 7.7 8.7 9.6 9.5 9.1 -0.4Gender: Male 9.0 9.2 10.4 11.2 11.5 10.3 10.5 10.6 9.5 8.9 8.4 7.6 7.7 8.8 7.8 7.7 -0.1 Female 9.0 9.8 11.9 12.2 14.0 14.1 12.9 11.6 11.1 9.9 9.9 7.8 9.6 10.5 11.1 10.5 -0.6College Plans: None or under 4 years 15.0 15.6 17.7 18.3 19.6 18.2 18.1 20.9 17.9 17.2 15.1 14.5 16.5 17.9 15.3 17.3 +2.0 Complete 4 years 8.1 8.8 10.2 10.9 11.9 11.4 11.2 10.2 9.5 8.6 8.6 7.1 8.0 8.7 9.0 8.3 -0.7Region: Northeast 8.0 8.6 11.3 12.0 13.1 11.7 12.1 9.1 9.8 8.7 9.4 6.9 9.0 8.9 9.1 7.2 -1.9 North Central 9.8 10.5 9.9 10.3 13.8 13.3 11.3 11.3 10.6 10.6 8.8 8.0 9.6 9.6 8.5 9.0 +0.5 South 8.9 9.1 10.0 11.3 12.1 11.3 11.6 11.3 9.9 8.4 9.5 8.4 7.9 9.9 9.8 9.1 -0.7 West 8.8 9.8 14.2 14.0 12.4 12.9 12.6 12.4 10.9 10.5 8.6 6.4 8.9 9.6 10.4 10.5 +0.1Population Density: Large MSA 9.9 9.1 10.8 11.6 11.7 11.4 10.4 8.6 8.8 8.3 8.3 7.1 8.0 8.8 8.8 8.8 0.0 Other MSA 8.5 10.3 12.3 13.1 13.7 13.4 11.5 11.1 10.1 9.4 8.9 8.0 8.5 10.3 10.7 9.0 -1.7 s Non-MSA 9.1 8.6 8.5 9.3 12.3 11.0 13.9 14.0 12.3 10.9 10.4 7.8 10.1 9.2 8.3 9.7 +1.4Parental Education:a
1.0-2.0 (Low) 12.0 11.4 11.5 12.4 13.0 11.3 12.1 14.4 12.9 13.1 10.7 10.3 10.6 12.6 11.6 10.5 -1.1 2.5-3.0 9.5 9.9 10.9 12.1 13.9 12.6 12.6 12.0 11.8 11.3 9.7 8.3 10.1 10.2 11.6 10.7 -1.0 3.5-4.0 8.9 10.0 11.5 12.3 14.7 13.4 13.5 12.8 10.8 9.9 9.4 8.9 10.3 11.0 10.0 10.3 +0.4 4.5-5.0 8.0 8.4 10.6 11.0 12.3 13.2 11.4 9.7 9.2 7.1 9.0 7.3 7.4 9.3 8.4 7.8 -0.6 5.5-6.0 (High) 8.4 10.3 12.6 12.2 11.6 11.7 10.8 10.6 9.1 9.2 7.7 6.2 6.5 6.9 8.0 7.9 0.0Race (2-year average):b
White — 10.1 11.3 12.4 13.8 14.6 14.1 13.3 12.1 10.9 10.1 9.1 8.8 9.6 9.8 9.7 -0.1 Black — 4.4 4.6 5.3 5.0 4.2 3.8 4.2 4.2 4.3 4.8 5.0 4.9 5.4 5.8 5.4 -0.4 Hispanic — 10.4 11.5 12.5 13.3 12.7 11.4 11.5 12.7 12.2 11.0 9.9 9.6 10.6 11.0 9.5 -1.5
aParental education is an average score of mother’s education and father’s education. See Appendix B for details.bTo derive percentages for each racial subgroup, data for the specified year and the previous year have been combined to increase subgroup sample sizes and thus provide
more stable estimates. For the data beginning in 2005, see the race/ethnicity note at the end of Appendix D.
TABLE D-10
Notes: Level of significance of difference between the two most recent classes: s = .05, ss = .01, sss = .001. ‘—’ indicates data not available.
Any apparent inconsistency between the change estimate and the prevalence-of-use estimates for the two most recent classes is due to rounding error.
See Table D-106 for the number of subgroup cases. See Appendix B for definition of variables in table.
Percentage who used in last twelve months’05–’06change
Inhalants: Trends in Annual Prevalence of Use by Subgroups for Eighth Graders
Source: The Monitoring the Future Study, the University of Michigan.
275

1991 1992 1993 1994 1995 1996 1997 1998 1999 2000 2001 2002 2003 2004 2005 2006Approx. N = 14,800 14,800 15,300 15,800 17,000 15,600 15,500 15,000 13,600 14,300 14,000 14,300 15,800 16,400 16,200 16,200
Total 7.1 7.5 8.4 9.1 9.6 9.5 8.7 8.0 7.2 7.3 6.6 5.8 5.4 5.9 6.0 6.5 +0.5Gender: Male 7.4 7.6 9.1 9.7 10.3 10.1 9.1 8.4 7.6 7.7 6.7 5.4 5.2 5.8 5.0 5.9 +0.9 Female 6.6 7.5 7.7 8.6 8.9 8.9 8.2 7.6 6.9 7.0 6.5 6.0 5.6 6.1 6.9 7.1 +0.2College Plans: None or under 4 years 12.0 12.4 14.0 15.1 14.6 14.3 14.4 13.5 11.6 11.2 11.0 9.8 9.6 11.2 9.9 10.6 +0.6 Complete 4 years 5.9 6.4 7.3 7.8 8.7 8.7 7.7 7.0 6.5 6.7 5.9 5.2 4.8 5.2 5.5 5.9 +0.4Region: Northeast 7.2 7.8 10.6 9.8 10.4 11.5 8.9 9.3 8.3 7.2 6.5 6.0 5.9 6.1 6.2 6.5 +0.3 North Central 7.5 8.0 8.3 8.4 10.4 9.8 8.3 6.7 8.4 7.5 6.5 5.8 6.1 5.7 6.1 6.7 +0.6 South 7.2 6.6 7.3 9.0 9.4 9.1 8.8 8.3 6.5 7.4 6.8 5.4 4.6 5.6 5.6 5.7 +0.1 West 6.2 8.0 8.4 9.9 8.1 8.0 8.5 7.8 6.1 7.2 6.7 6.2 5.5 6.6 6.1 7.2 +1.1Population Density: Large MSA 7.7 7.8 8.5 7.9 8.7 8.1 8.1 6.7 6.9 7.1 6.0 5.1 4.8 5.0 6.2 6.0 -0.2 Other MSA 7.1 7.4 8.4 9.8 9.7 9.6 8.4 7.7 7.0 6.8 6.9 5.4 5.2 6.3 5.6 6.4 +0.7 Non-MSA 6.5 7.5 8.6 9.1 10.5 11.0 9.8 10.1 8.3 8.5 7.0 7.4 7.1 6.5 6.5 7.4 +0.9Parental Education:a
1.0-2.0 (Low) 7.0 8.2 10.2 8.7 9.4 10.8 9.3 9.7 8.7 8.5 7.6 5.6 5.8 6.2 6.3 6.9 +0.6 2.5-3.0 8.0 7.9 9.1 9.5 11.0 9.9 8.5 9.1 8.0 8.1 7.5 6.0 6.3 6.9 6.9 6.2 -0.6 3.5-4.0 7.5 8.3 8.3 9.6 10.2 10.1 9.4 8.1 6.9 7.4 5.9 6.3 5.8 5.7 6.2 7.1 +0.8 4.5-5.0 6.4 6.5 7.2 8.7 9.4 8.4 8.3 7.1 6.7 6.5 6.8 5.6 5.1 5.7 5.8 5.5 -0.3 5.5-6.0 (High) 6.6 6.7 8.2 8.2 7.0 10.1 8.2 6.7 7.2 7.2 5.5 5.2 4.4 5.1 5.3 7.5 +2.3 sRace (2-year average):b
White — 8.3 8.8 9.6 10.6 11.0 10.4 9.6 8.9 8.4 7.9 7.1 6.6 6.5 6.6 6.8 +0.2 Black — 3.6 3.7 3.3 2.8 2.3 2.3 2.4 2.0 2.0 2.1 2.4 2.0 2.1 2.8 2.9 +0.2 Hispanic — 6.4 8.3 9.0 8.5 8.2 7.9 7.6 7.3 6.3 5.9 4.8 4.8 5.7 6.2 6.4 +0.2
TABLE D-11
aParental education is an average score of mother’s education and father’s education. See Appendix B for details.bTo derive percentages for each racial subgroup, data for the specified year and the previous year have been combined to increase subgroup sample sizes and thus provide
more stable estimates. For the data beginning in 2005, see the race/ethnicity note at the end of Appendix D.
Inhalants: Trends in Annual Prevalence of Use by Subgroups for Tenth Graders
Notes: Level of significance of difference between the two most recent classes: s = .05, ss = .01, sss = .001. ‘—’ indicates data not available.
Any apparent inconsistency between the change estimate and the prevalence-of-use estimates for the two most recent classes is due to rounding error.
See Table D-107 for the number of subgroup cases. See Appendix B for definition of variables in table.
Percentage who used in last twelve months’05–’06change
Source: The Monitoring the Future Study, the University of Michigan.
276

1975 1976 1977 1978 1979 1980 1981 1982 1983 1984 1985 1986 1987 1988 1989 1990Approx. N = 9,400 15,400 17,100 17,800 15,500 15,900 17,500 17,700 16,300 15,900 16,000 15,200 16,300 16,300 16,700 15,200
Total — 3.0 3.7 4.1 5.4 4.6 4.1 4.5 4.3 5.1 5.7 6.1 6.9 6.5 5.9 6.9 Adjustedb — — — — 8.9 7.9 6.1 6.6 6.2 7.2 7.5 8.9 8.1 7.1 6.9 7.5Gender: Male — 3.8 5.1 5.6 6.7 5.9 5.1 5.8 5.8 6.5 6.9 7.8 8.3 8.2 7.8 8.8 Female — 2.0 2.4 2.8 4.2 3.5 3.2 3.1 2.8 3.8 4.5 4.7 5.6 4.9 4.0 4.9College Plans: None or under 4 years — 3.6 4.7 5.0 6.3 5.0 4.3 4.9 4.7 5.8 5.8 7.7 8.0 8.1 7.1 7.8 Complete 4 years — 2.2 2.9 3.4 4.5 4.3 4.0 4.1 3.9 4.7 5.7 5.2 6.4 6.0 5.4 6.4Region: Northeast — 3.2 4.1 4.4 6.4 6.0 5.2 6.2 5.0 6.1 8.0 5.6 6.7 6.0 6.3 7.4 North Central — 2.6 4.2 4.8 5.9 4.6 3.8 3.6 4.5 5.0 5.8 6.7 8.6 7.2 6.7 8.0 South — 3.8 3.3 3.6 4.3 3.4 3.2 3.8 3.8 4.6 4.2 5.7 6.1 6.8 5.5 6.4 West — 1.7 3.0 3.6 4.9 4.9 4.7 4.4 4.3 5.3 5.4 6.6 6.2 5.6 4.8 5.7Population Density: Large MSA — 2.9 3.4 3.4 5.1 5.7 4.7 5.5 4.8 5.3 5.9 5.2 6.0 6.5 5.1 6.7 Other MSA — 2.6 3.6 3.7 4.8 4.2 4.0 3.9 4.4 5.0 5.9 6.3 6.9 6.0 5.8 6.8 Non-MSA — 3.4 4.2 5.3 6.2 4.4 3.7 4.4 3.9 5.2 5.4 6.6 7.8 7.5 6.8 7.4Parental Education:c
1.0-2.0 (Low) — 3.7 3.9 4.5 5.2 3.6 3.6 3.2 3.1 4.5 4.2 4.9 4.6 5.3 5.9 5.0 2.5-3.0 — 3.1 4.1 4.0 5.0 4.8 4.0 4.8 4.0 5.2 5.6 6.1 6.8 6.3 5.5 6.9 3.5-4.0 — 3.1 3.4 4.1 5.1 4.7 4.0 4.6 4.9 5.6 5.5 6.2 7.1 5.8 6.1 7.2 4.5-5.0 — 2.7 3.0 3.9 5.8 4.3 4.4 4.4 5.2 5.0 7.0 6.9 7.2 7.0 5.7 7.4 5.5-6.0 (High) — 3.7 4.2 5.0 7.2 5.8 4.9 6.0 4.7 5.6 6.8 6.4 8.7 9.1 6.8 7.6Race (2-year average):d
White — — 3.6 4.3 5.1 5.3 4.7 4.7 4.8 5.1 5.9 6.5 7.3 7.6 7.0 7.2 Black — — 1.5 1.3 2.1 2.2 2.1 1.9 1.8 2.2 2.0 2.1 3.0 3.1 2.2 2.1 Hispanic — — 2.7 3.0 2.9 2.9 3.5 4.1 3.4 4.6 6.5 5.5 4.6 4.1 4.7 4.8
indicated in Table D-108. Data based on three of six forms beginning in 1999; N is one-half of N indicated in Table D-108.
See Table D-108 for the number of subgroup cases. See Appendix B for definition of variables in table.
TABLE D-12Inhalants:a Trends in Annual Prevalence of Use by Subgroups for Twelfth Graders
Percentage who used in last twelve monthsClass of:
Source: The Monitoring the Future Study, the University of Michigan.
Notes: Level of significance of difference between the two most recent classes: s = .05, ss = .01, sss = .001. ‘—’ indicates data not available.
Data based on four of five forms in 1976–88; N is four-fifths of N indicated in Table D-108. Data based on five of six forms in 1989–98; N is five-sixths of N
Any apparent inconsistency between the change estimate and the prevalence-of-use estimates for the two most recent classes is due to rounding error.
Cont'd
277

1991 1992 1993 1994 1995 1996 1997 1998 1999 2000 2001 2002 2003 2004 2005 2006Approx. N = 15,000 15,800 16,300 15,400 15,400 14,300 15,400 15,200 13,600 12,800 12,800 12,900 14,600 14,600 14,700 14,200
Total 6.6 6.2 7.0 7.7 8.0 7.6 6.7 6.2 5.6 5.9 4.5 4.5 3.9 4.2 5.0 4.5 -0.5 Adjustedb 6.9 6.4 7.4 8.2 8.4 8.5 7.3 7.1 6.0 6.2 4.9 4.9 4.5 4.6 5.4 4.7 -0.7Gender: Male 8.2 8.0 9.2 9.6 9.9 9.1 8.3 7.5 6.5 6.8 5.5 5.8 5.2 4.8 6.2 5.1 -1.1 Female 5.0 4.5 4.8 6.0 6.2 6.1 5.2 5.1 4.9 5.1 3.5 3.3 2.9 3.4 4.1 3.9 -0.1College Plans: None or under 4 years 7.7 7.7 8.0 9.0 9.7 8.2 8.0 7.9 6.5 6.7 6.6 6.3 5.1 5.6 7.3 6.8 -0.5 Complete 4 years 6.3 5.7 6.7 7.4 7.4 7.3 6.5 5.7 5.4 5.5 3.9 4.2 3.5 3.8 4.6 3.9 -0.6Region: Northeast 6.7 6.0 8.9 10.3 10.3 10.8 9.4 8.0 6.2 6.3 5.7 5.4 5.1 4.3 6.0 5.9 0.0 North Central 8.6 7.4 6.3 9.5 8.6 7.6 6.9 7.6 6.3 5.5 5.0 5.6 3.7 3.8 5.6 4.8 -0.8 South 5.0 4.8 6.5 6.2 7.0 6.5 5.6 5.1 5.2 5.5 3.4 4.1 3.5 4.1 4.6 3.6 -1.0 West 6.8 7.5 7.0 5.7 6.7 6.0 5.4 4.7 4.9 6.7 4.8 3.2 3.6 4.6 4.3 4.7 +0.4Population Density: Large MSA 5.2 6.0 7.4 7.6 8.5 7.8 5.9 5.5 4.8 6.3 4.4 4.4 3.5 4.0 5.0 4.1 -0.9 Other MSA 7.8 6.6 7.3 7.7 7.8 7.9 6.5 6.1 5.3 4.9 4.3 4.4 4.4 4.1 5.1 4.5 -0.7 Non-MSA 5.8 5.6 6.0 7.6 7.8 7.0 8.1 7.4 6.9 7.2 5.2 4.8 3.7 4.3 4.9 5.2 +0.3Parental Education:c
1.0-2.0 (Low) 6.1 4.2 4.3 5.3 7.5 5.8 5.4 6.3 4.8 4.0 3.2 5.7 3.4 4.6 5.2 5.0 -0.1 2.5-3.0 6.6 6.7 6.0 7.8 8.0 7.9 6.3 6.0 5.4 5.2 5.7 4.3 3.8 4.9 5.7 4.8 -0.8 3.5-4.0 6.1 6.3 7.7 7.1 6.7 7.8 7.1 7.3 6.1 6.1 4.2 4.5 3.9 5.0 4.8 4.7 -0.1 4.5-5.0 7.4 6.3 7.6 8.9 8.9 7.4 7.9 5.3 5.6 5.9 3.8 4.7 4.4 3.4 5.8 4.3 -1.6 5.5-6.0 (High) 7.1 6.7 9.4 9.7 9.7 8.5 6.0 6.2 6.1 7.5 5.8 4.6 4.0 3.2 3.0 3.9 +1.0Race (2-year average):d
White 7.6 7.2 7.6 8.6 9.1 9.0 8.6 7.9 7.0 6.4 5.9 5.2 4.9 4.7 5.1 5.3 +0.2 Black 2.7 2.5 2.2 2.4 2.6 2.2 1.9 1.7 1.4 1.9 2.2 1.9 1.5 1.3 1.9 1.9 0.0 Hispanic 5.4 6.0 5.7 5.5 5.8 5.9 4.7 4.5 5.5 6.3 4.5 3.4 2.7 2.9 5.3 5.7 +0.4
Inhalants:a Trends in Annual Prevalence of Use by Subgroups for Twelfth GradersTABLE D-12 (cont'd)
aAll data are unadjusted for underreporting of amyl and butyl nitrites, except where otherwise noted.
’05–’06Class of:Percentage who used in last twelve months
dTo derive percentages for each racial subgroup, data for the specified year and the previous year have been combined to increase subgroup sample sizes and thus provide
more stable estimates. For the data beginning in 2005, see the race/ethnicity note at the end of Appendix D.
change
bAdjusted for underreporting of amyl and butyl nitrites. See text for details.cParental education is an average score of mother’s education and father’s education. See Appendix B for details.
278

1991 1992 1993 1994 1995 1996 1997 1998 1999 2000 2001a 2002a 2003 2004 2005 2006Approx. N = 17,500 18,600 18,300 17,300 17,500 17,800 18,600 18,100 16,700 16,700 16,200 15,100 16,500 17,000 16,800 16,500
Total 1.9 2.5 2.6 2.7 3.6 4.1 3.7 3.4 2.9 2.8‡ 3.4 2.6 2.6 2.2 2.4 2.1 -0.3Gender: Male 2.2 2.6 2.8 3.0 4.0 4.3 4.0 3.7 3.3 3.2‡ 3.8 2.9 2.9 2.3 2.5 2.1 -0.4 Female 1.6 2.3 2.3 2.4 3.3 3.7 3.2 2.9 2.4 2.5‡ 2.9 2.2 2.3 2.1 2.2 2.0 -0.2College Plans: None or under 4 years 5.1 7.2 7.1 6.7 9.6 9.6 10.1 9.2 9.4 7.7‡ 9.5 7.8 8.7 7.8 7.6 6.7 -0.9 Complete 4 years 1.4 1.8 1.9 2.2 2.9 3.2 2.9 2.7 2.1 2.3‡ 2.6 2.0 1.9 1.7 1.8 1.6 -0.2Region: Northeast 1.5 1.6 1.9 2.9 3.4 3.7 2.8 2.4 2.6 2.3‡ 2.9 1.5 2.5 2.0 1.9 1.4 -0.5 North Central 1.6 2.4 1.7 2.2 3.8 3.9 3.8 3.5 3.4 3.5‡ 2.7 2.7 2.6 1.9 2.2 1.9 -0.3 South 1.9 2.7 2.8 2.4 3.3 3.9 3.4 3.7 2.9 2.7‡ 4.0 2.9 2.6 2.4 2.9 2.3 -0.6 West 2.8 3.2 4.2 3.9 4.2 5.1 4.8 3.5 2.4 2.7‡ 3.3 2.9 2.7 2.6 2.3 2.4 +0.2Population Density: Large MSA 2.1 2.2 2.2 3.1 4.0 3.8 3.3 2.9 2.5 2.3‡ 2.7 2.0 2.2 1.9 2.2 1.4 -0.9 Other MSA 2.0 3.0 3.1 3.1 3.8 4.8 4.0 3.4 3.1 3.0‡ 3.6 2.4 2.5 2.6 2.4 2.4 0.0 Non-MSA 1.5 2.0 1.8 1.6 3.0 3.2 3.5 3.8 2.8 3.2‡ 3.6 3.5 3.3 2.1 2.7 2.5 -0.2Parental Education:b
1.0-2.0 (Low) 3.9 3.7 3.5 3.1 5.1 4.8 5.0 5.0 4.8 5.4‡ 5.9 4.4 4.3 4.8 3.4 2.9 -0.5 2.5-3.0 2.2 2.3 2.7 2.8 3.8 4.7 3.9 3.4 3.5 3.2‡ 3.9 3.2 3.2 2.5 3.3 2.6 -0.7 3.5-4.0 1.6 2.5 2.8 2.8 4.1 4.1 3.8 3.7 2.8 2.8‡ 3.7 2.6 2.6 2.1 3.0 2.3 -0.8 4.5-5.0 1.6 2.0 2.3 2.8 3.2 4.0 3.4 3.0 2.1 2.1‡ 2.4 2.1 2.0 2.0 1.8 1.9 +0.1 5.5-6.0 (High) 1.4 2.4 2.0 2.5 3.2 3.5 3.5 3.1 2.5 3.1‡ 2.3 1.7 1.9 1.7 1.1 1.5 +0.4Race (2-year average):c
White — 2.2 2.6 2.8 3.6 4.5 4.5 3.9 3.2 3.1 2.9‡ 2.7d 2.8 2.5 2.4 2.5 +0.1 Black — 0.7 0.7 0.6 0.6 0.7 0.7 0.7 0.6 0.7 0.7‡ 0.7d 0.9 1.2 1.3 1.1 -0.2 Hispanic — 3.8 4.1 4.0 4.0 4.1 4.2 4.6 4.5 4.0 3.4‡ 3.6d 2.9 2.9 2.7 1.8 -0.9
TABLE D-13 Hallucinogens: Trends in Annual Prevalence of Use by Subgroups for Eighth Graders
Percentage who used in last twelve months’05–’06change
(Table continued on next page)
279

dThe 2002 data comprise half of the 2001 sample data double-weighted and all of the 2002 sample data.
forms were changed. Beginning in 2002, the data are based on all forms. Data for "any illicit drug other than marijuana" and “hallucinogens” are also affected by these changes and have been treated in a parallel manner.bParental education is an average score of mother’s education and father’s education. See Appendix B for details.cTo derive percentages for each racial subgroup, data for the specified year and the previous year have been combined to increase subgroup
See Table D-106 for the number of subgroup cases. See Appendix B for definition of variables in table.
aIn 2001 the question text was changed on half of the questionnaire forms. “Other psychedelics” was changed to “other hallucinogens,” and “shrooms” was added to the list of examples. The 2001 data are based on the changed forms only; N is one-half of N indicated. In 2002 the remaining
sample sizes and thus provide more stable estimates. For the data beginning in 2005, see the race/ethnicity note at the end of Appendix D.
Level of significance of difference between the two most recent classes: s = .05, ss = .01, sss = .001. ‘—’ indicates data not available. Any apparent inconsistency between the change estimate and the prevalence-of-use estimates for the two most recent classes is due to rounding error.
Hallucinogens: Trends in Annual Prevalence of Use by Subgroups for Eighth Graders TABLE D-13 (cont'd)
Source: The Monitoring the Future Study, the University of Michigan.Notes: ‘‡’ indicates some change in the question. See relevant footnote. See relevant figure to assess the impact of the wording changes.
280

1991 1992 1993 1994 1995 1996 1997 1998 1999 2000 2001a 2002a 2003 2004 2005 2006Approx. N = 14,800 14,800 15,300 15,800 17,000 15,600 15,500 15,000 13,600 14,300 14,000 14,300 15,800 16,400 16,200 16,200
Total 4.0 4.3 4.7 5.8 7.2 7.8 7.6 6.9 6.9 6.1‡ 6.2 4.7 4.1 4.1 4.0 4.1 +0.1Gender: Male 4.4 4.7 5.7 6.6 8.1 8.5 8.7 7.4 8.1 7.2‡ 7.9 5.5 4.9 4.6 4.8 4.5 -0.3 Female 3.6 3.8 3.6 4.8 6.1 7.0 6.4 6.3 5.7 4.9‡ 4.6 3.9 3.4 3.5 3.1 3.5 +0.5College Plans: None or under 4 years 7.5 7.5 9.1 10.4 12.5 14.5 13.6 14.2 14.3 12.3‡ 5.0 10.3 8.9 9.3 9.4 10.0 +0.6 Complete 4 years 3.3 3.6 3.7 4.8 6.2 6.6 6.5 5.6 5.7 5.1‡ 4.8 3.9 3.3 3.3 3.2 3.3 +0.1Region: Northeast 4.0 2.7 4.7 5.8 5.6 7.7 6.2 8.1 8.6 5.8‡ 6.0 4.2 4.0 4.7 5.0 4.0 -1.0 North Central 3.4 4.3 4.6 5.7 7.8 9.0 7.0 5.6 6.7 6.1‡ 6.0 5.1 3.5 3.7 3.9 4.1 +0.2 South 3.6 3.9 3.6 5.1 7.3 7.5 8.3 7.6 6.5 5.7‡ 5.3 4.0 3.9 3.6 3.5 3.5 -0.1 West 5.2 6.5 6.7 7.1 7.6 6.6 8.5 6.1 6.1 6.9‡ 8.7 5.9 5.0 4.7 3.7 5.1 +1.4Population Density: Large MSA 4.1 4.6 4.9 6.0 7.1 8.6 7.8 6.3 5.8 7.5‡ 5.0 4.7 3.2 2.9 3.4 4.1 +0.8 Other MSA 4.8 4.4 4.9 6.4 8.0 8.2 7.9 7.6 7.8 5.8‡ 6.6 4.9 4.4 5.0 4.3 4.1 -0.1 Non-MSA 2.5 3.7 4.1 4.4 5.5 6.0 6.7 6.3 6.5 5.1‡ 6.8 4.4 4.6 3.9 4.2 3.8 -0.4Parental Education:b
1.0-2.0 (Low) 3.7 4.9 6.0 6.1 7.7 8.0 6.5 8.3 7.0 5.2‡ 6.4 5.3 6.5 3.2 3.7 5.3 +1.6 2.5-3.0 4.3 4.2 4.5 5.5 7.6 8.5 7.3 8.2 8.1 5.8‡ 6.7 5.2 4.7 4.8 4.5 4.5 -0.1 3.5-4.0 3.7 4.6 4.8 5.9 7.6 8.6 8.2 6.6 6.6 6.7‡ 6.1 4.8 4.0 3.9 4.0 3.8 -0.2 4.5-5.0 4.1 3.8 4.5 5.5 6.6 6.9 8.2 6.1 6.6 6.3‡ 6.0 4.0 3.5 3.7 4.0 3.9 0.0 5.5-6.0 (High) 4.6 4.2 4.6 6.2 6.5 7.2 6.8 6.0 6.5 6.2‡ 5.8 5.2 3.4 4.1 3.7 4.0 +0.3Race (2-year average):c
White — 4.9 5.1 5.6 7.1 8.6 8.9 8.4 8.2 7.6 6.6‡ 5.6d 5.3 4.9 4.7 4.7 0.0 Black — 0.2 0.6 1.1 1.2 0.9 1.0 1.1 1.0 1.0 1.3‡ 1.4d 1.0 0.8 1.2 1.4 +0.1 Hispanic — 3.6 4.5 5.7 6.3 6.6 7.3 7.3 6.4 5.2 4.4‡ 4.5d 3.9 3.8 4.0 3.5 -0.5
change
TABLE D-14 Hallucinogens: Trends in Annual Prevalence of Use by Subgroups for Tenth Graders
Percentage who used in last twelve months’05–’06
(Table continued on next page)
281

Level of significance of difference between the two most recent classes: s = .05, ss = .01, sss = .001.
TABLE D-14 (cont'd) Hallucinogens: Trends in Annual Prevalence of Use by Subgroups for Tenth Graders
Notes: ‘‡’ indicates some change in the question. See relevant footnote. See relevant figure to assess the impact of the wording changes. Source: The Monitoring the Future Study, the University of Michigan.
bParental education is an average score of mother’s education and father’s education. See Appendix B for details.cTo derive percentages for each racial subgroup, data for the specified year and the previous year have been combined to increase subgroup sample sizes and thus provide more stable estimates. For the data beginning in 2005, see the race/ethnicity note at the end of Appendix D.dThe 2002 data comprise half of the 2001 sample data double-weighted and all of the 2002 sample data.
affected by these changes and have been treated in a parallel manner.
aIn 2001 the question text was changed on half of the questionnaire forms. “Other psychedelics” was changed to “other hallucinogens,” and “shrooms” was added to the list of examples. The 2001 data are based on the changed forms only; N is one-half of N indicated. In 2002 the remaining forms were changed. Beginning in 2002, the data are based on all forms. Data for "any illicit drug other than marijuana" and “hallucinogens” are also
‘—’ indicates data not available. Any apparent inconsistency between the change estimate and the prevalence-of-use estimates for the two most recent classes is due to rounding error. See Table D-107 for the number of subgroup cases. See Appendix B for definition of variables in table.
282

1975 1976 1977 1978 1979 1980 1981 1982 1983 1984 1985 1986 1987 1988 1989 1990Approx. N = 9,400 15,400 17,100 17,800 15,500 15,900 17,500 17,700 16,300 15,900 16,000 15,200 16,300 16,300 16,700 15,200
Total 11.2 9.4 8.8 9.6 9.9 9.3 9.0 8.1 7.3 6.5 6.3 6.0 6.4 5.5 5.6 5.9 Adjustedc — — — — 11.8 10.4 10.1 9.0 8.3 7.3 7.6 7.6 6.7 5.8 6.2 6.0Gender: Male 13.7 11.6 10.8 11.6 11.8 11.7 10.9 9.6 8.6 7.9 8.1 7.2 7.5 7.2 7.4 7.7 Female 9.0 6.9 6.5 7.3 7.6 6.7 6.8 6.1 5.5 4.7 4.4 4.7 5.2 3.7 3.6 3.8College Plans: None or under 4 years — 11.2 10.6 11.0 11.3 11.2 10.7 9.5 8.9 8.3 7.7 7.4 7.9 6.4 7.1 6.6 Complete 4 years — 6.9 6.4 7.3 7.5 7.1 7.4 6.2 5.4 4.7 5.0 4.7 5.4 4.7 4.8 5.3Region: Northeast 13.2 10.9 10.6 13.0 12.9 12.2 12.9 11.4 8.7 11.3 9.9 7.9 7.5 5.8 5.6 6.6 North Central 13.0 10.3 9.7 10.7 11.1 11.3 10.3 9.1 8.9 6.0 6.8 6.6 6.9 5.3 6.6 5.7 South 8.5 7.4 6.8 6.3 5.7 5.4 4.1 4.6 5.2 3.9 3.2 3.3 4.8 5.2 4.9 5.0 West 10.2 9.3 8.2 9.6 11.0 9.2 10.4 7.8 6.3 7.0 6.3 7.2 7.4 6.0 5.5 6.9Population Density: Large MSA 13.9 11.1 9.9 11.9 12.3 11.6 12.0 10.9 9.2 8.8 8.3 7.6 7.9 6.5 5.4 5.7 Other MSA 12.1 9.8 9.1 9.3 10.5 9.8 9.0 7.6 7.6 6.3 6.1 5.9 6.3 6.0 5.9 6.6 Non-MSA 8.5 7.7 7.5 8.3 7.1 7.1 6.8 6.5 5.3 5.0 5.0 4.9 5.3 3.5 5.0 4.5Parental Education:d
1.0-2.0 (Low) 8.9 7.4 6.8 7.7 7.1 8.0 6.7 6.5 6.5 5.4 4.8 5.4 5.8 4.9 4.2 3.8 2.5-3.0 10.2 10.0 9.1 9.6 9.6 9.5 8.9 8.0 6.8 6.7 6.4 6.0 6.2 4.2 4.9 4.6 3.5-4.0 10.9 9.8 9.2 9.7 9.7 9.2 9.2 8.6 7.7 6.3 7.2 6.3 6.0 4.8 5.6 6.5 4.5-5.0 11.1 10.1 8.8 10.2 10.9 9.1 9.4 7.8 7.0 5.9 6.2 5.5 6.8 6.7 6.6 6.8 5.5-6.0 (High) 8.9 9.4 9.5 10.2 11.7 9.9 10.6 9.0 7.0 7.6 4.3 5.9 7.2 7.2 7.0 8.2Race (2-year average):e
White — — 9.8 9.9 10.5 10.3 10.0 9.3 8.3 7.5 7.0 6.7 6.8 6.8 6.4 6.7 Black — — 2.4 2.3 2.0 1.9 1.9 1.8 2.2 1.7 1.2 1.6 1.5 1.0 0.9 0.8 Hispanic — — 7.9 7.2 7.0 7.1 7.0 7.7 6.6 5.2 5.7 5.7 5.0 4.0 3.2 3.3
TABLE D-15Hallucinogens:a Trends in Annual Prevalence of Use by Subgroups for Twelfth Graders
Percentage who used in last twelve monthsClass of: Cont'd
283
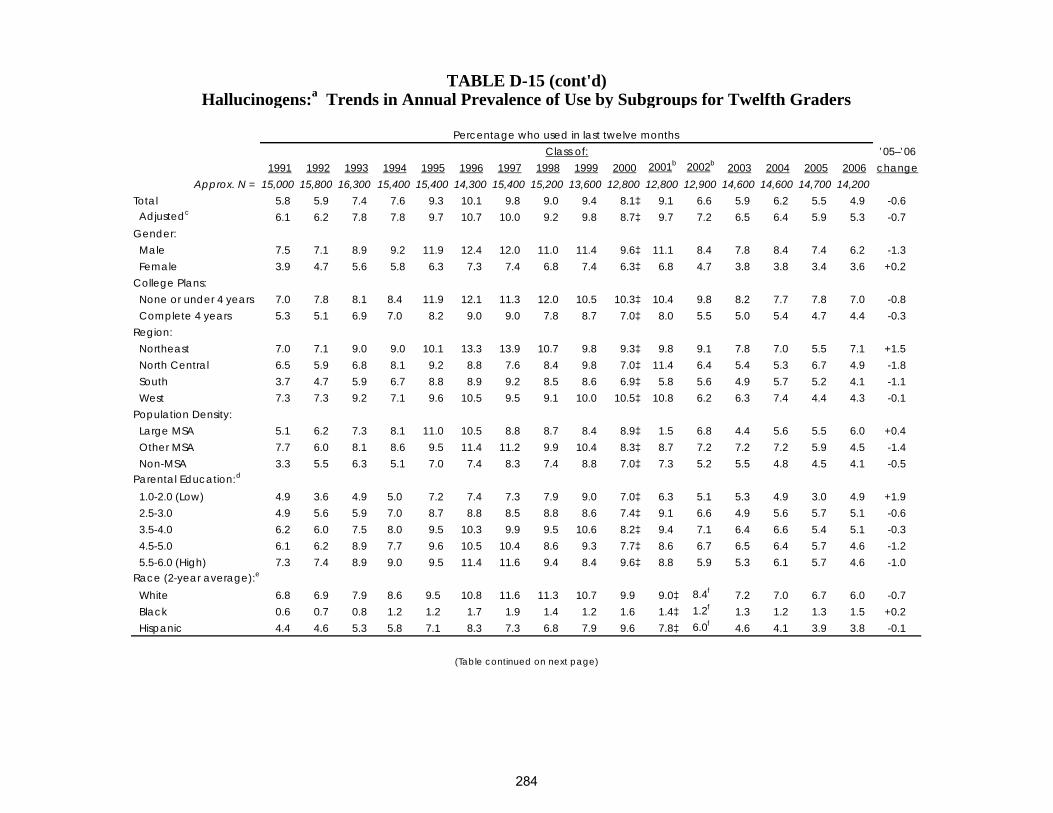
1991 1992 1993 1994 1995 1996 1997 1998 1999 2000 2001b 2002b 2003 2004 2005 2006Approx. N = 15,000 15,800 16,300 15,400 15,400 14,300 15,400 15,200 13,600 12,800 12,800 12,900 14,600 14,600 14,700 14,200
Total 5.8 5.9 7.4 7.6 9.3 10.1 9.8 9.0 9.4 8.1‡ 9.1 6.6 5.9 6.2 5.5 4.9 -0.6 Adjustedc 6.1 6.2 7.8 7.8 9.7 10.7 10.0 9.2 9.8 8.7‡ 9.7 7.2 6.5 6.4 5.9 5.3 -0.7Gender: Male 7.5 7.1 8.9 9.2 11.9 12.4 12.0 11.0 11.4 9.6‡ 11.1 8.4 7.8 8.4 7.4 6.2 -1.3 Female 3.9 4.7 5.6 5.8 6.3 7.3 7.4 6.8 7.4 6.3‡ 6.8 4.7 3.8 3.8 3.4 3.6 +0.2College Plans: None or under 4 years 7.0 7.8 8.1 8.4 11.9 12.1 11.3 12.0 10.5 10.3‡ 10.4 9.8 8.2 7.7 7.8 7.0 -0.8 Complete 4 years 5.3 5.1 6.9 7.0 8.2 9.0 9.0 7.8 8.7 7.0‡ 8.0 5.5 5.0 5.4 4.7 4.4 -0.3Region: Northeast 7.0 7.1 9.0 9.0 10.1 13.3 13.9 10.7 9.8 9.3‡ 9.8 9.1 7.8 7.0 5.5 7.1 +1.5 North Central 6.5 5.9 6.8 8.1 9.2 8.8 7.6 8.4 9.8 7.0‡ 11.4 6.4 5.4 5.3 6.7 4.9 -1.8 South 3.7 4.7 5.9 6.7 8.8 8.9 9.2 8.5 8.6 6.9‡ 5.8 5.6 4.9 5.7 5.2 4.1 -1.1 West 7.3 7.3 9.2 7.1 9.6 10.5 9.5 9.1 10.0 10.5‡ 10.8 6.2 6.3 7.4 4.4 4.3 -0.1Population Density: Large MSA 5.1 6.2 7.3 8.1 11.0 10.5 8.8 8.7 8.4 8.9‡ 1.5 6.8 4.4 5.6 5.5 6.0 +0.4 Other MSA 7.7 6.0 8.1 8.6 9.5 11.4 11.2 9.9 10.4 8.3‡ 8.7 7.2 7.2 7.2 5.9 4.5 -1.4 Non-MSA 3.3 5.5 6.3 5.1 7.0 7.4 8.3 7.4 8.8 7.0‡ 7.3 5.2 5.5 4.8 4.5 4.1 -0.5Parental Education:d
1.0-2.0 (Low) 4.9 3.6 4.9 5.0 7.2 7.4 7.3 7.9 9.0 7.0‡ 6.3 5.1 5.3 4.9 3.0 4.9 +1.9 2.5-3.0 4.9 5.6 5.9 7.0 8.7 8.8 8.5 8.8 8.6 7.4‡ 9.1 6.6 4.9 5.6 5.7 5.1 -0.6 3.5-4.0 6.2 6.0 7.5 8.0 9.5 10.3 9.9 9.5 10.6 8.2‡ 9.4 7.1 6.4 6.6 5.4 5.1 -0.3 4.5-5.0 6.1 6.2 8.9 7.7 9.6 10.5 10.4 8.6 9.3 7.7‡ 8.6 6.7 6.5 6.4 5.7 4.6 -1.2 5.5-6.0 (High) 7.3 7.4 8.9 9.0 9.5 11.4 11.6 9.4 8.4 9.6‡ 8.8 5.9 5.3 6.1 5.7 4.6 -1.0Race (2-year average):e
White 6.8 6.9 7.9 8.6 9.5 10.8 11.6 11.3 10.7 9.9 9.0‡ 8.4f 7.2 7.0 6.7 6.0 -0.7 Black 0.6 0.7 0.8 1.2 1.2 1.7 1.9 1.4 1.2 1.6 1.4‡ 1.2f 1.3 1.2 1.3 1.5 +0.2 Hispanic 4.4 4.6 5.3 5.8 7.1 8.3 7.3 6.8 7.9 9.6 7.8‡ 6.0f 4.6 4.1 3.9 3.8 -0.1
Percentage who used in last twelve monthsClass of:
(Table continued on next page)
TABLE D-15 (cont'd)Hallucinogens:a Trends in Annual Prevalence of Use by Subgroups for Twelfth Graders
’05–’06change
284

fThe 2002 data comprise half of the 2001 sample data double-weighted and all of the 2002 sample data.
dParental education is an average score of mother’s education and father’s education. See Appendix B for details.eTo derive percentages for each racial subgroup, data for the specified year and the previous year have been combined to increase subgroup sample sizes and thus provide more stable estimates. For the data beginning in 2005, see the race/ethnicity note at the end of Appendix D.
“shrooms” was added to the list of examples. The 2001 data are based on the changed forms only; N is one-half of N indicated. In 2002 the remaining forms were changed. Beginning in 2002, the data are based on all forms. Data for "any illcit drug other than marijuana" and “hallucinogens” are also affected by these changes and have been treated in a parallel manner.
TABLE D-15 (cont'd)Hallucinogens:a Trends in Annual Prevalence of Use by Subgroups for Twelfth Graders
Notes: ‘‡’ indicates some change in the question. See relevant footnote. See relevant figure to assess the impact of the wording changes.Source: The Monitoring the Future Study, the University of Michigan.
aAll data are unadjusted for the underreporting of PCP, unless otherwise indicated.
Any apparent inconsistency between the change estimate and the prevalence-of-use estimates for the two most recent classes is due to rounding error. See Table D-108 for the number of subgroup cases. See Appendix B for definition of variables in table.
cAdjusted for the underreporting of PCP. See text for details.
bIn 2001 the question text was changed on half of the questionnaire forms. “Other psychedelics” was changed to “other hallucinogens,” and
Level of significance of difference between the two most recent classes: s = .05, ss = .01, sss = .001. ‘—’ indicates data not available.
285

1991 1992 1993 1994 1995 1996 1997 1998 1999 2000 2001 2002 2003 2004 2005 2006Approx. N = 17,500 18,600 18,300 17,300 17,500 17,800 18,600 18,100 16,700 16,700 16,200 15,100 16,500 17,000 16,800 16,500
Total 1.7 2.1 2.3 2.4 3.2 3.5 3.2 2.8 2.4 2.4 2.2 1.5 1.3 1.1 1.2 0.9 -0.2Gender: Male 2.0 2.1 2.5 2.6 3.4 3.7 3.5 3.2 2.7 2.6 2.3 1.7 1.4 1.1 1.2 0.8 -0.4 Female 1.3 2.0 2.1 2.1 2.9 3.2 2.8 2.4 2.0 2.2 2.1 1.3 1.1 1.1 1.1 1.0 0.0College Plans: None or under 4 years 4.5 6.4 6.4 6.2 8.5 8.2 9.3 7.8 8.2 6.7 5.8 5.7 4.3 4.7 4.1 3.4 -0.7 Complete 4 years 1.2 1.5 1.6 1.8 2.5 2.7 2.5 2.2 1.7 2.0 1.8 1.1 0.9 0.7 0.8 0.7 -0.2Region: Northeast 1.3 1.4 1.8 2.6 2.9 2.9 2.3 2.1 2.2 1.9 1.9 0.9 1.4 1.0 0.9 0.5 -0.4 North Central 1.4 1.8 1.4 1.7 3.5 3.4 3.3 2.5 2.7 3.0 1.7 1.8 1.2 0.9 0.9 0.7 -0.2 South 1.8 2.4 2.4 2.1 2.8 3.4 3.0 3.2 2.5 2.4 2.7 1.8 1.3 1.2 1.5 1.1 -0.3 West 2.2 2.9 3.7 3.3 3.8 4.3 4.3 3.2 1.9 2.3 2.0 1.2 1.2 1.2 1.1 1.0 -0.1Population Density: Large MSA 1.9 2.0 2.0 2.7 3.6 3.2 2.9 2.6 2.2 2.0 1.8 1.3 1.3 1.1 1.0 0.6 -0.4 Other MSA 1.7 2.5 2.8 2.8 3.3 4.1 3.6 2.9 2.7 2.6 2.3 1.5 1.2 1.3 1.1 1.1 -0.1 Non-MSA 1.3 1.6 1.4 1.3 2.4 2.6 2.8 2.9 1.9 2.8 2.4 1.9 1.4 0.7 1.4 1.0 -0.4Parental Education:a
1.0-2.0 (Low) 3.5 3.1 3.1 2.8 4.6 4.4 4.7 4.4 3.7 4.9 4.1 3.4 2.3 2.8 1.7 1.8 +0.2 2.5-3.0 1.8 2.1 2.3 2.6 3.1 4.0 3.2 2.8 2.7 2.9 2.6 2.0 1.4 1.2 1.7 1.0 -0.7 3.5-4.0 1.4 2.0 2.4 2.4 3.6 3.5 3.4 3.1 2.4 2.2 2.4 1.3 1.3 1.0 1.5 1.0 -0.5 4.5-5.0 1.4 1.5 2.1 2.1 2.6 3.4 2.9 2.5 1.9 1.8 1.5 1.2 1.1 1.0 0.6 0.7 +0.1 5.5-6.0 (High) 1.3 2.0 2.0 2.1 2.9 3.0 2.9 2.4 1.9 2.3 1.3 0.8 0.8 0.6 0.4 0.7 +0.3Race (2-year average):b
White — 1.9 2.3 2.5 3.1 3.9 3.9 3.2 2.6 2.6 2.6 2.0 1.5 1.1 1.0 1.0 +0.1 Black — 0.5 0.4 0.5 0.5 0.6 0.6 0.6 0.5 0.5 0.5 0.4 0.6 0.8 0.9 0.6 -0.3 Hispanic — 3.3 3.7 3.6 3.3 3.5 3.9 4.2 3.9 3.5 3.2 2.4 1.7 1.8 1.7 1.0 -0.7
TABLE D-16
aParental education is an average score of mother’s education and father’s education. See Appendix B for details.bTo derive percentages for each racial subgroup, data for the specified year and the previous year have been combined to increase subgroup sample sizes and thus provide
more stable estimates. For the data beginning in 2005, see the race/ethnicity note at the end of Appendix D.
LSD: Trends in Annual Prevalence of Use by Subgroups for Eighth Graders
Notes: Level of significance of difference between the two most recent classes: s = .05, ss = .01, sss = .001. ‘—’ indicates data not available.
Any apparent inconsistency between the change estimate and the prevalence-of-use estimates for the two most recent classes is due to rounding error.
See Table D-106 for the number of subgroup cases. See Appendix B for definition of variables in table.
Percentage who used in last twelve months’05–’06change
Source: The Monitoring the Future Study, the University of Michigan.
286

1991 1992 1993 1994 1995 1996 1997 1998 1999 2000 2001 2002 2003 2004 2005 2006Approx. N = 14,800 14,800 15,300 15,800 17,000 15,600 15,500 15,000 13,600 14,300 14,000 14,300 15,800 16,400 16,200 16,200
Total 3.7 4.0 4.2 5.2 6.5 6.9 6.7 5.9 6.0 5.1 4.1 2.6 1.7 1.6 1.5 1.7 +0.2Gender: Male 3.9 4.3 5.1 5.9 7.4 7.6 7.6 6.3 7.0 5.9 5.1 3.1 1.9 1.8 1.9 2.1 +0.2 Female 3.4 3.6 3.2 4.3 5.5 6.2 5.8 5.4 5.1 4.3 3.1 2.0 1.6 1.4 1.0 1.3 +0.3College Plans: None or under 4 years 6.8 7.0 8.4 9.4 11.1 13.1 12.8 12.4 13.1 11.1 9.9 6.0 4.4 4.5 4.1 5.1 +1.0 Complete 4 years 3.0 3.4 3.3 4.2 5.6 5.8 5.7 4.7 4.9 4.1 3.2 2.0 1.3 1.2 1.1 1.2 +0.1Region: Northeast 3.6 2.6 3.8 5.1 4.7 6.4 5.2 7.1 7.5 4.1 4.0 2.2 1.8 1.7 2.3 1.7 -0.6 North Central 3.2 4.1 4.4 5.2 7.3 8.3 6.0 4.5 6.0 5.4 4.3 2.8 1.7 1.5 1.2 1.6 +0.4 South 3.3 3.7 3.2 4.6 6.8 6.8 7.9 6.5 5.8 5.0 3.5 2.3 1.7 1.4 1.4 1.7 +0.3 West 4.8 5.9 6.1 6.3 6.5 5.7 7.4 5.2 5.1 5.9 5.3 3.2 1.7 1.9 1.0 1.8 +0.7Population Density: Large MSA 3.8 4.4 4.4 5.4 6.6 7.6 7.0 5.4 4.9 6.4 3.8 2.6 1.3 1.1 1.2 1.6 +0.3 Other MSA 4.4 4.1 4.4 5.9 7.1 7.4 7.0 6.6 6.7 4.8 4.1 2.7 1.7 1.9 1.5 1.7 +0.2 Non-MSA 2.3 3.5 3.7 3.7 5.0 5.2 6.0 5.0 5.9 4.4 4.6 2.3 2.3 1.5 1.8 1.8 +0.1Parental Education:a
1.0-2.0 (Low) 3.1 4.4 5.5 5.5 6.9 7.6 5.9 7.9 6.3 4.9 3.9 2.7 3.7 1.3 1.8 2.5 +0.7 2.5-3.0 4.0 4.2 4.2 5.1 6.9 7.6 6.6 7.0 7.3 5.1 4.8 2.9 2.0 1.7 1.7 2.1 +0.4 3.5-4.0 3.4 4.1 4.2 5.3 6.9 7.9 7.4 5.6 5.8 5.6 4.3 2.8 1.7 1.4 1.6 1.6 0.0 4.5-5.0 3.8 3.6 3.9 4.8 6.0 6.0 7.0 5.0 5.7 5.0 3.8 2.0 1.2 1.4 1.2 1.3 +0.2 5.5-6.0 (High) 4.2 3.9 3.9 5.4 5.9 5.8 6.0 4.6 5.3 5.0 3.5 2.4 1.2 1.6 1.4 1.3 -0.1Race (2-year average):b
White — 4.6 4.6 5.0 6.4 7.7 7.9 7.3 7.0 6.5 5.2 3.8 2.4 1.9 1.7 1.8 +0.1 Black — 0.2 0.5 0.9 1.0 0.8 0.9 1.0 0.9 0.9 0.9 0.6 0.4 0.4 0.6 0.7 +0.1 Hispanic — 3.2 4.1 5.0 5.7 6.1 6.7 6.6 5.6 4.6 3.7 2.9 2.4 1.7 1.6 1.6 0.0
more stable estimates. For the data beginning in 2005, see the race/ethnicity note at the end of Appendix D.
TABLE D-17
aParental education is an average score of mother’s education and father’s education. See Appendix B for details.bTo derive percentages for each racial subgroup, data for the specified year and the previous year have been combined to increase subgroup sample sizes and thus provide
LSD: Trends in Annual Prevalence of Use by Subgroups for Tenth Graders
Notes: Level of significance of difference between the two most recent classes: s = .05, ss = .01, sss = .001. ‘—’ indicates data not available.
Any apparent inconsistency between the change estimate and the prevalence-of-use estimates for the two most recent classes is due to rounding error.
See Table D-107 for the number of subgroup cases. See Appendix B for definition of variables in table.
Percentage who used in last twelve months’05–’06change
Source: The Monitoring the Future Study, the University of Michigan.
287

1975 1976 1977 1978 1979 1980 1981 1982 1983 1984 1985 1986 1987 1988 1989 1990Approx. N = 9,400 15,400 17,100 17,800 15,500 15,900 17,500 17,700 16,300 15,900 16,000 15,200 16,300 16,300 16,700 15,200
Total 7.2 6.4 5.5 6.3 6.6 6.5 6.5 6.1 5.4 4.7 4.4 4.5 5.2 4.8 4.9 5.4Gender: Male 9.6 7.9 7.1 7.8 8.0 8.1 8.0 7.4 6.7 5.8 5.9 5.5 6.4 6.5 6.5 7.1 Female 5.6 4.6 3.9 4.5 4.8 4.8 4.7 4.3 3.8 3.1 2.8 3.4 3.9 3.0 3.2 3.6College Plans: None or under 4 years — 7.5 6.7 7.2 8.0 8.2 8.0 7.5 6.9 6.1 5.6 5.9 6.6 5.7 6.5 6.2 Complete 4 years — 4.7 4.0 4.6 4.5 4.7 5.0 4.3 3.8 3.1 3.4 3.3 4.3 4.1 4.2 4.8Region: Northeast 8.5 8.0 7.2 8.0 7.9 6.8 9.0 8.0 5.6 7.0 5.4 5.1 5.3 4.7 5.1 5.9 North Central 8.7 7.0 6.5 7.9 7.9 8.5 7.8 7.3 7.0 4.4 5.3 5.3 5.7 4.7 6.0 5.3 South 5.4 4.7 3.7 3.7 3.4 4.3 3.4 3.9 4.4 3.5 2.8 2.6 4.2 4.7 4.2 4.7 West 7.6 5.9 5.0 5.8 8.3 6.5 6.3 4.8 4.2 4.5 4.6 5.9 6.2 5.2 4.4 6.4Population Density: Large MSA 9.4 7.9 6.4 7.2 7.6 7.3 8.0 7.3 5.7 4.7 4.1 4.4 5.6 5.2 4.6 5.2 Other MSA 7.4 6.8 5.6 6.1 7.3 6.8 6.9 6.3 6.0 4.9 4.8 4.9 5.4 5.6 5.3 6.1 Non-MSA 5.7 4.8 4.8 5.8 4.9 5.6 4.9 4.8 4.4 4.2 4.1 4.0 4.4 3.1 4.3 4.2Parental Education:a
1.0-2.0 (Low) 6.1 4.8 4.5 5.0 4.5 5.2 4.8 5.0 4.9 4.1 3.0 3.9 4.4 4.1 3.6 3.4 2.5-3.0 6.5 6.8 5.8 6.1 6.3 6.8 6.5 6.1 5.1 4.8 4.5 4.6 4.9 3.8 4.3 4.4 3.5-4.0 6.4 6.7 5.6 6.1 6.7 6.7 6.7 6.4 5.7 4.3 4.7 4.6 4.9 4.2 5.1 6.0 4.5-5.0 7.0 6.4 5.3 6.7 7.5 5.7 6.4 5.7 5.2 4.3 4.8 4.1 5.8 6.2 5.9 6.2 5.5-6.0 (High) 6.5 6.4 6.1 7.0 7.4 7.2 7.7 6.0 4.8 5.0 3.8 4.7 6.1 6.2 5.5 7.4Race (2-year average):b
White — — 6.3 6.3 6.8 7.0 7.2 6.9 6.2 5.5 5.0 4.9 5.4 5.8 5.7 6.1 Black — — 1.3 1.3 1.2 1.1 1.0 0.9 0.9 0.7 0.7 1.0 0.8 0.6 0.7 0.6 Hispanic — — 6.1 5.0 4.9 5.2 4.5 5.2 5.0 4.1 3.9 3.9 4.0 3.1 2.3 2.7
TABLE D-18LSD: Trends in Annual Prevalence of Use by Subgroups for Twelfth Graders
Percentage who used in last twelve monthsClass of:
Notes: Level of significance of difference between the two most recent classes: s = .05, ss = .01, sss = .001. ‘—’ indicates data not available.
Any apparent inconsistency between the change estimate and the prevalence-of-use estimates for the two most recent classes is due to rounding error.
See Table D-108 for the number of subgroup cases. See Appendix B for definition of variables in table.
Source: The Monitoring the Future Study, the University of Michigan.
Cont'd
288

1991 1992 1993 1994 1995 1996 1997 1998 1999 2000 2001 2002 2003 2004 2005 2006Approx. N = 15,000 15,800 16,300 15,400 15,400 14,300 15,400 15,200 13,600 12,800 12,800 12,900 14,600 14,600 14,700 14,200
Total 5.2 5.6 6.8 6.9 8.4 8.8 8.4 7.6 8.1 6.6 6.6 3.5 1.9 2.2 1.8 1.7 -0.1Gender: Male 6.8 6.7 8.4 8.4 10.7 10.9 10.3 9.3 10.0 7.6 7.9 4.4 2.5 3.1 2.7 2.1 -0.5 Female 3.4 4.4 5.1 5.3 5.8 6.5 6.2 5.7 6.1 5.3 5.0 2.3 1.2 1.2 0.9 1.1 +0.2College Plans: None or under 4 years 6.4 7.6 7.5 7.7 11.2 11.4 10.3 10.9 9.4 8.7 8.2 5.7 3.0 3.2 3.4 2.6 -0.8 Complete 4 years 4.7 4.8 6.4 6.3 7.3 7.7 7.4 6.3 7.3 5.6 5.7 2.7 1.4 1.8 1.3 1.4 +0.1Region: Northeast 6.1 6.6 8.6 8.2 8.8 11.9 11.8 8.2 7.8 7.1 6.7 5.4 2.4 2.3 1.7 3.0 +1.4 North Central 5.9 5.5 6.3 7.3 8.3 7.7 7.0 7.6 9.1 5.9 8.6 3.7 1.8 1.8 2.1 1.6 -0.5 South 3.4 4.4 5.5 6.3 8.1 7.9 8.1 7.4 7.7 6.0 4.7 3.1 1.9 2.6 1.8 1.4 -0.4 West 6.5 7.0 8.5 6.2 8.5 8.8 6.9 7.1 7.7 7.9 6.6 2.1 1.4 2.3 1.6 1.1 -0.5Population Density: Large MSA 4.3 5.7 6.7 7.3 9.7 9.0 7.7 7.2 6.8 6.7 7.7 3.3 1.5 1.9 1.8 2.2 +0.4 Other MSA 7.0 5.8 7.6 7.9 8.7 10.0 9.3 8.4 9.2 6.9 6.4 4.0 2.2 2.6 1.9 1.5 -0.3 Non-MSA 3.0 5.1 5.6 4.6 6.5 6.5 7.3 6.1 7.4 5.9 5.6 2.7 1.7 1.9 1.7 1.2 -0.5Parental Education:a
1.0-2.0 (Low) 4.3 3.3 4.6 4.4 6.6 6.7 6.8 6.8 8.6 5.6 5.4 2.4 1.5 3.2 1.7 1.5 -0.2 2.5-3.0 4.4 5.2 5.6 6.5 8.1 8.2 7.3 7.8 7.6 6.4 6.7 3.4 1.9 2.4 1.9 2.0 0.0 3.5-4.0 5.5 5.7 7.0 7.4 8.6 9.3 8.5 8.2 9.0 6.7 6.3 4.0 1.7 1.8 1.5 1.9 +0.4 4.5-5.0 5.3 5.8 8.3 6.9 8.6 8.7 8.6 6.5 8.0 6.0 6.7 3.1 1.7 2.0 1.7 1.3 -0.4 5.5-6.0 (High) 7.1 7.0 8.2 7.9 8.3 9.2 9.5 7.3 6.4 7.0 5.6 2.8 1.7 2.2 1.7 1.1 -0.6Race (2-year average):b
White 6.3 6.4 7.4 8.0 8.6 9.7 10.1 9.5 9.1 8.3 7.5 5.8 3.0 2.2 2.2 1.8 -0.3 Black 0.6 0.6 0.6 0.9 1.0 1.3 1.6 1.1 0.8 1.3 1.3 0.8 0.8 0.8 0.7 0.9 +0.1 Hispanic 3.6 4.1 5.1 5.4 6.4 7.4 6.3 5.9 7.0 7.6 5.8 3.8 1.8 1.7 1.7 1.4 -0.3
more stable estimates. For the data beginning in 2005, see the race/ethnicity note at the end of Appendix D.
’05–’06change
TABLE D-18 (cont'd)LSD: Trends in Annual Prevalence of Use by Subgroups for Twelfth Graders
aParental education is an average score of mother’s education and father’s education. See Appendix B for details.bTo derive percentages for each racial subgroup, data for the specified year and the previous year have been combined to increase subgroup sample sizes and thus provide
Percentage who used in last twelve monthsClass of:
289

1991 1992 1993 1994 1995 1996 1997 1998 1999 2000 2001a 2002a 2003 2004 2005 2006Approx. N = 17,500 18,600 18,300 17,300 17,500 17,800 18,600 18,100 16,700 16,700 16,200 15,100 16,500 17,000 16,800 16,500
Total 0.7 1.1 1.0 1.3 1.7 2.0 1.8 1.6 1.5 1.4‡ 2.4 2.1 2.1 1.9 2.0 1.8 -0.3Gender: Male 0.8 1.1 1.2 1.6 1.9 2.1 2.1 1.8 1.8 1.5‡ 2.8 2.4 2.4 1.9 2.2 1.8 -0.4 Female 0.6 1.0 0.9 0.9 1.4 1.7 1.4 1.4 1.1 1.3‡ 2.0 1.7 1.8 1.8 1.8 1.7 -0.2College Plans: None or under 4 years 1.7 3.6 2.9 3.6 4.8 5.2 4.7 5.1 5.3 3.9‡ 7.4 6.5 7.5 6.5 6.1 5.5 -0.6 Complete 4 years 0.5 0.7 0.7 1.0 1.3 1.4 1.4 1.2 1.0 1.2‡ 1.8 1.6 1.5 1.4 1.6 1.4 -0.2Region: Northeast 0.4 0.6 0.7 1.4 1.8 2.1 1.7 1.2 1.4 1.3‡ 2.1 1.3 1.9 1.6 1.5 1.2 -0.4 North Central 0.6 1.3 0.6 1.1 1.6 1.8 1.8 1.9 1.7 1.8‡ 1.8 2.1 2.2 1.7 1.9 1.7 -0.2 South 0.7 1.0 1.0 1.0 1.5 1.7 1.4 1.8 1.6 1.3‡ 2.9 2.2 2.2 1.9 2.4 1.8 -0.6 West 1.4 1.3 1.9 1.9 1.9 2.6 2.7 1.3 1.1 1.4‡ 2.4 2.6 2.3 2.2 2.0 2.2 +0.2Population Density: Large MSA 0.7 0.8 0.7 1.6 1.6 1.8 1.4 1.3 1.1 1.2‡ 1.9 1.6 1.6 1.4 2.0 1.2 -0.8 s Other MSA 0.7 1.3 1.3 1.4 1.8 2.2 1.9 1.6 1.5 1.7‡ 2.6 1.9 2.1 2.1 2.0 2.0 0.0 Non-MSA 0.7 1.0 0.9 0.8 1.5 1.7 1.9 2.0 1.9 1.3‡ 2.6 3.0 3.0 2.0 2.2 2.1 -0.2Parental Education:b
1.0-2.0 (Low) 1.5 1.8 1.4 1.6 2.4 2.2 2.6 2.7 2.6 2.5‡ 5.0 3.4 3.5 3.9 2.7 2.3 -0.4 2.5-3.0 0.8 0.7 1.1 1.1 1.7 2.1 2.0 1.3 1.9 1.5‡ 2.3 2.6 2.8 2.0 2.9 2.2 -0.6 3.5-4.0 0.4 1.2 1.2 1.2 1.8 2.0 1.6 1.8 1.3 1.3‡ 2.6 1.9 2.2 1.7 2.6 1.8 -0.7 4.5-5.0 0.8 0.9 0.7 1.5 1.6 2.0 1.6 1.5 0.9 1.1‡ 1.6 1.7 1.5 1.6 1.6 1.7 +0.1 5.5-6.0 (High) 0.8 1.3 0.9 1.5 1.7 1.4 1.9 1.9 1.5 2.0‡ 1.9 1.5 1.6 1.6 1.0 1.2 +0.2Race (2-year average):c
White — 0.9 1.0 1.2 1.7 2.1 2.1 1.8 1.6 1.6 1.4‡ 1.5d 2.3 2.2 2.1 2.2 0.0 Black — 0.4 0.5 0.5 0.4 0.4 0.3 0.3 0.3 0.3 0.3‡ 0.4d 0.6 0.8 0.9 0.9 0.0 Hispanic — 1.5 1.5 1.5 1.8 2.1 2.0 2.2 2.2 1.8 1.2‡ 1.8d 2.2 2.2 2.1 1.4 -0.7
(Table continued on next page)
change
TABLE D-19 Hallucinogens Other Than LSD: Trends in Annual Prevalence of Use
by Subgroups for Eighth Graders
Percentage who used in last twelve months’05–’06
290

TABLE D-19 (cont'd) Hallucinogens Other Than LSD: Trends in Annual Prevalence of Use
by Subgroups for Eighth Graders
Notes: ‘‡’ indicates some change in the question. See relevant footnote. See relevant figure to assess the impact of the wording changes.
See Table D-106 for the number of subgroup cases. See Appendix B for definition of variables in table. rounding error.
aIn 2001 the question text was changed on half of the questionnaire forms. “Other psychedelics” was changed to “other hallucinogens,” and“shrooms” was added to the list of examples. The 2001 data are based on the changed forms only; N is one-half of N indicated. In 2002 the remaining forms were changed. Beginning in 2002, the data are based on all forms. Data for "any illicit drug other than marijuana" and “hallucinogens” are also affected by these changes and have been treated in a parallel manner.bParental education is an average score of mother’s education and father’s education. See Appendix B for details.cTo derive percentages for each racial subgroup, data for the specified year and the previous year have been combined to increase subgroup sample sizes and thus provide more stable estimates. For the data beginning in 2005, see the race/ethnicity note at the end of Appendix D.dThe 2002 data comprise half of the 2001 sample data double-weighted and all of the 2002 sample data.
Any apparent inconsistency between the change estimate and the prevalence-of-use estimates for the two most recent classes is due to
Source: The Monitoring the Future Study, the University of Michigan.
Level of significance of difference between the two most recent classes: s = .05, ss = .01, sss = .001. ‘—’ indicates data not available.
291

1991 1992 1993 1994 1995 1996 1997 1998 1999 2000 2001a 2002a 2003 2004 2005 2006Approx. N = 14,800 14,800 15,300 15,800 17,000 15,600 15,500 15,000 13,600 14,300 14,000 14,300 15,800 16,400 16,200 16,200
Total 1.3 1.4 1.9 2.4 2.8 3.3 3.3 3.4 3.2 3.1‡ 4.4 4.0 3.6 3.7 3.5 3.7 +0.1Gender: Male 1.5 1.6 2.5 3.0 3.4 3.8 4.1 3.9 4.1 3.8‡ 5.7 4.6 4.4 4.3 4.2 4.1 0.0 Female 1.1 1.1 1.2 1.7 2.1 2.7 2.5 2.8 2.3 2.4‡ 3.1 3.4 2.8 3.2 2.9 3.1 +0.3College Plans: None or under 4 years 2.5 2.7 3.7 4.8 5.3 6.2 4.8 7.3 6.7 6.1‡ 10.9 8.8 7.3 8.2 8.5 9.0 +0.5 Complete 4 years 1.1 1.1 1.5 1.9 2.3 2.7 3.0 2.6 2.6 2.6‡ 3.3 3.3 2.9 3.1 2.8 3.0 +0.1Region: Northeast 1.4 0.7 2.3 3.2 3.0 3.9 3.2 4.7 4.5 3.4‡ 4.2 3.6 3.4 4.3 4.4 3.7 -0.7 North Central 1.0 1.2 1.7 1.9 2.2 3.2 3.4 3.2 2.8 3.3‡ 4.0 4.3 2.9 3.3 3.6 3.7 +0.1 South 1.3 1.2 1.5 2.1 2.7 3.1 3.1 3.2 2.7 2.9‡ 3.6 3.4 3.5 3.3 3.0 3.0 0.0 West 1.6 2.6 2.5 3.0 3.5 3.0 3.6 2.5 3.3 3.0‡ 6.7 5.1 4.5 4.2 3.3 4.7 +1.3Population Density: Large MSA 1.4 1.5 1.9 2.4 2.7 3.4 3.3 3.1 3.1 3.9‡ 3.4 4.0 2.8 2.7 2.9 3.8 +0.9 Other MSA 1.4 1.4 1.9 2.5 3.0 3.5 3.2 3.4 3.5 2.9‡ 4.8 4.0 3.9 4.4 3.9 3.7 -0.2 Non-MSA 1.0 1.2 2.0 2.3 2.5 2.7 3.5 3.5 2.7 2.8‡ 4.5 3.9 3.8 3.6 3.6 3.3 -0.4Parental Education:b
1.0-2.0 (Low) 1.5 1.5 2.0 2.6 3.3 3.4 2.4 2.9 3.4 2.5‡ 4.8 4.4 5.2 2.8 3.1 4.7 +1.5 2.5-3.0 1.2 1.0 1.4 1.8 2.7 3.4 2.7 4.2 3.0 2.6‡ 4.4 4.3 4.2 4.5 4.1 3.8 -0.2 3.5-4.0 1.3 1.7 2.3 2.3 3.0 3.2 3.6 3.0 2.8 3.2‡ 4.3 4.0 3.3 3.6 3.6 3.4 -0.1 4.5-5.0 1.2 1.5 1.9 2.6 2.5 3.3 3.7 3.0 3.7 3.7‡ 4.4 3.5 3.2 3.5 3.5 3.7 +0.2 5.5-6.0 (High) 1.8 1.1 2.1 2.8 2.5 3.5 3.6 3.7 3.7 3.7‡ 3.9 4.6 3.0 3.5 3.3 3.8 +0.4Race (2-year average):c
White — 1.5 1.8 2.3 2.8 3.4 3.9 4.0 4.0 3.8 3.4‡ 4.0d 4.7 4.4 4.2 4.2 0.0 Black — 0.1 0.4 0.7 0.7 0.4 0.3 0.4 0.5 0.6 1.1‡ 1.3d 0.9 0.7 1.1 1.2 +0.1 Hispanic — 1.3 1.5 1.9 2.0 2.1 2.4 2.8 2.6 2.0 1.6‡ 2.5d 2.9 3.2 3.5 3.0 -0.5
’05–’06change
TABLE D-20 Hallucinogens Other Than LSD: Trends in Annual Prevalence of Use
Percentage who used in last twelve months
by Subgroups for Tenth Graders
(Table continued on next page)
292

dThe 2002 data comprise half of the 2001 sample data double-weighted and all of the 2002 sample data.
affected by these changes and have been treated in a parallel manner.bParental education is an average score of mother’s education and father’s education. See Appendix B for details.cTo derive percentages for each racial subgroup, data for the specified year and the previous year have been combined to increase subgroup sample sizes and thus provide more stable estimates. For the data beginning in 2005, see the race/ethnicity note at the end of Appendix D.
aIn 2001 the question text was changed on half of the questionnaire forms. “Other psychedelics” was changed to “other hallucinogens,” and “shrooms” was added to the list of examples. The 2001 data are based on the changed forms only; N is one-half of N indicated. In 2002 the remaining forms were changed. Beginning in 2002, the data are based on all forms. Data for "any illicit drug other than marijuana" and “hallucinogens” are also
TABLE D-20 (cont'd) Hallucinogens Other Than LSD: Trends in Annual Prevalence of Use
by Subgroups for Tenth Graders
Notes: ‘‡’ indicates some change in the question. See relevant footnote. See relevant figure to assess the impact of the wording changes.
See Table D-107 for the number of subgroup cases. See Appendix B for definition of variables in table.
Level of significance of difference between the two most recent classes: s = .05, ss = .01, sss = .001. ‘—’ indicates data not available. Any apparent inconsistency between the change estimate and the prevalence-of-use estimates for the two most recent classes is due to rounding error.
Source: The Monitoring the Future Study, the University of Michigan.
293

1975 1976 1977 1978 1979 1980 1981 1982 1983 1984 1985 1986 1987 1988 1989 1990Approx. N = 9,400 15,400 17,100 17,800 15,500 15,900 17,500 17,700 16,300 15,900 16,000 15,200 16,300 16,300 16,700 15,200
Total 9.4 7.0 6.9 7.3 6.8 6.2 5.6 4.7 4.1 3.8 3.6 3.0 3.2 2.1 2.2 2.1Gender: Male 12.1 8.8 8.9 8.8 8.0 8.0 6.9 5.7 4.9 4.8 4.6 3.4 3.7 2.7 3.1 3.0 Female 7.5 5.0 4.9 5.5 5.3 4.2 4.0 3.6 3.1 2.7 2.5 2.5 2.6 1.4 1.1 1.1College Plans: None or under 4 years — 8.3 8.6 8.1 7.6 6.7 6.0 5.1 4.8 4.5 4.1 3.3 3.5 2.5 2.7 2.1 Complete 4 years — 5.2 4.9 5.7 5.3 5.1 5.0 4.1 3.1 3.0 2.9 2.5 2.8 1.8 1.9 1.9Region: Northeast 12.0 7.8 8.2 10.3 10.2 10.0 9.0 8.1 6.1 8.4 7.1 5.1 4.8 2.6 2.5 2.9 North Central 11.3 7.9 7.9 7.6 6.8 6.7 5.7 4.8 4.4 2.9 3.1 2.7 3.5 1.6 2.3 1.7 South 7.1 5.7 5.4 4.8 4.1 3.1 2.0 1.8 2.4 1.5 1.5 1.4 1.7 2.0 1.9 1.7 West 7.7 6.7 6.3 7.2 6.6 5.9 6.9 4.9 4.1 4.5 3.6 3.3 3.3 2.5 2.3 2.6Population Density: Large MSA 11.1 7.8 7.5 9.3 8.8 8.5 8.1 7.3 6.6 6.9 6.1 5.1 4.8 3.3 2.6 2.3 Other MSA 10.7 7.3 7.2 6.9 7.2 6.5 5.0 3.7 4.0 3.1 3.0 2.4 2.5 1.7 2.0 2.4 Non-MSA 6.8 6.1 6.1 6.1 4.7 4.1 4.4 4.0 2.4 2.4 2.4 2.1 2.9 1.6 2.1 1.5Parental Education:b
1.0-2.0 (Low) 7.5 5.1 5.4 5.7 4.7 5.8 3.9 3.7 3.6 2.8 2.7 2.3 3.4 2.7 2.0 1.5 2.5-3.0 8.7 7.6 6.9 7.2 6.5 5.9 5.1 4.7 3.6 3.8 3.5 3.1 2.9 1.5 1.8 1.2 3.5-4.0 9.1 7.5 7.4 7.3 6.6 5.8 5.8 4.8 4.5 3.6 4.1 3.2 3.0 1.8 1.8 2.2 4.5-5.0 9.7 8.4 7.0 7.8 7.5 6.4 6.0 4.7 3.9 3.8 3.6 2.7 3.3 2.2 2.6 2.8 5.5-6.0 (High) 7.4 7.2 7.8 7.9 9.2 7.2 7.0 6.7 4.6 5.3 2.6 2.8 3.5 3.1 3.3 3.6Race (2-year average):c
White — — 7.6 7.6 7.5 7.0 6.3 5.6 4.7 4.3 4.0 3.5 3.4 3.0 2.4 2.4 Black — — 1.6 1.6 1.3 1.4 1.3 1.2 1.6 1.3 0.8 0.9 0.9 0.6 0.5 0.4 Hispanic — — 5.1 5.2 4.8 4.4 4.5 4.8 4.2 3.4 3.7 3.3 2.1 1.7 1.6 1.5
Class of:
TABLE D-21Hallucinogens Other Than LSD: Trends in Annual Prevalence of Use
by Subgroups for Twelfth Graders
Percentage who used in last twelve monthsCont'd
294

1991 1992 1993 1994 1995 1996 1997 1998 1999 2000 2001a 2002a 2003 2004 2005 2006Approx. N = 15,000 15,800 16,300 15,400 15,400 14,300 15,400 15,200 13,600 12,800 12,800 12,900 14,600 14,600 14,700 14,200
Total 2.0 1.7 2.2 3.1 3.8 4.4 4.6 4.6 4.3 4.4‡ 5.9 5.4 5.4 5.6 5.0 4.6 -0.4Gender: Male 2.7 2.3 3.0 4.3 5.3 5.7 5.9 6.0 5.4 5.8‡ 7.2 7.2 7.2 7.7 6.7 5.7 -1.0 Female 1.3 1.2 1.3 1.9 2.1 2.8 3.2 3.0 3.1 2.9‡ 4.2 3.5 3.4 3.4 3.2 3.3 +0.1College Plans: None or under 4 years 2.4 2.2 2.5 3.2 4.4 5.1 4.7 6.1 4.4 5.6‡ 7.3 7.9 7.3 6.9 6.8 6.5 -0.3 Complete 4 years 1.9 1.5 2.0 2.9 3.4 4.0 4.4 3.9 4.0 3.8‡ 5.0 4.6 4.5 4.9 4.4 4.1 -0.3Region: Northeast 3.5 2.5 2.6 5.1 5.3 6.1 6.6 6.3 5.5 5.0‡ 6.9 7.5 7.3 6.7 4.9 6.4 +1.5 North Central 1.9 1.8 2.0 3.1 3.2 3.5 2.8 4.1 3.7 3.6‡ 6.9 5.0 4.7 4.6 6.3 4.7 -1.6 s South 1.0 1.3 1.8 1.9 3.1 3.6 4.0 3.5 3.3 3.3‡ 3.1 4.5 4.3 4.9 4.7 3.8 -1.0 West 2.6 1.8 2.9 3.6 4.5 5.4 6.1 5.5 5.7 6.9‡ 8.0 5.6 6.0 6.9 4.0 4.2 +0.2Population Density: Large MSA 1.8 2.1 2.5 3.6 4.9 5.2 4.0 4.4 4.5 5.2‡ 7.6 5.9 3.9 5.2 5.1 5.5 +0.4 Other MSA 2.6 1.7 2.2 3.6 3.7 4.7 5.4 5.1 4.2 4.3‡ 5.4 5.8 6.5 6.6 5.4 4.2 -1.2 s Non-MSA 1.2 1.4 2.0 1.8 2.7 3.1 3.6 3.7 4.2 3.8‡ 4.8 4.3 5.1 4.1 4.0 3.9 -0.1Parental Education:b
1.0-2.0 (Low) 1.9 1.3 1.7 2.2 2.7 3.5 2.7 3.7 2.2 3.8‡ 3.8 4.3 4.7 3.3 2.9 4.9 +2.0 2.5-3.0 1.6 1.6 1.5 2.4 3.4 3.0 3.5 3.9 3.3 3.6‡ 5.4 5.4 4.3 4.9 5.1 4.5 -0.6 3.5-4.0 2.0 1.8 2.4 2.9 3.6 4.0 4.8 4.6 5.1 4.2‡ 6.1 5.6 5.9 6.0 4.9 4.9 0.0 4.5-5.0 2.4 1.7 2.7 3.7 4.2 5.2 5.3 5.0 4.4 4.6‡ 5.5 5.8 6.0 6.3 5.3 4.3 -1.0 5.5-6.0 (High) 2.4 2.1 3.0 4.4 4.1 5.9 5.9 5.4 4.7 5.8‡ 6.6 5.1 4.8 5.6 5.3 4.5 -0.8Race (2-year average):c
White 2.4 2.2 2.2 3.0 3.8 4.4 5.2 5.6 5.2 4.8 4.7‡ 5.4d 6.3 6.4 6.1 5.5 -0.6 Black 0.3 0.3 0.5 0.7 0.8 0.8 0.7 0.6 0.6 1.0 0.9‡ 0.9d 0.9 0.9 1.2 1.4 +0.2 Hispanic 1.7 1.4 1.4 1.6 2.6 3.5 3.1 2.7 3.0 4.6 4.8‡ 4.1d 4.1 3.7 3.6 3.5 -0.1
TABLE D-21 (cont'd)Hallucinogens Other Than LSD: Trends in Annual Prevalence of Use
by Subgroups for Twelfth Graders
’05–’06change
Percentage who used in last twelve monthsClass of:
(Table continued on next page)
295

TABLE D-21 (cont'd)
Level of significance of difference between the two most recent classes: s = .05, ss = .01, sss = .001. ‘—’ indicates data not available.
Hallucinogens Other Than LSD: Trends in Annual Prevalence of Use by Subgroups for Twelfth Graders
Notes: ‘‡’ indicates some change in the question. See relevant footnote. See relevant figure to assess the impact of the wording changes. Source: The Monitoring the Future Study, the University of Michigan.
Any apparent inconsistency between the change estimate and the prevalence-of-use estimates for the two most recent classes is due to rounding error.
cTo derive percentages for each racial subgroup, data for the specified year and the previous year have been combined to increase subgroup sample sizes and thus provide more stable estimates. For the data beginning in 2005, see the race/ethnicity note at the end of Appendix D. dThe 2002 data comprise half of the 2001 sample data double-weighted and all of the 2002 sample data.
See Table D-108 for the number of subgroup cases. See Appendix B for definition of variables in table.
aIn 2001 the question text was changed on half of the questionnaire forms. “Other psychedelics” was changed to “other hallucinogens,” and “shrooms” was added to the list of examples. The 2001 data are based on the changed forms only; N is one-half of N indicated. In 2002 the remaining forms were changed. Beginning in 2002, the data are based on all forms. Data for "any illcit drug other than marijuana" and “hallucinogens” are also affected by these changes and have been treated in a parallel manner.bParental education is an average score of mother’s education and father’s education. See Appendix B for details.
296

1991 1992 1993 1994 1995 1996 1997 1998 1999 2000 2001 2002 2003 2004 2005 2006Approx. N = — — — — — 17,800 18,600 18,100 16,700 16,700 16,200 15,100 16,500 17,000 16,800 16,500
Total — — — — — 2.3 2.3 1.8 1.7 3.1 3.5 2.9 2.1 1.7 1.7 1.4 -0.2Gender: Male — — — — — 2.2 2.7 2.3 1.7 3.1 3.4 3.1 1.8 1.7 1.6 1.0 -0.6 Female — — — — — 2.3 2.0 1.3 1.7 3.0 3.7 2.6 2.2 1.8 1.7 1.7 0.0College Plans: None or under 4 years — — — — — 4.8 6.1 4.8 5.3 6.5 9.2 9.1 6.9 5.4 5.9 3.8 -2.0 Complete 4 years — — — — — 1.9 2.0 1.5 1.2 2.7 2.9 2.3 1.5 1.3 1.3 1.2 -0.1Region: Northeast — — — — — 2.1 1.5 1.6 1.8 2.4 3.8 2.0 1.8 1.8 1.1 0.8 -0.3 North Central — — — — — 1.7 1.7 1.7 1.4 3.5 2.9 2.3 2.1 1.4 1.7 1.6 0.0 South — — — — — 2.8 2.3 2.7 1.8 3.2 3.7 3.7 2.5 1.9 2.1 2.0 -0.1 West — — — — — 2.3 3.8 0.8 1.7 2.9 3.6 3.0 1.6 1.7 1.5 0.7 -0.7Population Density: Large MSA — — — — — 2.9 1.8 1.8 1.6 3.0 3.1 2.6 1.8 2.1 1.6 1.1 -0.5 Other MSA — — — — — 2.5 3.1 2.1 1.8 3.4 4.3 3.3 1.9 1.9 1.6 1.6 0.0 Non-MSA — — — — — 1.2 1.5 1.5 1.6 2.5 2.5 2.5 2.7 1.0 1.9 1.6 -0.3Parental Education:a
1.0-2.0 (Low) — — — — — 2.9 2.2 2.1 2.5 4.2 5.8 6.0 3.6 3.6 2.5 2.8 +0.2 2.5-3.0 — — — — — 2.2 2.4 1.4 2.0 3.9 4.3 3.6 3.1 2.2 3.0 1.5 -1.5 s 3.5-4.0 — — — — — 2.2 2.9 2.6 1.5 2.8 2.4 2.9 2.1 1.7 1.7 1.2 -0.5 4.5-5.0 — — — — — 2.6 2.0 1.4 1.2 3.1 3.3 2.4 1.4 1.2 1.1 1.3 +0.2 5.5-6.0 (High) — — — — — 2.4 2.7 2.5 2.3 2.0 3.0 1.2 2.0 1.7 0.9 1.2 +0.3Race (2-year average):b
White — — — — — — 2.7 2.4 1.9 2.5 3.2 2.9 2.4 1.9 1.5 1.5 -0.1 Black — — — — — — 0.3 0.4 0.5 0.6 1.1 1.1 1.0 1.6 1.8 1.4 -0.4 Hispanic — — — — — — 2.5 1.7 1.9 3.3 5.3 5.9 4.0 2.3 2.3 1.8 -0.6Source: The Monitoring the Future Study, the University of Michigan.
change
bTo derive percentages for each racial subgroup, data for the specified year and the previous year have been combined to increase subgroup sample sizes and thus provide
more stable estimates. For the data beginning in 2005, see the race/ethnicity note at the end of Appendix D.
Data based on one of four forms in 1996–2001; N is one-third of N indicated in Table D-106. Data based on two of four forms beginning in 2002; N is one-half of N
indicated in Table D-106.
Notes: Level of significance of difference between the two most recent classes: s = .05, ss = .01, sss = .001. ‘—’ indicates data not available.
Any apparent inconsistency between the change estimate and the prevalence-of-use estimates for the two most recent classes is due to rounding error.
See Table D-106 for the number of subgroup cases. See Appendix B for definition of variables in table.
aParental education is an average score of mother’s education and father’s education. See Appendix B for details.
TABLE D-22
Percentage who used in last twelve months’05–’06
MDMA (Ecstasy): Trends in Annual Prevalence of Use by Subgroups for Eighth Graders
297

1991 1992 1993 1994 1995 1996 1997 1998 1999 2000 2001 2002 2003 2004 2005 2006Approx. N = — — — — — 15,600 15,500 15,000 13,600 14,300 14,000 14,300 15,800 16,400 16,200 16,200
Total — — — — — 4.6 3.9 3.3 4.4 5.4 6.2 4.9 3.0 2.4 2.6 2.8 +0.2Gender: Male — — — — — 4.9 4.7 3.5 4.7 5.7 7.6 4.3 2.8 2.4 2.6 3.3 +0.7 Female — — — — — 4.2 3.1 2.9 4.2 4.8 4.9 5.2 3.2 2.4 2.5 2.2 -0.3College Plans: None or under 4 years — — — — — 7.7 7.5 5.4 8.5 10.7 13.6 10.1 5.7 5.4 5.6 6.9 +1.4 Complete 4 years — — — — — 4.0 3.3 2.9 3.7 4.5 5.1 4.1 2.6 2.0 2.2 2.2 0.0Region: Northeast — — — — — 4.4 3.0 3.8 7.0 6.4 8.2 4.4 2.7 2.6 2.2 2.2 0.0 North Central — — — — — 3.6 3.2 2.2 2.3 5.2 4.8 4.6 2.5 1.9 3.0 2.8 -0.2 South — — — — — 5.6 5.0 4.1 4.1 5.2 5.9 5.1 3.8 2.6 2.6 3.0 +0.5 West — — — — — 4.1 3.7 2.7 4.4 5.0 6.8 5.2 3.0 2.7 2.5 3.0 +0.5Population Density: Large MSA — — — — — 5.6 4.0 2.5 5.2 7.0 7.3 5.1 2.4 1.8 3.0 2.9 -0.1 Other MSA — — — — — 4.6 3.6 4.1 4.7 5.3 5.5 5.2 3.1 3.1 2.5 2.7 +0.2 Non-MSA — — — — — 3.3 4.2 2.7 2.8 3.7 6.3 3.7 3.8 2.0 2.3 2.8 +0.6Parental Education:a
1.0-2.0 (Low) — — — — — 4.8 3.0 1.9 3.7 7.0 7.2 5.8 2.4 3.3 4.4 3.8 -0.6 2.5-3.0 — — — — — 4.7 3.9 3.1 4.4 4.9 6.5 5.5 3.8 3.3 2.8 2.9 +0.1 3.5-4.0 — — — — — 4.7 5.2 4.3 4.0 6.3 7.0 5.5 3.5 2.1 3.3 2.5 -0.8 4.5-5.0 — — — — — 4.2 2.5 2.9 4.3 5.0 5.3 3.9 2.7 2.3 2.2 2.7 +0.4 5.5-6.0 (High) — — — — — 5.3 4.0 4.4 5.6 4.8 5.8 4.6 2.3 1.4 1.4 3.3 +1.9 sRace (2-year average):b
White — — — — — — 4.8 4.0 4.4 5.3 6.0 6.2 4.6 3.1 2.7 2.9 +0.3 Black — — — — — — 0.8 1.2 1.3 1.5 2.2 1.8 1.5 0.9 0.6 1.0 +0.5 Hispanic — — — — — — 3.6 2.3 2.4 4.6 5.4 4.3 3.4 3.0 4.3 3.9 -0.4
change
Notes: Level of significance of difference between the two most recent classes: s = .05, ss = .01, sss = .001. ‘—’ indicates data not available.
TABLE D-23 MDMA (Ecstasy): Trends in Annual Prevalence of Use by Subgroups for Tenth Graders
Percentage who used in last twelve months’05–’06
Source: The Monitoring the Future Study, the University of Michigan.
more stable estimates. For the data beginning in 2005, see the race/ethnicity note at the end of Appendix D.
Any apparent inconsistency between the change estimate and the prevalence-of-use estimates for the two most recent classes is due to rounding error.
aParental education is an average score of mother’s education and father’s education. See Appendix B for details.bTo derive percentages for each racial subgroup, data for the specified year and the previous year have been combined to increase subgroup sample sizes and thus provide
See Table D-107 for the number of subgroup cases. See Appendix B for definition of variables in table.
Data based on one of four forms in 1996–2001; N is one-third of N indicated in Table D-107. Data based on two of four forms beginning in 2002; N is one-half of N
indicated in Table D-107.
298

1975–79 1980–89 1990–95 1996 1997 1998 1999 2000 2001 2002 2003 2004 2005 2006Approx. N = — — — 14,300 15,400 15,200 13,600 12,800 12,800 12,900 14,600 14,600 14,700 14,200
Total — — — 4.6 4.0 3.6 5.6 8.2 9.2 7.4 4.5 4.0 3.0 4.1 +1.1Gender: Male — — — 4.8 5.6 4.8 5.6 8.1 10.5 8.2 4.8 4.7 3.3 4.3 +1.1 Female — — — 4.2 2.5 2.7 5.6 8.2 8.0 6.4 4.0 3.2 2.7 4.0 +1.3 sCollege Plans: None or under 4 years — — — 6.9 3.8 4.7 4.2 8.5 9.8 8.9 6.5 5.3 3.7 6.0 +2.3 Complete 4 years — — — 4.0 3.9 3.3 6.2 8.0 8.7 7.1 3.9 3.6 2.8 3.7 +0.9Region: Northeast — — — 6.3 6.9 3.7 9.4 8.8 10.1 10.3 5.1 3.5 3.0 2.9 0.0 North Central — — — 3.7 1.3 2.7 3.3 5.7 11.8 5.0 4.7 3.0 3.0 3.4 +0.5 South — — — 4.6 4.3 4.0 5.7 5.9 5.7 7.9 4.2 5.1 3.4 4.9 +1.5 West — — — 3.9 4.1 4.0 5.0 14.4 10.3 6.8 4.2 3.8 2.5 4.6 +2.1Population Density: Large MSA — — — 3.6 3.6 3.2 6.1 8.7 10.9 8.4 4.3 4.0 3.5 6.1 +2.6 s Other MSA — — — 5.1 4.6 4.3 6.1 8.4 9.7 8.1 5.0 4.5 3.2 3.1 0.0 Non-MSA — — — 4.5 3.4 2.7 4.2 7.4 6.4 4.6 4.0 2.8 2.1 3.1 +1.0Parental Education:a
1.0-2.0 (Low) — — — 5.5 3.5 4.2 6.8 7.3 3.8 4.8 4.1 4.6 3.0 3.8 +0.8 2.5-3.0 — — — 5.0 3.1 3.2 5.1 7.7 10.3 8.0 3.8 3.7 3.9 3.6 -0.4 3.5-4.0 — — — 4.9 3.8 3.2 5.7 6.2 8.4 7.5 5.7 4.6 2.8 3.9 +1.2 4.5-5.0 — — — 4.0 2.9 4.3 6.2 8.3 11.2 7.3 5.0 3.8 3.2 5.1 +2.0 5.5-6.0 (High) — — — 4.1 8.7 3.5 4.7 10.6 8.1 7.6 3.3 3.1 2.0 3.6 +1.6Race (2-year average):b
White — — — — 5.2 4.7 5.1 7.6 9.6 8.5 6.4 4.7 3.9 4.0 +0.2 Black — — — — 0.4 0.4 0.5 1.3 2.4 1.7 1.4 1.6 1.4 1.8 +0.4 Hispanic — — — — 2.8 2.7 6.0 10.6 10.2 7.0 5.3 3.7 3.0 3.0 +0.1
Source: The Monitoring the Future Study, the University of Michigan.
For the data beginning in 2005, see the race/ethnicity note at the end of Appendix D.
Notes: Level of significance of difference between the two most recent classes: s = .05, ss = .01, sss = .001. ‘—’ indicates data not available.
Any apparent inconsistency between the change estimate and the prevalence-of-use estimates for the two most recent classes is due to rounding error.
See Table D-108 for the number of subgroup cases. See Appendix B for definition of variables in table.
bTo derive percentages for each racial subgroup, data for the specified year and the previous year have been combined to increase subgroup sample sizes and thus provide more stable estimates.
Data based on one of six forms in 1996–2001; N is one-sixth of N indicated in Table D-108. Data based on two of six forms beginning in 2002; N is two-sixths of N indicated in Table D-108.
Caution: Limited sample sizes (see “Notes” above). Use caution in interpreting subgroup trends.aParental education is an average score of mother’s education and father’s education. See Appendix B for details.
’05–’06change
TABLE D-24MDMA (Ecstasy): Trends in Annual Prevalence of Use by Subgroups for Twelfth Graders
Percentage who used in last twelve monthsClass of:
299

1991 1992 1993 1994 1995 1996 1997 1998 1999 2000 2001 2002 2003 2004 2005 2006Approx. N = 17,500 18,600 18,300 17,300 17,500 17,800 18,600 18,100 16,700 16,700 16,200 15,100 16,500 17,000 16,800 16,500
Total 1.1 1.5 1.7 2.1 2.6 3.0 2.8 3.1 2.7 2.6 2.5 2.3 2.2 2.0 2.2 2.0 -0.2Gender: Male 1.4 1.5 1.9 2.1 2.5 2.7 3.1 2.9 2.8 2.6 2.4 2.2 1.9 1.7 2.0 1.9 -0.1 Female 0.9 1.5 1.5 2.1 2.6 3.1 2.5 3.1 2.7 2.6 2.6 2.3 2.3 2.3 2.3 2.1 -0.3College Plans: None or under 4 years 3.2 4.8 5.4 6.6 7.0 7.9 7.5 9.4 8.1 7.5 7.0 7.2 7.1 6.8 6.1 7.1 +1.0 Complete 4 years 0.8 1.0 1.1 1.5 2.0 2.2 2.2 2.3 2.0 2.0 2.0 1.8 1.6 1.5 1.8 1.5 -0.3Region: Northeast 1.3 0.8 1.0 2.2 2.2 2.6 2.4 1.9 2.2 1.6 1.9 1.6 1.6 1.9 1.8 1.3 -0.5 North Central 0.9 1.4 1.0 1.2 2.6 2.9 2.6 2.7 2.6 2.9 2.3 2.3 2.0 1.6 2.0 1.3 -0.7 South 1.1 1.7 2.1 2.5 2.4 2.7 2.6 3.8 3.1 2.2 3.2 2.6 2.5 2.1 2.4 2.9 +0.4 West 1.5 2.0 2.7 2.3 3.3 3.7 3.7 3.3 2.7 3.7 2.4 2.4 2.3 2.4 2.4 1.9 -0.5Population Density: Large MSA 1.1 1.4 1.3 1.9 2.4 2.8 2.4 2.3 2.1 2.3 2.1 2.0 1.7 2.2 2.2 1.9 -0.3 Other MSA 1.1 1.7 2.2 2.5 2.8 3.2 2.9 3.3 2.8 2.5 2.8 2.3 2.2 2.1 2.2 2.0 -0.2 Non-MSA 1.2 1.3 1.2 1.4 2.4 2.7 3.0 3.4 3.2 3.1 2.5 2.6 2.7 1.7 2.2 2.2 0.0Parental Education:a
1.0-2.0 (Low) 2.4 3.2 2.9 3.5 4.9 3.9 4.7 6.3 5.6 5.3 4.4 3.7 4.1 3.3 4.2 4.4 +0.3 2.5-3.0 1.4 1.6 2.0 2.3 2.4 3.3 3.0 3.3 3.1 2.9 2.8 2.8 2.4 2.5 2.9 2.2 -0.7 3.5-4.0 0.7 1.2 1.8 2.1 2.8 3.3 2.8 3.1 2.8 2.5 2.4 2.2 2.2 2.0 2.5 2.0 -0.5 4.5-5.0 0.7 1.0 1.0 1.6 1.9 2.7 2.6 2.2 1.7 1.8 2.1 2.0 1.5 1.8 1.5 1.4 -0.1 5.5-6.0 (High) 1.2 1.5 1.1 1.9 2.5 2.5 2.3 2.5 2.5 2.2 1.6 1.5 2.0 1.2 1.2 1.5 +0.3Race (2-year average):b
White — 1.2 1.3 1.6 2.3 2.8 3.0 2.8 2.6 2.5 2.5 2.4 2.2 1.9 1.8 1.9 0.0 Black — 0.7 0.7 0.7 0.6 0.6 0.5 0.7 0.8 0.8 0.8 0.8 0.9 1.0 1.0 0.9 -0.1 Hispanic — 3.1 4.0 4.5 4.7 4.8 4.3 5.2 5.9 4.7 4.2 4.1 3.8 3.6 3.6 3.5 -0.1
TABLE D-25
aParental education is an average score of mother’s education and father’s education. See Appendix B for details.bTo derive percentages for each racial subgroup, data for the specified year and the previous year have been combined to increase subgroup sample sizes and thus provide
Source: The Monitoring the Future Study, the University of Michigan.
more stable estimates. For the data beginning in 2005, see the race/ethnicity note at the end of Appendix D.
Cocaine: Trends in Annual Prevalence of Use by Subgroups for Eighth Graders
Notes: Level of significance of difference between the two most recent classes: s = .05, ss = .01, sss = .001. ‘—’ indicates data not available.
Any apparent inconsistency between the change estimate and the prevalence-of-use estimates for the two most recent classes is due to rounding error.
See Table D-106 for the number of subgroup cases. See Appendix B for definition of variables in table.
Percentage who used in last twelve months’05–’06change
300

1991 1992 1993 1994 1995 1996 1997 1998 1999 2000 2001 2002 2003 2004 2005 2006Approx. N = 14,800 14,800 15,300 15,800 17,000 15,600 15,500 15,000 13,600 14,300 14,000 14,300 15,800 16,400 16,200 16,200
Total 2.2 1.9 2.1 2.8 3.5 4.2 4.7 4.7 4.9 4.4 3.6 4.0 3.3 3.7 3.5 3.2 -0.3Gender: Male 2.2 2.0 2.5 3.1 3.5 4.5 4.7 4.9 5.2 4.7 3.8 4.2 3.3 3.9 3.6 3.2 -0.4 Female 2.2 1.7 1.6 2.5 3.3 4.0 4.6 4.4 4.6 4.1 3.2 3.9 3.2 3.4 3.3 3.1 -0.2College Plans: None or under 4 years 4.7 4.0 5.1 6.6 7.2 10.0 10.4 10.7 11.6 9.7 9.1 10.1 8.3 9.4 8.8 9.0 +0.2 Complete 4 years 1.7 1.4 1.4 2.0 2.8 3.2 3.7 3.6 3.8 3.5 2.7 3.1 2.4 2.9 2.8 2.4 -0.3Region: Northeast 1.5 1.0 2.0 2.4 2.5 3.0 3.0 4.9 4.6 3.1 2.3 2.4 3.1 3.4 3.6 2.5 -1.0 North Central 1.7 1.7 1.4 2.2 2.9 4.1 4.0 3.7 4.4 4.6 3.4 3.6 2.7 3.2 3.4 3.2 -0.2 South 2.0 1.8 1.9 2.6 3.5 4.2 5.4 4.3 5.2 4.2 3.8 3.8 3.5 3.5 2.9 3.2 +0.3 West 3.6 3.2 3.7 4.7 5.3 5.9 6.4 6.4 5.3 5.7 4.9 6.5 3.7 4.8 4.4 3.8 -0.6Population Density: Large MSA 1.9 1.6 1.6 2.3 3.4 3.8 4.5 4.3 4.1 4.3 3.2 3.6 2.5 3.3 3.3 2.8 -0.5 Other MSA 2.7 2.1 2.3 3.1 3.5 4.7 4.3 4.7 5.1 4.2 3.7 4.4 3.2 3.8 3.4 3.2 -0.2 Non-MSA 1.6 1.7 2.1 2.7 3.6 3.7 5.7 5.2 5.4 4.7 3.8 3.8 4.6 3.9 3.8 3.8 -0.1Parental Education:a
1.0-2.0 (Low) 3.3 3.5 3.2 3.8 5.3 7.4 6.3 8.1 8.2 7.7 5.6 7.9 7.0 6.5 5.3 6.5 +1.1 2.5-3.0 2.4 1.7 2.2 2.9 4.3 4.5 5.0 5.5 5.9 5.4 5.2 4.8 3.9 4.2 4.6 4.1 -0.5 3.5-4.0 2.4 2.1 2.5 3.2 3.7 4.3 5.4 4.4 4.7 4.4 2.9 3.8 3.4 4.0 3.4 2.9 -0.5 4.5-5.0 1.6 1.4 1.6 2.1 2.6 3.4 3.7 3.5 3.9 3.2 2.7 2.4 2.2 3.0 2.8 2.0 -0.8 5.5-6.0 (High) 1.9 1.5 1.1 1.9 1.9 3.4 3.3 3.2 3.9 2.9 2.0 3.2 1.6 1.8 2.4 3.0 +0.6Race (2-year average):b
White — 2.1 2.0 2.2 3.0 3.8 4.4 4.7 4.9 4.7 3.9 3.9 3.9 3.7 3.7 3.5 -0.2 Black — 0.6 0.6 1.0 0.9 0.7 0.8 1.0 0.9 0.6 0.8 1.0 0.9 0.8 1.0 1.0 0.0 Hispanic — 3.7 3.7 4.9 5.5 7.0 8.5 8.3 8.2 8.0 6.6 6.0 6.1 5.8 6.4 5.9 -0.6
’05–’06change
more stable estimates. For the data beginning in 2005, see the race/ethnicity note at the end of Appendix D.
TABLE D-26
aParental education is an average score of mother’s education and father’s education. See Appendix B for details.bTo derive percentages for each racial subgroup, data for the specified year and the previous year have been combined to increase subgroup sample sizes and thus provide
Cocaine: Trends in Annual Prevalence of Use by Subgroups for Tenth Graders
Notes: Level of significance of difference between the two most recent classes: s = .05, ss = .01, sss = .001. ‘—’ indicates data not available.
Any apparent inconsistency between the change estimate and the prevalence-of-use estimates for the two most recent classes is due to rounding error.
Source: The Monitoring the Future Study, the University of Michigan.
See Table D-107 for the number of subgroup cases. See Appendix B for definition of variables in table.
Percentage who used in last twelve months
301
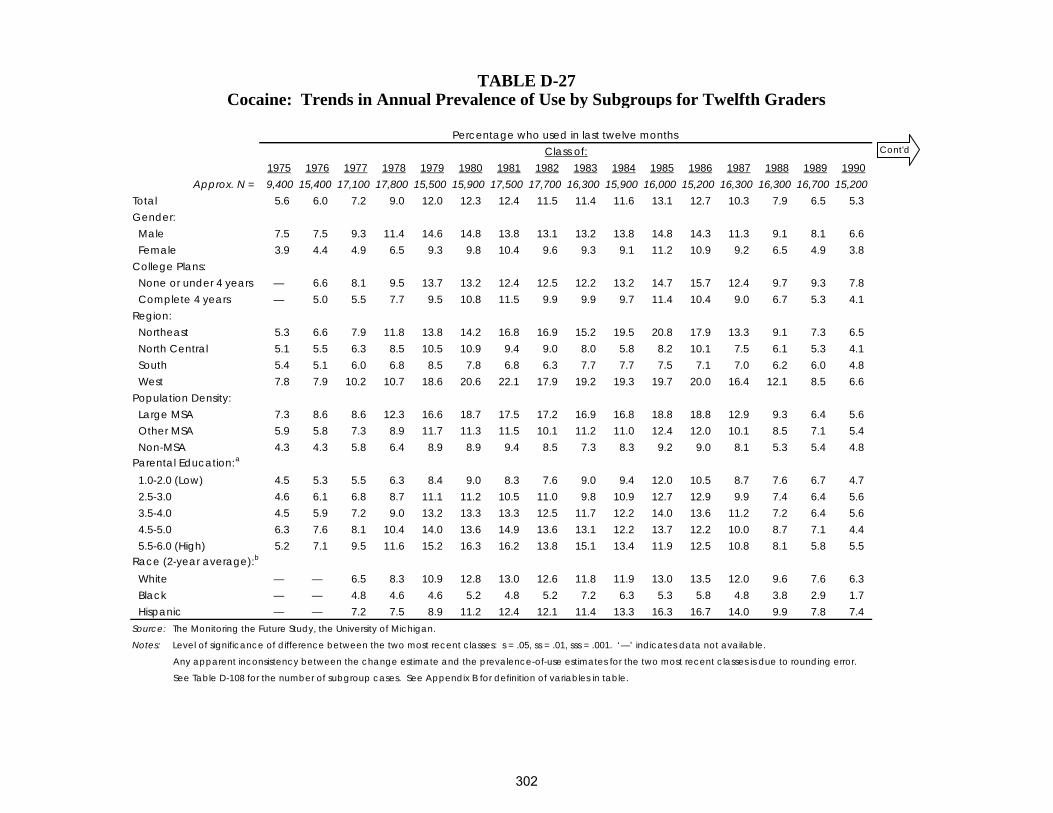
1975 1976 1977 1978 1979 1980 1981 1982 1983 1984 1985 1986 1987 1988 1989 1990Approx. N = 9,400 15,400 17,100 17,800 15,500 15,900 17,500 17,700 16,300 15,900 16,000 15,200 16,300 16,300 16,700 15,200
Total 5.6 6.0 7.2 9.0 12.0 12.3 12.4 11.5 11.4 11.6 13.1 12.7 10.3 7.9 6.5 5.3Gender: Male 7.5 7.5 9.3 11.4 14.6 14.8 13.8 13.1 13.2 13.8 14.8 14.3 11.3 9.1 8.1 6.6 Female 3.9 4.4 4.9 6.5 9.3 9.8 10.4 9.6 9.3 9.1 11.2 10.9 9.2 6.5 4.9 3.8College Plans: None or under 4 years — 6.6 8.1 9.5 13.7 13.2 12.4 12.5 12.2 13.2 14.7 15.7 12.4 9.7 9.3 7.8 Complete 4 years — 5.0 5.5 7.7 9.5 10.8 11.5 9.9 9.9 9.7 11.4 10.4 9.0 6.7 5.3 4.1Region: Northeast 5.3 6.6 7.9 11.8 13.8 14.2 16.8 16.9 15.2 19.5 20.8 17.9 13.3 9.1 7.3 6.5 North Central 5.1 5.5 6.3 8.5 10.5 10.9 9.4 9.0 8.0 5.8 8.2 10.1 7.5 6.1 5.3 4.1 South 5.4 5.1 6.0 6.8 8.5 7.8 6.8 6.3 7.7 7.7 7.5 7.1 7.0 6.2 6.0 4.8 West 7.8 7.9 10.2 10.7 18.6 20.6 22.1 17.9 19.2 19.3 19.7 20.0 16.4 12.1 8.5 6.6Population Density: Large MSA 7.3 8.6 8.6 12.3 16.6 18.7 17.5 17.2 16.9 16.8 18.8 18.8 12.9 9.3 6.4 5.6 Other MSA 5.9 5.8 7.3 8.9 11.7 11.3 11.5 10.1 11.2 11.0 12.4 12.0 10.1 8.5 7.1 5.4 Non-MSA 4.3 4.3 5.8 6.4 8.9 8.9 9.4 8.5 7.3 8.3 9.2 9.0 8.1 5.3 5.4 4.8Parental Education:a
1.0-2.0 (Low) 4.5 5.3 5.5 6.3 8.4 9.0 8.3 7.6 9.0 9.4 12.0 10.5 8.7 7.6 6.7 4.7 2.5-3.0 4.6 6.1 6.8 8.7 11.1 11.2 10.5 11.0 9.8 10.9 12.7 12.9 9.9 7.4 6.4 5.6 3.5-4.0 4.5 5.9 7.2 9.0 13.2 13.3 13.3 12.5 11.7 12.2 14.0 13.6 11.2 7.2 6.4 5.6 4.5-5.0 6.3 7.6 8.1 10.4 14.0 13.6 14.9 13.6 13.1 12.2 13.7 12.2 10.0 8.7 7.1 4.4 5.5-6.0 (High) 5.2 7.1 9.5 11.6 15.2 16.3 16.2 13.8 15.1 13.4 11.9 12.5 10.8 8.1 5.8 5.5Race (2-year average):b
White — — 6.5 8.3 10.9 12.8 13.0 12.6 11.8 11.9 13.0 13.5 12.0 9.6 7.6 6.3 Black — — 4.8 4.6 4.6 5.2 4.8 5.2 7.2 6.3 5.3 5.8 4.8 3.8 2.9 1.7 Hispanic — — 7.2 7.5 8.9 11.2 12.4 12.1 11.4 13.3 16.3 16.7 14.0 9.9 7.8 7.4Source: The Monitoring the Future Study, the University of Michigan.
Notes: Level of significance of difference between the two most recent classes: s = .05, ss = .01, sss = .001. ‘—’ indicates data not available.
Any apparent inconsistency between the change estimate and the prevalence-of-use estimates for the two most recent classes is due to rounding error.
See Table D-108 for the number of subgroup cases. See Appendix B for definition of variables in table.
TABLE D-27Cocaine: Trends in Annual Prevalence of Use by Subgroups for Twelfth Graders
Percentage who used in last twelve monthsClass of: Cont'd
302

1991 1992 1993 1994 1995 1996 1997 1998 1999 2000 2001 2002 2003 2004 2005 2006Approx. N = 15,000 15,800 16,300 15,400 15,400 14,300 15,400 15,200 13,600 12,800 12,800 12,900 14,600 14,600 14,700 14,200
Total 3.5 3.1 3.3 3.6 4.0 4.9 5.5 5.7 6.2 5.0 4.8 5.0 4.8 5.3 5.1 5.7 +0.7Gender: Male 4.1 3.7 4.0 4.5 4.8 6.0 6.6 6.8 7.3 5.8 5.4 5.9 5.9 6.5 5.8 6.0 +0.2 Female 2.6 2.4 2.3 2.8 3.1 3.5 4.2 4.5 5.0 3.9 4.1 4.0 3.7 4.1 4.2 5.2 +1.0College Plans: None or under 4 years 4.9 5.1 4.5 5.3 5.6 7.5 8.1 9.7 9.1 7.1 8.2 8.6 6.0 8.3 7.5 8.1 +0.5 Complete 4 years 2.8 2.4 2.8 3.0 3.4 4.0 4.4 4.5 5.4 4.2 3.7 3.9 4.2 4.3 4.4 5.1 +0.8Region: Northeast 3.8 2.8 3.1 3.1 3.8 5.5 6.6 5.9 4.3 4.1 4.8 5.0 5.2 5.0 4.7 6.7 +1.9 North Central 3.2 2.5 2.4 3.7 3.4 3.8 4.7 5.8 6.2 4.8 5.7 5.2 3.9 4.2 5.0 4.2 -0.9 South 3.0 3.2 3.1 3.4 3.6 4.6 4.8 5.8 6.9 4.7 3.9 5.0 4.7 5.4 5.3 6.4 +1.1 West 4.4 4.3 4.9 4.5 5.8 6.1 6.8 5.4 6.9 6.3 5.0 4.6 5.8 7.0 5.0 5.5 +0.5Population Density: Large MSA 4.1 3.6 2.7 3.3 4.4 4.8 4.7 5.4 5.0 4.1 4.3 4.1 3.8 4.7 5.2 7.4 +2.2 s Other MSA 3.7 3.3 3.9 4.1 3.9 4.9 5.6 5.8 6.6 4.9 5.0 5.4 5.7 5.8 5.2 4.8 -0.3 Non-MSA 2.5 2.4 2.7 3.2 3.9 4.9 6.0 6.0 6.9 6.1 5.2 5.3 4.6 5.0 4.7 4.9 +0.3Parental Education:a
1.0-2.0 (Low) 3.5 3.9 3.5 4.1 4.8 5.3 6.5 6.9 9.0 6.2 5.7 6.6 4.8 7.3 4.3 6.1 +1.7 2.5-3.0 3.8 3.3 3.0 4.0 3.9 5.0 5.5 6.3 6.0 4.6 6.0 5.3 4.1 5.2 6.6 6.3 -0.3 3.5-4.0 3.7 3.0 3.8 3.8 4.2 5.0 5.6 6.0 6.8 5.0 4.8 5.3 5.2 5.3 5.2 5.7 +0.5 4.5-5.0 3.1 2.9 3.0 3.1 3.7 4.8 5.2 5.0 5.4 5.3 4.4 4.2 4.7 5.2 4.3 5.1 +0.8 5.5-6.0 (High) 2.4 2.6 2.4 3.3 3.4 4.3 4.4 4.4 5.2 3.9 2.6 4.3 4.4 4.3 4.1 5.7 +1.6Race (2-year average):b
White 4.6 3.3 3.1 3.5 4.0 4.5 5.5 6.3 6.7 6.2 5.5 5.7 5.6 5.6 5.6 5.8 +0.2 Black 1.5 1.2 0.8 0.9 1.0 0.8 0.9 0.9 0.9 1.0 1.0 0.9 1.1 1.2 1.2 1.6 +0.3 Hispanic 6.1 5.2 5.8 5.4 5.5 7.3 7.6 6.7 7.5 7.6 6.1 5.5 4.9 5.5 6.2 6.5 +0.3
more stable estimates. For the data beginning in 2005, see the race/ethnicity note at the end of Appendix D.
’05–’06change
Class of:
TABLE D-27 (cont'd)Cocaine: Trends in Annual Prevalence of Use by Subgroups for Twelfth Graders
aParental education is an average score of mother’s education and father’s education. See Appendix B for details.bTo derive percentages for each racial subgroup, data for the specified year and the previous year have been combined to increase subgroup sample sizes and thus provide
Percentage who used in last twelve months
303
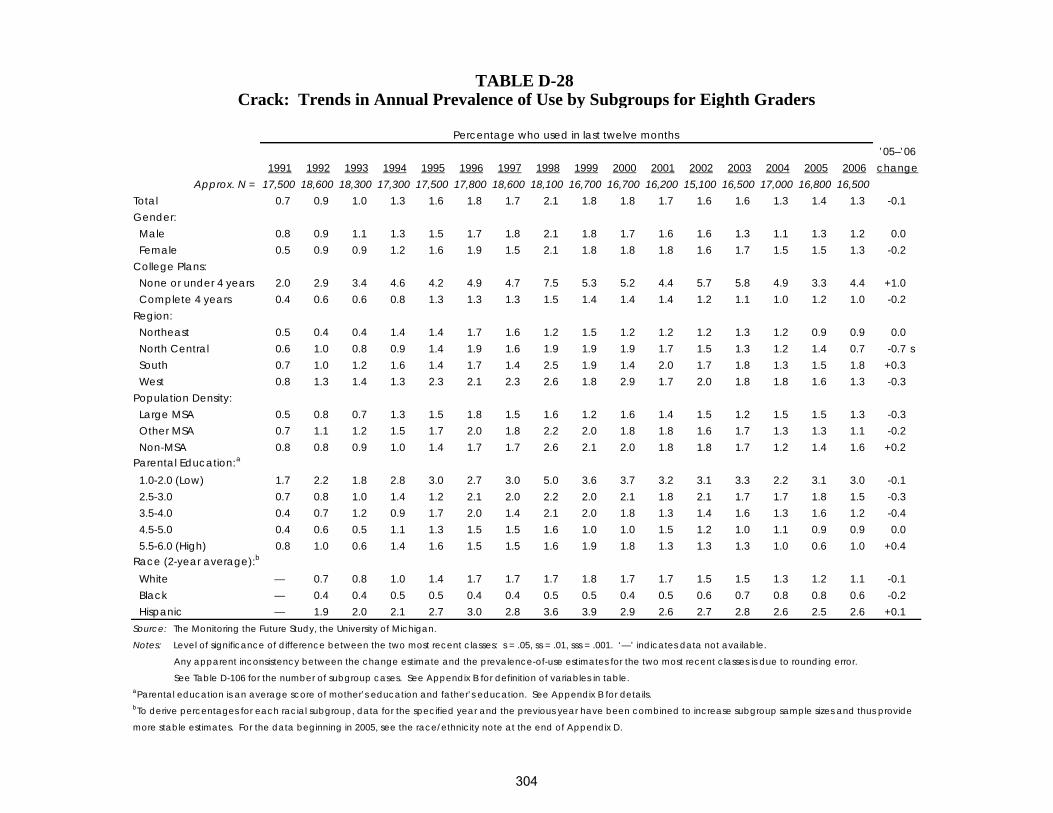
1991 1992 1993 1994 1995 1996 1997 1998 1999 2000 2001 2002 2003 2004 2005 2006Approx. N = 17,500 18,600 18,300 17,300 17,500 17,800 18,600 18,100 16,700 16,700 16,200 15,100 16,500 17,000 16,800 16,500
Total 0.7 0.9 1.0 1.3 1.6 1.8 1.7 2.1 1.8 1.8 1.7 1.6 1.6 1.3 1.4 1.3 -0.1Gender: Male 0.8 0.9 1.1 1.3 1.5 1.7 1.8 2.1 1.8 1.7 1.6 1.6 1.3 1.1 1.3 1.2 0.0 Female 0.5 0.9 0.9 1.2 1.6 1.9 1.5 2.1 1.8 1.8 1.8 1.6 1.7 1.5 1.5 1.3 -0.2College Plans: None or under 4 years 2.0 2.9 3.4 4.6 4.2 4.9 4.7 7.5 5.3 5.2 4.4 5.7 5.8 4.9 3.3 4.4 +1.0 Complete 4 years 0.4 0.6 0.6 0.8 1.3 1.3 1.3 1.5 1.4 1.4 1.4 1.2 1.1 1.0 1.2 1.0 -0.2Region: Northeast 0.5 0.4 0.4 1.4 1.4 1.7 1.6 1.2 1.5 1.2 1.2 1.2 1.3 1.2 0.9 0.9 0.0 North Central 0.6 1.0 0.8 0.9 1.4 1.9 1.6 1.9 1.9 1.9 1.7 1.5 1.3 1.2 1.4 0.7 -0.7 s South 0.7 1.0 1.2 1.6 1.4 1.7 1.4 2.5 1.9 1.4 2.0 1.7 1.8 1.3 1.5 1.8 +0.3 West 0.8 1.3 1.4 1.3 2.3 2.1 2.3 2.6 1.8 2.9 1.7 2.0 1.8 1.8 1.6 1.3 -0.3Population Density: Large MSA 0.5 0.8 0.7 1.3 1.5 1.8 1.5 1.6 1.2 1.6 1.4 1.5 1.2 1.5 1.5 1.3 -0.3 Other MSA 0.7 1.1 1.2 1.5 1.7 2.0 1.8 2.2 2.0 1.8 1.8 1.6 1.7 1.3 1.3 1.1 -0.2 Non-MSA 0.8 0.8 0.9 1.0 1.4 1.7 1.7 2.6 2.1 2.0 1.8 1.8 1.7 1.2 1.4 1.6 +0.2Parental Education:a
1.0-2.0 (Low) 1.7 2.2 1.8 2.8 3.0 2.7 3.0 5.0 3.6 3.7 3.2 3.1 3.3 2.2 3.1 3.0 -0.1 2.5-3.0 0.7 0.8 1.0 1.4 1.2 2.1 2.0 2.2 2.0 2.1 1.8 2.1 1.7 1.7 1.8 1.5 -0.3 3.5-4.0 0.4 0.7 1.2 0.9 1.7 2.0 1.4 2.1 2.0 1.8 1.3 1.4 1.6 1.3 1.6 1.2 -0.4 4.5-5.0 0.4 0.6 0.5 1.1 1.3 1.5 1.5 1.6 1.0 1.0 1.5 1.2 1.0 1.1 0.9 0.9 0.0 5.5-6.0 (High) 0.8 1.0 0.6 1.4 1.6 1.5 1.5 1.6 1.9 1.8 1.3 1.3 1.3 1.0 0.6 1.0 +0.4Race (2-year average):b
White — 0.7 0.8 1.0 1.4 1.7 1.7 1.7 1.8 1.7 1.7 1.5 1.5 1.3 1.2 1.1 -0.1 Black — 0.4 0.4 0.5 0.5 0.4 0.4 0.5 0.5 0.4 0.5 0.6 0.7 0.8 0.8 0.6 -0.2 Hispanic — 1.9 2.0 2.1 2.7 3.0 2.8 3.6 3.9 2.9 2.6 2.7 2.8 2.6 2.5 2.6 +0.1
more stable estimates. For the data beginning in 2005, see the race/ethnicity note at the end of Appendix D.
Crack: Trends in Annual Prevalence of Use by Subgroups for Eighth Graders
Notes: Level of significance of difference between the two most recent classes: s = .05, ss = .01, sss = .001. ‘—’ indicates data not available.
Any apparent inconsistency between the change estimate and the prevalence-of-use estimates for the two most recent classes is due to rounding error.
See Table D-106 for the number of subgroup cases. See Appendix B for definition of variables in table.
Percentage who used in last twelve months’05–’06change
TABLE D-28
aParental education is an average score of mother’s education and father’s education. See Appendix B for details.bTo derive percentages for each racial subgroup, data for the specified year and the previous year have been combined to increase subgroup sample sizes and thus provide
Source: The Monitoring the Future Study, the University of Michigan.
304

1991 1992 1993 1994 1995 1996 1997 1998 1999 2000 2001 2002 2003 2004 2005 2006Approx. N = 14,800 14,800 15,300 15,800 17,000 15,600 15,500 15,000 13,600 14,300 14,000 14,300 15,800 16,400 16,200 16,200
Total 0.9 0.9 1.1 1.4 1.8 2.1 2.2 2.5 2.4 2.2 1.8 2.3 1.6 1.7 1.7 1.3 -0.4 ssGender: Male 0.9 0.9 1.3 1.6 1.9 2.1 2.3 2.7 2.5 2.3 1.9 2.5 1.6 1.8 1.6 1.3 -0.4 Female 0.8 0.9 0.7 1.0 1.6 2.1 2.2 2.2 2.3 2.1 1.7 2.2 1.6 1.5 1.7 1.2 -0.4College Plans: None or under 4 years 2.4 2.1 2.7 3.4 3.7 5.0 4.9 6.0 5.5 5.2 4.7 5.6 4.5 4.6 4.8 3.7 -1.1 Complete 4 years 0.6 0.6 0.7 0.9 1.5 1.5 1.8 1.9 1.8 1.7 1.4 1.8 1.1 1.2 1.3 1.0 -0.3 sRegion: Northeast 0.5 0.4 1.1 1.4 1.1 1.4 1.5 2.6 2.5 1.7 1.0 1.4 1.3 1.4 1.8 0.9 -0.9 ss North Central 0.9 0.9 0.8 1.0 1.5 2.2 2.1 2.1 2.1 1.8 1.8 2.2 1.4 1.5 1.4 1.3 -0.2 South 1.0 0.8 0.9 1.3 1.9 2.0 2.0 1.9 2.0 1.9 1.7 1.7 1.7 1.4 1.3 1.2 -0.1 West 1.1 1.4 1.7 1.9 2.8 2.8 3.8 3.9 3.2 3.8 3.3 4.4 2.0 2.6 2.5 1.7 -0.8 sPopulation Density: Large MSA 0.9 0.8 0.7 0.9 1.9 1.7 2.3 2.2 2.2 2.4 1.9 2.2 1.2 1.5 1.8 1.3 -0.5 Other MSA 0.9 0.9 1.1 1.5 1.6 2.4 1.7 2.4 2.3 2.0 1.8 2.5 1.7 1.8 1.5 1.1 -0.4 Non-MSA 0.9 0.9 1.2 1.6 2.3 1.9 3.3 3.1 2.8 2.5 1.8 2.2 2.1 1.7 1.9 1.6 -0.3Parental Education:a
1.0-2.0 (Low) 1.3 1.7 1.8 1.9 3.0 3.9 3.4 4.5 3.4 4.8 3.0 3.9 2.9 3.5 2.6 3.9 +1.3 2.5-3.0 1.0 0.8 1.0 1.1 2.4 2.5 2.4 3.1 2.9 2.9 2.5 2.6 1.8 1.9 2.5 1.6 -1.0 s 3.5-4.0 0.9 1.0 1.4 1.5 1.7 1.9 2.6 2.0 2.5 2.2 1.4 2.2 1.6 1.6 1.4 1.0 -0.4 4.5-5.0 0.7 0.6 0.7 1.0 1.3 1.4 1.8 2.0 1.9 1.1 1.6 1.4 1.3 1.4 1.3 0.8 -0.6 s 5.5-6.0 (High) 0.7 0.9 0.5 1.1 1.1 1.8 1.2 1.8 1.8 1.4 1.2 2.2 0.8 0.8 1.0 1.0 0.0Race (2-year average):b
White — 0.9 0.9 1.1 1.5 1.9 2.2 2.3 2.4 2.2 1.8 2.0 2.0 1.6 1.5 1.4 -0.2 Black — 0.3 0.4 0.8 0.6 0.4 0.4 0.5 0.5 0.5 0.7 0.8 0.6 0.4 0.6 0.6 +0.1 Hispanic — 1.5 1.7 1.9 2.5 3.7 3.7 4.1 4.4 4.0 3.7 3.6 3.5 3.1 3.6 3.1 -0.5
’05–’06change
Source: The Monitoring the Future Study, the University of Michigan.
TABLE D-29
aParental education is an average score of mother’s education and father’s education. See Appendix B for details.bTo derive percentages for each racial subgroup, data for the specified year and the previous year have been combined to increase subgroup sample sizes and thus provide
more stable estimates. For the data beginning in 2005, see the race/ethnicity note at the end of Appendix D.
Crack: Trends in Annual Prevalence of Use by Subgroups for Tenth Graders
Notes: Level of significance of difference between the two most recent classes: s = .05, ss = .01, sss = .001. ‘—’ indicates data not available.
Any apparent inconsistency between the change estimate and the prevalence-of-use estimates for the two most recent classes is due to rounding error.
See Table D-107 for the number of subgroup cases. See Appendix B for definition of variables in table.
Percentage who used in last twelve months
305
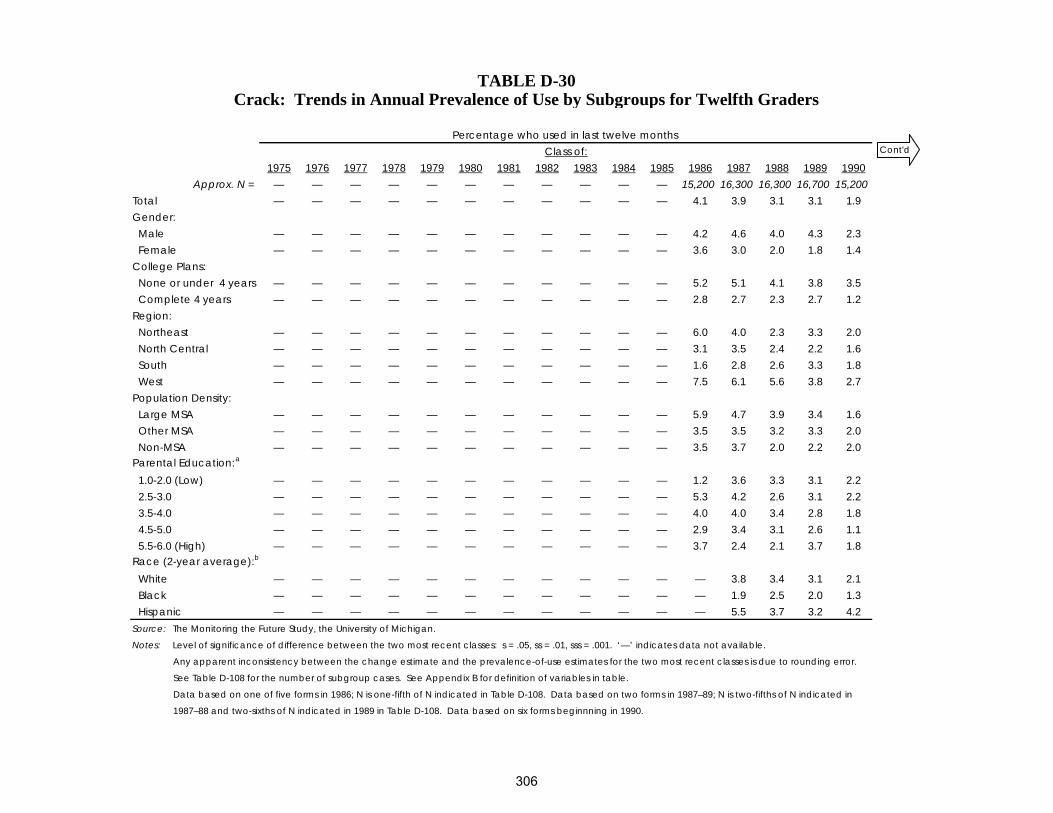
1975 1976 1977 1978 1979 1980 1981 1982 1983 1984 1985 1986 1987 1988 1989 1990Approx. N = — — — — — — — — — — — 15,200 16,300 16,300 16,700 15,200
Total — — — — — — — — — — — 4.1 3.9 3.1 3.1 1.9Gender: Male — — — — — — — — — — — 4.2 4.6 4.0 4.3 2.3 Female — — — — — — — — — — — 3.6 3.0 2.0 1.8 1.4College Plans: None or under 4 years — — — — — — — — — — — 5.2 5.1 4.1 3.8 3.5 Complete 4 years — — — — — — — — — — — 2.8 2.7 2.3 2.7 1.2Region: Northeast — — — — — — — — — — — 6.0 4.0 2.3 3.3 2.0 North Central — — — — — — — — — — — 3.1 3.5 2.4 2.2 1.6 South — — — — — — — — — — — 1.6 2.8 2.6 3.3 1.8 West — — — — — — — — — — — 7.5 6.1 5.6 3.8 2.7Population Density: Large MSA — — — — — — — — — — — 5.9 4.7 3.9 3.4 1.6 Other MSA — — — — — — — — — — — 3.5 3.5 3.2 3.3 2.0 Non-MSA — — — — — — — — — — — 3.5 3.7 2.0 2.2 2.0Parental Education:a
1.0-2.0 (Low) — — — — — — — — — — — 1.2 3.6 3.3 3.1 2.2 2.5-3.0 — — — — — — — — — — — 5.3 4.2 2.6 3.1 2.2 3.5-4.0 — — — — — — — — — — — 4.0 4.0 3.4 2.8 1.8 4.5-5.0 — — — — — — — — — — — 2.9 3.4 3.1 2.6 1.1 5.5-6.0 (High) — — — — — — — — — — — 3.7 2.4 2.1 3.7 1.8Race (2-year average):b
White — — — — — — — — — — — — 3.8 3.4 3.1 2.1 Black — — — — — — — — — — — — 1.9 2.5 2.0 1.3 Hispanic — — — — — — — — — — — — 5.5 3.7 3.2 4.2
Data based on one of five forms in 1986; N is one-fifth of N indicated in Table D-108. Data based on two forms in 1987–89; N is two-fifths of N indicated in
1987–88 and two-sixths of N indicated in 1989 in Table D-108. Data based on six forms beginnning in 1990.
Crack: Trends in Annual Prevalence of Use by Subgroups for Twelfth GradersTABLE D-30
Notes: Level of significance of difference between the two most recent classes: s = .05, ss = .01, sss = .001. ‘—’ indicates data not available.
Any apparent inconsistency between the change estimate and the prevalence-of-use estimates for the two most recent classes is due to rounding error.
See Table D-108 for the number of subgroup cases. See Appendix B for definition of variables in table.
Source: The Monitoring the Future Study, the University of Michigan.
Percentage who used in last twelve monthsClass of: Cont'd
306

1991 1992 1993 1994 1995 1996 1997 1998 1999 2000 2001 2002 2003 2004 2005 2006Approx. N = 15,000 15,800 16,300 15,400 15,400 14,300 15,400 15,200 13,600 12,800 12,800 12,900 14,600 14,600 14,700 14,200
Total 1.5 1.5 1.5 1.9 2.1 2.1 2.4 2.5 2.7 2.2 2.1 2.3 2.2 2.3 1.9 2.1 +0.1Gender: Male 1.8 1.7 1.9 2.4 2.5 2.6 3.0 3.1 2.9 2.5 2.4 2.6 2.3 2.5 2.2 2.1 -0.1 Female 1.0 1.0 1.1 1.3 1.5 1.6 1.8 2.0 2.2 1.7 1.8 1.8 1.9 1.9 1.6 1.9 +0.4College Plans: None or under 4 years 2.3 2.6 2.7 3.3 3.0 4.0 4.3 4.6 5.0 3.5 4.4 4.5 2.7 3.9 3.4 3.5 +0.1 Complete 4 years 1.1 1.0 1.2 1.4 1.7 1.6 1.7 1.9 1.9 1.7 1.5 1.7 1.8 1.7 1.6 1.7 +0.1Region: Northeast 1.3 1.3 1.2 1.5 1.6 2.1 2.6 3.0 2.4 1.8 2.0 2.0 2.0 1.7 1.5 2.5 +1.0 s North Central 1.5 1.4 1.3 2.2 2.0 2.3 2.2 2.6 2.8 2.0 2.6 2.6 1.9 2.1 2.3 1.5 -0.8 s South 1.2 1.2 1.5 1.6 1.7 1.7 1.8 2.0 2.3 1.8 1.2 1.9 2.0 2.2 1.8 2.1 +0.4 West 1.8 2.1 2.1 2.3 3.5 2.6 3.4 3.2 3.4 3.2 3.0 2.8 3.0 3.3 2.3 2.2 0.0Population Density: Large MSA 1.2 1.3 1.3 1.5 2.0 2.1 2.2 2.5 2.0 1.8 1.5 1.6 1.8 2.0 1.7 2.6 +1.0 ss Other MSA 1.7 1.6 1.8 2.1 2.1 1.9 2.3 2.4 2.5 2.1 2.2 2.4 2.3 2.2 1.8 1.7 -0.2 Non-MSA 1.2 1.3 1.4 1.9 2.1 2.5 2.8 2.9 3.6 2.8 2.8 2.8 2.4 2.8 2.5 2.0 -0.5Parental Education:a
1.0-2.0 (Low) 1.6 1.9 2.6 2.7 3.4 3.4 3.6 3.9 3.2 2.8 3.8 4.8 2.5 3.3 2.3 3.6 +1.3 2.5-3.0 1.5 1.9 1.6 2.2 2.3 2.4 2.5 2.8 2.8 2.1 2.6 2.2 1.6 2.9 2.4 2.4 -0.1 3.5-4.0 1.7 1.3 1.5 1.8 1.7 2.2 2.0 2.4 3.0 2.2 1.8 2.3 2.3 1.9 2.0 2.0 0.0 4.5-5.0 0.9 1.0 1.4 1.1 1.9 1.6 2.5 2.1 2.2 1.8 1.9 1.7 2.2 1.8 1.5 1.8 +0.4 5.5-6.0 (High) 1.1 0.8 1.0 1.8 1.5 1.6 1.8 2.1 1.6 2.2 1.2 1.5 1.9 1.7 1.5 1.2 -0.3Race (2-year average):b
White 1.6 1.3 1.3 1.6 1.9 2.0 2.2 2.6 2.8 2.5 2.2 2.3 2.2 2.2 2.1 1.9 -0.2 Black 1.0 0.6 0.6 0.9 1.0 0.7 0.5 0.3 0.4 0.5 0.5 0.7 1.2 1.3 0.9 1.0 0.0 Hispanic 3.4 2.7 2.5 2.4 3.1 4.1 4.2 3.9 3.5 3.4 3.1 3.1 2.9 3.0 3.1 3.1 0.0
change
more stable estimates. For the data beginning in 2005, see the race/ethnicity note at the end of Appendix D.
aParental education is an average score of mother’s education and father’s education. See Appendix B for details.bTo derive percentages for each racial subgroup, data for the specified year and the previous year have been combined to increase subgroup sample sizes and thus provide
TABLE D-30 (cont'd)Crack: Trends in Annual Prevalence of Use by Subgroups for Twelfth Graders
Percentage who used in last twelve monthsClass of: ’05–’06
307

1991 1992 1993 1994 1995 1996 1997 1998 1999 2000 2001 2002 2003 2004 2005 2006Approx. N = 17,500 18,600 18,300 17,300 17,500 17,800 18,600 18,100 16,700 16,700 16,200 15,100 16,500 17,000 16,800 16,500
Total 1.0 1.2 1.3 1.7 2.1 2.5 2.2 2.4 2.3 1.9 1.9 1.8 1.6 1.6 1.7 1.6 -0.1Gender: Male 1.1 1.2 1.5 1.7 2.0 2.2 2.5 2.3 2.3 1.9 1.8 1.7 1.5 1.3 1.5 1.4 -0.1 Female 0.8 1.2 1.2 1.8 2.2 2.6 1.9 2.4 2.2 1.8 2.0 1.9 1.6 1.8 1.8 1.7 0.0College Plans: None or under 4 years 2.7 4.2 4.1 5.6 5.9 6.6 6.0 7.7 7.1 6.1 5.3 6.4 5.0 5.4 4.5 5.7 +1.1 Complete 4 years 0.6 0.7 0.9 1.2 1.6 1.8 1.7 1.8 1.7 1.4 1.5 1.3 1.2 1.1 1.4 1.2 -0.2Region: Northeast 1.2 0.7 0.9 1.9 1.8 2.1 1.6 1.4 1.7 1.1 1.6 1.2 1.0 1.6 1.5 1.0 -0.5 North Central 0.6 1.0 0.7 0.9 2.0 2.4 2.0 1.9 2.2 2.3 1.6 1.8 1.7 1.1 1.3 1.1 -0.3 South 1.0 1.5 1.6 2.0 2.0 2.3 2.1 3.1 2.6 1.7 2.4 2.1 1.9 1.7 1.9 2.3 +0.4 West 1.3 1.5 2.1 2.0 2.7 3.1 2.9 2.5 2.2 2.5 1.7 1.9 1.6 1.8 1.8 1.5 -0.4Population Density: Large MSA 0.9 1.1 1.0 1.6 2.0 2.5 1.7 1.8 1.8 1.6 1.6 1.4 1.2 1.7 1.6 1.5 0.0 Other MSA 0.9 1.4 1.8 2.1 2.1 2.6 2.2 2.5 2.3 1.8 2.2 1.8 1.6 1.6 1.7 1.6 -0.1 Non-MSA 1.1 0.9 0.7 1.2 2.2 2.2 2.5 2.8 2.8 2.5 1.6 2.3 2.2 1.3 1.7 1.7 0.0Parental Education:a
1.0-2.0 (Low) 2.1 2.7 2.2 3.1 4.3 3.2 3.5 4.7 5.1 4.2 3.7 2.8 2.9 3.1 2.9 3.6 +0.7 2.5-3.0 1.2 1.1 1.5 2.0 2.0 2.6 2.4 2.5 2.8 2.1 1.9 2.3 1.8 1.9 2.2 1.7 -0.4 3.5-4.0 0.6 1.0 1.5 1.9 2.2 2.8 2.1 2.4 2.3 1.9 1.8 1.9 1.6 1.5 2.0 1.7 -0.3 4.5-5.0 0.6 0.8 0.8 1.1 1.6 2.4 1.9 1.8 1.3 1.4 1.6 1.6 1.1 1.3 1.2 1.2 0.0 5.5-6.0 (High) 1.0 1.2 0.8 1.2 2.0 1.9 1.7 1.8 1.8 1.3 1.1 0.8 1.5 0.9 0.9 0.9 0.0Race (2-year average):b
White — 0.9 1.0 1.2 1.8 2.4 2.5 2.2 2.1 1.9 1.8 1.8 1.8 1.5 1.4 1.5 +0.1 Black — 0.6 0.5 0.6 0.5 0.4 0.3 0.5 0.7 0.6 0.5 0.5 0.6 0.8 0.9 0.7 -0.2 Hispanic — 2.6 3.3 4.0 4.3 4.1 3.3 4.0 4.9 3.9 3.2 3.1 2.7 2.8 2.9 2.8 -0.1
more stable estimates. For the data beginning in 2005, see the race/ethnicity note at the end of Appendix D.
TABLE D-31
aParental education is an average score of mother’s education and father’s education. See Appendix B for details.bTo derive percentages for each racial subgroup, data for the specified year and the previous year have been combined to increase subgroup sample sizes and thus provide
Other Cocaine: Trends in Annual Prevalence of Use by Subgroups for Eighth Graders
Notes: Level of significance of difference between the two most recent classes: s = .05, ss = .01, sss = .001. ‘—’ indicates data not available.
Any apparent inconsistency between the change estimate and the prevalence-of-use estimates for the two most recent classes is due to rounding error.
See Table D-106 for the number of subgroup cases. See Appendix B for definition of variables in table.
Percentage who used in last twelve months
Source: The Monitoring the Future Study, the University of Michigan.
’05–’06change
308

1991 1992 1993 1994 1995 1996 1997 1998 1999 2000 2001 2002 2003 2004 2005 2006Approx. N = 14,800 14,800 15,300 15,800 17,000 15,600 15,500 15,000 13,600 14,300 14,000 14,300 15,800 16,400 16,200 16,200
Total 2.1 1.7 1.8 2.4 3.0 3.5 4.1 4.0 4.4 3.8 3.0 3.4 2.8 3.3 3.0 2.9 -0.1Gender: Male 2.0 1.9 2.2 2.7 3.1 3.7 4.1 4.1 4.6 4.2 3.3 3.6 2.9 3.6 3.3 3.0 -0.3 Female 2.1 1.5 1.4 2.1 2.9 3.3 4.0 3.8 4.1 3.4 2.6 3.3 2.7 3.0 2.7 2.8 +0.1College Plans: None or under 4 years 4.4 3.3 4.5 5.9 6.3 8.4 9.0 9.3 10.5 8.3 8.2 8.7 7.3 8.3 8.1 8.3 +0.2 Complete 4 years 1.6 1.3 1.3 1.7 2.5 2.7 3.2 3.0 3.4 3.0 2.1 2.6 2.1 2.6 2.3 2.2 -0.1Region: Northeast 1.3 1.0 1.8 2.0 2.2 2.2 2.5 4.3 4.1 2.5 2.0 1.8 2.7 3.2 3.0 2.5 -0.5 North Central 1.6 1.3 1.3 1.8 2.5 3.4 3.4 3.1 3.9 4.0 3.0 3.2 2.3 3.0 3.0 2.8 -0.2 South 1.9 1.6 1.7 2.2 2.9 3.5 4.8 3.7 4.7 3.9 3.2 3.3 3.1 3.2 2.6 2.9 +0.3 West 3.4 3.1 3.2 4.3 4.8 5.2 5.3 5.2 4.6 4.6 3.9 5.5 3.2 4.1 3.6 3.5 -0.1Population Density: Large MSA 1.6 1.5 1.4 1.9 2.8 3.3 3.9 3.8 3.7 3.7 2.5 3.1 2.2 2.9 2.7 2.6 -0.1 Other MSA 2.6 2.0 2.0 2.7 3.1 3.9 3.8 4.0 4.5 3.7 3.2 3.7 2.8 3.4 3.1 3.0 -0.1 Non-MSA 1.4 1.4 1.9 2.5 3.1 3.2 4.9 4.2 4.8 4.0 3.2 3.3 4.1 3.6 3.3 3.4 0.0Parental Education:a
1.0-2.0 (Low) 3.1 2.7 2.7 3.1 5.0 6.1 5.5 6.7 7.6 6.3 4.8 7.1 6.4 5.7 4.5 5.6 +1.1 2.5-3.0 2.2 1.6 2.0 2.6 3.6 3.6 4.3 4.5 5.1 4.4 4.5 3.9 3.5 3.7 4.0 3.7 -0.3 3.5-4.0 2.2 2.0 2.2 2.7 3.3 3.8 4.6 4.0 4.2 4.0 2.5 3.2 2.9 3.7 3.0 2.8 -0.2 4.5-5.0 1.6 1.3 1.4 1.8 2.2 3.0 3.3 3.0 3.5 3.0 2.2 2.0 1.8 2.8 2.4 1.8 -0.6 5.5-6.0 (High) 1.8 1.3 0.9 1.6 1.7 2.8 2.9 2.5 3.5 2.7 1.4 2.7 1.2 1.6 2.1 2.8 +0.7Race (2-year average):b
White — 1.9 1.8 1.9 2.6 3.2 3.7 4.1 4.3 4.1 3.4 3.3 3.4 3.4 3.3 3.2 -0.2 Black — 0.5 0.5 0.9 0.8 0.6 0.6 0.9 0.8 0.5 0.5 0.7 0.7 0.7 0.8 0.9 +0.1 Hispanic — 3.4 3.4 4.6 5.2 6.1 7.5 7.0 6.8 7.1 5.6 5.0 5.2 5.1 5.4 5.0 -0.4
more stable estimates. For the data beginning in 2005, see the race/ethnicity note at the end of Appendix D.
Other Cocaine: Trends in Annual Prevalence of Use by Subgroups for Tenth Graders
Notes: Level of significance of difference between the two most recent classes: s = .05, ss = .01, sss = .001. ‘—’ indicates data not available.
Any apparent inconsistency between the change estimate and the prevalence-of-use estimates for the two most recent classes is due to rounding error.
See Table D-107 for the number of subgroup cases. See Appendix B for definition of variables in table.
Percentage who used in last twelve months’05–’06change
TABLE D-32
aParental education is an average score of mother’s education and father’s education. See Appendix B for details.bTo derive percentages for each racial subgroup, data for the specified year and the previous year have been combined to increase subgroup sample sizes and thus provide
Source: The Monitoring the Future Study, the University of Michigan.
309
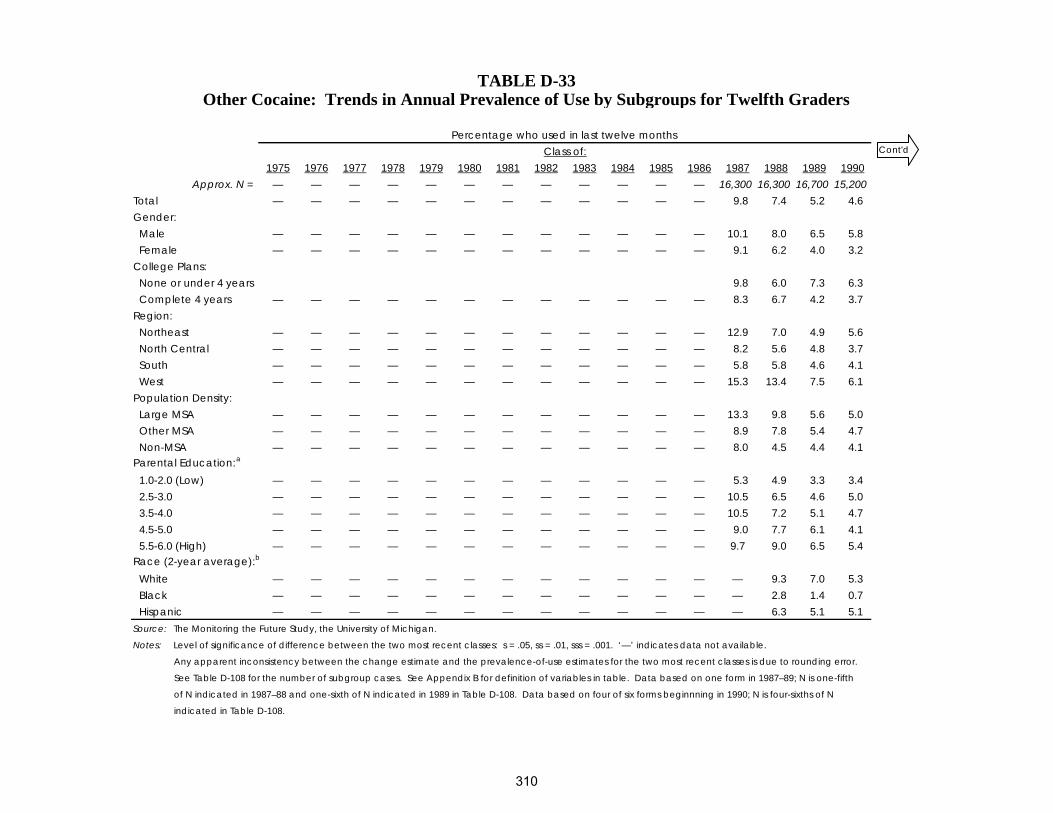
1975 1976 1977 1978 1979 1980 1981 1982 1983 1984 1985 1986 1987 1988 1989 1990Approx. N = — — — — — — — — — — — — 16,300 16,300 16,700 15,200
Total — — — — — — — — — — — — 9.8 7.4 5.2 4.6Gender: Male — — — — — — — — — — — — 10.1 8.0 6.5 5.8 Female — — — — — — — — — — — — 9.1 6.2 4.0 3.2College Plans: None or under 4 years 9.8 6.0 7.3 6.3 Complete 4 years — — — — — — — — — — — — 8.3 6.7 4.2 3.7Region: Northeast — — — — — — — — — — — — 12.9 7.0 4.9 5.6 North Central — — — — — — — — — — — — 8.2 5.6 4.8 3.7 South — — — — — — — — — — — — 5.8 5.8 4.6 4.1 West — — — — — — — — — — — — 15.3 13.4 7.5 6.1Population Density: Large MSA — — — — — — — — — — — — 13.3 9.8 5.6 5.0 Other MSA — — — — — — — — — — — — 8.9 7.8 5.4 4.7 Non-MSA — — — — — — — — — — — — 8.0 4.5 4.4 4.1Parental Education:a
1.0-2.0 (Low) — — — — — — — — — — — — 5.3 4.9 3.3 3.4 2.5-3.0 — — — — — — — — — — — — 10.5 6.5 4.6 5.0 3.5-4.0 — — — — — — — — — — — — 10.5 7.2 5.1 4.7 4.5-5.0 — — — — — — — — — — — — 9.0 7.7 6.1 4.1 5.5-6.0 (High) — — — — — — — — — — — — 9.7 9.0 6.5 5.4Race (2-year average):b
White — — — — — — — — — — — — — 9.3 7.0 5.3 Black — — — — — — — — — — — — — 2.8 1.4 0.7 Hispanic — — — — — — — — — — — — — 6.3 5.1 5.1
indicated in Table D-108.
TABLE D-33Other Cocaine: Trends in Annual Prevalence of Use by Subgroups for Twelfth Graders
Source: The Monitoring the Future Study, the University of Michigan.
Class of:Percentage who used in last twelve months
Notes: Level of significance of difference between the two most recent classes: s = .05, ss = .01, sss = .001. ‘—’ indicates data not available.
Any apparent inconsistency between the change estimate and the prevalence-of-use estimates for the two most recent classes is due to rounding error.
See Table D-108 for the number of subgroup cases. See Appendix B for definition of variables in table. Data based on one form in 1987–89; N is one-fifth
of N indicated in 1987–88 and one-sixth of N indicated in 1989 in Table D-108. Data based on four of six forms beginnning in 1990; N is four-sixths of N
Cont'd
310

1991 1992 1993 1994 1995 1996 1997 1998 1999 2000 2001 2002 2003 2004 2005 2006Approx. N = 15,000 15,800 16,300 15,400 15,400 14,300 15,400 15,200 13,600 12,800 12,800 12,900 14,600 14,600 14,700 14,200
Total 3.2 2.6 2.9 3.0 3.4 4.2 5.0 4.9 5.8 4.5 4.4 4.4 4.2 4.7 4.5 5.2 +0.7Gender: Male 3.7 3.1 3.7 3.7 4.0 4.9 5.7 5.6 7.1 5.5 4.9 5.0 5.4 5.8 5.4 5.7 +0.4 Female 2.4 2.0 2.0 2.3 2.5 3.2 4.0 3.9 4.2 3.4 3.7 3.7 2.9 3.5 3.6 4.4 +0.8College Plans: None or under 4 years 4.0 4.0 3.9 4.3 4.5 5.7 7.0 8.9 7.6 6.7 7.4 7.1 4.8 6.8 6.7 6.9 +0.2 Complete 4 years 2.8 2.0 2.5 2.5 2.9 3.5 4.1 3.5 5.2 3.7 3.4 3.4 3.8 3.9 3.9 4.7 +0.8Region: Northeast 3.4 2.8 2.3 2.8 4.2 5.2 5.9 4.7 4.1 3.7 4.4 4.3 5.3 4.4 4.3 6.2 +1.9 North Central 2.9 2.2 2.3 3.5 2.7 3.2 4.1 5.3 5.7 4.5 5.6 4.8 3.2 3.9 4.2 3.6 -0.6 South 2.8 2.5 2.6 2.6 3.1 4.2 4.6 4.9 6.6 4.0 3.9 4.4 4.1 4.9 4.7 5.8 +1.0 West 3.9 3.1 4.6 3.5 4.0 4.5 6.2 4.4 6.1 5.9 3.5 3.9 4.7 5.8 4.7 5.1 +0.5Population Density: Large MSA 3.7 3.1 2.6 2.6 3.7 3.9 4.2 4.8 4.8 3.7 4.1 3.5 3.0 3.9 4.6 7.2 +2.6 s Other MSA 3.3 2.5 3.6 3.5 3.3 4.4 5.2 4.9 6.0 4.5 4.3 4.7 5.3 5.4 4.7 4.4 -0.3 Non-MSA 2.5 2.3 2.0 2.6 3.1 4.2 5.6 4.9 6.7 5.4 5.0 4.9 3.9 4.2 4.0 3.8 -0.3Parental Education:a
1.0-2.0 (Low) 3.5 3.7 3.9 2.7 2.9 5.2 6.4 5.5 7.4 5.4 3.7 5.1 4.1 6.3 4.1 4.6 +0.4 2.5-3.0 3.5 2.3 2.3 3.2 3.4 3.8 4.9 5.3 5.0 3.8 5.6 4.7 3.4 3.6 5.5 5.5 0.0 3.5-4.0 3.2 2.6 3.3 3.4 3.6 4.6 4.9 5.3 6.9 4.7 4.7 4.9 4.6 5.1 4.7 5.2 +0.5 4.5-5.0 2.7 2.3 2.9 2.6 3.2 3.9 4.4 4.2 5.5 4.5 3.9 3.4 4.3 5.1 4.2 4.6 +0.4 5.5-6.0 (High) 2.4 2.0 1.7 3.1 2.7 3.8 4.8 3.5 3.6 4.2 2.2 3.9 3.8 3.7 3.7 5.9 +2.2Race (2-year average):b
White 4.2 2.9 2.6 2.9 3.3 3.9 5.0 5.6 6.0 5.7 5.0 5.1 4.9 4.8 4.9 5.2 +0.3 Black 1.0 1.0 0.7 0.8 0.8 0.7 0.7 0.6 0.8 1.0 0.9 0.8 1.0 1.1 1.2 1.4 +0.2 Hispanic 5.0 4.3 5.1 5.1 4.0 5.6 6.9 6.0 5.8 6.6 5.8 4.7 3.9 4.8 5.8 5.7 -0.1
Percentage who used in last twelve monthsClass of:
more stable estimates. For the data beginning in 2005, see the race/ethnicity note at the end of Appendix D.
TABLE D-33 (cont'd)Other Cocaine: Trends in Annual Prevalence of Use by Subgroups for Twelfth Graders
’05–’06change
aParental education is an average score of mother’s education and father’s education. See Appendix B for details.bTo derive percentages for each racial subgroup, data for the specified year and the previous year have been combined to increase subgroup sample sizes and thus provide
311

1991 1992 1993 1994 1995a 1996a 1997a 1998a 1999a 2000a 2001a 2002a 2003a 2004a 2005a 2006a
Approx. N = 17,500 18,600 18,300 17,300 17,500 17,800 18,600 18,100 16,700 16,700 16,200 15,100 16,500 17,000 16,800 16,500Total 0.7 0.7 0.7 1.2 1.4 1.6 1.3 1.3 1.4 1.1 1.0 0.9 0.9 1.0 0.8 0.8 0.0Gender: Male 0.9 0.8 0.8 1.3 1.6 1.5 1.4 1.5 1.4 1.0 1.0 0.8 0.8 0.9 0.8 0.6 -0.1 Female 0.5 0.7 0.5 0.9 1.2 1.5 1.1 1.1 1.3 1.2 1.0 1.0 0.9 1.0 0.8 0.9 0.0College Plans: None or under 4 years 2.1 2.7 2.0 3.9 4.4 4.1 3.4 5.0 3.7 3.5 3.1 2.9 3.1 4.2 2.3 3.0 +0.6 Complete 4 years 0.4 0.4 0.5 0.7 1.0 1.1 1.1 0.9 1.1 0.8 0.8 0.7 0.6 0.6 0.6 0.6 -0.1Region: Northeast 0.5 0.6 0.7 1.3 1.4 1.8 1.1 1.1 1.3 1.1 1.1 0.8 0.7 1.1 0.7 0.4 -0.2 North Central 0.4 0.8 0.5 1.1 1.4 1.6 1.4 1.3 1.6 1.4 1.0 1.0 1.0 0.8 0.5 0.7 +0.2 South 0.8 0.7 0.7 1.1 1.5 1.4 1.2 1.4 1.4 0.7 1.2 1.0 1.0 0.9 1.0 0.9 -0.1 West 1.0 0.7 1.1 1.1 1.2 1.6 1.4 1.3 1.2 1.4 0.7 1.0 0.9 1.2 0.8 0.9 +0.1Population Density: Large MSA 0.5 0.7 0.7 1.2 1.2 1.4 1.0 1.0 1.3 1.0 0.9 0.7 0.8 1.2 0.6 0.7 0.0 Other MSA 0.7 0.8 0.9 1.2 1.5 1.7 1.3 1.3 1.4 1.1 1.0 1.0 0.9 1.0 0.8 0.9 0.0 Non-MSA 0.8 0.7 0.4 1.0 1.5 1.5 1.5 1.6 1.5 1.0 1.1 1.1 1.2 0.6 1.0 0.8 -0.2Parental Education:b
1.0-2.0 (Low) 1.5 1.4 0.8 2.0 2.6 2.0 2.3 3.5 2.8 1.7 2.6 1.2 2.1 1.9 0.5 1.8 +1.3 ss 2.5-3.0 0.9 0.7 0.6 1.1 1.0 1.7 1.4 1.2 1.4 1.5 1.1 1.3 1.0 1.1 1.3 0.8 -0.5 3.5-4.0 0.6 0.6 0.7 1.3 1.6 1.7 1.0 1.1 1.2 0.7 1.0 0.9 0.8 1.0 1.0 0.8 -0.2 4.5-5.0 0.4 0.5 0.8 0.8 1.2 1.4 1.1 1.1 1.1 0.8 0.6 0.8 0.6 0.7 0.5 0.6 +0.1 5.5-6.0 (High) 0.5 0.8 0.6 1.3 1.6 1.0 1.5 1.4 1.8 1.0 0.8 0.6 0.7 0.6 0.4 0.4 0.0Race (2-year average):c
White — 0.6 0.6 0.8 1.2 1.6 1.6 1.3 1.2 1.2 1.0 1.0 0.9 0.9 0.8 0.7 -0.1 Black — 0.4 0.3 0.6 0.7 0.5 0.4 0.5 0.7 0.5 0.6 0.6 0.5 0.7 0.5 0.4 -0.1 Hispanic — 1.4 1.4 1.5 1.8 2.1 1.7 1.7 2.2 2.0 1.4 1.2 1.4 1.7 1.5 1.1 -0.4
cTo derive percentages for each racial subgroup, data for the specified year and the previous year have been combined to increase subgroup sample sizes and thus provide
more stable estimates. For the data beginning in 2005, see the race/ethnicity note at the end of Appendix D.
Heroin: Trends in Annual Prevalence of Use by Subgroups for Eighth Graders
Notes: Level of significance of difference between the two most recent classes: s = .05, ss = .01, sss = .001. ‘—’ indicates data not available.
Any apparent inconsistency between the change estimate and the prevalence-of-use estimates for the two most recent classes is due to rounding error.
See Table D-106 for the number of subgroup cases. See Appendix B for definition of variables in table.
Percentage who used in last twelve months’05–’06change
bParental education is an average score of mother’s education and father’s education. See Appendix B for details.
TABLE D-34
aIn 1995, the heroin question was changed in half of the forms. Separate questions were asked for use with injection and without injection. In 1996, the remaining forms were
also changed. Data presented here represent the combined data from all forms.
Source: The Monitoring the Future Study, the University of Michigan.
312

1991 1992 1993 1994 1995a 1996a 1997a 1998a 1999a 2000a 2001a 2002a 2003a 2004a 2005a 2006a
Approx. N = 14,800 14,800 15,300 15,800 17,000 15,600 15,500 15,000 13,600 14,300 14,000 14,300 15,800 16,400 16,200 16,200Total 0.5 0.6 0.7 0.9 1.1 1.2 1.4 1.4 1.4 1.4 0.9 1.1 0.7 0.9 0.9 0.9 -0.1Gender: Male 0.7 0.8 0.9 1.0 1.3 1.5 1.6 1.7 1.7 1.5 1.0 1.3 0.8 1.0 1.1 0.9 -0.2 Female 0.4 0.4 0.4 0.8 0.8 0.9 1.3 1.1 1.2 1.2 0.8 0.8 0.7 0.7 0.8 0.8 +0.1College Plans: None or under 4 years 1.4 1.4 1.9 2.0 2.2 2.4 2.9 2.7 3.4 3.8 2.5 2.7 2.0 2.8 3.2 2.7 -0.4 Complete 4 years 0.3 0.4 0.4 0.7 0.9 1.0 1.2 1.2 1.1 1.0 0.7 0.8 0.5 0.6 0.6 0.6 0.0Region: Northeast 0.4 0.6 0.6 0.6 0.9 0.9 1.3 1.8 1.9 1.5 1.0 0.9 0.6 1.1 1.3 0.9 -0.3 North Central 0.6 0.6 0.8 0.9 1.0 1.5 1.5 1.4 1.3 1.6 1.1 1.2 0.7 0.7 1.0 0.9 -0.1 South 0.6 0.5 0.6 1.0 1.3 1.4 1.5 1.3 1.4 1.5 0.9 0.8 0.9 1.0 0.8 0.9 +0.2 West 0.4 0.8 0.5 1.2 1.0 1.0 1.3 1.1 1.1 0.7 0.7 1.4 0.7 0.8 0.8 0.7 -0.1Population Density: Large MSA 0.6 0.6 0.7 0.8 1.0 1.1 1.6 1.2 1.2 1.8 0.9 0.9 0.6 0.9 0.8 0.7 -0.2 Other MSA 0.5 0.6 0.6 0.9 1.0 1.3 1.3 1.5 1.4 1.2 1.0 1.0 0.8 0.9 1.0 0.9 -0.1 Non-MSA 0.4 0.6 0.7 1.0 1.3 1.2 1.6 1.5 1.6 1.2 0.9 1.4 0.9 0.7 0.9 1.0 +0.1Parental Education:b
1.0-2.0 (Low) 0.4 0.5 1.2 1.3 1.8 1.0 1.3 1.7 2.4 1.3 1.1 2.0 1.1 1.5 1.7 1.4 -0.3 2.5-3.0 0.8 0.7 0.7 0.8 1.0 1.2 1.3 1.2 1.5 1.7 1.3 0.8 0.8 1.0 1.2 0.9 -0.3 3.5-4.0 0.5 0.6 0.8 0.9 1.2 1.3 1.6 1.6 1.2 1.5 0.6 1.1 0.7 0.8 0.8 0.6 -0.2 4.5-5.0 0.4 0.5 0.3 0.9 0.9 1.1 1.5 1.3 1.4 1.3 0.8 0.7 0.6 0.7 0.8 0.7 -0.2 5.5-6.0 (High) 0.4 0.5 0.8 0.9 0.9 1.5 1.1 1.3 1.2 1.1 0.9 1.6 0.3 0.5 0.6 1.2 +0.6 sRace (2-year average):c
White — 0.6 0.7 0.8 1.0 1.2 1.4 1.4 1.5 1.5 1.2 1.0 0.9 0.8 0.9 1.0 0.0 Black — 0.3 0.4 0.6 0.6 0.2 0.2 0.4 0.5 0.5 0.5 0.3 0.3 0.4 0.6 0.6 0.0 Hispanic — 0.7 0.7 0.7 1.0 1.0 1.3 1.6 1.7 1.4 1.4 1.1 1.1 1.2 1.2 1.2 -0.1
cTo derive percentages for each racial subgroup, data for the specified year and the previous year have been combined to increase subgroup sample sizes and thus provide
more stable estimates. For the data beginning in 2005, see the race/ethnicity note at the end of Appendix D.
Heroin: Trends in Annual Prevalence of Use by Subgroups for Tenth Graders
Notes: Level of significance of difference between the two most recent classes: s = .05, ss = .01, sss = .001. ‘—’ indicates data not available.
Any apparent inconsistency between the change estimate and the prevalence-of-use estimates for the two most recent classes is due to rounding error.
See Table D-107 for the number of subgroup cases. See Appendix B for definition of variables in table.
Percentage who used in last twelve months’05–’06change
bParental education is an average score of mother’s education and father’s education. See Appendix B for details.
TABLE D-35
aIn 1995, the heroin question was changed in half of the forms. Separate questions were asked for use with injection and without injection. In 1996, the remaining forms were
also changed. Data presented here represent the combined data from all forms.
Source: The Monitoring the Future Study, the University of Michigan.
313

1975 1976 1977 1978 1979 1980 1981 1982 1983 1984 1985 1986 1987 1988 1989 1990Approx. N = 9,400 15,400 17,100 17,800 15,500 15,900 17,500 17,700 16,300 15,900 16,000 15,200 16,300 16,300 16,700 15,200
Total 1.0 0.8 0.8 0.8 0.5 0.5 0.5 0.6 0.6 0.5 0.6 0.5 0.5 0.5 0.6 0.5Gender: Male 1.2 1.0 1.2 1.1 0.6 0.6 0.6 0.8 0.7 0.7 0.8 0.7 0.7 0.7 0.9 0.6 Female 0.8 0.5 0.4 0.6 0.3 0.4 0.3 0.4 0.4 0.3 0.3 0.2 0.3 0.3 0.4 0.3College Plans: None or under 4 years — 0.9 1.1 1.0 0.7 0.6 0.5 0.7 0.9 0.6 0.7 0.8 0.5 0.8 0.9 0.6 Complete 4 years — 0.6 0.5 0.6 0.3 0.3 0.5 0.4 0.3 0.4 0.5 0.4 0.4 0.3 0.5 0.4Region: Northeast 1.1 0.7 0.7 0.6 0.6 0.5 0.5 0.9 0.6 0.6 0.8 0.7 0.6 0.5 0.9 0.8 North Central 1.3 1.0 1.0 0.8 0.5 0.7 0.6 0.5 0.4 0.6 0.6 0.4 0.6 0.3 0.6 0.3 South 0.9 0.7 0.9 1.1 0.6 0.3 0.5 0.5 0.7 0.5 0.6 0.5 0.4 0.5 0.6 0.5 West 0.7 0.6 0.5 0.8 0.2 0.4 0.5 0.3 0.5 0.4 0.3 0.5 0.5 0.7 0.7 0.3Population Density: Large MSA 1.3 1.0 0.5 0.7 0.4 0.3 0.3 0.7 0.6 0.6 0.7 0.7 0.3 0.4 0.5 0.4 Other MSA 0.9 1.0 0.8 0.8 0.6 0.5 0.5 0.4 0.4 0.4 0.7 0.4 0.6 0.5 0.7 0.5 Non-MSA 1.0 0.4 1.1 1.0 0.5 0.6 0.7 0.6 0.7 0.7 0.4 0.5 0.5 0.5 0.8 0.5Parental Education:b
1.0-2.0 (Low) 1.2 0.8 0.8 0.8 0.6 0.6 0.4 0.4 0.5 0.6 0.8 0.9 0.5 0.5 0.9 0.8 2.5-3.0 0.8 0.9 0.8 0.9 0.5 0.6 0.6 0.7 0.6 0.5 0.5 0.4 0.4 0.7 0.7 0.4 3.5-4.0 0.6 0.8 0.9 0.7 0.4 0.4 0.5 0.3 0.5 0.5 0.5 0.5 0.6 0.4 0.6 0.4 4.5-5.0 1.2 1.4 0.6 0.9 0.6 0.4 0.3 0.6 0.4 0.4 0.7 0.3 0.3 0.3 0.6 0.4 5.5-6.0 (High) 1.2 0.6 1.1 1.0 0.8 0.4 0.7 1.1 0.8 0.5 0.6 0.5 0.7 0.4 0.4 0.5Race (2-year average):c
White — — 0.8 0.8 0.6 0.5 0.4 0.5 0.5 0.5 0.5 0.5 0.4 0.4 0.5 0.6 Black — — 0.6 0.6 0.5 0.5 0.6 0.7 0.6 0.4 0.5 0.5 0.5 0.7 0.6 0.3 Hispanic — — 1.2 2.0 1.7 0.4 0.3 0.4 0.6 1.1 1.0 0.9 0.9 0.5 0.5 0.6
See Table D-108 for the number of subgroup cases. See Appendix B for definition of variables in table.
TABLE D-36Heroin: Trends in Annual Prevalence of Use by Subgroups for Twelfth Graders
Notes: Level of significance of difference between the two most recent classes: s = .05, ss = .01, sss = .001. ‘—’ indicates data not available.
Any apparent inconsistency between the change estimate and the prevalence-of-use estimates for the two most recent classes is due to rounding error.
Percentage who used in last twelve monthsClass of:
Source: The Monitoring the Future Study, the University of Michigan.
Cont'd
314

1991 1992 1993 1994 1995a 1996a 1997a 1998a 1999a 2000a 2001a 2002a 2003a 2004a 2005a 2006a
Approx. N = 15,000 15,800 16,300 15,400 15,400 14,300 15,400 15,200 13,600 12,800 12,800 12,900 14,600 14,600 14,700 14,200Total 0.4 0.6 0.5 0.6 1.1 1.0 1.2 1.0 1.1 1.5 0.9 1.0 0.8 0.9 0.8 0.8 -0.1Gender: Male 0.6 0.8 0.7 0.8 1.4 1.3 1.5 1.4 1.4 1.7 1.3 1.1 0.8 1.2 1.2 1.0 -0.2 Female 0.3 0.3 0.3 0.4 0.8 0.7 0.9 0.7 0.8 1.2 0.6 0.8 0.5 0.4 0.5 0.4 -0.1College Plans: None or under 4 years 0.5 0.9 1.0 1.1 1.5 1.8 1.8 1.7 1.3 2.2 1.3 2.3 0.9 1.6 1.8 1.3 -0.5 Complete 4 years 0.4 0.5 0.4 0.5 0.9 0.8 1.0 0.8 1.0 1.1 0.7 0.7 0.6 0.6 0.6 0.6 -0.1Region: Northeast 0.2 0.5 0.9 0.7 1.0 1.6 1.7 1.3 1.2 1.0 1.2 1.2 0.8 0.9 1.0 1.1 +0.1 North Central 0.8 0.6 0.5 0.9 0.7 0.7 0.9 1.0 0.9 1.4 1.3 1.0 0.6 0.6 0.8 0.4 -0.4 South 0.4 0.6 0.4 0.6 1.4 1.0 1.1 1.1 1.3 1.6 0.6 1.2 1.0 1.0 0.9 0.8 0.0 West 0.3 0.8 0.5 0.4 1.0 0.9 1.2 0.6 0.9 1.8 0.8 0.5 0.5 0.9 0.7 0.7 0.0Population Density: Large MSA 0.4 0.4 0.6 0.4 1.4 1.1 1.1 0.9 0.8 1.9 1.1 1.0 0.7 0.8 0.8 1.0 +0.3 Other MSA 0.4 0.7 0.5 0.8 0.9 1.1 1.3 1.3 1.3 1.3 0.8 1.0 0.8 1.0 0.9 0.6 -0.3 Non-MSA 0.6 0.7 0.5 0.5 1.0 0.9 1.0 0.6 1.0 1.3 0.9 1.1 0.9 0.6 0.8 0.6 -0.3Parental Education:b
1.0-2.0 (Low) 0.5 0.7 0.3 0.9 1.8 1.1 2.1 1.2 2.3 2.3 1.3 2.1 1.1 1.4 1.0 1.2 +0.2 2.5-3.0 0.4 0.6 0.4 0.8 1.1 0.9 1.0 1.0 0.9 1.6 0.5 1.0 0.7 0.9 1.2 0.9 -0.3 3.5-4.0 0.4 0.6 0.6 0.4 0.9 1.1 1.2 1.2 1.0 1.3 1.0 0.9 0.8 0.7 0.8 0.7 -0.1 4.5-5.0 0.6 0.7 0.7 0.3 1.1 1.0 1.1 1.0 1.1 1.5 1.0 0.7 0.6 0.9 0.5 0.5 -0.1 5.5-6.0 (High) 0.5 0.3 0.4 0.9 1.0 0.8 1.1 0.7 1.1 1.1 0.8 1.0 0.6 0.6 0.8 0.7 -0.1Race (2-year average):c
White 0.5 0.5 0.5 0.5 0.8 1.0 1.2 1.2 1.1 1.3 1.3 1.0 0.8 0.7 0.7 0.7 0.0 Black 0.2 0.5 0.4 0.3 0.4 0.5 0.5 0.4 0.3 0.5 0.4 0.5 0.7 0.7 0.8 0.7 -0.1 Hispanic 0.6 0.9 0.7 0.5 1.2 1.5 1.1 0.8 1.0 2.0 1.6 0.8 0.8 1.0 1.3 1.2 -0.1
change
TABLE D-36 (cont'd)Heroin: Trends in Annual Prevalence of Use by Subgroups for Twelfth Graders
aIn 1995, the heroin question was changed in half of the forms. Separate questions were asked for use with injection and without injection. Data presented here represent the
’05–’06Class of:Percentage who used in last twelve months
combined data from all forms.bParental education is an average score of mother’s education and father’s education. See Appendix B for details.cTo derive percentages for each racial subgroup, data for the specified year and the previous year have been combined to increase subgroup sample sizes and thus provide
more stable estimates. For the data beginning in 2005, see the race/ethnicity note at the end of Appendix D.
315
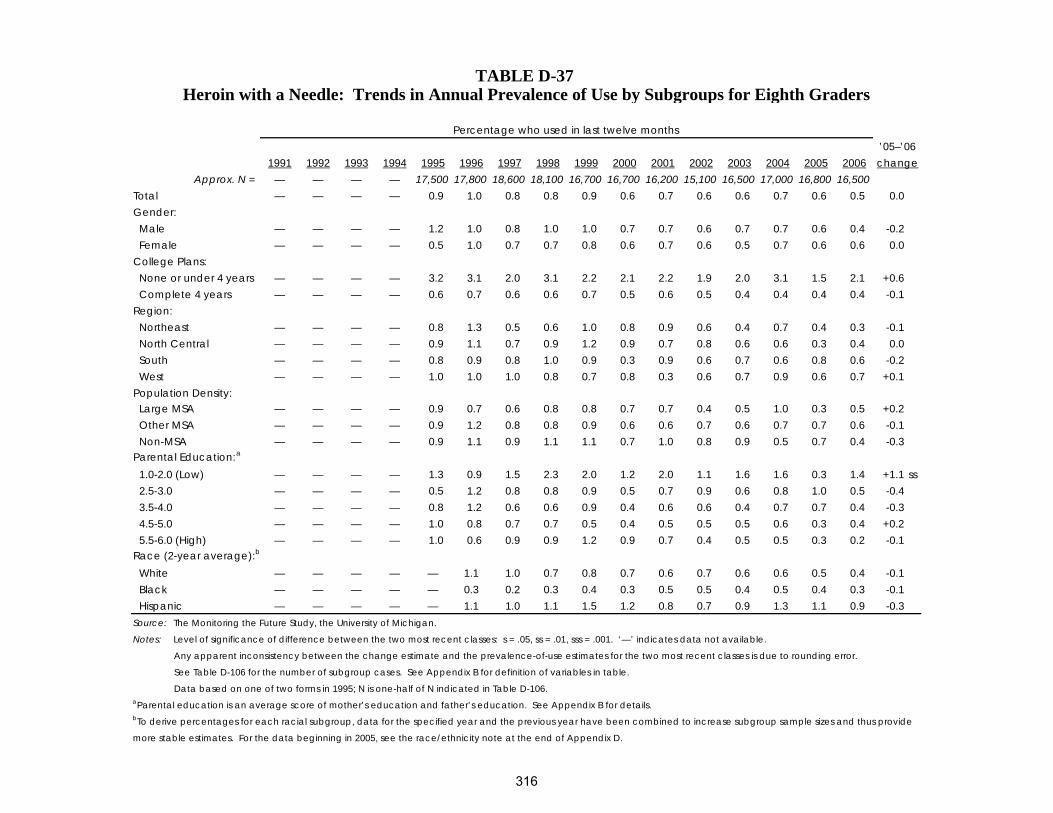
1991 1992 1993 1994 1995 1996 1997 1998 1999 2000 2001 2002 2003 2004 2005 2006Approx. N = — — — — 17,500 17,800 18,600 18,100 16,700 16,700 16,200 15,100 16,500 17,000 16,800 16,500
Total — — — — 0.9 1.0 0.8 0.8 0.9 0.6 0.7 0.6 0.6 0.7 0.6 0.5 0.0Gender: Male — — — — 1.2 1.0 0.8 1.0 1.0 0.7 0.7 0.6 0.7 0.7 0.6 0.4 -0.2 Female — — — — 0.5 1.0 0.7 0.7 0.8 0.6 0.7 0.6 0.5 0.7 0.6 0.6 0.0College Plans: None or under 4 years — — — — 3.2 3.1 2.0 3.1 2.2 2.1 2.2 1.9 2.0 3.1 1.5 2.1 +0.6 Complete 4 years — — — — 0.6 0.7 0.6 0.6 0.7 0.5 0.6 0.5 0.4 0.4 0.4 0.4 -0.1Region: Northeast — — — — 0.8 1.3 0.5 0.6 1.0 0.8 0.9 0.6 0.4 0.7 0.4 0.3 -0.1 North Central — — — — 0.9 1.1 0.7 0.9 1.2 0.9 0.7 0.8 0.6 0.6 0.3 0.4 0.0 South — — — — 0.8 0.9 0.8 1.0 0.9 0.3 0.9 0.6 0.7 0.6 0.8 0.6 -0.2 West — — — — 1.0 1.0 1.0 0.8 0.7 0.8 0.3 0.6 0.7 0.9 0.6 0.7 +0.1Population Density: Large MSA — — — — 0.9 0.7 0.6 0.8 0.8 0.7 0.7 0.4 0.5 1.0 0.3 0.5 +0.2 Other MSA — — — — 0.9 1.2 0.8 0.8 0.9 0.6 0.6 0.7 0.6 0.7 0.7 0.6 -0.1 Non-MSA — — — — 0.9 1.1 0.9 1.1 1.1 0.7 1.0 0.8 0.9 0.5 0.7 0.4 -0.3Parental Education:a
1.0-2.0 (Low) — — — — 1.3 0.9 1.5 2.3 2.0 1.2 2.0 1.1 1.6 1.6 0.3 1.4 +1.1 ss 2.5-3.0 — — — — 0.5 1.2 0.8 0.8 0.9 0.5 0.7 0.9 0.6 0.8 1.0 0.5 -0.4 3.5-4.0 — — — — 0.8 1.2 0.6 0.6 0.9 0.4 0.6 0.6 0.4 0.7 0.7 0.4 -0.3 4.5-5.0 — — — — 1.0 0.8 0.7 0.7 0.5 0.4 0.5 0.5 0.5 0.6 0.3 0.4 +0.2 5.5-6.0 (High) — — — — 1.0 0.6 0.9 0.9 1.2 0.9 0.7 0.4 0.5 0.5 0.3 0.2 -0.1Race (2-year average):b
White — — — — — 1.1 1.0 0.7 0.8 0.7 0.6 0.7 0.6 0.6 0.5 0.4 -0.1 Black — — — — — 0.3 0.2 0.3 0.4 0.3 0.5 0.5 0.4 0.5 0.4 0.3 -0.1 Hispanic — — — — — 1.1 1.0 1.1 1.5 1.2 0.8 0.7 0.9 1.3 1.1 0.9 -0.3
Percentage who used in last twelve months’05–’06change
Source: The Monitoring the Future Study, the University of Michigan.
bTo derive percentages for each racial subgroup, data for the specified year and the previous year have been combined to increase subgroup sample sizes and thus provide
more stable estimates. For the data beginning in 2005, see the race/ethnicity note at the end of Appendix D.
TABLE D-37
Data based on one of two forms in 1995; N is one-half of N indicated in Table D-106.aParental education is an average score of mother’s education and father’s education. See Appendix B for details.
Heroin with a Needle: Trends in Annual Prevalence of Use by Subgroups for Eighth Graders
Notes: Level of significance of difference between the two most recent classes: s = .05, ss = .01, sss = .001. ‘—’ indicates data not available.
Any apparent inconsistency between the change estimate and the prevalence-of-use estimates for the two most recent classes is due to rounding error.
See Table D-106 for the number of subgroup cases. See Appendix B for definition of variables in table.
316

1991 1992 1993 1994 1995 1996 1997 1998 1999 2000 2001 2002 2003 2004 2005 2006Approx. N = — — — — 17,000 15,600 15,500 15,000 13,600 14,300 14,000 14,300 15,800 16,400 16,200 16,200
Total — — — — 0.6 0.7 0.7 0.8 0.6 0.5 0.4 0.6 0.5 0.5 0.5 0.5 0.0Gender: Male — — — — 0.8 0.8 0.9 1.0 0.8 0.6 0.5 0.6 0.5 0.6 0.6 0.6 0.0 Female — — — — 0.4 0.4 0.5 0.5 0.5 0.4 0.3 0.4 0.4 0.3 0.4 0.4 +0.1College Plans: None or under 4 years — — — — 1.6 1.4 1.5 1.6 1.7 1.7 1.4 1.5 1.4 1.6 1.6 1.3 -0.3 Complete 4 years — — — — 0.4 0.5 0.6 0.6 0.5 0.3 0.3 0.4 0.3 0.3 0.3 0.4 +0.1Region: Northeast — — — — 0.5 0.3 0.6 0.8 0.7 0.5 0.5 0.4 0.4 0.5 0.6 0.6 0.0 North Central — — — — 0.6 1.0 0.8 0.9 0.7 0.5 0.5 0.6 0.5 0.4 0.5 0.5 0.0 South — — — — 0.6 0.7 0.8 0.8 0.6 0.6 0.3 0.5 0.5 0.5 0.4 0.6 +0.3 West — — — — 0.5 0.5 0.6 0.6 0.6 0.4 0.5 0.8 0.5 0.5 0.6 0.3 -0.2Population Density: Large MSA — — — — 0.5 0.5 0.6 0.7 0.6 0.6 0.4 0.5 0.4 0.5 0.4 0.4 0.0 Other MSA — — — — 0.5 0.7 0.6 0.7 0.5 0.4 0.5 0.4 0.4 0.5 0.6 0.5 0.0 Non-MSA — — — — 0.8 0.8 1.1 1.0 1.0 0.6 0.4 1.0 0.6 0.3 0.5 0.7 +0.2Parental Education:a
1.0-2.0 (Low) — — — — 1.6 0.6 0.7 1.3 1.2 1.0 0.5 1.2 0.8 1.0 1.4 1.0 -0.4 2.5-3.0 — — — — 0.5 0.8 0.6 0.6 0.7 0.8 0.7 0.3 0.4 0.5 0.6 0.5 -0.1 3.5-4.0 — — — — 0.7 0.7 0.9 0.9 0.6 0.5 0.2 0.6 0.5 0.4 0.4 0.4 0.0 4.5-5.0 — — — — 0.4 0.5 0.7 0.6 0.6 0.3 0.3 0.3 0.5 0.3 0.4 0.3 -0.1 5.5-6.0 (High) — — — — 0.3 0.6 0.7 0.8 0.6 0.3 0.5 1.1 0.2 0.3 0.3 1.0 +0.7 sRace (2-year average):b
White — — — — — 0.6 0.7 0.7 0.6 0.5 0.4 0.5 0.5 0.4 0.4 0.5 +0.1 Black — — — — — 0.1 0.1 0.3 0.3 0.3 0.3 0.2 0.1 0.2 0.5 0.4 0.0 Hispanic — — — — — 0.6 0.6 0.8 1.0 0.9 0.9 0.7 0.7 0.8 0.8 0.8 0.0
TABLE D-38 Heroin with a Needle: Trends in Annual Prevalence of Use by Subgroups for Tenth Graders
Notes: Level of significance of difference between the two most recent classes: s = .05, ss = .01, sss = .001. ‘—’ indicates data not available.
Any apparent inconsistency between the change estimate and the prevalence-of-use estimates for the two most recent classes is due to rounding error.
Source: The Monitoring the Future Study, the University of Michigan.
Percentage who used in last twelve months’05–’06change
aParental education is an average score of mother’s education and father’s education. See Appendix B for details.bTo derive percentages for each racial subgroup, data for the specified year and the previous year have been combined to increase subgroup sample sizes and thus provide
more stable estimates. For the data beginning in 2005, see the race/ethnicity note at the end of Appendix D.
See Table D-107 for the number of subgroup cases. See Appendix B for definition of variables in table.
Data based on one of two forms in 1995; N is one-half of N indicated in Table D-107.
317
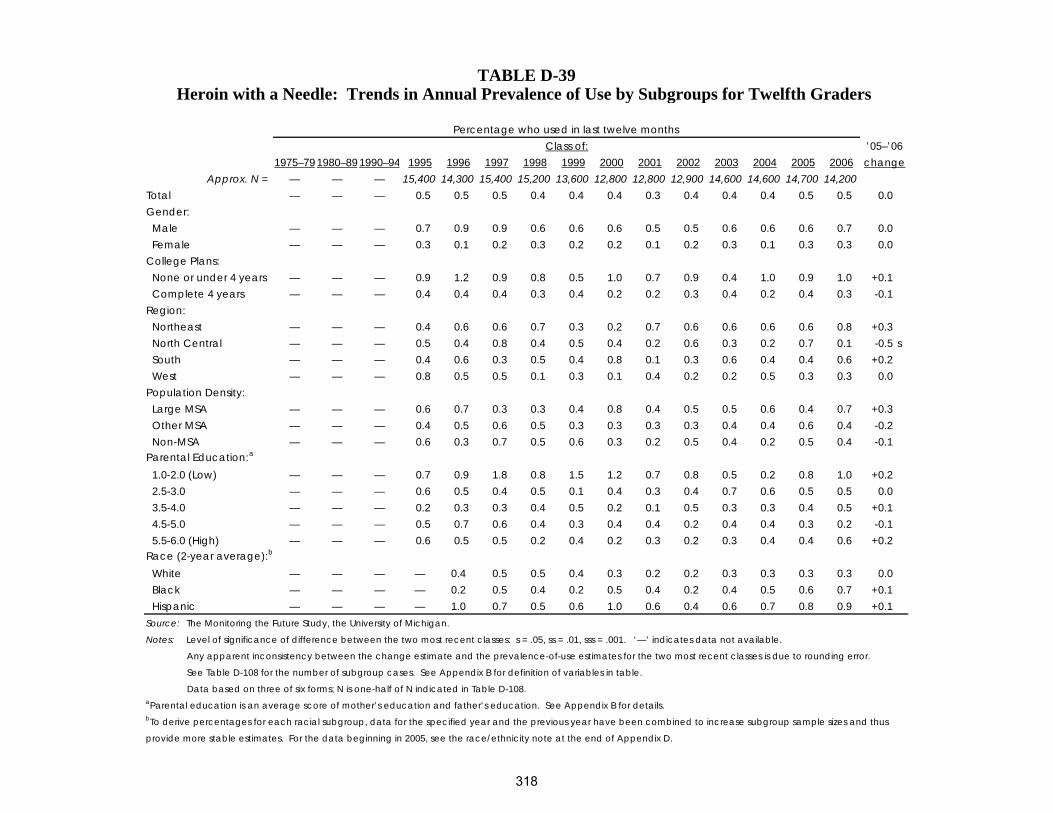
1975–79 1980–89 1990–94 1995 1996 1997 1998 1999 2000 2001 2002 2003 2004 2005 2006Approx. N = — — — 15,400 14,300 15,400 15,200 13,600 12,800 12,800 12,900 14,600 14,600 14,700 14,200
Total — — — 0.5 0.5 0.5 0.4 0.4 0.4 0.3 0.4 0.4 0.4 0.5 0.5 0.0Gender: Male — — — 0.7 0.9 0.9 0.6 0.6 0.6 0.5 0.5 0.6 0.6 0.6 0.7 0.0 Female — — — 0.3 0.1 0.2 0.3 0.2 0.2 0.1 0.2 0.3 0.1 0.3 0.3 0.0College Plans: None or under 4 years — — — 0.9 1.2 0.9 0.8 0.5 1.0 0.7 0.9 0.4 1.0 0.9 1.0 +0.1 Complete 4 years — — — 0.4 0.4 0.4 0.3 0.4 0.2 0.2 0.3 0.4 0.2 0.4 0.3 -0.1Region: Northeast — — — 0.4 0.6 0.6 0.7 0.3 0.2 0.7 0.6 0.6 0.6 0.6 0.8 +0.3 North Central — — — 0.5 0.4 0.8 0.4 0.5 0.4 0.2 0.6 0.3 0.2 0.7 0.1 -0.5 s South — — — 0.4 0.6 0.3 0.5 0.4 0.8 0.1 0.3 0.6 0.4 0.4 0.6 +0.2 West — — — 0.8 0.5 0.5 0.1 0.3 0.1 0.4 0.2 0.2 0.5 0.3 0.3 0.0Population Density: Large MSA — — — 0.6 0.7 0.3 0.3 0.4 0.8 0.4 0.5 0.5 0.6 0.4 0.7 +0.3 Other MSA — — — 0.4 0.5 0.6 0.5 0.3 0.3 0.3 0.3 0.4 0.4 0.6 0.4 -0.2 Non-MSA — — — 0.6 0.3 0.7 0.5 0.6 0.3 0.2 0.5 0.4 0.2 0.5 0.4 -0.1Parental Education:a
1.0-2.0 (Low) — — — 0.7 0.9 1.8 0.8 1.5 1.2 0.7 0.8 0.5 0.2 0.8 1.0 +0.2 2.5-3.0 — — — 0.6 0.5 0.4 0.5 0.1 0.4 0.3 0.4 0.7 0.6 0.5 0.5 0.0 3.5-4.0 — — — 0.2 0.3 0.3 0.4 0.5 0.2 0.1 0.5 0.3 0.3 0.4 0.5 +0.1 4.5-5.0 — — — 0.5 0.7 0.6 0.4 0.3 0.4 0.4 0.2 0.4 0.4 0.3 0.2 -0.1 5.5-6.0 (High) — — — 0.6 0.5 0.5 0.2 0.4 0.2 0.3 0.2 0.3 0.4 0.4 0.6 +0.2Race (2-year average):b
White — — — — 0.4 0.5 0.5 0.4 0.3 0.2 0.2 0.3 0.3 0.3 0.3 0.0 Black — — — — 0.2 0.5 0.4 0.2 0.5 0.4 0.2 0.4 0.5 0.6 0.7 +0.1 Hispanic — — — — 1.0 0.7 0.5 0.6 1.0 0.6 0.4 0.6 0.7 0.8 0.9 +0.1
provide more stable estimates. For the data beginning in 2005, see the race/ethnicity note at the end of Appendix D.
TABLE D-39
Notes: Level of significance of difference between the two most recent classes: s = .05, ss = .01, sss = .001. ‘—’ indicates data not available.
Any apparent inconsistency between the change estimate and the prevalence-of-use estimates for the two most recent classes is due to rounding error.
’05–’06change
See Table D-108 for the number of subgroup cases. See Appendix B for definition of variables in table.
Data based on three of six forms; N is one-half of N indicated in Table D-108.
Heroin with a Needle: Trends in Annual Prevalence of Use by Subgroups for Twelfth Graders
aParental education is an average score of mother’s education and father’s education. See Appendix B for details.bTo derive percentages for each racial subgroup, data for the specified year and the previous year have been combined to increase subgroup sample sizes and thus
Percentage who used in last twelve monthsClass of:
Source: The Monitoring the Future Study, the University of Michigan.
318

1991 1992 1993 1994 1995 1996 1997 1998 1999 2000 2001 2002 2003 2004 2005 2006Approx. N = — — — — 17,500 17,800 18,600 18,100 16,700 16,700 16,200 15,100 16,500 17,000 16,800 16,500
Total — — — — 0.8 1.0 0.8 0.8 0.9 0.7 0.6 0.6 0.6 0.6 0.5 0.5 +0.1Gender: Male — — — — 1.0 0.9 0.9 0.9 0.8 0.5 0.6 0.6 0.6 0.4 0.4 0.5 +0.1 Female — — — — 0.6 0.9 0.7 0.8 0.8 0.8 0.6 0.7 0.6 0.7 0.5 0.6 +0.1College Plans: None or under 4 years — — — — 3.2 2.1 2.2 3.4 2.7 2.4 1.9 1.7 2.3 2.5 1.6 2.3 +0.7 Complete 4 years — — — — 0.5 0.7 0.7 0.6 0.6 0.5 0.5 0.5 0.4 0.4 0.4 0.4 0.0Region: Northeast — — — — 0.9 1.1 0.8 0.7 0.7 0.6 0.7 0.3 0.5 0.6 0.5 0.2 -0.3 North Central — — — — 1.0 1.0 0.9 0.9 1.0 0.8 0.6 0.7 0.8 0.4 0.3 0.7 +0.3 South — — — — 0.8 0.8 0.7 0.9 0.9 0.5 0.6 0.7 0.7 0.6 0.6 0.6 +0.1 West — — — — 0.7 1.1 1.1 0.9 0.9 0.8 0.5 0.7 0.5 0.7 0.4 0.5 +0.1Population Density: Large MSA — — — — 0.9 1.0 0.6 0.5 0.8 0.7 0.5 0.6 0.6 0.7 0.4 0.4 0.0 Other MSA — — — — 0.8 1.0 0.9 1.0 0.8 0.8 0.8 0.5 0.6 0.6 0.5 0.5 +0.1 Non-MSA — — — — 0.9 0.9 1.0 1.0 1.1 0.5 0.4 0.8 0.7 0.3 0.6 0.7 +0.2Parental Education:a
1.0-2.0 (Low) — — — — 1.9 1.5 1.3 2.4 1.7 1.1 1.3 0.5 1.4 1.5 0.2 1.4 +1.2 ss 2.5-3.0 — — — — 0.7 0.9 1.1 0.7 1.0 1.3 0.6 0.8 0.6 0.6 0.9 0.6 -0.3 3.5-4.0 — — — — 0.5 1.2 0.5 0.8 0.6 0.5 0.6 0.6 0.7 0.6 0.5 0.6 0.0 4.5-5.0 — — — — 0.8 0.8 0.8 0.6 0.8 0.5 0.5 0.6 0.4 0.4 0.3 0.4 +0.1 5.5-6.0 (High) — — — — 0.7 0.8 1.0 1.1 1.1 0.3 0.4 0.4 0.5 0.3 0.1 0.3 +0.1Race (2-year average):b
White — — — — — 1.0 1.0 0.8 0.8 0.8 0.7 0.6 0.6 0.5 0.4 0.5 0.0 Black — — — — — 0.2 0.2 0.4 0.5 0.3 0.3 0.3 0.3 0.5 0.4 0.3 -0.1 Hispanic — — — — — 1.5 1.2 1.1 1.4 1.1 0.8 1.0 1.0 1.0 0.9 0.6 -0.3
bTo derive percentages for each racial subgroup, data for the specified year and the previous year have been combined to increase subgroup sample sizes and thus provide
more stable estimates. For the data beginning in 2005, see the race/ethnicity note at the end of Appendix D.
change
Source: The Monitoring the Future Study, the University of Michigan.
TABLE D-40
aParental education is an average score of mother’s education and father’s education. See Appendix B for details.
Percentage who used in last twelve months’05–’06
Notes: Level of significance of difference between the two most recent classes: s = .05, ss = .01, sss = .001. ‘—’ indicates data not available.
Any apparent inconsistency between the change estimate and the prevalence-of-use estimates for the two most recent classes is due to rounding error.
See Table D-106 for the number of subgroup cases. See Appendix B for definition of variables in table.
Data based on one of two forms in 1995; N is one-half of N indicated in Table D-106.
Heroin without a Needle: Trends in Annual Prevalence of Use by Subgroups for Eighth Graders
319

1991 1992 1993 1994 1995 1996 1997 1998 1999 2000 2001 2002 2003 2004 2005 2006Approx. N = — — — — 17,000 15,600 15,500 15,000 13,600 14,300 14,000 14,300 15,800 16,400 16,200 16,200
Total — — — — 0.8 0.9 1.1 1.0 1.1 1.1 0.7 0.8 0.5 0.7 0.7 0.6 -0.1Gender: Male — — — — 0.9 1.1 1.2 1.2 1.3 1.1 0.8 0.9 0.6 0.8 0.7 0.6 -0.1 Female — — — — 0.7 0.7 1.0 0.8 1.0 1.0 0.6 0.6 0.4 0.5 0.6 0.6 0.0College Plans: None or under 4 years — — — — 1.7 1.8 2.1 1.8 2.5 2.7 1.7 2.2 1.4 2.2 2.3 2.0 -0.3 Complete 4 years — — — — 0.6 0.7 1.0 0.9 0.8 0.8 0.5 0.6 0.4 0.5 0.4 0.4 0.0Region: Northeast — — — — 0.5 0.7 1.0 1.4 1.6 1.2 0.8 0.7 0.4 0.9 0.9 0.8 -0.1 North Central — — — — 0.5 0.8 1.2 0.7 1.0 1.2 0.8 0.9 0.5 0.5 0.8 0.6 -0.2 South — — — — 1.1 1.1 1.2 1.0 1.0 1.3 0.7 0.5 0.7 0.7 0.6 0.6 0.0 West — — — — 0.9 0.9 1.0 0.8 0.8 0.5 0.5 1.2 0.4 0.5 0.5 0.5 0.0Population Density: Large MSA — — — — 0.9 0.9 1.3 0.8 0.9 1.5 0.8 0.6 0.4 0.6 0.7 0.5 -0.2 Other MSA — — — — 0.7 1.0 1.0 1.1 1.2 1.0 0.7 0.8 0.6 0.8 0.7 0.6 -0.1 Non-MSA — — — — 0.9 0.7 1.1 1.0 1.2 0.9 0.7 1.0 0.6 0.5 0.6 0.8 +0.2Parental Education:a
1.0-2.0 (Low) — — — — 1.7 0.8 0.9 1.2 1.8 1.1 0.9 1.5 0.9 1.0 1.1 1.2 +0.1 2.5-3.0 — — — — 0.6 0.7 1.0 1.0 1.1 1.1 0.9 0.7 0.7 0.7 0.9 0.6 -0.3 3.5-4.0 — — — — 0.9 1.0 1.3 1.2 0.9 1.3 0.5 0.8 0.4 0.7 0.6 0.5 -0.1 4.5-5.0 — — — — 0.5 0.8 1.1 1.0 1.0 1.0 0.6 0.5 0.5 0.5 0.6 0.5 -0.1 5.5-6.0 (High) — — — — 0.9 1.1 1.0 0.7 1.1 1.1 0.6 1.1 0.1 0.4 0.5 0.4 -0.1Race (2-year average):b
White — — — — — 0.9 1.0 1.1 1.1 1.2 1.0 0.8 0.7 0.6 0.7 0.7 0.0 Black — — — — — 0.1 0.1 0.2 0.3 0.3 0.4 0.3 0.3 0.3 0.3 0.4 0.0 Hispanic — — — — — 0.8 1.1 1.4 1.3 0.9 0.8 0.8 0.8 0.9 1.0 0.9 0.0
bTo derive percentages for each racial subgroup, data for the specified year and the previous year have been combined to increase subgroup sample sizes and thus provide
more stable estimates. For the data beginning in 2005, see the race/ethnicity note at the end of Appendix D.
Percentage who used in last twelve months’05–’06
Data based on one of two forms in 1995; N is one-half of N indicated in Table D-107.aParental education is an average score of mother’s education and father’s education. See Appendix B for details.
Notes: Level of significance of difference between the two most recent classes: s = .05, ss = .01, sss = .001. ‘—’ indicates data not available.
Heroin without a Needle: Trends in Annual Prevalence of Use by Subgroups for Tenth Graders TABLE D-41
Any apparent inconsistency between the change estimate and the prevalence-of-use estimates for the two most recent classes is due to rounding error.
See Table D-107 for the number of subgroup cases. See Appendix B for definition of variables in table.
change
Source: The Monitoring the Future Study, the University of Michigan.
320

1975–79 1980–89 1990–94 1995 1996 1997 1998 1999 2000 2001 2002 2003 2004 2005 2006Approx. N = — — — 15,400 14,300 15,400 15,200 13,600 12,800 12,800 12,900 14,600 14,600 14,700 14,200
Total — — — 1.0 1.0 1.2 0.8 1.0 1.6 0.8 0.8 0.8 0.7 0.8 0.6 -0.2Gender: Male — — — 1.4 1.3 1.4 1.0 1.3 1.8 1.3 0.9 0.9 0.9 1.1 0.8 -0.3 Female — — — 0.7 0.7 0.9 0.7 0.8 1.5 0.4 0.7 0.7 0.4 0.5 0.3 -0.1College Plans: None or under 4 years — — — 1.4 1.7 1.6 1.3 1.5 2.7 1.3 2.2 0.8 1.5 1.7 1.2 -0.5 Complete 4 years — — — 0.9 0.8 1.0 0.6 1.0 1.3 0.7 0.4 0.7 0.4 0.6 0.4 -0.2Region: Northeast — — — 0.9 1.9 1.9 1.1 1.3 0.9 1.3 1.1 0.6 1.1 1.1 1.0 -0.1 North Central — — — 0.7 0.5 1.0 0.6 0.7 1.6 1.1 0.9 0.7 0.4 0.7 0.2 -0.5 s South — — — 1.4 0.9 1.1 1.1 1.2 1.8 0.3 0.9 1.2 0.5 0.7 0.7 -0.1 West — — — 0.8 0.7 0.6 0.3 1.0 2.0 0.9 0.4 0.3 1.0 0.7 0.6 -0.1Population Density: Large MSA — — — 1.3 1.1 1.2 0.9 0.9 2.5 1.0 0.6 0.8 0.8 0.7 0.8 +0.1 Other MSA — — — 0.8 1.2 1.1 0.9 1.2 1.2 0.8 1.1 0.7 0.9 0.7 0.4 -0.3 Non-MSA — — — 1.0 0.4 1.2 0.4 0.8 1.4 0.7 0.6 1.0 0.2 1.0 0.5 -0.5Parental Education:a
1.0-2.0 (Low) — — — 1.0 0.8 1.7 0.5 2.0 2.7 1.5 1.8 1.0 1.1 1.1 1.2 +0.1 2.5-3.0 — — — 1.1 0.6 0.8 1.1 1.1 1.8 0.5 0.9 0.9 0.8 1.0 0.5 -0.4 3.5-4.0 — — — 0.9 1.1 1.3 0.9 0.8 1.7 0.8 1.0 0.7 0.6 0.9 0.5 -0.4 4.5-5.0 — — — 1.2 1.2 1.2 0.8 1.1 1.6 1.1 0.2 0.8 0.7 0.5 0.4 -0.2 5.5-6.0 (High) — — — 0.6 1.0 1.0 0.5 1.0 0.6 0.8 0.8 0.7 0.3 0.5 0.7 +0.2Race (2-year average):b
White — — — — 1.1 1.3 1.2 1.1 1.4 1.3 1.0 0.8 0.7 0.6 0.6 0.0 Black — — — — 0.2 0.3 0.3 0.1 0.4 0.4 0.4 0.6 0.7 0.5 0.4 -0.2 Hispanic — — — — 0.9 0.6 0.4 0.6 1.8 1.3 0.5 0.7 0.7 0.9 1.0 +0.1
bTo derive percentages for each racial subgroup, data for the specified year and the previous year have been combined to increase subgroup sample sizes and thus
provide more stable estimates. For the data beginning in 2005, see the race/ethnicity note at the end of Appendix D.
Percentage who used in last twelve monthsClass of: ’05–’06
change
See Table D-108 for the number of subgroup cases. See Appendix B for definition of variables in table.
Data based on three of six forms; N is one-half of N indicated in Table D-108.aParental education is an average score of mother’s education and father’s education. See Appendix B for details.
TABLE D-42
Notes: Level of significance of difference between the two most recent classes: s = .05, ss = .01, sss = .001. ‘—’ indicates data not available.
Any apparent inconsistency between the change estimate and the prevalence-of-use estimates for the two most recent classes is due to rounding error.
Source: The Monitoring the Future Study, the University of Michigan.
Heroin without a Needle: Trends in Annual Prevalence of Use by Subgroups for Twelfth Graders
321
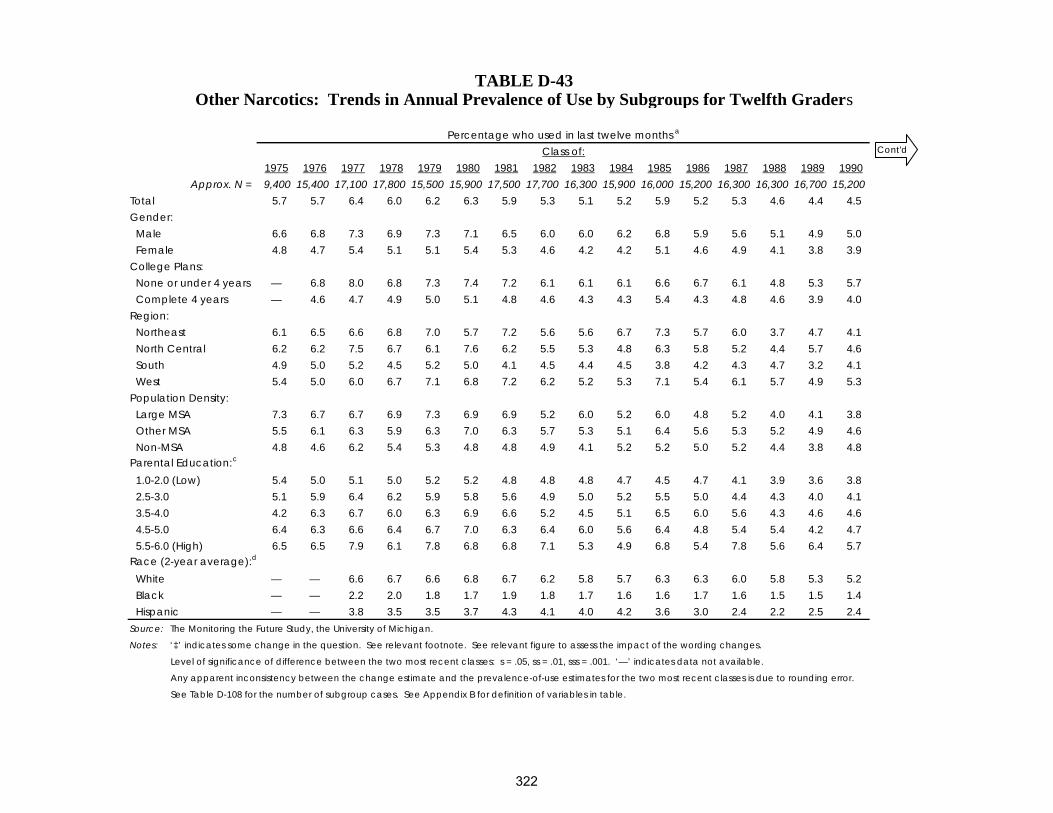
1975 1976 1977 1978 1979 1980 1981 1982 1983 1984 1985 1986 1987 1988 1989 1990Approx. N = 9,400 15,400 17,100 17,800 15,500 15,900 17,500 17,700 16,300 15,900 16,000 15,200 16,300 16,300 16,700 15,200
Total 5.7 5.7 6.4 6.0 6.2 6.3 5.9 5.3 5.1 5.2 5.9 5.2 5.3 4.6 4.4 4.5Gender: Male 6.6 6.8 7.3 6.9 7.3 7.1 6.5 6.0 6.0 6.2 6.8 5.9 5.6 5.1 4.9 5.0 Female 4.8 4.7 5.4 5.1 5.1 5.4 5.3 4.6 4.2 4.2 5.1 4.6 4.9 4.1 3.8 3.9College Plans: None or under 4 years — 6.8 8.0 6.8 7.3 7.4 7.2 6.1 6.1 6.1 6.6 6.7 6.1 4.8 5.3 5.7 Complete 4 years — 4.6 4.7 4.9 5.0 5.1 4.8 4.6 4.3 4.3 5.4 4.3 4.8 4.6 3.9 4.0Region: Northeast 6.1 6.5 6.6 6.8 7.0 5.7 7.2 5.6 5.6 6.7 7.3 5.7 6.0 3.7 4.7 4.1 North Central 6.2 6.2 7.5 6.7 6.1 7.6 6.2 5.5 5.3 4.8 6.3 5.8 5.2 4.4 5.7 4.6 South 4.9 5.0 5.2 4.5 5.2 5.0 4.1 4.5 4.4 4.5 3.8 4.2 4.3 4.7 3.2 4.1 West 5.4 5.0 6.0 6.7 7.1 6.8 7.2 6.2 5.2 5.3 7.1 5.4 6.1 5.7 4.9 5.3Population Density: Large MSA 7.3 6.7 6.7 6.9 7.3 6.9 6.9 5.2 6.0 5.2 6.0 4.8 5.2 4.0 4.1 3.8 Other MSA 5.5 6.1 6.3 5.9 6.3 7.0 6.3 5.7 5.3 5.1 6.4 5.6 5.3 5.2 4.9 4.6 Non-MSA 4.8 4.6 6.2 5.4 5.3 4.8 4.8 4.9 4.1 5.2 5.2 5.0 5.2 4.4 3.8 4.8Parental Education:c
1.0-2.0 (Low) 5.4 5.0 5.1 5.0 5.2 5.2 4.8 4.8 4.8 4.7 4.5 4.7 4.1 3.9 3.6 3.8 2.5-3.0 5.1 5.9 6.4 6.2 5.9 5.8 5.6 4.9 5.0 5.2 5.5 5.0 4.4 4.3 4.0 4.1 3.5-4.0 4.2 6.3 6.7 6.0 6.3 6.9 6.6 5.2 4.5 5.1 6.5 6.0 5.6 4.3 4.6 4.6 4.5-5.0 6.4 6.3 6.6 6.4 6.7 7.0 6.3 6.4 6.0 5.6 6.4 4.8 5.4 5.4 4.2 4.7 5.5-6.0 (High) 6.5 6.5 7.9 6.1 7.8 6.8 6.8 7.1 5.3 4.9 6.8 5.4 7.8 5.6 6.4 5.7Race (2-year average):d
White — — 6.6 6.7 6.6 6.8 6.7 6.2 5.8 5.7 6.3 6.3 6.0 5.8 5.3 5.2 Black — — 2.2 2.0 1.8 1.7 1.9 1.8 1.7 1.6 1.6 1.7 1.6 1.5 1.5 1.4 Hispanic — — 3.8 3.5 3.5 3.7 4.3 4.1 4.0 4.2 3.6 3.0 2.4 2.2 2.5 2.4
Level of significance of difference between the two most recent classes: s = .05, ss = .01, sss = .001. ‘—’ indicates data not available.
Any apparent inconsistency between the change estimate and the prevalence-of-use estimates for the two most recent classes is due to rounding error.
See Table D-108 for the number of subgroup cases. See Appendix B for definition of variables in table.
TABLE D-43Other Narcotics: Trends in Annual Prevalence of Use by Subgroups for Twelfth Graders
Notes: ‘‡’ indicates some change in the question. See relevant footnote. See relevant figure to assess the impact of the wording changes.
Percentage who used in last twelve months a
Class of:
Source: The Monitoring the Future Study, the University of Michigan.
Cont'd
322
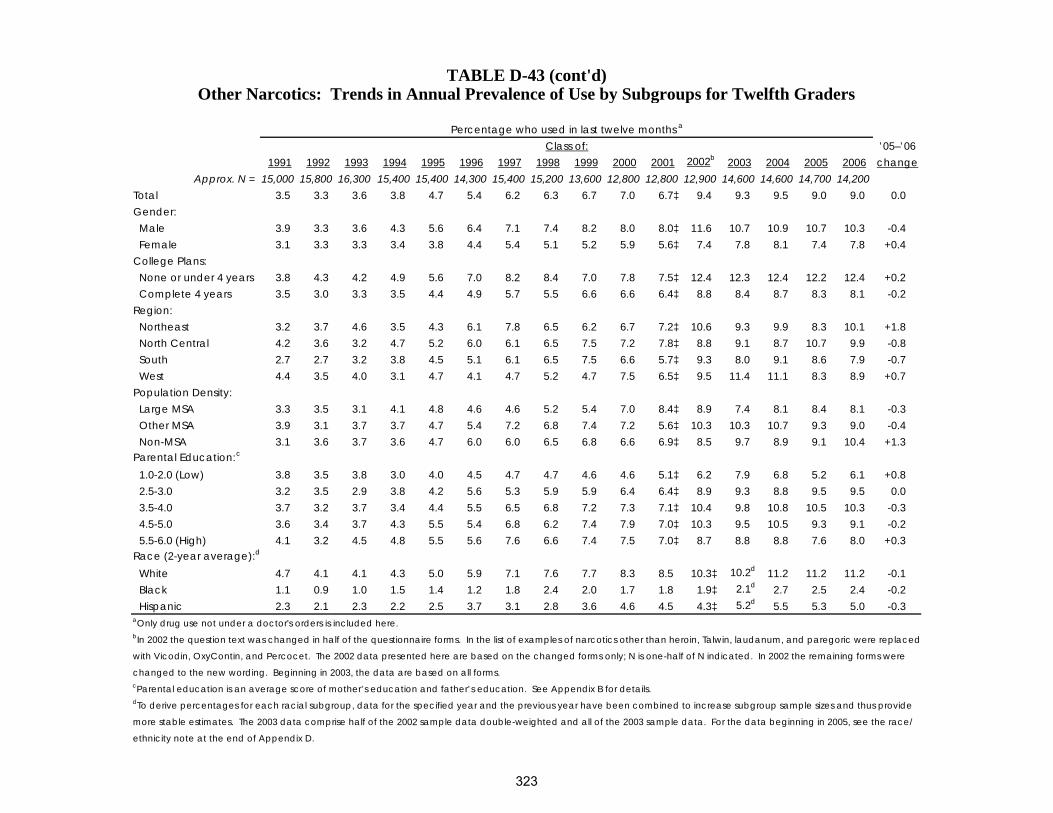
1991 1992 1993 1994 1995 1996 1997 1998 1999 2000 2001 2002b 2003 2004 2005 2006Approx. N = 15,000 15,800 16,300 15,400 15,400 14,300 15,400 15,200 13,600 12,800 12,800 12,900 14,600 14,600 14,700 14,200
Total 3.5 3.3 3.6 3.8 4.7 5.4 6.2 6.3 6.7 7.0 6.7‡ 9.4 9.3 9.5 9.0 9.0 0.0Gender: Male 3.9 3.3 3.6 4.3 5.6 6.4 7.1 7.4 8.2 8.0 8.0‡ 11.6 10.7 10.9 10.7 10.3 -0.4 Female 3.1 3.3 3.3 3.4 3.8 4.4 5.4 5.1 5.2 5.9 5.6‡ 7.4 7.8 8.1 7.4 7.8 +0.4College Plans: None or under 4 years 3.8 4.3 4.2 4.9 5.6 7.0 8.2 8.4 7.0 7.8 7.5‡ 12.4 12.3 12.4 12.2 12.4 +0.2 Complete 4 years 3.5 3.0 3.3 3.5 4.4 4.9 5.7 5.5 6.6 6.6 6.4‡ 8.8 8.4 8.7 8.3 8.1 -0.2Region: Northeast 3.2 3.7 4.6 3.5 4.3 6.1 7.8 6.5 6.2 6.7 7.2‡ 10.6 9.3 9.9 8.3 10.1 +1.8 North Central 4.2 3.6 3.2 4.7 5.2 6.0 6.1 6.5 7.5 7.2 7.8‡ 8.8 9.1 8.7 10.7 9.9 -0.8 South 2.7 2.7 3.2 3.8 4.5 5.1 6.1 6.5 7.5 6.6 5.7‡ 9.3 8.0 9.1 8.6 7.9 -0.7 West 4.4 3.5 4.0 3.1 4.7 4.1 4.7 5.2 4.7 7.5 6.5‡ 9.5 11.4 11.1 8.3 8.9 +0.7Population Density: Large MSA 3.3 3.5 3.1 4.1 4.8 4.6 4.6 5.2 5.4 7.0 8.4‡ 8.9 7.4 8.1 8.4 8.1 -0.3 Other MSA 3.9 3.1 3.7 3.7 4.7 5.4 7.2 6.8 7.4 7.2 5.6‡ 10.3 10.3 10.7 9.3 9.0 -0.4 Non-MSA 3.1 3.6 3.7 3.6 4.7 6.0 6.0 6.5 6.8 6.6 6.9‡ 8.5 9.7 8.9 9.1 10.4 +1.3Parental Education:c
1.0-2.0 (Low) 3.8 3.5 3.8 3.0 4.0 4.5 4.7 4.7 4.6 4.6 5.1‡ 6.2 7.9 6.8 5.2 6.1 +0.8 2.5-3.0 3.2 3.5 2.9 3.8 4.2 5.6 5.3 5.9 5.9 6.4 6.4‡ 8.9 9.3 8.8 9.5 9.5 0.0 3.5-4.0 3.7 3.2 3.7 3.4 4.4 5.5 6.5 6.8 7.2 7.3 7.1‡ 10.4 9.8 10.8 10.5 10.3 -0.3 4.5-5.0 3.6 3.4 3.7 4.3 5.5 5.4 6.8 6.2 7.4 7.9 7.0‡ 10.3 9.5 10.5 9.3 9.1 -0.2 5.5-6.0 (High) 4.1 3.2 4.5 4.8 5.5 5.6 7.6 6.6 7.4 7.5 7.0‡ 8.7 8.8 8.8 7.6 8.0 +0.3Race (2-year average):d
White 4.7 4.1 4.1 4.3 5.0 5.9 7.1 7.6 7.7 8.3 8.5 10.3‡ 10.2d 11.2 11.2 11.2 -0.1 Black 1.1 0.9 1.0 1.5 1.4 1.2 1.8 2.4 2.0 1.7 1.8 1.9‡ 2.1d 2.7 2.5 2.4 -0.2 Hispanic 2.3 2.1 2.3 2.2 2.5 3.7 3.1 2.8 3.6 4.6 4.5 4.3‡ 5.2d 5.5 5.3 5.0 -0.3
ethnicity note at the end of Appendix D.
TABLE D-43 (cont'd)
changed to the new wording. Beginning in 2003, the data are based on all forms. cParental education is an average score of mother’s education and father’s education. See Appendix B for details.dTo derive percentages for each racial subgroup, data for the specified year and the previous year have been combined to increase subgroup sample sizes and thus provide
Class of:
more stable estimates. The 2003 data comprise half of the 2002 sample data double-weighted and all of the 2003 sample data. For the data beginning in 2005, see the race/
Other Narcotics: Trends in Annual Prevalence of Use by Subgroups for Twelfth Graders
aOnly drug use not under a doctor's orders is included here. bIn 2002 the question text was changed in half of the questionnaire forms. In the list of examples of narcotics other than heroin, Talwin, laudanum, and paregoric were replaced
with Vicodin, OxyContin, and Percocet. The 2002 data presented here are based on the changed forms only; N is one-half of N indicated. In 2002 the remaining forms were
’05–’06change
Percentage who used in last twelve months a
323

1991–99 2000–01 2002 2003 2004 2005 2006 1991–99 2000–01 2002 2003 2004 2005 2006Approx. N = — — 15,100 16,500 17,000 16,800 16,500 — — 14,300 15,800 16,400 16,200 16,200
Total — — 1.3 1.7 1.7 1.8 2.6 +0.8 — — 3.0 3.6 3.5 3.2 3.8 +0.6Gender: Male — — 1.9 1.6 1.8 1.9 2.8 +0.9 — — 3.6 4.3 3.8 3.4 3.7 +0.3 Female — — 0.9 1.7 1.6 1.7 2.2 +0.4 — — 2.4 2.9 3.1 3.0 4.0 +1.0College Plans: None or under 4 years — — 4.3 7.5 6.9 6.8 8.8 +2.0 — — 6.5 10.8 7.2 8.0 11.0 +3.0 Complete 4 years — — 1.0 1.1 1.2 1.2 1.9 +0.7 s — — 2.5 2.5 3.0 2.6 2.9 +0.3Region: Northeast — — 1.0 1.2 1.1 1.7 1.6 -0.1 — — 3.6 3.7 4.6 3.8 3.1 -0.7 North Central — — 1.7 1.7 1.3 2.4 3.2 +0.7 — — 2.1 2.9 2.5 3.5 4.1 +0.6 South — — 1.5 2.1 2.2 2.0 2.4 +0.4 — — 3.7 4.2 4.8 3.6 4.4 +0.7 West — — 0.9 1.3 1.8 1.0 3.1 +2.1 s — — 2.6 3.5 1.9 1.6 3.3 +1.7Population Density: Large MSA — — 1.2 1.1 0.9 1.1 1.3 +0.2 — — 2.0 2.3 2.1 2.8 3.4 +0.6 Other MSA — — 1.4 1.7 2.6 2.3 3.1 +0.8 — — 3.3 3.6 3.7 2.7 3.3 +0.6 Non-MSA — — 1.5 2.5 1.1 1.8 3.2 +1.3 — — 3.7 5.7 5.1 4.9 5.8 +0.9Parental Education:a
1.0-2.0 (Low) — — 2.9 4.0 3.5 3.7 3.6 0.0 — — 6.5 5.9 3.7 3.3 6.9 +3.6 2.5-3.0 — — 2.0 2.3 2.1 2.9 3.4 +0.5 — — 3.8 3.9 4.0 4.8 5.3 +0.4 3.5-4.0 — — 1.0 1.9 2.2 2.5 2.4 -0.1 — — 2.0 4.1 4.1 3.0 4.3 +1.3 4.5-5.0 — — 0.9 0.7 1.3 0.7 2.0 +1.3 s — — 1.7 2.9 2.6 2.6 2.3 -0.2 5.5-6.0 (High) — — 1.3 1.6 0.7 0.8 2.2 +1.3 — — 4.4 2.8 2.8 2.6 2.4 -0.2Race (2-year average):b
White — — — 1.6 1.7 1.7 2.3 +0.5 — — — 3.6 4.1 4.1 4.1 0.0 Black — — — 0.9 0.6 1.0 1.4 +0.4 — — — 2.3 2.0 1.1 1.5 +0.4 Hispanic — — — 1.3 2.8 2.6 2.4 -0.2 — — — 2.5 2.9 2.3 1.8 -0.5
ber of subgroup cases. See Appendix B for definition of variables in table. Data based on one of four forms; N is one-third of N indicated in Tables D-106 and D-107.
between the change estimate and the prevalence-of-use estimates for the two most recent classes is due to rounding error. See Tables D-106 and D-107 for the num-
Percentage who used in last twelve months8th Graders 10th Graders
’05–’06 ’05–’06change
TABLE D-44OxyContin: Trends in Annual Prevalence of Use by Subgroups for Eighth and Tenth Graders
Source: The Monitoring the Future Study, the University of Michigan.
Notes: Level of significance of difference between the two most recent classes: s = .05, ss = .01, sss = .001. ‘—’ indicates data not available. Any apparent inconsistency
change
Caution: Limited sample sizes (see “Notes” above). Use caution in interpreting subgroup trends.aParental education is an average score of mother’s education and father’s education. See Appendix B for details.bTo derive percentages for each racial subgroup, data for the specified year and the previous year have been combined to increase subgroup sample sizes and thus provide
more stable estimates. For the data beginning in 2005, see the race/ethnicity note at the end of Appendix D.
324
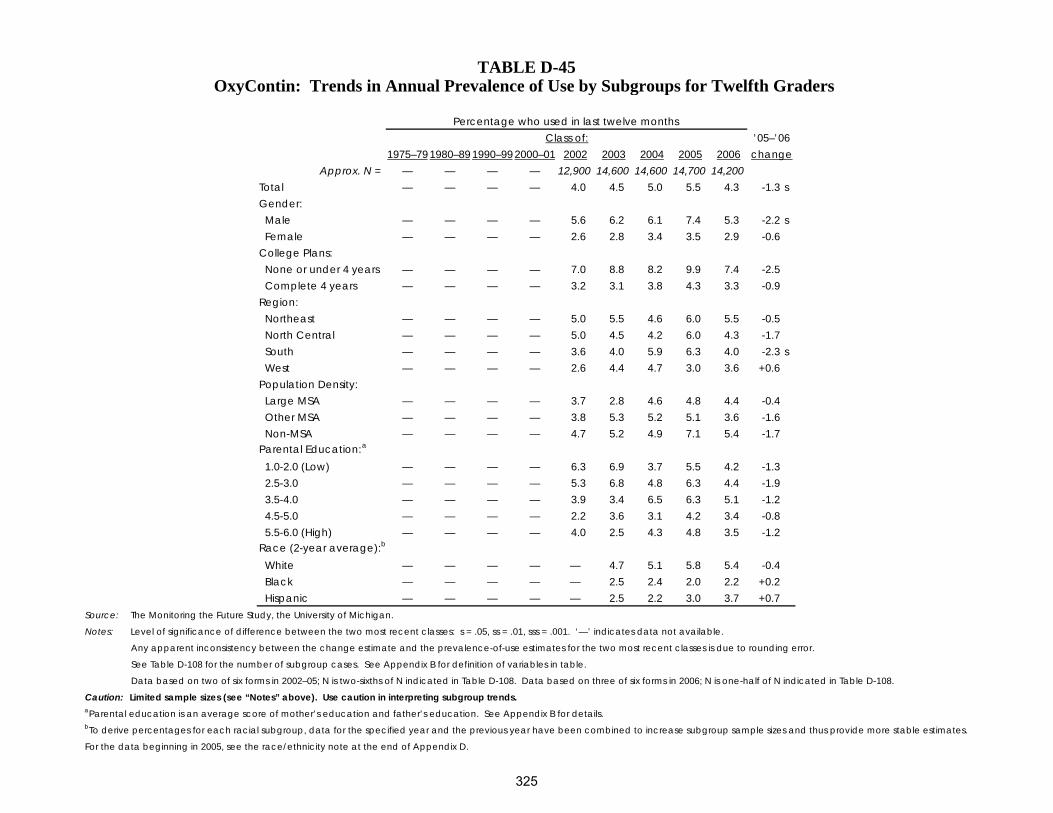
1975–79 1980–89 1990–99 2000–01 2002 2003 2004 2005 2006Approx. N = — — — — 12,900 14,600 14,600 14,700 14,200
Total — — — — 4.0 4.5 5.0 5.5 4.3 -1.3 sGender: Male — — — — 5.6 6.2 6.1 7.4 5.3 -2.2 s Female — — — — 2.6 2.8 3.4 3.5 2.9 -0.6College Plans: None or under 4 years — — — — 7.0 8.8 8.2 9.9 7.4 -2.5 Complete 4 years — — — — 3.2 3.1 3.8 4.3 3.3 -0.9Region: Northeast — — — — 5.0 5.5 4.6 6.0 5.5 -0.5 North Central — — — — 5.0 4.5 4.2 6.0 4.3 -1.7 South — — — — 3.6 4.0 5.9 6.3 4.0 -2.3 s West — — — — 2.6 4.4 4.7 3.0 3.6 +0.6Population Density: Large MSA — — — — 3.7 2.8 4.6 4.8 4.4 -0.4 Other MSA — — — — 3.8 5.3 5.2 5.1 3.6 -1.6 Non-MSA — — — — 4.7 5.2 4.9 7.1 5.4 -1.7Parental Education:a
1.0-2.0 (Low) — — — — 6.3 6.9 3.7 5.5 4.2 -1.3 2.5-3.0 — — — — 5.3 6.8 4.8 6.3 4.4 -1.9 3.5-4.0 — — — — 3.9 3.4 6.5 6.3 5.1 -1.2 4.5-5.0 — — — — 2.2 3.6 3.1 4.2 3.4 -0.8 5.5-6.0 (High) — — — — 4.0 2.5 4.3 4.8 3.5 -1.2Race (2-year average):b
White — — — — — 4.7 5.1 5.8 5.4 -0.4 Black — — — — — 2.5 2.4 2.0 2.2 +0.2 Hispanic — — — — — 2.5 2.2 3.0 3.7 +0.7
For the data beginning in 2005, see the race/ethnicity note at the end of Appendix D.
TABLE D-45OxyContin: Trends in Annual Prevalence of Use by Subgroups for Twelfth Graders
Notes: Level of significance of difference between the two most recent classes: s = .05, ss = .01, sss = .001. ‘—’ indicates data not available.
Any apparent inconsistency between the change estimate and the prevalence-of-use estimates for the two most recent classes is due to rounding error.
bTo derive percentages for each racial subgroup, data for the specified year and the previous year have been combined to increase subgroup sample sizes and thus provide more stable estimates.
Percentage who used in last twelve monthsClass of: ’05–’06
change
See Table D-108 for the number of subgroup cases. See Appendix B for definition of variables in table.
aParental education is an average score of mother’s education and father’s education. See Appendix B for details.
Caution: Limited sample sizes (see “Notes” above). Use caution in interpreting subgroup trends.
Source: The Monitoring the Future Study, the University of Michigan.
Data based on two of six forms in 2002–05; N is two-sixths of N indicated in Table D-108. Data based on three of six forms in 2006; N is one-half of N indicated in Table D-108.
325

1991–99 2000–01 2002 2003 2004 2005 2006 1991–99 2000–01 2002 2003 2004 2005 2006Approx. N = — — 15,100 16,500 17,000 16,800 16,500 — — 14,300 15,800 16,400 16,200 16,200
Total — — 2.5 2.8 2.5 2.6 3.0 +0.5 — — 6.9 7.2 6.2 5.9 7.0 +1.1Gender: Male — — 2.7 2.8 2.4 2.9 2.6 -0.3 — — 7.4 8.4 6.2 5.5 7.0 +1.5 Female — — 2.4 2.8 2.6 2.2 3.4 +1.2 — — 6.1 6.1 6.0 6.2 6.9 +0.7College Plans: None or under 4 years — — 5.9 6.3 7.1 7.3 9.5 +2.2 — — 13.4 15.8 11.6 13.2 17.2 +4.0 Complete 4 years — — 2.1 2.4 2.0 1.9 2.4 +0.5 — — 5.7 5.8 5.4 4.8 5.6 +0.8Region: Northeast — — 1.5 1.1 1.0 1.5 1.9 +0.4 — — 6.2 5.6 6.4 5.7 4.9 -0.8 North Central — — 3.3 3.9 3.2 3.3 3.9 +0.6 — — 7.2 9.4 6.4 7.1 8.7 +1.6 South — — 2.5 2.1 2.1 2.3 2.2 -0.1 — — 5.3 5.0 5.0 5.0 4.2 -0.9 West — — 2.6 4.2 3.6 3.1 4.4 +1.3 — — 10.0 9.1 7.1 5.8 11.1 +5.4 ssPopulation Density: Large MSA — — 2.6 2.4 1.8 2.5 2.4 -0.1 — — 5.7 7.1 4.8 6.5 6.1 -0.4 Other MSA — — 3.0 3.1 3.0 2.6 3.3 +0.7 — — 7.9 6.4 6.9 5.3 7.6 +2.3 Non-MSA — — 1.6 2.5 2.4 2.6 3.3 +0.8 — — 6.2 9.2 6.4 6.3 6.9 +0.6Parental Education:a
1.0-2.0 (Low) — — 3.3 3.3 4.9 3.9 4.8 +1.0 — — 6.1 6.4 6.4 4.9 7.6 +2.6 2.5-3.0 — — 3.9 3.4 4.1 3.8 4.0 +0.3 — — 8.0 8.3 8.2 7.7 8.0 +0.3 3.5-4.0 — — 3.4 2.9 3.2 2.9 2.7 -0.2 — — 7.5 8.5 6.2 6.8 8.1 +1.3 4.5-5.0 — — 1.4 2.1 1.1 1.9 2.6 +0.7 — — 5.7 6.3 5.1 5.0 5.6 +0.6 5.5-6.0 (High) — — 1.3 2.1 0.9 1.6 2.2 +0.5 — — 6.6 5.6 5.0 4.6 6.3 +1.7Race (2-year average):b
White — — — 3.0 2.7 2.4 2.9 +0.5 — — — 8.0 7.6 7.1 7.4 +0.3 Black — — — 1.4 1.4 1.6 1.7 +0.1 — — — 3.1 3.0 1.6 2.2 +0.6 Hispanic — — — 2.1 3.3 3.6 2.8 -0.8 — — — 6.5 6.0 4.8 4.4 -0.4
bTo derive percentages for each racial subgroup, data for the specified year and the previous year have been combined to increase subgroup sample sizes and thus provide
more stable estimates. For the data beginning in 2005, see the race/ethnicity note at the end of Appendix D.
TABLE D-46Vicodin: Trends in Annual Prevalence of Use by Subgroups for Eighth and Tenth Graders
between the change estimate and the prevalence-of-use estimates for the two most recent classes is due to rounding error. See Tables D-106 and D-107 for the num-
Source : The Monitoring the Future Study, the University of Michigan.
Notes: Level of significance of difference between the two most recent classes: s = .05, ss = .01, sss = .001. ‘—’ indicates data not available. Any apparent inconsistency
ber of subgroup cases. See Appendix B for definition of variables in table. Data based on one of four forms; N is one-third of N indicated in Tables D-106 and D-107.
Caution: Limited sample sizes (see “Notes” above). Use caution in interpreting subgroup trends.aParental education is an average score of mother’s education and father’s education. See Appendix B for details.
10th GradersPercentage who used in last twelve months
change’05–’06 ’05–’06change
8th Graders
326

1975–79 1980–89 1990–99 2000–01 2002 2003 2004 2005 2006Approx. N = — — — — 12,900 14,600 14,600 14,700 14,200
Total — — — — 9.6 10.5 9.3 9.5 9.7 +0.3Gender: Male — — — — 12.0 13.0 10.7 11.9 10.9 -1.0 Female — — — — 7.5 8.1 7.6 7.2 8.7 +1.4College Plans: None or under 4 years — — — — 13.0 14.7 11.6 14.3 11.8 -2.4 Complete 4 years — — — — 8.4 9.1 8.3 8.4 9.1 +0.7Region: Northeast — — — — 8.1 9.4 9.1 8.8 10.8 +2.0 North Central — — — — 11.6 13.2 8.4 12.4 12.0 -0.5 South — — — — 8.1 6.1 7.0 7.8 6.9 -0.9 West — — — — 10.9 16.3 15.4 9.3 11.2 +1.9Population Density: Large MSA — — — — 9.7 7.3 8.3 8.9 10.4 +1.5 Other MSA — — — — 10.6 12.2 10.9 9.3 9.4 +0.1 Non-MSA — — — — 7.8 11.4 7.2 10.6 9.5 -1.1Parental Education:a
1.0-2.0 (Low) — — — — 12.1 9.4 7.8 7.8 7.9 +0.2 2.5-3.0 — — — — 9.6 10.8 8.8 10.5 9.3 -1.2 3.5-4.0 — — — — 9.5 12.0 10.1 10.0 11.6 +1.6 4.5-5.0 — — — — 9.9 9.7 8.4 9.0 8.6 -0.4 5.5-6.0 (High) — — — — 8.6 8.8 10.1 8.9 10.4 +1.5Race (2-year average):b
White — — — — — 11.7 11.2 10.5 11.3 +0.7 Black — — — — — 3.3 3.1 3.3 3.7 +0.4 Hispanic — — — — — 7.1 7.2 7.7 6.5 -1.2
TABLE D-47Vicodin: Trends in Annual Prevalence of Use by Subgroups for Twelfth Graders
Notes: Level of significance of difference between the two most recent classes: s = .05, ss = .01, sss = .001. ‘—’ indicates data not available.
Any apparent inconsistency between the change estimate and the prevalence-of-use estimates for the two most recent classes is due to rounding error.
Source: The Monitoring the Future Study, the University of Michigan.
Percentage who used in last twelve monthsClass of: ’05–’06
change
Data based on two of six forms in 2002–05; N is two-sixths of N indicated in Table D-108. Data based on three of six forms in 2006; N is one-half of N indicated in Table D-108.
See Table D-108 for the number of subgroup cases. See Appendix B for definition of variables in table.
For the data beginning in 2005, see the race/ethnicity note at the end of Appendix D.
aParental education is an average score of mother’s education and father’s education. See Appendix B for details.bTo derive percentages for each racial subgroup, data for the specified year and the previous year have been combined to increase subgroup sample sizes and thus provide more stable estimates.
Caution: Limited sample sizes (see “Notes” above). Use caution in interpreting subgroup trends.
327

1991 1992 1993 1994 1995 1996 1997 1998 1999 2000 2001 2002 2003 2004 2005 2006Approx. N = 17,500 18,600 18,300 17,300 17,500 17,800 18,600 18,100 16,700 16,700 16,200 15,100 16,500 17,000 16,800 16,500
Total 6.2 6.5 7.2 7.9 8.7 9.1 8.1 7.2 6.9 6.5 6.7 5.5 5.5 4.9 4.9 4.7 -0.3Gender: Male 5.5 5.2 5.6 6.5 7.0 6.7 6.6 5.6 5.6 5.1 5.7 4.8 4.4 3.7 3.5 3.5 0.0 Female 6.9 7.9 8.8 9.3 10.3 11.3 9.6 8.7 8.2 7.7 7.5 6.2 6.5 6.1 6.2 5.7 -0.6College Plans: None or under 4 years 11.6 12.9 14.6 14.5 17.1 15.5 14.1 15.4 14.0 14.2 12.0 12.2 12.4 8.9 11.2 10.7 -0.5 Complete 4 years 5.4 5.7 6.3 7.0 7.6 8.3 7.5 6.3 6.2 5.7 6.1 4.8 4.8 4.5 4.3 4.1 -0.2Region: Northeast 5.1 4.3 5.9 6.9 7.3 7.6 6.5 5.5 5.6 5.0 5.5 3.4 4.1 2.8 3.5 2.2 -1.3 North Central 7.1 8.0 7.3 7.8 10.6 10.8 9.3 7.2 8.3 7.8 7.1 5.9 5.9 5.1 5.0 5.3 +0.3 South 6.1 6.6 7.3 8.3 8.6 8.7 8.1 8.4 7.5 7.0 8.1 6.7 6.4 5.7 5.8 5.6 -0.1 West 6.0 6.6 8.6 8.4 7.9 9.1 8.3 6.7 5.4 5.4 4.6 4.7 4.6 4.9 4.6 4.3 -0.3Population Density: Large MSA 5.8 4.8 5.6 6.6 7.2 7.9 6.4 5.4 5.2 5.2 5.0 4.2 3.9 4.0 3.6 3.9 +0.3 Other MSA 6.2 7.5 8.2 8.8 8.9 10.0 8.1 7.4 6.8 6.4 7.6 5.9 5.5 5.4 5.8 4.8 -0.9 Non-MSA 6.7 7.0 7.5 7.5 10.1 8.9 9.9 8.8 9.3 8.5 6.9 6.3 7.5 5.0 5.2 5.4 +0.2Parental Education:b
1.0-2.0 (Low) 8.3 8.4 10.2 11.2 11.8 10.1 9.6 11.2 8.9 9.7 7.4 6.3 8.4 9.7 8.3 6.5 -1.8 2.5-3.0 6.6 7.3 8.2 9.0 10.6 9.9 9.2 8.1 7.8 8.1 8.2 7.3 7.4 5.2 6.6 6.0 -0.6 3.5-4.0 6.7 7.4 7.8 8.5 10.1 10.3 8.9 7.7 8.2 6.8 7.8 5.7 5.9 5.6 5.6 5.0 -0.5 4.5-5.0 5.3 5.5 6.4 6.6 6.8 8.6 7.5 6.2 5.6 5.2 5.9 4.9 4.3 4.2 3.7 4.2 +0.5 5.5-6.0 (High) 5.7 5.4 5.3 5.7 6.4 8.7 7.3 6.4 5.8 5.2 4.5 4.3 3.9 3.5 3.1 3.6 +0.5Race (2-year average):c
White — 6.8 7.4 8.1 9.3 10.2 9.9 9.0 8.4 8.0 7.8 7.2 6.4 5.9 5.4 5.3 -0.1 Black — 3.3 3.4 3.9 3.9 3.4 3.0 2.8 2.7 2.4 2.3 2.7 2.5 2.1 2.2 2.0 -0.2 Hispanic — 7.2 7.7 8.6 8.7 8.6 8.1 7.2 7.0 6.8 6.6 5.9 5.0 5.4 5.3 4.5 -0.8
TABLE D-48
more stable estimates. For the data beginning in 2005, see the race/ethnicity note at the end of Appendix D.
Percentage who used in last twelve months a
’05–’06change
aOnly drug use not under a doctor's orders is included here.bParental education is an average score of mother’s education and father’s education. See Appendix B for details.cTo derive percentages for each racial subgroup, data for the specified year and the previous year have been combined to increase subgroup sample sizes and thus provide
Amphetamines: Trends in Annual Prevalence of Use by Subgroups for Eighth Graders
Notes: Level of significance of difference between the two most recent classes: s = .05, ss = .01, sss = .001. ‘—’ indicates data not available.
Any apparent inconsistency between the change estimate and the prevalence-of-use estimates for the two most recent classes is due to rounding error.
See Table D-106 for the number of subgroup cases. See Appendix B for definition of variables in table.
Source: The Monitoring the Future Study, the University of Michigan.
328

1991 1992 1993 1994 1995 1996 1997 1998 1999 2000 2001 2002 2003 2004 2005 2006Approx. N = 14,800 14,800 15,300 15,800 17,000 15,600 15,500 15,000 13,600 14,300 14,000 14,300 15,800 16,400 16,200 16,200
Total 8.2 8.2 9.6 10.2 11.9 12.4 12.1 10.7 10.4 11.1 11.7 10.7 9.0 8.5 7.8 7.9 +0.1Gender: Male 7.0 7.0 8.2 8.6 9.6 10.5 10.3 9.0 9.2 10.3 10.6 9.6 7.8 7.3 6.6 6.7 +0.1 Female 9.3 9.3 10.9 11.7 14.1 14.2 13.9 12.3 11.5 11.8 12.7 11.8 10.1 9.6 9.0 8.9 0.0College Plans: None or under 4 years 13.4 14.4 15.5 16.6 19.9 20.3 19.3 17.9 16.3 18.2 20.4 17.5 15.7 14.8 13.7 14.8 +1.1 Complete 4 years 7.1 6.9 8.4 8.9 10.6 11.1 10.9 9.5 9.5 10.0 10.3 9.7 7.9 7.6 7.0 7.0 0.0Region: Northeast 6.1 5.4 7.8 8.7 9.8 11.5 10.7 11.0 12.1 9.8 10.5 9.3 7.4 8.5 7.4 6.7 -0.7 North Central 10.3 9.4 9.5 10.5 13.3 14.0 11.0 9.8 10.3 11.1 10.7 10.4 9.7 8.2 8.5 8.7 +0.2 South 8.1 8.7 10.9 11.2 12.8 12.6 14.2 12.6 10.8 12.0 14.0 12.2 10.2 9.6 8.6 8.5 -0.2 West 7.7 8.4 9.5 9.4 10.6 10.6 11.1 8.5 8.2 10.9 9.9 9.6 8.1 7.3 5.8 7.1 +1.4Population Density: Large MSA 7.5 6.7 7.6 8.0 9.2 10.5 9.9 8.9 9.3 10.7 9.8 9.8 6.2 6.2 6.5 6.8 +0.4 Other MSA 7.9 8.0 9.5 10.8 12.8 12.8 11.5 10.3 10.6 9.9 11.1 11.0 9.5 9.6 8.0 8.3 +0.2 Non-MSA 9.3 10.0 11.6 11.2 13.3 13.7 15.5 13.8 11.5 13.6 15.1 11.2 12.2 9.2 9.0 8.7 -0.3Parental Education:b
1.0-2.0 (Low) 10.0 11.9 12.3 10.8 14.3 15.1 12.2 12.6 10.7 13.3 12.3 13.1 10.9 9.2 8.9 9.3 +0.3 2.5-3.0 9.7 8.9 10.5 11.6 14.2 13.0 14.1 12.8 11.3 12.9 13.6 12.8 11.2 9.9 8.9 9.0 +0.1 3.5-4.0 7.9 8.4 10.5 11.1 12.4 14.1 13.5 11.1 11.2 12.2 12.6 11.1 9.9 10.1 8.1 9.1 +1.0 4.5-5.0 7.4 6.6 7.5 8.9 10.7 10.7 10.6 9.0 9.8 9.7 10.5 9.5 7.6 7.2 7.4 6.6 -0.9 5.5-6.0 (High) 6.9 6.9 8.3 7.3 8.8 10.1 9.2 9.4 9.8 8.8 9.2 8.1 6.4 6.3 6.6 6.8 +0.2Race (2-year average):c
White — 9.4 10.1 11.0 12.4 13.9 14.2 13.6 12.6 12.7 13.4 13.4 12.2 10.6 9.5 9.2 -0.3 Black — 2.8 3.0 4.0 4.0 3.4 3.1 2.9 2.8 2.5 2.9 3.5 2.8 2.7 3.0 2.8 -0.3 Hispanic — 6.2 7.0 7.7 8.9 10.3 9.8 8.9 8.8 9.1 8.3 7.9 7.7 7.3 7.3 6.3 -1.0Source: The Monitoring the Future Study, the University of Michigan.
cTo derive percentages for each racial subgroup, data for the specified year and the previous year have been combined to increase subgroup sample sizes and thus provide
more stable estimates. For the data beginning in 2005, see the race/ethnicity note at the end of Appendix D.
TABLE D-49
aOnly drug use not under a doctor's orders is included here.bParental education is an average score of mother’s education and father’s education. See Appendix B for details.
Amphetamines: Trends in Annual Prevalence of Use by Subgroups for Tenth Graders
Notes: Level of significance of difference between the two most recent classes: s = .05, ss = .01, sss = .001. ‘—’ indicates data not available.
Any apparent inconsistency between the change estimate and the prevalence-of-use estimates for the two most recent classes is due to rounding error.
See Table D-107 for the number of subgroup cases. See Appendix B for definition of variables in table.
Percentage who used in last twelve months a
’05–’06change
329

1975 1976 1977 1978 1979 1980 1981 1982 1983 1984 1985 1986 1987 1988 1989 1990Approx. N = 9,400 15,400 17,100 17,800 15,500 15,900 17,500 17,700 16,300 15,900 16,000 15,200 16,300 16,300 16,700 15,200
Total 16.2 15.8 16.3 17.1 18.3 20.8 26.0 20.3 17.9 17.7 15.8 13.4 12.2 10.9 10.8 9.1Gender: Male 15.6 15.8 16.0 16.9 18.4 19.7 24.8 19.6 17.2 16.8 14.9 12.7 11.8 10.8 11.1 9.4 Female 16.5 15.4 16.4 17.1 17.8 21.8 26.9 20.3 17.9 18.2 16.4 13.8 12.4 10.9 10.5 8.6College Plans: None or under 4 years — 19.3 20.5 20.0 21.8 25.8 30.9 23.7 20.9 22.2 19.7 17.7 16.0 13.9 15.1 12.6 Complete 4 years — 11.9 11.5 13.7 14.5 16.5 22.3 16.8 14.5 14.2 13.3 10.9 10.2 9.5 9.1 7.4Region: Northeast 16.5 14.7 16.8 19.6 22.0 22.0 28.8 21.5 17.9 19.0 16.8 12.6 10.4 8.4 9.0 6.3 North Central 18.7 17.8 19.0 18.2 18.3 22.2 30.1 24.1 20.4 20.3 17.3 15.2 13.5 12.2 13.3 10.7 South 12.6 13.7 13.2 14.0 14.0 17.7 19.6 16.4 15.4 15.1 12.8 11.5 11.5 10.8 9.9 8.9 West 18.5 17.2 16.0 17.8 20.7 22.1 26.6 18.7 18.2 16.9 17.3 15.0 13.4 11.8 11.1 10.2Population Density: Large MSA 19.6 15.4 15.3 17.7 19.5 21.9 28.0 21.6 18.1 17.7 15.0 11.2 10.9 8.8 7.1 6.5 Other MSA 15.5 16.3 17.1 17.5 18.9 20.8 25.5 20.7 19.6 17.1 15.7 14.2 11.9 11.9 11.4 9.6 Non-MSA 14.8 15.4 15.9 16.0 16.6 19.9 25.1 18.8 15.6 18.5 16.6 14.1 14.0 11.3 13.3 10.6Parental Education:b
1.0-2.0 (Low) 15.7 13.4 14.5 14.9 16.0 19.1 22.3 18.7 15.7 17.1 14.5 11.9 11.9 9.8 10.4 7.6 2.5-3.0 16.7 16.9 17.4 17.3 18.4 22.2 26.7 21.9 19.6 19.2 17.0 15.2 13.3 11.1 11.7 9.7 3.5-4.0 14.9 16.6 16.1 18.2 19.6 21.5 26.9 21.7 19.4 18.5 17.2 14.3 12.6 11.8 12.3 10.6 4.5-5.0 14.5 16.8 15.9 16.9 17.1 20.0 26.2 19.1 18.9 15.9 15.1 12.0 11.7 10.3 9.4 8.1 5.5-6.0 (High) 12.0 14.6 16.0 17.2 20.4 17.9 26.8 20.5 16.1 14.0 10.9 10.1 10.4 10.0 9.1 7.3Race (2-year average):c
White — — 17.3 18.2 19.2 21.3 26.4 23.6 22.3 20.5 18.9 16.4 14.3 13.0 12.4 11.4 Black — — 5.3 4.7 4.2 5.3 5.8 6.0 5.7 4.7 4.3 4.0 3.8 3.9 3.6 3.1 Hispanic — — 12.3 12.2 12.8 14.5 17.5 12.3 11.5 13.2 14.6 10.8 8.7 9.6 9.0 7.0Source: The Monitoring the Future Study, the University of Michigan.
Notes: Level of significance of difference between the two most recent classes: s = .05, ss = .01, sss = .001. ‘—’ indicates data not available.
Any apparent inconsistency between the change estimate and the prevalence-of-use estimates for the two most recent classes is due to rounding error.
See Table D-108 for the number of subgroup cases. See Appendix B for definition of variables in table.
TABLE D-50Amphetamines: Trends in Annual Prevalence of Use by Subgroups for Twelfth Graders
Percentage who used in last twelve months a
Class of: Cont'd
330

1991 1992 1993 1994 1995 1996 1997 1998 1999 2000 2001 2002 2003 2004 2005 2006Approx. N = 15,000 15,800 16,300 15,400 15,400 14,300 15,400 15,200 13,600 12,800 12,800 12,900 14,600 14,600 14,700 14,200
Total 8.2 7.1 8.4 9.4 9.3 9.5 10.2 10.1 10.2 10.5 10.9 11.1 9.9 10.0 8.6 8.1 -0.5Gender: Male 8.3 7.2 8.2 9.2 9.5 9.6 10.1 10.3 10.6 10.4 10.9 11.3 9.8 9.9 9.1 7.4 -1.6 s Female 7.9 6.9 8.5 9.4 8.9 8.8 10.2 9.8 9.6 10.5 10.6 10.7 9.5 9.9 7.9 8.5 +0.7College Plans: None or under 4 years 11.0 9.7 11.0 13.4 12.3 12.8 14.1 13.6 12.7 13.9 14.4 14.8 14.4 13.3 11.5 10.6 -0.8 Complete 4 years 7.0 6.1 7.6 8.0 8.3 8.4 8.9 9.0 9.5 9.6 9.8 10.1 8.4 8.9 7.8 7.5 -0.3Region: Northeast 6.5 6.2 8.1 7.4 9.6 10.4 11.1 9.0 9.9 10.6 12.0 11.5 9.7 9.5 7.4 8.5 +1.1 North Central 10.1 8.4 8.9 12.0 9.5 10.0 10.8 11.0 10.5 10.4 12.7 11.3 10.3 10.2 10.3 7.6 -2.7 s South 7.9 6.7 8.3 9.0 9.2 9.1 9.8 10.4 10.8 10.2 9.5 11.7 9.7 10.3 9.4 8.8 -0.7 West 7.8 6.9 8.3 8.4 8.9 8.3 9.1 9.6 8.8 10.9 9.7 9.6 9.7 9.5 6.1 7.0 +0.8Population Density: Large MSA 6.2 6.0 6.5 7.8 9.1 7.9 8.9 9.0 7.0 8.3 10.6 10.7 7.5 8.0 7.8 8.7 +0.9 Other MSA 8.4 6.7 8.5 9.4 8.5 8.9 9.5 9.9 10.8 10.9 10.8 11.0 10.5 10.6 8.9 7.6 -1.3 Non-MSA 9.5 9.0 9.8 10.9 10.8 11.9 13.0 12.2 12.4 12.4 11.4 12.1 11.7 11.1 8.9 8.2 -0.8Parental Education:b
1.0-2.0 (Low) 9.5 7.0 9.0 10.4 9.9 8.1 9.8 9.7 9.9 11.0 8.9 8.1 10.6 7.5 6.1 8.2 +2.1 2.5-3.0 9.1 7.7 8.6 10.3 9.9 10.5 10.3 10.6 11.3 11.0 12.2 11.4 9.9 11.0 9.2 8.2 -1.0 3.5-4.0 8.9 7.7 9.1 9.4 9.1 9.3 10.8 11.4 10.8 10.6 11.6 12.3 10.7 12.3 9.5 8.9 -0.6 4.5-5.0 6.5 6.3 8.0 9.5 9.2 8.9 9.4 9.4 9.7 10.3 10.7 11.1 9.4 8.2 8.5 7.8 -0.7 5.5-6.0 (High) 5.7 5.8 7.6 7.1 8.1 9.1 10.2 8.7 8.4 10.2 8.7 10.2 7.7 8.4 7.4 7.0 -0.4Race (2-year average):c
White 9.8 8.8 9.0 10.4 10.7 10.5 11.4 12.1 11.9 11.9 12.6 13.2 12.4 11.6 11.0 9.9 -1.1 Black 2.7 2.2 2.3 3.4 3.4 2.9 2.8 2.8 2.5 2.6 3.0 2.9 2.8 2.4 2.4 2.6 +0.2 Hispanic 6.1 6.0 6.2 6.4 7.1 7.8 7.3 7.0 7.6 9.2 9.2 7.9 6.8 7.0 6.7 6.4 -0.2
cTo derive percentages for each racial subgroup, data for the specified year and the previous year have been combined to increase subgroup sample sizes and thus provide
more stable estimates. For the data beginning in 2005, see the race/ethnicity note at the end of Appendix D.
’05–’06change
drug use not under a doctor’s orders is included here.bParental education is an average score of mother’s education and father’s education. See Appendix B for details.
Amphetamines: Trends in Annual Prevalence of Use by Subgroups for Twelfth GradersTABLE D-50 (cont'd)
aBeginning in 1982 the question about amphetamine use was revised to get respondents to exclude the inappropriate reporting of nonprescription amphetamines. The
prevalence-of-use rate dropped slightly as a result of this methodological change. (In 1982 and 1983, these data were based on three of the five questionnaire forms.) Only
Percentage who used in last twelve months a
Class of:
331

1991–99 2000 2001 2002 2003 2004 2005 2006 1991–99 2000 2001 2002 2003 2004 2005 2006Approx. N = — — 16,200 15,100 16,500 17,000 16,800 16,500 — — 14,000 14,300 15,800 16,400 16,200 16,200
Total — — 2.9 2.8 2.6 2.5 2.4 2.6 +0.2 — — 4.8 4.8 4.1 3.4 3.4 3.6 +0.2Gender: Male — — 3.2 3.2 2.9 2.6 2.4 2.7 +0.3 — — 5.2 4.9 4.2 3.6 3.2 3.7 +0.4 Female — — 2.6 2.5 2.3 2.4 2.4 2.5 +0.1 — — 4.3 4.6 3.8 3.0 3.5 3.7 +0.1College Plans: None or under 4 years — — 8.1 7.7 6.8 8.8 7.5 9.0 +1.5 — — 7.2 10.2 11.0 5.5 6.7 9.1 +2.4 Complete 4 years — — 2.4 2.2 2.1 1.8 1.8 1.9 +0.2 — — 4.3 3.8 2.9 3.0 2.9 2.8 -0.1Region: Northeast — — 1.5 2.8 1.7 1.6 2.0 2.0 0.0 — — 5.5 3.6 3.8 4.5 4.1 3.0 -1.1 North Central — — 3.0 3.0 2.9 2.4 1.9 3.2 +1.3 — — 4.6 4.8 4.2 2.7 4.8 4.0 -0.8 South — — 3.5 2.8 2.9 3.0 3.0 2.5 -0.5 — — 5.3 5.2 4.2 3.8 3.0 3.4 +0.4 West — — 2.9 2.5 2.2 2.5 2.1 2.7 +0.6 — — 3.1 5.1 3.9 2.4 1.4 4.2 +2.8 ssPopulation Density: Large MSA — — 2.2 2.3 2.3 1.7 1.5 2.3 +0.8 — — 4.3 3.6 4.0 2.6 4.0 2.8 -1.2 Other MSA — — 2.9 3.1 2.8 3.0 3.4 3.0 -0.4 — — 4.6 5.8 3.7 3.6 3.3 4.1 +0.8 Non-MSA — — 3.5 2.8 2.4 2.4 1.7 2.3 +0.5 — — 5.8 4.3 5.1 3.7 2.8 3.7 +0.9Parental Education:a
1.0-2.0 (Low) — — 4.8 5.3 2.5 4.2 5.2 6.5 +1.3 — — 5.0 7.7 4.2 4.8 3.3 3.9 +0.6 2.5-3.0 — — 3.3 4.0 2.8 2.9 2.7 3.1 +0.4 — — 5.4 5.9 5.0 3.4 4.4 3.8 -0.6 3.5-4.0 — — 3.5 3.3 3.3 2.7 2.7 2.6 0.0 — — 5.0 4.2 4.1 3.0 2.6 3.6 +1.0 4.5-5.0 — — 2.4 1.5 1.8 2.1 1.5 2.0 +0.5 — — 4.2 3.6 3.7 2.9 4.0 3.4 -0.5 5.5-6.0 (High) — — 2.1 1.7 2.1 1.9 1.6 1.2 -0.5 — — 4.6 4.7 3.3 3.7 2.8 4.0 +1.2Race (2-year average):b
White — — — 3.0 2.8 2.7 2.5 2.6 +0.1 — — — 5.5 4.8 4.1 3.9 3.9 0.0 Black — — — 1.0 1.3 1.5 1.6 1.8 +0.1 — — — 1.8 2.5 1.9 1.0 1.5 +0.5 Hispanic — — — 3.8 2.7 2.5 3.3 3.1 -0.3 — — — 3.1 4.4 3.6 2.2 2.1 -0.1
’05–’06change
TABLE D-51
Percentage who used in last twelve months8th Graders 10th Graders
’05–’06
Ritalin: Trends in Annual Prevalence of Use by Subgroups for Eighth and Tenth Graders
change
Source: The Monitoring the Future Study, the University of Michigan.
Notes: Level of significance of difference between the two most recent classes: s = .05, ss = .01, sss = .001. ‘—’ indicates data not available. Any apparent inconsistency between the
See Appendix B for definition of variables in table. Data based on one of four forms; N is one-third of N indicated in Tables D-106 and D-107.
change estimate and the prevalence-of-use estimates for the two most recent classes is due to rounding error. See Tables D-106 and D-107 for the number of subgroup cases.
Caution: Limited sample sizes (see “Notes” above). Use caution in interpreting subgroup trends.aParental education is an average score of mother’s education and father’s education. See Appendix B for details.bTo derive percentages for each racial subgroup, data for the specified year and the previous year have been combined to increase subgroup sample sizes and thus provide more stable
estimates. For the data beginning in 2005, see the race/ethnicity note at the end of Appendix D.
332

1975–79 1980–89 1990–99 2000 2001 2002 2003 2004 2005 2006Approx. N = — — — — 12,800 12,900 14,600 14,600 14,700 14,200
Total — — — — 5.1 4.0 4.0 5.1 4.4 4.4 0.0Gender: Male — — — — 6.0 5.1 5.5 6.0 5.4 4.5 -0.9 Female — — — — 4.1 2.8 2.6 4.0 3.3 3.8 +0.5College Plans: None or under 4 years — — — — 6.4 7.7 4.4 6.8 5.3 5.3 +0.1 Complete 4 years — — — — 4.7 3.0 3.7 4.4 4.1 4.0 -0.1Region: Northeast — — — — 4.7 4.5 4.6 4.1 4.7 6.1 +1.4 North Central — — — — 7.4 5.4 3.8 6.0 5.3 3.8 -1.5 South — — — — 4.1 3.4 3.5 4.7 4.6 4.3 -0.3 West — — — — 3.8 2.6 4.4 5.5 2.7 3.8 +1.0Population Density: Large MSA — — — — 7.2 3.9 3.2 4.2 4.1 5.4 +1.3 Other MSA — — — — 3.7 4.0 5.1 5.6 5.1 3.9 -1.2 Non-MSA — — — — 5.4 4.0 2.9 4.9 3.4 3.8 +0.4Parental Education:a
1.0-2.0 (Low) — — — — 5.6 5.3 3.1 5.2 5.5 5.2 -0.2 2.5-3.0 — — — — 4.5 4.2 3.7 4.2 4.2 3.6 -0.6 3.5-4.0 — — — — 5.0 3.9 4.8 6.3 4.1 4.6 +0.5 4.5-5.0 — — — — 4.7 3.5 3.5 4.6 3.9 4.7 +0.8 5.5-6.0 (High) — — — — 6.6 3.9 4.0 4.5 6.0 4.6 -1.4Race (2-year average):b
White — — — — — 5.4 4.6 5.2 5.3 4.9 -0.4 Black — — — — — 0.8 1.2 1.2 2.0 2.3 +0.3 Hispanic — — — — — 3.1 3.3 3.6 3.6 3.9 +0.3
Source: The Monitoring the Future Study, the University of Michigan.
For the data beginning in 2005, see the race/ethnicity note at the end of Appendix D.
TABLE D-52Ritalin: Trends in Annual Prevalence of Use by Subgroups for Twelfth Graders
Percentage who used in last twelve monthsClass of:
bTo derive percentages for each racial subgroup, data for the specified year and the previous year have been combined to increase subgroup sample sizes and thus provide more stable estimates.
’05–’06change
Notes: Level of significance of difference between the two most recent classes: s = .05, ss = .01, sss = .001. ‘—’ indicates data not available.
Any apparent inconsistency between the change estimate and the prevalence-of-use estimates for the two most recent classes is due to rounding error.
See Table D-108 for the number of subgroup cases. See Appendix B for definition of variables in table. Data based on two of six forms; N is two-sixths of N indicated in Table D-108.
aParental education is an average score of mother’s education and father’s education. See Appendix B for details.
Caution: Limited sample sizes (see “Notes” above). Use caution in interpreting subgroup trends.
333

1991 1992 1993 1994 1995 1996 1997 1998 1999 2000 2001 2002 2003 2004 2005 2006Approx. N = — — — — — — — — 16,700 16,700 16,200 15,100 16,500 17,000 16,800 16,500
Total — — — — — — — — 3.2 2.5 2.8 2.2 2.5 1.5 1.8 1.8 0.0Gender: Male — — — — — — — — 3.1 2.2 2.5 2.0 2.0 1.1 1.7 1.4 -0.3 Female — — — — — — — — 3.2 2.8 3.0 2.4 3.0 1.7 1.9 2.3 +0.4College Plans: None or under 4 years — — — — — — — — 7.4 6.8 6.6 6.6 7.9 6.6 6.8 6.3 -0.6 Complete 4 years — — — — — — — — 2.7 2.0 2.3 1.7 2.0 1.0 1.2 1.3 +0.2Region: Northeast — — — — — — — — 1.6 2.0 1.2 0.8 1.7 1.0 0.6 0.7 +0.1 North Central — — — — — — — — 4.4 3.0 3.2 2.5 3.5 2.1 2.0 1.7 -0.3 South — — — — — — — — 3.4 2.4 3.4 2.8 2.4 1.4 2.0 1.6 -0.4 West — — — — — — — — 2.8 2.5 2.4 2.0 2.4 1.6 2.1 3.1 +1.0Population Density: Large MSA — — — — — — — — 2.2 2.1 1.6 1.3 2.0 1.5 1.3 1.5 +0.2 Other MSA — — — — — — — — 3.6 2.6 3.4 2.5 2.4 1.7 2.0 2.1 +0.1 Non-MSA — — — — — — — — 3.5 3.0 2.8 2.7 3.4 1.2 2.1 1.8 -0.3Parental Education:a
1.0-2.0 (Low) — — — — — — — — 6.3 5.0 4.4 4.3 4.2 4.4 4.1 3.9 -0.2 2.5-3.0 — — — — — — — — 4.3 3.1 4.0 3.0 3.4 1.3 1.5 1.8 +0.3 3.5-4.0 — — — — — — — — 3.3 2.4 3.0 2.0 2.5 1.8 2.9 2.2 -0.7 4.5-5.0 — — — — — — — — 1.9 1.3 1.6 1.9 1.6 1.0 0.9 1.2 +0.2 5.5-6.0 (High) — — — — — — — — 3.2 2.2 1.2 1.1 2.3 0.9 0.7 1.7 +1.1Race (2-year average):b
White — — — — — — — — — 3.2 3.1 2.8 2.7 2.2 1.6 1.6 0.0 Black — — — — — — — — — 1.1 0.8 0.6 0.8 0.6 0.5 0.8 +0.3 Hispanic — — — — — — — — — 4.0 3.3 3.2 3.2 3.0 2.8 2.8 0.0
TABLE D-53
Percentage who used in last twelve months’05–’06
more stable estimates. For the data beginning in 2005, see the race/ethnicity note at the end of Appendix D.
Source: The Monitoring the Future Study, the University of Michigan.
bTo derive percentages for each racial subgroup, data for the specified year and the previous year have been combined to increase subgroup sample sizes and thus provide
Methamphetamine: Trends in Annual Prevalence of Use by Subgroups for Eighth Graders
subgroup cases. See Appendix B for definition of variables in table. Data based on one of four forms; N is one-third of N indicated in Table D-106.
Caution: Limited sample sizes (see “Notes” above). Use caution in interpreting subgroup trends.aParental education is an average score of mother’s education and father’s education. See Appendix B for details.
Notes: Level of significance of difference between the two most recent classes: s = .05, ss = .01, sss = .001. ‘—’ indicates data not available. Any apparent inconsistency
between the change estimate and the prevalence-of-use estimates for the two most recent classes is due to rounding error. See Table D-106 for the number of
change
334

1991 1992 1993 1994 1995 1996 1997 1998 1999 2000 2001 2002 2003 2004 2005 2006Approx. N = — — — — — — — — 14,000 13,600 14,000 14,300 15,800 16,400 16,200 16,200
Total — — — — — — — — 4.6 4.0 3.7 3.9 3.3 3.0 2.9 1.8 -1.0 ssGender: Male — — — — — — — — 4.5 4.5 3.8 3.9 3.0 2.7 2.6 1.7 -1.0 s Female — — — — — — — — 4.7 3.6 3.5 3.6 3.7 3.3 3.0 2.0 -1.1 sCollege Plans: None or under 4 years — — — — — — — — 9.1 8.8 7.0 9.1 9.4 6.0 7.3 5.8 -1.5 Complete 4 years — — — — — — — — 3.9 3.3 3.1 3.0 2.3 2.6 2.2 1.3 -0.9 ssRegion: Northeast — — — — — — — — 5.1 4.1 2.3 1.5 2.1 2.5 3.0 1.5 -1.5 s North Central — — — — — — — — 4.6 4.0 3.8 3.0 3.4 2.2 3.4 1.7 -1.7 ss South — — — — — — — — 4.0 3.8 4.0 4.6 3.8 2.9 2.2 2.3 +0.1 West — — — — — — — — 5.1 4.4 4.6 5.8 3.8 4.7 3.0 1.7 -1.3Population Density: Large MSA — — — — — — — — 3.8 4.4 4.0 3.1 2.3 2.7 2.9 2.2 -0.7 Other MSA — — — — — — — — 4.8 3.4 3.6 4.4 3.8 3.4 3.0 1.5 -1.5 ss Non-MSA — — — — — — — — 5.2 4.8 3.6 3.7 3.7 2.5 2.5 2.1 -0.4Parental Education:a
1.0-2.0 (Low) — — — — — — — — 7.2 7.0 5.6 6.2 7.3 4.5 4.2 3.8 -0.4 2.5-3.0 — — — — — — — — 4.2 4.3 4.6 4.9 4.1 3.7 3.8 2.7 -1.1 3.5-4.0 — — — — — — — — 4.8 4.3 3.2 3.7 3.2 3.3 2.0 1.4 -0.6 4.5-5.0 — — — — — — — — 4.8 3.5 3.6 2.4 2.2 2.3 3.2 1.4 -1.9 ss 5.5-6.0 (High) — — — — — — — — 3.3 3.5 2.5 4.0 2.1 1.7 1.3 1.3 -0.1Race (2-year average):b
White — — — — — — — — — 4.7 4.1 4.1 4.2 3.4 2.9 2.4 -0.6 Black — — — — — — — — — 0.4 1.0 1.1 0.6 0.8 1.1 1.0 0.0 Hispanic — — — — — — — — — 3.9 3.0 4.4 4.6 4.6 5.0 3.3 -1.7
’05–’06change
more stable estimates. For the data beginning in 2005, see the race/ethnicity note at the end of Appendix D.
TABLE D-54
Percentage who used in last twelve months
Source: The Monitoring the Future Study, the University of Michigan.
bTo derive percentages for each racial subgroup, data for the specified year and the previous year have been combined to increase subgroup sample sizes and thus provide
Methamphetamine: Trends in Annual Prevalence of Use by Subgroups for Tenth Graders
subgroup cases. See Appendix B for definition of variables in table. Data based on one of four forms; N is one-third of N indicated in Tables D-107.
Caution: Limited sample sizes (see “Notes” above). Use caution in interpreting subgroup trends.aParental education is an average score of mother’s education and father’s education. See Appendix B for details.
Notes: Level of significance of difference between the two most recent classes: s = .05, ss = .01, sss = .001. ‘—’ indicates data not available. Any apparent inconsistency
between the change estimate and the prevalence-of-use estimates for the two most recent classes is due to rounding error. See Tables D-107 for the number of
335

1975–79 1980–89 1990–98 1999 2000 2001 2002 2003 2004 2005 2006Approx. N = — — — 13,600 12,800 12,800 12,900 14,600 14,600 14,700 14,200
Total — — — 4.7 4.3 3.9 3.6 3.2 3.4 2.5 2.5 0.0Gender: Male — — — 5.0 4.4 4.3 4.3 3.6 3.7 2.7 2.0 -0.7 Female — — — 4.5 4.2 3.4 3.0 2.9 3.1 2.3 3.0 +0.8College Plans: None or under 4 years — — — 6.8 6.2 6.9 6.5 5.8 6.7 4.9 3.7 -1.2 Complete 4 years — — — 4.0 3.8 3.2 2.7 2.4 2.4 2.0 2.1 +0.1Region: Northeast — — — 3.1 4.5 3.4 1.6 1.8 1.3 0.6 1.4 +0.8 North Central — — — 5.1 4.1 4.7 4.5 4.2 3.3 4.4 1.2 -3.2 sss South — — — 3.9 3.7 3.4 3.0 2.8 4.0 2.2 3.1 +0.9 West — — — 7.1 5.4 4.4 5.4 4.0 4.9 2.7 3.8 +1.1Population Density: Large MSA — — — 4.2 3.6 2.7 2.1 1.8 2.8 1.5 3.4 +1.9 ss Other MSA — — — 4.0 4.9 4.0 4.4 3.0 2.6 2.4 2.0 -0.3 Non-MSA — — — 6.4 4.3 5.3 4.1 5.3 5.5 4.1 2.0 -2.1 sParental Education:a
1.0-2.0 (Low) — — — 6.0 7.7 5.0 3.5 4.3 5.5 4.0 2.7 -1.3 2.5-3.0 — — — 4.8 3.5 4.8 4.9 3.6 4.1 3.0 2.4 -0.6 3.5-4.0 — — — 5.2 3.9 3.8 3.8 3.6 3.1 3.0 2.9 0.0 4.5-5.0 — — — 3.7 4.2 3.1 2.9 2.9 2.8 2.1 2.2 +0.1 5.5-6.0 (High) — — — 4.2 5.5 3.2 3.1 1.0 3.0 1.2 1.2 0.0Race (2-year average):b
White — — — — 4.9 4.6 4.2 3.5 3.5 3.3 2.6 -0.7 Black — — — — 1.1 1.0 0.5 1.4 1.8 0.7 0.4 -0.3 Hispanic — — — — 4.9 4.6 3.9 3.4 3.4 3.4 3.7 +0.3
Source: The Monitoring the Future Study, the University of Michigan.
See Table D-108 for the number of subgroup cases. See Appendix B for definition of variables in table. Data based on two of six forms; N is two-sixths of N indicated in Table D-108.
aParental education is an average score of mother’s education and father’s education. See Appendix B for details.
Caution: Limited sample sizes (see “Notes” above). Use caution in interpreting subgroup trends.
For the data beginning in 2005, see the race/ethnicity note at the end of Appendix D.
TABLE D-55Methamphetamine: Trends in Annual Prevalence of Use by Subgroups for Twelfth Graders
Notes: Level of significance of difference between the two most recent classes: s = .05, ss = .01, sss = .001. ‘—’ indicates data not available.
Any apparent inconsistency between the change estimate and the prevalence-of-use estimates for the two most recent classes is due to rounding error.
Percentage who used in last twelve monthsClass of:
bTo derive percentages for each racial subgroup, data for the specified year and the previous year have been combined to increase subgroup sample sizes and thus provide more stable estimates.
’05–’06change
336

1975–89 1990 1991 1992 1993 1994 1995 1996 1997 1998 1999 2000 2001 2002 2003 2004 2005 2006Approx. N = — 15,200 15,000 15,800 16,300 15,400 15,400 14,300 15,400 15,200 13,600 12,800 12,800 12,900 14,600 14,600 14,700 14,200
Total — 1.3 1.4 1.3 1.7 1.8 2.4 2.8 2.3 3.0 1.9 2.2 2.5 3.1 2.0 2.1 2.3 1.9 -0.5Gender: Male — 1.5 1.9 1.5 1.9 2.2 2.6 3.9 2.6 3.9 2.2 2.5 2.7 3.5 2.5 2.6 2.5 1.5 -1.0 s Female — 1.0 0.9 1.0 1.2 1.3 2.1 1.7 2.1 2.1 1.6 1.9 2.1 2.5 1.5 1.6 2.0 2.2 +0.1College Plans: None or under 4 years — 1.4 1.9 2.2 2.6 2.4 4.3 5.1 3.8 5.0 2.3 3.8 4.2 4.8 2.6 4.4 4.2 3.5 -0.8 Complete 4 years — 1.2 1.2 1.0 1.4 1.5 1.8 2.1 1.9 2.4 1.8 1.7 2.0 2.6 1.9 1.5 1.8 1.3 -0.5Region: Northeast — 1.6 1.1 0.9 1.1 0.9 1.4 3.2 2.8 2.6 1.0 1.0 1.9 2.6 1.3 0.9 1.2 1.0 -0.2 North Central — 1.1 1.4 1.1 1.5 2.3 2.2 2.1 1.9 2.7 1.7 2.8 2.1 2.0 1.0 1.8 2.2 1.0 -1.2 s South — 0.5 1.0 1.0 1.2 1.2 1.8 2.0 1.6 3.1 2.3 2.0 1.7 3.5 2.3 2.3 2.7 2.9 +0.2 West — 2.5 2.2 2.6 3.2 2.8 4.7 4.9 3.7 3.4 2.5 2.9 4.7 4.0 3.4 3.5 3.1 1.9 -1.2Population Density: Large MSA — 1.2 1.3 1.5 2.2 2.0 3.0 4.6 2.9 2.5 1.6 2.3 2.7 2.2 1.9 2.3 2.1 2.2 +0.1 Other MSA — 1.3 1.7 1.3 1.7 1.8 2.0 2.0 2.0 3.3 2.1 1.7 2.3 3.6 2.0 1.4 2.3 1.5 -0.9 Non-MSA — 1.2 0.8 1.2 1.2 1.6 2.3 2.6 2.1 2.8 2.0 3.0 2.5 3.2 2.1 3.2 2.7 2.1 -0.6Parental Education:a
1.0-2.0 (Low) — 1.1 1.0 0.9 1.6 1.0 3.2 3.4 2.2 2.8 3.6 3.2 5.9 3.7 3.7 4.0 2.6 4.2 +1.6 2.5-3.0 — 1.4 1.1 1.1 1.2 3.0 2.6 3.0 2.5 3.2 1.3 1.7 2.4 3.6 1.7 2.7 2.6 2.6 0.0 3.5-4.0 — 1.4 1.2 1.5 2.3 1.6 1.9 2.6 2.2 3.6 2.5 1.9 2.8 2.4 2.2 2.4 3.1 1.4 -1.7 ss 4.5-5.0 — 1.2 1.8 1.4 1.8 1.3 2.5 2.9 2.9 2.6 1.3 2.8 1.5 2.8 1.5 1.0 1.4 1.0 -0.4 5.5-6.0 (High) — 1.1 1.0 1.4 1.3 1.0 2.2 2.5 1.4 1.9 2.1 1.3 2.0 2.8 1.8 0.9 1.1 1.4 +0.3Race (2-year average):b
White — — 1.3 1.3 1.5 1.7 2.0 2.5 2.6 2.9 2.8 2.3 2.4 2.6 2.3 2.0 2.0 1.9 -0.1 Black — — 0.8 1.0 0.8 0.5 0.5 0.3 0.5 1.0 0.7 0.7 1.1 1.6 1.4 0.7 1.0 1.0 -0.1 Hispanic — — 1.3 1.8 2.3 2.1 2.7 4.0 2.8 1.7 1.7 2.4 3.4 3.6 2.5 2.6 3.4 3.3 -0.1Source: The Monitoring the Future Study, the University of Michigan.
For the data beginning in 2005, see the race/ethnicity note at the end of Appendix D.
bTo derive percentages for each racial subgroup, data for the specified year and the previous year have been combined to increase subgroup sizes and thus provide more stable estimates.
’05–’06change
Notes: Level of significance of difference between the two most recent classes: s = .05, ss = .01, sss = .001. ‘—’ indicates data not available.
Any apparent inconsistency between the change estimate and the prevalence-of-use estimates for the two most recent classes is due to rounding error.
See Table D-108 for the number of subgroup cases. See Appendix B for definition of variables in table. Data based on two of six forms; N is two-sixths of N indicated in Table D-108.
aParental education is an average score of mother’s education and father’s education. See Appendix B for details.
Caution: Limited sample sizes (see “Notes” above). Use caution in interpreting subgroup trends.
TABLE D-56Ice (Crystal Methamphetamine): Trends in Annual Prevalence of Use by Subgroups for Twelfth Graders
Percentage who used in last twelve monthsClass of:
337

1975 1976 1977 1978 1979 1980 1981 1982 1983 1984 1985 1986 1987 1988 1989 1990Approx. N = 9,400 15,400 17,100 17,800 15,500 15,900 17,500 17,700 16,300 15,900 16,000 15,200 16,300 16,300 16,700 15,200
Total 10.7 9.6 9.3 8.1 7.5 6.8 6.6 5.5 5.2 4.9 4.6 4.2 3.6 3.2 3.3 3.4Gender: Male 12.3 9.9 10.2 8.4 7.6 7.3 7.2 5.9 5.9 5.5 5.2 4.7 4.0 3.4 3.5 3.8 Female 9.9 9.2 8.4 7.7 7.0 6.0 5.8 5.0 4.2 4.0 3.9 3.8 3.2 3.0 3.0 3.0College Plans: None or under 4 years — 11.6 11.4 9.1 9.3 9.0 8.1 7.4 6.7 6.2 6.2 6.1 4.7 4.1 4.8 4.7 Complete 4 years — 7.3 6.8 6.8 5.2 4.8 5.1 3.8 3.8 3.7 3.6 3.0 3.0 2.7 2.5 2.8Region: Northeast 11.5 10.4 9.2 9.6 9.6 6.9 6.8 5.6 4.7 5.1 5.3 5.2 4.2 2.5 3.2 2.9 North Central 12.8 10.4 10.7 7.9 6.9 7.3 7.5 5.4 6.1 4.9 4.9 4.2 3.3 2.5 3.2 3.5 South 9.9 9.7 9.3 7.8 7.3 7.0 5.5 6.3 5.2 5.2 4.2 4.1 3.7 4.1 3.7 4.0 West 10.0 6.7 6.6 6.6 5.7 5.2 6.5 3.9 4.0 4.2 4.1 3.3 3.2 3.2 2.7 2.9Population Density: Large MSA 11.1 10.2 8.1 8.1 8.3 6.6 6.9 5.3 5.2 4.4 4.4 3.7 3.3 2.8 2.6 2.6 Other MSA 11.3 9.8 9.9 8.2 7.3 6.5 6.4 5.7 5.3 4.9 4.2 4.4 3.6 3.4 3.1 3.6 Non-MSA 9.8 9.0 9.5 8.1 7.0 7.2 6.6 5.5 5.0 5.5 5.4 4.5 3.9 3.2 4.4 3.9Parental Education:b
1.0-2.0 (Low) 10.3 9.1 8.0 7.5 7.8 8.0 6.5 5.8 6.1 4.7 5.0 4.8 3.8 4.3 4.1 3.1 2.5-3.0 10.3 10.2 10.3 8.2 7.3 7.2 6.5 5.7 5.7 5.2 5.3 4.6 3.6 3.1 3.4 3.7 3.5-4.0 9.5 9.6 9.0 8.3 7.4 6.3 6.5 5.1 4.6 5.0 4.4 4.4 3.2 2.9 3.2 3.9 4.5-5.0 10.7 10.1 9.1 7.8 6.6 5.9 6.4 5.0 4.4 4.3 4.1 3.3 3.9 3.3 2.8 3.1 5.5-6.0 (High) 9.0 10.3 8.3 8.0 7.2 5.4 6.8 5.8 3.7 4.0 3.1 3.4 3.6 3.1 3.4 2.9Race (2-year average):c
White — — 10.2 9.3 8.2 7.5 7.2 6.5 5.8 5.5 5.1 4.7 4.2 3.7 3.5 3.7 Black — — 3.3 3.2 2.6 2.5 2.4 2.0 1.7 1.6 1.6 1.6 1.7 1.5 1.1 1.1 Hispanic — — 7.4 5.8 5.8 5.8 5.7 5.1 4.1 4.4 4.6 3.6 2.8 2.8 3.2 2.8
Notes: Level of significance of difference between the two most recent classes: s = .05, ss = .01, sss = .001. ‘—’ indicates data not available.
See Table D-108 for the number of subgroup cases. See Appendix B for definition of variables in table.
Any apparent inconsistency between the change estimate and the prevalence-of-use estimates for the two most recent classes is due to rounding error.
Source: The Monitoring the Future Study, the University of Michigan.
TABLE D-57
Percentage who used in last twelve months a
Class of:
Sedatives (Barbiturates): Trends in Annual Prevalence of Use by Subgroups for Twelfth Graders
Cont'd
338

1991 1992 1993 1994 1995 1996 1997 1998 1999 2000 2001 2002 2003 2004 2005 2006Approx. N = 15,000 15,800 16,300 15,400 15,400 14,300 15,400 15,200 13,600 12,800 12,800 12,900 14,600 14,600 14,700 14,200
Total 3.4 2.8 3.4 4.1 4.7 4.9 5.1 5.5 5.8 6.2 5.7 6.7 6.0 6.5 7.2 6.6 -0.6Gender: Male 3.4 2.9 3.4 4.3 5.1 5.2 5.3 6.3 6.3 6.9 6.3 7.4 6.7 7.0 7.7 6.4 -1.3 Female 3.2 2.6 3.3 3.8 4.2 4.4 4.8 4.8 5.3 5.4 5.1 5.9 5.4 6.0 6.6 6.7 +0.1College Plans: None or under 4 years 4.3 3.9 3.8 5.4 5.9 6.7 6.6 6.9 7.0 7.0 7.1 9.8 9.6 9.3 10.7 10.0 -0.7 Complete 4 years 2.9 2.3 3.2 3.7 4.4 4.3 4.6 5.1 5.5 6.0 5.4 6.0 5.1 5.6 6.3 5.7 -0.7Region: Northeast 2.8 2.7 3.5 4.0 4.1 5.6 5.7 5.5 4.7 5.6 5.3 5.9 4.8 5.4 5.7 5.7 0.0 North Central 3.5 2.7 3.5 4.1 4.5 4.9 4.4 4.8 6.0 5.2 5.6 6.4 5.1 5.9 7.5 6.2 -1.3 South 3.6 3.0 3.6 4.8 5.3 5.4 5.8 6.8 6.8 7.5 6.1 8.4 7.1 7.8 8.5 7.5 -1.0 West 3.3 2.5 2.7 2.8 4.3 3.3 4.2 4.2 4.9 5.7 5.6 5.1 6.5 6.3 5.9 6.2 +0.3Population Density: Large MSA 2.4 2.4 2.6 3.6 4.1 3.6 4.2 4.6 3.7 5.1 5.9 6.5 4.2 5.5 6.1 6.6 +0.5 Other MSA 3.9 2.6 3.1 4.3 4.9 5.4 5.0 5.6 6.2 6.6 6.1 6.7 6.6 7.1 7.5 6.6 -0.9 Non-MSA 3.3 3.4 4.3 4.1 5.0 5.4 6.4 6.8 7.4 6.8 4.9 7.0 7.4 6.6 7.8 6.6 -1.3Parental Education:b
1.0-2.0 (Low) 3.6 3.9 3.8 4.5 4.9 4.8 4.3 6.4 7.5 5.2 6.3 5.1 6.7 6.6 6.2 7.3 +1.2 2.5-3.0 3.7 2.4 3.6 4.5 5.2 4.9 4.9 6.3 6.2 7.1 5.3 7.1 6.5 7.0 8.1 6.5 -1.6 3.5-4.0 3.0 2.8 2.8 4.0 4.6 4.9 6.0 5.6 6.4 5.8 6.1 7.7 7.2 8.0 7.7 7.3 -0.3 4.5-5.0 3.3 2.9 3.4 4.0 4.4 5.0 5.1 5.0 5.0 6.7 5.9 6.3 4.7 5.1 7.0 6.2 -0.8 5.5-6.0 (High) 3.6 2.4 3.8 3.6 4.1 4.6 4.6 5.0 5.1 5.5 5.8 6.6 4.3 5.5 6.3 6.0 -0.4Race (2-year average):c
White 3.8 3.5 3.6 4.3 4.9 5.4 5.9 6.5 6.7 6.9 7.0 7.5 7.6 7.4 7.9 7.9 0.0 Black 1.2 1.1 1.0 1.5 1.6 1.1 1.0 1.4 1.4 1.3 1.5 1.4 1.7 2.4 2.6 2.5 -0.2 Hispanic 2.4 2.2 1.9 2.6 3.5 4.0 3.7 3.3 4.0 5.1 4.7 4.5 4.1 4.7 5.8 5.8 0.0
cTo derive percentages for each racial subgroup, data for the specified year and the previous year have been combined to increase subgroup sample sizes and thus provide
more stable estimates. For the data beginning in 2005, see the race/ethnicity note at the end of Appendix D.
’05–’06change
TABLE D-57 (cont'd)
aOnly drug use not under a doctor’s orders is included here.bParental education is an average score of mother’s education and father’s education. See Appendix B for details.
Percentage who used in last twelve months a
Class of:
Sedatives (Barbiturates): Trends in Annual Prevalence of Use by Subgroups for Twelfth Graders
339

1991 1992 1993 1994 1995 1996 1997 1998 1999 2000 2001b 2002b 2003 2004 2005 2006Approx. N = 17,500 18,600 18,300 17,300 17,500 17,800 18,600 18,100 16,700 16,700 16,200 15,100 16,500 17,000 16,800 16,500
Total 1.8 2.0 2.1 2.4 2.7 3.3 2.9 2.6 2.5 2.6‡ 2.8 2.6 2.7 2.5 2.8 2.6 -0.2Gender: Male 1.5 1.6 1.8 1.9 2.0 2.3 2.6 2.3 2.1 2.1‡ 2.5 2.2 2.2 1.9 2.1 2.2 +0.1 Female 2.1 2.3 2.4 2.8 3.3 4.0 3.2 3.0 2.9 3.1‡ 2.9 2.8 3.0 3.2 3.4 2.9 -0.5College Plans: None or under 4 years 3.9 4.9 3.6 5.1 5.9 6.4 5.8 6.4 5.8 6.8‡ 5.8 6.5 6.3 6.2 6.9 6.0 -1.0 Complete 4 years 1.5 1.5 1.9 2.0 2.3 2.8 2.6 2.2 2.0 2.2‡ 2.5 2.1 2.3 2.1 2.4 2.3 -0.1Region: Northeast 1.0 1.6 1.7 2.5 2.3 2.7 2.5 2.0 2.3 2.2‡ 2.0 1.8 1.9 1.7 1.6 1.3 -0.4 North Central 1.4 1.9 1.3 1.7 2.6 3.5 2.4 2.6 2.6 2.2‡ 2.2 2.4 2.2 2.1 2.8 2.4 -0.4 South 2.6 2.5 2.4 2.6 3.0 3.7 3.3 3.2 2.8 3.2‡ 3.4 3.4 3.5 3.4 3.7 3.6 -0.1 West 1.8 1.6 3.0 2.7 2.4 2.9 3.0 2.3 1.9 2.5‡ 3.2 1.9 2.6 2.2 2.2 2.1 -0.1Population Density: Large MSA 1.8 2.1 1.7 2.5 1.8 3.2 2.1 1.9 1.8 2.5‡ 2.8 2.0 1.8 1.8 2.0 1.9 0.0 Other MSA 1.7 1.8 2.5 2.6 3.2 3.4 3.2 2.6 2.4 2.7‡ 3.1 2.7 2.9 3.1 3.1 2.6 -0.5 Non-MSA 2.2 2.2 1.6 1.9 2.6 3.1 3.2 3.6 3.4 2.7‡ 2.3 2.9 3.4 2.4 3.4 3.5 +0.1Parental Education:c
1.0-2.0 (Low) 3.6 3.8 2.5 3.2 3.9 4.9 4.3 5.5 5.0 5.6‡ 3.7 5.0 3.9 4.7 5.0 5.1 +0.1 2.5-3.0 1.6 2.1 2.5 2.6 2.7 3.5 3.1 2.8 3.3 3.6‡ 3.7 3.6 3.5 2.8 4.3 3.2 -1.1 3.5-4.0 2.0 2.2 2.1 2.6 3.2 3.9 3.2 2.7 2.1 2.6‡ 2.7 2.2 2.8 3.0 3.3 3.1 -0.2 4.5-5.0 1.4 0.9 1.8 2.0 2.2 2.8 2.4 2.4 1.7 1.4‡ 2.7 2.0 2.1 2.0 1.3 1.7 +0.4 5.5-6.0 (High) 1.8 1.9 1.7 2.1 1.6 2.7 2.7 2.1 1.9 2.2‡ 2.1 1.6 1.6 1.7 2.0 1.8 -0.2Race (2-year average):d
White — 2.0 2.0 2.2 2.7 3.2 3.4 3.1 2.9 3.0 3.0‡ 3.0e 2.8 2.8 2.9 3.0 +0.1 Black — 0.9 1.1 1.2 1.2 1.3 1.2 0.9 0.7 0.5 0.5‡ 0.6e 1.0 1.2 1.0 0.8 -0.2 Hispanic — 2.7 3.1 3.4 3.3 3.5 3.5 3.4 3.5 3.5 3.6‡ 3.8e 3.4 3.4 3.5 3.0 -0.4
change
TABLE D-58 Tranquilizers: Trends in Annual Prevalence of Use by Subgroups for Eighth Graders
(Table continued on next page)
Percentage who used in last twelve months a
’05–’06
340

TABLE D-58 (cont'd)
eThe 2002 data comprise half of the 2001 sample data double-weighted and all of the 2002 sample data.
rounding error.
Tranquilizers: Trends in Annual Prevalence of Use by Subgroups for Eighth Graders
Notes: ‘‡’ indicates some change in the question. See relevant footnote. See relevant figure to assess the impact of the wording changes. Level of significance of difference between the two most recent classes: s = .05, ss = .01, sss = .001. ‘—’ indicates data not available. Any apparent inconsistency between the change estimate and the prevalence-of-use estimates for the two most recent classes is due to
Source: The Monitoring the Future Study, the University of Michigan.
sample sizes and thus provide more stable estimates. For the data beginning in 2005, see the race/ethnicity note at the end of Appendix D.
See Table D-106 for the number of subgroup cases. See Appendix B for definition of variables in table.
bIn 2001, for the tranquilizer list of examples, Miltown was replaced with Xanax. The 2001 data are based on the changed forms only; N is one-half of
dTo derive percentages for each racial subgroup, data for the specified year and the previous year have been combined to increase subgroup
N indicated. In 2002 the remaining forms were changed. Beginning in 2002, the data are based on all forms. Data for "any illicit drug other than marijuana" and “hallucinogens” are also affected by these changes and have been treated in a parallel manner. cParental education is an average score of mother’s education and father’s education. See Appendix B for details.
aOnly drug use not under a doctor's orders is included here.
341

1991 1992 1993 1994 1995 1996 1997 1998 1999 2000 2001b 2002b 2003 2004 2005 2006Approx. N = 14,800 14,800 15,300 15,800 17,000 15,600 15,500 15,000 13,600 14,300 14,000 14,300 15,800 16,400 16,200 16,200
Total 3.2 3.5 3.3 3.3 4.0 4.6 4.9 5.1 5.4 5.6‡ 7.3 6.3 5.3 5.1 4.8 5.2 +0.4Gender: Male 2.5 2.7 3.2 3.0 4.0 4.3 4.7 4.7 5.2 5.8‡ 7.9 5.7 4.7 4.7 4.3 5.0 +0.8 Female 3.8 4.3 3.2 3.6 4.0 4.9 5.2 5.4 5.4 5.5‡ 6.8 6.9 5.8 5.5 5.3 5.3 0.0College Plans: None or under 4 years 5.0 6.0 5.8 6.0 7.4 9.4 8.6 8.3 8.6 10.0‡ 13.5 11.6 9.2 9.6 9.6 10.2 +0.6 Complete 4 years 2.8 3.1 2.7 2.8 3.4 3.8 4.3 4.5 4.8 4.9‡ 6.4 5.5 4.7 4.5 4.2 4.5 +0.4Region: Northeast 2.7 2.8 3.4 2.8 2.6 3.9 3.6 5.7 5.5 3.9‡ 6.2 4.6 4.3 5.0 5.0 3.8 -1.2 North Central 2.4 3.0 2.5 2.6 3.2 4.4 3.7 3.4 4.6 5.4‡ 5.6 5.5 4.5 3.5 3.3 4.2 +0.9 South 4.2 4.5 3.9 4.2 5.1 5.7 7.3 6.6 6.0 6.9‡ 9.6 8.1 7.5 7.3 6.6 6.9 +0.3 West 2.9 3.2 3.2 3.6 4.3 3.6 3.7 4.1 4.9 5.4‡ 6.7 5.8 4.1 4.1 3.8 5.3 +1.5Population Density: Large MSA 3.2 3.3 2.7 2.6 3.2 4.2 3.9 4.1 5.0 5.5‡ 5.8 5.1 3.9 3.2 3.5 4.4 +0.9 Other MSA 3.0 3.8 3.3 3.9 4.1 4.6 4.4 5.2 5.5 5.4‡ 7.0 6.8 5.8 5.7 5.4 5.3 -0.1 Non-MSA 3.5 3.3 3.6 3.0 4.7 5.2 7.0 6.0 5.6 6.1‡ 9.9 6.7 6.4 6.4 5.3 6.3 +1.1Parental Education:c
1.0-2.0 (Low) 3.3 5.3 4.8 4.2 5.0 5.9 4.7 6.5 5.0 8.2‡ 7.6 7.1 7.5 5.8 5.2 6.6 +1.4 2.5-3.0 3.6 3.5 3.1 3.3 4.5 5.2 5.3 6.3 5.9 6.2‡ 7.9 7.5 7.3 5.6 5.7 6.2 +0.5 3.5-4.0 3.2 3.4 3.5 3.4 4.3 5.0 5.5 4.9 5.2 5.6‡ 8.1 6.7 5.7 5.7 5.4 5.6 +0.2 4.5-5.0 2.5 3.9 2.9 2.9 3.5 4.1 4.2 4.5 5.7 5.2‡ 6.7 5.8 4.1 4.6 4.0 4.3 +0.3 5.5-6.0 (High) 3.5 2.3 3.1 3.4 3.2 3.6 4.4 4.0 5.3 4.7‡ 6.9 4.6 3.4 4.1 4.0 4.3 +0.2Race (2-year average):d
White — 4.0 3.8 3.6 4.1 4.9 5.6 6.0 6.1 6.4 7.0‡ 7.6e 7.4 6.5 6.0 6.0 -0.1 Black — 0.9 0.9 0.9 0.8 0.7 0.9 1.0 1.2 1.1 1.5‡ 1.5e 1.3 1.3 1.3 1.6 +0.3 Hispanic — 2.9 3.3 3.1 3.1 3.4 3.5 3.5 3.7 4.0 4.0‡ 4.3e 4.4 4.5 4.3 3.8 -0.5
TABLE D-59 Tranquilizers: Trends in Annual Prevalence of Use by Subgroups for Tenth Graders
Percentage who used in last twelve months a
’05–’06change
(Table continued on next page)
342

dTo derive percentages for each racial subgroup, data for the specified year and the previous year have been combined to increase subgroup sample sizes and thus provide more stable estimates. For the data beginning in 2005, see the race/ethnicity note at the end of Appendix D.eThe 2002 data comprise half of the 2001 sample data double-weighted and all of the 2002 sample data.
N indicated. In 2002 the remaining forms were changed. Beginning in 2002, the data are based on all forms. Data for "any illicit drug other than marijuana" and “hallucinogens” are also affected by these changes and have been treated in a parallel manner. cParental education is an average score of mother’s education and father’s education. See Appendix B for details.
aOnly drug use not under a doctor's orders is included here.bIn 2001, for the tranquilizer list of examples, Miltown was replaced with Xanax. The 2001 data are based on the changed forms only; N is one-half of
rounding error. See Table D-107 for the number of subgroup cases. See Appendix B for definition of variables in table.
TABLE D-59 (cont'd)
Level of significance of difference between the two most recent classes: s = .05, ss = .01, sss = .001. ‘—’ indicates data not available. Any apparent inconsistency between the change estimate and the prevalence-of-use estimates for the two most recent classes is due to
Tranquilizers: Trends in Annual Prevalence of Use by Subgroups for Tenth Graders
Notes: ‘‡’ indicates some change in the question. See relevant footnote. See relevant figure to assess the impact of the wording changes. Source: The Monitoring the Future Study, the University of Michigan.
343

1975 1976 1977 1978 1979 1980 1981 1982 1983 1984 1985 1986 1987 1988 1989 1990Approx. N = 9,400 15,400 17,100 17,800 15,500 15,900 17,500 17,700 16,300 15,900 16,000 15,200 16,300 16,300 16,700 15,200
Total 10.6 10.3 10.8 9.9 9.6 8.7 8.0 7.0 6.9 6.1 6.1 5.8 5.5 4.8 3.8 3.5Gender: Male 10.0 9.4 10.2 9.7 9.9 9.0 8.0 6.9 7.0 6.3 6.4 5.9 5.2 4.7 4.0 3.5 Female 11.1 11.0 11.4 10.1 9.3 8.5 7.7 7.1 6.7 5.8 5.7 5.8 5.8 4.8 3.5 3.5College Plans: None or under 4 years — 11.5 12.3 11.1 11.0 10.7 9.4 8.0 8.0 7.4 6.8 7.2 6.7 5.1 4.8 4.3 Complete 4 years — 8.9 9.0 8.6 8.1 7.2 6.9 6.3 5.8 5.2 5.5 5.1 4.9 4.6 3.3 3.2Region: Northeast 9.2 9.7 10.4 10.9 11.5 8.6 8.3 7.8 6.8 6.8 7.1 6.4 6.9 4.5 3.7 2.9 North Central 10.6 10.1 11.0 8.8 7.5 8.2 7.8 6.2 6.8 5.6 6.0 5.5 4.5 3.7 3.1 2.9 South 11.3 11.7 11.4 10.5 10.4 9.5 7.8 7.4 7.4 6.9 5.9 6.3 5.7 6.0 4.4 4.3 West 11.7 8.5 9.6 8.9 9.4 8.6 8.0 6.4 6.2 4.9 5.3 4.8 5.2 4.4 3.4 3.9Population Density: Large MSA 11.2 9.6 9.6 10.3 9.9 8.7 8.3 7.0 7.0 5.4 5.8 5.3 5.8 4.7 3.1 3.6 Other MSA 11.0 11.3 11.4 10.1 10.2 9.3 8.1 7.2 7.2 6.1 6.0 5.7 5.6 5.0 3.5 3.7 Non-MSA 9.9 9.5 11.0 9.2 8.7 8.0 7.5 6.8 6.5 6.8 6.5 6.4 5.2 4.5 4.9 3.3Parental Education:b
1.0-2.0 (Low) — 11.2 10.1 9.4 9.4 9.1 7.8 7.1 6.1 6.0 6.5 5.3 6.7 5.7 3.9 3.6 2.5-3.0 — 9.8 10.3 11.5 10.1 8.8 9.1 8.0 7.3 7.2 6.5 6.2 5.8 5.4 4.6 3.9 3.5-4.0 — 9.8 11.2 11.1 9.5 10.4 8.9 8.3 6.7 6.9 5.8 6.4 6.5 5.3 4.5 3.4 4.5-5.0 — 11.3 11.7 11.4 10.5 10.0 8.1 7.4 7.6 6.6 5.8 6.3 4.7 5.9 5.5 3.8 5.5-6.0 (High) — 9.3 12.0 10.1 11.0 11.4 10.3 9.1 7.6 7.1 6.3 5.5 5.4 5.4 5.6 4.9Race (2-year average):c
White — — 11.4 11.1 10.5 9.9 9.1 8.3 7.8 7.3 6.8 6.6 6.3 5.9 5.0 4.2 Black — — 4.3 4.2 3.6 3.1 3.0 2.5 2.3 2.1 1.7 1.7 2.0 2.0 1.2 0.7 Hispanic — — 8.4 8.2 7.4 6.4 5.7 5.8 5.1 5.3 5.0 4.4 3.7 2.5 1.6 1.9
See Table D-108 for the number of subgroup cases. See Appendix B for definition of variables in table.
Source: The Monitoring the Future Study, the University of Michigan.
TABLE D-60Tranquilizers: Trends in Annual Prevalence of Use by Subgroups for Twelfth Graders
Any apparent inconsistency between the change estimate and the prevalence-of-use estimates for the two most recent classes is due to rounding error.
Notes: ‘‡’ indicates some change in the question. See relevant footnote. See relevant figure to assess the impact of the wording changes.
Level of significance of difference between the two most recent classes: s = .05, ss = .01, sss = .001. ‘—’ indicates data not available.
Percentage who used in last twelve months a
Class of: Cont'd
344

1991 1992 1993 1994 1995 1996 1997 1998 1999 2000 2001b 2002b 2003 2004 2005 2006Approx. N = 15,000 15,800 16,300 15,400 15,400 14,300 15,400 15,200 13,600 12,800 12,800 12,900 14,600 14,600 14,700 14,200
Total 3.6 2.8 3.5 3.7 4.4 4.6 4.7 5.5 5.8 5.7‡ 6.9 7.7 6.7 7.3 6.8 6.6 -0.1Gender: Male 3.5 2.7 3.5 4.0 4.7 5.0 5.4 6.3 6.9 6.4‡ 7.9 8.4 6.9 8.0 7.2 7.1 -0.1 Female 3.6 3.0 3.3 3.5 4.1 4.0 3.9 4.7 4.8 4.9‡ 5.8 6.9 6.3 6.5 6.2 6.1 -0.1College Plans: None or under 4 years 4.2 3.9 3.9 4.5 5.6 5.6 6.2 6.8 6.4 6.7‡ 7.6 9.9 9.6 9.1 10.3 8.5 -1.8 Complete 4 years 3.4 2.5 3.3 3.5 4.1 4.2 4.0 5.1 5.6 5.2‡ 6.7 7.1 6.0 6.8 5.9 6.0 +0.1Region: Northeast 3.0 3.0 3.7 3.5 3.9 4.8 5.3 4.9 5.6 5.2‡ 5.7 6.8 5.4 6.5 5.7 7.2 +1.6 North Central 3.0 2.3 2.8 3.1 4.0 4.4 3.5 3.7 5.1 4.7‡ 8.1 6.5 5.5 6.2 7.0 5.8 -1.2 South 4.0 3.5 4.2 4.8 5.0 5.3 5.4 7.5 7.6 6.7‡ 7.4 10.4 8.5 9.0 8.3 7.6 -0.6 West 4.4 2.3 3.0 2.8 4.3 3.0 4.3 4.4 3.9 5.6‡ 5.5 5.8 6.6 7.0 4.9 5.3 +0.4Population Density: Large MSA 2.5 2.9 2.9 3.9 4.0 3.7 4.2 4.8 4.0 4.7‡ 7.9 7.8 4.7 5.5 5.5 6.5 +1.0 Other MSA 4.1 2.7 3.6 3.7 4.5 4.9 4.8 5.7 6.6 6.2‡ 6.4 8.2 7.8 8.5 7.4 6.6 -0.8 Non-MSA 3.7 3.1 3.7 3.5 4.8 4.7 5.1 5.9 6.5 6.0‡ 6.7 6.8 7.4 7.3 7.1 6.9 -0.2Parental Education:c
1.0-2.0 (Low) 4.0 3.9 3.3 4.2 3.9 4.2 3.9 6.4 5.2 6.4‡ 5.4 5.2 7.1 5.0 4.3 5.7 +1.4 2.5-3.0 3.6 2.8 3.3 3.5 4.7 4.0 4.3 5.2 6.2 5.3‡ 6.7 7.9 6.5 7.9 7.7 6.9 -0.8 3.5-4.0 3.1 2.7 3.5 3.6 4.3 4.7 4.6 6.0 6.4 5.6‡ 7.7 8.4 7.6 9.0 7.3 6.9 -0.5 4.5-5.0 3.9 3.0 3.4 3.7 4.5 4.6 5.4 4.9 5.4 5.9‡ 7.4 7.9 5.9 7.1 6.8 6.6 -0.1 5.5-6.0 (High) 4.0 2.2 4.2 4.2 4.1 5.3 5.1 5.5 5.6 5.8‡ 6.0 7.9 6.2 5.4 5.9 6.4 +0.5Race (2-year average):d
White 4.1 3.7 3.7 4.2 4.6 5.1 5.5 6.2 6.8 6.9 7.7‡ 9.2e 8.7 8.4 8.6 8.2 -0.4 Black 0.9 1.3 1.0 1.1 1.2 0.9 0.8 1.0 1.0 0.7 0.6‡ 1.1e 1.3 1.7 1.9 1.6 -0.2 Hispanic 2.7 2.4 2.0 2.4 3.5 4.3 3.8 3.3 3.5 4.3 3.9‡ 4.1e 4.5 4.5 4.3 4.3 -0.1
dTo derive percentages for each racial subgroup, data for the specified year and the previous year have been combined to increase subgroup sample sizes and thus provide
more stable estimates. For the data beginning in 2005, see the race/ethnicity note at the end of Appendix D. eThe 2002 data comprise half of the 2001 sample data double-weighted and all of the 2002 sample data.
change
bIn 2001, for the tranquilizer list of examples, Miltown was replaced with Xanax. The 2001 data are based on the changed forms only; N is one-half of N indicated. In 2002 the
remaining forms were changed. Beginning in 2002, the data are based on all forms. Data for "any illicit drug other than marijuana" and “hallucinogens” are also affected by
these changes and have been treated in a parallel manner. cParental education is an average score of mother’s education and father’s education. See Appendix B for details.
TABLE D-60 (cont'd)Tranquilizers: Trends in Annual Prevalence of Use by Subgroups for Twelfth Graders
aOnly drug use not under a doctor's orders is included here.
’05–’06Percentage who used in last twelve months a
Class of:
345

1991 1992 1993 1994 1995 1996 1997 1998 1999 2000 2001 2002 2003 2004 2005 2006Approx. N = — — — — — 17,800 18,600 18,100 16,700 16,700 16,200 15,100 16,500 17,000 16,800 16,500
Total — — — — — 1.0 0.8 0.8 0.5 0.5 0.7 0.3 0.5 0.6 0.7 0.5 -0.1Gender: Male — — — — — 1.1 0.7 0.8 0.6 0.5 0.6 0.2 0.4 0.5 0.7 0.7 0.0 Female — — — — — 1.0 0.9 0.9 0.2 0.6 0.7 0.2 0.4 0.7 0.7 0.4 -0.3College Plans: None or under 4 years — — — — — 2.5 1.5 3.0 0.9 2.2 2.0 1.0 1.3 2.4 1.8 1.1 -0.8 Complete 4 years — — — — — 0.8 0.7 0.6 0.4 0.4 0.5 0.2 0.4 0.4 0.6 0.5 -0.1Region: Northeast — — — — — 0.9 0.3 0.9 0.3 0.6 0.9 0.2 0.2 0.3 0.6 1.4 +0.8 North Central — — — — — 0.9 0.8 0.8 0.3 0.4 1.0 0.4 0.2 0.8 0.6 0.0 -0.6 South — — — — — 1.3 1.1 0.9 0.7 0.9 0.6 0.4 0.6 0.5 0.5 0.6 +0.1 West — — — — — 1.0 0.7 0.8 0.5 * 0.4 0.1 0.7 0.7 1.1 0.2 -0.9Population Density: Large MSA — — — — — 1.2 0.8 0.7 0.4 0.9 1.2 0.1 0.1 0.5 0.4 0.6 +0.3 Other MSA — — — — — 1.1 0.9 1.0 0.6 0.5 0.5 0.3 0.4 0.8 0.7 0.5 -0.3 Non-MSA — — — — — 0.8 0.7 0.8 0.3 0.2 0.4 0.5 1.0 0.3 1.0 0.5 -0.5Parental Education:a
1.0-2.0 (Low) — — — — — 2.0 2.1 2.2 0.2 0.9 1.3 0.9 1.8 2.4 0.6 0.7 +0.1 2.5-3.0 — — — — — 1.1 1.1 0.8 0.3 0.8 0.3 0.0 0.9 0.1 1.3 0.1 -1.2 s 3.5-4.0 — — — — — 1.2 0.7 0.9 0.6 0.2 1.2 0.2 0.1 0.2 0.4 0.7 +0.2 4.5-5.0 — — — — — 0.8 0.6 0.6 0.5 0.4 0.7 0.6 0.4 0.6 0.9 0.1 -0.8 5.5-6.0 (High) — — — — — 0.8 0.5 0.9 0.7 0.9 0.2 0.2 0.0 0.1 0.5 1.5 +1.0Race (2-year average):b
White — — — — — — 0.9 0.8 0.7 0.5 0.6 0.5 0.4 0.4 0.5 0.5 0.0 Black — — — — — — 0.4 0.4 0.4 0.3 0.4 0.4 0.3 0.9 0.7 0.2 -0.5 Hispanic — — — — — — 1.4 1.5 1.5 0.6 0.9 0.8 0.4 1.0 0.8 0.6 -0.2
For the data beginning in 2005, see the race/ethnicity note at the end of Appendix D.
bTo derive percentages for each racial subgroup, data for the specified year and the previous year have been combined to increase subgroup sample sizes and thus provide more stable estimates.
TABLE D-61 Rohypnol: Trends in Annual Prevalence of Use by Subgroups for Eighth Graders
Notes: Level of significance of difference between the two most recent classes: s = .05, ss = .01, sss = .001. ‘—’ indicates data not available. ‘*’ indicates less than .05 percent but greater than
based on one of four forms beginning in 2002; N is one-sixth of N indicated in Table D-106.
Caution: Limited sample sizes (see “Notes” above). Use caution in interpreting subgroup trends.aParental education is an average score of mother’s education and father’s education. See Appendix B for details.
0 percent. Any apparent inconsistency between the change estimate and the prevalence-of-use estimates for the two most recent classes is due to rounding error.
See Table D-106 for the number of subgroup cases. See Appendix B for definition of variables in table. Data based on one of two forms in 1996; N is one-half of N indicated in Table D-106.
Data based on three of four forms in 1997–98; N is two-thirds of N indicated in Table D-106. Data based on two of four forms in 1999–2001; N is one-third of N indicated in Table D-106. Data
Percentage who used in last twelve months’05–’06change
Source: The Monitoring the Future Study, the University of Michigan.
346

1991 1992 1993 1994 1995 1996 1997 1998 1999 2000 2001 2002 2003 2004 2005 2006Approx. N = — — — — — 15,600 15,500 15,000 13,600 14,300 14,000 14,300 15,800 16,400 16,200 16,200
Total — — — — — 1.1 1.3 1.2 1.0 0.8 1.0 0.7 0.6 0.7 0.5 0.5 +0.1Gender: Male — — — — — 1.1 1.4 1.4 1.2 1.0 1.1 0.4 0.7 0.8 0.3 0.4 +0.1 Female — — — — — 1.1 1.1 1.1 0.9 0.6 0.9 0.9 0.6 0.6 0.6 0.7 0.0College Plans: None or under 4 years — — — — — 2.9 2.7 2.9 2.8 1.4 2.8 0.5 0.3 1.4 1.6 1.5 -0.1 Complete 4 years — — — — — 0.8 1.1 0.9 0.8 0.6 0.7 0.7 0.6 0.6 0.3 0.4 +0.1Region: Northeast — — — — — 0.6 0.7 0.9 0.4 0.6 0.9 0.4 1.0 0.8 0.7 0.3 -0.4 North Central — — — — — 0.5 0.8 1.0 0.9 0.4 0.9 0.3 0.2 0.3 0.2 1.0 +0.8 South — — — — — 1.9 2.4 2.0 1.8 1.2 1.0 0.4 0.8 0.9 0.7 0.7 0.0 West — — — — — 1.1 0.6 0.5 0.6 0.7 1.3 2.0 0.4 0.9 0.2 0.0 -0.2Population Density: Large MSA — — — — — 1.1 1.3 1.3 0.9 0.9 1.2 0.7 0.3 0.6 0.3 0.2 -0.1 Other MSA — — — — — 1.4 1.3 1.3 1.3 0.9 0.8 0.9 0.4 0.7 0.5 0.7 +0.1 Non-MSA — — — — — 0.6 1.3 1.0 0.7 0.5 1.2 0.3 1.5 0.8 0.5 0.8 +0.3Parental Education:a
1.0-2.0 (Low) — — — — — 1.7 1.3 1.7 1.2 1.3 2.3 0.4 1.3 0.4 1.1 1.4 +0.4 2.5-3.0 — — — — — 1.0 1.1 1.6 1.6 0.5 1.1 0.9 0.7 0.4 0.5 0.3 -0.1 3.5-4.0 — — — — — 1.5 1.6 1.0 0.8 0.8 0.7 1.0 0.9 1.0 0.4 0.7 +0.3 4.5-5.0 — — — — — 0.7 1.5 0.9 0.6 0.7 1.1 0.7 0.2 0.6 0.6 0.3 -0.3 5.5-6.0 (High) — — — — — 1.1 0.8 1.3 1.1 0.8 0.3 0.2 0.4 1.0 0.0 0.0 0.0Race (2-year average):b
White — — — — — — 1.4 1.5 1.5 1.0 1.0 1.0 0.6 0.9 0.8 0.5 -0.3 Black — — — — — — 0.1 0.1 0.1 0.1 0.2 0.3 0.1 0.2 0.4 0.3 -0.1 Hispanic — — — — — — 1.0 1.2 1.1 0.7 0.9 1.0 0.7 0.3 0.2 0.6 +0.4
based on one of four forms beginning in 2002; N is one-sixth of N indicated in Table D-107.
TABLE D-62 Rohypnol: Trends in Annual Prevalence of Use by Subgroups for Tenth Graders
Notes: Level of significance of difference between the two most recent classes: s = .05, ss = .01, sss = .001. ‘—’ indicates data not available.
Any apparent inconsistency between the change estimate and the prevalence-of-use estimates for the two most recent classes is due to rounding error.
Source: The Monitoring the Future Study, the University of Michigan.
For the data beginning in 2005, see the race/ethnicity note at the end of Appendix D.
bTo derive percentages for each racial subgroup, data for the specified year and the previous year have been combined to increase subgroup sample sizes and thus provide more stable estimates.
Percentage who used in last twelve months
aParental education is an average score of mother’s education and father’s education. See Appendix B for details.
Caution: Limited sample sizes (see “Notes” above). Use caution in interpreting subgroup trends.
’05–’06change
See Table D-107 for the number of subgroup cases. See Appendix B for definition of variables in table. Data based on one of two forms in 1996; N is one-half of N indicated in Table D-107.
Data based on three of four forms in 1997–98; N is two-thirds of N indicated in Table D-107. Data based on two of four forms in 1999–2001; N is one-third of N indicated in Table D-107. Data
347

1975–79 1980–89 1990–95 1996 1997 1998 1999 2000 2001 2002a 2003 2004 2005 2006Approx. N = — — — 14,300 15,400 15,200 13,600 12,800 12,800 12,900 14,600 14,600 14,700 14,200
Total — — — 1.1 1.2 1.4 1.0 0.8 0.9‡ 1.6 1.3 1.6 1.2 1.1 -0.1Gender: Male — — — 1.8 1.2 1.7 1.0 0.8 1.1‡ 2.3 2.0 2.3 1.5 1.3 -0.2 Female — — — 0.3 1.1 1.1 1.0 0.7 0.6‡ 1.0 0.5 0.7 0.8 0.5 -0.3College Plans: None or under 4 years — — — 1.4 0.5 1.8 1.0 0.1 1.2‡ 2.5 2.1 3.0 2.4 1.6 -0.7 Complete 4 years — — — 0.8 1.3 1.3 1.0 0.9 0.8‡ 1.4 0.9 1.0 0.9 0.8 -0.1Region: Northeast — — — 0.9 0.6 1.2 0.8 0.3 1.7‡ 1.2 1.4 0.8 1.1 1.3 +0.2 North Central — — — 1.0 0.5 1.0 0.8 0.9 0.5‡ 1.8 1.2 1.3 1.7 0.8 -0.9 South — — — 1.8 2.2 2.6 1.6 1.3 1.0‡ 1.5 1.4 2.1 1.3 1.3 -0.1 West — — — 0.1 0.8 0.0 0.2 0.1 0.8‡ 2.0 1.1 1.8 0.6 1.3 +0.7Population Density: Large MSA — — — 1.3 0.9 0.8 0.3 0.3 1.0‡ 1.6 1.1 1.8 1.4 1.2 -0.2 Other MSA — — — 1.3 1.5 2.2 1.4 1.1 1.2‡ 2.0 1.7 1.6 1.2 1.0 -0.2 Non-MSA — — — 0.7 0.7 0.6 0.9 0.7 0.3‡ 1.1 0.9 1.2 1.1 1.4 +0.3Parental Education:b
1.0-2.0 (Low) — — — 1.6 0.4 0.6 4.7 0.0 4.2‡ 3.7 2.8 3.4 3.9 1.2 -2.7 s 2.5-3.0 — — — 0.5 0.6 1.0 0.3 0.4 0.4‡ 2.9 1.8 1.8 1.2 1.2 0.0 3.5-4.0 — — — 0.8 1.4 1.1 1.1 1.5 0.8‡ 0.8 1.2 1.5 1.4 1.0 -0.3 4.5-5.0 — — — 0.9 1.7 2.7 0.3 0.6 0.8‡ 1.6 0.9 0.6 0.3 1.2 +0.8 s 5.5-6.0 (High) — — — 1.8 1.7 1.4 0.7 0.0 0.2‡ 0.8 0.2 1.5 0.9 0.7 -0.2Race (2-year average):c
White — — — — 1.2 1.6 1.5 0.9 0.8‡ — 1.5 1.3 1.1 0.9 -0.3 Black — — — — 0.1 0.0 0.2 0.4 0.2‡ — 0.8 1.2 1.7 1.3 -0.5 Hispanic — — — — 2.0 1.3 1.0 0.6 1.3‡ — 1.6 1.7 1.9 2.1 +0.2
TABLE D-63
(Table continued on next page)
Rohypnol: Trends in Annual Prevalence of Use by Subgroups for Twelfth Graders
Percentage who used in last twelve monthsClass of: ’05–’06
change
348

Appendix D.
bParental education is an average score of mother’s education and father’s education. See Appendix B for details.cTo derive percentages for each racial subgroup, data for the specified year and the previous year have been combined to increase
beginning in 2002; N is two-sixths of N indicated in Table D-108.Caution: Limited sample sizes (see “Notes” above). Use caution in interpreting subgroup trends.
aThe 2001 and 2002 data are not comparable due to changes in the questionnaire forms.
subgroup sample sizes and thus provide more stable estimates. For the data beginning in 2005, see the race/ethnicity note at the end of
See Table D-108 for the number of subgroup cases. See Appendix B for definition of variables in table. Data based on one of six forms in 1996–2001; N is one-sixth of N indicated in Table D-108. Data based on two of six forms
TABLE D-63 (cont'd)Rohypnol: Trends in Annual Prevalence of Use by Subgroups for Twelfth Graders
Any apparent inconsistency between the change estimate and the prevalence-of-use estimates for the two most recent classes is due to rounding error.
Source: The Monitoring the Future Study, the University of Michigan.Notes: ‘‡’ indicates some change in the question. See relevant footnote. See relevant figure to assess the impact of the wording changes. Level of significance of difference between the two most recent classes: s = .05, ss = .01, sss = .001. ‘—’ indicates data not available.
349

1991 1992 1993a 1994a 1995 1996 1997 1998 1999 2000 2001 2002 2003 2004 2005 2006Approx. N = 17,500 18,600 18,300 17,300 17,500 17,800 18,600 18,100 16,700 16,700 16,200 15,100 16,500 17,000 16,800 16,500
Total 25.1 26.1‡ 24.3 25.5 24.6 26.2 24.5 23.0 24.0 22.4 21.5 19.6 19.7 18.6 17.1 17.2 +0.1Gender: Male 26.3 26.3‡ 25.3 26.5 25.0 26.6 25.2 24.0 24.8 22.5 22.3 19.1 19.4 17.9 16.2 16.3 0.0 Female 23.8 25.9‡ 23.7 24.7 24.0 25.8 23.9 21.9 23.3 22.0 20.6 20.0 19.8 19.0 17.9 17.6 -0.2College Plans: None or under 4 years 37.2 39.6‡ 41.1 41.4 40.0 41.7 40.2 41.2 41.6 38.3 37.0 35.3 35.3 32.6 32.6 30.8 -1.8 Complete 4 years 23.1 24.2‡ 22.2 23.6 22.6 24.0 22.8 21.0 22.0 20.4 19.7 18.2 18.1 17.2 15.5 15.8 +0.3Region: Northeast 24.3 23.8‡ 21.0 25.4 24.1 26.9 24.8 21.2 25.7 25.6 23.3 19.3 18.4 18.0 14.5 16.9 +2.4 North Central 26.6 28.3‡ 24.7 24.2 24.7 26.9 22.8 23.9 25.7 24.1 21.2 19.1 21.9 19.3 16.9 17.0 +0.1 South 25.1 26.8‡ 25.4 25.6 25.5 26.3 26.4 23.8 24.4 20.9 22.8 21.6 20.8 18.8 19.0 18.5 -0.4 West 23.1 23.5‡ 25.6 27.2 23.1 24.8 22.7 22.2 19.8 20.2 18.1 17.0 16.0 17.9 16.4 15.3 -1.1Population Density: Large MSA 25.4 27.4‡ 21.2 23.8 22.3 24.9 23.1 21.4 21.7 21.2 19.4 17.4 18.2 18.1 17.2 16.6 -0.6 Other MSA 24.3 26.1‡ 26.0 27.4 25.3 27.4 24.9 22.4 23.4 21.3 21.5 20.1 19.4 19.1 17.9 17.4 -0.4 Non-MSA 26.2 24.2‡ 24.9 23.8 26.0 25.7 25.4 26.0 28.1 26.1 24.1 21.4 22.3 18.1 15.6 17.5 +1.9Parental Education:b
1.0-2.0 (Low) 30.7 32.8‡ 28.0 33.5 30.8 28.1 29.7 28.9 30.7 30.2 28.5 27.6 25.5 24.2 23.8 24.1 +0.3 2.5-3.0 27.0 27.2‡ 28.0 27.4 27.8 30.1 26.2 26.5 27.9 26.3 27.0 23.2 24.0 22.1 20.4 20.0 -0.4 3.5-4.0 25.1 26.3‡ 25.9 26.7 26.8 27.6 27.8 24.5 25.2 23.0 23.3 21.2 22.0 20.0 18.8 19.0 +0.2 4.5-5.0 22.8 24.6‡ 20.6 22.6 21.0 25.0 22.6 20.2 20.4 18.4 17.2 17.0 16.0 16.3 14.6 13.9 -0.7 5.5-6.0 (High) 24.0 25.2‡ 22.3 23.6 20.5 21.5 20.5 21.3 22.1 19.0 16.4 15.1 15.7 15.8 13.1 13.8 +0.7Race (2-year average):c
White — 26.6 27.1‡ 25.3 25.4 26.6 26.7 24.8 24.7 24.7 23.2 21.5 20.1 19.2 17.9 16.9 -1.0 Black — 18.6 19.7‡ 19.4 18.7 18.1 17.9 16.1 16.1 16.0 15.0 14.8 15.5 16.2 14.9 13.1 -1.8 Hispanic — 31.0 32.3‡ 33.5 32.4 29.7 29.8 29.5 29.0 26.7 25.7 26.5 25.3 23.5 20.6 21.2 +0.6
For the data beginning in 2005, see the race/ethnicity note at the end of Appendix D.
recent classes: s = .05, ss = .01, sss = .001. ‘—’ indicates data not available. Any apparent inconsistency between the change estimate and the prevalence-of-use estimates for the two most
recent classes is due to rounding error. See Table D-106 for the number of subgroup cases. See Appendix B for definition of variables in table.
Percentage who used in last thirty days’05–’06
1994 the question text was changed in the remaining form. Beginning in 1994, the data are based on all forms. In 2004, the question text was changed slightly in half of the forms. An examination of the
bParental education is an average score of mother’s education and father’s education. See Appendix B for details.
TABLE D-64 Alcohol: Trends in Thirty-Day Prevalence of Use by Subgroups for Eighth Graders
cTo derive percentages for each racial subgroup, data for the specified year and the previous year have been combined to increase subgroup sample sizes and thus provide more stable estimates.
data did not show any effect from the wording change. The remaining forms were changed in 2005.
change
Notes: ‘‡’ indicates some change in the question. See relevant footnote. See relevant figure to assess the impact of the wording changes. Level of significance of difference between the two most
aIn 1993, the question text was changed slightly in one form to indicate that a "drink" meant "more than a few sips." The 1993 data are based on the changed forms only; N is one-half of N indicated. In
Source: The Monitoring the Future Study, the University of Michigan.
350

1991 1992 1993a 1994a 1995 1996 1997 1998 1999 2000 2001 2002 2003 2004 2005 2006Approx. N = 14,800 14,800 15,300 15,800 17,000 15,600 15,500 15,000 13,600 14,300 14,000 14,300 15,800 16,400 16,200 16,200
Total 42.8 39.9‡ 38.2 39.2 38.8 40.4 40.1 38.8 40.0 41.0 39.0 35.4 35.4 35.2 33.2 33.8 +0.6Gender: Male 45.5 41.6‡ 40.6 43.5 39.7 42.6 42.5 40.0 42.3 43.3 41.1 35.3 35.3 36.3 32.8 33.8 +1.1 Female 40.2 38.3‡ 35.6 34.8 37.8 38.3 37.9 37.7 38.1 38.6 36.8 35.7 35.3 34.0 33.6 33.8 +0.2College Plans: None or under 4 years 53.6 49.5‡ 48.6 52.0 52.2 53.3 51.6 52.4 53.7 53.9 52.2 47.1 46.6 47.5 44.9 44.8 0.0 Complete 4 years 40.6 37.9‡ 36.1 36.4 36.4 38.3 38.1 36.5 37.9 39.1 36.8 33.5 33.6 33.6 31.6 32.5 +0.9Region: Northeast 48.0 42.3‡ 42.4 37.4 38.3 41.4 41.1 41.6 44.8 42.0 37.8 36.3 38.7 40.4 37.0 35.7 -1.3 North Central 43.5 40.3‡ 37.4 39.6 38.9 39.1 38.6 37.6 40.9 42.5 41.0 35.7 34.4 30.9 31.9 33.7 +1.8 South 41.7 38.2‡ 38.0 40.5 39.4 41.7 40.8 39.9 38.8 39.1 38.3 33.7 34.8 36.4 33.4 32.8 -0.6 West 39.6 39.8‡ 35.6 38.2 38.0 38.9 39.9 35.5 36.1 41.1 38.2 37.2 34.1 33.7 30.7 33.9 +3.2Population Density: Large MSA 43.6 40.4‡ 39.0 36.3 34.6 37.9 37.8 34.2 39.7 42.4 37.6 32.0 33.1 32.0 31.1 32.5 +1.4 Other MSA 41.4 38.6‡ 36.2 40.1 39.9 41.0 40.2 39.0 39.7 39.3 38.3 35.2 35.6 37.0 34.4 34.5 0.0 Non-MSA 44.8 41.9‡ 41.3 40.6 41.3 42.1 42.6 43.7 41.0 42.4 41.8 40.4 38.3 35.8 33.5 34.4 +0.9Parental Education:b
1.0-2.0 (Low) 42.1 40.4‡ 37.5 38.6 43.5 43.2 39.2 39.9 40.6 41.1 38.6 38.2 38.4 38.6 36.5 33.1 -3.4 2.5-3.0 43.9 40.9‡ 40.6 41.5 42.3 42.6 41.1 41.2 42.3 42.8 41.4 38.0 37.4 38.5 36.0 38.0 +2.0 3.5-4.0 44.2 40.0‡ 38.0 40.6 38.8 42.2 41.6 40.1 40.2 42.8 41.0 36.4 36.6 37.5 33.5 35.6 +2.1 4.5-5.0 40.7 39.4‡ 36.2 37.7 37.9 37.8 39.3 36.9 38.7 40.2 37.0 33.7 32.7 32.6 31.8 32.0 +0.2 5.5-6.0 (High) 44.9 41.7‡ 39.3 35.4 34.3 39.6 38.9 37.0 40.9 39.0 37.1 32.0 34.1 32.4 31.8 31.7 -0.1Race (2-year average):c
White — 44.1 43.1‡ 40.4 41.0 42.2 43.0 42.7 43.0 43.9 42.7 40.0 38.7 37.8 37.0 36.3 -0.7 Black — 30.2 29.3‡ 29.7 28.0 23.9 24.6 25.1 24.4 24.7 25.3 24.3 23.7 24.6 23.0 21.5 -1.5 Hispanic — 41.0 39.9‡ 37.7 40.5 44.0 42.8 39.4 39.6 40.5 40.2 37.9 37.1 39.5 38.2 36.1 -2.1
change
Alcohol: Trends in Thirty-Day Prevalence of Use by Subgroups for Tenth Graders TABLE D-65
Notes: ‘‡’ indicates some change in the question. See relevant footnote. See relevant figure to assess the impact of the wording changes. Level of significance of difference between the two most
Percentage who used in last thirty days’05–’06
Source: The Monitoring the Future Study, the University of Michigan.
recent classes: s = .05, ss = .01, sss = .001. ‘—’ indicates data not available. Any apparent inconsistency between the change estimate and the prevalence-of-use estimates for the two most
recent classes is due to rounding error. See Table D-107 for the number of subgroup cases. See Appendix B for definition of variables in table.aIn 1993, the question text was changed slightly in one form to indicate that a "drink" meant "more than a few sips." The 1993 data are based on the changed forms only; N is one-half of N indicated. In
For the data beginning in 2005, see the race/ethnicity note at the end of Appendix D.
1994 the question text was changed in the remaining form. Beginning in 1994, the data are based on all forms. In 2004, the question text was changed slightly in half of the forms. An examination of the
bParental education is an average score of mother’s education and father’s education. See Appendix B for details.cTo derive percentages for each racial subgroup, data for the specified year and the previous year have been combined to increase subgroup sample sizes and thus provide more stable estimates.
data did not show any effect from the wording change. The remaining forms were changed in 2005.
351

1975 1976 1977 1978 1979 1980 1981 1982 1983 1984 1985 1986 1987 1988 1989 1990Approx. N = 9,400 15,400 17,100 17,800 15,500 15,900 17,500 17,700 16,300 15,900 16,000 15,200 16,300 16,300 16,700 15,200
Total 68.2 68.3 71.2 72.1 71.8 72.0 70.7 69.7 69.4 67.2 65.9 65.3 66.4 63.9 60.0 57.1Gender: Male 75.0 74.5 77.8 77.5 76.7 77.4 75.7 74.1 74.4 71.4 69.8 69.0 69.9 68.0 65.1 61.3 Female 62.2 61.8 65.0 67.1 67.0 66.8 65.7 65.4 64.3 62.8 62.1 61.9 63.1 59.9 54.9 52.3College Plans: None or under 4 years — 69.9 72.8 72.7 72.2 73.5 72.1 71.6 70.5 69.0 67.9 66.6 68.6 65.0 61.6 58.7 Complete 4 years — 66.5 69.4 71.6 71.4 70.8 70.0 68.6 68.1 65.7 64.6 64.8 65.7 63.6 59.1 56.4Region: Northeast 76.9 75.7 76.6 78.0 81.1 79.4 80.4 76.7 74.4 73.6 72.3 67.6 69.1 66.7 61.7 65.3 North Central 71.1 73.2 76.4 77.2 73.9 75.1 73.6 75.0 74.4 70.6 66.8 71.3 70.7 67.9 65.9 61.5 South 62.8 60.2 64.7 67.0 65.7 65.5 62.9 61.3 64.3 62.1 60.0 58.2 60.7 58.6 55.1 51.0 West 60.0 62.2 64.4 63.1 65.5 67.6 65.3 63.8 62.9 63.6 66.2 64.5 66.7 65.0 59.3 51.6Population Density: Large MSA 75.3 72.6 74.0 75.5 77.3 78.0 75.5 72.9 69.2 66.6 67.4 66.2 66.3 63.8 56.9 59.2 Other MSA 68.5 67.0 72.0 72.7 72.0 70.8 69.1 69.3 69.8 66.2 65.1 64.8 66.9 64.1 60.7 57.4 Non-MSA 63.2 66.5 67.8 68.4 67.3 69.0 68.9 67.6 69.0 69.0 65.9 65.2 65.5 63.8 61.7 54.4Parental Education:b
1.0-2.0 (Low) 58.7 62.5 62.0 62.7 64.6 65.9 62.1 61.3 61.2 58.1 58.7 56.1 56.3 54.5 47.8 47.2 2.5-3.0 70.0 71.4 72.5 71.9 71.1 72.0 70.7 69.4 69.2 67.4 65.9 65.3 67.0 64.6 59.7 57.2 3.5-4.0 69.2 67.9 73.5 75.0 74.6 73.3 71.5 72.7 70.4 69.6 66.9 66.7 67.2 64.3 62.9 57.7 4.5-5.0 69.6 71.3 74.5 77.0 76.0 74.4 73.1 74.5 73.1 69.3 68.9 68.0 68.8 66.0 62.1 60.8 5.5-6.0 (High) 67.3 72.5 77.1 79.2 75.9 77.2 77.4 74.1 75.0 70.3 67.9 69.9 70.5 67.3 62.2 60.8Race (2-year average):c
White — — 72.8 75.0 75.3 75.4 75.4 74.6 73.9 72.8 71.2 70.2 71.0 70.6 67.3 63.8 Black — — 49.5 48.7 47.2 47.6 46.7 46.0 47.7 45.5 42.8 42.1 39.4 39.8 39.5 35.8 Hispanic — — 63.0 64.5 63.8 63.6 62.0 60.3 59.1 59.7 58.1 56.3 57.2 57.8 52.9 49.1
See Table D-108 for the number of subgroup cases. See Appendix B for definition of variables in table.
TABLE D-66Alcohol: Trends in Thirty-Day Prevalence of Use by Subgroups for Twelfth Graders
Any apparent inconsistency between the change estimate and the prevalence-of-use estimates for the two most recent classes is due to rounding error.
Notes: ‘‡’ indicates some change in the question. See relevant footnote. See relevant figure to assess the impact of the wording changes.
Level of significance of difference between the two most recent classes: s = .05, ss = .01, sss = .001. ‘—’ indicates data not available.
Percentage who used in last thirty daysClass of:
Source: The Monitoring the Future Study, the University of Michigan.
Cont'd
352

1991 1992 1993a 1994a 1995 1996 1997 1998 1999 2000 2001 2002 2003 2004 2005 2006Approx. N = 15,000 15,800 16,300 15,400 15,400 14,300 15,400 15,200 13,600 12,800 12,800 12,900 14,600 14,600 14,700 14,200
Total 54.0 51.3‡ 48.6 50.1 51.3 50.8 52.7 52.0 51.0 50.0 49.8 48.6 47.5 48.0 47.0 45.3 -1.7Gender: Male 58.4 55.8‡ 54.2 55.5 55.7 54.8 56.2 57.3 55.3 54.0 54.7 52.3 51.7 51.1 50.7 47.3 -3.4 s Female 49.0 46.8‡ 43.4 45.2 47.0 46.9 48.9 46.9 46.8 46.1 45.1 45.1 43.8 45.1 43.3 43.0 -0.3College Plans: None or under 4 years 57.1 54.9‡ 52.4 53.6 55.9 54.8 56.1 56.0 55.2 54.3 55.5 53.0 55.4 52.1 52.8 54.0 +1.2 Complete 4 years 52.7 50.0‡ 47.4 48.9 49.6 49.3 51.4 50.9 49.8 48.3 47.9 47.4 45.2 47.0 45.5 43.2 -2.3Region: Northeast 59.6 51.5‡ 56.1 53.1 55.0 56.5 56.7 56.2 57.2 58.0 54.3 50.9 51.6 53.9 54.5 52.4 -2.1 North Central 59.7 58.0‡ 51.6 53.8 55.3 51.5 51.5 51.9 51.1 52.3 54.5 52.1 50.8 49.5 48.0 46.3 -1.7 South 49.1 48.1‡ 47.7 49.2 50.6 51.1 51.1 51.4 49.5 44.9 45.9 46.8 43.0 43.5 43.9 43.2 -0.7 West 49.7 46.7‡ 39.8 44.2 43.2 42.1 52.7 49.2 47.8 48.3 44.9 45.0 47.0 47.3 43.6 41.3 -2.3Population Density: Large MSA 52.9 49.0‡ 50.6 49.5 50.6 51.6 51.1 49.1 48.9 51.2 49.7 50.3 43.0 44.1 46.6 47.6 +0.9 Other MSA 55.7 50.8‡ 47.1 49.2 50.6 50.1 53.4 53.9 52.8 48.8 49.6 48.8 49.6 51.7 47.6 43.9 -3.8 s Non-MSA 52.0 54.1‡ 49.8 52.5 53.4 51.4 52.9 51.6 50.1 50.8 50.0 45.9 49.6 45.5 46.1 44.7 -1.5Parental Education:b
1.0-2.0 (Low) 49.9 45.6‡ 36.6 43.5 45.9 41.2 43.8 43.8 46.8 43.4 42.9 42.2 43.6 42.1 38.2 44.4 +6.3 s 2.5-3.0 53.3 52.3‡ 49.0 49.9 52.0 48.2 51.0 50.1 50.5 50.0 49.0 47.9 47.8 46.8 47.8 46.7 -1.1 3.5-4.0 54.3 51.2‡ 51.2 50.1 50.6 51.4 52.1 55.6 51.1 51.3 51.4 50.9 47.9 52.4 47.8 46.3 -1.5 4.5-5.0 54.8 51.0‡ 49.8 52.6 51.8 53.6 55.3 52.4 50.2 48.1 51.5 48.9 47.5 47.7 50.2 42.9 -7.2 sss 5.5-6.0 (High) 58.0 55.7‡ 53.2 52.2 55.1 54.2 57.4 54.7 56.0 54.0 49.5 51.1 49.3 47.4 46.0 48.2 +2.2Race (2-year average):c
White 60.0 56.8 55.6‡ 54.0 54.5 54.8 56.4 57.7 56.3 55.1 55.3 54.0 52.3 52.2 52.3 50.7 -1.7 Black 33.7 31.7 32.4‡ 33.8 35.2 36.5 34.3 33.3 32.2 30.0 29.4 30.1 29.9 29.2 29.0 29.2 +0.2 Hispanic 51.5 53.8 50.5‡ 45.9 48.7 47.5 48.2 49.8 50.2 51.2 48.9 47.5 46.4 45.4 43.3 43.4 +0.1
TABLE D-66 (cont'd)Alcohol: Trends in Thirty-Day Prevalence of Use by Subgroups for Twelfth Graders
aIn 1993, the question text was changed slightly in three of six forms to indicate that a "drink" meant "more than a few sips." The 1993 data are based on the changed forms only;
’05–’06Class of:Percentage who used in last thirty days
bParental education is an average score of mother’s education and father’s education. See Appendix B for details.cTo derive percentages for each racial subgroup, data for the specified year and the previous year have been combined to increase subgroup sample sizes and thus provide
more stable estimates. For the data beginning in 2005, see the race/ethnicity note at the end of Appendix D.
change
N is one-half of N indicated. In 1994 the question text was changed in the remaining forms. Beginning in 1994, the data are based on all six forms. In 2004 the question text was
changed slightly in half of the forms. An examination of the data did not show any effect from the wording change. The remaining forms were changed in 2005.
353

1991 1992 1993 1994 1995 1996 1997 1998 1999 2000 2001 2002 2003 2004 2005 2006Approx. N = 17,500 18,600 18,300 17,300 17,500 17,800 18,600 18,100 16,700 16,700 16,200 15,100 16,500 17,000 16,800 16,500
Total 7.6 7.5 7.8 8.7 8.3 9.6 8.2 8.4 9.4 8.3 7.7 6.7 6.7 6.2 6.0 6.2 +0.2Gender: Male 8.4 7.4 7.8 9.0 8.2 9.7 8.4 8.5 10.2 8.2 7.8 7.1 6.6 5.8 5.9 6.1 +0.2 Female 7.0 7.6 7.8 8.3 8.2 9.5 7.9 8.2 8.6 8.1 7.4 6.3 6.8 6.6 6.2 6.2 0.0College Plans: None or under 4 years 15.8 17.2 18.4 20.0 17.2 19.3 18.7 21.4 22.4 18.9 18.9 15.5 17.0 16.1 15.7 15.4 -0.3 Complete 4 years 6.4 6.1 6.4 7.3 7.3 8.2 7.1 6.9 8.0 7.0 6.5 5.9 5.7 5.2 5.1 5.4 +0.3Region: Northeast 5.7 6.4 6.2 8.2 8.2 9.7 7.9 6.9 9.4 8.3 8.0 5.3 4.9 4.8 4.2 5.8 +1.6 North Central 7.7 7.6 7.3 8.3 8.3 10.2 8.2 10.4 11.6 9.7 8.2 7.0 8.1 6.8 6.2 6.3 +0.1 South 8.8 8.2 8.3 8.8 8.4 9.1 8.3 7.8 9.5 7.4 8.1 7.6 7.2 6.4 7.1 6.9 -0.2 West 7.3 6.9 9.4 9.6 8.2 9.8 8.3 8.3 6.6 8.1 6.0 5.9 6.0 6.4 5.8 5.2 -0.6Population Density: Large MSA 7.4 7.0 6.0 7.6 7.2 8.9 6.7 6.9 7.8 7.1 6.3 5.2 5.6 5.4 5.4 5.1 -0.3 Other MSA 7.3 7.4 8.4 9.7 8.9 9.9 8.6 7.5 8.4 7.2 7.9 7.3 6.8 6.5 6.1 6.4 +0.3 Non-MSA 8.4 8.2 8.8 7.9 8.6 10.0 9.2 11.7 13.3 12.0 8.9 7.3 8.1 6.5 6.9 7.5 +0.6Parental Education:a
1.0-2.0 (Low) 13.4 11.0 10.4 12.5 13.1 11.1 11.5 13.1 14.5 14.0 12.1 10.5 13.4 10.0 9.3 9.4 +0.2 2.5-3.0 9.2 8.8 9.2 9.3 9.6 11.9 9.3 9.5 11.7 10.5 9.7 8.5 9.4 7.4 8.4 7.9 -0.6 3.5-4.0 6.9 7.6 8.5 9.3 9.4 10.4 10.2 9.1 9.9 8.0 8.7 6.7 7.1 6.8 6.7 7.1 +0.4 4.5-5.0 6.1 6.5 5.9 7.5 6.4 8.7 6.7 7.0 6.9 5.6 5.7 5.5 4.5 5.0 4.6 4.4 -0.2 5.5-6.0 (High) 6.8 4.9 6.7 7.6 6.0 7.1 5.8 6.9 8.7 7.1 4.6 4.8 4.2 4.4 3.5 4.6 +1.1Race (2-year average):b
White — 7.7 7.8 8.4 8.9 9.7 9.7 9.1 9.8 10.0 9.0 8.0 7.2 6.8 6.6 6.4 -0.2 Black — 5.4 5.1 5.6 5.6 5.5 4.6 3.9 4.9 4.7 4.0 4.0 4.2 4.1 3.8 3.6 -0.1 Hispanic — 9.9 9.9 10.8 10.8 10.8 10.4 9.8 9.9 8.5 7.8 8.4 8.5 8.1 7.0 7.2 +0.2
’05–’06change
more stable estimates. For the data beginning in 2005, see the race/ethnicity note at the end of Appendix D.
TABLE D-67
aParental education is an average score of mother’s education and father’s education. See Appendix B for details.bTo derive percentages for each racial subgroup, data for the specified year and the previous year have been combined to increase subgroup sample sizes and thus provide
Been Drunk: Trends in Thirty-Day Prevalence by Subgroups for Eighth Graders
Notes: Level of significance of difference between the two most recent classes: s = .05, ss = .01, sss = .001. ‘—’ indicates data not available.
Any apparent inconsistency between the change estimate and the prevalence-of-use estimates for the two most recent classes is due to rounding error.
See Table D-106 for the number of subgroup cases. See Appendix B for definition of variables in table.
Percentage who had been drunk in last thirty days
Source: The Monitoring the Future Study, the University of Michigan.
354

1991 1992 1993 1994 1995 1996 1997 1998 1999 2000 2001 2002 2003 2004 2005 2006Approx. N = 14,800 14,800 15,300 15,800 17,000 15,600 15,500 15,000 13,600 14,300 14,000 14,300 15,800 16,400 16,200 16,200
Total 20.5 18.1 19.8 20.3 20.8 21.3 22.4 21.1 22.5 23.5 21.9 18.3 18.2 18.5 17.6 18.8 +1.2Gender: Male 22.3 18.6 21.4 23.2 21.9 23.0 24.6 22.3 25.4 26.2 24.2 19.3 18.8 20.2 18.2 19.1 +0.9 Female 18.7 17.5 18.1 17.2 19.6 19.8 20.2 19.9 19.8 20.9 19.7 17.4 17.7 17.0 16.8 18.4 +1.6College Plans: None or under 4 years 29.5 26.3 29.0 31.1 31.4 32.0 35.5 33.5 34.6 35.1 34.8 27.4 27.4 27.5 27.8 29.0 +1.2 Complete 4 years 18.6 16.4 17.9 18.0 19.0 19.7 20.3 19.1 20.7 21.8 19.8 16.8 16.9 17.4 16.3 17.5 +1.2Region: Northeast 23.9 18.8 20.0 19.0 19.5 22.4 21.9 23.1 25.8 22.8 19.9 18.1 20.3 22.4 20.5 20.4 -0.2 North Central 21.8 18.9 20.1 21.0 22.6 22.0 23.3 21.8 26.0 27.6 24.0 18.7 18.8 16.6 17.4 19.8 +2.4 South 19.2 16.8 19.8 20.9 20.9 21.4 22.0 21.9 20.3 21.4 21.5 17.5 17.6 18.7 17.2 17.6 +0.4 West 18.2 18.3 19.0 19.5 19.5 19.3 22.6 17.0 19.0 22.4 21.2 19.5 16.5 16.7 15.2 17.9 +2.8Population Density: Large MSA 20.6 17.6 17.6 16.1 18.2 19.6 20.7 17.2 21.6 23.4 19.5 16.5 15.7 15.1 16.2 17.7 +1.5 Other MSA 20.1 17.3 18.2 21.7 21.8 21.9 21.8 21.2 22.7 22.5 21.6 18.0 18.6 20.5 18.3 19.0 +0.7 Non-MSA 21.1 19.9 24.7 21.8 21.8 22.4 25.5 25.4 23.4 25.4 25.3 21.4 21.4 19.0 17.8 20.0 +2.2Parental Education:a
1.0-2.0 (Low) 20.9 18.2 22.2 20.0 23.4 22.1 19.7 20.1 21.8 21.3 22.0 17.3 19.0 17.7 15.8 18.4 +2.6 2.5-3.0 22.5 18.5 21.4 21.2 22.9 23.4 22.5 23.3 23.4 24.5 22.6 19.9 18.9 21.0 19.4 21.6 +2.2 3.5-4.0 20.4 19.4 19.4 22.1 21.4 22.1 24.1 21.3 23.3 24.5 22.8 19.5 19.3 18.9 17.5 19.9 +2.4 s 4.5-5.0 19.7 17.1 18.2 18.7 19.7 19.5 22.3 20.2 21.7 24.1 21.4 17.4 17.5 17.3 17.5 17.4 -0.1 5.5-6.0 (High) 20.6 18.5 18.6 17.9 17.9 22.3 22.4 20.4 24.0 23.1 21.5 16.8 17.7 19.3 17.0 17.6 +0.6Race (2-year average):b
White — 21.6 20.8 22.0 22.7 23.7 25.0 25.5 25.7 26.7 25.8 23.2 21.9 21.7 21.0 20.9 0.0 Black — 9.4 10.3 10.1 9.8 8.5 8.6 8.8 7.6 8.6 9.5 8.6 8.0 8.3 8.0 7.8 -0.2 Hispanic — 16.2 15.9 17.0 18.6 20.1 19.5 18.0 17.8 18.0 18.7 17.4 15.7 17.0 17.3 16.6 -0.7
TABLE D-68
aParental education is an average score of mother’s education and father’s education. See Appendix B for details.bTo derive percentages for each racial subgroup, data for the specified year and the previous year have been combined to increase subgroup sample sizes and thus provide
more stable estimates. For the data beginning in 2005, see the race/ethnicity note at the end of Appendix D.
Been Drunk: Trends in Thirty-Day Prevalence by Subgroups for Tenth Graders
Notes: Level of significance of difference between the two most recent classes: s = .05, ss = .01, sss = .001. ‘—’ indicates data not available.
Any apparent inconsistency between the change estimate and the prevalence-of-use estimates for the two most recent classes is due to rounding error.
See Table D-107 for the number of subgroup cases. See Appendix B for definition of variables in table.
Percentage who had been drunk in last thirty days’05–’06change
Source: The Monitoring the Future Study, the University of Michigan.
355

1975–79 1980–90 1991 1992 1993 1994 1995 1996 1997 1998 1999 2000 2001 2002 2003 2004 2005 2006Approx. N = — — 15,000 15,800 16,300 15,400 15,400 14,300 15,400 15,200 13,600 12,800 12,800 12,900 14,600 14,600 14,700 14,200
Total — — 31.6 29.9 28.9 30.8 33.2 31.3 34.2 32.9 32.9 32.3 32.7 30.3 30.9 32.5 30.2 30.0 -0.1Gender: Male — — 37.1 35.2 34.5 34.5 37.8 35.4 39.2 39.0 37.9 38.4 37.0 34.3 34.9 36.0 33.6 32.9 -0.7 Female — — 25.4 24.5 23.5 26.8 28.8 27.3 29.1 26.6 27.7 26.7 28.4 26.9 26.9 29.0 26.4 26.3 -0.1College Plans: None or under 4 years — — 32.2 31.4 32.6 32.2 37.6 31.4 38.1 33.7 36.1 35.0 36.3 31.7 37.6 34.7 34.3 37.2 +3.0 Complete 4 years — — 30.9 29.2 27.4 29.4 31.4 31.0 32.3 32.0 31.7 30.6 31.3 29.3 28.7 31.2 28.5 27.6 -0.9Region: Northeast — — 36.4 30.0 35.0 35.2 35.5 37.2 35.9 35.6 37.5 39.3 33.9 33.6 35.4 38.1 38.7 37.9 -0.8 North Central — — 37.2 38.2 32.5 34.1 38.2 31.5 33.7 34.8 33.4 34.8 39.2 35.0 34.9 34.2 31.3 32.2 +0.9 South — — 26.5 25.2 26.4 29.1 31.2 31.0 34.5 30.1 30.8 26.5 28.8 28.4 25.9 29.3 26.9 27.4 +0.5 West — — 28.5 26.6 23.2 25.4 27.1 24.7 32.7 33.5 32.2 32.8 28.8 25.0 30.1 29.5 26.5 25.2 -1.3Population Density: Large MSA — — 30.4 26.1 29.4 28.7 32.0 31.5 31.5 32.2 29.2 30.5 30.6 32.9 25.4 27.4 28.2 30.4 +2.2 Other MSA — — 33.5 29.8 26.9 29.9 31.7 33.0 33.7 34.0 35.4 34.5 31.7 29.1 33.5 37.3 31.5 29.0 -2.5 Non-MSA — — 29.4 33.7 32.0 34.4 36.9 28.2 38.2 31.4 32.5 30.5 36.7 29.2 33.2 29.1 29.9 31.4 +1.5Parental Education:a
1.0-2.0 (Low) — — 20.4 20.5 23.6 25.7 25.4 18.8 23.7 24.6 20.8 28.4 22.2 20.0 25.6 25.5 22.0 27.7 +5.7 2.5-3.0 — — 30.2 30.0 26.4 30.3 30.0 27.4 31.5 28.0 30.5 33.1 32.2 27.0 28.7 32.3 29.9 29.5 -0.4 3.5-4.0 — — 31.0 31.3 29.2 29.9 34.4 31.1 32.7 34.1 34.0 31.2 32.0 32.4 30.6 35.1 31.3 31.0 -0.3 4.5-5.0 — — 34.4 29.4 32.8 33.5 36.5 35.8 37.7 36.0 32.8 31.9 36.1 31.0 33.3 33.7 31.3 29.7 -1.6 5.5-6.0 (High) — — 40.5 34.3 30.4 30.7 34.9 34.6 39.8 39.9 40.6 35.5 33.6 34.5 33.4 32.6 32.2 30.1 -2.1Race (2-year average):b
White — — — 34.7 33.6 34.0 36.4 36.6 37.7 39.3 37.8 37.0 37.7 36.6 35.6 36.4 36.5 35.2 -1.3 Black — — — 11.0 12.5 14.1 13.2 13.0 13.8 13.8 14.9 14.9 12.0 12.1 11.7 14.3 15.4 13.5 -1.9 Hispanic — — — 27.2 24.8 23.0 24.2 26.2 26.9 25.9 27.5 29.8 25.5 23.5 23.9 24.1 22.2 23.1 +1.0
Notes: Level of significance of difference between the two most recent classes: s = .05, ss = .01, sss = .001. ‘—’ indicates data not available.
Any apparent inconsistency between the change estimate and the prevalence-of-use estimates for the two most recent classes is due to rounding error. See Table D-108 for the
number of subgroup cases. See Appendix B for definition of variables in table. Data based on two of six forms; N is two-sixths of N indicated in Table D-108.
Source: The Monitoring the Future Study, the University of Michigan.
For the data beginning in 2005, see the race/ethnicity note at the end of Appendix D.
Percentage who had been drunk in last thirty daysClass of:
TABLE D-69Been Drunk: Trends in Thirty-Day Prevalence by Subgroups for Twelfth Graders
’05–’06
aParental education is an average score of mother’s education and father’s education. See Appendix B for details.bTo derive percentages for each racial subgroup, data for the specified year and the previous year have been combined to increase subgroup sizes and thus provide more stable estimates.
Caution: Limited sample sizes (see “Notes” above). Use caution in interpreting subgroup trends.
change
356

1991 1992 1993 1994 1995 1996 1997 1998 1999 2000 2001 2002 2003 2004 2005 2006Approx. N = 17,500 18,600 18,300 17,300 17,500 17,800 18,600 18,100 16,700 16,700 16,200 15,100 16,500 17,000 16,800 16,500
Total 12.9 13.4 13.5 14.5 14.5 15.6 14.5 13.7 15.2 14.1 13.2 12.4 11.9 11.4 10.5 10.9 +0.4Gender: Male 14.3 13.9 14.8 16.0 15.1 16.5 15.3 14.4 16.4 14.4 13.7 12.5 12.2 10.8 10.2 10.5 +0.4 Female 11.4 12.8 12.3 13.0 13.9 14.5 13.5 12.7 13.9 13.6 12.4 12.1 11.6 11.8 10.6 10.8 +0.3College Plans: None or under 4 years 24.4 26.4 29.3 29.3 29.2 29.9 30.3 30.5 33.9 29.3 29.6 28.1 27.7 25.1 25.1 22.7 -2.4 Complete 4 years 11.1 11.5 11.3 12.5 12.7 13.3 12.5 11.6 13.0 12.3 11.2 10.9 10.2 10.0 8.9 9.6 +0.7Region: Northeast 10.3 10.7 10.0 12.6 12.6 15.1 13.0 11.3 14.5 13.8 12.6 10.0 9.4 9.8 7.4 9.9 +2.5 North Central 13.4 14.2 12.8 13.7 14.2 16.0 14.2 14.4 17.4 15.6 12.5 12.1 12.9 12.5 11.2 10.8 -0.4 South 14.1 14.8 15.5 14.9 15.7 15.8 15.3 14.2 15.7 13.7 15.3 14.0 13.0 11.6 12.2 12.3 +0.2 West 12.3 12.8 15.0 16.5 14.4 15.3 14.6 13.9 12.2 13.3 11.0 12.1 11.0 11.5 9.5 9.3 -0.1Population Density: Large MSA 12.4 12.5 10.6 12.3 12.3 14.5 13.7 12.2 13.1 12.8 11.1 10.8 11.2 10.6 9.8 10.4 +0.5 Other MSA 12.4 14.0 14.5 15.7 14.2 15.7 14.0 13.0 14.2 12.8 13.2 12.6 10.8 11.3 10.2 10.6 +0.4 Non-MSA 14.4 13.5 15.5 14.4 17.8 16.9 16.4 16.6 19.7 18.5 15.9 13.9 15.1 12.8 11.8 12.3 +0.5Parental Education:a
1.0-2.0 (Low) 21.8 21.8 19.7 20.4 23.2 20.1 22.5 20.0 23.7 22.5 21.0 19.5 20.1 19.2 17.4 17.2 -0.1 2.5-3.0 15.1 16.0 15.6 17.1 17.8 18.4 16.2 16.4 19.6 18.7 16.6 15.2 15.7 14.9 13.6 13.0 -0.6 3.5-4.0 12.8 13.0 13.9 14.8 15.0 15.9 15.8 14.5 16.1 13.2 13.9 13.2 12.9 11.6 11.7 12.2 +0.5 4.5-5.0 10.2 10.3 10.3 11.8 11.0 13.1 11.7 10.9 11.0 10.0 9.8 9.8 8.4 9.5 7.7 8.2 +0.4 5.5-6.0 (High) 9.8 9.5 10.1 11.2 10.5 12.1 10.6 10.7 11.21 11.0 8.1 8.8 8.3 7.2 6.0 7.4 +1.4Race (2-year average):b
White — 12.7 12.6 12.9 13.9 15.1 15.1 14.1 14.3 14.9 13.8 12.7 11.8 11.3 10.8 10.2 -0.6 Black — 9.6 10.7 11.8 10.8 10.4 9.8 9.0 9.9 10.0 9.0 9.4 10.4 9.8 8.2 8.0 -0.3 Hispanic — 20.4 21.4 22.3 22.0 21.0 20.7 20.4 20.9 19.1 17.6 17.8 16.6 16.1 14.8 14.5 -0.3
TABLE D-70
aParental education is an average score of mother’s education and father’s education. See Appendix B for details.bTo derive percentages for each racial subgroup, data for the specified year and the previous year have been combined to increase subgroup sample sizes and thus provide
Source: The Monitoring the Future Study, the University of Michigan.
more stable estimates. For the data beginning in 2005, see the race/ethnicity note at the end of Appendix D.
Alcohol: Trends in Two-Week Prevalence of Five or More Drinks in a Row by Subgroups for Eighth Graders
Notes: Level of significance of difference between the two most recent classes: s = .05, ss = .01, sss = .001. ‘—’ indicates data not available.
Any apparent inconsistency between the change estimate and the prevalence-of-use estimates for the two most recent classes is due to rounding error.
See Table D-106 for the number of subgroup cases. See Appendix B for definition of variables in table.
Percentage reporting 5+ drinks in a row on one or more occasions’05–’06change
357

1991 1992 1993 1994 1995 1996 1997 1998 1999 2000 2001 2002 2003 2004 2005 2006Approx. N = 14,800 14,800 15,300 15,800 17,000 15,600 15,500 15,000 13,600 14,300 14,000 14,300 15,800 16,400 16,200 16,200
Total 22.9 21.1 23.0 23.6 24.0 24.8 25.1 24.3 25.6 26.2 24.9 22.4 22.2 22.0 21.0 21.9 +0.9Gender: Male 26.4 23.7 26.5 28.5 26.3 27.2 28.6 26.7 29.7 29.8 28.6 23.8 23.2 23.8 22.0 22.9 +0.9 Female 19.5 18.6 19.3 18.7 21.5 22.3 21.7 22.2 21.8 22.5 21.4 21.0 21.2 20.2 19.9 20.9 +1.0College Plans: None or under 4 years 33.0 31.8 35.1 36.4 37.5 38.2 39.4 38.2 39.3 39.3 40.2 34.3 34.2 32.9 34.0 33.0 -1.0 Complete 4 years 20.8 18.9 20.5 20.8 21.5 22.5 22.7 22.0 23.4 24.2 22.4 20.4 20.3 20.4 19.3 20.5 +1.2Region: Northeast 25.1 19.9 23.2 21.3 22.1 23.8 23.4 25.6 28.1 25.4 22.7 21.4 23.3 25.5 22.7 22.8 +0.1 North Central 23.7 21.3 23.5 24.8 25.3 25.3 24.0 24.2 27.1 28.3 26.7 22.1 22.0 18.3 20.7 22.3 +1.6 South 22.7 21.5 22.6 24.6 24.5 25.6 25.6 25.2 24.2 24.9 24.2 21.8 21.5 22.4 20.7 21.1 +0.4 West 20.7 21.7 22.5 22.5 23.1 23.6 27.9 21.8 23.8 26.5 25.7 24.9 22.2 22.6 20.2 21.9 +1.7Population Density: Large MSA 21.6 19.3 20.9 19.0 20.2 22.2 22.5 20.0 24.3 25.7 22.6 19.4 19.7 19.6 19.5 21.0 +1.5 Other MSA 22.1 20.0 21.2 24.4 24.1 24.9 24.8 24.0 24.6 25.4 23.9 22.7 22.1 23.4 21.2 21.4 +0.2 Non-MSA 25.5 25.2 28.1 26.8 28.1 27.6 28.9 30.1 29.3 28.2 29.5 26.2 26.2 22.2 22.7 24.6 +1.9Parental Education:a
1.0-2.0 (Low) 25.7 25.6 26.8 25.5 30.5 27.2 25.5 26.5 28.4 27.5 26.3 26.7 27.2 27.1 24.1 22.7 -1.4 2.5-3.0 26.0 22.4 25.7 25.7 26.7 27.8 26.1 27.9 28.7 29.4 27.4 25.1 24.3 24.4 23.6 25.4 +1.8 3.5-4.0 21.7 21.3 22.8 24.7 24.6 25.4 26.5 24.8 25.6 26.1 25.6 22.7 22.6 22.6 21.0 22.9 +1.9 4.5-5.0 20.8 19.7 19.9 21.7 21.6 22.0 23.1 21.5 23.3 25.0 23.4 19.1 19.6 19.7 19.4 19.8 +0.3 5.5-6.0 (High) 22.4 19.5 20.4 19.3 19.0 24.0 24.0 21.5 24.9 24.6 23.1 20.6 19.9 20.4 19.4 20.3 +0.8Race (2-year average):b
White — 23.2 23.0 24.5 25.4 26.2 26.9 27.0 27.2 28.1 27.4 25.5 24.5 24.0 23.5 23.4 -0.1 Black — 15.0 14.8 14.0 13.3 12.2 12.7 12.8 12.7 12.9 12.6 12.4 12.1 11.6 11.0 11.2 +0.2 Hispanic — 22.9 23.8 24.2 26.8 29.6 27.5 26.3 27.5 28.3 27.7 26.5 26.1 26.9 26.0 24.6 -1.5
change
Alcohol: Trends in Two-Week Prevalence of Five or More Drinks in a Row by Subgroups for Tenth Graders
Notes: Level of significance of difference between the two most recent classes: s = .05, ss = .01, sss = .001. ‘—’ indicates data not available.
Any apparent inconsistency between the change estimate and the prevalence-of-use estimates for the two most recent classes is due to rounding error.
Source: The Monitoring the Future Study, the University of Michigan.
TABLE D-71
Percentage reporting 5+ drinks in a row on one or more occasions’05–’06
aParental education is an average score of mother’s education and father’s education. See Appendix B for details.bTo derive percentages for each racial subgroup, data for the specified year and the previous year have been combined to increase subgroup sample sizes and thus provide
more stable estimates. For the data beginning in 2005, see the race/ethnicity note at the end of Appendix D.
See Table D-107 for the number of subgroup cases. See Appendix B for definition of variables in table.
358

1975 1976 1977 1978 1979 1980 1981 1982 1983 1984 1985 1986 1987 1988 1989 1990Approx. N = 9,400 15,400 17,100 17,800 15,500 15,900 17,500 17,700 16,300 15,900 16,000 15,200 16,300 16,300 16,700 15,200
Total 36.8 37.1 39.4 40.3 41.2 41.2 41.4 40.5 40.8 38.7 36.7 36.8 37.5 34.7 33.0 32.2Gender: Male 49.0 47.9 50.0 51.4 51.9 52.1 51.6 49.8 50.4 47.5 45.3 46.1 46.1 43.0 41.2 39.1 Female 26.4 25.9 29.3 29.6 30.9 30.5 30.8 31.1 31.0 29.6 28.2 28.1 29.2 26.5 24.9 24.4College Plans: None or under 4 years — 41.8 44.7 44.3 44.5 46.3 46.7 45.7 44.9 43.5 41.6 41.3 42.7 38.5 38.2 35.8 Complete 4 years — 31.5 33.9 35.9 37.7 36.9 37.4 36.5 37.2 34.6 33.0 34.1 35.0 32.8 30.5 30.3Region: Northeast 43.0 40.8 40.0 43.5 47.4 48.0 49.3 43.3 42.2 42.9 42.4 37.1 37.2 34.3 33.3 37.2 North Central 40.6 42.8 44.5 45.3 44.8 45.4 44.9 47.9 47.2 44.3 39.7 42.6 43.5 39.9 40.4 37.9 South 32.1 30.8 36.3 36.4 36.7 34.4 34.7 34.6 37.6 33.5 29.7 31.7 33.4 30.4 28.5 27.2 West 29.0 32.8 34.2 33.3 34.0 36.0 35.6 32.5 33.3 34.5 36.1 35.9 36.6 35.4 30.8 26.3Population Density: Large MSA 37.9 37.0 38.1 39.5 42.2 44.8 43.4 40.9 38.8 37.9 37.6 36.4 34.8 32.5 28.8 34.5 Other MSA 36.1 36.8 39.5 40.1 40.8 38.9 39.5 39.7 41.0 37.3 35.4 35.5 38.6 35.3 33.7 31.8 Non-MSA 36.9 38.0 40.5 41.3 40.9 41.4 42.2 41.3 42.0 41.2 37.6 39.1 38.3 35.9 35.8 30.6Parental Education:a
1.0-2.0 (Low) 31.6 34.1 35.6 36.3 36.0 37.0 37.0 35.3 37.2 34.8 31.8 31.7 33.9 30.7 25.4 25.3 2.5-3.0 37.5 41.1 41.8 40.9 42.3 43.3 43.2 41.4 41.2 39.8 38.2 37.9 38.9 35.7 34.0 32.7 3.5-4.0 35.1 36.4 39.5 41.3 41.4 42.1 42.4 42.4 40.9 39.3 36.9 37.9 38.3 34.7 34.3 32.0 4.5-5.0 34.4 36.9 37.2 42.4 43.8 40.8 40.8 41.9 41.9 38.6 37.1 37.1 37.2 35.1 34.2 34.5 5.5-6.0 (High) 29.9 34.5 41.1 37.2 41.9 38.5 39.3 40.9 42.1 38.2 34.9 36.7 37.2 34.7 31.8 34.1Race (2-year average):b
White — — 40.5 42.4 43.5 44.3 44.9 44.9 44.5 43.6 41.5 40.3 40.9 40.0 37.9 36.6 Black — — 19.0 19.3 18.9 17.7 17.1 17.1 18.3 17.2 15.7 16.4 15.8 15.2 15.7 14.4 Hispanic — — 36.4 37.2 33.6 33.1 34.8 32.9 32.5 33.0 31.7 30.8 33.0 33.7 28.8 25.6
Class of:
TABLE D-72Alcohol: Trends in Two-Week Prevalence of Five or More Drinks in a Row by Subgroups for Twelfth Graders
Percentage reporting 5+ drinks in a row on one or more occasions
Source: The Monitoring the Future Study, the University of Michigan.
Notes: Level of significance of difference between the two most recent classes: s = .05, ss = .01, sss = .001. ‘—’ indicates data not available.
Any apparent inconsistency between the change estimate and the prevalence-of-use estimates for the two most recent classes is due to rounding error.
See Table D-108 for the number of subgroup cases. See Appendix B for definition of variables in table.
Cont'd
359

1991 1992 1993 1994 1995 1996 1997 1998 1999 2000 2001 2002 2003 2004 2005c 2006c
Approx. N = 15,000 15,800 16,300 15,400 15,400 14,300 15,400 15,200 13,600 12,800 12,800 12,900 14,600 14,600 14,700 14,200Total 29.8 27.9 27.5 28.2 29.8 30.2 31.3 31.5 30.8 30.0 29.7 28.6 27.9 29.2 27.1 25.4 -1.6Gender: Male 37.8 35.6 34.6 37.0 36.9 37.0 37.9 39.2 38.1 36.7 36.0 34.2 34.2 34.3 32.6 28.9 -3.7 ss Female 21.2 20.3 20.7 20.2 23.0 23.5 24.4 24.0 23.6 23.5 23.7 23.0 22.1 24.2 21.6 21.5 -0.1College Plans: None or under 4 years 34.4 32.8 32.7 34.0 35.2 33.9 36.2 36.3 35.4 35.7 35.9 34.0 34.5 34.6 34.3 32.3 -2.0 Complete 4 years 27.9 26.0 25.8 26.3 27.8 28.8 29.5 30.0 29.5 27.6 27.8 27.2 25.9 27.6 25.1 23.7 -1.4Region: Northeast 33.4 25.8 30.3 29.2 31.2 33.7 33.5 33.5 33.7 35.1 31.8 30.7 30.9 33.2 32.2 30.9 -1.2 North Central 34.6 34.6 30.1 31.9 34.3 31.5 31.6 32.6 31.6 33.9 34.5 33.4 32.5 30.2 29.1 26.5 -2.6 South 26.3 24.7 27.1 26.9 28.6 30.2 30.6 30.7 30.0 24.9 26.6 26.8 23.7 26.1 24.2 23.9 -0.3 West 26.3 26.0 22.0 24.5 24.2 24.0 29.6 29.5 28.6 29.3 26.0 23.9 26.5 28.6 24.5 22.0 -2.5Population Density: Large MSA 28.6 25.5 27.6 26.8 28.3 29.8 29.9 27.9 27.1 29.7 29.0 29.9 23.3 25.5 26.5 26.6 +0.1 Other MSA 30.1 27.0 26.5 27.1 28.4 30.3 31.1 33.1 32.2 29.3 29.0 28.0 29.8 31.9 27.4 25.0 -2.4 Non-MSA 30.4 31.9 29.2 31.5 34.0 30.5 33.2 32.4 32.4 31.7 31.9 28.2 30.5 28.2 27.0 24.5 -2.5Parental Education:a
1.0-2.0 (Low) 26.8 23.4 21.9 24.0 26.6 24.8 22.6 26.3 27.4 25.1 24.8 22.2 23.5 22.9 19.4 25.4 +6.0 s 2.5-3.0 29.9 28.1 27.6 28.5 31.2 28.6 30.4 30.3 30.8 29.2 30.2 28.5 27.6 28.8 28.3 25.8 -2.5 3.5-4.0 30.4 27.9 28.4 28.4 29.5 29.8 31.0 33.2 30.5 30.5 30.3 28.6 28.4 30.9 27.6 26.5 -1.1 4.5-5.0 29.9 28.1 28.4 29.3 29.9 32.4 32.4 32.3 30.6 29.9 30.9 30.9 28.6 30.5 29.4 24.0 -5.3 sss 5.5-6.0 (High) 30.6 30.4 29.0 29.0 30.7 33.1 34.9 32.4 34.2 32.7 28.6 30.6 28.7 27.8 25.2 26.3 +1.1Race (2-year average):b
White 34.6 32.1 31.3 31.5 32.3 33.4 35.1 36.4 35.7 34.6 34.5 33.7 32.4 32.5 32.5 30.4 -2.1 Black 11.7 11.3 12.6 14.4 14.9 15.3 13.4 12.3 12.3 11.5 11.8 11.5 10.8 11.4 11.3 11.4 +0.1 Hispanic 27.9 31.1 27.2 24.3 26.6 27.1 27.6 28.1 29.3 31.0 28.4 26.4 25.9 26.0 23.9 23.3 -0.6
TABLE D-72 (cont'd)Alcohol: Trends in Two-Week Prevalence of Five or More Drinks in a Row by Subgroups for Twelfth Graders
aParental education is an average score of mother’s education and father’s education. See Appendix B for details.bTo derive percentages for each racial subgroup, data for the specified year and the previous year have been combined to increase subgroup sample sizes and thus provide
Percentage reporting 5+ drinks in a row on one or more occasions
cDue to a coding error, previous versions of this table contained slightly incorrect values for 2005 and 2006.
more stable estimates. For the data beginning in 2005, see the race/ethnicity note at the end of Appendix D.
’05–’06change
Class of:
360

1991 1992 1993 1994 1995 1996 1997 1998 1999 2000 2001 2002 2003 2004 2005 2006Approx. N = 17,500 18,600 18,300 17,300 17,500 17,800 18,600 18,100 16,700 16,700 16,200 15,100 16,500 17,000 16,800 16,500
Total 16.2 16.9 17.4 18.3 18.8 18.4 16.7 16.2 16.6 15.2 15.0 12.3 12.0 14.4 12.8 12.5 -0.2Gender: Male 19.1 18.6 19.1 21.2 20.4 19.9 18.6 17.7 19.4 16.8 16.5 12.2 12.4 14.0 12.9 13.0 +0.1 Female 13.5 15.3 16.1 16.0 17.0 17.1 14.6 14.7 14.1 13.5 13.6 12.2 11.4 14.6 12.9 11.9 -0.9College Plans: None or under 4 years 26.4 27.7 32.2 32.8 36.0 33.0 33.9 32.6 35.5 29.6 32.9 27.4 28.7 26.4 26.3 24.7 -1.7 Complete 4 years 14.6 15.4 15.6 16.6 16.8 16.3 14.6 14.4 14.3 13.8 12.9 11.1 10.2 13.1 11.5 11.4 -0.1Region: Northeast 14.0 14.0 14.9 18.6 19.3 21.7 18.4 14.7 18.5 14.2 18.7 10.8 12.3 15.1 11.4 11.4 0.0 North Central 16.4 18.0 16.7 18.0 17.4 19.3 16.8 18.4 17.5 17.0 13.2 10.2 14.0 15.9 11.4 13.2 +1.9 South 17.8 18.5 19.1 18.2 20.1 16.6 15.5 16.1 17.2 14.2 14.3 14.0 11.4 14.4 15.0 13.3 -1.6 West 14.9 15.1 18.0 18.8 17.6 17.8 17.2 15.1 12.6 15.7 15.3 13.9 10.3 12.2 11.4 11.4 0.0Population Density: Large MSA 15.0 18.7 15.1 15.2 12.0 16.2 15.0 13.8 14.3 14.0 12.0 11.5 11.0 14.2 11.4 11.9 +0.4 Other MSA 16.1 16.8 17.6 19.4 19.1 19.6 15.9 14.3 16.5 14.1 15.5 12.4 11.9 13.9 13.6 12.1 -1.4 Non-MSA 17.8 15.4 19.8 18.3 21.8 18.8 19.6 22.7 19.4 18.8 17.2 13.2 13.5 15.6 13.1 14.3 +1.2Parental Education:a
1.0-2.0 (Low) 22.0 22.5 21.5 24.4 23.9 19.7 21.6 21.9 25.4 23.2 21.3 24.1 17.1 23.7 22.6 17.3 -5.3 2.5-3.0 18.2 18.4 19.5 19.7 22.8 21.3 21.2 17.4 19.7 20.7 18.4 14.8 15.1 17.8 15.8 16.8 +1.0 3.5-4.0 15.7 18.0 19.4 19.7 19.6 20.2 18.5 17.9 16.9 13.5 18.1 13.5 14.3 15.0 13.9 13.6 -0.2 4.5-5.0 14.4 13.4 14.9 15.3 15.6 17.8 12.7 12.6 12.3 12.0 10.0 8.4 7.4 11.9 11.2 9.4 -1.8 5.5-6.0 (High) 13.5 14.6 14.4 17.2 14.2 13.2 14.1 17.0 16.0 11.4 9.7 10.3 10.2 13.3 6.7 9.3 +2.6Race (2-year average):b
White — 16.7 17.6 17.9 19.0 19.7 18.8 17.4 17.4 16.8 15.5 13.5 12.0 13.5 14.0 12.7 -1.3 Black — 12.6 13.0 15.8 14.5 11.1 9.7 8.1 9.7 9.7 7.9 7.2 7.5 8.1 7.6 8.5 +0.9 Hispanic — 23.9 24.2 22.2 23.3 23.7 21.8 19.9 19.5 19.8 20.7 21.8 19.6 18.4 18.3 17.1 -1.3
See Table D-106 for the number of subgroup cases. See Appendix B for definition of variables in table.
TABLE D-73 Beer: Trends in Thirty-Day Prevalence of Use by Subgroups for Eighth Graders
Notes: Level of significance of difference between the two most recent classes: s = .05, ss = .01, sss = .001. ‘—’ indicates data not available.
Any apparent inconsistency between the change estimate and the prevalence-of-use estimates for the two most recent classes is due to rounding error.
Percentage who used in last thirty days’05–’06change
Source: The Monitoring the Future Study, the University of Michigan.
For the data beginning in 2005, see the race/ethnicity note at the end of Appendix D.
Data based on one of two forms in 1991–96; N is one-half of N indicated in Table D-106. Data based on one of four forms beginning in 1997; N is one-third of N indicated in Table D-106.
aParental education is an average score of mother’s education and father’s education. See Appendix B for details.
Caution: Limited sample sizes (see “Notes” above). Use caution in interpreting subgroup trends.
bTo derive percentages for each racial subgroup, data for the specified year and the previous year have been combined to increase subgroup sample sizes and thus provide more stable estimates.
361
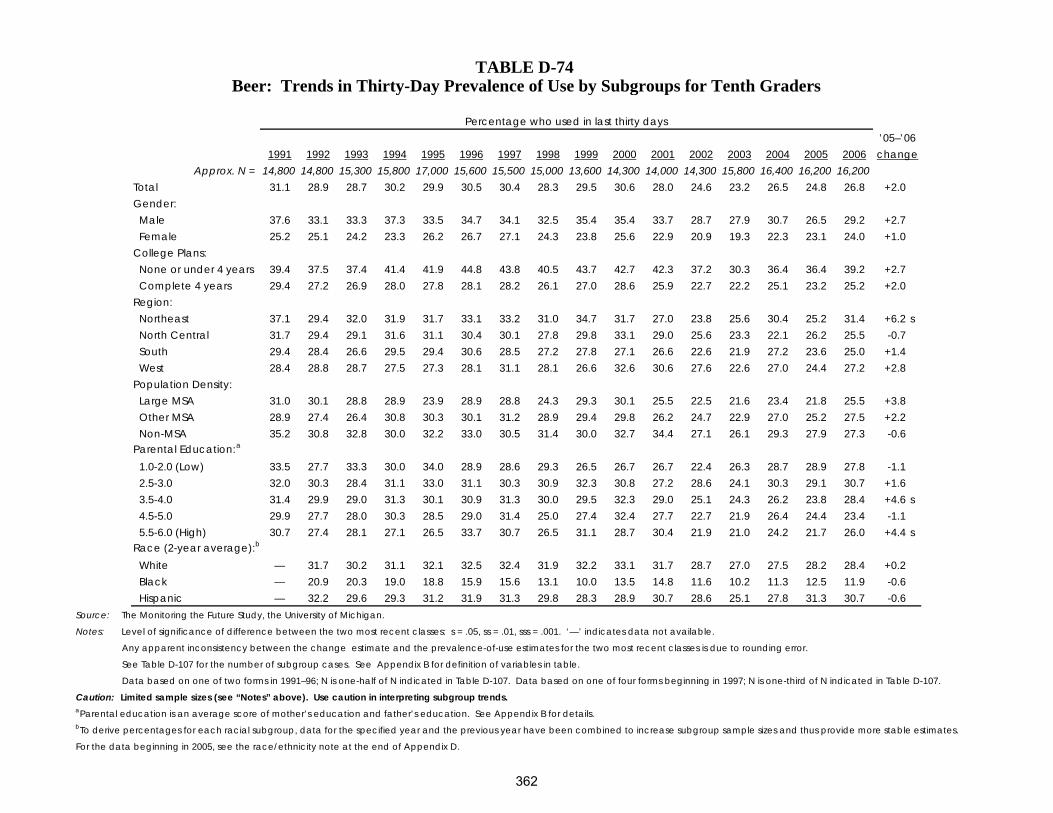
1991 1992 1993 1994 1995 1996 1997 1998 1999 2000 2001 2002 2003 2004 2005 2006Approx. N = 14,800 14,800 15,300 15,800 17,000 15,600 15,500 15,000 13,600 14,300 14,000 14,300 15,800 16,400 16,200 16,200
Total 31.1 28.9 28.7 30.2 29.9 30.5 30.4 28.3 29.5 30.6 28.0 24.6 23.2 26.5 24.8 26.8 +2.0Gender: Male 37.6 33.1 33.3 37.3 33.5 34.7 34.1 32.5 35.4 35.4 33.7 28.7 27.9 30.7 26.5 29.2 +2.7 Female 25.2 25.1 24.2 23.3 26.2 26.7 27.1 24.3 23.8 25.6 22.9 20.9 19.3 22.3 23.1 24.0 +1.0College Plans: None or under 4 years 39.4 37.5 37.4 41.4 41.9 44.8 43.8 40.5 43.7 42.7 42.3 37.2 30.3 36.4 36.4 39.2 +2.7 Complete 4 years 29.4 27.2 26.9 28.0 27.8 28.1 28.2 26.1 27.0 28.6 25.9 22.7 22.2 25.1 23.2 25.2 +2.0Region: Northeast 37.1 29.4 32.0 31.9 31.7 33.1 33.2 31.0 34.7 31.7 27.0 23.8 25.6 30.4 25.2 31.4 +6.2 s North Central 31.7 29.4 29.1 31.6 31.1 30.4 30.1 27.8 29.8 33.1 29.0 25.6 23.3 22.1 26.2 25.5 -0.7 South 29.4 28.4 26.6 29.5 29.4 30.6 28.5 27.2 27.8 27.1 26.6 22.6 21.9 27.2 23.6 25.0 +1.4 West 28.4 28.8 28.7 27.5 27.3 28.1 31.1 28.1 26.6 32.6 30.6 27.6 22.6 27.0 24.4 27.2 +2.8Population Density: Large MSA 31.0 30.1 28.8 28.9 23.9 28.9 28.8 24.3 29.3 30.1 25.5 22.5 21.6 23.4 21.8 25.5 +3.8 Other MSA 28.9 27.4 26.4 30.8 30.3 30.1 31.2 28.9 29.4 29.8 26.2 24.7 22.9 27.0 25.2 27.5 +2.2 Non-MSA 35.2 30.8 32.8 30.0 32.2 33.0 30.5 31.4 30.0 32.7 34.4 27.1 26.1 29.3 27.9 27.3 -0.6Parental Education:a
1.0-2.0 (Low) 33.5 27.7 33.3 30.0 34.0 28.9 28.6 29.3 26.5 26.7 26.7 22.4 26.3 28.7 28.9 27.8 -1.1 2.5-3.0 32.0 30.3 28.4 31.1 33.0 31.1 30.3 30.9 32.3 30.8 27.2 28.6 24.1 30.3 29.1 30.7 +1.6 3.5-4.0 31.4 29.9 29.0 31.3 30.1 30.9 31.3 30.0 29.5 32.3 29.0 25.1 24.3 26.2 23.8 28.4 +4.6 s 4.5-5.0 29.9 27.7 28.0 30.3 28.5 29.0 31.4 25.0 27.4 32.4 27.7 22.7 21.9 26.4 24.4 23.4 -1.1 5.5-6.0 (High) 30.7 27.4 28.1 27.1 26.5 33.7 30.7 26.5 31.1 28.7 30.4 21.9 21.0 24.2 21.7 26.0 +4.4 sRace (2-year average):b
White — 31.7 30.2 31.1 32.1 32.5 32.4 31.9 32.2 33.1 31.7 28.7 27.0 27.5 28.2 28.4 +0.2 Black — 20.9 20.3 19.0 18.8 15.9 15.6 13.1 10.0 13.5 14.8 11.6 10.2 11.3 12.5 11.9 -0.6 Hispanic — 32.2 29.6 29.3 31.2 31.9 31.3 29.8 28.3 28.9 30.7 28.6 25.1 27.8 31.3 30.7 -0.6
TABLE D-74 Beer: Trends in Thirty-Day Prevalence of Use by Subgroups for Tenth Graders
Notes: Level of significance of difference between the two most recent classes: s = .05, ss = .01, sss = .001. ‘—’ indicates data not available.
Any apparent inconsistency between the change estimate and the prevalence-of-use estimates for the two most recent classes is due to rounding error.
Percentage who used in last thirty days’05–’06change
Source: The Monitoring the Future Study, the University of Michigan.
For the data beginning in 2005, see the race/ethnicity note at the end of Appendix D.
See Table D-107 for the number of subgroup cases. See Appendix B for definition of variables in table.
Data based on one of two forms in 1991–96; N is one-half of N indicated in Table D-107. Data based on one of four forms beginning in 1997; N is one-third of N indicated in Table D-107.
aParental education is an average score of mother’s education and father’s education. See Appendix B for details.bTo derive percentages for each racial subgroup, data for the specified year and the previous year have been combined to increase subgroup sample sizes and thus provide more stable estimates.
Caution: Limited sample sizes (see “Notes” above). Use caution in interpreting subgroup trends.
362

1975 1976 1977 1978 1979 1980 1981 1982 1983 1984 1985 1986 1987 1988 1989 1990Approx. N = — 15,400 17,100 17,800 15,500 15,900 17,500 17,700 16,300 15,900 16,000 15,200 16,300 16,300 16,700 15,200
Total — 59.8 62.1 62.3 63.7 62.9 62.7 60.3 61.7 59.5 56.7 55.5 56.2 53.3 51.4 47.2Gender: Male — 68.6 73.1 73.0 74.0 74.3 71.4 68.3 69.7 67.4 64.5 64.3 64.9 61.8 59.7 55.7 Female — 51.3 52.8 52.7 54.5 52.4 53.9 52.7 54.0 51.8 49.4 47.9 48.1 46.3 43.4 38.0College Plans: None or under 4 years — 62.1 64.6 65.2 65.7 68.3 65.0 64.6 62.4 62.7 59.8 54.2 58.2 57.3 55.5 46.5 Complete 4 years — 57.6 60.3 59.5 61.6 58.4 61.0 57.4 61.1 57.4 55.1 55.7 55.1 51.8 49.4 47.5Region: Northeast — 64.9 65.9 64.7 71.9 67.6 67.1 65.7 68.3 62.6 64.4 51.5 56.8 54.8 54.2 52.7 North Central — 65.4 66.9 68.3 66.1 64.9 67.5 66.1 66.6 66.8 57.4 66.3 61.4 59.8 58.5 50.3 South — 53.2 55.3 58.4 59.2 60.3 57.5 53.0 56.5 53.7 51.0 48.6 52.1 47.6 46.1 42.0 West — 52.8 59.4 54.2 56.1 57.7 56.9 52.8 53.8 55.3 56.4 54.4 54.8 52.7 48.5 45.4Population Density: Large MSA — 62.5 64.2 62.8 65.3 67.7 63.8 63.3 63.1 58.8 56.0 55.1 56.9 52.6 50.1 52.3 Other MSA — 58.6 62.0 62.4 62.3 62.1 61.9 58.6 59.4 56.6 56.8 55.1 56.4 53.0 51.6 47.3 Non-MSA — 59.3 60.7 61.7 64.4 60.5 63.0 60.0 63.6 63.7 57.3 56.3 55.4 54.3 52.1 42.4Parental Education:a
1.0-2.0 (Low) — 58.5 48.3 54.6 52.9 55.9 54.7 56.8 58.8 51.1 52.2 46.8 55.8 47.1 45.3 42.2 2.5-3.0 — 62.7 64.8 63.6 64.5 66.1 65.4 58.5 59.8 62.4 56.8 54.6 53.6 51.9 52.4 47.5 3.5-4.0 — 58.4 66.0 62.7 67.1 64.4 64.0 63.9 62.3 61.2 57.9 56.0 56.0 51.5 52.2 45.8 4.5-5.0 — 62.6 64.4 64.7 68.4 58.4 60.1 60.0 66.2 61.9 60.5 57.6 59.9 58.2 51.4 49.3 5.5-6.0 (High) — 64.1 69.3 68.3 63.6 69.3 68.9 68.3 65.9 54.2 55.4 62.5 57.7 57.4 53.2 53.4Race (2-year average):b
White — — 63.8 65.2 65.9 66.3 66.3 65.4 64.6 64.6 62.2 59.9 59.6 59.1 57.0 54.1 Black — — 38.7 36.4 37.4 38.7 38.8 37.2 39.2 36.9 33.1 32.7 28.6 30.3 32.6 28.4 Hispanic — — 52.7 54.3 52.3 52.5 47.7 47.5 43.4 40.7 46.5 50.9 55.4 49.2 40.4 36.6
TABLE D-75Beer: Trends in Thirty-Day Prevalence of Use by Subgroups for Twelfth Graders
Class of:Percentage who used in last thirty days
Source: The Monitoring the Future Study, the University of Michigan.
See Table D-108 for the number of subgroup cases. See Appendix B for definition of variables in table. Data based on one of five forms in 1976–88; N is
Caution: Limited sample sizes (see “Notes” above). Use caution in interpreting subgroup trends.
Notes: Level of significance of difference between the two most recent classes: s = .05, ss = .01, sss = .001. ‘—’ indicates data not available.
one-fifth of N indicated in Table D-108. Data based on one of six forms beginning in 1989; N is one-sixth of N indicated in Table D-108.
Any apparent inconsistency between the change estimate and the prevalence-of-use estimates for the two most recent classes is due to rounding error.
Cont'd
363

1991 1992 1993 1994 1995 1996 1997 1998 1999 2000 2001 2002 2003 2004 2005 2006Approx. N = 15,000 15,800 16,300 15,400 15,400 14,300 15,400 15,200 13,600 12,800 12,800 12,900 14,600 14,600 14,700 14,200
Total 47.2 42.0 43.4 42.6 44.9 46.9 44.4 45.6 42.7 42.7 41.5 39.7 37.8 38.3 38.0 35.5 -2.4Gender: Male 55.3 50.1 50.0 51.2 53.0 53.5 49.7 55.0 48.2 51.7 50.9 44.3 44.5 44.1 47.3 39.7 -7.7 ss Female 39.3 34.6 37.2 35.6 37.4 40.2 39.9 37.0 36.9 33.9 32.1 34.4 31.7 32.1 30.4 31.1 +0.7College Plans: None or under 4 years 52.4 48.8 48.2 47.1 50.1 46.2 44.6 49.6 47.5 42.4 54.1 45.7 39.4 44.0 45.1 46.2 +1.1 Complete 4 years 45.2 39.9 41.5 41.6 42.8 47.0 44.4 44.4 41.7 42.4 38.4 37.9 37.2 36.6 36.6 33.4 -3.2Region: Northeast 49.5 40.8 47.0 43.3 47.0 56.9 47.5 52.6 54.3 48.9 47.2 43.4 41.9 42.6 41.3 42.9 +1.5 North Central 53.5 49.1 46.3 48.0 49.7 48.1 43.3 44.6 45.4 47.6 48.1 42.9 43.1 41.4 40.5 35.8 -4.7 South 41.1 39.5 43.0 40.4 43.8 44.4 43.3 43.2 36.6 35.1 33.6 35.1 32.0 34.2 33.8 34.2 +0.4 West 46.0 36.7 37.0 38.2 37.8 38.8 44.5 45.5 40.2 43.5 39.9 39.8 36.9 36.1 38.8 31.3 -7.5 ssPopulation Density: Large MSA 44.4 42.3 44.0 42.8 45.9 49.1 45.5 42.1 39.9 45.2 38.0 40.5 36.3 34.2 37.9 35.1 -2.8 Other MSA 47.6 40.3 42.0 39.4 43.7 46.9 45.0 47.6 42.8 40.7 42.6 38.8 38.9 38.9 38.4 37.2 -1.2 Non-MSA 48.8 45.1 45.3 47.6 46.0 45.3 41.9 45.6 45.4 43.2 43.3 40.5 37.5 41.4 37.1 33.0 -4.1Parental Education:a
1.0-2.0 (Low) 48.1 36.6 41.1 37.0 43.1 31.2 30.4 37.0 35.4 37.2 39.1 41.6 30.9 34.1 32.9 27.5 -5.4 2.5-3.0 46.7 41.4 43.7 44.4 44.0 42.4 41.5 42.8 43.0 37.4 48.0 36.6 36.2 38.0 35.8 38.1 +2.3 3.5-4.0 48.4 40.7 44.4 42.2 42.8 48.2 46.3 48.9 42.5 45.1 35.8 40.9 39.9 43.0 38.4 35.7 -2.7 4.5-5.0 46.4 43.8 41.9 41.1 47.1 47.1 47.7 48.9 40.0 43.9 43.6 39.9 38.4 36.1 42.4 35.3 -7.1 5.5-6.0 (High) 46.1 47.0 47.7 46.6 49.6 58.0 49.9 44.5 51.8 52.0 42.3 45.2 41.4 38.7 37.6 38.4 +0.8Race (2-year average):b
White 51.6 48.3 46.0 46.5 47.8 50.1 50.7 49.9 47.7 45.8 46.7 45.4 43.1 42.1 42.3 41.8 -0.5 Black 25.3 24.2 28.0 29.9 25.6 28.4 25.5 22.8 22.3 21.7 20.6 16.9 14.0 15.7 18.0 14.8 -3.2 Hispanic 40.3 44.7 39.8 40.5 41.7 41.3 39.8 39.0 43.6 45.3 42.6 40.8 37.2 36.7 39.2 35.4 -3.8
TABLE D-75 (cont'd)Beer: Trends in Thirty-Day Prevalence of Use by Subgroups for Twelfth Graders
aParental education is an average score of mother’s education and father’s education. See Appendix B for details.bTo derive percentages for each racial subgroup, data for the specified year and the previous year have been combined to increase subgroup sample sizes and thus provide
Percentage who used in last thirty days
more stable estimates. For the data beginning in 2005, see the race/ethnicity note at the end of Appendix D.
’05–’06change
Class of:
364

1991 1992 1993 1994 1995 1996 1997 1998 1999 2000 2001 2002 2003 2004 2005 2006Approx. N = 17,500 18,600 18,300 17,300 17,500 17,800 18,600 18,100 16,700 16,700 16,200 15,100 16,500 17,000 16,800 16,500
Total 7.2 7.3 8.2 8.5 8.5 9.2 7.6 8.0 8.3 7.5 8.1 6.1 5.5 6.8 5.8 5.5 -0.3Gender: Male 9.2 8.9 9.4 10.6 9.8 10.1 9.2 10.0 10.5 8.8 9.4 6.5 5.8 6.4 5.5 5.9 +0.4 Female 5.2 5.9 7.1 6.7 7.4 8.2 6.0 6.3 6.2 6.3 7.0 5.5 5.1 6.9 6.2 4.9 -1.3College Plans: None or under 4 years 15.4 18.2 18.4 20.7 17.5 19.7 22.0 21.6 24.8 21.9 25.4 19.0 17.5 19.0 16.7 13.9 -2.8 Complete 4 years 5.9 5.8 6.9 7.1 7.5 7.6 6.0 6.6 6.2 6.1 6.3 5.0 4.2 5.5 4.9 4.7 -0.2Region: Northeast 4.8 5.5 5.8 8.1 9.3 10.7 7.6 6.6 9.1 5.7 9.4 3.5 5.6 6.5 3.7 4.1 +0.4 North Central 6.9 7.0 7.6 8.8 8.0 9.2 8.4 10.0 9.3 8.9 7.8 5.6 7.0 8.3 4.7 5.9 +1.1 South 8.9 9.0 9.4 8.1 8.8 8.4 6.9 8.0 8.9 7.1 7.9 6.7 5.1 6.4 7.4 6.3 -1.1 West 7.0 6.7 9.2 9.1 8.1 9.2 7.9 7.1 5.3 8.0 7.9 8.4 4.2 6.0 6.0 4.9 -1.1Population Density: Large MSA 6.6 7.4 6.1 6.9 5.3 8.5 5.6 6.7 6.2 6.0 5.4 5.0 4.2 5.6 4.9 4.1 -0.9 Other MSA 7.0 7.6 8.2 9.1 8.8 9.3 7.4 6.6 8.6 6.4 8.4 6.0 5.3 6.4 6.0 5.4 -0.7 Non-MSA 8.4 6.8 10.7 8.4 9.8 9.8 9.6 12.3 10.2 11.5 10.5 7.7 7.3 8.9 6.6 7.8 +1.2Parental Education:a
1.0-2.0 (Low) 12.6 12.5 11.0 11.6 12.5 12.8 9.8 12.6 17.9 14.8 11.5 11.2 9.4 11.9 14.0 8.9 -5.0 2.5-3.0 7.7 8.9 9.9 9.3 10.2 10.7 10.1 8.0 9.8 10.9 10.0 8.1 7.2 8.8 8.1 7.1 -1.0 3.5-4.0 7.8 7.0 7.9 9.0 9.8 10.1 8.3 9.0 10.4 6.6 9.1 6.8 6.0 7.9 5.3 5.4 +0.1 4.5-5.0 5.0 4.5 7.3 6.8 6.1 7.5 5.3 5.9 3.9 5.0 5.1 3.7 3.5 5.3 4.3 4.3 -0.1 5.5-6.0 (High) 6.2 6.0 6.2 8.4 5.9 6.7 5.7 8.7 6.1 4.3 5.3 4.8 4.1 4.7 2.4 4.7 +2.2Race (2-year average):b
White — 7.0 7.6 8.0 8.7 9.2 8.6 7.9 8.3 8.3 7.7 6.7 5.7 6.1 5.9 5.2 -0.7 Black — 5.2 5.1 7.2 6.4 4.9 4.4 3.6 4.7 4.9 4.0 3.2 3.0 3.6 3.1 2.7 -0.3 Hispanic — 12.7 13.2 12.1 11.6 12.7 12.3 10.5 10.2 9.8 12.3 13.2 10.3 9.1 10.0 9.0 -1.1
For the data beginning in 2005, see the race/ethnicity note at the end of Appendix D.
bTo derive percentages for each racial subgroup, data for the specified year and the previous year have been combined to increase subgroup sample sizes and thus provide more stable estimates.
TABLE D-76 Beer: Trends in Two-Week Prevalence of Five or More Drinks in a Row by Subgroups for Eighth Graders
Notes: Level of significance of difference between the two most recent classes: s = .05, ss = .01, sss = .001. ‘—’ indicates data not available.
Any apparent inconsistency between the change estimate and the prevalence-of-use estimates for the two most recent classes is due to rounding error.
’05–’06change
See Table D-106 for the number of subgroup cases. See Appendix B for definition of variables in table.
Data based on one of two forms in 1991–96; N is one-half of N indicated in Table D-106. Data based on one of four forms beginning in 1997; N is one-third of N indicated in Table D-106.
aParental education is an average score of mother’s education and father’s education. See Appendix B for details.
Percentage reporting 5+ drinks in a row on one or more occasions
Caution: Limited sample sizes (see “Notes” above). Use caution in interpreting subgroup trends.
Source: The Monitoring the Future Study, the University of Michigan.
365
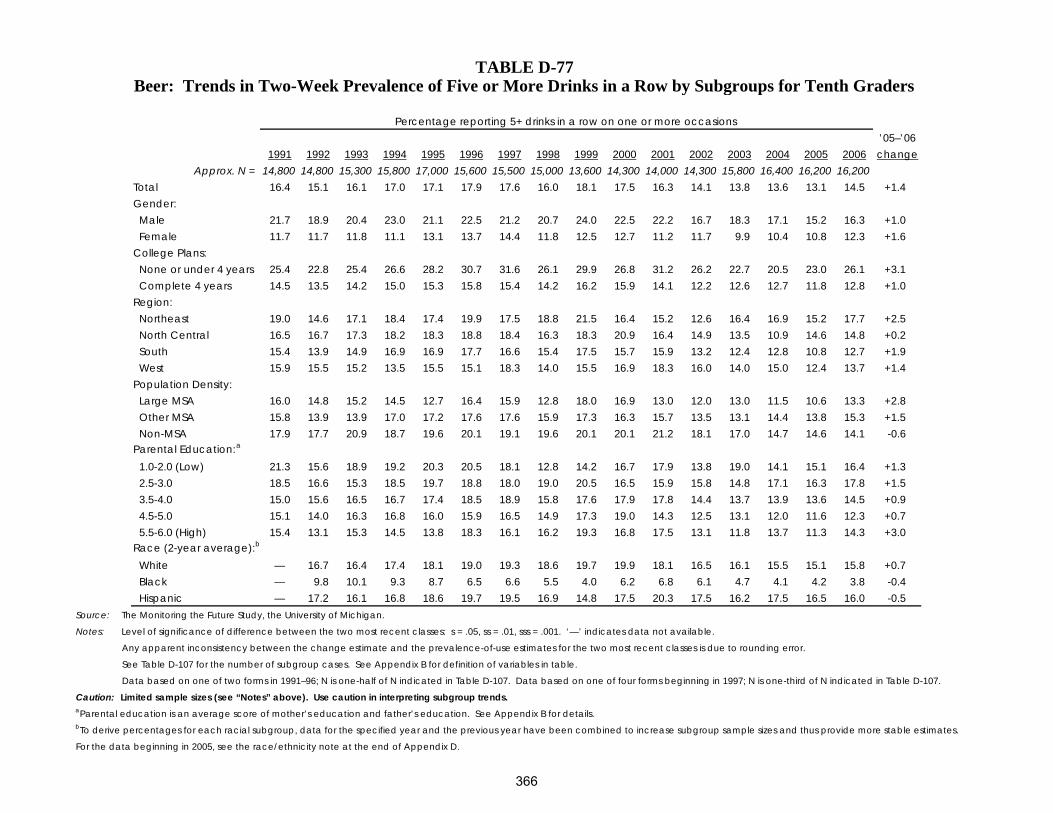
1991 1992 1993 1994 1995 1996 1997 1998 1999 2000 2001 2002 2003 2004 2005 2006Approx. N = 14,800 14,800 15,300 15,800 17,000 15,600 15,500 15,000 13,600 14,300 14,000 14,300 15,800 16,400 16,200 16,200
Total 16.4 15.1 16.1 17.0 17.1 17.9 17.6 16.0 18.1 17.5 16.3 14.1 13.8 13.6 13.1 14.5 +1.4Gender: Male 21.7 18.9 20.4 23.0 21.1 22.5 21.2 20.7 24.0 22.5 22.2 16.7 18.3 17.1 15.2 16.3 +1.0 Female 11.7 11.7 11.8 11.1 13.1 13.7 14.4 11.8 12.5 12.7 11.2 11.7 9.9 10.4 10.8 12.3 +1.6College Plans: None or under 4 years 25.4 22.8 25.4 26.6 28.2 30.7 31.6 26.1 29.9 26.8 31.2 26.2 22.7 20.5 23.0 26.1 +3.1 Complete 4 years 14.5 13.5 14.2 15.0 15.3 15.8 15.4 14.2 16.2 15.9 14.1 12.2 12.6 12.7 11.8 12.8 +1.0Region: Northeast 19.0 14.6 17.1 18.4 17.4 19.9 17.5 18.8 21.5 16.4 15.2 12.6 16.4 16.9 15.2 17.7 +2.5 North Central 16.5 16.7 17.3 18.2 18.3 18.8 18.4 16.3 18.3 20.9 16.4 14.9 13.5 10.9 14.6 14.8 +0.2 South 15.4 13.9 14.9 16.9 16.9 17.7 16.6 15.4 17.5 15.7 15.9 13.2 12.4 12.8 10.8 12.7 +1.9 West 15.9 15.5 15.2 13.5 15.5 15.1 18.3 14.0 15.5 16.9 18.3 16.0 14.0 15.0 12.4 13.7 +1.4Population Density: Large MSA 16.0 14.8 15.2 14.5 12.7 16.4 15.9 12.8 18.0 16.9 13.0 12.0 13.0 11.5 10.6 13.3 +2.8 Other MSA 15.8 13.9 13.9 17.0 17.2 17.6 17.6 15.9 17.3 16.3 15.7 13.5 13.1 14.4 13.8 15.3 +1.5 Non-MSA 17.9 17.7 20.9 18.7 19.6 20.1 19.1 19.6 20.1 20.1 21.2 18.1 17.0 14.7 14.6 14.1 -0.6Parental Education:a
1.0-2.0 (Low) 21.3 15.6 18.9 19.2 20.3 20.5 18.1 12.8 14.2 16.7 17.9 13.8 19.0 14.1 15.1 16.4 +1.3 2.5-3.0 18.5 16.6 15.3 18.5 19.7 18.8 18.0 19.0 20.5 16.5 15.9 15.8 14.8 17.1 16.3 17.8 +1.5 3.5-4.0 15.0 15.6 16.5 16.7 17.4 18.5 18.9 15.8 17.6 17.9 17.8 14.4 13.7 13.9 13.6 14.5 +0.9 4.5-5.0 15.1 14.0 16.3 16.8 16.0 15.9 16.5 14.9 17.3 19.0 14.3 12.5 13.1 12.0 11.6 12.3 +0.7 5.5-6.0 (High) 15.4 13.1 15.3 14.5 13.8 18.3 16.1 16.2 19.3 16.8 17.5 13.1 11.8 13.7 11.3 14.3 +3.0Race (2-year average):b
White — 16.7 16.4 17.4 18.1 19.0 19.3 18.6 19.7 19.9 18.1 16.5 16.1 15.5 15.1 15.8 +0.7 Black — 9.8 10.1 9.3 8.7 6.5 6.6 5.5 4.0 6.2 6.8 6.1 4.7 4.1 4.2 3.8 -0.4 Hispanic — 17.2 16.1 16.8 18.6 19.7 19.5 16.9 14.8 17.5 20.3 17.5 16.2 17.5 16.5 16.0 -0.5
Source: The Monitoring the Future Study, the University of Michigan.
See Table D-107 for the number of subgroup cases. See Appendix B for definition of variables in table.
Data based on one of two forms in 1991–96; N is one-half of N indicated in Table D-107. Data based on one of four forms beginning in 1997; N is one-third of N indicated in Table D-107.
aParental education is an average score of mother’s education and father’s education. See Appendix B for details.
Caution: Limited sample sizes (see “Notes” above). Use caution in interpreting subgroup trends.
For the data beginning in 2005, see the race/ethnicity note at the end of Appendix D.
bTo derive percentages for each racial subgroup, data for the specified year and the previous year have been combined to increase subgroup sample sizes and thus provide more stable estimates.
TABLE D-77 Beer: Trends in Two-Week Prevalence of Five or More Drinks in a Row by Subgroups for Tenth Graders
Notes: Level of significance of difference between the two most recent classes: s = .05, ss = .01, sss = .001. ‘—’ indicates data not available.
Any apparent inconsistency between the change estimate and the prevalence-of-use estimates for the two most recent classes is due to rounding error.
Percentage reporting 5+ drinks in a row on one or more occasions’05–’06change
366

1975 1976 1977 1978 1979 1980 1981 1982 1983 1984 1985 1986 1987 1988 1989 1990Approx. N = — 15,400 17,100 17,800 15,500 15,900 17,500 17,700 16,300 15,900 16,000 15,200 16,300 16,300 16,700 15,200
Total — 33.0 35.1 35.4 36.4 36.6 38.0 37.6 38.1 36.2 32.0 33.1 33.8 31.0 31.3 27.0Gender: Male — 45.6 49.0 49.8 50.6 51.1 49.4 48.5 49.8 47.7 42.6 45.4 45.4 41.5 39.5 37.1 Female — 21.4 23.5 22.6 24.2 23.9 26.5 27.3 27.4 25.0 22.4 22.4 23.1 22.2 23.8 16.5College Plans: None or under 4 years — 37.7 39.2 41.6 39.5 43.5 42.8 42.1 43.1 41.2 35.5 36.1 37.8 36.9 37.7 29.0 Complete 4 years — 27.8 31.0 29.4 33.3 30.9 34.2 34.2 34.3 33.6 29.8 30.8 31.7 28.4 28.5 26.0Region: Northeast — 39.0 35.3 36.5 41.9 41.4 42.1 40.0 37.9 39.8 35.5 32.6 32.1 32.7 32.1 27.4 North Central — 35.8 37.6 39.9 39.0 42.3 43.6 45.3 45.1 43.7 34.2 40.8 41.3 38.5 38.2 31.4 South — 26.6 33.9 31.8 34.0 30.5 33.9 31.7 35.1 31.5 26.6 29.4 30.7 25.7 27.5 23.8 West — 31.0 31.6 32.0 28.3 31.1 28.5 28.1 31.3 29.4 33.8 27.5 29.8 28.5 27.4 25.1Population Density: Large MSA — 32.8 34.4 34.4 35.0 40.9 38.9 36.2 37.4 34.5 31.2 33.9 32.3 29.6 27.3 32.0 Other MSA — 33.9 35.4 35.7 36.3 33.9 37.7 36.6 36.6 33.2 30.2 31.5 34.5 30.9 32.3 26.9 Non-MSA — 32.1 35.2 35.7 37.6 37.0 37.6 39.8 40.6 41.4 35.1 35.0 33.9 32.6 32.9 22.6Parental Education:a
1.0-2.0 (Low) — 30.7 31.9 33.6 32.8 31.1 32.3 35.0 38.4 26.8 27.4 28.5 32.9 31.3 26.9 28.1 2.5-3.0 — 37.5 36.4 37.8 38.0 38.8 42.9 37.5 37.4 39.2 33.6 34.2 34.3 31.0 32.2 26.7 3.5-4.0 — 32.9 34.8 34.4 36.5 37.6 39.2 41.6 39.1 37.1 32.1 32.9 34.9 29.4 32.8 24.9 4.5-5.0 — 33.9 34.1 36.2 38.2 36.0 31.7 35.3 39.1 39.9 35.9 34.4 34.7 32.8 31.2 27.7 5.5-6.0 (High) — 27.2 38.0 28.7 35.5 37.6 38.5 38.9 36.5 30.2 27.4 33.8 29.7 31.4 26.5 32.3Race (2-year average):b
White — — 35.5 36.8 37.6 38.5 40.1 40.9 40.8 40.0 37.1 35.3 35.8 35.2 34.4 32.5 Black — — 18.8 19.5 19.4 17.7 16.4 16.9 18.1 18.9 15.5 13.2 13.6 16.1 18.5 13.5 Hispanic — — 34.4 33.5 31.5 32.7 30.8 27.6 27.9 27.4 24.6 29.4 32.8 27.5 22.0 20.6
Caution: Limited sample sizes (see “Notes” above). Use caution in interpreting subgroup trends.
See Table D-108 for the number of subgroup cases. See Appendix B for definition of variables in table. Data based on one of five forms in 1976–88; N is
Notes: Level of significance of difference between the two most recent classes: s = .05, ss = .01, sss = .001. ‘—’ indicates data not available.
one-fifth of N indicated in Table D-108. Data based on one of six forms beginning in 1989; N is one-sixth of N indicated in Table D-108.
Any apparent inconsistency between the change estimate and the prevalence-of-use estimates for the two most recent classes is due to rounding error.
Source: The Monitoring the Future Study, the University of Michigan.
TABLE D-78Beer: Trends in Two-Week Prevalence of Five or More Drinks in a Row by Subgroups for Twelfth Graders
Class of:Percentage reporting 5+ drinks in a row on one or more occasions
Cont'd
367

1991 1992 1993 1994 1995 1996 1997 1998 1999 2000 2001 2002 2003 2004 2005 2006Approx. N = 15,000 15,800 16,300 15,400 15,400 14,300 15,400 15,200 13,600 12,800 12,800 12,900 14,600 14,600 14,700 14,200
Total 28.5 25.4 25.5 24.6 27.6 29.2 26.7 28.5 25.6 27.5 26.7 26.1 21.4 23.7 22.4 21.4 -1.0Gender: Male 37.0 34.0 34.2 35.7 36.5 38.7 32.9 39.3 34.7 38.2 35.9 33.7 31.1 32.1 30.9 26.9 -4.0 s Female 20.1 17.6 18.1 15.5 19.5 19.2 21.2 19.5 17.0 17.6 18.0 18.2 12.9 15.6 15.3 16.2 +0.9College Plans: None or under 4 years 35.1 32.8 30.2 29.6 32.7 29.4 29.0 39.7 29.5 31.0 40.5 37.0 24.9 32.0 28.9 31.5 +2.7 Complete 4 years 26.0 23.3 23.8 23.4 25.4 28.8 26.2 25.1 24.7 26.0 23.3 22.9 20.3 21.5 21.1 19.0 -2.1Region: Northeast 27.8 25.7 28.5 23.4 30.5 35.4 32.0 34.2 33.0 32.7 26.5 28.6 27.1 26.1 25.8 25.9 +0.2 North Central 34.7 32.5 27.6 28.3 30.2 29.9 25.7 31.4 28.9 32.4 33.9 28.9 24.8 26.2 26.2 22.1 -4.1 South 24.2 22.9 25.2 24.8 27.2 27.5 24.1 25.5 21.3 20.0 19.7 22.4 16.8 21.8 20.2 20.6 +0.4 West 27.3 18.4 20.8 19.7 21.8 24.6 27.6 25.6 22.8 29.4 27.9 26.3 19.2 20.9 18.0 18.1 +0.1Population Density: Large MSA 24.7 26.0 23.8 23.6 26.9 32.4 26.2 24.4 21.3 29.8 23.4 25.7 18.9 20.9 21.4 21.2 -0.2 Other MSA 28.8 24.2 24.8 22.6 26.7 29.3 27.9 30.3 26.8 26.1 26.7 25.2 22.9 22.9 23.7 21.2 -2.5 Non-MSA 31.0 27.2 28.1 28.7 30.0 26.6 25.0 29.5 28.1 27.4 30.2 28.1 21.7 28.2 21.0 22.1 +1.1Parental Education:a
1.0-2.0 (Low) 34.9 23.4 27.3 23.7 28.9 23.8 18.7 23.5 22.1 16.8 28.2 32.0 20.1 18.5 17.0 19.3 +2.4 2.5-3.0 29.2 26.6 26.1 25.3 27.6 25.0 26.0 26.5 27.7 24.3 31.9 24.5 22.9 27.0 21.3 23.2 +1.9 3.5-4.0 29.4 25.2 26.6 24.2 25.6 29.3 28.3 31.9 26.5 29.1 21.4 27.4 20.5 26.3 23.0 23.9 +0.9 4.5-5.0 26.2 23.9 24.1 24.1 27.6 28.1 29.1 29.3 24.2 28.7 28.7 24.4 23.3 20.9 25.5 19.6 -5.9 5.5-6.0 (High) 25.7 26.9 26.1 26.0 32.2 41.0 28.3 27.6 24.3 35.1 28.0 27.3 19.0 20.2 21.8 19.3 -2.5Race (2-year average):b
White 30.6 29.6 27.6 27.3 29.0 31.3 31.4 31.3 30.0 28.8 31.0 30.2 26.4 25.3 26.1 25.8 -0.3 Black 10.2 13.1 15.5 15.4 12.6 14.6 13.3 11.7 10.6 9.9 9.1 7.6 6.1 9.3 11.2 7.1 -4.0 Hispanic 23.8 27.2 24.8 24.9 23.8 26.1 26.0 24.4 27.5 29.0 27.1 24.7 21.6 20.0 19.7 19.8 +0.1
more stable estimates. For the data beginning in 2005, see the race/ethnicity note at the end of Appendix D.
’05–’06change
Class of:
TABLE D-78 (cont'd)Beer: Trends in Two-Week Prevalence of Five or More Drinks in a Row by Subgroups for Twelfth Graders
aParental education is an average score of mother’s education and father’s education. See Appendix B for details.bTo derive percentages for each racial subgroup, data for the specified year and the previous year have been combined to increase subgroup sample sizes and thus provide
Percentage reporting 5+ drinks in a row on one or more occasions
368
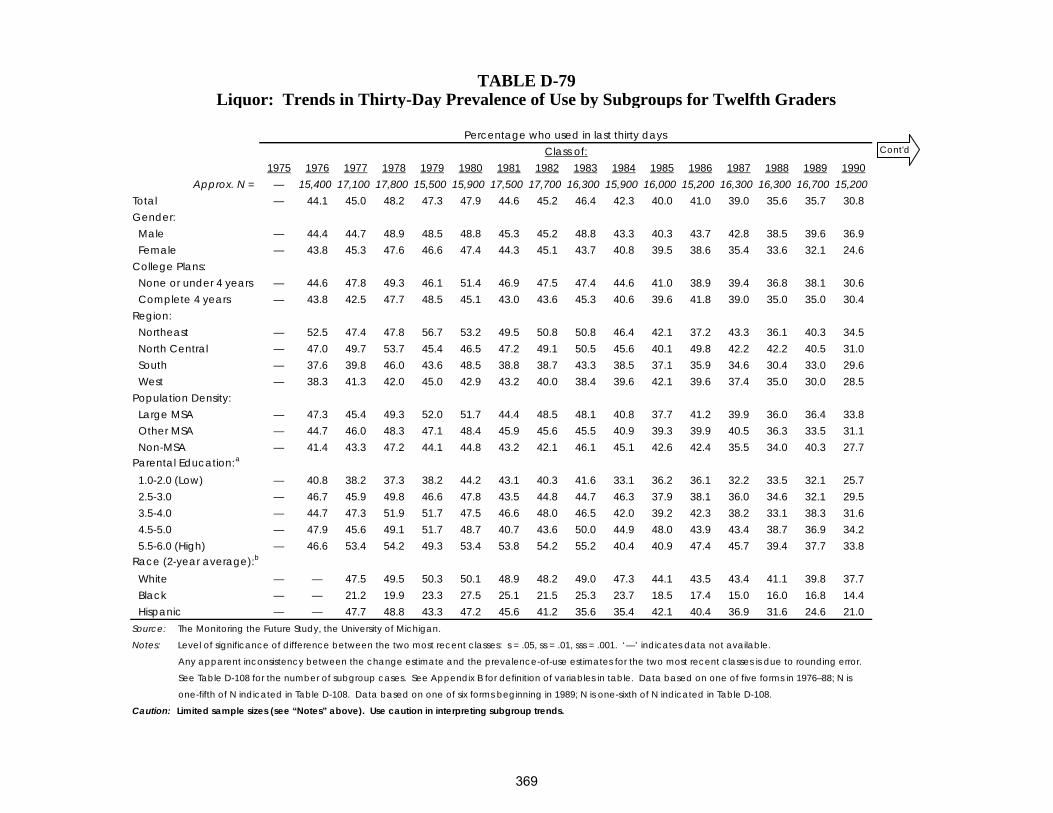
1975 1976 1977 1978 1979 1980 1981 1982 1983 1984 1985 1986 1987 1988 1989 1990Approx. N = — 15,400 17,100 17,800 15,500 15,900 17,500 17,700 16,300 15,900 16,000 15,200 16,300 16,300 16,700 15,200
Total — 44.1 45.0 48.2 47.3 47.9 44.6 45.2 46.4 42.3 40.0 41.0 39.0 35.6 35.7 30.8Gender: Male — 44.4 44.7 48.9 48.5 48.8 45.3 45.2 48.8 43.3 40.3 43.7 42.8 38.5 39.6 36.9 Female — 43.8 45.3 47.6 46.6 47.4 44.3 45.1 43.7 40.8 39.5 38.6 35.4 33.6 32.1 24.6College Plans: None or under 4 years — 44.6 47.8 49.3 46.1 51.4 46.9 47.5 47.4 44.6 41.0 38.9 39.4 36.8 38.1 30.6 Complete 4 years — 43.8 42.5 47.7 48.5 45.1 43.0 43.6 45.3 40.6 39.6 41.8 39.0 35.0 35.0 30.4Region: Northeast — 52.5 47.4 47.8 56.7 53.2 49.5 50.8 50.8 46.4 42.1 37.2 43.3 36.1 40.3 34.5 North Central — 47.0 49.7 53.7 45.4 46.5 47.2 49.1 50.5 45.6 40.1 49.8 42.2 42.2 40.5 31.0 South — 37.6 39.8 46.0 43.6 48.5 38.8 38.7 43.3 38.5 37.1 35.9 34.6 30.4 33.0 29.6 West — 38.3 41.3 42.0 45.0 42.9 43.2 40.0 38.4 39.6 42.1 39.6 37.4 35.0 30.0 28.5Population Density: Large MSA — 47.3 45.4 49.3 52.0 51.7 44.4 48.5 48.1 40.8 37.7 41.2 39.9 36.0 36.4 33.8 Other MSA — 44.7 46.0 48.3 47.1 48.4 45.9 45.6 45.5 40.9 39.3 39.9 40.5 36.3 33.5 31.1 Non-MSA — 41.4 43.3 47.2 44.1 44.8 43.2 42.1 46.1 45.1 42.6 42.4 35.5 34.0 40.3 27.7Parental Education:a
1.0-2.0 (Low) — 40.8 38.2 37.3 38.2 44.2 43.1 40.3 41.6 33.1 36.2 36.1 32.2 33.5 32.1 25.7 2.5-3.0 — 46.7 45.9 49.8 46.6 47.8 43.5 44.8 44.7 46.3 37.9 38.1 36.0 34.6 32.1 29.5 3.5-4.0 — 44.7 47.3 51.9 51.7 47.5 46.6 48.0 46.5 42.0 39.2 42.3 38.2 33.1 38.3 31.6 4.5-5.0 — 47.9 45.6 49.1 51.7 48.7 40.7 43.6 50.0 44.9 48.0 43.9 43.4 38.7 36.9 34.2 5.5-6.0 (High) — 46.6 53.4 54.2 49.3 53.4 53.8 54.2 55.2 40.4 40.9 47.4 45.7 39.4 37.7 33.8Race (2-year average):b
White — — 47.5 49.5 50.3 50.1 48.9 48.2 49.0 47.3 44.1 43.5 43.4 41.1 39.8 37.7 Black — — 21.2 19.9 23.3 27.5 25.1 21.5 25.3 23.7 18.5 17.4 15.0 16.0 16.8 14.4 Hispanic — — 47.7 48.8 43.3 47.2 45.6 41.2 35.6 35.4 42.1 40.4 36.9 31.6 24.6 21.0Source: The Monitoring the Future Study, the University of Michigan.
TABLE D-79Liquor: Trends in Thirty-Day Prevalence of Use by Subgroups for Twelfth Graders
Percentage who used in last thirty daysClass of:
Caution: Limited sample sizes (see “Notes” above). Use caution in interpreting subgroup trends.
Notes: Level of significance of difference between the two most recent classes: s = .05, ss = .01, sss = .001. ‘—’ indicates data not available.
one-fifth of N indicated in Table D-108. Data based on one of six forms beginning in 1989; N is one-sixth of N indicated in Table D-108.
Any apparent inconsistency between the change estimate and the prevalence-of-use estimates for the two most recent classes is due to rounding error.
See Table D-108 for the number of subgroup cases. See Appendix B for definition of variables in table. Data based on one of five forms in 1976–88; N is
Cont'd
369

1991 1992 1993 1994 1995 1996 1997 1998 1999 2000 2001 2002 2003 2004 2005 2006Approx. N = 15,000 15,800 16,300 15,400 15,400 14,300 15,400 15,200 13,600 12,800 12,800 12,900 14,600 14,600 14,700 14,200
Total 31.3 28.6 31.4 28.0 34.3 34.7 34.6 37.3 34.3 36.0 35.1 36.0 34.3 35.6 36.4 34.2 -2.3Gender: Male 34.9 32.0 36.4 32.8 38.2 36.4 36.3 41.2 38.0 41.7 35.6 37.9 36.1 39.3 38.4 33.7 -4.6 Female 28.0 25.9 27.3 23.2 30.9 32.6 33.4 33.3 30.0 30.7 33.7 33.8 32.9 32.2 34.9 33.9 -1.0College Plans: None or under 4 years 37.0 31.9 37.3 28.3 36.8 35.8 34.2 38.3 35.0 38.1 40.4 42.5 36.9 40.3 42.6 39.7 -2.9 Complete 4 years 29.0 27.4 29.9 28.1 33.4 34.1 34.9 36.6 33.9 35.0 33.6 34.2 33.6 34.3 35.5 33.0 -2.5Region: Northeast 36.6 25.8 32.4 25.9 37.7 40.9 36.6 46.3 39.8 40.9 40.8 41.4 35.8 41.1 41.9 40.0 -1.9 North Central 33.5 33.5 32.1 29.0 35.4 36.2 35.2 36.6 33.7 40.5 37.4 39.6 37.4 35.4 39.3 35.2 -4.1 South 28.1 27.1 34.7 28.1 34.9 33.6 32.9 33.9 32.1 28.3 31.7 32.9 30.7 33.3 33.7 32.5 -1.2 West 29.0 26.3 24.0 28.2 28.7 27.8 35.1 37.2 34.5 38.5 33.3 31.8 35.4 33.8 32.3 30.9 -1.4Population Density: Large MSA 30.4 29.8 32.2 30.3 33.3 30.6 36.0 37.2 34.5 41.1 36.0 37.5 32.4 30.1 36.2 34.4 -1.8 Other MSA 33.1 27.4 30.4 26.5 34.9 38.0 34.6 38.9 34.9 33.8 35.4 37.0 35.6 37.7 37.8 36.3 -1.5 Non-MSA 29.1 30.0 32.7 28.1 34.3 32.4 33.4 33.9 33.3 34.0 33.9 32.3 34.3 37.4 34.2 30.2 -4.0Parental Education:a
1.0-2.0 (Low) 29.7 25.4 29.1 23.6 26.8 24.7 27.7 33.5 35.3 30.8 28.2 29.4 27.6 29.5 30.9 30.2 -0.8 2.5-3.0 32.6 29.9 29.4 28.2 34.8 37.5 31.8 33.5 33.7 28.7 36.3 33.5 35.2 34.0 33.0 36.7 +3.7 3.5-4.0 33.6 29.0 34.1 25.8 32.4 34.7 36.4 40.6 32.7 40.0 35.4 37.3 35.7 38.2 33.8 34.7 +0.9 4.5-5.0 27.4 25.9 32.2 29.3 35.7 30.1 35.8 38.2 33.4 35.2 38.3 38.2 36.5 36.4 43.3 33.8 -9.6 s 5.5-6.0 (High) 33.5 33.1 29.9 32.0 41.1 42.1 40.4 38.3 40.8 47.8 34.5 38.8 33.0 36.6 38.4 35.9 -2.5Race (2-year average):b
White 35.0 32.9 32.5 32.6 34.1 37.2 38.5 39.5 37.6 37.2 38.8 38.9 37.8 37.8 39.8 39.5 -0.3 Black 14.1 15.1 17.5 17.1 17.9 24.9 20.4 17.6 21.5 22.2 22.1 22.0 23.0 23.7 25.3 23.0 -2.3 Hispanic 23.2 29.2 28.9 26.3 27.4 29.4 28.1 31.7 36.6 36.3 36.0 36.3 33.3 29.6 30.2 28.4 -1.8
more stable estimates. For the data beginning in 2005, see the race/ethnicity note at the end of Appendix D.
’05–’06change
Class of:
TABLE D-79 (cont'd)Liquor: Trends in Thirty-Day Prevalence of Use by Subgroups for Twelfth Graders
aParental education is an average score of mother’s education and father’s education. See Appendix B for details.bTo derive percentages for each racial subgroup, data for the specified year and the previous year have been combined to increase subgroup sample sizes and thus provide
Percentage who used in last thirty days
370
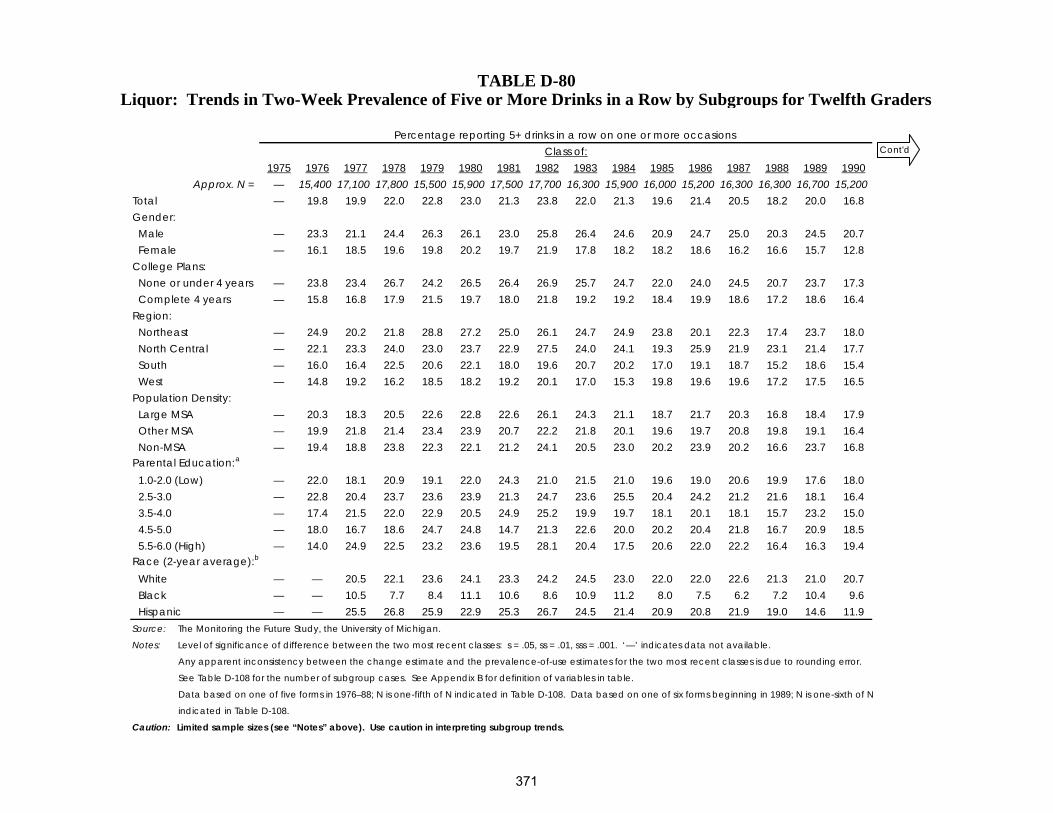
1975 1976 1977 1978 1979 1980 1981 1982 1983 1984 1985 1986 1987 1988 1989 1990Approx. N = — 15,400 17,100 17,800 15,500 15,900 17,500 17,700 16,300 15,900 16,000 15,200 16,300 16,300 16,700 15,200
Total — 19.8 19.9 22.0 22.8 23.0 21.3 23.8 22.0 21.3 19.6 21.4 20.5 18.2 20.0 16.8Gender: Male — 23.3 21.1 24.4 26.3 26.1 23.0 25.8 26.4 24.6 20.9 24.7 25.0 20.3 24.5 20.7 Female — 16.1 18.5 19.6 19.8 20.2 19.7 21.9 17.8 18.2 18.2 18.6 16.2 16.6 15.7 12.8College Plans: None or under 4 years — 23.8 23.4 26.7 24.2 26.5 26.4 26.9 25.7 24.7 22.0 24.0 24.5 20.7 23.7 17.3 Complete 4 years — 15.8 16.8 17.9 21.5 19.7 18.0 21.8 19.2 19.2 18.4 19.9 18.6 17.2 18.6 16.4Region: Northeast — 24.9 20.2 21.8 28.8 27.2 25.0 26.1 24.7 24.9 23.8 20.1 22.3 17.4 23.7 18.0 North Central — 22.1 23.3 24.0 23.0 23.7 22.9 27.5 24.0 24.1 19.3 25.9 21.9 23.1 21.4 17.7 South — 16.0 16.4 22.5 20.6 22.1 18.0 19.6 20.7 20.2 17.0 19.1 18.7 15.2 18.6 15.4 West — 14.8 19.2 16.2 18.5 18.2 19.2 20.1 17.0 15.3 19.8 19.6 19.6 17.2 17.5 16.5Population Density: Large MSA — 20.3 18.3 20.5 22.6 22.8 22.6 26.1 24.3 21.1 18.7 21.7 20.3 16.8 18.4 17.9 Other MSA — 19.9 21.8 21.4 23.4 23.9 20.7 22.2 21.8 20.1 19.6 19.7 20.8 19.8 19.1 16.4 Non-MSA — 19.4 18.8 23.8 22.3 22.1 21.2 24.1 20.5 23.0 20.2 23.9 20.2 16.6 23.7 16.8Parental Education:a
1.0-2.0 (Low) — 22.0 18.1 20.9 19.1 22.0 24.3 21.0 21.5 21.0 19.6 19.0 20.6 19.9 17.6 18.0 2.5-3.0 — 22.8 20.4 23.7 23.6 23.9 21.3 24.7 23.6 25.5 20.4 24.2 21.2 21.6 18.1 16.4 3.5-4.0 — 17.4 21.5 22.0 22.9 20.5 24.9 25.2 19.9 19.7 18.1 20.1 18.1 15.7 23.2 15.0 4.5-5.0 — 18.0 16.7 18.6 24.7 24.8 14.7 21.3 22.6 20.0 20.2 20.4 21.8 16.7 20.9 18.5 5.5-6.0 (High) — 14.0 24.9 22.5 23.2 23.6 19.5 28.1 20.4 17.5 20.6 22.0 22.2 16.4 16.3 19.4Race (2-year average):b
White — — 20.5 22.1 23.6 24.1 23.3 24.2 24.5 23.0 22.0 22.0 22.6 21.3 21.0 20.7 Black — — 10.5 7.7 8.4 11.1 10.6 8.6 10.9 11.2 8.0 7.5 6.2 7.2 10.4 9.6 Hispanic — — 25.5 26.8 25.9 22.9 25.3 26.7 24.5 21.4 20.9 20.8 21.9 19.0 14.6 11.9
TABLE D-80Liquor: Trends in Two-Week Prevalence of Five or More Drinks in a Row by Subgroups for Twelfth Graders
Percentage reporting 5+ drinks in a row on one or more occasionsClass of:
Source: The Monitoring the Future Study, the University of Michigan.
indicated in Table D-108.
Data based on one of five forms in 1976–88; N is one-fifth of N indicated in Table D-108. Data based on one of six forms beginning in 1989; N is one-sixth of N
Caution: Limited sample sizes (see “Notes” above). Use caution in interpreting subgroup trends.
Notes: Level of significance of difference between the two most recent classes: s = .05, ss = .01, sss = .001. ‘—’ indicates data not available.
Any apparent inconsistency between the change estimate and the prevalence-of-use estimates for the two most recent classes is due to rounding error.
See Table D-108 for the number of subgroup cases. See Appendix B for definition of variables in table.
Cont'd
371

1991 1992 1993 1994 1995 1996 1997 1998 1999 2000 2001 2002 2003 2004 2005 2006Approx. N = 15,000 15,800 16,300 15,400 15,400 14,300 15,400 15,200 13,600 12,800 12,800 12,900 14,600 14,600 14,700 14,200
Total 17.4 16.0 18.2 17.1 20.2 21.6 21.1 23.6 22.3 23.8 22.7 25.6 21.1 23.8 25.0 23.3 -1.8Gender: Male 20.5 20.0 24.6 22.4 24.7 24.6 23.9 27.3 27.6 30.8 26.4 27.2 24.1 29.2 28.5 24.7 -3.9 Female 14.4 12.6 13.2 12.6 16.2 17.7 18.7 20.0 16.1 17.4 18.8 23.6 18.9 18.2 22.0 22.0 +0.1College Plans: None or under 4 years 21.7 21.4 24.6 19.1 22.5 21.1 23.4 31.2 23.2 26.4 29.2 31.9 23.0 29.2 32.6 27.1 -5.6 Complete 4 years 15.8 14.1 16.5 16.6 19.2 21.4 20.6 21.7 21.9 22.9 20.7 23.7 20.5 22.1 23.7 22.6 -1.0Region: Northeast 21.3 14.8 15.1 14.2 19.2 25.4 24.6 29.8 25.5 24.7 27.9 27.8 23.5 28.2 28.7 29.0 +0.3 North Central 19.0 19.0 18.9 17.7 21.5 22.0 20.6 23.6 19.9 29.7 21.5 28.1 24.8 23.4 28.3 26.2 -2.1 South 15.3 15.5 21.7 17.6 21.8 21.9 20.0 21.7 21.7 17.4 20.4 24.3 17.4 21.6 22.8 20.5 -2.3 West 15.2 13.7 13.6 18.0 16.4 16.3 20.5 22.3 23.6 26.1 24.3 22.7 20.7 23.4 21.2 19.8 -1.5Population Density: Large MSA 16.4 15.6 16.8 16.1 19.3 19.5 23.0 23.9 21.4 26.6 23.6 25.8 20.0 20.7 25.3 22.6 -2.7 Other MSA 17.5 15.2 17.3 16.3 20.3 24.9 21.3 25.1 22.8 21.7 22.2 26.3 21.9 24.6 26.2 25.0 -1.2 Non-MSA 18.1 17.9 20.7 19.5 21.1 17.7 18.7 20.3 22.2 24.1 22.6 24.0 21.2 25.5 22.5 21.0 -1.5Parental Education:a
1.0-2.0 (Low) 19.9 15.9 20.7 14.4 15.2 14.7 16.7 23.9 25.5 24.4 15.2 18.4 17.9 17.8 18.5 19.1 +0.6 2.5-3.0 18.1 17.9 18.3 18.5 19.7 22.1 18.3 21.3 20.7 17.8 25.4 24.2 24.2 25.9 22.1 22.7 +0.6 3.5-4.0 18.6 15.9 19.7 16.2 20.7 20.4 23.3 25.4 23.6 25.8 21.8 24.4 21.1 26.2 23.5 26.1 +2.7 4.5-5.0 16.4 13.5 17.4 17.7 21.6 18.0 22.2 24.3 20.6 24.5 24.9 29.0 21.0 22.2 29.8 24.5 -5.3 5.5-6.0 (High) 13.3 16.5 16.0 18.8 22.0 31.3 23.5 23.0 22.8 30.4 22.4 31.0 21.0 20.3 28.7 20.3 -8.4Race (2-year average):b
White 19.0 18.0 18.7 19.4 20.4 22.3 23.4 24.7 24.4 24.3 25.3 26.3 25.4 24.6 26.9 27.5 +0.6 Black 6.8 7.1 8.9 9.5 11.3 15.4 12.5 9.9 10.4 10.2 12.8 14.6 14.9 15.8 17.2 14.9 -2.3 Hispanic 13.4 19.4 18.1 16.8 18.1 18.9 20.0 22.2 24.3 25.2 24.0 24.0 21.1 18.9 20.6 18.4 -2.2
Percentage reporting 5+ drinks in a row on one or more occasions
TABLE D-80 (cont'd)Liquor: Trends in Two-Week Prevalence of Five or More Drinks in a Row by Subgroups for Twelfth Graders
aParental education is an average score of mother’s education and father’s education. See Appendix B for details.bTo derive percentages for each racial subgroup, data for the specified year and the previous year have been combined to increase subgroup sample sizes and thus provide
more stable estimates. For the data beginning in 2005, see the race/ethnicity note at the end of Appendix D.
’05–’06change
Class of:
372

1975 1976 1977 1978 1979 1980 1981 1982 1983 1984 1985 1986 1987 1988a 1989 1990Approx. N = — 15,400 17,100 17,800 15,500 15,900 17,500 17,700 16,300 15,900 16,000 15,200 16,300 16,300 16,700 15,200
Total — 34.5 37.4 37.7 36.6 39.5 36.6 37.8 36.0 34.1 36.0 34.5 33.5 22.7 19.7 14.7Gender: Male — 34.1 35.5 34.8 33.9 38.1 35.3 35.6 33.8 30.3 34.2 30.8 29.3 20.7 18.9 16.1 Female — 34.5 39.1 40.2 39.0 41.1 38.2 39.9 37.7 38.1 37.4 38.1 37.1 24.3 20.4 13.5College Plans: None or under 4 years — 31.5 33.1 33.8 33.8 37.1 32.8 36.3 34.5 33.7 34.6 31.5 28.2 19.7 18.6 11.9 Complete 4 years — 38.0 41.4 41.5 38.5 41.0 39.1 39.5 37.2 34.0 37.3 36.2 35.7 24.0 20.5 16.0Region: Northeast — 45.2 42.6 47.5 45.3 48.0 51.6 51.4 46.0 41.5 43.9 32.0 35.6 27.7 22.1 15.0 North Central — 33.8 36.3 40.8 33.8 36.6 38.5 38.9 36.0 34.3 34.1 41.0 34.0 23.0 23.7 13.4 South — 27.5 34.2 30.2 30.8 34.8 26.3 27.7 30.9 29.5 30.7 28.1 31.7 18.9 17.4 14.5 West — 34.0 38.1 32.7 40.8 42.4 31.6 32.5 32.4 34.7 38.4 38.1 33.8 24.5 16.0 16.9Population Density: Large MSA — 46.6 47.0 45.6 44.2 46.9 46.0 46.3 45.0 36.7 40.7 36.6 35.3 27.6 20.6 15.3 Other MSA — 33.0 36.5 36.8 36.0 42.1 34.6 36.6 32.4 34.0 36.4 36.0 34.9 22.0 20.5 16.8 Non-MSA — 28.0 31.4 32.8 31.9 31.0 32.4 32.8 33.8 32.3 31.7 30.7 29.2 19.3 16.7 9.9Parental Education:b
1.0-2.0 (Low) — 33.4 30.1 32.3 31.4 28.0 28.0 30.2 26.6 28.3 28.6 28.0 23.9 16.4 19.0 9.5 2.5-3.0 — 33.8 32.8 35.3 33.0 38.0 33.2 33.8 35.3 34.0 32.4 31.3 30.7 17.8 15.6 12.4 3.5-4.0 — 36.9 42.0 40.2 38.2 39.6 37.2 42.0 32.9 35.9 36.9 37.1 31.5 23.4 18.8 14.2 4.5-5.0 — 39.6 42.5 40.8 43.6 45.2 41.5 43.4 46.1 37.1 43.1 36.3 39.7 26.5 24.1 18.9 5.5-6.0 (High) — 48.4 57.3 49.8 46.7 51.7 52.9 47.5 43.2 33.9 42.6 40.1 40.9 31.4 23.5 19.3Race (2-year average):c
White — — 35.9 38.1 38.1 39.2 40.2 39.6 38.4 36.5 36.7 37.1 35.7 29.9 23.0 18.6 Black — — 36.2 30.8 27.4 27.9 24.9 26.0 28.9 24.4 21.3 21.0 21.8 18.4 15.0 11.2 Hispanic — — 42.9 38.5 30.0 31.0 27.3 26.8 28.3 30.9 37.0 37.4 33.0 22.2 15.0 14.2Source: The Monitoring the Future Study, the University of Michigan.
Caution: Limited sample sizes (see “Notes” above). Use caution in interpreting subgroup trends.
Any apparent inconsistency between the change estimate and the prevalence-of-use estimates for the two most recent classes is due to rounding error.
Notes: Level of significance of difference between the two most recent classes: s = .05, ss = .01, sss = .001. ‘—’ indicates data not available.
See Table D-108 for the number of subgroup cases. See Appendix B for definition of variables in table.
indicated in Table D-108.
Data based on one of five forms in 1976–88; N is one-fifth of N indicated in Table D-108. Data based on one of six forms beginning in 1989; N is one-sixth of N
TABLE D-81Wine: Trends in Thirty-Day Prevalence of Use by Subgroups for Twelfth Graders
Class of:Percentage who used in last thirty days
Cont'd
373

1991 1992 1993 1994 1995 1996 1997 1998 1999 2000 2001 2002 2003 2004 2005 2006Approx. N = 15,000 15,800 16,300 15,400 15,400 14,300 15,400 15,200 13,600 12,800 12,800 12,900 14,600 14,600 14,700 14,200
Total 16.1 16.9 14.9 14.2 14.3 18.3 17.0 16.0 15.8 16.2 14.1 13.4 13.4 13.9 14.4 12.6 -1.8Gender: Male 16.9 17.2 15.9 13.8 13.2 18.1 16.7 17.4 17.6 17.7 12.8 13.2 13.9 13.8 13.8 11.6 -2.2 Female 15.5 16.6 13.9 14.3 15.3 18.2 17.3 15.0 14.4 15.0 15.5 13.2 13.5 14.1 15.1 13.6 -1.4College Plans: None or under 4 years 16.1 12.6 16.5 11.7 10.6 14.5 14.2 19.0 11.9 12.0 15.9 11.7 13.8 12.7 14.4 13.9 -0.6 Complete 4 years 16.4 18.4 14.4 14.8 15.3 19.3 18.0 15.3 16.8 17.1 13.3 13.7 13.5 14.5 14.3 11.9 -2.3Region: Northeast 22.1 18.5 15.2 15.9 14.2 23.4 19.4 18.7 23.5 20.8 19.2 17.3 12.5 18.2 15.2 13.9 -1.3 North Central 17.3 21.9 14.0 14.3 14.3 13.1 14.2 17.7 16.2 11.9 13.5 14.9 13.5 13.0 15.3 13.9 -1.4 South 11.8 11.0 16.7 13.0 15.9 20.0 17.7 13.8 14.6 17.2 13.9 12.7 14.0 12.6 13.4 12.1 -1.3 West 16.2 18.3 13.0 15.0 11.6 16.8 17.1 15.9 11.2 15.9 11.3 9.8 13.5 12.8 14.1 10.7 -3.4Population Density: Large MSA 13.9 17.0 20.0 16.8 14.8 19.5 18.2 19.5 17.4 20.4 16.7 17.2 11.1 12.5 16.9 15.0 -1.9 Other MSA 17.8 19.0 15.0 14.4 15.1 18.6 18.2 15.9 16.5 14.6 11.5 11.8 15.0 15.4 14.0 12.8 -1.2 Non-MSA 15.1 12.6 11.3 11.3 12.4 16.6 13.6 12.3 13.3 14.2 15.6 11.9 13.5 12.8 12.2 8.9 -3.3Parental Education:b
1.0-2.0 (Low) 10.8 11.7 14.3 9.8 13.5 9.7 13.1 14.6 16.7 19.7 12.3 14.8 9.4 12.8 10.9 4.0 -6.9 s 2.5-3.0 16.0 13.9 12.1 13.6 10.2 15.2 13.8 10.2 10.5 10.4 13.6 8.6 13.1 10.9 13.4 10.6 -2.9 3.5-4.0 16.4 15.4 14.3 11.7 10.5 17.9 15.7 15.1 11.5 14.6 10.2 13.1 13.1 15.6 12.2 11.4 -0.8 4.5-5.0 17.5 19.2 17.7 14.6 18.1 18.0 18.0 20.8 19.6 16.2 19.1 15.4 15.5 14.1 16.8 15.5 -1.3 5.5-6.0 (High) 19.4 27.1 16.5 23.8 24.9 27.2 29.1 20.0 29.8 29.1 16.7 19.0 15.8 18.3 18.2 18.4 +0.1Race (2-year average):c
White 16.6 17.4 16.2 14.4 14.4 16.8 19.3 18.1 16.6 16.4 15.9 15.2 14.5 14.7 15.5 15.6 +0.1 Black 10.2 11.7 14.5 17.6 13.6 12.8 11.1 9.9 9.3 9.5 10.9 8.5 8.0 7.9 7.8 6.1 -1.6 Hispanic 10.9 14.9 14.3 14.2 15.0 13.8 13.5 13.4 16.4 17.9 12.9 9.4 12.2 13.5 13.1 10.5 -2.6
TABLE D-81 (cont'd)Wine: Trends in Thirty-Day Prevalence of Use by Subgroups for Twelfth Graders
aIn the 1988 questionnaires, a question on the use of wine coolers was added. This change may account for the discontinuity between the 1987 and 1988 use rates for wine.
’05–’06Class of:Percentage who used in last thirty days
bParental education is an average score of mother’s education and father’s education. See Appendix B for details.cTo derive percentages for each racial subgroup, data for the specified year and the previous year have been combined to increase subgroup sample sizes and thus provide
more stable estimates. For the data beginning in 2005, see the race/ethnicity note at the end of Appendix D.
change
374

1975 1976 1977 1978 1979 1980 1981 1982 1983 1984 1985 1986 1987 1988a 1989 1990Approx. N = — 15,400 17,100 17,800 15,500 15,900 17,500 17,700 16,300 15,900 16,000 15,200 16,300 16,300 16,700 15,200
Total — 12.5 13.1 13.5 12.9 13.2 13.0 14.9 14.3 13.0 12.8 13.8 12.7 7.8 6.8 4.9Gender: Male — 14.5 13.9 14.3 13.9 13.3 12.2 12.6 14.4 12.6 12.9 12.4 12.3 7.8 6.1 5.5 Female — 10.4 12.1 12.8 12.0 12.8 13.5 16.8 13.9 13.1 12.5 14.6 12.8 7.7 7.3 4.3College Plans: None or under 4 years — 14.1 14.6 14.6 14.8 15.3 13.2 16.1 15.7 14.4 13.9 14.6 13.7 9.5 9.0 5.1 Complete 4 years — 10.4 11.6 12.7 11.4 11.3 12.6 13.9 13.2 11.9 11.9 13.3 12.0 7.1 6.0 4.9Region: Northeast — 14.8 14.8 15.0 16.4 18.2 17.9 18.3 19.1 16.9 15.7 11.5 10.7 8.1 7.4 3.6 North Central — 13.8 12.9 15.4 12.6 12.2 13.9 16.0 13.6 14.1 12.3 17.2 13.5 7.8 6.9 3.9 South — 10.1 11.8 11.7 11.8 11.6 10.0 12.4 12.5 11.0 10.9 12.9 13.1 6.8 6.7 5.4 West — 10.8 13.4 10.9 10.4 11.6 9.8 12.0 13.1 10.9 13.3 12.2 13.2 9.5 6.3 7.0Population Density: Large MSA — 17.0 14.9 14.7 14.3 14.9 16.8 17.9 17.1 14.1 14.0 13.5 11.0 9.7 6.1 4.4 Other MSA — 11.4 13.0 12.5 11.8 13.2 11.6 13.3 12.6 12.4 13.7 13.8 13.6 7.8 8.0 4.9 Non-MSA — 10.7 11.8 14.0 13.1 12.0 11.8 14.7 14.4 13.0 10.6 13.9 12.9 6.0 4.8 5.2Parental Education:b
1.0-2.0 (Low) — 14.0 16.4 14.9 12.7 10.2 13.7 15.7 12.1 12.8 11.9 14.7 12.2 8.2 8.3 4.6 2.5-3.0 — 13.4 12.0 13.7 12.4 15.4 13.1 12.1 16.8 14.6 12.1 13.6 13.0 7.2 6.2 5.4 3.5-4.0 — 11.7 14.0 12.2 10.3 13.0 13.4 16.7 12.4 15.0 13.1 14.9 12.1 7.5 6.3 5.4 4.5-5.0 — 12.4 9.4 12.9 16.5 12.7 11.2 14.9 14.4 10.2 13.4 12.2 13.3 7.7 8.0 4.3 5.5-6.0 (High) — 14.4 15.4 15.0 16.5 12.0 14.2 21.2 12.5 7.7 14.5 12.9 12.3 9.5 5.0 4.4Race (2-year average):c
White — — 12.0 13.1 13.4 13.1 13.4 14.4 14.8 13.8 13.3 13.6 13.4 10.4 7.5 6.0 Black — — 16.7 12.6 10.8 10.4 9.0 10.0 11.4 10.1 8.3 8.3 7.6 8.3 7.8 4.7 Hispanic — — 19.3 14.7 9.7 9.5 15.3 15.1 15.8 14.3 13.4 16.1 14.7 8.4 5.1 6.4
Data based on one of five forms in 1976–88; N is one-fifth of N indicated in Table D-108. Data based on one of six forms beginning in 1989; N is one-sixth of N
Caution: Limited sample sizes (see “Notes” above). Use caution in interpreting subgroup trends.
Any apparent inconsistency between the change estimate and the prevalence-of-use estimates for the two most recent classes is due to rounding error.
Notes: Level of significance of difference between the two most recent classes: s = .05, ss = .01, sss = .001. ‘—’ indicates data not available.
See Table D-108 for the number of subgroup cases. See Appendix B for definition of variables in table.
indicated in Table D-108.
Source: The Monitoring the Future Study, the University of Michigan.
TABLE D-82Wine: Trends in Two-Week Prevalence of Five or More Drinks in a Row by Subgroups for Twelfth Graders
Class of:Percentage reporting 5+ drinks in a row on one or more occasions
Cont'd
375

1991 1992 1993 1994 1995 1996 1997 1998 1999 2000 2001 2002 2003 2004 2005 2006Approx. N = 15,000 15,800 16,300 15,400 15,400 14,300 15,400 15,200 13,600 12,800 12,800 12,900 14,600 14,600 14,700 14,200
Total 5.8 5.7 5.8 4.9 5.8 7.0 6.4 6.4 5.0 5.4 5.9 4.7 5.0 4.9 5.4 4.4 -1.0Gender: Male 7.1 6.5 7.2 4.9 6.1 8.3 6.9 6.9 6.5 7.3 5.8 4.6 5.7 6.2 5.1 4.9 -0.3 Female 4.6 4.5 4.4 4.9 5.6 5.7 6.1 5.8 3.8 3.6 5.3 4.1 4.3 3.5 5.6 4.1 -1.5College Plans: None or under 4 years 8.0 6.7 8.3 4.0 6.1 5.7 8.7 9.6 5.0 4.2 7.8 6.4 7.0 5.2 7.1 6.0 -1.1 Complete 4 years 5.3 5.4 5.1 5.3 5.4 7.2 5.7 5.5 5.1 5.6 5.2 4.1 4.5 4.8 4.8 4.0 -0.8Region: Northeast 7.1 4.5 3.4 4.2 5.9 10.2 6.6 8.0 5.4 5.9 8.3 5.3 4.1 4.6 5.2 5.6 +0.4 North Central 5.6 7.2 4.6 4.6 6.3 5.7 5.5 6.4 6.4 5.3 4.5 4.6 5.5 5.1 6.1 5.0 -1.1 South 5.1 4.1 8.2 4.7 6.9 6.7 7.2 5.7 5.0 5.2 5.8 3.9 5.4 4.9 5.1 3.6 -1.5 West 6.0 7.1 5.3 6.5 3.0 6.1 6.3 6.5 3.2 5.5 6.1 5.8 4.5 4.9 5.3 4.1 -1.2Population Density: Large MSA 5.3 6.1 5.4 4.7 5.6 9.6 7.3 6.6 5.3 6.7 5.5 5.4 4.1 5.3 5.8 5.3 -0.5 Other MSA 6.5 5.8 6.8 6.2 5.4 7.0 6.4 6.6 4.2 5.4 5.4 3.2 5.0 4.6 5.3 3.9 -1.3 Non-MSA 4.9 5.1 4.5 3.2 6.6 4.9 5.6 5.8 6.2 3.9 7.0 6.7 5.9 5.0 5.2 4.1 -1.2Parental Education:b
1.0-2.0 (Low) 5.7 8.0 12.4 4.9 6.1 4.2 5.2 10.7 8.2 11.3 8.0 8.2 6.8 6.4 5.6 4.3 -1.3 2.5-3.0 6.8 4.8 5.3 3.8 5.6 6.5 6.8 6.0 3.5 3.7 5.6 4.6 6.6 4.4 5.3 2.8 -2.5 3.5-4.0 6.5 4.1 4.3 5.5 4.2 7.1 4.8 5.7 4.1 5.3 4.7 4.5 4.6 6.5 4.6 3.6 -1.0 4.5-5.0 4.9 6.1 6.0 3.7 5.6 4.4 8.1 7.6 4.7 4.8 7.2 4.4 4.1 4.1 4.7 5.2 +0.5 5.5-6.0 (High) 3.5 8.3 4.4 8.4 11.1 13.0 8.2 4.5 8.8 6.5 5.5 4.4 4.2 4.2 8.1 7.3 -0.7Race (2-year average):c
White 5.3 5.5 5.0 4.8 5.2 6.2 6.9 6.5 5.4 4.7 4.8 4.9 5.0 4.9 5.1 5.2 +0.1 Black 5.1 5.1 7.6 7.5 4.0 4.9 5.1 5.3 4.5 5.2 6.5 5.0 4.3 3.5 2.3 1.7 -0.6 Hispanic 4.3 7.5 7.8 7.2 7.3 7.6 7.6 7.1 7.8 7.8 7.8 4.7 3.5 5.2 5.0 3.9 -1.0
TABLE D-82 (cont'd)Wine: Trends in Two-Week Prevalence of Five or More Drinks in a Row by Subgroups for Twelfth Graders
aIn the 1988 questionnaires, a question on the use of wine coolers was added. This change may account for the discontinuity between the 1987 and 1988 use rates for wine.
’05–’06Class of:Percentage reporting 5+ drinks in a row on one or more occasions
bParental education is an average score of mother’s education and father’s education. See Appendix B for details.cTo derive percentages for each racial subgroup, data for the specified year and the previous year have been combined to increase subgroup sample sizes and thus provide
more stable estimates. For the data beginning in 2005, see the race/ethnicity note at the end of Appendix D.
change
376

1991 1992 1993 1994 1995 1996 1997 1998 1999 2000 2001 2002 2003 2004 2005 2006Approx. N = 17,500 18,600 18,300 17,300 17,500 17,800 18,600 18,100 16,700 16,700 16,200 15,100 16,500 — — —
Total 14.8 15.1 16.1 15.9 15.3 17.5 15.9 15.6 16.5 14.8 15.3 12.9 12.4 — — —Gender: Male 14.7 13.8 16.2 15.8 14.6 16.1 14.5 15.4 16.7 13.4 14.2 11.9 10.2 — — — Female 14.6 16.2 16.0 16.2 15.6 18.7 16.9 15.8 16.3 15.9 15.9 13.3 14.3 — — —College Plans: None or under 4 years 21.2 23.9 30.6 28.1 25.3 28.7 32.1 27.3 31.9 28.5 31.6 21.1 24.2 — — — Complete 4 years 13.7 14.0 14.3 14.5 14.1 15.7 14.0 14.3 14.7 13.3 13.4 12.2 11.1 — — —Region: Northeast 9.8 11.5 12.7 15.8 15.0 17.7 14.5 15.7 15.4 13.5 17.7 11.8 10.9 — — — North Central 14.5 14.6 15.7 15.0 13.9 18.5 16.1 16.2 17.6 17.0 14.8 12.1 15.5 — — — South 17.4 18.1 17.8 16.7 17.0 17.5 16.6 16.2 18.6 14.6 16.8 15.0 12.7 — — — West 14.8 14.2 17.3 15.9 13.9 16.0 15.3 14.0 12.7 13.3 11.4 11.3 8.9 — — —Population Density: Large MSA 14.1 16.4 12.7 14.4 11.1 16.5 14.1 14.0 14.0 12.9 12.3 12.1 10.4 — — — Other MSA 14.6 15.4 17.4 17.8 16.1 18.2 15.7 15.4 16.8 14.5 15.4 12.7 12.3 — — — Non-MSA 15.8 13.4 17.3 13.2 15.8 17.3 17.9 17.6 18.9 17.5 18.3 14.4 14.7 — — —Parental Education:a
1.0-2.0 (Low) 19.3 18.7 18.5 21.1 20.4 21.7 22.2 20.7 30.2 22.1 25.1 22.8 18.2 — — — 2.5-3.0 16.9 16.6 19.9 17.7 17.6 20.2 19.2 17.8 19.7 18.1 19.7 14.3 15.4 — — — 3.5-4.0 12.9 16.8 17.2 18.4 15.7 18.4 16.8 16.6 17.5 14.3 19.6 15.7 15.8 — — — 4.5-5.0 13.9 11.8 13.5 12.0 12.5 15.4 11.9 13.6 13.1 11.8 9.0 9.8 8.1 — — — 5.5-6.0 (High) 13.5 12.5 11.9 14.7 13.2 13.8 13.5 14.2 11.4 12.1 8.2 9.0 8.7 — — —Race (2-year average):b
White — 14.4 15.1 15.1 14.9 16.4 16.5 15.4 16.0 15.9 15.0 14.0 12.6 — — — Black — 13.7 13.3 14.4 12.7 12.2 14.7 12.8 12.8 13.1 12.0 9.8 9.6 — — — Hispanic — 21.9 23.2 23.4 24.4 22.9 21.3 21.2 22.4 21.1 18.5 18.9 18.8 — — —
See Table D-106 for the number of subgroup cases. See Appendix B for definition of variables in table.
Percentage who used in last thirty days
TABLE D-83 Wine Coolers: Trends in Thirty-Day Prevalence of Use by Subgroups for Eighth Graders
Notes: Level of significance of difference between the two most recent classes: s = .05, ss = .01, sss = .001. ‘—’ indicates data not available.
Any apparent inconsistency between the change estimate and the prevalence-of-use estimates for the two most recent classes is due to rounding error.
Source: The Monitoring the Future Study, the University of Michigan.
Data based on one of two forms in 1991–96; N is one-half of N indicated in Table D-106. Data based on one of four forms beginning in 1997; N is one-third of N indicated in Table D-106.
aParental education is an average score of mother’s education and father’s education. See Appendix B for details.bTo derive percentages for each racial subgroup, data for the specified year and the previous year have been combined to increase subgroup sample sizes and thus provide more stable estimates.
Caution: Limited sample sizes (see “Notes” above). Use caution in interpreting subgroup trends.
377

1991 1992 1993 1994 1995 1996 1997 1998 1999 2000 2001 2002 2003 2004 2005 2006Approx. N = 14,800 14,800 15,300 15,800 17,000 15,600 15,500 15,000 13,600 14,300 14,000 14,300 15,800 — — —
Total 24.0 21.5 22.5 21.8 20.8 22.8 22.1 20.9 22.1 21.2 20.8 18.9 17.2 — — —Gender: Male 23.9 19.8 20.5 21.9 19.4 21.8 20.6 19.0 20.5 19.6 19.8 16.0 14.8 — — — Female 24.1 22.9 24.3 21.6 21.9 23.6 23.4 22.0 23.4 22.6 21.7 21.6 19.5 — — —College Plans: None or under 4 years 31.1 26.7 27.6 28.4 28.9 33.0 28.4 29.3 33.4 32.6 31.6 30.2 23.8 — — — Complete 4 years 22.5 20.5 21.4 20.4 19.4 21.0 21.1 19.3 20.3 19.5 19.1 17.2 16.2 — — —Region: Northeast 23.2 19.0 24.1 21.6 18.5 20.3 21.0 19.1 21.7 18.8 21.5 18.1 18.7 — — — North Central 23.0 20.2 20.4 21.6 20.6 21.9 20.9 19.1 21.1 20.6 20.2 19.2 15.3 — — — South 26.0 23.3 23.6 23.0 22.9 25.0 23.4 22.5 24.0 23.3 21.4 17.7 16.9 — — — West 23.0 22.7 23.0 20.2 19.2 22.3 22.4 22.0 20.3 20.7 19.6 21.5 18.2 — — —Population Density: Large MSA 23.1 21.6 21.5 21.2 16.4 19.3 20.2 16.9 23.1 19.8 19.9 17.4 17.0 — — — Other MSA 23.8 22.3 22.4 22.6 20.7 23.7 22.2 21.9 21.3 19.7 19.7 18.7 16.4 — — — Non-MSA 25.1 20.0 23.6 20.4 23.7 24.6 23.8 23.2 22.6 25.6 23.7 21.2 19.5 — — —Parental Education:a
1.0-2.0 (Low) 25.9 24.4 27.4 24.4 27.7 25.4 21.1 22.6 26.3 23.8 22.2 20.3 23.4 — — — 2.5-3.0 26.8 21.3 22.3 22.4 23.8 25.5 24.3 25.4 25.1 24.2 22.7 22.5 19.8 — — — 3.5-4.0 24.8 22.5 22.5 22.3 22.1 23.7 23.6 22.0 22.3 23.6 22.2 19.1 17.5 — — — 4.5-5.0 21.8 20.6 21.9 21.4 19.1 19.9 21.2 15.6 17.5 19.4 17.7 18.2 15.4 — — — 5.5-6.0 (High) 20.7 20.5 20.2 17.8 14.5 21.3 18.5 18.5 21.2 14.2 20.3 13.7 13.3 — — —Race (2-year average):b
White — 23.0 21.9 22.1 21.2 21.7 22.6 21.7 21.6 21.9 21.2 20.3 18.1 — — — Black — 19.9 19.3 20.6 20.0 16.6 16.1 17.6 17.0 18.1 18.3 15.3 15.2 — — — Hispanic — 26.3 26.2 24.7 24.9 28.1 28.0 24.1 24.5 25.2 24.5 22.3 21.7 — — —
TABLE D-84 Wine Coolers: Trends in Thirty-Day Prevalence of Use by Subgroups for Tenth Graders
Percentage who used in last thirty days
aParental education is an average score of mother’s education and father’s education. See Appendix B for details.bTo derive percentages for each racial subgroup, data for the specified year and the previous year have been combined to increase subgroup sample sizes and thus provide more stable estimates.
Caution: Limited sample sizes (see “Notes” above). Use caution in interpreting subgroup trends.
Source: The Monitoring the Future Study, the University of Michigan.
See Table D-107 for the number of subgroup cases. See Appendix B for definition of variables in table.
Data based on one of two forms in 1991–96; N is one-half of N indicated in Table D-107. Data based on one of four forms beginning in 1997; N is one-third of N indicated in Table D-107.
Notes: Level of significance of difference between the two most recent classes: s = .05, ss = .01, sss = .001. ‘—’ indicates data not available.
Any apparent inconsistency between the change estimate and the prevalence-of-use estimates for the two most recent classes is due to rounding error.
378

1975 1976 1977 1978 1979 1980 1981 1982 1983 1984 1985 1986 1987 1988 1989 1990Approx. N = — — — — — — — — — — — — — 16,300 16,700 15,200
Total — — — — — — — — — — — — — 36.6 29.4 26.2Gender: Male — — — — — — — — — — — — — 30.8 25.5 22.7 Female — — — — — — — — — — — — — 41.5 33.6 29.8College Plans: None or under 4 years — — — — — — — — — — — — — 38.2 30.9 29.2 Complete 4 years — — — — — — — — — — — — — 35.9 28.6 24.9Region: Northeast — — — — — — — — — — — — — 33.8 29.6 29.2 North Central — — — — — — — — — — — — — 37.9 33.0 28.6 South — — — — — — — — — — — — — 33.6 25.7 22.9 West — — — — — — — — — — — — — 42.7 31.3 24.7Population Density: Large MSA — — — — — — — — — — — — — 37.7 28.6 25.9 Other MSA — — — — — — — — — — — — — 37.1 31.1 28.7 Non-MSA — — — — — — — — — — — — — 34.6 26.4 21.1Parental Education:a
1.0-2.0 (Low) — — — — — — — — — — — — — 28.8 27.7 22.9 2.5-3.0 — — — — — — — — — — — — — 37.8 31.9 28.1 3.5-4.0 — — — — — — — — — — — — — 38.5 31.2 27.1 4.5-5.0 — — — — — — — — — — — — — 35.6 27.6 27.6 5.5-6.0 (High) — — — — — — — — — — — — — 36.9 23.5 21.5Race (2-year average):b
White — — — — — — — — — — — — — — 35.4 29.6 Black — — — — — — — — — — — — — — 25.3 21.7 Hispanic — — — — — — — — — — — — — — 30.2 23.3
Table D-108.
Source: The Monitoring the Future Study, the University of Michigan.
Percentage who used in last thirty daysClass of:
See Table D-108 for the number of subgroup cases. See Appendix B for definition of variables in table.
Data based on one of five forms in 1988; N is one-fifth of N indicated in Table D-108. Data based on one of six forms beginning in 1989; N is one-sixth of N indicated in
TABLE D-85Wine Coolers: Trends in Thirty-Day Prevalence of Use by Subgroups for Twelfth Graders
Notes: Level of significance of difference between the two most recent classes: s = .05, ss = .01, sss = .001. ‘—’ indicates data not available.
Any apparent inconsistency between the change estimate and the prevalence-of-use estimates for the two most recent classes is due to rounding error.
Cont'd
379
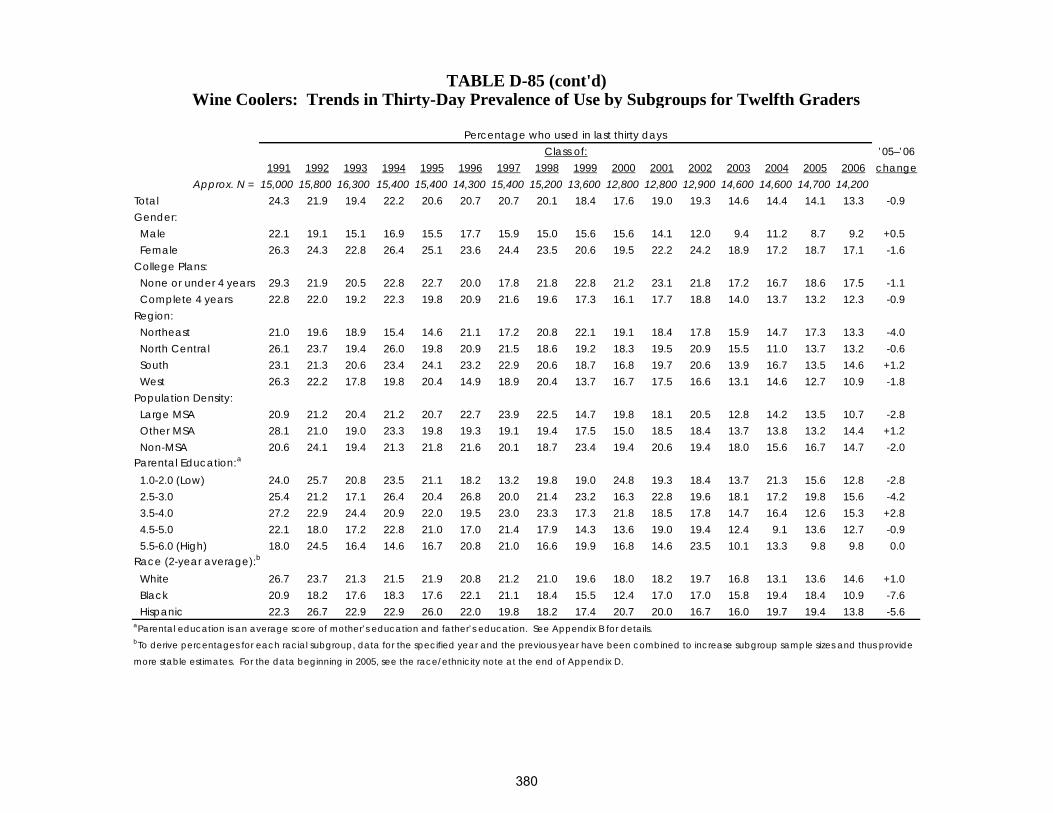
1991 1992 1993 1994 1995 1996 1997 1998 1999 2000 2001 2002 2003 2004 2005 2006Approx. N = 15,000 15,800 16,300 15,400 15,400 14,300 15,400 15,200 13,600 12,800 12,800 12,900 14,600 14,600 14,700 14,200
Total 24.3 21.9 19.4 22.2 20.6 20.7 20.7 20.1 18.4 17.6 19.0 19.3 14.6 14.4 14.1 13.3 -0.9Gender: Male 22.1 19.1 15.1 16.9 15.5 17.7 15.9 15.0 15.6 15.6 14.1 12.0 9.4 11.2 8.7 9.2 +0.5 Female 26.3 24.3 22.8 26.4 25.1 23.6 24.4 23.5 20.6 19.5 22.2 24.2 18.9 17.2 18.7 17.1 -1.6College Plans: None or under 4 years 29.3 21.9 20.5 22.8 22.7 20.0 17.8 21.8 22.8 21.2 23.1 21.8 17.2 16.7 18.6 17.5 -1.1 Complete 4 years 22.8 22.0 19.2 22.3 19.8 20.9 21.6 19.6 17.3 16.1 17.7 18.8 14.0 13.7 13.2 12.3 -0.9Region: Northeast 21.0 19.6 18.9 15.4 14.6 21.1 17.2 20.8 22.1 19.1 18.4 17.8 15.9 14.7 17.3 13.3 -4.0 North Central 26.1 23.7 19.4 26.0 19.8 20.9 21.5 18.6 19.2 18.3 19.5 20.9 15.5 11.0 13.7 13.2 -0.6 South 23.1 21.3 20.6 23.4 24.1 23.2 22.9 20.6 18.7 16.8 19.7 20.6 13.9 16.7 13.5 14.6 +1.2 West 26.3 22.2 17.8 19.8 20.4 14.9 18.9 20.4 13.7 16.7 17.5 16.6 13.1 14.6 12.7 10.9 -1.8Population Density: Large MSA 20.9 21.2 20.4 21.2 20.7 22.7 23.9 22.5 14.7 19.8 18.1 20.5 12.8 14.2 13.5 10.7 -2.8 Other MSA 28.1 21.0 19.0 23.3 19.8 19.3 19.1 19.4 17.5 15.0 18.5 18.4 13.7 13.8 13.2 14.4 +1.2 Non-MSA 20.6 24.1 19.4 21.3 21.8 21.6 20.1 18.7 23.4 19.4 20.6 19.4 18.0 15.6 16.7 14.7 -2.0Parental Education:a
1.0-2.0 (Low) 24.0 25.7 20.8 23.5 21.1 18.2 13.2 19.8 19.0 24.8 19.3 18.4 13.7 21.3 15.6 12.8 -2.8 2.5-3.0 25.4 21.2 17.1 26.4 20.4 26.8 20.0 21.4 23.2 16.3 22.8 19.6 18.1 17.2 19.8 15.6 -4.2 3.5-4.0 27.2 22.9 24.4 20.9 22.0 19.5 23.0 23.3 17.3 21.8 18.5 17.8 14.7 16.4 12.6 15.3 +2.8 4.5-5.0 22.1 18.0 17.2 22.8 21.0 17.0 21.4 17.9 14.3 13.6 19.0 19.4 12.4 9.1 13.6 12.7 -0.9 5.5-6.0 (High) 18.0 24.5 16.4 14.6 16.7 20.8 21.0 16.6 19.9 16.8 14.6 23.5 10.1 13.3 9.8 9.8 0.0Race (2-year average):b
White 26.7 23.7 21.3 21.5 21.9 20.8 21.2 21.0 19.6 18.0 18.2 19.7 16.8 13.1 13.6 14.6 +1.0 Black 20.9 18.2 17.6 18.3 17.6 22.1 21.1 18.4 15.5 12.4 17.0 17.0 15.8 19.4 18.4 10.9 -7.6 Hispanic 22.3 26.7 22.9 22.9 26.0 22.0 19.8 18.2 17.4 20.7 20.0 16.7 16.0 19.7 19.4 13.8 -5.6
Percentage who used in last thirty days
TABLE D-85 (cont'd)Wine Coolers: Trends in Thirty-Day Prevalence of Use by Subgroups for Twelfth Graders
’05–’06change
more stable estimates. For the data beginning in 2005, see the race/ethnicity note at the end of Appendix D.
Class of:
bTo derive percentages for each racial subgroup, data for the specified year and the previous year have been combined to increase subgroup sample sizes and thus provide
aParental education is an average score of mother’s education and father’s education. See Appendix B for details.
380

1975 1976 1977 1978 1979 1980 1981 1982 1983 1984 1985 1986 1987 1988 1989 1990Approx. N = — — — — — — — — — — — — — 16,300 16,700 15,200
Total — — — — — — — — — — — — — 13.9 12.4 10.5Gender: Male — — — — — — — — — — — — — 12.1 11.3 9.9 Female — — — — — — — — — — — — — 15.1 13.5 11.3College Plans: None or under 4 years — — — — — — — — — — — — — 17.7 16.2 14.2 Complete 4 years — — — — — — — — — — — — — 12.5 10.7 9.0Region: Northeast — — — — — — — — — — — — — 14.7 14.3 10.0 North Central — — — — — — — — — — — — — 14.2 13.1 12.0 South — — — — — — — — — — — — — 11.2 11.2 9.3 West — — — — — — — — — — — — — 17.4 12.0 11.0Population Density: Large MSA — — — — — — — — — — — — — 14.2 11.7 10.0 Other MSA — — — — — — — — — — — — — 15.6 12.4 11.0 Non-MSA — — — — — — — — — — — — — 10.7 13.3 9.9Parental Education:a
1.0-2.0 (Low) — — — — — — — — — — — — — 13.9 9.2 10.7 2.5-3.0 — — — — — — — — — — — — — 16.6 13.8 13.3 3.5-4.0 — — — — — — — — — — — — — 13.6 14.9 9.3 4.5-5.0 — — — — — — — — — — — — — 11.7 10.5 11.3 5.5-6.0 (High) — — — — — — — — — — — — — 11.4 7.4 6.3Race (2-year average):b
White — — — — — — — — — — — — — — 13.6 12.3 Black — — — — — — — — — — — — — — 13.0 9.9 Hispanic — — — — — — — — — — — — — — 11.5 6.0
Caution: Limited sample sizes (see “Notes” above). Use caution in interpreting subgroup trends.
Source: The Monitoring the Future Study, the University of Michigan.
indicated in Table D-108.
Wine Coolers: Trends in Two-Week Prevalence of Five or More Drinks in a Row by Subgroups for Twelfth Graders
Data based on one of five forms in 1988; N is one-fifth of N indicated in Table D-108. Data based on one of six forms beginning in 1989; N is one-sixth of N
TABLE D-86
See Table D-108 for the number of subgroup cases. See Appendix B for definition of variables in table.
Percentage who used in last thirty daysClass of:
Notes: Level of significance of difference between the two most recent classes: s = .05, ss = .01, sss = .001. ‘—’ indicates data not available.
Any apparent inconsistency between the change estimate and the prevalence-of-use estimates for the two most recent classes is due to rounding error.
Cont'd
381

1991 1992 1993 1994 1995 1996 1997 1998 1999 2000 2001 2002 2003 2004 2005 2006Approx. N = 15,000 15,800 16,300 15,400 15,400 14,300 15,400 15,200 13,600 12,800 12,800 12,900 14,600 14,600 14,700 14,200
Total 10.2 10.4 8.5 8.9 9.0 8.4 9.4 9.5 7.7 8.8 9.7 10.0 7.1 7.5 7.2 7.1 -0.1Gender: Male 10.0 10.2 7.3 7.4 6.7 6.9 6.7 7.0 7.0 9.4 6.2 7.2 5.4 7.5 4.2 6.1 +1.9 Female 10.2 10.3 9.5 10.0 10.8 9.7 11.3 11.0 7.8 8.4 11.4 11.4 8.2 8.0 9.7 8.0 -1.7College Plans: None or under 4 years 13.5 11.1 10.8 10.9 12.1 8.8 10.1 9.9 10.2 12.1 14.8 13.7 8.9 10.8 11.4 11.9 +0.5 Complete 4 years 9.2 10.1 8.0 8.6 8.0 8.3 9.2 9.5 7.0 7.4 8.2 9.2 6.7 6.8 6.2 6.0 -0.2Region: Northeast 7.6 8.8 6.5 5.5 5.5 9.8 8.2 9.6 8.9 10.1 10.2 9.8 8.0 7.5 10.7 6.9 -3.7 North Central 10.9 12.0 8.0 9.9 7.0 9.2 9.7 7.3 7.0 10.8 8.9 12.0 8.8 6.4 6.6 7.3 +0.8 South 8.8 10.3 11.1 9.3 11.5 8.7 9.7 10.5 8.8 5.9 10.9 9.6 6.7 8.6 6.6 8.3 +1.7 West 13.2 9.7 6.2 10.0 10.4 4.8 9.7 10.2 5.6 10.1 8.4 8.4 5.0 7.1 5.7 5.1 -0.6Population Density: Large MSA 7.9 11.8 7.9 8.5 11.1 8.8 10.8 12.1 7.5 11.1 10.6 9.6 6.8 7.2 7.0 6.4 -0.5 Other MSA 12.4 9.2 8.7 8.8 7.5 8.3 9.5 8.7 6.5 8.1 8.2 9.9 6.3 7.0 7.4 6.6 -0.8 Non-MSA 8.2 11.7 8.6 9.6 9.1 8.2 7.8 7.9 9.7 7.4 11.3 10.7 8.9 8.9 7.1 9.1 +2.1Parental Education:a
1.0-2.0 (Low) 12.5 13.1 12.2 11.4 11.7 9.6 6.8 13.2 8.3 16.8 14.1 14.6 9.3 11.9 8.3 12.0 +3.8 2.5-3.0 10.9 9.5 6.9 10.4 9.5 11.4 9.8 11.0 9.2 8.8 12.6 9.9 9.4 9.5 9.9 8.2 -1.7 3.5-4.0 12.0 11.1 11.1 8.8 8.5 6.8 10.6 9.9 7.7 8.8 7.3 9.9 6.1 9.1 6.2 7.4 +1.2 4.5-5.0 9.2 8.8 7.4 9.2 9.2 7.2 8.6 7.7 7.2 8.6 10.7 10.7 5.9 4.2 6.8 7.4 +0.6 5.5-6.0 (High) 3.7 10.6 5.6 4.8 7.5 7.7 9.5 7.9 5.8 7.0 6.1 8.0 5.9 5.5 5.2 3.4 -1.8Race (2-year average):b
White 10.7 10.3 9.5 8.6 8.6 8.1 8.7 8.8 7.6 7.6 8.9 10.2 8.4 6.4 6.9 7.5 +0.6 Black 9.2 8.7 8.6 8.6 7.5 10.4 10.0 9.2 6.9 4.2 9.6 10.0 7.8 11.7 10.5 4.6 -5.9 Hispanic 9.8 14.5 13.5 13.1 13.9 11.1 9.8 12.0 12.6 13.2 11.5 9.1 9.3 10.6 9.4 8.0 -1.4
more stable estimates. For the data beginning in 2005, see the race/ethnicity note at the end of Appendix D.
aParental education is an average score of mother’s education and father’s education. See Appendix B for details.bTo derive percentages for each racial subgroup, data for the specified year and the previous year have been combined to increase subgroup sample sizes and thus provide
TABLE D-86 (cont'd)
’05–’06change
Percentage who used in last thirty daysClass of:
Wine Coolers: Trends in Two-Week Prevalence of Five or More Drinks in a Row by Subgroups for Twelfth Graders
382

1991–99 2000–03 2004 2005 2006 1991–99 2000–03 2004 2005 2006 1975–99 2000–03 2004 2005 2006Approx. N = — — 17,000 16,800 16,500 — — 16,400 16,200 16,200 — — 14,600 14,700 14,200
Total — — 14.6 12.9 13.1 +0.2 — — 25.1 23.1 24.7 +1.7 — — 31.1 30.5 29.3 -1.2Gender: Male — — 12.7 11.4 10.8 -0.6 — — 24.5 20.3 22.4 +2.1 — — 28.9 28.3 26.0 -2.3 Female — — 16.3 14.4 15.3 +0.9 — — 25.6 25.8 26.9 +1.1 — — 33.2 33.2 32.3 -0.9College Plans: None or under 4 years — — 28.1 24.9 25.9 +0.9 — — 32.5 33.8 37.2 +3.4 — — 34.7 34.2 32.9 -1.4 Complete 4 years — — 13.3 11.8 11.8 0.0 — — 24.2 21.7 23.1 +1.4 — — 30.3 29.6 28.7 -0.9Region: Northeast — — 14.9 11.0 12.2 +1.2 — — 26.6 22.4 26.3 +3.9 — — 33.5 38.1 29.4 -8.7 s North Central — — 16.2 12.6 12.9 +0.3 — — 22.5 23.4 23.5 +0.1 — — 35.3 33.4 32.2 -1.2 South — — 15.1 14.6 14.3 -0.3 — — 25.6 23.7 24.5 +0.8 — — 25.9 25.9 27.0 +1.1 West — — 11.7 11.9 12.0 +0.2 — — 26.5 22.5 25.4 +2.9 — — 32.1 27.9 29.9 +2.0Population Density: Large MSA — — 14.4 11.5 12.6 +1.2 — — 22.4 22.0 23.1 +1.0 — — 27.0 29.9 32.3 +2.4 Other MSA — — 14.2 14.0 13.0 -0.9 — — 26.1 23.1 25.5 +2.4 — — 33.4 29.9 27.7 -2.2 Non-MSA — — 15.6 12.8 13.9 +1.1 — — 26.5 24.4 25.5 +1.1 — — 30.9 32.2 28.5 -3.7Parental Education:a
1.0-2.0 (Low) — — 19.5 19.5 18.7 -0.9 — — 27.3 24.9 25.8 +0.9 — — 28.5 22.2 30.3 +8.2 2.5-3.0 — — 17.5 18.0 18.7 +0.7 — — 30.5 28.1 27.9 -0.1 — — 31.0 33.3 30.6 -2.7 3.5-4.0 — — 17.8 16.2 13.4 -2.8 — — 25.0 23.6 28.5 +4.9 s — — 33.6 31.7 30.9 -0.7 4.5-5.0 — — 11.8 10.3 8.5 -1.7 — — 24.9 22.6 19.9 -2.7 — — 29.4 30.2 28.8 -1.3 5.5-6.0 (High) — — 11.5 7.3 9.9 +2.6 — — 20.8 17.3 23.7 +6.5 ss — — 29.8 30.2 26.4 -3.8Race (2-year average):b
White — — — 13.8 12.6 -1.2 — — — 25.7 25.1 -0.6 — — — 33.3 31.4 -1.9 Black — — — 12.0 11.0 -1.0 — — — 16.1 15.5 -0.6 — — — 17.1 20.9 +3.8 Hispanic — — — 17.0 17.6 +0.6 — — — 29.0 28.6 -0.4 — — — 28.6 32.2 +3.6
bTo derive percentages for each racial subgroup, data for the specified year and the previous year have been combined to increase subgroup sample sizes and thus provide more stable
estimates. For the data beginning in 2005, see the race/ethnicity note at the end of Appendix D.
TABLE D-87Flavored Alcoholic Beverages: Trends in Thirty-Day Prevalence of Use by Subgroups
for Eighth, Tenth, and Twelfth Graders
estimate and the prevalence-of-use estimates for the two most recent classes is due to rounding error. See Tables D-106 to D-108 for the number of subgroup cases. See Appendix B for
definition of variables in table. Data for 8th and 10th graders based on one of four forms; N is one-third of N indicated in Tables D-106 and D-107. Data for 12th graders based on one of
six forms; N is one-sixth of N indicated in Table D-108. Caution: Limited sample sizes (see “Notes” above). Use caution in interpreting subgroup trends. aParental education is an average score of mother’s education and father’s education. See Appendix B for details.
Percentage who used in last thirty days
Source: The Monitoring the Future Study, the University of Michigan.
Notes: Level of significance of difference between the two most recent classes: s = .05, ss = .01, sss = .001. ‘—’ indicates data not available. Any apparent inconsistency between the change
’05–’06change change
’05–’06change
8th Graders 10th Graders 12th Graders’05–’06
383

1991 1992 1993 1994 1995 1996 1997 1998 1999 2000 2001 2002 2003 2004 2005 2006Approx. N = 17,500 18,600 18,300 17,300 17,500 17,800 18,600 18,100 16,700 16,700 16,200 15,100 16,500 17,000 16,800 16,500
Total 14.3 15.5 16.7 18.6 19.1 21.0 19.4 19.1 17.5 14.6 12.2 10.7 10.2 9.2 9.3 8.7 -0.6Gender: Male 15.5 14.9 17.2 19.3 18.8 20.6 19.1 18.0 16.7 14.3 12.2 11.0 9.6 8.3 8.7 8.1 -0.6 Female 13.1 15.9 16.3 17.9 19.0 21.1 19.5 19.8 17.7 14.7 12.0 10.4 10.6 9.9 9.7 8.9 -0.8College Plans: None or under 4 years 29.2 31.9 34.1 36.6 36.5 39.2 40.0 40.1 40.3 34.7 30.0 29.3 27.8 25.6 26.7 23.2 -3.5 Complete 4 years 11.8 13.1 14.3 16.1 16.8 18.2 16.9 16.5 14.5 12.2 10.0 8.9 8.3 7.4 7.4 7.1 -0.2Region: Northeast 13.7 14.4 15.0 17.8 18.6 22.1 18.0 15.6 15.7 13.7 11.4 9.1 7.7 7.2 7.8 6.7 -1.0 North Central 15.5 16.5 16.3 18.5 20.9 23.2 20.0 22.3 21.3 17.1 12.0 11.0 12.2 10.8 9.5 9.3 -0.2 South 15.7 17.0 18.2 19.5 19.4 21.1 21.0 21.1 18.7 14.7 14.3 13.0 11.7 10.3 11.6 10.9 -0.7 West 10.0 12.2 16.4 18.0 16.5 17.1 17.1 15.1 12.1 12.2 9.3 7.5 7.0 7.4 6.3 5.7 -0.6Population Density: Large MSA 12.8 15.0 14.1 15.5 16.5 19.4 15.8 16.4 12.7 12.1 9.3 7.5 7.7 7.7 6.7 6.4 -0.3 Other MSA 14.9 15.3 17.8 20.7 19.4 21.4 19.7 17.7 16.0 13.1 11.6 10.6 9.8 8.9 9.8 8.8 -1.0 Non-MSA 14.8 16.4 17.9 17.8 21.5 22.1 22.8 24.8 26.1 21.1 16.9 14.9 14.4 11.6 11.8 11.6 -0.2Parental Education:a
1.0-2.0 (Low) 26.2 24.1 23.3 26.1 25.3 26.5 26.9 26.7 26.6 22.0 20.3 20.3 17.5 15.8 16.6 14.7 -2.0 2.5-3.0 16.4 16.9 19.8 20.6 22.7 24.4 22.4 23.9 23.5 19.6 16.4 14.5 14.8 12.2 13.4 12.5 -1.0 3.5-4.0 13.9 14.9 17.4 20.1 20.8 21.4 20.9 21.4 17.0 14.7 12.6 10.5 9.6 9.6 10.5 8.8 -1.8 4.5-5.0 10.1 13.3 12.5 14.9 14.9 18.4 16.2 14.2 12.3 10.2 8.3 7.8 6.7 6.7 5.9 5.5 -0.4 5.5-6.0 (High) 11.3 11.5 13.3 15.1 14.5 17.3 15.3 13.8 12.2 9.8 6.9 5.8 6.0 5.2 4.3 4.8 +0.5Race (2-year average):b
White — 16.2 17.8 18.9 20.7 22.7 22.8 21.5 20.1 17.7 14.7 12.0 10.9 10.0 9.4 9.3 -0.1 Black — 5.3 6.6 8.7 8.9 9.6 10.9 10.6 10.7 9.6 8.2 7.7 6.9 6.9 7.1 6.0 -1.1 Hispanic — 16.7 18.3 21.3 21.6 19.6 19.1 20.1 20.5 16.6 13.0 12.8 11.9 10.1 9.0 8.8 -0.2
aParental education is an average score of mother’s education and father’s education. See Appendix B for details.bTo derive percentages for each racial subgroup, data for the specified year and the previous year have been combined to increase subgroup sample sizes and thus provide
more stable estimates. For the data beginning in 2005, see the race/ethnicity note at the end of Appendix D.
Percentage who used in last thirty days’05–’06change
See Table D-106 for the number of subgroup cases. See Appendix B for definition of variables in table.
Source: The Monitoring the Future Study, the University of Michigan.
TABLE D-88 Cigarettes: Trends in Thirty-Day Prevalence of Use by Subgroups for Eighth Graders
Notes: Level of significance of difference between the two most recent classes: s = .05, ss = .01, sss = .001. ‘—’ indicates data not available.
Any apparent inconsistency between the change estimate and the prevalence-of-use estimates for the two most recent classes is due to rounding error.
384

1991 1992 1993 1994 1995 1996 1997 1998 1999 2000 2001 2002 2003 2004 2005 2006Approx. N = 14,800 14,800 15,300 15,800 17,000 15,600 15,500 15,000 13,600 14,300 14,000 14,300 15,800 16,400 16,200 16,200
Total 20.8 21.5 24.7 25.4 27.9 30.4 29.8 27.6 25.7 23.9 21.3 17.7 16.7 16.0 14.9 14.5 -0.4Gender: Male 20.8 20.6 24.6 26.6 27.7 30.1 28.2 26.2 25.2 23.8 20.9 16.7 16.2 16.2 14.5 13.4 -1.1 Female 20.7 22.2 24.5 23.9 27.9 30.8 31.1 29.1 25.8 23.6 21.5 18.6 17.0 15.7 15.1 15.5 +0.3College Plans: None or under 4 years 36.5 35.0 41.9 42.2 46.3 46.2 47.2 45.2 44.0 38.6 38.1 33.3 33.0 33.1 29.4 32.7 +3.3 Complete 4 years 17.3 18.6 21.0 21.7 24.7 27.8 26.8 24.5 22.7 21.5 18.5 15.1 14.0 13.6 12.9 12.1 -0.8Region: Northeast 22.4 21.9 27.1 24.5 27.8 31.7 29.3 30.1 28.0 23.9 18.1 15.9 16.6 16.6 14.9 11.8 -3.1 North Central 22.9 24.3 26.0 28.8 30.1 32.5 31.7 29.5 30.2 27.1 24.2 19.2 18.4 14.6 16.2 18.1 +1.9 South 21.2 19.8 24.0 25.7 30.8 33.4 32.2 29.8 26.3 25.5 23.5 19.6 18.2 20.4 16.4 15.6 -0.9 West 16.7 20.2 21.2 20.1 19.6 20.8 23.2 19.6 17.5 16.8 15.0 14.1 12.5 10.9 10.9 10.9 0.0Population Density: Large MSA 19.7 21.6 22.5 22.3 23.3 26.2 26.6 22.5 22.9 23.1 17.3 14.2 13.1 12.0 11.7 11.5 -0.2 Other MSA 20.3 20.3 23.8 26.3 28.9 31.1 28.9 26.6 25.0 21.3 20.5 17.6 16.6 16.6 14.7 13.3 -1.4 Non-MSA 22.7 23.7 28.2 26.7 31.3 33.9 34.9 35.7 30.4 29.4 27.6 22.6 22.4 20.4 19.8 22.4 +2.6Parental Education:a
1.0-2.0 (Low) 23.5 28.4 29.5 26.4 30.9 28.7 28.2 28.0 30.5 29.3 22.5 21.4 23.4 19.3 16.4 20.4 +4.0 2.5-3.0 24.1 23.3 28.0 29.1 33.2 33.8 33.2 33.0 29.6 26.8 25.7 22.4 21.2 19.9 19.7 19.7 0.0 3.5-4.0 20.4 20.6 24.8 26.0 27.8 31.6 30.9 27.3 26.0 25.3 21.1 17.4 16.2 17.8 15.7 15.5 -0.2 4.5-5.0 18.5 19.5 20.1 22.6 25.9 28.7 28.5 25.7 22.4 21.2 18.9 15.1 13.4 12.6 12.5 10.8 -1.7 5.5-6.0 (High) 18.5 18.9 21.4 20.7 21.8 27.8 24.6 22.5 21.4 19.1 17.1 12.7 11.6 10.8 10.8 10.0 -0.8Race (2-year average):b
White — 24.1 26.0 27.8 29.7 32.9 34.4 33.2 30.8 28.2 25.7 22.4 20.0 18.7 17.6 16.6 -1.0 Black — 6.6 7.5 9.8 11.5 12.2 12.8 13.7 12.5 11.1 11.1 9.8 8.9 9.2 8.7 8.0 -0.6 Hispanic — 18.3 20.5 19.4 21.4 23.7 23.0 21.3 21.1 19.6 16.8 14.3 13.2 13.9 13.5 12.1 -1.4
TABLE D-89
aParental education is an average score of mother’s education and father’s education. See Appendix B for details.bTo derive percentages for each racial subgroup, data for the specified year and the previous year have been combined to increase subgroup sample sizes and thus provide
more stable estimates. For the data beginning in 2005, see the race/ethnicity note at the end of Appendix D.
Cigarettes: Trends in Thirty-Day Prevalence of Use by Subgroups for Tenth Graders
Notes: Level of significance of difference between the two most recent classes: s = .05, ss = .01, sss = .001. ‘—’ indicates data not available.
Any apparent inconsistency between the change estimate and the prevalence-of-use estimates for the two most recent classes is due to rounding error.
See Table D-107 for the number of subgroup cases. See Appendix B for definition of variables in table.
Percentage who used in last thirty days’05–’06change
Source: The Monitoring the Future Study, the University of Michigan.
385

1975 1976 1977 1978 1979 1980 1981 1982 1983 1984 1985 1986 1987 1988 1989 1990Approx. N = 9,400 15,400 17,100 17,800 15,500 15,900 17,500 17,700 16,300 15,900 16,000 15,200 16,300 16,300 16,700 15,200
Total 36.7 38.8 38.4 36.7 34.4 30.5 29.4 30.0 30.3 29.3 30.1 29.6 29.4 28.7 28.6 29.4Gender: Male 37.2 37.7 36.6 34.5 31.2 26.8 26.5 26.8 28.0 25.9 28.2 27.9 27.0 28.0 27.7 29.1 Female 35.9 39.1 39.6 38.1 37.1 33.4 31.6 32.6 31.6 31.9 31.4 30.6 31.4 28.9 29.0 29.2College Plans: None or under 4 years — 46.3 46.2 44.6 43.0 39.6 38.1 38.7 38.0 37.9 40.5 38.5 39.7 37.5 38.0 37.5 Complete 4 years — 29.8 29.4 27.4 26.0 22.3 22.3 22.1 23.3 22.7 22.8 24.0 24.3 24.4 24.1 25.4Region: Northeast 40.1 41.8 43.0 40.6 37.0 34.1 31.5 32.1 34.6 33.5 34.2 35.2 34.1 31.2 29.4 31.9 North Central 39.5 41.3 40.5 39.0 36.6 31.5 32.4 33.5 33.2 31.4 34.1 32.5 31.7 31.1 34.9 34.0 South 36.2 39.1 37.6 35.7 35.4 31.8 28.9 29.4 28.7 28.6 25.6 26.1 26.0 28.0 26.4 26.1 West 26.3 28.3 27.7 27.3 24.8 21.2 21.8 20.4 21.8 22.9 26.3 23.3 26.6 23.9 22.7 25.1Population Density: Large MSA 39.7 40.4 40.9 37.5 33.4 31.2 30.6 32.1 30.8 31.3 31.9 30.8 29.3 26.9 25.9 27.9 Other MSA 35.1 35.9 36.1 34.3 33.5 29.7 27.4 27.8 29.1 28.2 28.5 28.0 28.2 28.3 28.2 29.6 Non-MSA 36.7 40.9 39.2 39.4 36.4 30.9 30.9 31.2 31.5 29.3 30.8 31.0 31.8 31.4 32.2 30.4Parental Education:a
1.0-2.0 (Low) 37.2 43.2 39.6 38.1 38.1 32.7 32.5 32.6 32.7 33.6 32.3 28.6 28.8 28.1 25.4 26.3 2.5-3.0 37.0 41.2 40.8 39.3 35.9 34.2 31.7 32.0 32.2 31.8 32.3 32.3 31.4 29.9 30.8 30.8 3.5-4.0 31.9 35.3 37.3 34.0 33.3 28.0 28.2 29.0 28.0 28.1 29.7 29.7 28.8 27.8 29.4 29.3 4.5-5.0 32.3 35.0 33.0 32.6 30.1 25.7 26.0 25.5 27.8 25.2 27.7 26.4 27.6 28.6 27.0 29.1 5.5-6.0 (High) 26.8 30.8 32.8 31.9 29.6 24.0 22.5 25.1 25.5 23.7 22.6 26.7 29.3 27.8 26.3 28.6Race (2-year average):b
White — — 38.3 37.6 36.0 33.0 30.5 30.7 31.3 31.2 31.3 31.9 32.1 32.2 32.2 32.3 Black — — 36.7 32.7 30.2 26.8 23.7 21.8 21.2 19.3 18.1 16.9 14.2 13.3 12.6 12.2 Hispanic — — 35.7 32.8 26.8 22.6 23.2 24.7 24.7 25.3 25.5 23.7 22.7 21.9 20.6 21.7
Notes: Level of significance of difference between the two most recent classes: s = .05, ss = .01, sss = .001. ‘—’ indicates data not available.
Any apparent inconsistency between the change estimate and the prevalence-of-use estimates for the two most recent classes is due to rounding error.
See Table D-108 for the number of subgroup cases. See Appendix B for definition of variables in table.
Source: The Monitoring the Future Study, the University of Michigan.
TABLE D-90Cigarettes: Trends in Thirty-Day Prevalence of Use by Subgroups for Twelfth Graders
Class of:Percentage who used in last thirty days
Cont'd
386

1991 1992 1993 1994 1995 1996 1997 1998 1999 2000 2001 2002 2003 2004 2005 2006Approx. N = 15,000 15,800 16,300 15,400 15,400 14,300 15,400 15,200 13,600 12,800 12,800 12,900 14,600 14,600 14,700 14,200
Total 28.3 27.8 29.9 31.2 33.5 34.0 36.5 35.1 34.6 31.4 29.5 26.7 24.4 25.0 23.2 21.6 -1.6Gender: Male 29.0 29.2 30.7 32.9 34.5 34.9 37.3 36.3 35.4 32.8 29.7 27.4 26.2 25.3 24.8 22.4 -2.4 s Female 27.5 26.1 28.7 29.2 32.0 32.4 35.2 33.3 33.5 29.7 28.7 25.5 22.1 24.1 20.7 20.1 -0.6College Plans: None or under 4 years 38.1 38.6 37.3 40.9 43.5 45.0 45.7 46.7 44.9 43.6 40.8 37.5 36.2 36.8 34.8 32.9 -1.9 Complete 4 years 24.2 23.8 27.3 28.0 29.9 30.8 33.1 31.3 31.4 27.3 25.9 23.6 20.8 21.6 20.0 18.6 -1.4Region: Northeast 30.5 29.6 34.2 33.2 34.4 38.5 40.6 35.9 34.2 33.1 30.3 27.3 25.0 25.9 22.0 23.1 +1.1 North Central 34.6 31.7 33.2 36.2 37.8 37.7 39.3 40.0 37.8 35.6 35.9 31.7 27.3 28.3 26.8 23.6 -3.2 South 25.4 26.4 29.0 30.7 33.5 33.2 35.0 34.3 36.2 29.6 25.9 27.2 24.3 24.6 24.6 23.2 -1.4 West 23.2 22.8 22.9 24.0 26.5 24.4 30.5 29.1 27.6 28.1 25.2 19.4 20.7 20.1 17.5 15.0 -2.5Population Density: Large MSA 26.2 25.6 29.5 29.0 33.9 32.1 34.9 32.9 30.0 27.4 27.3 24.8 18.9 20.8 20.8 20.7 -0.1 Other MSA 29.3 26.9 29.8 31.1 31.7 32.6 35.7 34.2 35.0 31.5 28.2 26.2 25.1 26.3 22.6 20.3 -2.3 Non-MSA 28.6 31.5 30.3 33.8 36.2 38.2 40.0 39.7 38.7 36.3 34.3 30.1 30.4 27.6 27.4 25.3 -2.0Parental Education:a
1.0-2.0 (Low) 31.3 27.1 26.5 26.2 31.2 31.5 31.2 32.3 33.0 31.3 24.8 20.9 23.5 21.0 19.1 21.1 +2.0 2.5-3.0 28.7 30.3 30.4 32.8 35.0 35.5 36.5 36.0 37.3 32.2 31.5 28.9 27.0 28.7 27.3 24.7 -2.6 3.5-4.0 28.4 27.8 29.9 31.4 33.2 33.2 35.6 36.7 35.0 32.8 30.3 28.6 24.3 26.3 24.8 22.9 -1.8 4.5-5.0 26.9 25.8 30.1 32.0 32.6 34.5 37.5 34.2 32.4 30.2 29.3 25.0 22.6 23.8 21.8 19.2 -2.6 5.5-6.0 (High) 27.1 25.5 30.5 30.4 34.0 32.9 38.5 33.1 34.4 27.4 25.0 25.3 21.0 19.9 18.0 17.4 -0.6Race (2-year average):b
White 32.2 31.8 33.2 35.2 36.6 38.1 40.7 41.7 40.1 37.9 35.3 32.5 29.4 28.2 27.6 25.9 -1.7 Black 10.6 8.7 9.5 10.9 12.9 14.2 14.3 14.9 14.9 14.3 13.3 12.1 10.0 10.1 10.7 10.5 -0.1 Hispanic 24.0 25.0 24.2 23.6 25.1 25.4 25.9 26.6 27.3 27.7 23.8 21.3 19.0 18.5 17.1 16.0 -1.1
more stable estimates. For the data beginning in 2005, see the race/ethnicity note at the end of Appendix D.
’05–’06change
TABLE D-90 (cont'd)Cigarettes: Trends in Thirty-Day Prevalence of Use by Subgroups for Twelfth Graders
aParental education is an average score of mother’s education and father’s education. See Appendix B for details.bTo derive percentages for each racial subgroup, data for the specified year and the previous year have been combined to increase subgroup sample sizes and thus provide
Percentage who used in last thirty daysClass of:
387
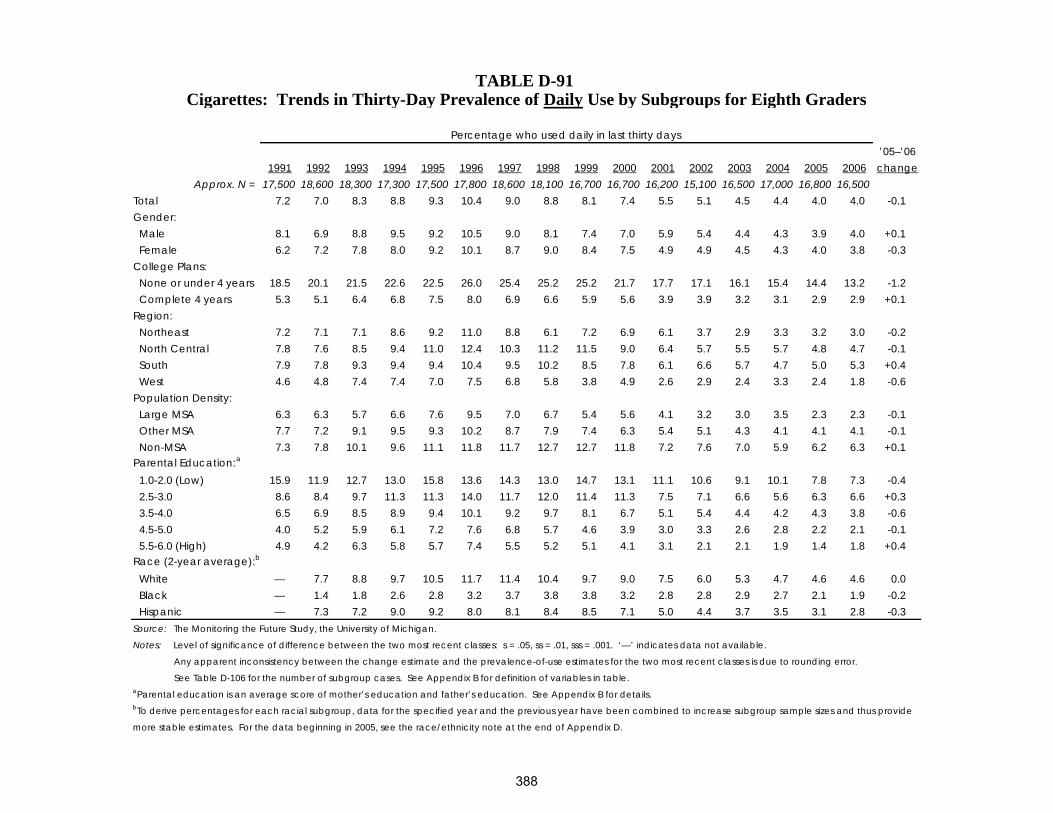
1991 1992 1993 1994 1995 1996 1997 1998 1999 2000 2001 2002 2003 2004 2005 2006Approx. N = 17,500 18,600 18,300 17,300 17,500 17,800 18,600 18,100 16,700 16,700 16,200 15,100 16,500 17,000 16,800 16,500
Total 7.2 7.0 8.3 8.8 9.3 10.4 9.0 8.8 8.1 7.4 5.5 5.1 4.5 4.4 4.0 4.0 -0.1Gender: Male 8.1 6.9 8.8 9.5 9.2 10.5 9.0 8.1 7.4 7.0 5.9 5.4 4.4 4.3 3.9 4.0 +0.1 Female 6.2 7.2 7.8 8.0 9.2 10.1 8.7 9.0 8.4 7.5 4.9 4.9 4.5 4.3 4.0 3.8 -0.3College Plans: None or under 4 years 18.5 20.1 21.5 22.6 22.5 26.0 25.4 25.2 25.2 21.7 17.7 17.1 16.1 15.4 14.4 13.2 -1.2 Complete 4 years 5.3 5.1 6.4 6.8 7.5 8.0 6.9 6.6 5.9 5.6 3.9 3.9 3.2 3.1 2.9 2.9 +0.1Region: Northeast 7.2 7.1 7.1 8.6 9.2 11.0 8.8 6.1 7.2 6.9 6.1 3.7 2.9 3.3 3.2 3.0 -0.2 North Central 7.8 7.6 8.5 9.4 11.0 12.4 10.3 11.2 11.5 9.0 6.4 5.7 5.5 5.7 4.8 4.7 -0.1 South 7.9 7.8 9.3 9.4 9.4 10.4 9.5 10.2 8.5 7.8 6.1 6.6 5.7 4.7 5.0 5.3 +0.4 West 4.6 4.8 7.4 7.4 7.0 7.5 6.8 5.8 3.8 4.9 2.6 2.9 2.4 3.3 2.4 1.8 -0.6Population Density: Large MSA 6.3 6.3 5.7 6.6 7.6 9.5 7.0 6.7 5.4 5.6 4.1 3.2 3.0 3.5 2.3 2.3 -0.1 Other MSA 7.7 7.2 9.1 9.5 9.3 10.2 8.7 7.9 7.4 6.3 5.4 5.1 4.3 4.1 4.1 4.1 -0.1 Non-MSA 7.3 7.8 10.1 9.6 11.1 11.8 11.7 12.7 12.7 11.8 7.2 7.6 7.0 5.9 6.2 6.3 +0.1Parental Education:a
1.0-2.0 (Low) 15.9 11.9 12.7 13.0 15.8 13.6 14.3 13.0 14.7 13.1 11.1 10.6 9.1 10.1 7.8 7.3 -0.4 2.5-3.0 8.6 8.4 9.7 11.3 11.3 14.0 11.7 12.0 11.4 11.3 7.5 7.1 6.6 5.6 6.3 6.6 +0.3 3.5-4.0 6.5 6.9 8.5 8.9 9.4 10.1 9.2 9.7 8.1 6.7 5.1 5.4 4.4 4.2 4.3 3.8 -0.6 4.5-5.0 4.0 5.2 5.9 6.1 7.2 7.6 6.8 5.7 4.6 3.9 3.0 3.3 2.6 2.8 2.2 2.1 -0.1 5.5-6.0 (High) 4.9 4.2 6.3 5.8 5.7 7.4 5.5 5.2 5.1 4.1 3.1 2.1 2.1 1.9 1.4 1.8 +0.4Race (2-year average):b
White — 7.7 8.8 9.7 10.5 11.7 11.4 10.4 9.7 9.0 7.5 6.0 5.3 4.7 4.6 4.6 0.0 Black — 1.4 1.8 2.6 2.8 3.2 3.7 3.8 3.8 3.2 2.8 2.8 2.9 2.7 2.1 1.9 -0.2 Hispanic — 7.3 7.2 9.0 9.2 8.0 8.1 8.4 8.5 7.1 5.0 4.4 3.7 3.5 3.1 2.8 -0.3
aParental education is an average score of mother’s education and father’s education. See Appendix B for details.bTo derive percentages for each racial subgroup, data for the specified year and the previous year have been combined to increase subgroup sample sizes and thus provide
more stable estimates. For the data beginning in 2005, see the race/ethnicity note at the end of Appendix D.
Percentage who used daily in last thirty days’05–’06change
See Table D-106 for the number of subgroup cases. See Appendix B for definition of variables in table.
TABLE D-91 Cigarettes: Trends in Thirty-Day Prevalence of Daily Use by Subgroups for Eighth Graders
Notes: Level of significance of difference between the two most recent classes: s = .05, ss = .01, sss = .001. ‘—’ indicates data not available.
Any apparent inconsistency between the change estimate and the prevalence-of-use estimates for the two most recent classes is due to rounding error.
Source: The Monitoring the Future Study, the University of Michigan.
388

1991 1992 1993 1994 1995 1996 1997 1998 1999 2000 2001 2002 2003 2004 2005 2006Approx. N = 14,800 14,800 15,300 15,800 17,000 15,600 15,500 15,000 13,600 14,300 14,000 14,300 15,800 16,400 16,200 16,200
Total 12.6 12.3 14.2 14.6 16.3 18.3 18.0 15.8 15.9 14.0 12.2 10.1 8.9 8.3 7.5 7.6 0.0Gender: Male 12.4 12.1 13.8 15.2 16.3 18.1 17.2 14.7 15.6 13.7 12.4 9.4 8.6 8.2 7.2 6.9 -0.3 Female 12.5 12.4 14.3 13.7 16.1 18.6 18.5 16.8 15.9 14.1 11.9 10.8 9.0 8.2 7.7 8.1 +0.4College Plans: None or under 4 years 25.7 25.5 28.9 28.9 32.7 34.3 35.4 31.7 32.1 28.8 27.3 22.9 22.1 21.4 19.2 21.7 +2.4 Complete 4 years 9.6 9.5 11.0 11.5 13.3 15.5 15.0 12.9 13.2 11.6 9.6 7.9 6.7 6.4 5.9 5.6 -0.2Region: Northeast 14.3 13.1 16.3 14.1 15.8 18.8 18.0 18.7 17.7 14.1 11.0 8.3 8.6 8.5 7.6 6.2 -1.4 North Central 14.3 14.3 15.1 16.9 17.6 20.6 19.5 17.3 19.6 16.3 13.2 11.5 10.2 7.4 8.6 10.3 +1.7 South 12.8 11.4 13.9 15.5 19.3 20.5 20.5 17.1 16.3 15.7 14.3 11.3 10.1 11.0 8.8 8.4 -0.4 West 9.1 10.7 10.9 9.7 9.4 10.7 11.1 8.8 9.1 7.8 7.0 7.8 6.0 5.2 4.0 4.2 +0.2Population Density: Large MSA 12.3 11.7 12.3 12.0 12.6 15.3 15.7 12.2 13.2 13.8 9.6 7.4 6.1 5.6 5.5 5.4 -0.1 Other MSA 11.7 11.6 13.6 15.5 17.5 18.8 16.9 15.1 15.5 12.1 11.6 10.4 8.7 8.1 7.0 6.7 -0.3 Non-MSA 14.3 14.5 16.9 15.5 18.4 20.8 22.5 21.1 19.7 17.5 16.3 13.1 13.7 12.3 11.4 13.2 +1.8Parental Education:a
1.0-2.0 (Low) 16.0 17.8 19.3 15.5 20.0 19.3 17.7 17.4 20.1 18.9 12.9 14.1 15.3 11.4 9.9 12.5 +2.6 2.5-3.0 15.5 13.9 16.9 17.6 21.6 23.1 22.1 21.3 19.1 17.6 16.2 14.7 12.7 11.5 11.1 11.9 +0.7 3.5-4.0 12.0 11.8 13.6 15.9 17.0 19.4 18.9 14.9 16.6 14.2 12.2 10.0 8.8 9.3 7.9 7.8 -0.1 4.5-5.0 10.6 10.5 10.7 11.5 12.6 14.8 15.6 12.9 13.0 11.5 9.7 6.8 5.8 5.4 5.2 4.4 -0.8 5.5-6.0 (High) 9.6 9.0 10.5 9.6 10.3 13.6 12.0 11.1 11.2 9.8 8.3 6.4 4.5 4.2 4.4 4.3 -0.1Race (2-year average):b
White — 14.5 15.3 16.5 17.6 20.0 21.4 20.3 19.1 17.7 15.5 13.3 11.4 10.0 9.1 8.7 -0.4 Black — 2.8 3.1 3.8 4.7 5.1 5.6 5.8 5.3 5.2 5.2 5.0 4.3 4.4 3.9 3.3 -0.6 Hispanic — 8.4 8.9 8.1 9.9 11.6 10.8 9.4 9.1 8.8 7.4 6.4 6.0 6.0 5.9 5.3 -0.6
TABLE D-92
aParental education is an average score of mother’s education and father’s education. See Appendix B for details.bTo derive percentages for each racial subgroup, data for the specified year and the previous year have been combined to increase subgroup sample sizes and thus provide
Source: The Monitoring the Future Study, the University of Michigan.
more stable estimates. For the data beginning in 2005, see the race/ethnicity note at the end of Appendix D.
Cigarettes: Trends in Thirty-Day Prevalence of Daily Use by Subgroups for Tenth Graders
Notes: Level of significance of difference between the two most recent classes: s = .05, ss = .01, sss = .001. ‘—’ indicates data not available.
Any apparent inconsistency between the change estimate and the prevalence-of-use estimates for the two most recent classes is due to rounding error.
See Table D-107 for the number of subgroup cases. See Appendix B for definition of variables in table.
Percentage who used daily in last thirty days’05–’06change
389

1975 1976 1977 1978 1979 1980 1981 1982 1983 1984 1985 1986 1987 1988 1989 1990Approx. N = 9,400 15,400 17,100 17,800 15,500 15,900 17,500 17,700 16,300 15,900 16,000 15,200 16,300 16,300 16,700 15,200
Total 26.9 28.8 28.8 27.5 25.4 21.3 20.3 21.1 21.2 18.7 19.5 18.7 18.7 18.1 18.9 19.1Gender: Male 26.9 28.0 27.1 26.0 22.3 18.5 18.1 18.2 19.2 16.0 17.8 16.9 16.4 17.4 17.9 18.6 Female 26.4 28.8 30.0 28.3 27.8 23.5 21.7 23.2 22.2 20.5 20.6 19.8 20.6 18.1 19.4 19.3College Plans: None or under 4 years — 36.5 37.2 35.2 33.8 29.7 29.3 29.5 29.3 27.2 29.6 28.2 29.0 27.4 27.9 28.3 Complete 4 years — 19.8 19.3 18.3 17.0 13.8 12.9 13.2 13.8 11.9 12.4 12.8 13.3 13.4 14.6 14.7Region: Northeast 31.4 32.3 33.8 32.5 28.6 24.1 23.3 23.4 26.1 23.6 24.9 24.9 24.8 21.4 21.3 22.8 North Central 28.6 30.2 29.4 28.6 27.0 22.0 23.0 24.0 23.4 20.4 22.4 19.9 20.3 19.0 23.0 22.2 South 26.2 29.1 28.7 26.4 25.8 22.6 19.1 20.2 19.4 17.7 16.0 15.8 15.7 17.7 17.1 16.5 West 17.3 19.4 19.2 19.1 17.0 14.0 13.1 12.7 13.0 12.4 14.2 13.4 14.9 14.0 13.8 14.8Population Density: Large MSA 30.8 30.4 30.9 29.2 24.5 21.6 21.9 23.5 22.1 21.5 21.9 20.6 20.3 18.0 16.7 19.0 Other MSA 25.6 27.1 27.2 25.7 25.0 21.3 19.0 19.3 20.2 17.4 17.7 17.0 17.6 17.7 19.0 19.0 Non-MSA 25.8 29.5 29.1 28.7 26.5 21.2 20.7 21.3 21.7 18.2 19.9 19.8 19.3 18.8 20.9 19.5Parental Education:a
1.0-2.0 (Low) 27.2 32.7 29.6 28.6 29.1 23.7 24.1 24.6 24.0 23.2 22.7 20.4 19.7 19.2 17.1 16.7 2.5-3.0 27.2 31.3 31.5 30.3 26.5 24.7 22.5 23.1 23.2 21.5 21.8 21.4 21.1 19.6 21.5 21.0 3.5-4.0 22.1 25.8 28.1 24.8 24.5 19.4 19.0 19.7 18.8 16.4 19.3 19.4 17.8 17.5 19.0 19.3 4.5-5.0 22.9 24.5 23.7 23.2 21.2 16.6 16.1 16.8 17.5 14.1 16.0 13.9 16.5 16.5 17.2 18.3 5.5-6.0 (High) 17.4 22.8 21.7 22.8 20.6 15.0 13.9 14.5 17.2 14.1 11.2 13.6 16.6 15.1 15.8 16.5Race (2-year average):b
White — — 28.9 28.3 26.9 23.9 21.4 21.6 22.1 21.0 20.4 20.6 20.5 20.6 21.1 21.8 Black — — 24.9 22.7 20.9 17.4 14.6 13.1 12.5 10.7 9.9 9.4 7.9 7.3 6.4 5.8 Hispanic — — 22.6 20.4 15.8 12.8 13.6 14.3 14.9 13.9 11.8 11.3 11.0 10.9 10.8 10.9
TABLE D-93Cigarettes: Trends in Thirty-Day Prevalence of Daily Use by Subgroups for Twelfth Graders
Class of:Percentage who used daily in last thirty days
Source: The Monitoring the Future Study, the University of Michigan.
Notes: Level of significance of difference between the two most recent classes: s = .05, ss = .01, sss = .001. ‘—’ indicates data not available.
Any apparent inconsistency between the change estimate and the prevalence-of-use estimates for the two most recent classes is due to rounding error.
See Table D-108 for the number of subgroup cases. See Appendix B for definition of variables in table.
Cont'd
390

1991 1992 1993 1994 1995 1996 1997 1998 1999 2000 2001 2002 2003 2004 2005 2006Approx. N = 15,000 15,800 16,300 15,400 15,400 14,300 15,400 15,200 13,600 12,800 12,800 12,900 14,600 14,600 14,700 14,200
Total 18.5 17.2 19.0 19.4 21.6 22.2 24.6 22.4 23.1 20.6 19.0 16.9 15.8 15.6 13.6 12.2 -1.4Gender: Male 18.8 17.2 19.4 20.4 21.7 22.2 24.8 22.7 23.6 20.9 18.4 17.2 17.0 15.4 14.6 12.0 -2.6 ss Female 17.9 16.7 18.2 18.1 20.8 21.8 23.6 21.5 22.2 19.7 18.9 16.1 14.0 15.0 11.9 11.8 -0.1College Plans: None or under 4 years 28.4 28.1 27.8 29.8 33.7 33.2 35.6 34.6 34.2 31.7 30.1 27.6 27.9 26.9 24.9 22.8 -2.1 Complete 4 years 14.1 12.9 15.9 15.7 17.4 18.9 20.6 18.4 19.5 16.6 15.5 13.8 12.1 12.2 10.5 9.4 -1.1Region: Northeast 20.9 19.4 23.5 21.3 22.5 27.0 29.4 23.4 23.2 22.8 21.9 18.4 16.4 16.2 13.3 14.3 +1.0 North Central 23.0 19.0 21.3 23.8 25.7 26.1 28.0 27.8 25.9 23.6 25.2 22.5 18.2 18.5 16.3 13.2 -3.1 South 16.4 16.7 18.5 19.3 21.7 20.5 22.6 21.8 24.2 19.4 15.5 16.6 16.3 15.8 15.4 13.3 -2.1 West 13.9 13.3 13.0 12.4 14.5 13.8 17.5 15.5 17.3 16.9 13.4 9.5 11.8 10.1 7.6 7.0 -0.5Population Density: Large MSA 16.7 16.6 17.3 17.7 21.3 20.7 23.7 20.6 18.6 16.7 17.4 15.0 11.5 12.6 11.4 10.3 -1.0 Other MSA 19.0 15.9 19.7 19.2 19.9 21.9 23.9 21.2 22.8 21.1 17.5 16.7 15.9 16.1 12.7 11.5 -1.3 Non-MSA 19.0 20.3 19.2 21.6 24.8 24.1 26.8 27.2 28.5 24.5 23.9 19.8 21.4 18.0 18.2 16.2 -2.0Parental Education:a
1.0-2.0 (Low) 21.2 16.5 17.6 16.9 21.3 21.1 21.9 21.7 23.8 22.8 16.4 12.4 15.1 14.2 11.7 11.4 -0.3 2.5-3.0 19.8 20.4 20.2 22.4 24.6 24.4 26.0 24.7 26.9 22.9 21.9 19.8 18.3 19.4 18.3 16.1 -2.2 3.5-4.0 18.5 16.9 18.9 18.9 21.6 21.2 23.8 23.8 23.6 21.2 19.9 19.1 16.5 16.3 14.4 12.3 -2.1 4.5-5.0 16.2 15.0 18.9 18.7 19.7 22.4 24.9 20.6 20.6 18.6 17.9 14.1 13.0 13.7 11.7 10.4 -1.3 5.5-6.0 (High) 16.1 12.8 16.6 17.3 18.5 20.0 22.9 17.4 19.0 15.2 13.4 14.3 11.3 10.3 8.1 8.3 +0.2Race (2-year average):b
White 21.5 20.5 21.4 22.9 23.9 25.4 27.8 28.3 26.9 25.7 23.8 21.8 19.5 18.3 17.1 15.3 -1.8 Black 5.1 4.2 4.1 4.9 6.1 7.0 7.2 7.4 7.7 8.0 7.5 6.4 5.4 5.2 5.6 5.7 0.0 Hispanic 11.5 12.5 11.8 10.6 11.6 12.9 14.0 13.6 14.0 15.7 12.0 9.2 8.0 8.2 7.7 7.0 -0.7
bTo derive percentages for each racial subgroup, data for the specified year and the previous year have been combined to increase subgroup sample sizes and thus provide
more stable estimates. For the data beginning in 2005, see the race/ethnicity note at the end of Appendix D.
change
TABLE D-93 (cont'd)Cigarettes: Trends in Thirty-Day Prevalence of Daily Use by Subgroups for Twelfth Graders
aParental education is an average score of mother’s education and father’s education. See Appendix B for details.
’05–’06Percentage who used daily in last thirty days
Class of:
391

1991 1992 1993 1994 1995 1996 1997 1998 1999 2000 2001 2002 2003 2004 2005 2006Approx. N = 17,500 18,600 18,300 17,300 17,500 17,800 18,600 18,100 16,700 16,700 16,200 15,100 16,500 17,000 16,800 16,500
Total 3.1 2.9 3.5 3.6 3.4 4.3 3.5 3.6 3.3 2.8 2.3 2.1 1.8 1.7 1.7 1.5 -0.1Gender: Male 3.7 3.1 4.3 4.2 3.7 4.7 3.7 3.5 3.1 2.8 2.6 2.4 1.8 1.7 2.0 1.7 -0.3 Female 2.4 2.7 2.7 2.9 3.2 3.7 3.1 3.3 3.3 2.6 2.0 1.9 1.7 1.7 1.3 1.3 0.0College Plans: None or under 4 years 10.1 10.8 11.9 11.7 11.4 13.5 11.6 13.8 13.4 10.3 9.8 8.4 7.5 7.4 7.7 5.8 -1.9 Complete 4 years 1.9 1.7 2.2 2.4 2.3 2.8 2.4 2.2 2.0 1.8 1.4 1.5 1.2 1.1 1.0 1.1 +0.1Region: Northeast 3.3 2.8 2.7 3.7 3.7 4.1 3.7 2.1 3.1 3.3 2.6 1.7 1.0 1.4 1.4 1.2 -0.3 North Central 3.3 3.2 3.5 3.9 4.4 5.3 4.1 4.6 5.7 3.4 3.1 2.7 2.1 2.3 2.2 1.9 -0.3 South 3.4 3.3 4.6 3.9 3.6 4.5 3.7 4.8 2.9 2.8 2.7 2.5 2.6 1.8 1.9 2.1 +0.2 West 1.9 2.0 2.2 2.6 1.8 2.7 2.2 1.6 1.2 1.3 0.7 0.9 0.8 1.2 0.9 0.6 -0.3Population Density: Large MSA 2.4 2.3 2.1 3.0 2.5 3.7 2.7 2.3 1.8 2.1 1.5 1.3 1.0 1.3 1.0 0.9 -0.1 Other MSA 3.3 3.2 3.7 3.9 3.6 3.8 3.2 3.2 2.8 2.2 2.1 2.2 1.7 1.6 1.5 1.6 +0.1 Non-MSA 3.4 3.3 5.0 3.7 4.3 5.8 4.8 5.6 5.9 4.6 3.9 3.1 3.1 2.4 2.9 2.3 -0.6Parental Education:a
1.0-2.0 (Low) 7.9 6.5 6.4 5.1 8.2 6.5 6.4 6.2 6.2 7.1 5.2 4.6 3.7 5.6 2.9 3.6 +0.7 2.5-3.0 3.7 3.4 3.9 4.9 4.1 6.4 4.8 5.2 4.8 3.8 3.6 2.8 2.9 2.1 2.8 2.4 -0.4 3.5-4.0 2.5 2.6 3.6 3.4 3.6 3.2 3.5 3.7 3.4 2.3 2.0 2.2 1.8 1.5 1.9 1.3 -0.6 4.5-5.0 1.6 1.8 2.3 2.6 2.0 2.8 2.2 2.0 1.5 1.4 0.9 1.2 0.7 0.8 0.6 1.0 +0.3 5.5-6.0 (High) 1.8 1.5 2.2 2.2 1.5 2.7 1.8 2.1 1.8 1.5 1.4 1.1 0.9 0.6 0.5 0.6 +0.1Race (2-year average):b
White — 3.3 3.8 4.2 4.2 4.6 4.6 4.2 4.0 3.6 3.2 2.8 2.3 1.9 1.9 1.9 0.0 Black — 0.4 0.7 1.0 0.9 1.3 1.4 1.2 1.3 1.0 1.1 1.1 1.2 1.1 0.9 0.8 -0.1 Hispanic — 2.7 2.5 3.1 3.3 2.7 2.4 2.8 3.0 2.3 1.4 1.3 1.5 1.4 1.1 0.7 -0.4
See Table D-106 for the number of subgroup cases. See Appendix B for definition of variables in table.aParental education is an average score of mother’s education and father’s education. See Appendix B for details.bTo derive percentages for each racial subgroup, data for the specified year and the previous year have been combined to increase subgroup sample sizes and thus provide
TABLE D-94
more stable estimates. For the data beginning in 2005, see the race/ethnicity note at the end of Appendix D.
Cigarettes: Trends in Thirty-Day Prevalence of Use of Half-pack a Day or More by Subgroups for Eighth Graders
Notes: Level of significance of difference between the two most recent classes: s = .05, ss = .01, sss = .001. ‘—’ indicates data not available.
Any apparent inconsistency between the change estimate and the prevalence-of-use estimates for the two most recent classes is due to rounding error.
Percentage who used daily in last thirty days’05–’06change
Source: The Monitoring the Future Study, the University of Michigan.
392

1991 1992 1993 1994 1995 1996 1997 1998 1999 2000 2001 2002 2003 2004 2005 2006Approx. N = 14,800 14,800 15,300 15,800 17,000 15,600 15,500 15,000 13,600 14,300 14,000 14,300 15,800 16,400 16,200 16,200
Total 6.5 6.0 7.0 7.6 8.3 9.4 8.6 7.9 7.6 6.2 5.5 4.4 4.1 3.3 3.1 3.3 +0.2Gender: Male 6.9 6.5 7.8 8.2 8.7 9.9 8.9 8.1 7.8 6.7 6.0 4.1 4.3 3.5 2.9 3.1 +0.2 Female 6.0 5.1 6.2 6.7 7.7 9.0 8.2 7.8 7.3 5.6 5.1 4.6 3.8 2.9 3.2 3.3 0.0College Plans: None or under 4 years 15.9 15.3 18.5 18.5 20.9 22.4 22.0 20.6 18.9 16.0 16.0 11.5 12.3 10.8 9.4 12.0 +2.6 Complete 4 years 4.4 4.0 4.6 5.2 6.1 7.1 6.3 5.6 5.7 4.5 3.8 3.1 2.8 2.2 2.2 2.1 -0.1Region: Northeast 7.8 5.9 8.5 7.8 7.7 9.1 8.8 10.0 9.1 6.0 5.0 3.7 4.6 3.6 3.4 3.2 -0.2 North Central 7.1 7.3 7.7 8.3 9.5 10.9 9.3 9.1 9.9 8.1 6.0 4.8 5.0 3.0 3.3 4.5 +1.2 South 7.2 5.5 7.1 8.7 10.3 11.0 10.2 8.9 7.8 7.1 6.5 5.5 4.5 4.3 3.7 3.6 -0.1 West 4.0 5.0 4.3 4.2 3.4 5.0 4.4 3.0 3.0 2.2 3.3 2.5 2.3 1.8 1.7 1.3 -0.3Population Density: Large MSA 6.9 5.2 5.9 5.8 6.0 7.6 6.6 5.8 6.0 5.7 4.8 3.0 2.3 1.9 2.3 1.8 -0.5 Other MSA 5.8 5.8 6.7 8.5 9.2 9.5 8.0 7.7 7.6 5.6 5.0 4.7 4.0 3.3 2.6 3.0 +0.4 Non-MSA 7.6 6.9 8.7 7.8 9.2 11.5 12.0 11.0 9.4 7.8 7.5 5.7 7.3 5.2 5.4 6.3 +0.9Parental Education:a
1.0-2.0 (Low) 9.9 10.7 10.8 8.1 12.0 12.1 10.8 9.0 11.3 10.7 7.6 7.4 8.6 6.6 4.6 7.1 +2.5 2.5-3.0 8.9 6.9 8.5 10.1 12.2 13.1 11.4 11.6 10.4 8.5 8.3 7.0 6.3 5.3 4.9 5.6 +0.7 3.5-4.0 5.8 5.4 7.3 8.0 8.6 10.2 8.8 7.4 7.4 5.9 5.3 4.0 4.2 3.8 3.2 3.1 -0.1 4.5-5.0 4.7 4.7 4.3 5.4 5.0 6.2 6.5 5.9 5.5 4.3 3.9 2.4 2.2 1.4 1.8 1.5 -0.3 5.5-6.0 (High) 4.5 3.7 3.9 4.0 4.0 5.7 4.8 5.4 4.5 3.6 2.6 2.0 1.4 1.0 1.6 1.6 0.0Race (2-year average):b
White — 7.4 7.7 8.6 9.3 10.5 11.0 10.4 9.9 8.5 7.1 6.2 5.5 4.7 3.9 3.8 -0.1 Black — 0.8 0.6 1.2 1.8 1.6 1.7 1.8 1.5 1.9 1.7 1.2 1.0 1.0 1.2 1.3 +0.1 Hispanic — 3.0 3.0 2.6 3.4 4.3 3.3 3.0 3.1 2.9 2.7 2.2 1.8 1.5 1.9 2.0 +0.1
TABLE D-95 Cigarettes: Trends in Thirty-Day Prevalence of Use of Half-pack a Day or More
by Subgroups for Tenth Graders
change
aParental education is an average score of mother’s education and father’s education. See Appendix B for details.bTo derive percentages for each racial subgroup, data for the specified year and the previous year have been combined to increase subgroup sample sizes and thus provide
more stable estimates. For the data beginning in 2005, see the race/ethnicity note at the end of Appendix D.
Percentage who used daily in last thirty days’05–’06
Notes: Level of significance of difference between the two most recent classes: s = .05, ss = .01, sss = .001. ‘—’ indicates data not available.
Any apparent inconsistency between the change estimate and the prevalence-of-use estimates for the two most recent classes is due to rounding error.
See Table D-107 for the number of subgroup cases. See Appendix B for definition of variables in table.
Source: The Monitoring the Future Study, the University of Michigan.
393

1975 1976 1977 1978 1979 1980 1981 1982 1983 1984 1985 1986 1987 1988 1989 1990Approx. N = 9,400 15,400 17,100 17,800 15,500 15,900 17,500 17,700 16,300 15,900 16,000 15,200 16,300 16,300 16,700 15,200
Total 17.9 19.2 19.4 18.8 16.5 14.3 13.5 14.2 13.8 12.3 12.5 11.4 11.4 10.6 11.2 11.3Gender: Male 19.6 19.9 19.7 18.9 15.4 13.5 12.8 13.1 13.1 11.0 12.3 10.7 10.1 11.1 11.2 11.6 Female 16.1 18.0 18.9 18.0 17.1 14.7 13.8 14.7 13.6 12.8 12.0 11.6 12.5 9.7 10.7 10.8College Plans: None or under 4 years — 25.5 26.9 25.5 23.3 21.2 20.8 21.0 20.9 19.6 20.7 19.2 19.5 18.4 18.6 19.2 Complete 4 years — 11.9 11.2 11.1 9.8 8.2 7.5 7.8 7.6 6.5 6.5 6.4 7.2 6.8 7.5 7.5Region: Northeast 22.0 22.5 24.2 23.6 19.8 17.0 16.6 15.6 16.6 17.4 17.0 15.6 16.5 13.1 13.6 13.8 North Central 18.8 20.3 20.3 19.8 17.4 15.4 16.0 17.3 17.1 13.0 14.9 12.3 12.3 11.5 14.2 13.7 South 16.8 19.0 18.5 17.0 16.1 14.5 12.0 13.3 12.4 11.3 9.7 10.0 9.4 10.1 9.7 9.4 West 11.3 12.4 11.5 12.2 10.8 8.3 7.3 7.1 6.4 7.4 7.6 6.5 8.1 7.7 6.9 8.3Population Density: Large MSA 21.7 20.1 20.4 19.7 16.2 14.8 15.4 15.9 14.1 14.8 14.4 12.2 13.1 10.8 10.1 11.2 Other MSA 17.4 18.9 18.8 17.9 16.5 13.8 12.4 12.9 13.5 11.4 11.0 9.6 10.0 10.4 11.2 11.0 Non-MSA 15.9 19.0 19.5 19.3 16.7 14.7 13.6 14.2 14.0 11.5 12.9 13.3 12.5 10.7 12.1 12.1Parental Education:a
1.0-2.0 (Low) 18.6 21.3 20.0 19.2 19.5 16.3 16.0 17.1 17.1 16.4 16.1 15.6 13.8 11.2 11.5 10.2 2.5-3.0 17.7 21.4 22.2 21.0 17.6 16.8 15.6 15.9 15.2 14.8 14.2 13.3 13.9 12.4 13.5 13.4 3.5-4.0 13.9 17.4 18.3 16.9 15.2 12.8 12.5 13.3 11.9 10.5 12.0 11.0 10.5 10.3 10.7 11.6 4.5-5.0 15.9 15.9 14.8 15.4 12.6 10.3 10.1 10.1 10.5 8.0 9.5 6.8 8.9 8.6 9.2 10.2 5.5-6.0 (High) 9.1 15.9 14.6 14.5 13.6 9.8 8.8 9.3 9.3 7.9 5.4 7.4 8.4 8.3 8.4 7.9Race (2-year average):b
White — — 20.3 20.2 18.6 16.4 15.0 15.1 15.2 14.2 13.6 13.1 12.9 12.9 12.9 13.3 Black — — 10.7 9.7 9.1 7.1 5.8 5.4 4.9 4.1 3.9 3.6 2.9 2.3 1.9 1.8 Hispanic — — 11.3 9.0 6.4 5.6 6.1 5.6 5.9 6.1 5.3 5.0 4.1 3.5 4.2 4.2
Notes: Level of significance of difference between the two most recent classes: s = .05, ss = .01, sss = .001. ‘—’ indicates data not available.
Any apparent inconsistency between the change estimate and the prevalence-of-use estimates for the two most recent classes is due to rounding error.
See Table D-108 for the number of subgroup cases. See Appendix B for definition of variables in table.
Source: The Monitoring the Future Study, the University of Michigan.
TABLE D-96Cigarettes: Trends in Thirty-Day Prevalence of Use of Half-pack a Day or More
by Subgroups for Twelfth Graders
Class of:Percentage who used daily in last thirty days
Cont'd
394

1991 1992 1993 1994 1995 1996 1997 1998 1999 2000 2001 2002 2003 2004 2005 2006Approx. N = 15,000 15,800 16,300 15,400 15,400 14,300 15,400 15,200 13,600 12,800 12,800 12,900 14,600 14,600 14,700 14,200
Total 10.7 10.0 10.9 11.2 12.4 13.0 14.3 12.6 13.2 11.3 10.3 9.1 8.4 8.0 6.9 5.9 -1.0 sGender: Male 11.6 10.4 11.6 12.7 13.2 13.6 15.5 13.5 14.5 11.4 10.2 10.0 9.5 8.0 8.0 6.2 -1.8 ss Female 9.5 9.2 9.9 9.5 11.1 12.0 12.6 11.1 11.5 10.8 10.2 7.9 6.6 7.5 5.3 5.2 -0.2College Plans: None or under 4 years 18.7 19.1 18.7 19.6 22.6 23.1 23.5 23.7 23.2 20.3 19.3 17.5 17.2 16.0 15.2 13.0 -2.2 Complete 4 years 7.1 6.5 8.1 8.2 8.9 10.0 11.0 8.9 10.1 8.1 7.6 6.7 5.5 5.6 4.6 3.9 -0.6Region: Northeast 12.9 11.1 14.7 12.2 13.4 17.0 19.4 13.6 13.4 13.6 12.3 10.9 8.7 9.0 7.5 7.9 +0.4 North Central 14.1 11.0 12.5 15.3 14.2 15.1 16.9 16.8 15.0 13.7 14.8 13.6 10.1 8.8 8.7 6.7 -2.0 South 8.9 10.2 10.4 10.8 12.6 12.0 12.3 11.8 13.9 10.6 7.6 8.6 8.9 8.9 7.6 6.0 -1.6 West 7.2 6.8 6.0 5.9 8.4 6.5 8.2 7.5 9.0 7.5 6.6 3.1 5.0 4.1 3.1 2.9 -0.1Population Density: Large MSA 10.2 9.9 9.1 10.2 12.3 11.6 12.8 11.0 9.6 8.2 9.4 7.6 5.4 6.0 5.2 4.8 -0.3 Other MSA 10.7 8.4 11.2 10.5 11.1 12.8 14.3 11.7 12.6 11.6 9.4 8.7 8.4 8.2 6.3 5.0 -1.4 s Non-MSA 11.1 13.1 11.7 13.7 14.7 14.4 16.0 16.5 18.0 14.5 13.3 11.9 12.2 10.0 10.4 9.2 -1.1Parental Education:a
1.0-2.0 (Low) 12.5 11.0 10.7 9.5 13.5 13.6 11.9 12.5 15.0 16.1 10.8 7.4 8.7 8.6 6.8 5.4 -1.3 2.5-3.0 12.4 12.7 12.5 13.7 15.1 14.8 16.4 14.9 16.6 13.8 12.5 12.0 10.5 10.9 10.0 8.4 -1.6 3.5-4.0 10.7 9.6 10.4 11.0 12.7 12.3 13.9 13.8 13.1 10.7 10.6 10.3 8.7 8.2 7.2 5.8 -1.4 4.5-5.0 7.9 8.1 10.0 10.4 9.8 12.6 14.5 10.3 10.7 9.3 9.2 6.8 5.7 6.1 5.1 4.6 -0.4 5.5-6.0 (High) 9.0 5.7 8.3 8.8 9.1 10.8 11.2 7.4 9.5 7.1 6.2 5.4 4.9 4.7 3.2 3.3 0.0Race (2-year average):b
White 13.1 12.3 12.8 13.7 14.2 15.2 16.9 16.9 15.9 15.1 13.6 12.4 10.9 10.0 9.1 7.9 -1.2 Black 1.8 1.8 1.5 1.7 2.2 2.5 2.8 2.5 2.4 2.6 2.4 2.1 1.7 1.6 1.8 2.1 +0.3 Hispanic 4.0 4.6 4.5 4.0 4.1 5.3 5.8 5.2 5.8 7.0 5.3 3.8 3.0 2.9 2.9 2.6 -0.3
bTo derive percentages for each racial subgroup, data for the specified year and the previous year have been combined to increase subgroup sample sizes and thus provide
more stable estimates. For the data beginning in 2005, see the race/ethnicity note at the end of Appendix D.
TABLE D-96 (cont'd)Cigarettes: Trends in Thirty-Day Prevalence of Use of Half-pack a Day or More
by Subgroups for Twelfth Graders
aParental education is an average score of mother’s education and father’s education. See Appendix B for details.
’05–’06change
Class of:Percentage who used daily in last thirty days
395

1991 1992 1993 1994 1995 1996 1997 1998 1999 2000 2001 2002 2003 2004 2005 2006Approx. N = 17,500 18,600 18,300 17,300 17,500 17,800 18,600 18,100 16,700 16,700 16,200 15,100 16,500 17,000 16,800 16,500
Total 6.9 7.0 6.6 7.7 7.1 7.1 5.5 4.8 4.5 4.2 4.0 3.3 4.1 4.1 3.3 3.7 +0.3Gender: Male 12.7 12.5 10.9 12.8 11.8 11.4 9.9 8.1 6.9 6.7 6.9 5.4 6.7 6.4 5.3 5.3 0.0 Female 1.4 2.0 2.7 2.4 2.9 2.9 1.5 1.5 2.1 1.8 1.4 1.3 1.8 1.7 1.5 2.1 +0.6College Plans: None or under 4 years 12.7 17.1 15.5 16.7 15.4 16.4 12.6 13.9 13.2 11.4 14.6 10.2 12.8 12.3 10.8 11.3 +0.5 Complete 4 years 6.1 5.5 5.3 6.5 6.0 5.6 4.6 3.8 3.5 3.4 2.9 2.6 3.3 3.2 2.4 2.9 +0.4Region: Northeast 5.0 4.9 3.4 6.1 5.4 4.9 3.2 2.7 2.5 2.7 3.7 2.7 3.1 3.4 1.4 2.9 +1.5 North Central 7.1 7.5 7.2 7.1 7.6 8.3 6.8 4.3 5.3 4.8 4.0 3.9 3.5 4.2 3.2 4.0 +0.7 South 9.5 9.3 8.0 9.9 8.7 8.1 6.7 6.9 5.9 5.8 5.4 4.1 5.9 5.5 5.3 4.6 -0.7 West 3.5 4.4 6.3 6.0 5.0 5.9 4.1 3.9 2.9 1.9 2.1 1.5 2.5 2.0 1.4 2.2 +0.7Population Density: Large MSA 4.8 4.2 3.3 4.6 4.1 4.2 3.6 2.9 1.8 2.4 2.4 1.5 2.6 1.9 1.3 1.9 +0.6 Other MSA 6.2 6.9 6.8 6.4 6.7 7.1 4.7 4.1 3.9 3.9 3.5 2.9 3.7 3.6 2.8 3.1 +0.4 Non-MSA 10.4 10.3 9.9 13.0 11.2 10.6 9.0 8.5 8.9 7.0 7.0 6.2 6.9 7.7 7.0 7.1 +0.1Parental Education:a
1.0-2.0 (Low) 11.4 7.8 9.4 8.9 10.6 6.3 8.3 5.4 6.6 7.4 5.0 4.5 6.8 6.9 5.7 5.9 +0.2 2.5-3.0 8.4 8.5 7.5 8.4 9.9 8.8 6.0 5.1 5.7 5.2 5.4 5.1 5.1 6.0 4.9 3.9 -1.0 3.5-4.0 6.7 7.0 7.5 8.7 7.0 7.2 6.5 5.9 4.5 4.5 3.7 3.2 4.1 3.5 3.1 3.7 +0.6 4.5-5.0 4.8 7.0 5.2 6.1 5.0 6.8 4.8 4.4 3.3 2.9 2.5 2.4 3.1 3.2 2.4 3.1 +0.8 5.5-6.0 (High) 6.1 4.6 4.9 6.8 5.8 5.9 3.7 3.9 3.1 3.0 4.2 2.5 2.7 2.9 1.8 3.4 +1.6Race (2-year average):b
White — 8.3 8.0 8.1 8.9 8.8 7.6 6.1 5.4 5.2 4.8 4.1 3.9 4.4 4.2 3.7 -0.5 Black — 1.8 2.7 3.2 2.6 2.2 2.6 2.3 2.3 2.7 2.2 1.6 2.7 3.0 2.0 2.1 +0.1 Hispanic — 4.2 4.0 5.0 5.7 5.2 4.6 4.5 4.6 3.7 3.3 4.0 4.7 4.0 2.6 3.1 +0.5
Notes: Level of significance of difference between the two most recent classes: s = .05, ss = .01, sss = .001. ‘—’ indicates data not available.
Source: The Monitoring the Future Study, the University of Michigan.
Any apparent inconsistency between the change estimate and the prevalence-of-use estimates for the two most recent classes is due to rounding error.
Smokeless Tobacco: Trends in Thirty-Day Prevalence of Use by Subgroups for Eighth Graders TABLE D-97
bTo derive percentages for each racial subgroup, data for the specified year and the previous year have been combined to increase subgroup sample sizes and thus provide
more stable estimates. For the data beginning in 2005, see the race/ethnicity note at the end of Appendix D.
Percentage who used in last thirty days’05–’06change
See Table D-106 for the number of subgroup cases. See Appendix B for definition of variables in table.
Data based on one of two forms in 1991–96 and on two of four forms beginning in 1997; N is one-half of N indicated in Table D-106.aParental education is an average score of mother’s education and father’s education. See Appendix B for details.
396

1991 1992 1993 1994 1995 1996 1997 1998 1999 2000 2001 2002 2003 2004 2005 2006Approx. N = 14,800 14,800 15,300 15,800 17,000 15,600 15,500 15,000 13,600 14,300 14,000 14,300 15,800 16,400 16,200 16,200
Total 10.0 9.6 10.4 10.5 9.7 8.6 8.9 7.5 6.5 6.1 6.9 6.1 5.3 4.9 5.6 5.7 +0.1Gender: Male 18.7 18.1 19.3 19.2 17.2 15.0 14.9 13.8 12.2 11.4 12.7 9.9 9.6 9.0 9.7 10.2 +0.6 Female 1.3 1.8 2.0 2.1 2.1 2.3 2.7 1.7 1.3 1.3 1.6 2.1 1.3 1.0 1.6 1.2 -0.4College Plans: None or under 4 years 16.9 17.5 20.2 19.9 20.3 16.3 18.5 17.8 13.2 13.9 16.0 13.6 13.0 12.2 13.3 14.9 +1.6 Complete 4 years 8.4 8.0 8.4 8.5 7.8 7.2 7.2 5.7 5.4 4.8 5.4 4.8 4.1 3.9 4.5 4.5 0.0Region: Northeast 8.6 5.3 8.0 9.0 7.6 6.8 9.3 6.5 5.2 4.6 4.9 4.7 4.5 5.1 4.6 4.5 -0.1 North Central 11.0 9.6 10.0 10.0 11.0 9.5 7.1 7.9 8.1 6.2 7.0 4.8 4.9 3.7 5.7 7.5 +1.8 South 11.6 11.4 11.8 11.7 10.9 10.2 10.2 9.5 7.9 7.7 9.6 8.3 7.5 7.3 7.0 6.0 -1.1 West 7.8 10.9 11.1 10.9 7.7 6.0 8.2 4.6 4.0 4.5 3.0 5.1 3.5 3.0 4.5 4.1 -0.3Population Density: Large MSA 5.9 6.4 6.5 6.2 5.9 5.5 4.2 3.7 4.6 5.6 4.1 4.5 3.7 3.0 3.2 3.9 +0.7 Other MSA 9.2 9.3 10.1 10.9 9.2 8.4 8.3 5.7 5.3 4.3 5.7 6.1 4.8 4.3 5.3 5.3 0.0 Non-MSA 14.7 13.3 14.1 13.9 15.0 12.2 14.7 15.1 11.3 9.8 12.5 8.2 9.2 9.0 9.4 9.6 +0.2Parental Education:a
1.0-2.0 (Low) 6.6 10.1 10.9 9.4 9.6 8.1 9.0 6.8 7.2 7.4 6.9 6.7 7.4 3.7 4.4 7.4 +2.9 2.5-3.0 12.1 11.0 12.2 12.5 10.4 9.7 9.4 8.2 7.0 6.4 8.9 8.1 5.0 5.8 6.7 7.1 +0.4 3.5-4.0 10.6 10.5 10.9 10.2 10.9 8.3 10.3 8.6 7.3 6.3 7.1 5.5 4.9 5.2 6.0 5.7 -0.3 4.5-5.0 9.3 7.6 9.9 9.8 9.8 8.5 7.2 6.9 6.1 6.2 5.7 5.4 5.7 4.4 5.6 4.9 -0.7 5.5-6.0 (High) 8.6 8.1 7.0 8.9 6.0 7.7 8.3 5.2 4.8 4.0 4.8 5.2 4.3 4.4 3.8 5.3 +1.4Race (2-year average):b
White — 11.4 12.0 12.5 12.0 11.0 10.4 10.0 8.7 7.5 7.5 7.8 6.9 6.1 6.6 6.9 +0.3 Black — 2.9 2.3 2.3 2.5 2.5 2.8 2.3 1.6 2.0 3.2 2.6 2.5 2.7 2.5 3.2 +0.7 Hispanic — 6.2 6.1 4.3 3.6 4.0 4.6 4.8 4.8 4.5 4.0 4.0 4.1 3.3 3.1 3.4 +0.3
change
Percentage who used in last thirty days’05–’06
TABLE D-98 Smokeless Tobacco: Trends in Thirty-Day Prevalence of Use by Subgroups for Tenth Graders
Source: The Monitoring the Future Study, the University of Michigan.
aParental education is an average score of mother’s education and father’s education. See Appendix B for details.bTo derive percentages for each racial subgroup, data for the specified year and the previous year have been combined to increase subgroup sample sizes and thus provide
more stable estimates. For the data beginning in 2005, see the race/ethnicity note at the end of Appendix D.
Notes: Level of significance of difference between the two most recent classes: s = .05, ss = .01, sss = .001. ‘—’ indicates data not available.
Any apparent inconsistency between the change estimate and the prevalence-of-use estimates for the two most recent classes is due to rounding error.
See Table D-107 for the number of subgroup cases. See Appendix B for definition of variables in table.
Data based on one of two forms in 1991–96 and on two of four forms beginning in 1997; N is one-half of N indicated in Table D-107.
397

1975 1976 1977 1978 1979 1980 1981 1982 1983 1984 1985 1986 1987 1988 1989 1990a
Approx. N = — — — — — — — — — — — 15,200 16,300 16,300 16,700 —Total — — — — — — — — — — — 11.5 11.3 10.3 8.4 —Gender: Male — — — — — — — — — — — 22.3 22.8 19.9 15.9 — Female — — — — — — — — — — — 1.6 0.7 1.7 1.2 —College Plans: None or under 4 years — — — — — — — — — — — 14.5 15.5 13.1 9.6 — Complete 4 years — — — — — — — — — — — 9.8 9.0 8.8 7.7 —Region: Northeast — — — — — — — — — — — 9.5 7.3 5.9 5.0 — North Central — — — — — — — — — — — 13.5 11.3 10.8 8.3 — South — — — — — — — — — — — 12.2 13.7 12.1 9.8 — West — — — — — — — — — — — 9.3 11.7 10.9 9.1 —Population Density: Large MSA — — — — — — — — — — — 9.0 6.4 7.7 6.8 — Other MSA — — — — — — — — — — — 8.9 10.5 8.5 7.6 — Non-MSA — — — — — — — — — — — 17.1 17.5 16.1 11.7 —Parental Education:b
1.0-2.0 (Low) — — — — — — — — — — — 8.6 11.7 10.7 5.3 — 2.5-3.0 — — — — — — — — — — — 14.4 11.5 10.7 7.0 — 3.5-4.0 — — — — — — — — — — — 11.5 12.1 10.6 9.0 — 4.5-5.0 — — — — — — — — — — — 10.4 11.7 11.8 10.2 — 5.5-6.0 (High) — — — — — — — — — — — 7.7 8.1 7.2 8.4 —Race (2-year average):c
White — — — — — — — — — — — — 12.9 12.0 10.6 — Black — — — — — — — — — — — — 2.1 4.5 4.5 — Hispanic — — — — — — — — — — — — 4.4 5.2 5.1 —
Percentage who used in last thirty daysClass of:
TABLE D-99Smokeless Tobacco: Trends in Thirty-Day Prevalence of Use by Subgroups for Twelfth Graders
Cont'd
398

1991a 1992 1993 1994 1995 1996 1997 1998 1999 2000 2001 2002 2003 2004 2005 2006Approx. N = — 15,800 16,300 15,400 15,400 14,300 15,400 15,200 13,600 12,800 12,800 12,900 14,600 14,600 14,700 14,200
Total — 11.4 10.7 11.1 12.2 9.8 9.7 8.8 8.4 7.6 7.8 6.5 6.7 6.7 7.6 6.1 -1.5Gender: Male — 20.8 19.7 20.3 23.6 19.5 18.7 15.6 15.5 14.4 14.2 12.2 12.5 12.2 12.7 11.0 -1.7 Female — 2.0 2.3 2.6 1.8 1.1 1.2 1.5 1.3 1.3 1.6 1.2 1.0 1.6 1.9 1.5 -0.4College Plans: None or under 4 years — 18.0 14.9 15.8 18.7 17.6 16.9 14.3 10.5 15.8 13.0 10.8 12.8 11.9 15.2 13.4 -1.8 Complete 4 years — 9.4 9.4 9.3 9.9 7.6 7.4 7.1 7.6 5.4 6.1 4.8 4.8 4.9 5.4 4.1 -1.3Region: Northeast — 8.2 9.6 12.0 9.6 8.4 6.9 2.6 4.3 5.3 5.4 5.3 6.3 5.1 8.0 5.3 -2.7 North Central — 12.3 13.6 14.7 16.7 12.6 13.4 11.8 8.9 11.1 9.9 7.8 5.7 7.4 10.5 7.0 -3.5 South — 12.5 11.1 9.7 11.9 9.2 9.0 10.5 10.7 7.3 8.5 7.9 7.9 8.4 7.5 7.5 -0.1 West — 11.1 7.0 8.5 8.6 8.5 9.1 7.3 7.0 6.3 6.2 3.9 6.0 4.3 4.0 3.4 -0.6Population Density: Large MSA — 5.9 7.1 7.5 12.5 8.6 6.5 4.7 4.9 4.2 4.4 3.4 3.4 3.8 4.3 4.8 +0.4 Other MSA — 11.1 9.9 11.3 9.5 7.4 7.4 7.7 8.5 7.9 8.0 5.7 6.9 5.6 7.8 4.6 -3.2 Non-MSA — 16.9 15.0 14.7 16.7 15.3 17.9 16.1 11.7 11.4 11.5 11.9 10.4 12.1 11.3 10.9 -0.4Parental Education:b
1.0-2.0 (Low) — 14.9 7.0 12.3 9.8 6.3 5.8 6.1 5.4 4.3 6.3 4.1 9.3 6.1 5.3 4.9 -0.4 2.5-3.0 — 12.4 11.6 12.9 11.5 10.4 10.7 9.0 9.1 9.9 7.5 5.6 5.9 8.8 9.7 8.0 -1.7 3.5-4.0 — 12.4 10.8 9.8 12.8 9.1 10.4 9.8 8.8 8.9 8.6 7.4 6.5 4.6 7.8 6.4 -1.4 4.5-5.0 — 8.0 13.3 11.1 12.8 11.4 9.1 9.6 8.5 6.2 6.2 7.3 7.6 7.9 8.0 6.1 -1.8 5.5-6.0 (High) — 10.6 7.8 10.2 11.6 8.1 9.9 7.4 7.9 5.7 10.3 4.6 6.2 5.4 3.7 3.5 -0.2Race (2-year average):c
White — — 13.8 13.8 13.8 13.0 12.2 11.8 11.0 10.5 10.3 9.7 8.5 8.2 8.7 8.8 +0.1 Black — — 2.0 1.9 2.1 2.7 2.2 1.4 1.5 1.5 1.2 1.0 1.0 0.6 0.3 0.5 +0.2 Hispanic — — 6.0 5.4 7.6 8.1 5.3 4.3 3.9 3.8 3.2 2.6 3.1 3.9 4.9 3.8 -1.1
Smokeless Tobacco: Trends in Thirty-Day Prevalence of Use by Subgroups for Twelfth GradersTABLE D-99 (cont'd)
’05–’06change
(Table continued on next page)
Class of:Percentage who used in last thirty days
399

and thus provide more stable estimates. For the data beginning in 2005, see the race/ethnicity note at the end of Appendix D.
Source: The Monitoring the Future Study, the University of Michigan.Notes: Level of significance of difference between the two most recent classes: s = .05, ss = .01, sss = .001. ‘—’ indicates data not available.
Smokeless Tobacco: Trends in Thirty-Day Prevalence of Use by Subgroups for Twelfth Graders TABLE D-99 (cont'd)
Any apparent inconsistency between the change estimate and the prevalence-of-use estimates for the two most recent classes is due to rounding error. See Table D-108 for the number of subgroup cases. See Appendix B for definition of variables in table. Data based on one of six forms; N is one-sixth of N indicated in Table D-108.Caution: Limited sample sizes (see “Notes” above). Use caution in interpreting subgroup trends.
aPrevalence of smokeless tobacco use was not asked of 12th graders in 1990 and 1991. Prior to 1990 the prevalence-of-use question on smokeless tobacco was located near the end of one 12th-grade questionnaire form, whereas after 1991 the question was placed earlier and in a different form. This shift could explain the discontinuities between the corresponding data.bParental education is an average score of mother’s education and father’s education. See Appendix B for details.cTo derive percentages for each racial subgroup, data for the specified year and the previous year have been combined to increase subgroup sizes
400

1991 1992 1993 1994 1995 1996 1997 1998 1999 2000 2001 2002 2003 2004 2005 2006Approx. N = 17,500 18,600 18,300 17,300 17,500 17,800 18,600 18,100 16,700 16,700 16,200 15,100 16,500 17,000 16,800 16,500
Total 1.6 1.8 1.5 1.9 1.2 1.5 1.0 1.0 0.9 0.9 1.2 0.8 0.8 1.0 0.7 0.7 +0.1Gender: Male 3.1 3.4 2.9 3.2 2.2 2.9 1.7 1.8 1.6 1.5 2.5 1.5 1.4 1.7 1.2 1.1 -0.1 Female 0.2 0.3 0.3 0.3 0.3 0.2 0.3 0.2 0.2 0.3 0.1 0.2 0.2 0.3 0.2 0.3 +0.1College Plans: None or under 4 years 4.1 5.6 4.4 5.4 3.5 5.1 3.6 6.1 3.8 2.7 4.5 4.5 4.0 3.8 2.4 4.0 +1.7 Complete 4 years 1.2 1.2 1.1 1.4 0.9 1.0 0.6 0.5 0.5 0.7 0.9 0.5 0.5 0.7 0.5 0.4 -0.1Region: Northeast 1.2 0.9 0.6 0.8 0.6 0.8 0.6 0.4 0.1 0.4 0.7 0.6 0.8 1.0 0.1 0.6 +0.5 North Central 1.5 1.6 1.6 1.4 1.1 2.0 1.2 1.3 0.9 1.3 1.1 1.1 0.6 0.6 0.3 0.5 +0.2 South 2.4 3.0 2.2 3.3 1.8 2.0 1.5 1.3 1.6 1.3 2.1 1.0 1.3 1.7 1.4 1.1 -0.3 West 0.6 0.8 1.0 0.9 0.8 0.8 0.2 0.7 0.3 0.2 0.1 0.2 0.2 0.3 0.2 0.4 +0.2Population Density: Large MSA 0.5 0.6 0.7 0.7 0.4 0.4 0.5 0.4 0.3 0.2 0.3 0.4 0.7 0.4 * 0.3 +0.2 Other MSA 1.2 1.9 1.5 1.0 0.9 1.2 0.8 0.6 0.8 0.8 0.8 0.6 0.6 0.6 0.5 0.6 +0.1 Non-MSA 3.3 2.8 2.5 4.6 2.6 3.4 1.6 2.6 1.8 2.0 2.9 1.8 1.5 2.6 1.9 1.6 -0.3Parental Education:a
1.0-2.0 (Low) 2.8 3.5 2.0 3.0 2.2 1.5 3.2 2.6 0.9 1.4 1.8 2.2 1.8 2.8 1.4 1.3 -0.1 2.5-3.0 2.2 2.6 1.9 2.7 1.7 3.1 1.1 1.5 1.6 1.4 2.1 1.0 1.0 1.1 0.5 0.9 +0.3 3.5-4.0 1.4 1.2 1.8 1.9 1.2 1.7 0.9 1.3 0.8 1.3 0.3 1.0 0.8 0.8 0.8 0.7 -0.1 4.5-5.0 0.8 1.3 1.1 1.1 0.9 0.3 0.8 0.5 0.5 0.4 0.5 0.3 0.2 0.7 0.8 0.6 -0.3 5.5-6.0 (High) 1.0 0.9 0.6 0.7 0.8 0.8 0.4 0.5 0.4 0.4 1.7 0.9 1.1 0.8 0.4 0.5 +0.2Race (2-year average):b
White — 2.0 2.0 2.0 1.9 1.7 1.5 1.2 1.1 1.1 1.2 1.0 0.7 0.9 0.9 0.7 -0.2 Black — 0.3 0.4 0.7 0.6 0.4 0.5 0.4 0.4 0.4 0.5 0.5 0.6 0.5 0.2 0.5 +0.3 Hispanic — 0.8 0.9 0.9 0.7 1.1 0.9 0.8 1.0 0.8 0.8 0.8 0.9 0.9 0.4 0.5 +0.1
‘—’ indicates data not available. ‘*’ indicates less than .05 percent but greater than 0 percent.
Source: The Monitoring the Future Study, the University of Michigan.
TABLE D-100Smokeless Tobacco: Trends in Thirty-Day Prevalence of Daily Use by Subgroups for Eighth Graders
more stable estimates. For the data beginning in 2005, see the race/ethnicity note at the end of Appendix D.
Percentage who used daily in last thirty days’05–’06change
See Table D-106 for the number of subgroup cases. See Appendix B for definition of variables in table.
Data based on one of two forms in 1991–96 and on two of four forms beginning in 1997; N is one-half of N indicated in Table D-106.aParental education is an average score of mother’s education and father’s education. See Appendix B for details.bTo derive percentages for each racial subgroup, data for the specified year and the previous year have been combined to increase subgroup sample sizes and thus provide
Notes: Level of significance of difference between the two most recent classes: s = .05, ss = .01, sss = .001.
Any apparent inconsistency between the change estimate and the prevalence-of-use estimates for the two most recent classes is due to rounding error.
401

1991 1992 1993 1994 1995 1996 1997 1998 1999 2000 2001 2002 2003 2004 2005 2006Approx. N = 14,800 14,800 15,300 15,800 17,000 15,600 15,500 15,000 13,600 14,300 14,000 14,300 15,800 16,400 16,200 16,200
Total 3.3 3.0 3.3 3.0 2.7 2.2 2.2 2.2 1.5 1.9 2.2 1.7 1.8 1.6 1.9 1.7 -0.2Gender: Male 6.3 6.3 6.4 5.9 5.2 4.2 4.0 4.3 3.2 3.9 4.5 3.0 3.7 3.0 3.4 3.3 -0.1 Female 0.2 0.1 0.3 0.2 0.2 0.2 0.3 0.3 0.1 0.2 0.3 0.2 0.1 0.2 0.3 * -0.3College Plans: None or under 4 years 7.6 8.5 8.8 6.5 7.8 5.4 6.3 6.4 3.6 5.9 6.6 4.6 4.8 5.0 5.4 6.8 +1.4 Complete 4 years 2.3 1.9 2.2 2.2 1.9 1.6 1.5 1.5 1.2 1.2 1.5 1.0 1.3 1.1 1.3 1.0 -0.3Region: Northeast 1.8 1.0 1.7 3.0 2.0 1.3 1.5 1.2 1.2 0.9 1.1 0.8 1.6 2.1 1.3 0.8 -0.6 North Central 3.1 2.9 2.5 2.4 2.5 2.1 1.4 2.1 2.0 2.1 2.1 1.3 1.3 0.8 1.7 2.2 +0.5 South 4.7 4.5 5.2 3.3 4.1 3.3 3.5 3.8 2.0 2.8 3.6 2.6 3.0 2.6 2.8 2.3 -0.5 West 2.7 2.9 3.1 3.6 1.1 1.0 1.7 0.8 0.7 1.0 0.9 1.1 0.8 0.6 1.2 0.9 -0.3Population Density: Large MSA 1.5 1.6 1.1 1.0 1.5 0.6 0.8 1.0 0.8 1.6 0.8 1.3 1.2 0.8 0.8 1.1 +0.3 Other MSA 3.1 2.8 3.2 3.5 2.3 2.3 1.7 1.5 1.0 1.0 1.7 1.4 1.5 1.3 1.4 1.4 +0.1 Non-MSA 5.0 4.9 5.3 4.2 4.9 3.6 4.6 5.0 3.5 3.8 5.0 2.6 3.5 3.4 4.2 3.2 -1.0Parental Education:a
1.0-2.0 (Low) 2.5 3.9 4.1 3.2 3.6 1.7 3.8 2.6 1.7 2.4 3.8 1.7 1.7 1.5 2.0 3.6 +1.6 2.5-3.0 4.8 5.0 4.3 3.8 3.4 3.4 2.0 2.8 1.7 2.3 3.2 1.2 2.1 1.8 2.6 2.9 +0.2 3.5-4.0 3.3 2.8 3.1 3.0 2.8 1.4 2.4 2.7 1.6 1.6 1.5 2.0 1.9 2.4 2.0 1.3 -0.6 4.5-5.0 2.5 1.7 2.5 2.7 2.9 2.3 1.7 1.8 1.6 1.9 1.9 1.5 1.7 0.7 1.7 1.1 -0.6 5.5-6.0 (High) 2.5 1.6 2.7 1.7 1.0 1.4 1.9 0.7 0.8 0.8 1.9 1.3 1.4 0.9 1.2 1.3 +0.1Race (2-year average):b
White — 3.8 3.9 3.8 3.3 2.9 2.5 2.7 2.4 2.1 2.4 2.3 2.1 2.1 2.1 2.2 +0.1 Black — 0.5 0.4 0.6 0.5 0.4 0.4 0.4 0.3 0.4 0.9 0.8 0.4 0.6 0.8 0.8 -0.1 Hispanic — 1.1 1.0 0.8 1.2 1.2 1.3 1.3 0.8 0.8 1.0 0.5 0.4 0.9 1.0 0.7 -0.3
aParental education is an average score of mother’s education and father’s education. See Appendix B for details.bTo derive percentages for each racial subgroup, data for the specified year and the previous year have been combined to increase subgroup sample sizes and thus provide
more stable estimates. For the data beginning in 2005, see the race/ethnicity note at the end of Appendix D.
Smokeless Tobacco: Trends in Thirty-Day Prevalence of Daily Use by Subgroups for Tenth Graders
See Table D-107 for the number of subgroup cases. See Appendix B for definition of variables in table.
Data based on one of two forms in 1991–96 and on two of four forms beginning in 1997; N is one-half of N indicated in Table D-107.
Percentage who used daily in last thirty days’05–’06change
TABLE D-101
Notes: Level of significance of difference between the two most recent classes: s = .05, ss = .01, sss = .001.
Any apparent inconsistency between the change estimate and the prevalence-of-use estimates for the two most recent classes is due to rounding error.
Source: The Monitoring the Future Study, the University of Michigan.
‘—’ indicates data not available. ‘*’ indicates less than .05 percent but greater than 0 percent.
402

1975 1976 1977 1978 1979 1980 1981 1982 1983 1984 1985 1986 1987 1988 1989 1990a
Approx. N = — — — — — — — — — — — 15,200 16,300 16,300 16,700 —Total — — — — — — — — — — — 4.7 5.1 4.3 3.3 —Gender: Male — — — — — — — — — — — 10.0 10.7 8.6 6.8 — Female — — — — — — — — — — — 0.1 0.1 0.5 0.0 —College Plans: None or under 4 years — — — — — — — — — — — 7.1 7.8 5.8 4.2 — Complete 4 years — — — — — — — — — — — 3.3 3.7 3.5 2.7 —Region: Northeast — — — — — — — — — — — 4.6 2.1 2.3 1.3 — North Central — — — — — — — — — — — 4.5 4.5 3.5 2.2 — South — — — — — — — — — — — 6.1 7.4 6.3 4.2 — West — — — — — — — — — — — 2.9 5.5 4.0 4.9 —Population Density: Large MSA — — — — — — — — — — — 3.4 3.3 3.0 3.0 — Other MSA — — — — — — — — — — — 3.3 4.3 2.5 2.8 — Non-MSA — — — — — — — — — — — 7.8 8.5 8.9 4.6 —Parental Education:b
1.0-2.0 (Low) — — — — — — — — — — — 1.9 5.6 5.3 1.8 — 2.5-3.0 — — — — — — — — — — — 7.6 6.9 3.2 3.9 — 3.5-4.0 — — — — — — — — — — — 3.5 4.7 5.4 3.1 — 4.5-5.0 — — — — — — — — — — — 3.9 5.0 4.7 4.6 — 5.5-6.0 (High) — — — — — — — — — — — 3.3 2.1 3.5 1.2 —Race (2-year average):c
White — — — — — — — — — — — — 5.8 5.4 4.5 — Black — — — — — — — — — — — — 0.6 1.0 0.5 — Hispanic — — — — — — — — — — — — 0.8 2.1 2.1 —
TABLE D-102
Percentage who used daily in last thirty daysClass of:
Smokeless Tobacco: Trends in Thirty-Day Prevalence of Daily Use by Subgroups for Twelfth Graders
Cont'd
403

1991a 1992 1993 1994 1995 1996 1997 1998 1999 2000 2001 2002 2003 2004 2005 2006Approx. N = — 15,800 16,300 15,400 15,400 14,300 15,400 15,200 13,600 12,800 12,800 12,900 14,600 14,600 14,700 14,200
Total — 4.3 3.3 3.9 3.6 3.3 4.4 3.2 2.9 3.2 2.8 2.0 2.2 2.8 2.5 2.2 -0.3Gender: Male — 7.8 6.4 7.2 7.2 7.1 8.6 6.0 5.7 6.5 5.6 4.3 4.6 5.6 4.7 4.3 -0.4 Female — 0.5 0.4 0.3 0.1 0.1 0.2 0.0 0.0 0.4 0.3 0.0 0.0 0.2 0.2 0.1 -0.1College Plans: None or under 4 years — 7.4 4.3 6.6 6.5 6.8 9.1 6.5 3.4 7.9 4.7 2.4 5.3 5.0 7.1 6.1 -1.0 Complete 4 years — 3.3 3.1 2.8 2.7 2.6 2.7 2.3 2.6 2.0 2.1 1.4 1.4 2.0 1.5 1.2 -0.3Region: Northeast — 1.8 1.9 4.5 2.2 3.2 3.5 0.5 1.0 1.3 1.5 1.6 2.7 1.9 2.1 1.9 -0.2 North Central — 4.0 4.4 4.7 4.9 4.1 7.0 4.0 3.4 5.0 2.8 2.2 1.1 3.0 3.8 2.1 -1.8 South — 5.4 4.0 3.5 4.2 3.1 3.6 4.6 4.0 4.0 3.8 2.4 2.6 3.7 2.7 3.0 +0.3 West — 5.1 1.7 3.2 1.6 2.9 3.0 1.8 1.9 1.6 2.6 1.3 2.2 1.7 1.0 1.0 0.0Population Density: Large MSA — 2.0 1.7 2.0 2.1 2.6 3.3 0.9 0.5 0.9 1.4 0.4 0.5 0.8 1.0 1.4 +0.5 Other MSA — 4.2 3.0 3.6 3.2 1.9 3.3 2.4 3.1 3.7 2.6 2.0 2.2 2.2 2.4 1.6 -0.8 Non-MSA — 6.5 5.2 6.7 5.8 6.7 7.7 7.6 4.9 5.3 5.0 3.8 4.2 6.2 4.8 4.4 -0.5Parental Education:b
1.0-2.0 (Low) — 6.7 3.9 6.6 2.7 2.2 1.3 2.2 2.1 2.9 4.0 2.2 4.9 3.0 2.2 1.3 -0.8 2.5-3.0 — 4.8 3.5 3.8 4.7 3.6 5.8 5.2 3.7 4.2 3.2 1.7 1.4 4.2 3.5 3.3 -0.1 3.5-4.0 — 5.2 3.3 3.3 2.9 3.6 3.7 2.6 3.5 3.9 2.8 2.1 2.0 2.0 3.7 1.7 -2.0 4.5-5.0 — 2.4 3.7 3.9 3.5 4.6 3.9 3.0 1.9 2.1 2.7 2.4 2.8 2.6 1.8 2.6 +0.8 5.5-6.0 (High) — 2.6 1.8 2.7 2.7 1.1 5.0 2.5 2.1 2.5 2.5 0.2 1.8 1.9 0.4 1.3 +1.0Race (2-year average):c
White — — 4.8 4.7 4.6 4.1 5.0 5.2 4.3 4.3 4.4 3.5 2.9 3.2 3.5 3.4 -0.2 Black — — 0.3 0.7 0.6 0.3 0.2 0.0 0.0 0.1 0.2 0.1 0.0 0.0 0.0 0.2 +0.2 Hispanic — — 1.6 0.7 1.2 2.2 1.9 0.8 0.4 0.9 0.6 0.3 0.7 1.1 0.7 0.4 -0.3
Smokeless Tobacco: Trends in Thirty-Day Prevalence of Daily Use by Subgroups for Twelfth Graders
(Table continued on next page)
Percentage who used daily in last thirty daysClass of:
TABLE D-102 (cont'd)
’05–’06change
404

bParental education is an average score of mother’s education and father’s education. See Appendix B for details.cTo derive percentages for each racial subgroup, data for the specified year and the previous year have been combined to increase subgroup sizes and thus provide more stable estimates. For the data beginning in 2005, see the race/ethnicity note at the end of Appendix D.
rounding error. See Table D-108 for the number of subgroup cases. See Appendix B for definition of variables in table. Data based on one of six forms; N is one-sixth of N indicated in Table D-108.Caution: Limited sample sizes (see “Notes” above). Use caution in interpreting subgroup trends.
Source: The Monitoring the Future Study, the University of Michigan.Notes: Level of significance of difference between the two most recent classes: s = .05, ss = .01, sss = .001.
TABLE D-102 (cont'd)Smokeless Tobacco: Trends in Thirty-Day Prevalence of Daily Use by Subgroups for Twelfth Graders
aPrevalence of smokeless tobacco use was not asked of 12th graders in 1990 and 1991. Prior to 1990 the prevalence-of-use question on smokeless tobacco was located near the end of one 12th-grade questionnaire form, whereas after 1991 the question was placed earlier and in a different form. This shift could explain the discontinuities between the corresponding data.
‘—’ indicates data not available. Any apparent inconsistency between the change estimate and the prevalence-of-use estimates for the two most recent classes is due to
405

1991 1992 1993 1994 1995 1996 1997 1998 1999 2000 2001 2002 2003 2004 2005 2006Approx. N = 17,500 18,600 18,300 17,300 17,500 17,800 18,600 18,100 16,700 16,700 16,200 15,100 16,500 17,000 16,800 16,500
Total 1.0 1.1 0.9 1.2 1.0 0.9 1.0 1.2 1.7 1.7 1.6 1.5 1.4 1.1 1.1 0.9 -0.2Gender: Male 1.8 1.7 1.4 1.8 1.3 1.1 1.3 1.6 2.5 2.2 2.3 1.8 1.8 1.3 1.2 1.2 -0.1 Female 0.3 0.5 0.3 0.6 0.8 0.7 0.7 0.7 0.9 1.0 1.0 1.2 1.1 1.0 0.9 0.6 -0.3College Plans: None or under 4 years 2.2 2.4 2.2 2.5 2.2 1.5 2.4 2.8 4.0 3.6 3.1 3.6 2.7 3.2 2.4 2.4 0.0 Complete 4 years 0.8 0.9 0.7 1.0 0.9 0.8 0.8 1.0 1.4 1.5 1.5 1.3 1.3 0.9 0.9 0.7 -0.2Region: Northeast 0.7 1.1 0.6 1.0 1.0 1.1 1.0 1.1 1.6 1.7 1.8 1.2 1.1 0.8 0.6 0.6 0.0 North Central 1.1 1.2 1.0 1.0 1.1 0.8 1.0 1.2 1.6 1.8 1.7 1.6 1.7 1.2 1.1 0.8 -0.2 South 1.2 1.1 1.0 1.6 1.1 0.9 0.9 1.4 1.9 1.8 1.9 1.9 1.6 1.3 1.3 1.1 -0.2 West 0.7 0.9 0.7 1.0 1.0 0.8 1.1 0.9 1.4 1.3 0.9 1.2 1.2 1.0 1.0 0.7 -0.3Population Density: Large MSA 0.8 1.0 0.8 0.9 0.9 0.8 0.9 1.0 1.3 1.6 1.6 1.1 1.0 1.0 0.8 0.8 0.0 Other MSA 1.2 1.2 0.9 1.2 1.2 0.9 0.9 1.2 1.9 1.5 1.7 1.6 1.5 1.1 1.1 0.8 -0.3 Non-MSA 1.0 0.9 0.9 1.5 0.9 0.9 1.2 1.4 1.7 2.0 1.6 2.1 1.8 1.3 1.3 1.2 -0.1Parental Education:a
1.0-2.0 (Low) 1.8 1.2 1.2 1.6 1.3 0.9 1.4 1.7 2.2 2.5 2.0 1.8 1.3 1.5 2.1 1.0 -1.1 s 2.5-3.0 1.1 1.2 0.8 1.6 1.3 0.7 0.9 1.1 1.9 2.1 1.6 1.7 1.9 1.4 1.0 0.9 0.0 3.5-4.0 1.0 1.0 1.1 1.3 0.8 0.9 1.2 1.4 1.6 1.3 1.9 1.9 1.6 1.0 1.1 1.0 -0.1 4.5-5.0 0.7 0.9 0.8 0.8 0.8 1.2 0.9 1.1 1.4 1.6 1.5 1.0 1.3 1.2 1.1 0.7 -0.4 5.5-6.0 (High) 1.0 1.3 0.6 0.9 1.5 0.9 1.2 1.1 2.0 1.6 1.7 1.6 1.0 0.7 0.7 1.1 +0.4Race (2-year average):b
White — 1.1 1.0 1.0 1.1 0.9 0.9 1.1 1.5 1.9 1.8 1.7 1.6 1.3 1.0 0.9 -0.1 Black — 0.7 0.6 0.8 0.9 0.7 0.6 0.7 0.8 0.7 0.8 1.2 1.2 0.9 0.9 0.8 -0.1 Hispanic — 1.2 1.1 1.1 1.3 1.5 1.4 1.4 1.8 1.8 1.5 1.5 1.7 1.7 1.2 0.9 -0.4
TABLE D-103
aParental education is an average score of mother’s education and father’s education. See Appendix B for details.bTo derive percentages for each racial subgroup, data for the specified year and the previous year have been combined to increase subgroup sample sizes and thus provide
Source: The Monitoring the Future Study, the University of Michigan.
more stable estimates. For the data beginning in 2005, see the race/ethnicity note at the end of Appendix D.
Steroids: Trends in Annual Prevalence of Use by Subgroups for Eighth Graders
Notes: Level of significance of difference between the two most recent classes: s = .05, ss = .01, sss = .001. ‘—’ indicates data not available.
Any apparent inconsistency between the change estimate and the prevalence-of-use estimates for the two most recent classes is due to rounding error.
See Table D-106 for the number of subgroup cases. See Appendix B for definition of variables in table.
Percentage who used in last twelve months’05–’06change
In 2006, the question text was changed slightly in half of the questionnaire forms. An examination of the data did not show any effect from the wording change.
406
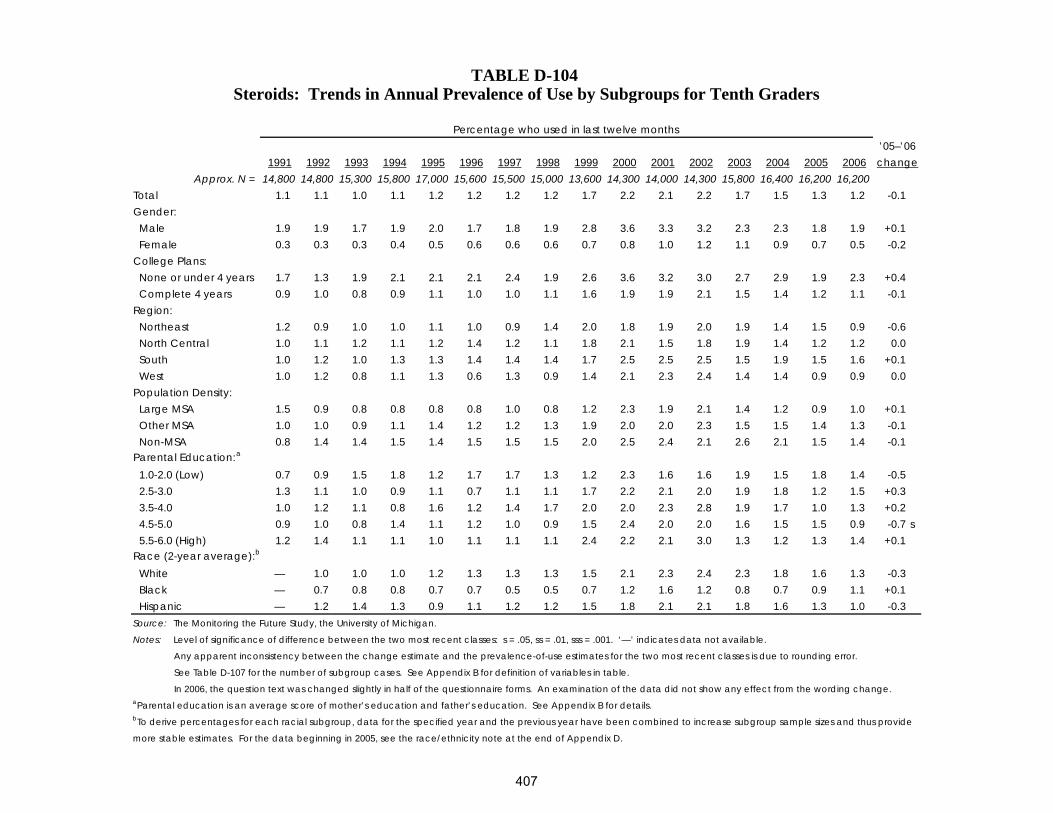
1991 1992 1993 1994 1995 1996 1997 1998 1999 2000 2001 2002 2003 2004 2005 2006Approx. N = 14,800 14,800 15,300 15,800 17,000 15,600 15,500 15,000 13,600 14,300 14,000 14,300 15,800 16,400 16,200 16,200
Total 1.1 1.1 1.0 1.1 1.2 1.2 1.2 1.2 1.7 2.2 2.1 2.2 1.7 1.5 1.3 1.2 -0.1Gender: Male 1.9 1.9 1.7 1.9 2.0 1.7 1.8 1.9 2.8 3.6 3.3 3.2 2.3 2.3 1.8 1.9 +0.1 Female 0.3 0.3 0.3 0.4 0.5 0.6 0.6 0.6 0.7 0.8 1.0 1.2 1.1 0.9 0.7 0.5 -0.2College Plans: None or under 4 years 1.7 1.3 1.9 2.1 2.1 2.1 2.4 1.9 2.6 3.6 3.2 3.0 2.7 2.9 1.9 2.3 +0.4 Complete 4 years 0.9 1.0 0.8 0.9 1.1 1.0 1.0 1.1 1.6 1.9 1.9 2.1 1.5 1.4 1.2 1.1 -0.1Region: Northeast 1.2 0.9 1.0 1.0 1.1 1.0 0.9 1.4 2.0 1.8 1.9 2.0 1.9 1.4 1.5 0.9 -0.6 North Central 1.0 1.1 1.2 1.1 1.2 1.4 1.2 1.1 1.8 2.1 1.5 1.8 1.9 1.4 1.2 1.2 0.0 South 1.0 1.2 1.0 1.3 1.3 1.4 1.4 1.4 1.7 2.5 2.5 2.5 1.5 1.9 1.5 1.6 +0.1 West 1.0 1.2 0.8 1.1 1.3 0.6 1.3 0.9 1.4 2.1 2.3 2.4 1.4 1.4 0.9 0.9 0.0Population Density: Large MSA 1.5 0.9 0.8 0.8 0.8 0.8 1.0 0.8 1.2 2.3 1.9 2.1 1.4 1.2 0.9 1.0 +0.1 Other MSA 1.0 1.0 0.9 1.1 1.4 1.2 1.2 1.3 1.9 2.0 2.0 2.3 1.5 1.5 1.4 1.3 -0.1 Non-MSA 0.8 1.4 1.4 1.5 1.4 1.5 1.5 1.5 2.0 2.5 2.4 2.1 2.6 2.1 1.5 1.4 -0.1Parental Education:a
1.0-2.0 (Low) 0.7 0.9 1.5 1.8 1.2 1.7 1.7 1.3 1.2 2.3 1.6 1.6 1.9 1.5 1.8 1.4 -0.5 2.5-3.0 1.3 1.1 1.0 0.9 1.1 0.7 1.1 1.1 1.7 2.2 2.1 2.0 1.9 1.8 1.2 1.5 +0.3 3.5-4.0 1.0 1.2 1.1 0.8 1.6 1.2 1.4 1.7 2.0 2.0 2.3 2.8 1.9 1.7 1.0 1.3 +0.2 4.5-5.0 0.9 1.0 0.8 1.4 1.1 1.2 1.0 0.9 1.5 2.4 2.0 2.0 1.6 1.5 1.5 0.9 -0.7 s 5.5-6.0 (High) 1.2 1.4 1.1 1.1 1.0 1.1 1.1 1.1 2.4 2.2 2.1 3.0 1.3 1.2 1.3 1.4 +0.1Race (2-year average):b
White — 1.0 1.0 1.0 1.2 1.3 1.3 1.3 1.5 2.1 2.3 2.4 2.3 1.8 1.6 1.3 -0.3 Black — 0.7 0.8 0.8 0.7 0.7 0.5 0.5 0.7 1.2 1.6 1.2 0.8 0.7 0.9 1.1 +0.1 Hispanic — 1.2 1.4 1.3 0.9 1.1 1.2 1.2 1.5 1.8 2.1 2.1 1.8 1.6 1.3 1.0 -0.3
’05–’06change
more stable estimates. For the data beginning in 2005, see the race/ethnicity note at the end of Appendix D.
In 2006, the question text was changed slightly in half of the questionnaire forms. An examination of the data did not show any effect from the wording change.
TABLE D-104
aParental education is an average score of mother’s education and father’s education. See Appendix B for details.bTo derive percentages for each racial subgroup, data for the specified year and the previous year have been combined to increase subgroup sample sizes and thus provide
Steroids: Trends in Annual Prevalence of Use by Subgroups for Tenth Graders
Notes: Level of significance of difference between the two most recent classes: s = .05, ss = .01, sss = .001. ‘—’ indicates data not available.
Any apparent inconsistency between the change estimate and the prevalence-of-use estimates for the two most recent classes is due to rounding error.
See Table D-107 for the number of subgroup cases. See Appendix B for definition of variables in table.
Percentage who used in last twelve months
Source: The Monitoring the Future Study, the University of Michigan.
407

1975–88 1989 1990 1991 1992 1993 1994 1995 1996 1997 1998 1999 2000 2001 2002 2003 2004 2005 2006Approx. N = — 16,700 15,200 15,000 15,800 16,300 15,400 15,400 14,300 15,400 15,200 13,600 12,800 12,800 12,900 14,600 14,600 14,700 14,200
Total — 1.9 1.7 1.4 1.1 1.2 1.3 1.5 1.4 1.4 1.7 1.8 1.7 2.4 2.5 2.1 2.5 1.5 1.8 +0.3Gender: Male — 2.8 2.6 2.4 2.1 2.5 2.1 2.4 2.2 2.5 2.8 3.1 2.5 3.8 3.8 3.2 3.3 2.6 2.7 +0.1 Female — 0.9 0.3 0.2 0.1 0.1 0.5 0.6 0.4 0.5 0.3 0.6 0.9 1.1 1.3 1.1 1.7 0.4 0.7 +0.3College Plans: None or under 4 years — 2.3 2.2 2.1 2.1 2.0 1.9 2.0 2.3 2.3 2.1 3.6 2.0 4.6 4.1 2.6 2.8 2.1 2.7 +0.5 Complete 4 years — 1.6 1.3 1.2 0.8 0.9 1.1 1.2 1.1 1.2 1.4 1.3 1.6 1.8 2.0 2.0 2.4 1.2 1.5 +0.2Region: Northeast — 2.0 1.3 1.2 0.6 1.5 1.5 1.6 1.3 2.1 0.9 1.3 1.9 4.5 2.1 3.0 3.8 1.6 2.0 +0.4 North Central — 1.5 1.3 1.4 1.4 0.8 2.2 1.5 2.1 2.1 2.3 1.6 2.3 1.7 2.8 1.8 2.4 1.6 1.5 -0.1 South — 2.1 2.2 1.7 0.6 1.6 1.0 1.7 1.3 0.5 1.6 2.6 1.5 2.1 2.5 1.8 2.2 1.6 2.0 +0.4 West — 1.9 1.7 1.0 2.3 1.1 0.8 1.0 0.3 1.6 1.7 1.2 1.1 2.1 2.4 2.2 2.0 1.0 1.5 +0.5Population Density: Large MSA — 1.6 1.3 1.1 1.0 0.7 1.1 1.4 1.3 0.8 2.1 1.3 1.7 1.9 2.0 2.1 2.6 1.4 1.6 +0.3 Other MSA — 2.3 1.5 1.4 1.4 0.9 1.5 1.3 1.3 1.7 1.5 2.0 2.0 2.9 3.0 2.1 2.9 1.4 1.6 +0.2 Non-MSA — 1.1 2.4 1.6 0.8 2.2 1.3 2.1 1.5 1.6 1.6 1.9 1.2 2.0 2.1 2.3 1.8 1.7 2.2 +0.5Parental Education:a
1.0-2.0 (Low) — 0.6 1.1 2.0 2.1 1.1 2.8 1.1 1.5 3.4 3.0 1.5 1.3 2.1 3.6 2.9 4.9 2.1 2.8 +0.7 2.5-3.0 — 2.1 2.0 0.6 0.9 1.3 1.7 1.3 1.9 1.4 1.4 0.8 1.6 3.2 3.0 1.3 2.9 1.3 1.8 +0.5 3.5-4.0 — 2.6 2.3 1.6 1.3 1.5 1.1 1.1 1.3 1.1 1.1 2.5 1.9 1.9 2.8 2.7 2.5 1.7 1.7 -0.1 4.5-5.0 — 1.3 1.1 1.6 0.9 1.3 0.6 2.0 1.1 1.2 1.9 2.2 1.4 1.9 2.3 2.3 1.8 1.3 1.3 +0.1 5.5-6.0 (High) — 2.1 1.0 0.5 0.8 0.8 1.2 1.4 1.1 1.3 1.5 1.1 2.4 2.2 1.0 1.4 2.4 1.2 1.5 +0.3Race (2-year average):b
White — — 1.6 1.3 1.3 1.2 1.1 1.4 1.3 1.2 1.5 1.7 1.8 2.1 2.5 2.4 2.4 2.1 1.6 -0.5 Black — — 1.8 1.2 0.5 1.1 1.8 1.2 1.4 1.5 0.9 0.7 1.0 1.2 1.0 1.1 1.3 1.6 1.7 +0.1 Hispanic — — 2.3 3.3 1.8 0.9 1.7 1.3 0.6 1.6 2.4 2.9 2.4 2.1 2.2 1.8 2.4 2.0 2.3 +0.3
data beginning in 2005, see the race/ethnicity note at the end of Appendix D.
change
Notes: Level of significance of difference between the two most recent classes: s = .05, ss = .01, sss = .001. ‘—’ indicates data not available. Any apparent inconsistency between the change
estimate and the prevalence-of-use estimates for the two most recent classes is due to rounding error. See Table D-108 for the number of subgroup cases. See Appendix B for definition of
bTo derive percentages for each racial subgroup, data for the specified year and the previous year have been combined to increase subgroup sizes and thus provide more stable estimates. For the
variables in table. Data based on one of six forms in 1989–90; N is one-sixth of N indicated in Table D-108. Data based on two of six forms in 1991–2005; N is two-sixths of N indicated in Table
D-108. Data based on three of six forms in 2006; N is one-half of N indicated in Table D-108. In 2006, the question text was changed slightly in one of the questionnaire forms. An examination
aParental education is an average score of mother’s education and father’s education. See Appendix B for details.
Caution: Limited sample sizes (see “Notes” above). Use caution in interpreting subgroup trends. of the data did not show any effect from the wording change.
Source: The Monitoring the Future Study, the University of Michigan.
Percentage who used in last twelve monthsClass of:
TABLE D-105Steroids: Trends in Annual Prevalence of Use by Subgroups for Twelfth Graders
’05–’06
408

1991 1992 1993 1994 1995 1996 1997 1998 1999 2000 2001 2002 2003 2004 2005 2006Total 17,500 18,600 18,300 17,300 17,500 17,800 18,600 18,100 16,700 16,700 16,200 15,100 16,500 17,000 16,800 16,500Gender: Male 8,600 8,800 8,600 8,300 8,100 8,400 8,600 8,600 7,800 7,900 7,500 7,000 7,600 8,100 8,000 7,800 Female 8,600 9,300 9,200 8,600 8,700 8,800 9,300 8,900 8,400 8,300 8,300 7,600 8,400 8,500 8,400 8,200College Plans: None or under 4 years 2,300 2,400 2,100 2,000 1,900 2,200 1,900 1,800 1,700 1,600 1,600 1,300 1,600 1,600 1,600 1,500 Complete 4 years 14,600 15,400 15,400 14,700 14,800 14,800 15,800 15,600 14,500 14,500 14,100 13,400 14,500 15,000 14,800 14,600Region: Northeast 3,000 3,700 3,900 3,400 3,100 3,200 3,400 3,300 3,000 2,800 2,900 2,800 3,200 3,200 3,200 2,900 North Central 5,300 5,300 4,700 4,200 4,300 4,600 4,100 4,300 4,200 4,300 4,000 4,000 4,100 4,000 3,700 3,500 South 6,300 6,200 6,400 6,300 6,600 6,300 7,200 6,600 6,100 6,300 5,900 5,400 6,300 6,300 6,300 6,300 West 2,900 3,400 3,300 3,400 3,500 3,700 3,900 3,900 3,400 3,300 3,400 2,900 2,900 3,500 3,600 3,800Population Density: Large MSA 4,500 5,700 5,500 4,400 5,200 5,200 5,000 4,800 4,800 4,900 4,700 4,500 4,900 5,000 5,400 5,400 Other MSA 8,400 8,300 8,800 8,300 7,800 8,400 9,000 8,800 7,900 7,900 7,500 6,900 7,700 7,900 7,400 7,300 Non-MSA 4,600 4,600 4,000 4,600 4,500 4,200 4,600 4,500 4,000 3,900 4,000 3,700 3,900 4,100 4,000 3,800Parental Education: 1.0-2.0 (Low) 1,400 1,700 1,700 1,600 1,500 1,500 1,500 1,300 1,300 1,300 1,300 1,100 1,100 1,200 1,400 1,400 2.5-3.0 4,400 4,600 4,500 4,100 3,900 4,300 4,000 3,900 3,800 3,700 3,400 3,200 3,400 3,400 3,400 3,300 3.5-4.0 4,100 4,300 4,300 4,200 4,000 4,100 4,300 4,100 3,800 3,900 4,000 3,500 3,700 4,000 3,700 3,800 4.5-5.0 4,100 4,100 4,100 3,900 3,900 3,900 4,500 4,500 4,000 3,900 3,900 3,800 4,200 4,300 4,200 4,000 5.5-6.0 (High) 2,200 2,300 2,300 2,200 2,300 2,200 2,600 2,700 2,200 2,200 2,100 2,100 2,400 2,500 2,600 2,300Race (2-year average):a
White — 21,900 22,000 20,900 19,800 20,200 21,400 21,300 19,800 18,900 18,600 17,600 18,400 20,400 20,500 19,500 Black — 4,200 4,800 5,500 5,600 5,300 4,700 4,900 5,000 4,800 4,500 4,500 4,400 3,900 3,800 4,000 Hispanic — 3,400 3,600 4,000 4,000 4,000 4,200 4,100 4,100 4,000 4,100 3,900 3,400 3,200 3,600 4,700
Notes: ‘—’ indicates data not available. See Appendix B for definition of variables in table.
and thus provide more stable estimates. For the data beginning in 2005, see the race/ethnicity note at the end of Appendix D.
aNs for each racial subgroup represent the combination of the specified year and the previous year. Data have been combined to increase subgroup sample sizes
about that drug. If there is no such indication, that means the entire sample received the question. than in all, in which case these Ns need to be adjusted appropriately. Look under “Notes” in each table to see if only a fraction of the sample was asked Caution: The Ns in this table are based on the entire sample at each grade level. Some drug-use questions are asked only in some of the questionnaire forms rather
Source: The Monitoring the Future Study, the University of Michigan.
TABLE D-106 Approximate Weighted Ns by Subgroups for Eighth Graders
409

1991 1992 1993 1994 1995 1996 1997 1998 1999 2000 2001 2002 2003 2004 2005 2006Total 14,800 14,800 15,300 15,800 17,000 15,600 15,500 15,000 13,600 14,300 14,000 14,300 15,800 16,400 16,200 16,200Gender: Male 7,200 7,000 7,300 7,700 8,300 7,500 7,400 7,100 6,300 6,800 6,600 6,900 7,500 7,900 7,900 7,900 Female 7,400 7,400 7,800 7,900 8,400 7,800 7,800 7,700 7,000 7,200 7,100 7,100 8,000 8,300 8,000 8,000College Plans: None or under 4 years 2,600 2,400 2,500 2,700 2,500 2,300 2,200 2,200 1,900 1,900 1,900 2,000 2,100 1,900 1,800 1,800 Complete 4 years 11,900 12,000 12,400 12,800 14,200 13,000 13,000 12,500 11,500 12,100 11,900 12,100 13,400 14,300 14,100 14,100Region: Northeast 2,700 3,000 2,900 3,100 3,300 3,100 3,300 3,100 3,000 2,800 2,700 2,600 3,400 3,600 3,500 3,200 North Central 3,700 3,800 4,800 4,700 4,400 3,900 3,900 3,600 3,100 3,700 4,100 3,700 4,000 4,600 4,500 4,300 South 4,900 5,000 4,900 5,200 6,100 5,600 5,500 5,200 4,700 5,000 5,000 5,100 4,900 4,900 5,000 5,300 West 3,500 3,000 2,700 2,800 3,200 3,000 2,800 3,100 2,800 2,800 2,200 2,900 3,500 3,300 3,200 3,400Population Density: Large MSA 3,400 3,700 3,500 4,100 4,700 4,300 4,300 4,300 3,700 4,000 3,900 4,300 4,900 5,000 4,900 5,100 Other MSA 7,400 7,300 7,600 7,500 8,200 7,500 7,300 7,000 6,700 6,700 6,700 6,800 7,800 7,800 7,600 7,900 Non-MSA 4,000 3,800 4,200 4,200 4,100 3,800 3,900 3,700 3,200 3,600 3,400 3,200 3,100 3,600 3,700 3,200Parental Education: 1.0-2.0 (Low) 1,300 1,300 1,300 1,300 1,200 1,100 1,300 1,300 1,100 1,200 1,200 1,300 1,200 1,300 1,100 1,100 2.5-3.0 3,900 3,900 4,100 4,100 4,100 3,600 3,700 3,700 3,200 3,200 3,200 3,300 3,500 3,400 3,200 3,200 3.5-4.0 3,900 3,900 4,100 4,300 4,600 4,300 4,100 4,000 3,600 3,700 3,700 3,700 4,200 4,200 4,100 4,300 4.5-5.0 3,500 3,400 3,500 3,700 4,000 3,900 3,700 3,500 3,300 3,500 3,400 3,500 3,900 4,300 4,400 4,500 5.5-6.0 (High) 1,800 1,700 1,700 1,800 2,300 1,900 1,900 1,800 1,700 1,900 1,800 1,700 2,100 2,400 2,400 2,300Race (2-year average):a
White — 19,600 20,700 22,000 22,900 22,400 20,900 19,800 18,400 18,200 18,600 18,000 18,500 19,900 20,400 21,100 Black — 3,900 3,600 3,300 3,300 3,100 3,200 3,600 3,600 3,100 2,800 3,400 4,600 4,600 4,300 3,900 Hispanic — 2,600 2,700 2,800 2,900 3,000 3,200 3,500 3,200 3,100 3,400 3,600 3,600 3,500 3,500 3,300
TABLE D-107 Approximate Weighted Ns by Subgroups for Tenth Graders
aNs for each racial subgroup represent the combination of the specified year and the previous year. Data have been combined to increase subgroup sample sizes
Source: The Monitoring the Future Study, the University of Michigan.
and thus provide more stable estimates. For the data beginning in 2005, see the race/ethnicity note at the end of Appendix D.
Notes: ‘—’ indicates data not available. See Appendix B for definition of variables in table.
than in all, in which case these Ns need to be adjusted appropriately. Look under “Notes” in each table to see if only a fraction of the sample was asked Caution: The Ns in this table are based on the entire sample at each grade level. Some drug-use questions are asked only in some of the questionnaire forms rather
about that drug. If there is no such indication, that means the entire sample received the question.
410

1975 1976 1977 1978 1979 1980 1981 1982 1983 1984 1985 1986 1987 1988 1989 1990Total 9,400 15,400 17,100 17,800 15,500 15,900 17,500 17,700 16,300 15,900 16,000 15,200 16,300 16,300 16,700 15,200Gender: Male 4,300 6,900 7,100 8,500 7,500 7,500 8,400 8,500 7,800 7,600 7,600 7,100 7,700 7,700 8,000 7,700 Female 5,200 7,000 7,600 9,000 8,000 7,800 8,600 8,600 8,000 7,800 8,000 7,700 8,200 8,200 8,300 7,100College Plans: None or under 4 years — 6,500 6,700 8,100 6,800 6,300 6,700 7,200 6,300 5,900 5,600 5,100 5,000 4,700 4,800 4,200 Complete 4 years — 6,800 7,200 8,600 8,000 8,500 9,700 9,200 8,800 8,900 9,300 9,100 10,300 10,600 11,000 10,100Region: Northeast 2,200 3,400 3,700 4,400 3,800 3,600 4,100 4,600 3,900 3,200 3,700 3,600 3,500 3,200 3,200 3,300 North Central 2,900 4,500 4,600 5,200 4,800 4,700 5,300 5,200 4,600 4,500 4,400 4,300 4,400 4,300 4,500 4,200 South 3,000 4,300 4,600 6,000 4,800 4,800 5,300 5,300 5,200 5,300 4,900 4,700 5,200 5,600 6,100 5,000 West 1,400 2,200 2,200 2,500 2,600 2,700 2,800 2,600 2,600 2,900 3,000 2,600 3,200 3,200 2,900 2,700Population Density: Large MSA 2,100 3,700 4,000 4,600 4,000 3,900 4,500 4,800 4,200 4,100 4,200 3,700 4,200 4,400 4,000 3,800 Other MSA 4,000 5,700 6,200 8,000 6,800 6,700 7,100 7,300 6,800 6,900 6,900 7,000 8,000 7,700 8,800 7,700 Non-MSA 3,400 5,000 4,900 5,500 5,200 5,200 5,900 5,600 5,300 4,900 4,900 4,500 4,100 4,200 3,900 3,700Parental Education: 1.0-2.0 (Low) 1,700 2,200 2,600 3,100 2,500 2,300 2,400 2,700 2,200 1,900 1,800 1,800 1,700 1,600 1,700 1,600 2.5-3.0 3,000 4,300 5,400 6,200 5,600 5,300 5,800 5,900 5,500 5,100 5,100 4,600 4,500 4,500 4,600 4,300 3.5-4.0 1,600 2,500 3,200 4,000 3,600 3,600 4,200 4,200 3,900 4,000 4,000 3,800 4,300 4,400 4,500 4,100 4.5-5.0 1,100 1,600 2,200 2,800 2,600 2,700 3,100 2,900 2,800 2,900 3,000 2,900 3,400 3,500 3,500 3,100 5.5-6.0 (High) 440 710 1,100 1,200 1,200 1,300 1,500 1,300 1,200 1,400 1,500 1,500 1,800 1,900 1,700 1,600Race (2-year average):a
White — — 23,400 26,500 27,500 25,600 26,300 27,300 26,200 24,700 24,200 23,600 23,800 24,200 24,000 23,400 Black — — 3,300 3,700 3,500 3,500 4,000 4,000 3,900 4,000 4,000 3,500 3,200 3,600 3,900 3,500 Hispanic — — 890 1,000 940 740 930 1,300 1,300 1,200 1,200 1,500 1,900 2,100 2,400 2,500
TABLE D-108 Approximate Weighted Ns by Subgroups for Twelfth Graders
Notes: ‘—’ indicates data not available. See Appendix B for definition of variables in table.
rather than in all, in which case these Ns need to be adjusted appropriately. Look under “Notes” in each table to see if only a fraction of the sample was
Source: The Monitoring the Future Study, the University of Michigan.
asked about that drug. If there is no such indication, that means the entire sample received the question.
Class of:
and thus provide more stable estimates. For the data beginning in 2005, see the race/ethnicity note at the end of Appendix D.
aNs for each racial subgroup represent the combination of the specified year and the previous year. Data have been combined to increase subgroup sample sizes
Caution: The Ns in this table are based on the entire sample at each grade level. Some drug-use questions are asked only in some of the questionnaire forms
Cont'd
411

1991 1992 1993 1994 1995 1996 1997 1998 1999 2000 2001 2002 2003 2004 2005 2006Total 15,000 15,800 16,300 15,400 15,400 14,300 15,400 15,200 13,600 12,800 12,800 12,900 14,600 14,600 14,700 14,200Gender: Male 7,400 7,400 7,500 6,900 7,200 6,700 7,100 7,100 6,300 5,800 5,800 5,800 6,600 6,800 6,800 6,600 Female 7,200 7,900 8,200 8,000 7,800 7,100 7,700 7,500 6,700 6,400 6,500 6,600 7,400 7,200 7,300 7,100College Plans: None or under 4 years 4,000 3,700 3,700 3,400 3,300 2,600 3,200 3,100 2,800 2,600 2,500 2,400 2,800 2,800 2,600 2,500 Complete 4 years 10,300 11,200 11,600 11,100 11,200 10,800 11,000 11,100 10,200 9,300 9,600 9,700 11,100 11,000 11,300 11,000Region: Northeast 2,800 2,800 2,700 2,700 2,800 3,000 3,300 2,800 2,500 2,500 2,400 2,500 3,100 3,100 2,900 2,600 North Central 4,000 4,400 4,600 4,000 4,300 3,800 4,100 3,800 3,600 3,100 3,700 3,300 3,600 3,800 3,600 3,500 South 5,100 5,600 5,800 5,700 5,400 5,100 5,300 5,700 4,900 4,500 4,100 4,300 4,900 5,000 5,200 5,200 West 3,100 3,000 3,200 3,000 2,900 2,400 2,700 2,900 2,600 2,700 2,600 2,800 3,000 2,700 3,000 2,900Population Density: Large MSA 3,600 3,600 3,700 4,300 4,400 3,400 4,100 4,300 3,800 3,800 3,800 4,000 4,600 4,200 4,300 4,700 Other MSA 7,200 8,200 7,800 7,100 7,000 7,000 7,500 7,500 6,200 5,800 5,800 5,900 6,500 6,800 7,000 6,200 Non-MSA 4,200 4,000 4,800 4,000 4,000 3,900 3,800 3,400 3,600 3,200 3,200 3,000 3,500 3,600 3,400 3,300Parental Education: 1.0-2.0 (Low) 1,500 1,400 1,600 1,400 1,200 1,100 1,300 1,200 960 860 1,000 980 1,200 1,000 1,100 1,100 2.5-3.0 4,100 4,100 4,300 3,700 3,700 3,300 3,600 3,700 3,200 3,000 2,900 2,800 3,400 3,400 3,200 3,100 3.5-4.0 4,200 4,600 4,500 4,300 4,400 3,800 4,100 4,300 3,900 3,600 3,600 3,800 4,200 4,000 3,900 4,000 4.5-5.0 3,100 3,400 3,600 3,500 3,700 3,500 3,500 3,300 3,200 3,100 3,200 3,100 3,400 3,600 3,600 3,600 5.5-6.0 (High) 1,500 1,700 1,700 1,800 1,800 2,100 2,100 2,000 1,800 1,600 1,600 1,500 1,800 2,000 2,100 1,900Race (2-year average):a
White 21,900 21,500 22,000 21,800 21,600 20,700 19,800 20,200 19,500 17,700 16,200 16,300 17,800 19,600 19,600 18,600 Black 3,200 3,900 4,200 3,600 3,300 3,200 3,600 3,700 3,400 3,300 3,100 2,900 3,000 3,200 3,000 3,000 Hispanic 2,400 2,600 2,900 3,100 2,700 2,600 2,800 3,000 2,500 2,200 2,600 3,100 3,100 2,800 2,900 3,500
and thus provide more stable estimates. For the data beginning in 2005, see the race/ethnicity note at the end of Appendix D.
aNs for each racial subgroup represent the combination of the specified year and the previous year. Data have been combined to increase subgroup sample sizes
than in all, in which case these Ns need to be adjusted appropriately. Look under “Notes” in each table to see if only a fraction of the sample was asked about that drug. If there is no such indication, that means the entire sample received the question.
TABLE D-108 (cont'd)Approximate Weighted Ns by Subgroups for Twelfth Graders
Notes: ‘—’ indicates data not available. See Appendix B for definition of variables in table.
Caution: The Ns in this table are based on the entire sample at each grade level. Some drug-use questions are asked only in some of the questionnaire forms rather
Source: The Monitoring the Future Study, the University of Michigan.
Class of:
412

In the original race/ethnicity question, which was used from the inception of the study through 2004,respondents were asked to select the one race/ethnicity category that they thought best described them.In 2005 the race/ethnicity question was changed in half of the questionnaire forms to conform moreclosely with the Office of Management and Budget guidelines. For the revised Monitoring the Futurequestion, respondents were given a list of race/ethnicity options and instructed to mark all of them thatapplied. An examination of the data showed a very low occurrence of respondents (about 6% in 2005)selecting more than one ethnic/racial group.
In 2005, to enable the combination of the data from the original question and the revised question, thefollowing method was used. For the original version of the question, respondents were assigned to theracial/ethnic group specified in their response. For the revised 2005 questions, those checking onlyWhite and no other racial/ethnic group were categorized as White; those checking Black and no otherracial/ethnic group were categorized as Black; and those checking one or more of the four Hispaniccategories but no other racial/ethnic group were categorized as Hispanic.
A Note about the Two-Year-Average Race/Ethnicity Data for 2005 and 2006
The prevalence-of-use data presented in Appendix D for the three largest racial/ethnic groups are basedon two-year moving averages, so as to moderate random fluctuations. The 2005 race/ethnicity entriesare, therefore, based on both the 2004 and 2005 data combined. Most of the entries for 2005 are basedon 2004 and 2005 data derived from the original question combined with 2005 data derived from thenew race/ethnicity question. In 2006 the race/ethnicity question was revised in the remaining forms.For the 2006 two-year moving averages, most of the entries are based on 2005 data derived from theoriginal question and 2005 and 2006 data derived from the revised question combined with the 2006data. (Note that, because some drug use questions occur only in a few forms, there is some variation inthe version of the race/ethnicity question upon which the 2005 data are based. Based on the analysesthat we have examined, we do not think that these different permutations make any appreciabledifference in the results.)
413