monitoring, verification, and evaluation component of the
TRANSCRIPT
e-Pact is a consortium led by Oxford Policy Management and co-managed with Itad in association with the Institute for
Fiscal Studies.
This evaluation was commissioned by the UK Department for International Development and was funded with UK aid
from the UK government.
This material has been funded by UK aid from the UK government; however the views expressed do not necessarily reflect the UK government’s official policies.
Monitoring, Verification, and
Evaluation Component of the
WASH Results Programme
Evaluation Synthesis Report – Vol. 1.1
January 2019
Evaluation of WASH Results Programme Endline Synthesis Report
This evaluation is being carried out by e-Pact. Julia Larkin is the team leader for the evaluation and Zach White is manager for the evaluation ([email protected]). The project director for the whole monitoring, verification, and evaluation contract is Don Brown.
The contact point for the client is Stephen Lindley-Jones ([email protected]). The client reference number for the project is PO6507.
e-Pact Level 3 Clarendon Centre Tel +44 (0) 1865 207300
52 Cornmarket St Fax +44 (0) 1865 207301
Oxford OX1 3HJ Email [email protected]
Registered in England: 3122495 United Kingdom Website www.opml.co.uk
Acknowledgements
This report is the culmination of evaluation activities undertaken by Oxford Policy Management
(OPM) between November 2014 and January 2019.
We would like to thank Guy Howard, Stephen Lindley-Jones, Leonard Tedd, and Laura Westcott at
the UK Department for International Development, the suppliers and their partners (especially their
teams in Kenya, Pakistan, Tanzania, and Uganda), and the monitoring and verification team for
their time and inputs during this period.
The core evaluation team comprised Julia Larkin, Lucrezia Tincani, Zach White, and Jeremy Colin.
This core team worked with a wider team in conducing the data collection and analysis; this wider
team included: Sue Cavill, Sarah Javeed, Alice Mango, Faith Muniale, and Shona Jenkins. The
following experts served as internal expert reviewers: Alex Hurrell, Sophie Witter, Richard Carter
and Timothy Forster.
The draft report was also reviewed by a representative from each supplier (John Dean from
SAWRP, Anne Mutta from SSH4A and Joanna Trevor from SWIFT) as well as representatives
from the Itad verification team (Katherine Welle and Ben Harris).
The evaluation findings draw on hundreds of interviews conducted with consortium programme
staff, local implementing NGOs, and government counterparts. The evaluation team are extremely
grateful to all those who offered their time and insights.
Disclaimer
This report has been prepared by the e-Pact consortium for the named client, for services specified
in the terms of reference and contract of engagement. Any use of the information in this report
should include a citation that acknowledges the e-Pact consortium as the author of the report,
using the citation “ePact (2018) – WASH Results Programme Evaluation – Synthesis Report vol.
1.1”.
This clause applies to all pages and information included in this report.
Evaluation of WASH Results Programme Endline Synthesis Report
e-Pact i
Executive summary
The WASH Results Programme
The UK Department for International Development’s (DFID) Water, Sanitation and Hygiene
(WASH) Results Programme is a £111 million seven-year programme (2014 to 2021). The
first round of the programme was implemented between May 2014 and March 2018 and aimed to
bring equitable and sustainable water and sanitation services and hygiene practices to 4.5 million
people in 11 countries1. In 2017 the programme was extended, to include a second phase lasting
until 2021. The scope of this evaluation is limited to the first contracting round (2014 to 2018)2.
The programme was implemented by three supplier consortia contracted to DFID under a
payment by results (PbR) financing modality. The WASH Results Programme was one of
DFID’s - and the wider sector’s - first large-scale applications of a PBR contracting modality.
Suppliers had no up-front financing; 100% of payments to Suppliers were based on delivery of pre-
specified ‘results’ which were independently verified by a third party.
The nature of the ‘results’ varied by supplier and varied across the phases of the
programme. In the two initial years of the programme (the ‘output phase’ – January 2014 to
December 2015) payments were made for the completion of activities and output-level results.
While in the latter two years of the programme (the ‘outcome phase’ – January 2016 to March
2018), payments were linked almost exclusively to achievement of outcomes, with a small
proportion of payments linked to indicators of sustainability of outcomes for one Supplier.
In addition to the PbR financing modality the WASH Results Programme had a number of
other key features, the most important of which were:
size, with each supplier contract being worth approximately £25 million; and
timing and phasing, with an output phase (ending by the Millennium Development Goals
(MDGs) deadline of December 2015) that delivered access to water and sanitation services
and hygiene promotion campaigns; and an outcome phase (to March 2018), which aimed to
ensure the sustainability of the services and behaviour changes achieved.
The Suppliers
The programme was implemented predominantly through INGOs working in partnership
with local government and national NGOs. Two suppliers, the Consortium for Sustainable
WASH in Fragile Contexts (SWIFT), and the South Asia WASH Results Programme (SAWRP),
were consortia of international non-governmental organisations (INGOs). The third, Sustainable
Sanitation and Hygiene for All (SSH4A), was implemented by a single INGO. Table 1 (overleaf)
provides an overview of the three consortia.
1 South Sudan and Liberia were dropped from the original 13-country programme 2 Envisaged as a £70 million four-year programme (May 2014 to March 2018)
Evaluation of WASH Results Programme Endline Synthesis Report
e-Pact ii
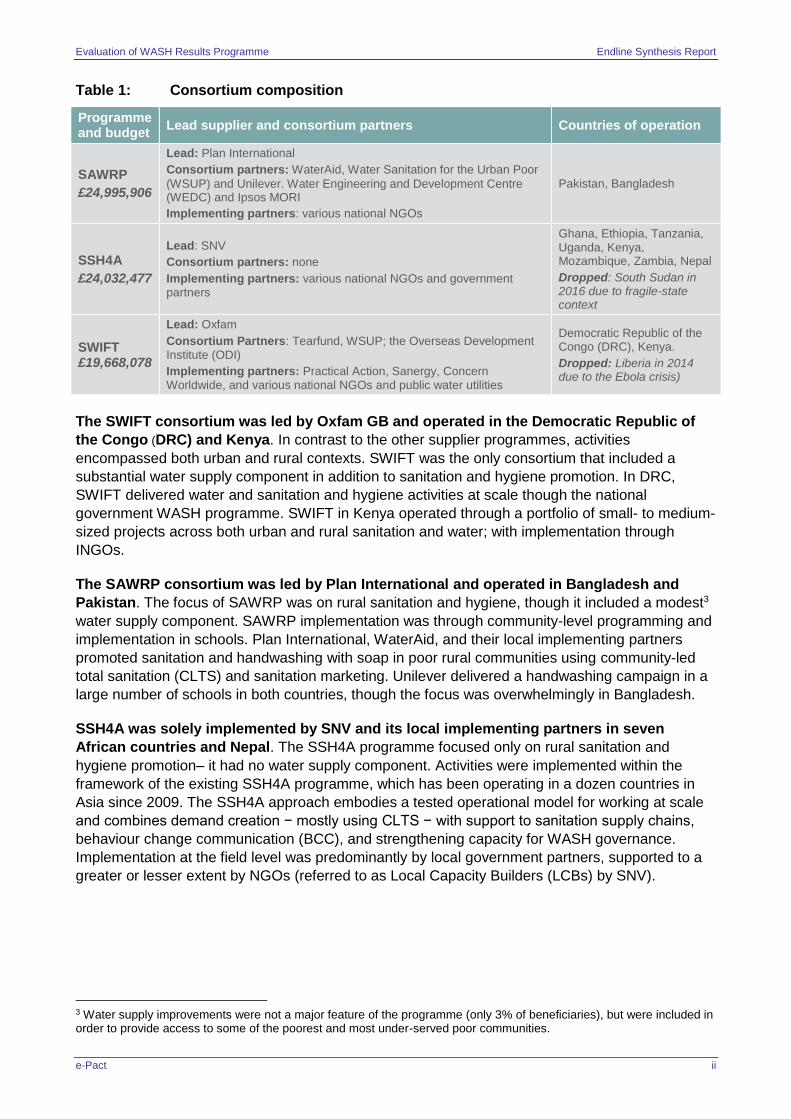
Table 1: Consortium composition
Programme and budget
Lead supplier and consortium partners Countries of operation
SAWRP
£24,995,906
Lead: Plan International
Consortium partners: WaterAid, Water Sanitation for the Urban Poor
(WSUP) and Unilever. Water Engineering and Development Centre (WEDC) and Ipsos MORI
Implementing partners: various national NGOs
Pakistan, Bangladesh
SSH4A
£24,032,477
Lead: SNV
Consortium partners: none
Implementing partners: various national NGOs and government partners
Ghana, Ethiopia, Tanzania, Uganda, Kenya, Mozambique, Zambia, Nepal
Dropped: South Sudan in 2016 due to fragile-state context
SWIFT £19,668,078
Lead: Oxfam
Consortium Partners: Tearfund, WSUP; the Overseas Development Institute (ODI)
Implementing partners: Practical Action, Sanergy, Concern Worldwide, and various national NGOs and public water utilities
Democratic Republic of the Congo (DRC), Kenya.
Dropped: Liberia in 2014 due to the Ebola crisis)
The SWIFT consortium was led by Oxfam GB and operated in the Democratic Republic of
the Congo (DRC) and Kenya. In contrast to the other supplier programmes, activities
encompassed both urban and rural contexts. SWIFT was the only consortium that included a
substantial water supply component in addition to sanitation and hygiene promotion. In DRC,
SWIFT delivered water and sanitation and hygiene activities at scale though the national
government WASH programme. SWIFT in Kenya operated through a portfolio of small- to medium-
sized projects across both urban and rural sanitation and water; with implementation through
INGOs.
The SAWRP consortium was led by Plan International and operated in Bangladesh and
Pakistan. The focus of SAWRP was on rural sanitation and hygiene, though it included a modest3
water supply component. SAWRP implementation was through community-level programming and
implementation in schools. Plan International, WaterAid, and their local implementing partners
promoted sanitation and handwashing with soap in poor rural communities using community-led
total sanitation (CLTS) and sanitation marketing. Unilever delivered a handwashing campaign in a
large number of schools in both countries, though the focus was overwhelmingly in Bangladesh.
SSH4A was solely implemented by SNV and its local implementing partners in seven
African countries and Nepal. The SSH4A programme focused only on rural sanitation and
hygiene promotion– it had no water supply component. Activities were implemented within the
framework of the existing SSH4A programme, which has been operating in a dozen countries in
Asia since 2009. The SSH4A approach embodies a tested operational model for working at scale
and combines demand creation − mostly using CLTS − with support to sanitation supply chains,
behaviour change communication (BCC), and strengthening capacity for WASH governance.
Implementation at the field level was predominantly by local government partners, supported to a
greater or lesser extent by NGOs (referred to as Local Capacity Builders (LCBs) by SNV).
3 Water supply improvements were not a major feature of the programme (only 3% of beneficiaries), but were included in order to provide access to some of the poorest and most under-served poor communities.
Evaluation of WASH Results Programme Endline Synthesis Report
e-Pact iii
The verification approach
The independent verification of suppliers’ results adopted a systems-based approach, meaning it
was based on data generated by the supplier’s internal monitoring and reporting systems, rather
than independent data collection by the monitoring and verification (MV) team. Working with DFID
and suppliers, the MV team created a verification system for the programme – tailored specifically
to each supplier’s monitoring and reporting systems. However the verification approach contained
the same core elements:
Systems appraisals of the suppliers’ monitoring and evaluation (M&E) systems were
conducted to assess the likelihood that data would be reliable and reports would be timely
and accurate.
Field visits were conducted to better understand supplier M&E systems, to collect primary
data that feeds into verification, and to help build relationships with Suppliers.
The evidence submitted by suppliers was reviewed, using a set of minimum standards.
Sometimes spot checks were done on the data.
After Action reviews were held to ensure that key learning surrounding measurement
and verification of indicators was applied in subsequent verification rounds.
Programme performance
By most measures the programme was very successful in achieving its stated objectives.
The vast majority of output-level targets were achieved by all suppliers, and in many areas with
significant overachievement. A prominent reason for exceeding targets was that suppliers had
planned for overachievement as part of their risk management strategy. The suppliers also
overwhelmingly achieved the outcome targets, with significant overachievement in several areas
and modest underachievement in relatively few others. The WASH Results Programme also
consistently scored well under DFID’s Annual review process; scoring A in 2014 and 2015 and A+
2016-2018.
The evaluation approach
The WASH Results Programme evaluation was primarily undertaken for learning purposes,
not accountability.4 The objectives of the evaluation were to assess:
(i) whether the programme successfully achieved its stated objectives;
(ii) the influence of programme design, including the PbR modality, on this achievement; and
(iii) lessons for applying PbR in WASH programming going forward.
The main focus of the evaluation, and this report, is on how and why and under what
circumstances results were achieved. The 27 detailed evaluation questions address all five
Organisation for Economic Co-operation and Development (OECD) Development Assistance
Committee (DAC) criteria: relevance, effectiveness, efficiency, impacts, and sustainability.
4 Operationalisation of the original terms of reference resulted in two distinct workstreams. The Programme Evaluation
Workstream (PEW) is addressed in this document. The randomised control trial (RCT), conducted in Pakistan, which examines factors affecting the sustainability of sanitation behaviour change in Pakistan, is described in separate documents.
Evaluation of WASH Results Programme Endline Synthesis Report
e-Pact iv
The mid-term evaluation report (2016) examined progress half way through the programme,
focusing particularly on the original design and tendering process, and on the output phase (March
2014 to December 2015, later extended to March 2016). It addressed all relevance evaluation
questions, and the effectiveness and efficiency questions as they related to the output phase, and
it explored some initial indications of impacts and sustainability.
The endline evaluation activities were conducted from October 2017 to July 2018 and
addressed the outstanding effectiveness and efficiency elements, especially as they related to the
outcome phase (January 2016 to March 2018), and examined the impact and sustainability
evaluation questions.
This final synthesis report incorporates key findings from the midline with the results from
the new endline evaluation activities. The findings draw on an analysis of programme
documentation; verification data; an analysis of the literature on PbR and WASH practice; two
phases of interviews with key informants among all stakeholder groups; and, in particular, the
findings from purposively selected case studies undertaken for each of the three suppliers.
Lessons learned
The lessons presented in this section are framed around the core learning objectives of this
evaluation as opposed to specific evaluation questions. As an endline evaluation, the
evaluators focused on broader lessons relevant for the future for individual suppliers, DFID and/or
the WASH sector as a whole. This report does not repeat all of the lessons and recommendations
from the midline evaluation (see full list from the midline in Annex A), though several themes carry
through. The lessons presented here are further elaborated upon and nuanced in the main body of
the report.
(i) Whether the programme successfully achieved its stated objectives
A. All three supplier consortia were successful in delivering their targets, through there is a question of how replicable this achievement is. Suppliers achieved, if not exceeded, the vast majority of their contractual targets; partially due to the possibility to shift over-achievement to cover underperformance within some subcategories. However, the tight timetable in the output phase placed a high burden on staff; particularly during the output phase. The WASH Results Programme was exceptional in that it was the first large-scale application of PbR in the WASH sector; it was a high-profile programme which presented great financial and reputational risks for the suppliers. With this came heightened management attention. These exceptional factors are significant because they raise some questions surrounding how replicable the achievements of the programme may be.
B. Suppliers’ programme approaches were generally well aligned with DFID’s expectations, but in some cases the fact that DFID did not articulate these expectations more clearly resulted in a missed opportunity. The programmatic approaches chosen by the suppliers generally met DFID’s expectations, such as operating at scale5, inclusivity, and sustainability. However, not requiring a focus on community-wide coverage (in sanitation Open Defecation Free (ODF) status) or other best practice for achieving sustainable and inclusive outcomes presented a missed opportunity – though it is noted that in many cases ODF was still pursued as a programme objective by suppliers. DFID not explicitly setting all of their expectations at the bidding stage created a risk for potential suppliers, onto whom the risk of delivery was transferred under a PbR contract.
5 Taken here to mean reaching a large number of people.
Evaluation of WASH Results Programme Endline Synthesis Report
e-Pact v
C. The PbR modality strengthened supplier monitoring systems, though in many cases undertaking improvements to monitoring systems was more burdensome than suppliers anticipated. The monitoring systems of most of the supplier consortia partners required moderate to significant modifications to meet verification requirements. It is important to strike a balance between increased rigour and the corresponding increased cost, because there is a potential opportunity cost with regards to staff time and money in doing ever more intensive monitoring.
D. Suppliers reported substantial learning on how to manage and price risk. Based on the programme’s experience, the following approaches worked well, some of which can be considered normal good practice: (1) setting realistic targets; (2) using reliable implementation partners; (3) applying tested approaches; (4) including a contingency fund; (5) considering cost inflation in the total price; (6) considering the risk that partners would not achieve the intended results; and (7) taking advantage of the increased monitoring to facilitate risk management.
(ii) The influence of programme design, including the PbR modality, on this achievement
E. DFID gave suppliers substantial flexibility and freedom to design and implement their own approaches, but this flexibility largely manifested only to higher levels of programme management6. Suppliers were able to propose the indicators, and the frequency with which they would be assessed, and each supplier individually negotiated a different ‘results framework’ with DFID under which they were paid. Suppliers appreciated this flexibility at the design stage, as well as the flexibility allowed during implementation. This flexibility was largely confined to higher levels of programme management, as field teams were tightly managed, and where there were local implementing partners they generally operated on grant agreements which retained financial and activity reporting.
F. Implementation approaches for the three supplier consortia varied widely yet overwhelmingly relied on proven approaches and existing relationships with NGOs and governments. The evaluators uncovered little evidence of genuine innovation in programmatic approaches – meaning that no approaches that were novel to the global WASH sector were developed, though it is important to note evaluators found several instances of adaptive programming.
G. The split between output and outcome phases had mixed results. The urgency of the December 2015 deadline for the output phase in some cases limited suppliers’ ability to adapt and posed risks to quality, at least in the short term, and the sustainability of results. While it was clearly beneficial to have longer-term engagement with the institutions (government or community-level) with responsibility for managing services, this could have been achieved without formal phasing. Similarly, while imposing accountability for outcomes was beneficial and improved functionality, this could also have been achieved without formal phasing.
6 This lesson is also supported by evidence from the wider PbR literature. See Soucat, A., Dale, E., Mathauer, I., Kutzin,
J. (2017) ‘Pay-for-Performance Debate: Not Seeing the Forest for the Trees’. Health Systems & Reform 2017; 3:74–79; and Renmans, D., Holvoet, N., Orach, C. G. and Criel, B. (2016) ‘Opening the “black box” of performance-based financing in low- and lower middle-income countries: a review of the literature’. Health Policy and Planning, 31(9), 1297–1309. doi: 10.1093/heapol/czw045
Evaluation of WASH Results Programme Endline Synthesis Report
e-Pact vi
(iii) Lessons for applying PbR in WASH programming in future
H. The WASH Results Programme was not a clean test of PbR, for a variety of reasons,
such as the evolution of expectations, the characteristics of the contracting process, and
the uniquely tight timetable for the first two years. For example, many programmatic
decisions had already been made by suppliers, by verifiers and by DFID before the PbR
modality was fully understood, and before the indicators for which suppliers would be
judged were negotiated. While the WASH Results Programme offers several interesting
and indicative lessons, its contribution to the broader evidence base for PbR in WASH is
limited.
I. PbR appeared to be a viable option for funding WASH programmes, but 100% PbR
was neither necessary nor optimal. To help manage cash flow and other risks, two
suppliers selected several process or activity targets, however these activities were time-
consuming to document and verify. These could easily have been reimbursed in a more
traditional way, without reducing the overall stimulus a PbR contract provides.
J. A PbR approach using disincentives only, without bonus opportunities, put
potentially undue, and unintended, burden on suppliers. Suppliers put in a great deal
of effort to not only achieve but overachieve many targets, but were not rewarded for doing
so.
K. The efforts of suppliers were not solely informed by financial incentives. The suppliers contracted under the WASH Results Programme had strong organisational values, which led them to take action on aspects not directly linked to payment. In many cases the reputational risk associated with not meeting given targets was also a powerful motivator.
L. Clarity on guiding principles of how major events, such as natural disasters or epidemics, would be handled between DFID and suppliers is important in a PbR context. In two cases involving SWIFT, DFID de facto assumed some of the financial risk after events. As the level of risk-sharing and the level of evidence expected was not clearly specified at contract stage, time and resources were invested in negotiating the level of risk sharing.
M. The high level of uncertainty at invitation to tender stage discouraged several bidders. Specifically, the lack of clarity surrounding the results and how they would be verified meant that some private sector actors viewed the programme as very high risk.
N. Under the WASH Results Programme, in part because of the lack of clarity on how
the PbR modality would operate, the PbR incentives acted within the context of tried
and tested implementation approaches than on untested operational models.
O. The lack of an inception phase – to design verification requirements before
implementation began – caused inefficiencies because the verification had to be
repeatedly adapted as the supplier’s systems changed or became better-known by
the MV team.
P. The value of including process-related indicators as payment indicators was
dependent on context. The evaluators perceived that the process indicators related to
start-up activities were included primarily to minimise the risk of non-payment for the
suppliers and to facilitate cash flow in early stages rather than incentivise supplier attention
on specific aspects of programming7. This was suboptimal and inefficient when these
indicators are costly and time-consuming to document and verify. The experience of this
7 This indicates that it is less likely that such process indicators would be included in future if a significant part of the
programme was grant-funded.
Evaluation of WASH Results Programme Endline Synthesis Report
e-Pact vii
programme shows that more complex aspects of programming (e.g. sustainability
prerequisites or learning) which lack agreed standards are difficult to measure. There is
value in reporting on process indicators related to these complex aspects of programming
when DFID seeks to encourage certain aspects in programme implementation. Though this
reporting does not necessarily need to be linked to result-based payment8.
Q. The PbR mechanism was better able to incentivise the desired results in those cases
where suppliers had more control over results. The PbR incentive acted less strongly
where implementation was through government, and where activities were incentivising
behaviour change.
R. Larger international partners were better able to handle the pre-financing, risk
management, and flexibility necessary under PbR than small organisations. All three
lead suppliers chose to hold a large portion of risk centrally. There were mixed results in
the few cases where local implementers were on full or partial PbR contracts, with some
shifting positively to a stronger sense of accountability, while others were less able to cope
and in some cases had their contracts discontinued.
S. Establishing appropriate outcome level targets was challenging. This was because much was beyond the suppliers’ direct control, and at the time of contracting there were few established benchmarks for the conversion of WASH outputs into outcomes.
T. Several lessons emerged on how the PbR modality could best strengthen supplier monitoring systems: In the WASH Results Programme, explicitly linking payments to outcomes triggered intensive discussion around outcome measurement, and the validity of those measurements in particular. Outcome-level monitoring, as well as accountability, played a facilitative role in ensuring functionality. The increased monitoring also supported supplier risk management strategies. It is also noted that suppliers were generally positive about the MV’s contribution to strengthening monitoring.
U. Several missed opportunities for learning occurred under the WASH Results Programme: data were primarily used for progress reporting/compliance, as opposed to learning; and the tight schedule in the output phase also limited opportunity for deeper learning and reflection.
8 If aspects such as inclusion were linked to a result-based payment, these payments could for example reward the
following: (a) Work in under-served geographical areas could be rewarded by allowing a higher unit price-per-beneficiary. (b) Bonus payments could reward survey results which confirm that equity targets and water-point functionality targets have been met after a certain period.
Evaluation of WASH Results Programme Endline Synthesis Report
e-Pact viii
Recommendations for future WASH PbR programmes
These recommendations are primarily for donors, such as DFID, that are considering the use of
PbR in future WASH programmes.
1. At design stage clarify the purpose of using PbR and consider the implications of
PbR for the type of supplier expected to bid. While the potential benefits of PbR
generally are well documented, it is important to set out in the programme design what the
specific rationale is for using PbR in this case, and to define the added value that it should
bring.
2. 100% PbR may be undesirable – the size of the PbR component should be tailored to
the purpose specified and to the feasibility of measuring results – especially in cases
where suppliers require finance in the early stages of implementation to ensure cash flow.
We recommend a hybrid design where a part of supplier payments are grant-based, with a
smaller percentage used as an incentive for good performance in key areas9. If PbR is
used to incentivise action related to aspects of programming that are important but difficult
to measure10, then great care should be given to the indicators used
3. Where possible, streamline the verification burden on suppliers. This relates both to
the indicators used for payment purposes and how the effort is applied by verifiers.
4. At design stage, the funding agency should, as far as possible, provide more clarity
on the results to be achieved and the accompanying verification requirements. This
may include appointing the verification provider before implementation begins and/ or being
more prescriptive on standards for verification requirements11.
5. As far as possible, at tender stage clarify donor/supplier risk-sharing arrangements
in the event of exceptional events including the level and type of evidence expected.
6. In future programmes ensure there is a sufficient inception phase, ensuring that
verification requirements are clear before any implementation activities begins.
7. Ensure that the learning by the MV team and suppliers on measuring and verifying
key WASH indicators (especially outcome-level indicators) is captured and
disseminated at the sector level.
9 Experience with PbR in other sectors also suggests that the value of PbR lies not in reimbursing the direct costs of
implementation (as NGOs are already motivated to do this) but in linking PbR payments so as to incentivise only those dimensions which might otherwise be marginalised, albeit unintentionally
10 These aspects include: creating an enabling environment for sustainability; ensuring meaningful action on equity and inclusion; and allowing space for learning.
11 This recommendation is also supported by evidence from the wider PbR literature. See Witter, S. et al. (2018) ‘(How)
does RBF strengthen strategic purchasing of health care? Comparing the experience of Uganda, Zimbabwe and the Democratic Republic of the Congo’. Submitted for publication.
Evaluation of WASH Results Programme Endline Synthesis Report
e-Pact ix
Table of contents
Acknowledgements 1
Executive summary i
The WASH Results Programme i
The Suppliers i
The verification approach iii
Programme performance iii
The evaluation approach iii
Lessons learned iv
Recommendations for future WASH PbR programmes viii
List of tables, figures, and boxes x
Abbreviations xi
1 Introduction 1
1.1 The WASH Results Programme 1
1.2 Objectives of the evaluation 3
1.3 Evaluation activities 4
1.4 High-level evaluation questions 5
1.5 Reporting of synthesis findings 6
1.6 Structure of the remainder of this report 6
2 Context for the WASH Results Programme 7
2.1 International development context 7
2.2 Linkages or synergies with other WASH programmes 8
2.3 PbR or results-based aid for WASH 8
2.4 How the context influenced evaluation design 12
2.5 Origins of the WASH Results Programme 13
3 Overview of the WASH Results Programme 15
3.1 DFID’s overall programme design 15
3.2 SWIFT 20
3.3 SAWRP 25
3.4 SSH4A 30
4 Findings and analysis 33
4.1 Relevance 33
4.2 Effectiveness 46
4.3 Efficiency 60
4.4 Impacts 68
4.5 Sustainability 77
5 Lessons learned and recommendations 90
5.1 High-level reflections relating to water, sanitation, and hygiene programming aspects 90
5.2 Lessons learned 91
5.3 Recommendations for future WASH PbR programmes 96
Bibliography 99
Evaluation of WASH Results Programme Endline Synthesis Report
e-Pact x
List of tables, figures, and boxes
Table 1: Consortium composition ................................................................................................ ii Table 2: The supplier programmes .............................................................................................. 2 Table 3: Summary of endline evaluation activities ....................................................................... 5 Table 4: Evaluation findings reporting.......................................................................................... 6 Table 5: Targets for the WASH Results Programme ................................................................. 16 Table 6: SWIFT deliverables as per the contract annex ............................................................ 21 Table 7: SWIFT performance on key deliverables ..................................................................... 24 Table 8: SAWRP deliverables as per contract annex ................................................................ 25 Table 9: Output-phase results ................................................................................................... 28 Table 10: Verified outcome-phase results of SAWRP ............................................................ 29 Table 11: Child survey results (Unilever) ............................................................................... 29 Table 12: SSH4A deliverables (revised)* ............................................................................... 30 Table 13: SSH4A performance on key indicators .................................................................. 32 Table 14: Summary of relevance DEQ findings (adapted from midline evaluation report) ...... 34 Table 15: Comparison of contracted ‘results’ across suppliers .............................................. 42 Table 16: Summary of effectiveness DEQ findings ................................................................ 46 Table 17: L&D team events and outputs ................................................................................ 58 Table 18: Summary of efficiency DEQ findings ...................................................................... 60 Table 19: Summary of impact DEQ findings .......................................................................... 68 Table 20: Inclusion framework ............................................................................................... 73 Table 21: Summary of sustainability DEQ findings ................................................................ 77 Table 22: Sustainability assessment by supplier .................................................................... 81 Figure 1: Triangular relationship between DFID, the MV provider, and suppliers 19 Figure 2: Generic causal pathway diagram 41 Figure 3: Comparison of payments made in response to different results across suppliers 42 Box 1: The midline evaluation report ............................................................................................... 4 Box 2: Lessons from the health sector on incentivising ‘quality’ performance using PbR .............. 12 Box 3: DFID’s definitions of PbR ................................................................................................... 14 Box 4: Phasing and timing in the global design ............................................................................. 17 Box 5: Theory behind PbR incentives ........................................................................................... 18
Evaluation of WASH Results Programme Endline Synthesis Report
e-Pact xi
Abbreviations
ASAL Arid and semi-arid lands BCC Behaviour change communication CCU Country Coordination Unit CLTS Community-led total sanitation DEQ Detailed evaluation question DFID UK Department for International Development DRC Democratic Republic of Congo EQuALS Evaluation Quality Assurance and Learning Service FGD Focus group discussion HEQ High-level evaluation question INGO International non-governmental organisation JMP Joint Monitoring Programme L&D Learning and dissemination LCB Local Capacity Builder M&E Monitoring and evaluation MDGs Millennium Development Goals MOU Memorandum of understanding MV Monitoring and verification MVE Monitoring, verification, and evaluation NGO Non-governmental organisation ODF Open defecation-free ODI Overseas Development Institute OECD DAC Organisation for Economic Co-operation and Development – Development
Assistance Committee OPM Oxford Policy Management OxPAC Oxfam, Practical Action, and Concern PbR Payment by results PEW Programme Evaluation Workstream Q1 Quarter 1 RBF Results-based financing RCT Randomised control trial SAF Sustainability Assessment Framework SAWRP South Asia WASH Results Programme, a consortium led by Plan-UK SNV Netherlands Development Organisation SSH4A Sustainable Sanitation and Hygiene for All SWIFT Sustainable WASH in Fragile Contexts, a consortium led by Oxfam UK TOR Terms of reference UNICEF UN Children’s Fund VEA Villlages et Écoles Assainis (Healthy Villages and Schools) VFM Value for money WASH Water, sanitation, and hygiene WEDC Water Engineering and Development Centre
Evaluation of WASH Results Programme Endline Synthesis Report
e-Pact xii
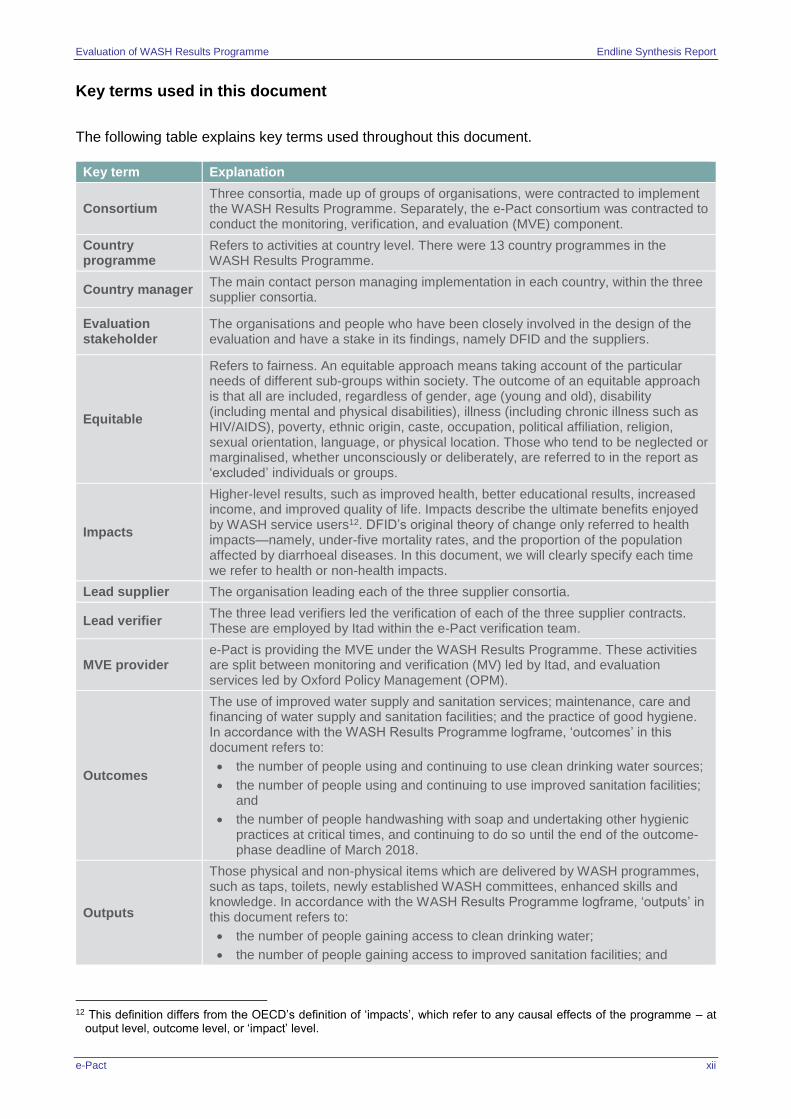
Key terms used in this document
The following table explains key terms used throughout this document.
12 This definition differs from the OECD’s definition of ‘impacts’, which refer to any causal effects of the programme – at
output level, outcome level, or ‘impact’ level.
Key term Explanation
Consortium Three consortia, made up of groups of organisations, were contracted to implement the WASH Results Programme. Separately, the e-Pact consortium was contracted to conduct the monitoring, verification, and evaluation (MVE) component.
Country programme
Refers to activities at country level. There were 13 country programmes in the WASH Results Programme.
Country manager The main contact person managing implementation in each country, within the three supplier consortia.
Evaluation stakeholder
The organisations and people who have been closely involved in the design of the evaluation and have a stake in its findings, namely DFID and the suppliers.
Equitable
Refers to fairness. An equitable approach means taking account of the particular needs of different sub-groups within society. The outcome of an equitable approach is that all are included, regardless of gender, age (young and old), disability (including mental and physical disabilities), illness (including chronic illness such as HIV/AIDS), poverty, ethnic origin, caste, occupation, political affiliation, religion, sexual orientation, language, or physical location. Those who tend to be neglected or marginalised, whether unconsciously or deliberately, are referred to in the report as ‘excluded’ individuals or groups.
Impacts
Higher-level results, such as improved health, better educational results, increased income, and improved quality of life. Impacts describe the ultimate benefits enjoyed by WASH service users12. DFID’s original theory of change only referred to health impacts—namely, under-five mortality rates, and the proportion of the population affected by diarrhoeal diseases. In this document, we will clearly specify each time we refer to health or non-health impacts.
Lead supplier The organisation leading each of the three supplier consortia.
Lead verifier The three lead verifiers led the verification of each of the three supplier contracts. These are employed by Itad within the e-Pact verification team.
MVE provider e-Pact is providing the MVE under the WASH Results Programme. These activities are split between monitoring and verification (MV) led by Itad, and evaluation services led by Oxford Policy Management (OPM).
Outcomes
The use of improved water supply and sanitation services; maintenance, care and financing of water supply and sanitation facilities; and the practice of good hygiene. In accordance with the WASH Results Programme logframe, ‘outcomes’ in this document refers to:
the number of people using and continuing to use clean drinking water sources;
the number of people using and continuing to use improved sanitation facilities; and
the number of people handwashing with soap and undertaking other hygienic practices at critical times, and continuing to do so until the end of the outcome-phase deadline of March 2018.
Outputs
Those physical and non-physical items which are delivered by WASH programmes, such as taps, toilets, newly established WASH committees, enhanced skills and knowledge. In accordance with the WASH Results Programme logframe, ‘outputs’ in this document refers to:
the number of people gaining access to clean drinking water;
the number of people gaining access to improved sanitation facilities; and
Evaluation of WASH Results Programme Endline Synthesis Report
e-Pact xiii
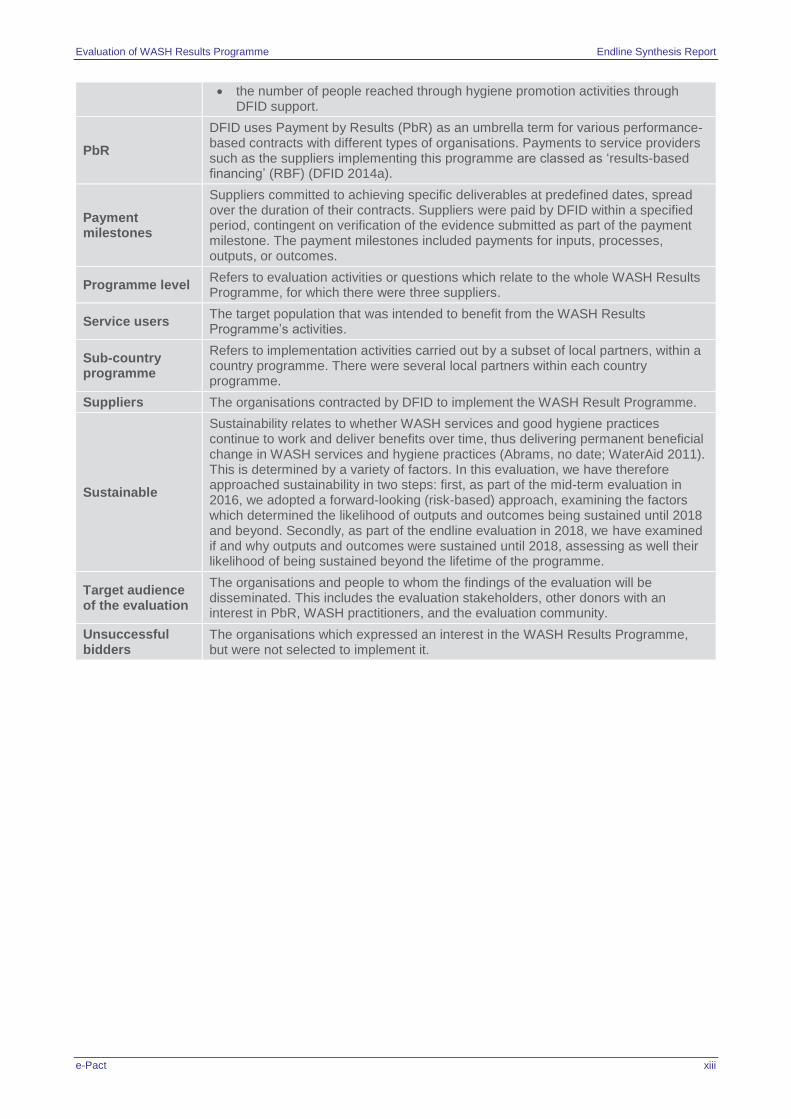
the number of people reached through hygiene promotion activities through DFID support.
PbR
DFID uses Payment by Results (PbR) as an umbrella term for various performance-based contracts with different types of organisations. Payments to service providers such as the suppliers implementing this programme are classed as ‘results-based financing’ (RBF) (DFID 2014a).
Payment milestones
Suppliers committed to achieving specific deliverables at predefined dates, spread over the duration of their contracts. Suppliers were paid by DFID within a specified period, contingent on verification of the evidence submitted as part of the payment milestone. The payment milestones included payments for inputs, processes, outputs, or outcomes.
Programme level Refers to evaluation activities or questions which relate to the whole WASH Results Programme, for which there were three suppliers.
Service users The target population that was intended to benefit from the WASH Results Programme’s activities.
Sub-country programme
Refers to implementation activities carried out by a subset of local partners, within a country programme. There were several local partners within each country programme.
Suppliers The organisations contracted by DFID to implement the WASH Result Programme.
Sustainable
Sustainability relates to whether WASH services and good hygiene practices continue to work and deliver benefits over time, thus delivering permanent beneficial change in WASH services and hygiene practices (Abrams, no date; WaterAid 2011). This is determined by a variety of factors. In this evaluation, we have therefore approached sustainability in two steps: first, as part of the mid-term evaluation in 2016, we adopted a forward-looking (risk-based) approach, examining the factors which determined the likelihood of outputs and outcomes being sustained until 2018 and beyond. Secondly, as part of the endline evaluation in 2018, we have examined if and why outputs and outcomes were sustained until 2018, assessing as well their likelihood of being sustained beyond the lifetime of the programme.
Target audience of the evaluation
The organisations and people to whom the findings of the evaluation will be disseminated. This includes the evaluation stakeholders, other donors with an interest in PbR, WASH practitioners, and the evaluation community.
Unsuccessful bidders
The organisations which expressed an interest in the WASH Results Programme, but were not selected to implement it.
Evaluation of WASH Results Programme Endline Synthesis Report
e-Pact 1
1 Introduction
DFID contracted the e-Pact consortium to deliver the Monitoring, Verification and Evaluation (MVE)
services for the multi-country WASH Results Programme. This final synthesis report integrates key
findings and recommendations from the previous midline evaluation (2016) with the results from
the endline evaluation activities conducted from October 2017 to July 2018.13, 14
This evaluation falls under the MVE component of the WASH Results Programme, implemented by
the e-Pact consortium under DFID’s Global Evaluations Framework Agreement. The evaluation
component was led by OPM, and the MV component was led by Itad.
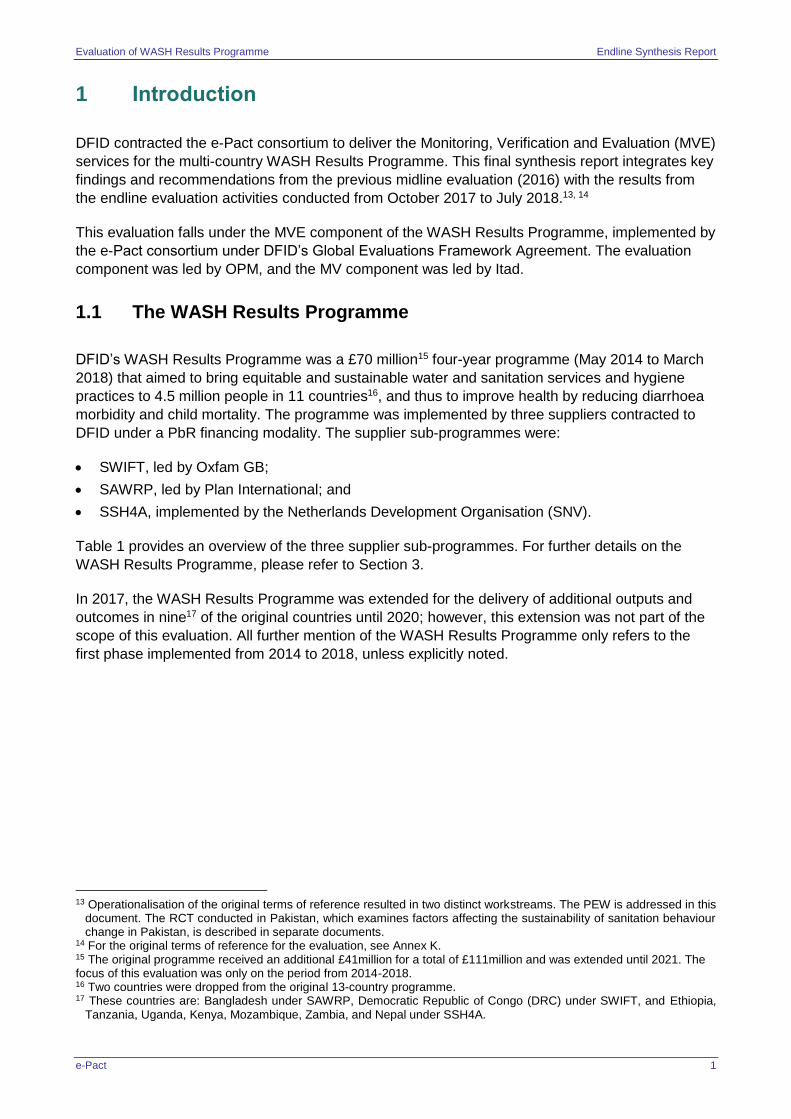
1.1 The WASH Results Programme
DFID’s WASH Results Programme was a £70 million15 four-year programme (May 2014 to March
2018) that aimed to bring equitable and sustainable water and sanitation services and hygiene
practices to 4.5 million people in 11 countries16, and thus to improve health by reducing diarrhoea
morbidity and child mortality. The programme was implemented by three suppliers contracted to
DFID under a PbR financing modality. The supplier sub-programmes were:
SWIFT, led by Oxfam GB;
SAWRP, led by Plan International; and
SSH4A, implemented by the Netherlands Development Organisation (SNV).
Table 1 provides an overview of the three supplier sub-programmes. For further details on the
WASH Results Programme, please refer to Section 3.
In 2017, the WASH Results Programme was extended for the delivery of additional outputs and
outcomes in nine17 of the original countries until 2020; however, this extension was not part of the
scope of this evaluation. All further mention of the WASH Results Programme only refers to the
first phase implemented from 2014 to 2018, unless explicitly noted.
13 Operationalisation of the original terms of reference resulted in two distinct workstreams. The PEW is addressed in this
document. The RCT conducted in Pakistan, which examines factors affecting the sustainability of sanitation behaviour change in Pakistan, is described in separate documents.
14 For the original terms of reference for the evaluation, see Annex K. 15 The original programme received an additional £41million for a total of £111million and was extended until 2021. The focus of this evaluation was only on the period from 2014-2018. 16 Two countries were dropped from the original 13-country programme. 17 These countries are: Bangladesh under SAWRP, Democratic Republic of Congo (DRC) under SWIFT, and Ethiopia,
Tanzania, Uganda, Kenya, Mozambique, Zambia, and Nepal under SSH4A.
Evaluation of WASH Results Programme Endline Synthesis Report
e-Pact 2
Table 2: The supplier programmes
Programme and budget
Lead supplier and consortium partners
Countries of operation Programme components
SAWRP
£24,995,906
Lead: Plan International
Consortium partners: WaterAid, Water Sanitation for the Urban Poor (WSUP) and Unilever. Water Engineering and Development Centre (WEDC) and Ipsos MORI provided support on monitoring and knowledge management
Implementing partners: various national NGOs
Pakistan, Bangladesh
Sanitation; hygiene, including a substantial school hygiene promotion component; and a modest water supply component (all rural)
SSH4A
£24,032,477
Lead: SNV
(not a consortium)
Implementing partners: various national NGOs and government partners
Ghana, Ethiopia, Tanzania, Uganda, Kenya, Mozambique, Zambia, Nepal
(Also South Sudan originally, but dropped in 2016 due to fragile-state context)
Rural sanitation and hygiene only
SWIFT
£19,668,078
Lead: Oxfam
Consortium Partners: Tearfund, WSUP; the Overseas Development Institute (ODI) supported monitoring, evaluation, accountability, and learning
Implementing partners: Practical Action, Sanergy, Concern Worldwide, and various national NGOs and public water utilities
DRC, Kenya.
(Also Liberia originally, but this was terminated in 2014 due to the Ebola crisis)
Water supply, sanitation and hygiene (urban and rural)
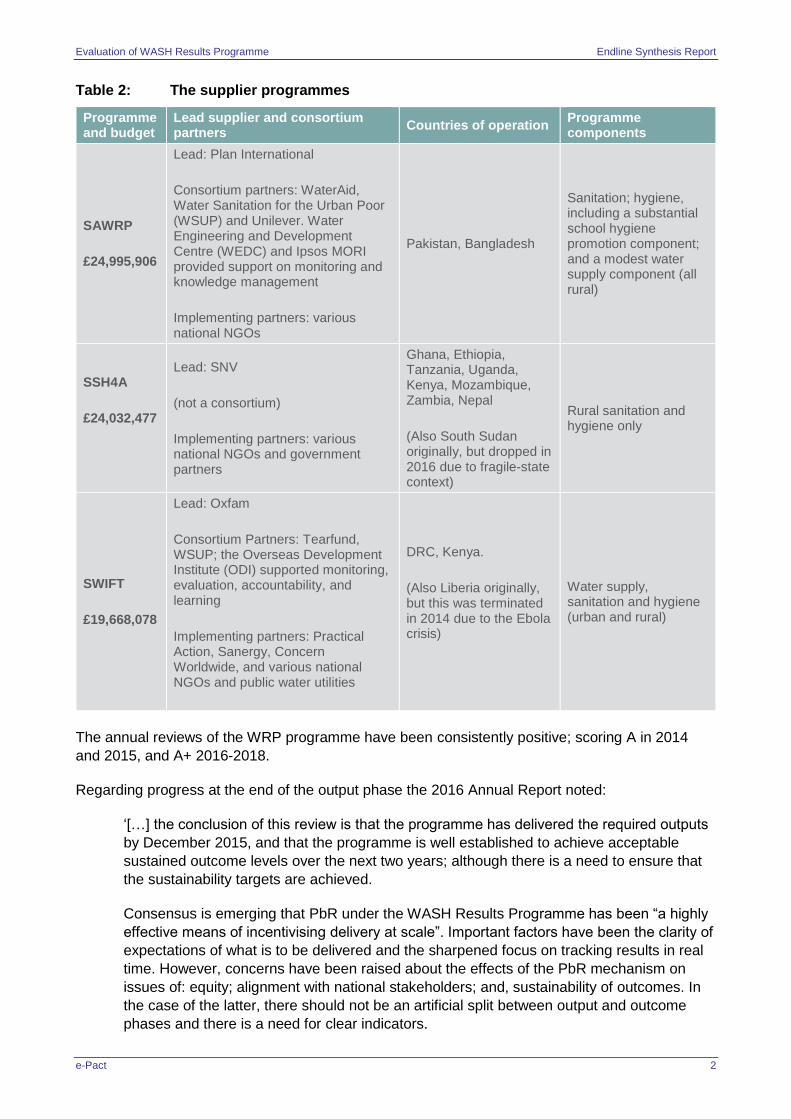
The annual reviews of the WRP programme have been consistently positive; scoring A in 2014
and 2015, and A+ 2016-2018.
Regarding progress at the end of the output phase the 2016 Annual Report noted:
‘[…] the conclusion of this review is that the programme has delivered the required outputs
by December 2015, and that the programme is well established to achieve acceptable
sustained outcome levels over the next two years; although there is a need to ensure that
the sustainability targets are achieved.
Consensus is emerging that PbR under the WASH Results Programme has been “a highly
effective means of incentivising delivery at scale”. Important factors have been the clarity of
expectations of what is to be delivered and the sharpened focus on tracking results in real
time. However, concerns have been raised about the effects of the PbR mechanism on
issues of: equity; alignment with national stakeholders; and, sustainability of outcomes. In
the case of the latter, there should not be an artificial split between output and outcome
phases and there is a need for clear indicators.
Evaluation of WASH Results Programme Endline Synthesis Report
e-Pact 3
[…] The programme is strategically relevant for DFID.’
Regarding performance at the end of the outcome phase the 2018 Annual review noted:
‘The WASH Results Programme has continued to exceed the milestones and targets set at the
outset. This year was potentially more challenging for the suppliers and the monitoring and
verification provider than previous years because work was ongoing simultaneously on outcome
level work to sustain use of services and hygiene behaviours under the original contract and work
on delivering output level results under the contract extensions. This has been done successfully
overall, with a significant number of expected outcome milestones exceeded by each supplier and
all others being met.’
1.2 Objectives of the evaluation
In June 2014, DFID made a commitment to greater use of PbR for the funding of international
development programmes, and DFID signalled the need for more learning on how PbR
programmes can be effectively implemented, and under what circumstances.
The evaluation of the WASH Results Programme is therefore primarily being undertaken for
learning purposes, not as an accountability exercise. The objectives of the evaluation are to
assess:
(i) whether the programme successfully achieved its stated objectives;
(ii) the influence of programme design, including the PbR modality, on this achievement; and
(iii) lessons for applying PbR in WASH programming in future.
With the first phase of the WASH Results Programme now complete (2014–2018), this final
synthesis report incorporates key findings from the midline evaluation with the results of the
endline evaluation activities.
The overarching evaluation questions address all five OECD DAC criteria: relevance,
effectiveness, efficiency, impacts, and sustainability.
The use of PbR in the WASH sector specifically is still relatively new. Where it has been applied,
this has mostly been in the form results-based aid to a government agency; its use for the
contracting of INGOs to deliver community-based WASH projects at scale is rare.18 Whilst the
midline evaluation identified lessons and recommendations that could be of use to the suppliers
and to DFID for the remaining implementation period, this endline evaluation focuses on broader
lessons learned for future programmes. Lessons from the evaluation are likely to be of great
interest not only to DFID and the contracted suppliers, but also to WASH sector stakeholders and
INGOs generally.
18 Note that the use of PbR for contracting INGOs is less rare in other sectors: the earliest use of RBF in health was
through performance-based contracts with NGOs in fragile settings such as Haiti, Cambodia, and Afghanistan, starting in the late 1990s. See for example: Eichler, R., Auxila, P., Antoine, U., Desmanglesena, B. (2009) ‘Haiti: Going to Scale with a Performance Incentive Model’, in: Performance Incentives for Global Health: Potential and Pitfalls. Center for Global Development, Washington, DC.
Evaluation of WASH Results Programme Endline Synthesis Report
e-Pact 4
1.3 Evaluation activities
The endline evaluation activities focused on implementation between 2016 and March 2018, when
the WASH Results Programme ended. As noted above, this report also incorporates several key
findings from the midline evaluation, which focused on implementation between the programme
start and December 2015. Refer to Box 1 for more information on the midline evaluation.
Box 1: The midline evaluation report
The midline evaluation report followed the methodology outlined in the Evaluation Design Document19, submitted in May 2015. The mid-term evaluation examined progress halfway through the four-year WASH Results Programme.
It answered the subset of evaluation questions that relate to the original design and tendering process of the DFID-funded WASH Results Programme, and to its output phase (March 2014–December 2015, later extended to March 2016).
It addressed all relevance evaluation questions, and the effectiveness and efficiency questions as they related to the output phase, and it explored some initial indications of impacts and sustainability.
See Annex A for the executive summary of the midline evaluation report.
In preparation for the endline evaluation activities, the team developed the Endline Design Note20
to document updates and refinements to the methodology to be used for the endline evaluation,
including: the detailed evaluation questions (DEQs) to be addressed, our overarching evaluation
approach, and our specific methodology for the various components of the evaluation. While the
evaluation examines what was achieved, the main focus is on how and why, and under what
circumstances, results were achieved.
The endline evaluation activities were conducted from October 2017 to July 2018 and addressed
the outstanding effectiveness and efficiency elements, especially as they related to the outcome
phase (January 2016 to March 2018), and it re-examined the impact and sustainability evaluation
questions.
The evaluation activities included theory of change analysis, process evaluation (including
institutional systems review), impact assessment, in-depth country case studies, and contribution
analysis for a subset of evaluation questions.
The findings of this report draw on an analysis of programme documentation from the earliest days
of the design phase to its conclusion; verification data; ongoing analysis of literature on PbR and
WASH practice; two phases of interviews with key informants among all stakeholder groups; and,
in particular, the findings from purposively selected case studies undertaken for each of the three
suppliers. For summaries of the case studies, refer to Vols. 2.1-2.3.
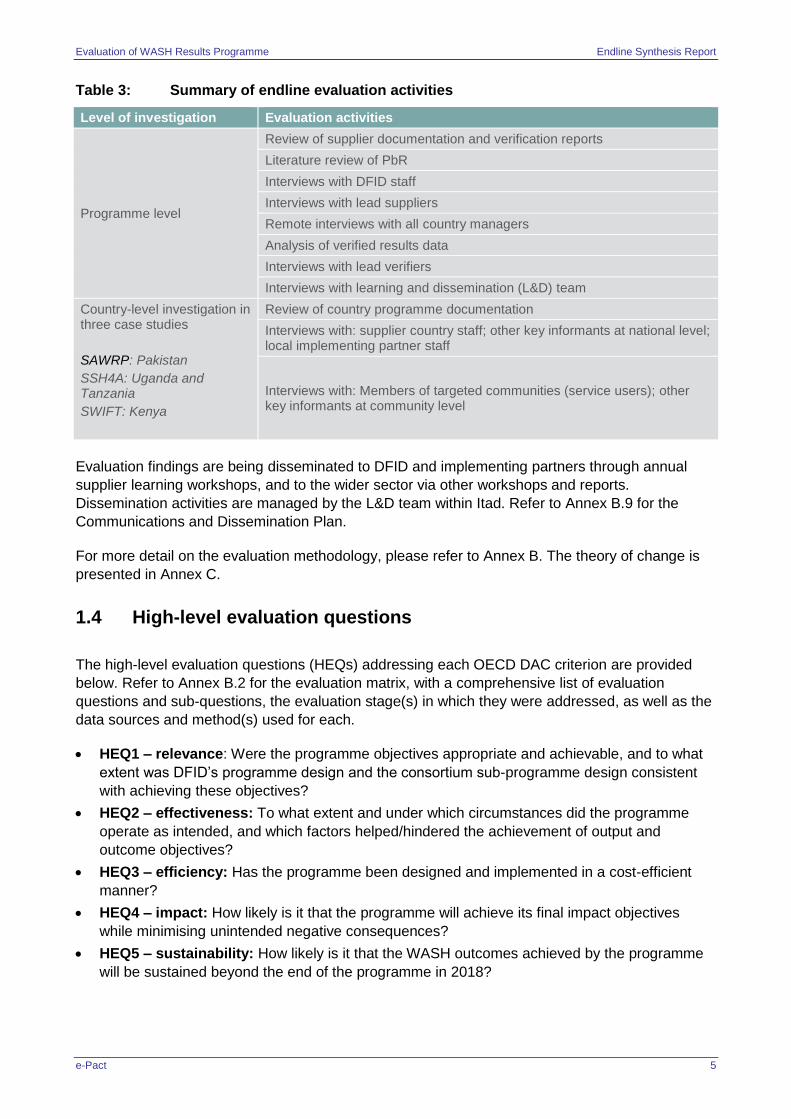
Table 3 summarises the stakeholder engagement and desk review activities conducted for this
endline evaluation.21
19 OPM (2015) ‘MVE component of the WASH results Programme: Evaluation design document’. 20 OPM (2018) ‘MVE component of the WASH results Programme: Endline evaluation design note’. 21 These activities are almost identical to those of the midline with two key exceptions. Interviews with unsuccessful
suppliers conducted at midline were not repeated and more effort was put into the remote interviews with the Country Managers for countries not included in the site visits.
Evaluation of WASH Results Programme Endline Synthesis Report
e-Pact 5
Table 3: Summary of endline evaluation activities
Level of investigation Evaluation activities
Programme level
Review of supplier documentation and verification reports
Literature review of PbR
Interviews with DFID staff
Interviews with lead suppliers
Remote interviews with all country managers
Analysis of verified results data
Interviews with lead verifiers
Interviews with learning and dissemination (L&D) team
Country-level investigation in three case studies
SAWRP: Pakistan
SSH4A: Uganda and Tanzania
SWIFT: Kenya
Review of country programme documentation
Interviews with: supplier country staff; other key informants at national level; local implementing partner staff
Interviews with: Members of targeted communities (service users); other key informants at community level
Evaluation findings are being disseminated to DFID and implementing partners through annual
supplier learning workshops, and to the wider sector via other workshops and reports.
Dissemination activities are managed by the L&D team within Itad. Refer to Annex B.9 for the
Communications and Dissemination Plan.
For more detail on the evaluation methodology, please refer to Annex B. The theory of change is
presented in Annex C.
1.4 High-level evaluation questions
The high-level evaluation questions (HEQs) addressing each OECD DAC criterion are provided
below. Refer to Annex B.2 for the evaluation matrix, with a comprehensive list of evaluation
questions and sub-questions, the evaluation stage(s) in which they were addressed, as well as the
data sources and method(s) used for each.
HEQ1 – relevance: Were the programme objectives appropriate and achievable, and to what
extent was DFID’s programme design and the consortium sub-programme design consistent
with achieving these objectives?
HEQ2 – effectiveness: To what extent and under which circumstances did the programme
operate as intended, and which factors helped/hindered the achievement of output and
outcome objectives?
HEQ3 – efficiency: Has the programme been designed and implemented in a cost-efficient
manner?
HEQ4 – impact: How likely is it that the programme will achieve its final impact objectives
while minimising unintended negative consequences?
HEQ5 – sustainability: How likely is it that the WASH outcomes achieved by the programme
will be sustained beyond the end of the programme in 2018?
Evaluation of WASH Results Programme Endline Synthesis Report
e-Pact 6
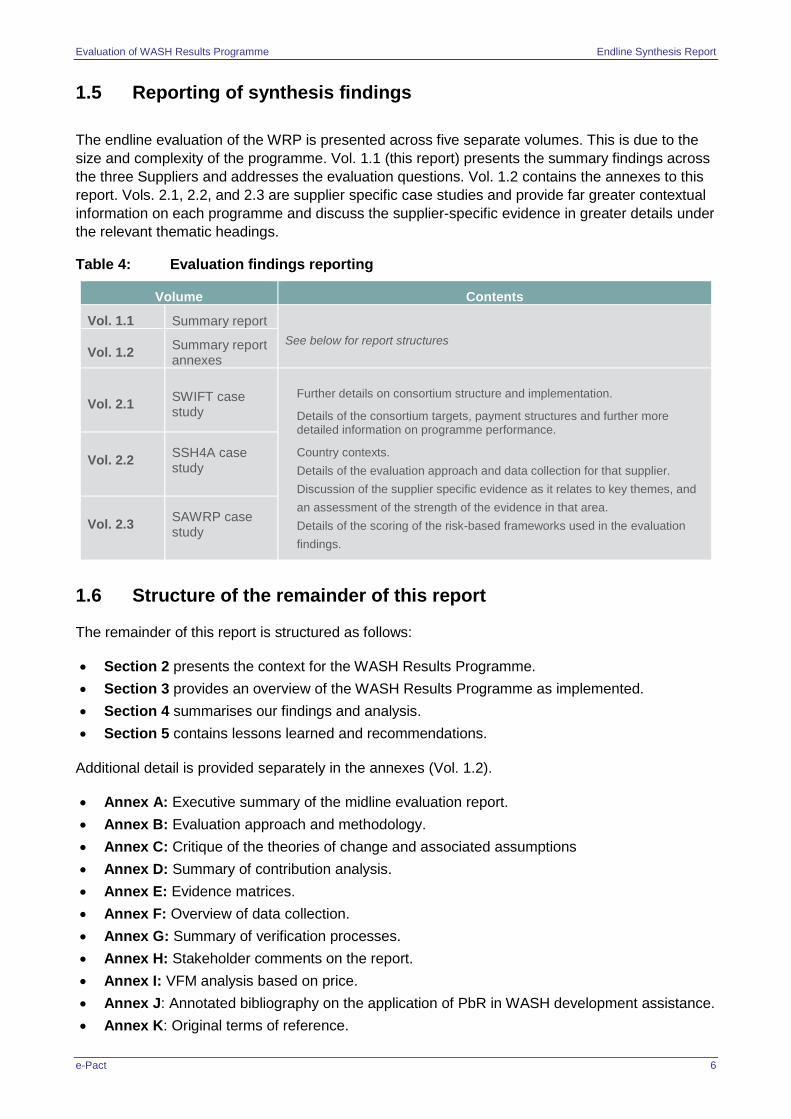
1.5 Reporting of synthesis findings
The endline evaluation of the WRP is presented across five separate volumes. This is due to the
size and complexity of the programme. Vol. 1.1 (this report) presents the summary findings across
the three Suppliers and addresses the evaluation questions. Vol. 1.2 contains the annexes to this
report. Vols. 2.1, 2.2, and 2.3 are supplier specific case studies and provide far greater contextual
information on each programme and discuss the supplier-specific evidence in greater details under
the relevant thematic headings.
Table 4: Evaluation findings reporting
Volume Contents
Vol. 1.1 Summary report
See below for report structures Vol. 1.2
Summary report annexes
Vol. 2.1 SWIFT case study
Further details on consortium structure and implementation.
Details of the consortium targets, payment structures and further more detailed information on programme performance.
Country contexts.
Details of the evaluation approach and data collection for that supplier.
Discussion of the supplier specific evidence as it relates to key themes, and
an assessment of the strength of the evidence in that area.
Details of the scoring of the risk-based frameworks used in the evaluation
findings.
Vol. 2.2 SSH4A case study
Vol. 2.3 SAWRP case study
1.6 Structure of the remainder of this report
The remainder of this report is structured as follows:
Section 2 presents the context for the WASH Results Programme.
Section 3 provides an overview of the WASH Results Programme as implemented.
Section 4 summarises our findings and analysis.
Section 5 contains lessons learned and recommendations.
Additional detail is provided separately in the annexes (Vol. 1.2).
Annex A: Executive summary of the midline evaluation report.
Annex B: Evaluation approach and methodology.
Annex C: Critique of the theories of change and associated assumptions
Annex D: Summary of contribution analysis.
Annex E: Evidence matrices.
Annex F: Overview of data collection.
Annex G: Summary of verification processes.
Annex H: Stakeholder comments on the report.
Annex I: VFM analysis based on price.
Annex J: Annotated bibliography on the application of PbR in WASH development assistance.
Annex K: Original terms of reference.
Evaluation of WASH Results Programme Endline Synthesis Report
e-Pact 7
2 Context for the WASH Results Programme
This section provides background information on the context for, as well as the emergence of, the
WASH Results Programme.22 The detailed design of the programme is examined in Section 3.
2.1 International development context
2.1.1 The fundamental importance of WASH
Supporting the improvement of water suppliers and sanitation systems is critical to developing
human capital, primarily through their contribution to public health. At the global level, access to
improved WASH has been shown to reduce mortality rates in diarrheal disease23, improve
management of cholera outbreaks24 and help reduce transmission risks from neglected tropical
diseases25 and acute respiratory infections26. The benefits of WASH extend beyond health. WASH
access at households and in intuitions has been shown to an effective means to promote gender
equity, disability inclusion as well as supporting the essential needs of children and the vulnerable
in society. This increases their ability to realise their rights and live productive lives. Moreover,
communities with improved WASH services have access to greater economic development
opportunities and are not robbed of their productive time due to sickness or time spent fetching
water (especially burdensome for women). Lastly, sustainable WASH access is associated with
improved environmental protection (especially from effective containment and faecal sludge
management) and indirectly contributes to climate change adaptation efforts.
2.1.2 WASH services in South Asia and sub-Saharan Africa
At the start of the WASH Results programme, the MDG era was coming to a close –it was clear
that while much progress in the sector had been made, significant challenges remained. Firstly, the
sanitation target had been missed by the equivalent of almost 700 million people, mostly in
southern Asia but also areas many areas of sub-Saharan Africa. Although the MDG goal for
improving access to an improved drinking water source was reached, the 2015 assessment
indicated that some countries were still left behind, with populations residing in least developed
countries most unlikely to have received access to an improved water source, especially within the
sub-Saharan African region. Overall, the 2015 assessment revealed that access to improved
WASH services was being achieved in an unequal way, with those living at the bottom of the
wealth pyramid and those living in rural areas fairing the worst.
The countries targeted under the WASH results programme were those facing some of the
greatest WASH challenges globally, particularly in terms access to improved sanitation in rural
areas.
22 For a more extensive discussion of the origins of the programme, refer to the Midline Evaluation Report 23 Pruss-Ustun el al (2014) Burden of disease through inadequate water sanitation and hygiene in low and middle
income settings: a retrospective analysis of data from 145 countries. Tropical Medicine and International Health 19(8) 894-905
24 Ending cholera: a global roadmap to 2030. Global Task Force on Cholera Control; October 2017. Accessed from
http://www.who.int/cholera/publications/global-roadmap/en/ 25 Water, Sanitation and Hygiene for Acceleration and Sustaining Progress on Neglected Tropical Disease: a global
Strategy WHO Geneva, 2016. Accessed from http://www.who.int/water_sanitation_health/publications/wash-and-ntd-strategy/en/
26 Rabie, T and Curtis, V. (2006): Handwashing and risk of respiratory infections: a quantitative systematic review. Tropical Medicine and International Health, 11(3), 258-267.
Evaluation of WASH Results Programme Endline Synthesis Report
e-Pact 8
2.2 Linkages or synergies with other WASH programmes
In all programme countries, other WASH initiatives were also being implemented, which created a
more favourable enabling environment within which the WASH Results Programme operated (see
full detail in Vols. 2.1-2.3). In several countries – for example for SWIFT in DRC and for Tanzania
under SSH4A – programme activities were explicitly implemented within the framework of national
WASH programmes and governments were involved in implementation. In other countries, such as
for SAWRP in Pakistan, activities were aligned with Pakistan’s de facto national sanitation
strategy, but the government was not directly involved in implementation. In all four case study
countries, stakeholders from these national WASH initiatives were interviewed, confirming positive
synergies with the WASH Results Programme.
Notwithstanding these synergies, it seems unlikely that there was direct overlap between the
implication areas of other WASH initiatives and those of the WASH Results Programme. It was a
requirement for suppliers to demonstrate to DFID that they were the only significant actors
implementing WASH activities in their locality.
2.3 PbR or results-based aid for WASH
The use of PbR in the WASH sector is relatively new and the available literature is limited, though
growing27. Where PbR has been applied, this has more commonly been in the form of results-
based aid to a government agency; its use for the contracting of INGOs to deliver community-
based WASH projects at scale is rare. Additionally, linking payments to hardware (e.g. water
supply infrastructure) has been more common – especially in an urban context – whereas linking
payments to software, such as changing behaviours on handwashing, has been more unusual.
Given this context, and given DFID’s commitment to expanding the use of PbR, lessons from the
evaluation are likely to be of great interest not only to DFID and the contracted suppliers, but also
to INGOs and other WASH sector stakeholders generally.
2.3.1 DFID’s use of PbR in funding WASH programmes
By the end of 2013, 71% of all centrally issued contracts from DFID for all sectors had a PbR
component. In 2014, DFID declared its ambition to push innovation in the way that PbR contracts
are designed to shift programming towards longer-term results and output- and outcome-based
payments. At this time, DFID was only beginning to explore outcome-based aid to address the
sustainability of outputs, mainly in the fields of health, infrastructure, and education. DFID’s 2014
strategy laid out clear objectives to remain at the forefront of PbR financing; to expand the
evidence base for how PbR can deliver better results in different sectors; and to develop internal
capacity to manage and guide rigorous, independent, and comparable evaluations for what works
best in PbR financing. It is clear from a review of recent DFID publications on PbR that PbR is its
preferred payment modality and that DFID has followed through on its commitment to expand the
evidence base for PbR in different sectors.28
The WASH Results Programme was the first large-scale DFID programme funded through a PbR
mechanism. In addition to the WASH Results Programme, DFID has funded three other large
WASH programmes with a PbR mechanism:
27 See, for example www.gpoba.org/node/787. 28 See for example, Clist (2017) and Duvendack (2017).
Evaluation of WASH Results Programme Endline Synthesis Report
e-Pact 9
In Support to Rural Water Supply, Sanitation, and Hygiene in Tanzania (2014–2022),
around half of the contract value, £78.6 million, is to be paid out to local government authorities
based on the delivery of results, with particular emphasis on maintenance of rural water supply
infrastructure. The 2015 Annual Review of this programme described a delay in the start of the
PbR mechanism due to insufficient baseline data, which made verification of results
impossible.
In Supporting the Transformation of Rural WASH Service Delivery in Mozambique (2015–
2020), DFID support takes the form of financial aid and technical assistance, where, in part,
payment is based on agreed-upon performance indicators, which are verified by an
independent monitoring partner. The business case describes how the PbR modality only
starts 18 months into implementation, following a kick-off period where financial aid is
disbursed as usual. During this kick-off period, DFID works with the Government of
Mozambique to define performance indicators that incentivise improved services.
The most recent Annual Review of the 2016–2017 programme year confirms that the performance
indicators were collaboratively developed with national, regional, and local levels of government,
and a monitoring and evaluation (M&E) framework is in development by the independent
verification partners, in line with agreed performance indicators.
DFID is also supporting Accelerating Sanitation and Water for All in Neglected, Off-Track
Countries (ASWA I and ASWA II) (2013–2019). For ASWA I, payments were not linked to
achievements (no PbR), but independent verification of results was still performed (total project
value: £45 million). However, for ASWA II, a small PbR component was introduced, relating to
the sustainability of open defecation-free (ODF) status. The most recent independent
evaluation report of ASWA I summarises lessons learned from the independent M&E
process29.
2.3.2 Evaluations of the use of RBF or PbR in WASH
In 2015, Castalia conducted the first comprehensive review of RBF in WASH30. Two-thirds of the
RBF WASH projects considered in the Castalia report were funded by the World Bank and/or
Global Partnership on Output-Based Aid (GPOBA). The remaining funders included a wide list of
donors31, as well as the WASH Results Programme. Eighty percent of these WASH projects used
GPOBA as the predominant RBF mechanism (as opposed to conditional cash transfers or voucher
programmes).
The Castalia review was not able to determine if RBF (or PbR) posed a better alternative to more
conventional forms of financing for WASH projects. The review signalled that RBF projects are
generally effective in achieving their aims, with three-quarters of WASH projects included in the
review achieving results above target levels. RBF projects are at least as efficient as
conventionally financed WASH projects. However, there is an absence of data against which to
compare RBF WASH projects with conventionally financed WASH projects to determine if RBF is
more efficient. At the time of the Castalia publication, no WASH project had published data on the
state of service delivery following payment of funds; thus there was insufficient evidence to indicate
that WASH results in PbR projects are more sustainable. Establishing a monitoring framework that
29 WYG International Limited (2017) ‘IPME Evaluation – Final Report’. 30 Castalia (2015) ‘Review of Results-Based Financing Schemes in WASH’. Available at:
https://www.ircwash.org/sites/default/files/rbf_in_wash_final_report_full_jan_2015.pdf 31 AusAid, US Agency for International Development, Bill & Melinda Gates Foundation, Millennium Challenge
Corporation, and certain state and national governments (Chile, Brazil, Australia).
Evaluation of WASH Results Programme Endline Synthesis Report
e-Pact 10
covers up to the ‘mean time for failure’ of comparable, conventional WASH systems being
supported could generate the data necessary to better assess sustainability of RBF WASH
projects.32
The evaluation of the independent verification of ASWA I concluded that there is a risk that
independent verification of results is not possible in countries affected by conflict and natural
disasters, and the achievement of results may be delayed due to factors beyond the control of
implementing partners. Consensus is necessary in the early stages of the design of the M&E
framework on programme ambitions in each country with regard to outputs and outcomes, and
timing of verification that balances the upfront funding requirements, enabling conditions, and
prerequisites for sustainability. Lastly, independent verification of a multi-country WASH
programme is resource-intensive for all parties involved: DFID, the independent M&E team, and
suppliers. Sharing lessons between all parties is certainly necessary to build capacity, as reflected
in the rationale of the WASH Results Programme.
2.3.3 Evaluations of use of PbR and RBF by DFID in other sectors
Most of the evidence related to the effectiveness of PbR is drawn from the fields of health and
education. Two recent reviews have reviewed PbR projects across sectors.
Clist’s 2017 summary report explored what works in PbR for DFID 33. He considered 11 projects
directly managed and contracted by DFID and eight larger funds linked to multiple projects.
Intervention areas included health, education, employment, energy, WASH, public financial
management, social protection, and food security. At the time this report was published, in 2017,
the evidence base for what works best was still considered by Clist to be very thin, with the caveat
that the evidence base from rigorous evaluations of PbR funding under DFID was expected to
double in the coming years. At the time of publication, Clist assessed only a handful of DFID PbR
projects as successful, which is not surprising given the lack of robust evidence generated from
PbR evaluations. Key areas where greater evidence is required include the following:
How to get the quality of the performance measure right – ensuring alignment between what is
measured and ambitious, yet achievable, results.
How to design PbR contracts that generate incentives that are appropriate for different cost
levels and how to target the interests of appropriate actors at different levels.
Capturing the additional costs of PbR (verification, management, technical assistance, and risk
management of gaming).
Clarity on how value for money (VFM) is calculated for PbR-only results, especially in cases
where PbR results are a sub-component of total funding. Greater clarity on how the added
costs of PbR are integrated into VFM calculations is required to compare PbR programmes
with each other, and with conventionally funded programmes.
From a broader strategic standpoint, Clist suggested that DFID differentiate between ‘big PbR’
(which have many payments linked to a single high-quality measure, longer agreements, and tend
to be with governments and private sector actors, with greater space for autonomy and innovation)
32 The Castalia systematic review was limited by the availability of data. Strengthening the evidence base to assess how
and in what ways RBF is a suitable substitute to more conventional funding for WASH projects requires comparable data and greater transparency.
33 Clist, P. (2017) ‘Full Report: Review of Payment by Results in DFID: Establishing the Evidence Base: Objective 2: What works for Payment by results Mechanisms in DFID Programs’. Available at: https://assets.publishing.service.gov.uk/government/uploads/system/uploads/attachment_data/file/684278/full-report-UEA2-merged.pdf
Evaluation of WASH Results Programme Endline Synthesis Report
e-Pact 11
and ‘small PbR’ (which have lesser quality measures, with greater oversight required to track
inputs and negotiate approaches, and which have shorter agreements, and tend to be with NGOs
and the private sector, with less space for autonomy and innovation). The evidence base currently
emerging on PbR relates to small PbR, and Clist (2017) classified the WRP as ‘small PbR’.
In 2017, Duvendack led a review to assess the evidence base to understand how and in what
contexts PbR mechanisms work best in implementation and lead to greater impacts than more
conventional funding mechanisms, specifically in developing countries34. The review identified
thousands of studies and narrowed down the pool of relevant literature to 100 research reports,
based on their selection criteria. The selection used in this review was developed to identify trends
and generalisable lessons on how and under what circumstances PbR programmes can achieve
their intended outcomes. The review confirmed that the majority of available evidence on the topic
is within the fields of health and education, and the evidence from the WASH sector at the time of
publication remained scant. The review did confirm a statistically significant positive effect of PbR
on targeted results. The review highlighted that the main actors issuing PbR contracts are
governments (and their respective international development cooperation bodies: for example,
DFID). Other actors issuing PbR contracts include the World Bank, NGOs, development financing
organisations, and public–private partnerships. Based on the (predominantly) health studies
included, the agents delivering results considered were either the health facility or individuals, and
60% of PbR measures (that trigger payments) were output-related. Fewer examples of PbR
mechanisms used in the health sector were linked to outcome-level results.
In Josephson et al.’s (2017) review of quality checklists of supply-side health facility-based
performance-based financing programmes in low- and lower middle-income countries, they
concluded that very few indicators assess health outcomes, as these are difficult to measure, but
also are not directly in the control of the providers being incentivised, whereas outputs are.35 Thus
it is understandable that the evidence base for how PbR can improve sustainability (outcome level
and beyond) is still limited, even within the health sector, where PbR has been in use far longer
than in the WASH sector.
A fundamental precondition for the appropriateness of PbR is that indicators should, to the extent
possible, be linked to outcomes that can be credibly verified. Clisp and Verschoor underline that
setting performance measures and credible verification systems is a deceptively simple task36. The
appropriateness and effectiveness of PbR has been shown to be context dependent, especially
when PbR is implemented in fragile states. Other contextual factors that impact the
appropriateness and effectiveness of PbR identified in other literature include the capacity of the
implementing agency to monitor and evaluate results, to manage financial resources under PbR
agreements, and to adaptively manage the flexible approach to PbR implementation37. DFID and
SIDA have also highlighted the management capacity gap that exists on the part of donors to cost-
34 Duvendack, M. (2017) ‘Full Report: Review of Payment by Results in DFID: Establishing the Evidence Base: Semi-
systematic review to understand Payment-by-Results mechanisms in developing countries’. Available at: https://assets.publishing.service.gov.uk/government/uploads/system/uploads/attachment_data/file/684277/full-report-UEA1-merged.pdf
35 Josephson, E., Gergen, J., Coe, M., Ski, S., Madhavan, S., and Bauhoff, S. (2017) ‘How do performance-based financing programmes measure quality of care? A descriptive analysis of 68 quality checklists from 28 low-and middle-income countries’. Health policy and planning, 32(8), 1120–1126.
36 Clist, P., Verschoor, A. (2014) ‘The Conceptual Basis of Payment by Results’. Available at: www.gov.uk/dfid-research-outputs/the-conceptual-basis-of-payment-by-results
37 O’Donnel M. and Longhurst, R. (2014) ‘Payment by Results: What it means for UK NGOs’. Available at: www.bond.org.uk/sites/default/files/resource-documents/bond_pbr_what_it_means_for_ngos_nov14.pdf
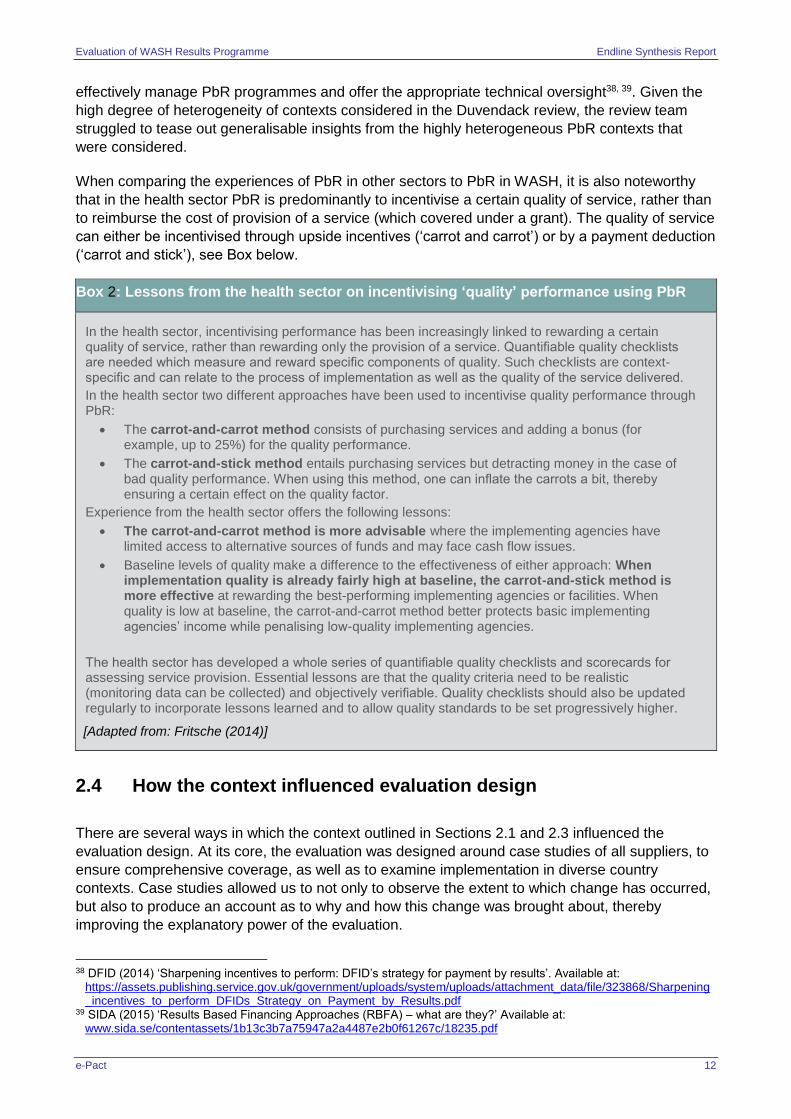
Evaluation of WASH Results Programme Endline Synthesis Report
e-Pact 12
effectively manage PbR programmes and offer the appropriate technical oversight38, 39. Given the
high degree of heterogeneity of contexts considered in the Duvendack review, the review team
struggled to tease out generalisable insights from the highly heterogeneous PbR contexts that
were considered.
When comparing the experiences of PbR in other sectors to PbR in WASH, it is also noteworthy
that in the health sector PbR is predominantly to incentivise a certain quality of service, rather than
to reimburse the cost of provision of a service (which covered under a grant). The quality of service
can either be incentivised through upside incentives (‘carrot and carrot’) or by a payment deduction
(‘carrot and stick’), see Box below.
Box 2: Lessons from the health sector on incentivising ‘quality’ performance using PbR
In the health sector, incentivising performance has been increasingly linked to rewarding a certain quality of service, rather than rewarding only the provision of a service. Quantifiable quality checklists are needed which measure and reward specific components of quality. Such checklists are context-specific and can relate to the process of implementation as well as the quality of the service delivered.
In the health sector two different approaches have been used to incentivise quality performance through PbR:
The carrot-and-carrot method consists of purchasing services and adding a bonus (for example, up to 25%) for the quality performance.
The carrot-and-stick method entails purchasing services but detracting money in the case of bad quality performance. When using this method, one can inflate the carrots a bit, thereby ensuring a certain effect on the quality factor.
Experience from the health sector offers the following lessons:
The carrot-and-carrot method is more advisable where the implementing agencies have limited access to alternative sources of funds and may face cash flow issues.
Baseline levels of quality make a difference to the effectiveness of either approach: When implementation quality is already fairly high at baseline, the carrot-and-stick method is more effective at rewarding the best-performing implementing agencies or facilities. When quality is low at baseline, the carrot-and-carrot method better protects basic implementing agencies’ income while penalising low-quality implementing agencies.
The health sector has developed a whole series of quantifiable quality checklists and scorecards for assessing service provision. Essential lessons are that the quality criteria need to be realistic (monitoring data can be collected) and objectively verifiable. Quality checklists should also be updated regularly to incorporate lessons learned and to allow quality standards to be set progressively higher.
[Adapted from: Fritsche (2014)]
2.4 How the context influenced evaluation design
There are several ways in which the context outlined in Sections 2.1 and 2.3 influenced the
evaluation design. At its core, the evaluation was designed around case studies of all suppliers, to
ensure comprehensive coverage, as well as to examine implementation in diverse country
contexts. Case studies allowed us to not only to observe the extent to which change has occurred,
but also to produce an account as to why and how this change was brought about, thereby
improving the explanatory power of the evaluation.
38 DFID (2014) ‘Sharpening incentives to perform: DFID’s strategy for payment by results’. Available at:
https://assets.publishing.service.gov.uk/government/uploads/system/uploads/attachment_data/file/323868/Sharpening_incentives_to_perform_DFIDs_Strategy_on_Payment_by_Results.pdf
39 SIDA (2015) ‘Results Based Financing Approaches (RBFA) – what are they?’ Available at: www.sida.se/contentassets/1b13c3b7a75947a2a4487e2b0f61267c/18235.pdf
Evaluation of WASH Results Programme Endline Synthesis Report
e-Pact 13
Given that PbR is still relatively new in the WASH sector – and given that the WASH Results
Programme was the first large-scale DFID programme funded through a PbR mechanism – the
evaluation focused on the circumstances under which PbR was effective in WASH programming,
in order to be able to inform DFID’s programming and the sector more widely. Contribution
analysis was seen at the most appropriate methodological framework for teasing out these
circumstances.
In the absence of a consensus on how to assess sustainability in WASH, and on which are the
most likely pathways to impact, the evaluation used a risk-based framework to score various
prerequisites for sustainability and for impacts manifesting.
Annex B explains in detail the methodological framework, types of evaluation activities, and the
evaluation case studies undertaken.
2.5 Origins of the WASH Results Programme
The concept of the WASH Results Programme was born out of the UK’s pledge, made by the then
Secretary of State for International Development, Andrew Mitchell, in April 2012, to contribute to
global MDG commitments by ensuring that 60 million additional people gained access to WASH
services by December 2015 (DFID 2014c). A secondary, but important, driver of the programme
was DFID’s desire to expand its base of potential large-scale WASH providers.40
Starting in 2013, DFID published the business case for the WASH Results Programme,41 one year
prior to DFID’s publication of its strategy for PbR42. The business case recognised that a WASH
development programme of this size based on a PbR mechanism would be a risk for both DFID
and potential suppliers, who would be inexperienced in its management and implementation, but
that it would provide a valuable opportunity to generate evidence on the use of PbR in the WASH
development sector.
DFID engaged in a competitive tender process for the WASH Results Programme to cover an
estimated shortfall in beneficiary numbers anticipated from existing programmes to meet the UK’s
MDG commitment.43 Several different funding modalities were considered in the business case.44
As part of an ongoing dialogue, DFID met with potential bidders in July 2013, announcing up to five
‘large results contracts’ and the plan to include a PbR element.45 Box 3 below gives an overview of
DFID’s definitions of PbR.
40 This entire subsection has been adapted from the midline evaluation report. 41 DFID (2013) ‘Business Case and Intervention Summary: Water, Sanitation and Hygiene (WASH) Results Programme’.
Available at: https://devtracker.dfid.gov.uk/projects/GB-1-203572/documents 42 DFID (2014) ‘Sharpening incentives to perform: DFID’s Strategy for Payment by results’. Available at:
https://assets.publishing.service.gov.uk/government/uploads/system/uploads/attachment_data/file/323868/Sharpening_incentives_to_perform_DFIDs_Strategy_on_Payment_by_Results.pdf
43 In June 2013, DFID was still describing the programme as a five-year ‘Results Challenge Fund’. 44 The business case was approved in August 2013. 45 Suppliers had already begun developing their consortiums before the PbR element was announced.
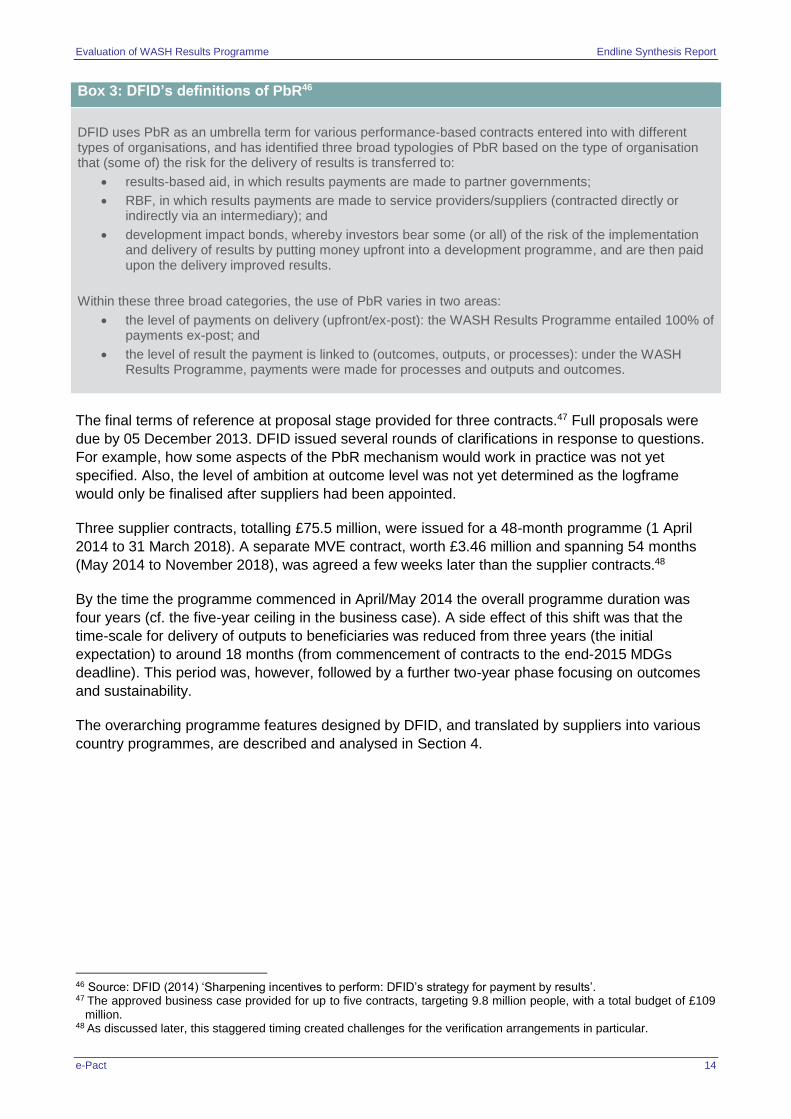
Evaluation of WASH Results Programme Endline Synthesis Report
e-Pact 14
Box 3: DFID’s definitions of PbR46
DFID uses PbR as an umbrella term for various performance-based contracts entered into with different types of organisations, and has identified three broad typologies of PbR based on the type of organisation that (some of) the risk for the delivery of results is transferred to:
results-based aid, in which results payments are made to partner governments;
RBF, in which results payments are made to service providers/suppliers (contracted directly or indirectly via an intermediary); and
development impact bonds, whereby investors bear some (or all) of the risk of the implementation and delivery of results by putting money upfront into a development programme, and are then paid upon the delivery improved results.
Within these three broad categories, the use of PbR varies in two areas:
the level of payments on delivery (upfront/ex-post): the WASH Results Programme entailed 100% of payments ex-post; and
the level of result the payment is linked to (outcomes, outputs, or processes): under the WASH Results Programme, payments were made for processes and outputs and outcomes.
The final terms of reference at proposal stage provided for three contracts.47 Full proposals were
due by 05 December 2013. DFID issued several rounds of clarifications in response to questions.
For example, how some aspects of the PbR mechanism would work in practice was not yet
specified. Also, the level of ambition at outcome level was not yet determined as the logframe
would only be finalised after suppliers had been appointed.
Three supplier contracts, totalling £75.5 million, were issued for a 48-month programme (1 April
2014 to 31 March 2018). A separate MVE contract, worth £3.46 million and spanning 54 months
(May 2014 to November 2018), was agreed a few weeks later than the supplier contracts.48
By the time the programme commenced in April/May 2014 the overall programme duration was
four years (cf. the five-year ceiling in the business case). A side effect of this shift was that the
time-scale for delivery of outputs to beneficiaries was reduced from three years (the initial
expectation) to around 18 months (from commencement of contracts to the end-2015 MDGs
deadline). This period was, however, followed by a further two-year phase focusing on outcomes
and sustainability.
The overarching programme features designed by DFID, and translated by suppliers into various
country programmes, are described and analysed in Section 4.
46 Source: DFID (2014) ‘Sharpening incentives to perform: DFID’s strategy for payment by results’. 47 The approved business case provided for up to five contracts, targeting 9.8 million people, with a total budget of £109
million. 48 As discussed later, this staggered timing created challenges for the verification arrangements in particular.
Evaluation of WASH Results Programme Endline Synthesis Report
e-Pact 15
3 Overview of the WASH Results Programme
This section sets out the key features of the WASH Results Programme, which had a four-year
implementation period (April 2014 to March 2018).49 It describes the key design features set by
DFID, and then explains how these parameters were interpreted by each of the suppliers, which
implemented activities across 12 countries.50
The programme consisted of a hierarchy of three nested designs:
DFID’s overall programme design was described in its business case, terms of reference,
and procurement documentation (together with ad hoc clarifications of these documents). This
is the highest and most general level of the design, and is outlined in Section 3.1.1.3 below.
The DFID programme design period covered the initial programme conception in 2012 through
to the issuing of tender documentation in the second half of 2013.
Each of the contracted suppliers proposed their own programme designs and results
frameworks, two of which related to only two countries51 (SWIFT and SAWRP), and one of
which (SSH4A) was implemented in eight countries.52 This is the second level of programme
design and is also described later in this section. The supplier programme design period
covered late 2013 to the completion of contract negotiations in April 2014.
For each supplier, the design of the programme varied by consortium membership,
programme components, and country. This represents a third level of detail, which, together
with the differences between country-level implementing partners, provides further context for
the evaluation findings set out in Section 4. The period covered by this design phase was that
of the programme implementation, namely April 2014 to March 2018. This level is summarised
in Vols. 2.1-2.3, covering each of the three suppliers separately.
3.1 DFID’s overall programme design
The WASH Results Programme is described by DFID as an ‘innovative global portfolio fund’. The
overall programme objective was to deliver sustainable access to clean drinking water sources,
improved sanitation facilities, and hygiene promotion activities to 4.5 million people, as per DFID’s
commitment to achieving the MDG targets. See Table 5 for the specific programmatic targets.
49 This entire section is adapted from the midline evaluation report. 50 Liberia was dropped from the original programme in 2014. 51 SWIFT originally included a third country - Liberia – the programme was suspended there and later terminated due to
the Ebola crisis. 52 SSH4A originally included South Sudan which was ultimately dropped in 2016 due to the fragile state context.
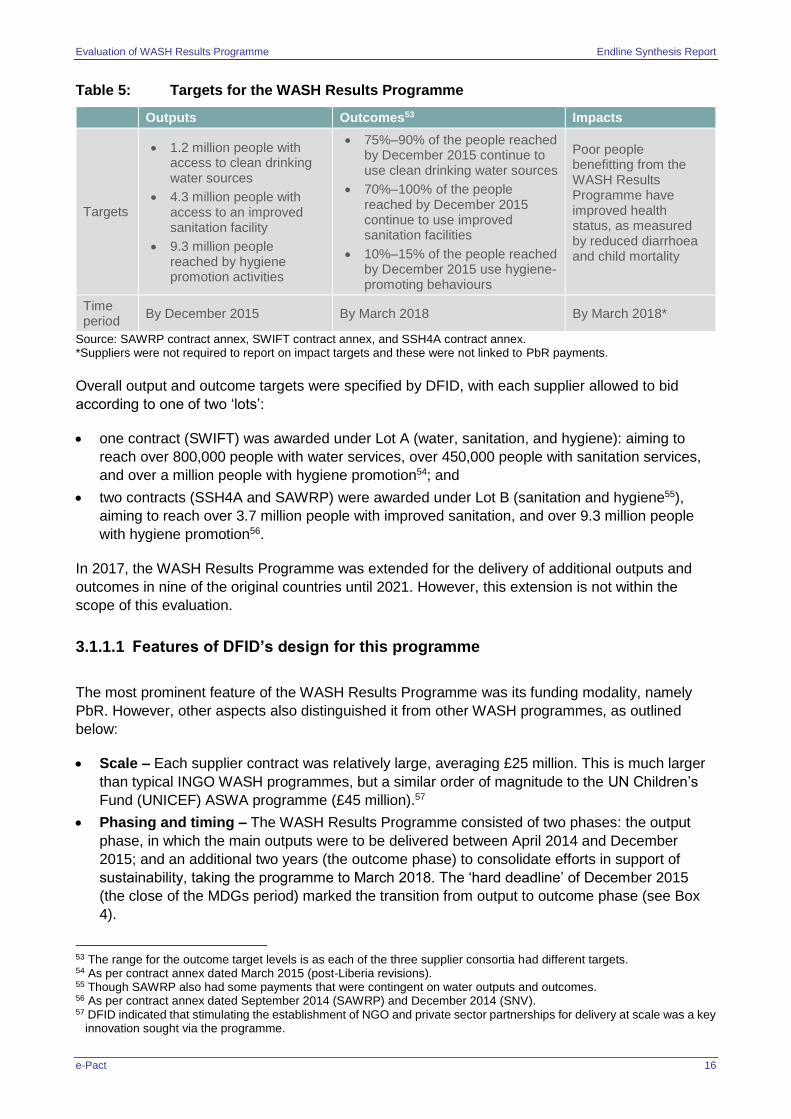
Evaluation of WASH Results Programme Endline Synthesis Report
e-Pact 16
Table 5: Targets for the WASH Results Programme
Outputs Outcomes53 Impacts
Targets
1.2 million people with access to clean drinking water sources
4.3 million people with access to an improved sanitation facility
9.3 million people reached by hygiene promotion activities
75%–90% of the people reached by December 2015 continue to use clean drinking water sources
70%–100% of the people reached by December 2015 continue to use improved sanitation facilities
10%–15% of the people reached by December 2015 use hygiene-promoting behaviours
Poor people benefitting from the WASH Results Programme have improved health status, as measured by reduced diarrhoea and child mortality
Time period
By December 2015 By March 2018 By March 2018*
Source: SAWRP contract annex, SWIFT contract annex, and SSH4A contract annex. *Suppliers were not required to report on impact targets and these were not linked to PbR payments.
Overall output and outcome targets were specified by DFID, with each supplier allowed to bid
according to one of two ‘lots’:
one contract (SWIFT) was awarded under Lot A (water, sanitation, and hygiene): aiming to
reach over 800,000 people with water services, over 450,000 people with sanitation services,
and over a million people with hygiene promotion54; and
two contracts (SSH4A and SAWRP) were awarded under Lot B (sanitation and hygiene55),
aiming to reach over 3.7 million people with improved sanitation, and over 9.3 million people
with hygiene promotion56.
In 2017, the WASH Results Programme was extended for the delivery of additional outputs and
outcomes in nine of the original countries until 2021. However, this extension is not within the
scope of this evaluation.
3.1.1.1 Features of DFID’s design for this programme
The most prominent feature of the WASH Results Programme was its funding modality, namely
PbR. However, other aspects also distinguished it from other WASH programmes, as outlined
below:
Scale – Each supplier contract was relatively large, averaging £25 million. This is much larger
than typical INGO WASH programmes, but a similar order of magnitude to the UN Children’s
Fund (UNICEF) ASWA programme (£45 million).57
Phasing and timing – The WASH Results Programme consisted of two phases: the output
phase, in which the main outputs were to be delivered between April 2014 and December
2015; and an additional two years (the outcome phase) to consolidate efforts in support of
sustainability, taking the programme to March 2018. The ‘hard deadline’ of December 2015
(the close of the MDGs period) marked the transition from output to outcome phase (see Box
4).
53 The range for the outcome target levels is as each of the three supplier consortia had different targets. 54 As per contract annex dated March 2015 (post-Liberia revisions). 55 Though SAWRP also had some payments that were contingent on water outputs and outcomes. 56 As per contract annex dated September 2014 (SAWRP) and December 2014 (SNV). 57 DFID indicated that stimulating the establishment of NGO and private sector partnerships for delivery at scale was a key
innovation sought via the programme.
Evaluation of WASH Results Programme Endline Synthesis Report
e-Pact 17
The PbR financing modality – Payments to suppliers were triggered by the independently
verified delivery of pre-specified ‘results’ (key activities, outputs, and outcomes). Details of the
PbR modality are provided in Section 4.1.2. This financing modality is relatively unusual in the
WASH sector, especially for software-based interventions, though it is more common for urban
hardware interventions; it was quite unusual for DFID’s WASH portfolio: the WASH Results
Programme was DFID’s first 100% PbR programme in the WASH sector.
MV – The MV component was a vital element of the PbR model, as it was responsible for
independently verifying the suppliers’ delivery of the contractually specified ‘results’, which in
turn triggered payment from DFID.
Impact – The theory of change identified improved health, specifically in relation to diarrhoea
and under-five mortality, as the ultimate goal of the programme. However, DFID’s design,
allowing suppliers’ flexibility in implementation approach, expressed no preference for
implementation strategy – for example, there was no specific requirement to implement a
geographically-focused programme or to work towards ODF communities. Health
achievements were not reported on or verified, and were not linked to any PbR payments.
Box 4: Phasing and timing in the global design
Two comments are made here in regard to the phasing and timing of the programme.
First, the MDGs deadline was the determining feature of the programme structure as the numerical beneficiary targets had to be achieved by December 2015 to meet the UK’s commitments. During preliminary consultations, having a second phase to consolidate efforts in support of sustainability was seen by some stakeholders as counter to good practice; they argued that sustainability should be addressed from the outset in order to have a realistic chance of being realised.
DFID articulated that the inclusion of a post-implementation phase (‘outcome phase’) was an innovative and positive design feature. DFID also expected that measures in support of sustainability should feature in plans and operations from the start of each project. Additionally, having a dedicated outcome phase was expected to allow extra time and resources to be spent to consolidate sustainability measures introduced during the output phase.
Second, as the programme design and procurement period extended beyond early expectations, the implementation period shortened, from five years to four.
(Adapted from the midline evaluation report.)
DFID technical guidance states that ‘if designed and delivered well, potential benefits of PbR
include: improved efficiency and effectiveness of delivery from the sharpened incentives in a PbR
contract (paying once results are delivered rather than upfront); Increased potential for innovation
and flexibility in delivery through not specifying how to achieve results; Increased transparency and
accountability for results; and a stronger focus on performance’ (DFID 2014b).
The PbR model was expected to allow suppliers freedom to design and implement their own
approaches, so long as the agreed results were delivered. Whilst not explicitly required in the
contract, there were also some underlying expectations about how this would be manifested:58
Innovative private sector partnerships. As per the business case, there was an expectation
that ‘innovative’ private sector partnerships would lead to important learning, especially for
NGO partners. Refer to Section 3.2.1 for an overview of the implementing consortia.
Innovative interventions. The business case also noted an expectation that the PbR modality
would foster innovative interventions as suppliers would be free to employ whatever
58 Each of these themes is further elaborated upon in the midline evaluation report.
Evaluation of WASH Results Programme Endline Synthesis Report
e-Pact 18
approaches they wanted to in order to achieve their results targets.59 Further information on
how this dynamic manifested itself by supplier is given in Section 4.2.5.
Sustainability. All guiding documentation for the programme emphasised sustainability,
acknowledging the importance of services and behaviour changes standing the test of time.
The midline noted that sustainability was explicitly built into the programme design in so much
as the PbR payment being linked to outcomes incentivised the sustaining of an agreed level of
results at least until programme end. However, linking prerequisites for sustainably to
payments was not explicitly required by the design (although suppliers were free to do so).
Findings relating to variations in sustainability approaches by suppliers, as well as prospects
for sustainability, are given in Section 4.5.
Inclusiveness or equity. The business case specified that suppliers must ‘accurately target
their interventions at the poorest communities and, more specifically, the poorest groups within
these communities’. While the overall programme design prioritised equity and inclusion, like
sustainability it was not required that these elements be built into the payment criteria agreed
between DFID and each supplier.
Learning. As the use of PbR in WASH was still relatively novel, DFID indicated that ongoing
learning and course correction was intended to be a key part of the programme.
Box 5 below provides further detail on the theory behind PbR incentives.
Box 5: Theory behind PbR incentives
The underlying rationale for PbR first assumes that the financial incentive provided by PbR is needed by those contracted to deliver under this arrangement (and that it will therefore incentivise them). Secondly, it assumes that the indicators are correct proxies for the outcomes that are desired, can be accurately measured, and are within the control of the agent to affect (Witter et al. 2012). Thirdly, it assumes that suppliers have systems that are capable of responding to, and acting on, the incentives created under a PbR modality (Perrin 2013). Fourthly, it is also assumed that implementation processes are sufficiently flexible that they can be modified to optimise delivery, within the timeframe of each verification cycle.
By not specifying how results should be achieved, it is assumed that suppliers can adjust implementation processes to improve outcomes (Birdsall and Savedoff 2010, Bertone and Meesen 2013). Furthermore, there is an implicit assumption that suppliers have sufficient skills and capacity to monitor progress sufficiently accurately and sufficiently frequently to identify trends in performance and identify the underlying drivers, and that they have effective management systems in place which can adjust implementation processes in response to this learning (improved performance management; Birdsall and Savedoff 2010, Bertone and Meesen 2013).
[Text adapted from midline evaluation report]
3.1.1.2 The MVE role
As the separate MVE provider, Itad (of the e-PACT consortium) was hired to:
‘design and implement a system of third-party results verification (including working with
Suppliers to define measurement methods and monitoring, verification and reporting
requirements for payment) for those parts of projects operating under a Payment by
Results framework. This will be used to verify results and outputs to inform payments. The
MVE provider will audit contractors’ results reporting within the contract terms related to
payment by results.’
59 The evaluators note that there is a potential confusion between innovation as something new or different, and flexibility
within an overall guiding framework.
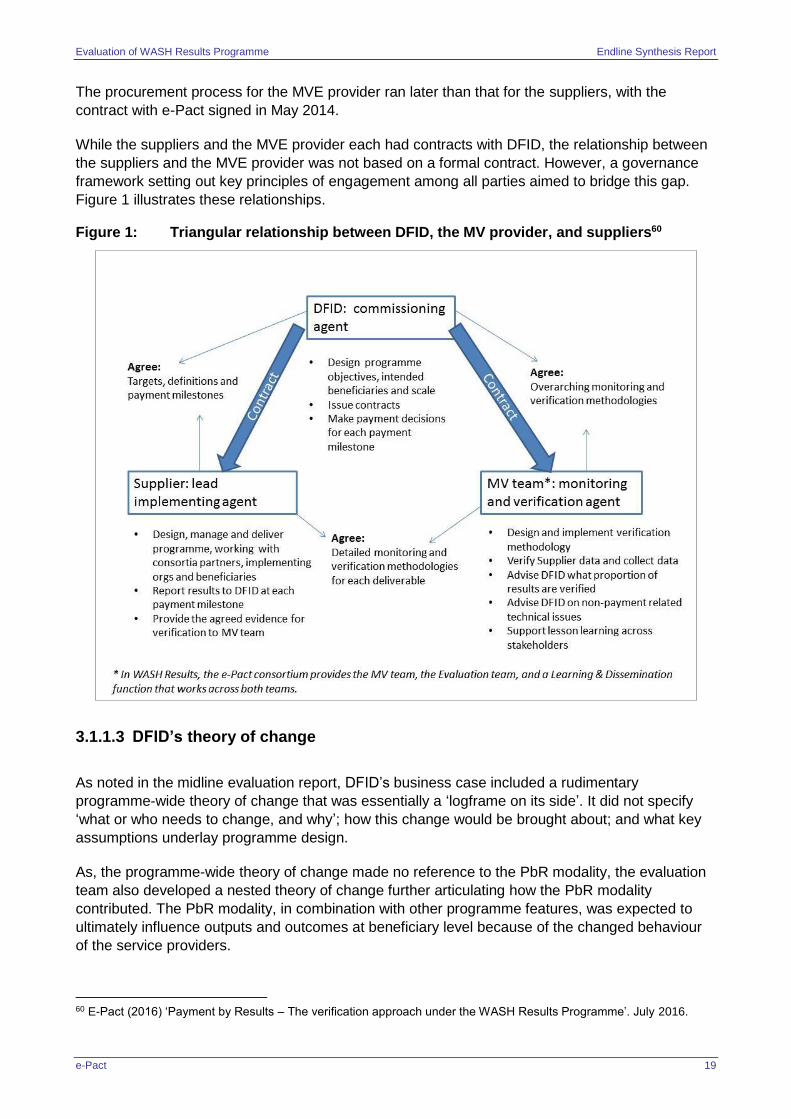
Evaluation of WASH Results Programme Endline Synthesis Report
e-Pact 19
The procurement process for the MVE provider ran later than that for the suppliers, with the
contract with e-Pact signed in May 2014.
While the suppliers and the MVE provider each had contracts with DFID, the relationship between
the suppliers and the MVE provider was not based on a formal contract. However, a governance
framework setting out key principles of engagement among all parties aimed to bridge this gap.
Figure 1 illustrates these relationships.
Figure 1: Triangular relationship between DFID, the MV provider, and suppliers60
3.1.1.3 DFID’s theory of change
As noted in the midline evaluation report, DFID’s business case included a rudimentary
programme-wide theory of change that was essentially a ‘logframe on its side’. It did not specify
‘what or who needs to change, and why’; how this change would be brought about; and what key
assumptions underlay programme design.
As, the programme-wide theory of change made no reference to the PbR modality, the evaluation
team also developed a nested theory of change further articulating how the PbR modality
contributed. The PbR modality, in combination with other programme features, was expected to
ultimately influence outputs and outcomes at beneficiary level because of the changed behaviour
of the service providers.
60 E-Pact (2016) ‘Payment by Results – The verification approach under the WASH Results Programme’. July 2016.
Evaluation of WASH Results Programme Endline Synthesis Report
e-Pact 20
The way the programme was implemented differed significantly by supplier, but no theories of
change were developed by DFID at the sub-programme level61. The focus instead was placed on
the supplier-specific results frameworks against which payments were made. The results
frameworks had a high profile in programme operations and in practice the theory of change was
not a key point of reference either for DFID or the suppliers.62
Refer to Annex C for the full critique of the theory of change that was conducted during the midline
evaluation. This includes updates discussed with DFID at that time, as well as the nested PbR
theory of change. The evidence uncovered during the endline evaluation led to only minor updates
to the PbR theory of change.
3.2 SWIFT
This section provides only a brief overview of the SWIFT sub-programme; a more detailed
discussion of SWIFT implementation and the country contexts is in the supplier case study (Vol.
2.1).
3.2.1 Implementing organisations
The SWIFT consortium was led by Oxfam GB and included Tearfund and the ODI, which led on
monitoring, evaluation, and learning. At country level the implementing partners were INGOs and
included Concern Worldwide, Sanergy, WSUP, BBC Media Action, Practical Action, and Africa
Ahead. SWIFT operated in DRC and Kenya; Liberia was initially targeted but was terminated in
2014 due to constraints related to the Ebola crisis. This consortium had the largest number of
implementing partners and was managed through national consortium managers sitting within
Oxfam Kenya and Oxfam DRC.
3.2.2 Supplier targets
Table 6 outlines the deliverables as per the contract. SWIFT’s payment packages were made up of
a series of 12 deliverables that were assessed at different points of the programme for the various
suppliers.
61 SWIFT was the only supplier to submit country-level theories of change. 62 See Midline Evaluation Report
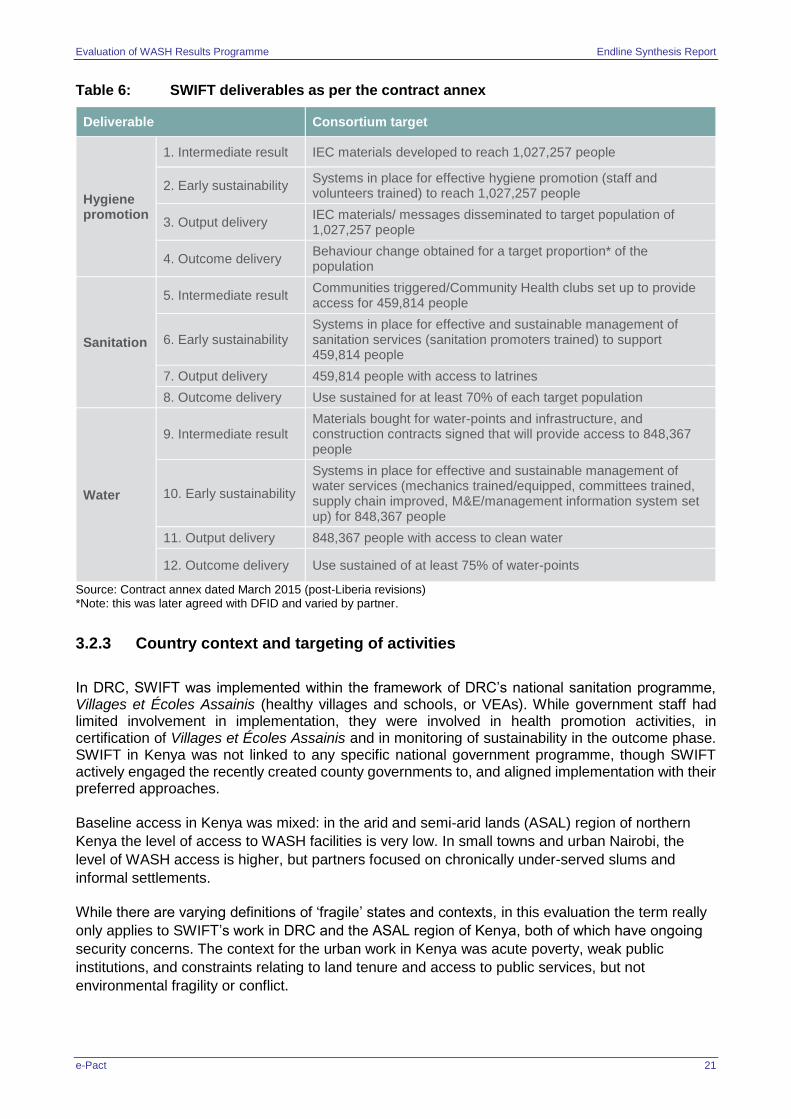
Evaluation of WASH Results Programme Endline Synthesis Report
e-Pact 21
Table 6: SWIFT deliverables as per the contract annex
Deliverable Consortium target
Hygiene promotion
1. Intermediate result IEC materials developed to reach 1,027,257 people
2. Early sustainability Systems in place for effective hygiene promotion (staff and volunteers trained) to reach 1,027,257 people
3. Output delivery IEC materials/ messages disseminated to target population of 1,027,257 people
4. Outcome delivery Behaviour change obtained for a target proportion* of the population
Sanitation
5. Intermediate result Communities triggered/Community Health clubs set up to provide access for 459,814 people
6. Early sustainability Systems in place for effective and sustainable management of sanitation services (sanitation promoters trained) to support 459,814 people
7. Output delivery 459,814 people with access to latrines
8. Outcome delivery Use sustained for at least 70% of each target population
Water
9. Intermediate result Materials bought for water-points and infrastructure, and construction contracts signed that will provide access to 848,367 people
10. Early sustainability
Systems in place for effective and sustainable management of water services (mechanics trained/equipped, committees trained, supply chain improved, M&E/management information system set up) for 848,367 people
11. Output delivery 848,367 people with access to clean water
12. Outcome delivery Use sustained of at least 75% of water-points
Source: Contract annex dated March 2015 (post-Liberia revisions) *Note: this was later agreed with DFID and varied by partner.
3.2.3 Country context and targeting of activities
In DRC, SWIFT was implemented within the framework of DRC’s national sanitation programme, Villages et Écoles Assainis (healthy villages and schools, or VEAs). While government staff had limited involvement in implementation, they were involved in health promotion activities, in certification of Villages et Écoles Assainis and in monitoring of sustainability in the outcome phase. SWIFT in Kenya was not linked to any specific national government programme, though SWIFT actively engaged the recently created county governments to, and aligned implementation with their preferred approaches.
Baseline access in Kenya was mixed: in the arid and semi-arid lands (ASAL) region of northern
Kenya the level of access to WASH facilities is very low. In small towns and urban Nairobi, the
level of WASH access is higher, but partners focused on chronically under-served slums and
informal settlements.
While there are varying definitions of ‘fragile’ states and contexts, in this evaluation the term really
only applies to SWIFT’s work in DRC and the ASAL region of Kenya, both of which have ongoing
security concerns. The context for the urban work in Kenya was acute poverty, weak public
institutions, and constraints relating to land tenure and access to public services, but not
environmental fragility or conflict.
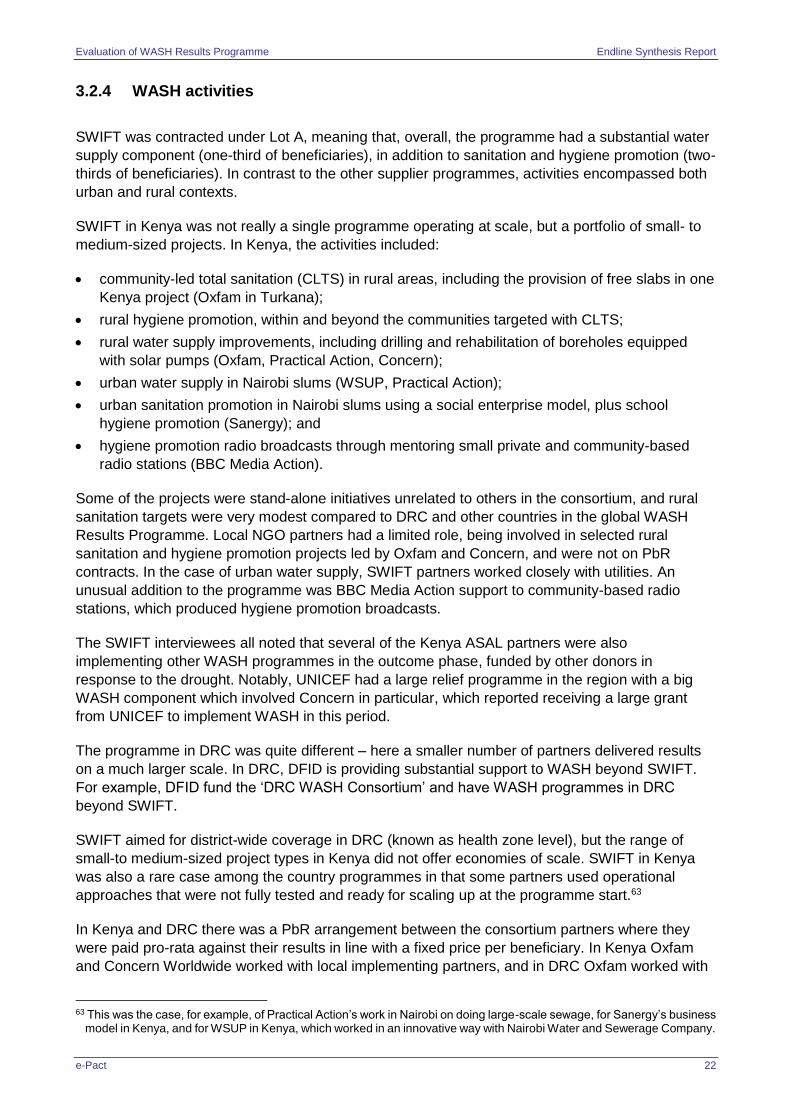
Evaluation of WASH Results Programme Endline Synthesis Report
e-Pact 22
3.2.4 WASH activities
SWIFT was contracted under Lot A, meaning that, overall, the programme had a substantial water
supply component (one-third of beneficiaries), in addition to sanitation and hygiene promotion (two-
thirds of beneficiaries). In contrast to the other supplier programmes, activities encompassed both
urban and rural contexts.
SWIFT in Kenya was not really a single programme operating at scale, but a portfolio of small- to
medium-sized projects. In Kenya, the activities included:
community-led total sanitation (CLTS) in rural areas, including the provision of free slabs in one
Kenya project (Oxfam in Turkana);
rural hygiene promotion, within and beyond the communities targeted with CLTS;
rural water supply improvements, including drilling and rehabilitation of boreholes equipped
with solar pumps (Oxfam, Practical Action, Concern);
urban water supply in Nairobi slums (WSUP, Practical Action);
urban sanitation promotion in Nairobi slums using a social enterprise model, plus school
hygiene promotion (Sanergy); and
hygiene promotion radio broadcasts through mentoring small private and community-based
radio stations (BBC Media Action).
Some of the projects were stand-alone initiatives unrelated to others in the consortium, and rural
sanitation targets were very modest compared to DRC and other countries in the global WASH
Results Programme. Local NGO partners had a limited role, being involved in selected rural
sanitation and hygiene promotion projects led by Oxfam and Concern, and were not on PbR
contracts. In the case of urban water supply, SWIFT partners worked closely with utilities. An
unusual addition to the programme was BBC Media Action support to community-based radio
stations, which produced hygiene promotion broadcasts.
The SWIFT interviewees all noted that several of the Kenya ASAL partners were also
implementing other WASH programmes in the outcome phase, funded by other donors in
response to the drought. Notably, UNICEF had a large relief programme in the region with a big
WASH component which involved Concern in particular, which reported receiving a large grant
from UNICEF to implement WASH in this period.
The programme in DRC was quite different – here a smaller number of partners delivered results
on a much larger scale. In DRC, DFID is providing substantial support to WASH beyond SWIFT.
For example, DFID fund the ‘DRC WASH Consortium’ and have WASH programmes in DRC
beyond SWIFT.
SWIFT aimed for district-wide coverage in DRC (known as health zone level), but the range of
small-to medium-sized project types in Kenya did not offer economies of scale. SWIFT in Kenya
was also a rare case among the country programmes in that some partners used operational
approaches that were not fully tested and ready for scaling up at the programme start.63
In Kenya and DRC there was a PbR arrangement between the consortium partners where they
were paid pro-rata against their results in line with a fixed price per beneficiary. In Kenya Oxfam
and Concern Worldwide worked with local implementing partners, and in DRC Oxfam worked with
63 This was the case, for example, of Practical Action’s work in Nairobi on doing large-scale sewage, for Sanergy’s business
model in Kenya, and for WSUP in Kenya, which worked in an innovative way with Nairobi Water and Sewerage Company.
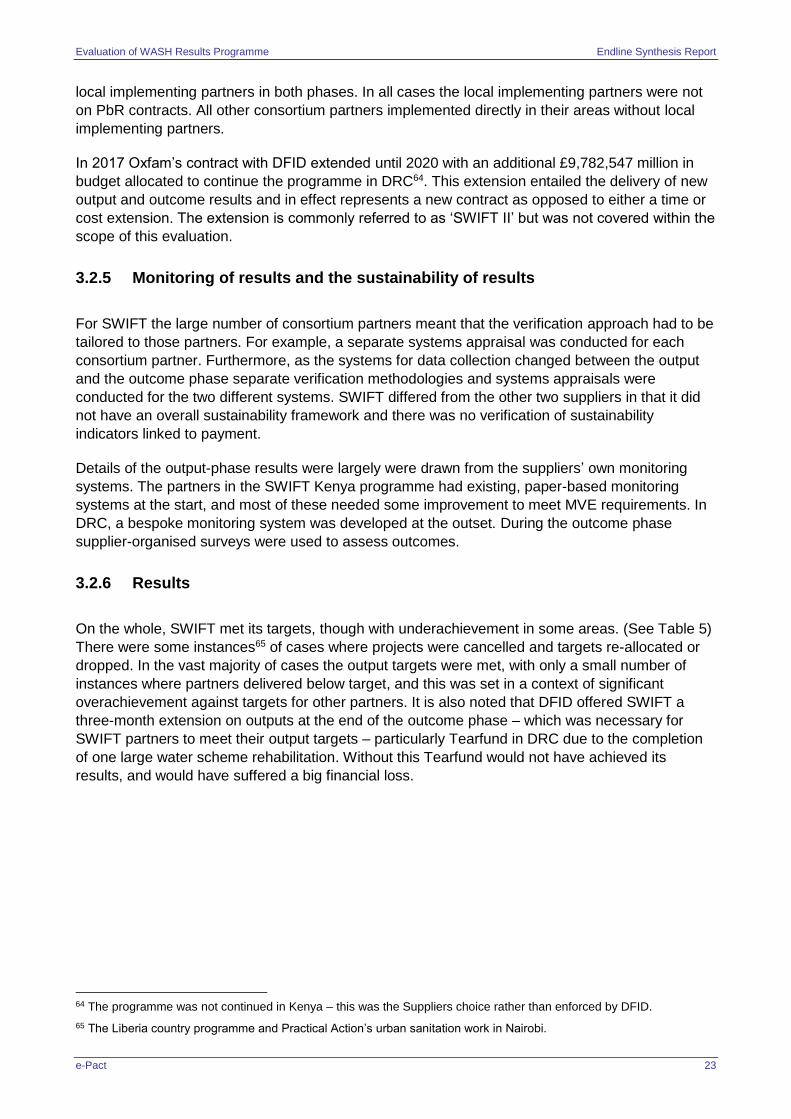
Evaluation of WASH Results Programme Endline Synthesis Report
e-Pact 23
local implementing partners in both phases. In all cases the local implementing partners were not
on PbR contracts. All other consortium partners implemented directly in their areas without local
implementing partners.
In 2017 Oxfam’s contract with DFID extended until 2020 with an additional £9,782,547 million in
budget allocated to continue the programme in DRC64. This extension entailed the delivery of new
output and outcome results and in effect represents a new contract as opposed to either a time or
cost extension. The extension is commonly referred to as ‘SWIFT II’ but was not covered within the
scope of this evaluation.
3.2.5 Monitoring of results and the sustainability of results
For SWIFT the large number of consortium partners meant that the verification approach had to be
tailored to those partners. For example, a separate systems appraisal was conducted for each
consortium partner. Furthermore, as the systems for data collection changed between the output
and the outcome phase separate verification methodologies and systems appraisals were
conducted for the two different systems. SWIFT differed from the other two suppliers in that it did
not have an overall sustainability framework and there was no verification of sustainability
indicators linked to payment.
Details of the output-phase results were largely were drawn from the suppliers’ own monitoring
systems. The partners in the SWIFT Kenya programme had existing, paper-based monitoring
systems at the start, and most of these needed some improvement to meet MVE requirements. In
DRC, a bespoke monitoring system was developed at the outset. During the outcome phase
supplier-organised surveys were used to assess outcomes.
3.2.6 Results
On the whole, SWIFT met its targets, though with underachievement in some areas. (See Table 5)
There were some instances65 of cases where projects were cancelled and targets re-allocated or
dropped. In the vast majority of cases the output targets were met, with only a small number of
instances where partners delivered below target, and this was set in a context of significant
overachievement against targets for other partners. It is also noted that DFID offered SWIFT a
three-month extension on outputs at the end of the outcome phase – which was necessary for
SWIFT partners to meet their output targets – particularly Tearfund in DRC due to the completion
of one large water scheme rehabilitation. Without this Tearfund would not have achieved its
results, and would have suffered a big financial loss.
64 The programme was not continued in Kenya – this was the Suppliers choice rather than enforced by DFID.
65 The Liberia country programme and Practical Action’s urban sanitation work in Nairobi.
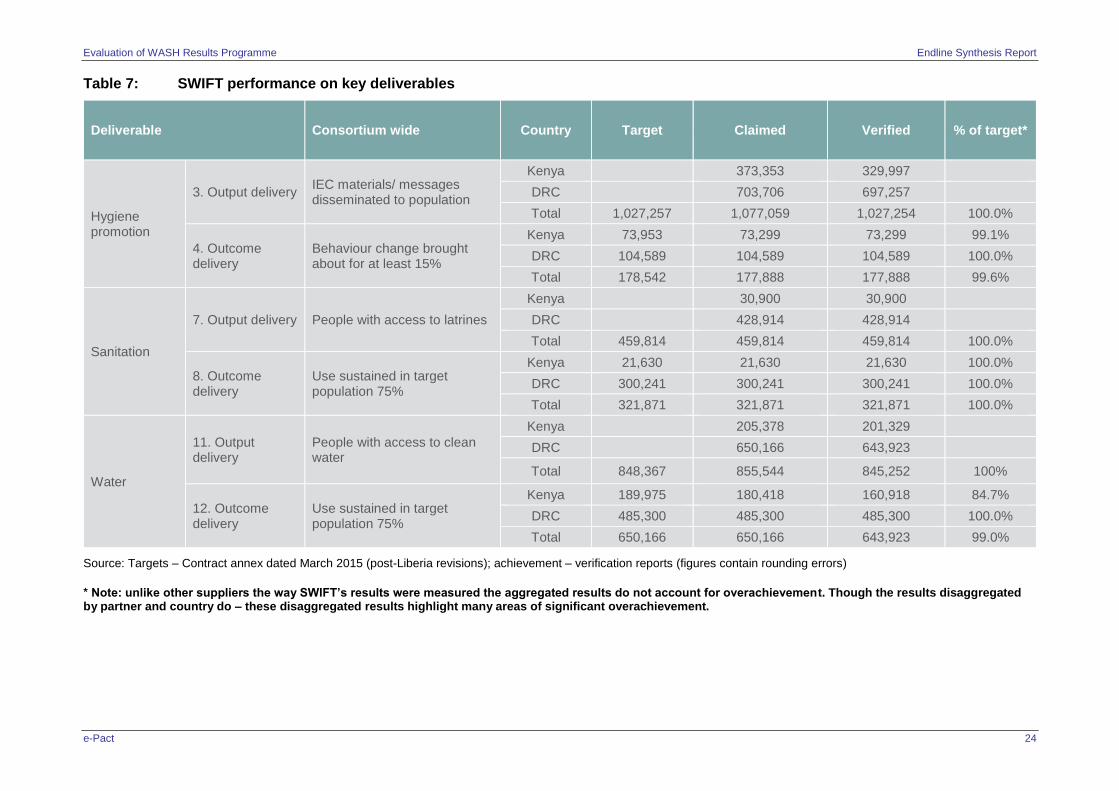
Evaluation of WASH Results Programme Endline Synthesis Report
e-Pact 24
Table 7: SWIFT performance on key deliverables
Deliverable Consortium wide Country Target Claimed Verified % of target*
Hygiene promotion
3. Output delivery IEC materials/ messages disseminated to population
Kenya 373,353 329,997
DRC 703,706 697,257
Total 1,027,257 1,077,059 1,027,254 100.0%
4. Outcome delivery
Behaviour change brought about for at least 15%
Kenya 73,953 73,299 73,299 99.1%
DRC 104,589 104,589 104,589 100.0%
Total 178,542 177,888 177,888 99.6%
Sanitation
7. Output delivery People with access to latrines
Kenya 30,900 30,900
DRC 428,914 428,914
Total 459,814 459,814 459,814 100.0%
8. Outcome delivery
Use sustained in target population 75%
Kenya 21,630 21,630 21,630 100.0%
DRC 300,241 300,241 300,241 100.0%
Total 321,871 321,871 321,871 100.0%
Water
11. Output delivery
People with access to clean water
Kenya 205,378 201,329
DRC 650,166 643,923
Total 848,367 855,544 845,252 100%
12. Outcome delivery
Use sustained in target population 75%
Kenya 189,975 180,418 160,918 84.7%
DRC 485,300 485,300 485,300 100.0%
Total 650,166 650,166 643,923 99.0%
Source: Targets – Contract annex dated March 2015 (post-Liberia revisions); achievement – verification reports (figures contain rounding errors)
* Note: unlike other suppliers the way SWIFT’s results were measured the aggregated results do not account for overachievement. Though the results disaggregated by partner and country do – these disaggregated results highlight many areas of significant overachievement.
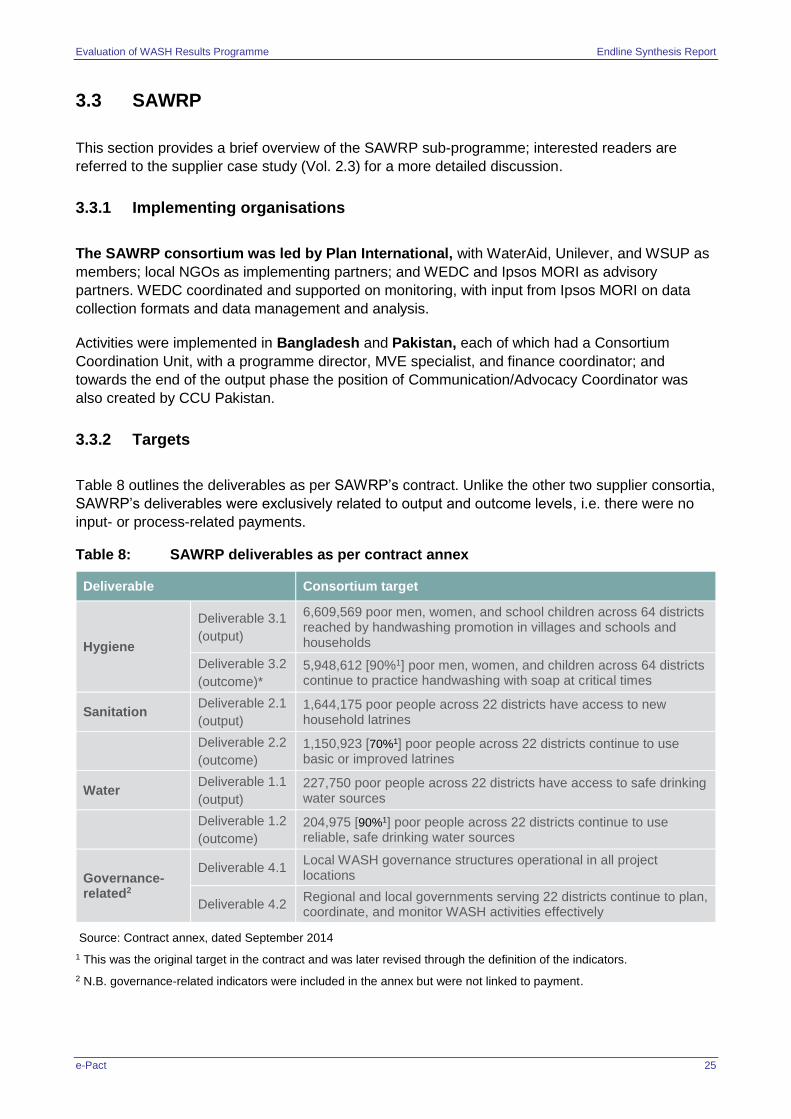
Evaluation of WASH Results Programme Endline Synthesis Report
e-Pact 25
3.3 SAWRP
This section provides a brief overview of the SAWRP sub-programme; interested readers are
referred to the supplier case study (Vol. 2.3) for a more detailed discussion.
3.3.1 Implementing organisations
The SAWRP consortium was led by Plan International, with WaterAid, Unilever, and WSUP as
members; local NGOs as implementing partners; and WEDC and Ipsos MORI as advisory
partners. WEDC coordinated and supported on monitoring, with input from Ipsos MORI on data
collection formats and data management and analysis.
Activities were implemented in Bangladesh and Pakistan, each of which had a Consortium
Coordination Unit, with a programme director, MVE specialist, and finance coordinator; and
towards the end of the output phase the position of Communication/Advocacy Coordinator was
also created by CCU Pakistan.
3.3.2 Targets
Table 8 outlines the deliverables as per SAWRP’s contract. Unlike the other two supplier consortia,
SAWRP’s deliverables were exclusively related to output and outcome levels, i.e. there were no
input- or process-related payments.
Table 8: SAWRP deliverables as per contract annex
Deliverable Consortium target
Hygiene
Deliverable 3.1
(output)
6,609,569 poor men, women, and school children across 64 districts reached by handwashing promotion in villages and schools and households
Deliverable 3.2
(outcome)*
5,948,612 [90%1] poor men, women, and children across 64 districts continue to practice handwashing with soap at critical times
Sanitation Deliverable 2.1
(output)
1,644,175 poor people across 22 districts have access to new household latrines
Deliverable 2.2
(outcome)
1,150,923 [70%1] poor people across 22 districts continue to use basic or improved latrines
Water Deliverable 1.1
(output)
227,750 poor people across 22 districts have access to safe drinking water sources
Deliverable 1.2
(outcome)
204,975 [90%1] poor people across 22 districts continue to use reliable, safe drinking water sources
Governance-related2
Deliverable 4.1 Local WASH governance structures operational in all project locations
Deliverable 4.2 Regional and local governments serving 22 districts continue to plan, coordinate, and monitor WASH activities effectively
Source: Contract annex, dated September 2014
1 This was the original target in the contract and was later revised through the definition of the indicators.
2 N.B. governance-related indicators were included in the annex but were not linked to payment.
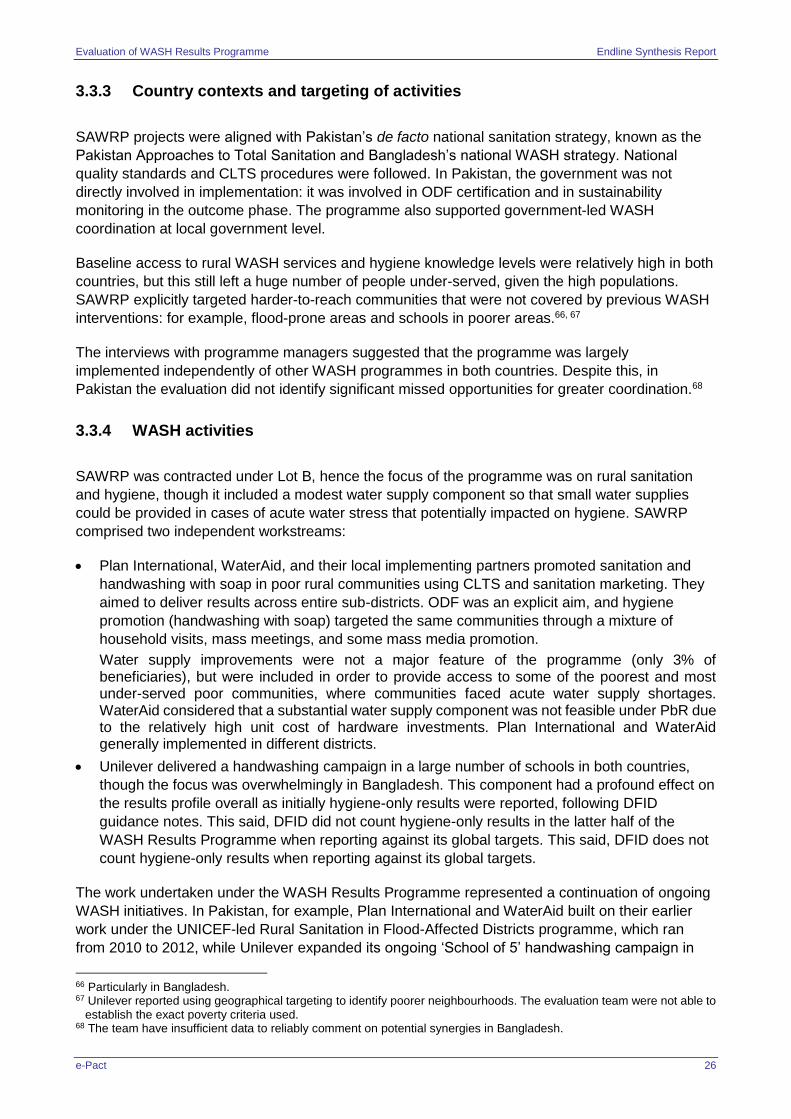
Evaluation of WASH Results Programme Endline Synthesis Report
e-Pact 26
3.3.3 Country contexts and targeting of activities
SAWRP projects were aligned with Pakistan’s de facto national sanitation strategy, known as the
Pakistan Approaches to Total Sanitation and Bangladesh’s national WASH strategy. National
quality standards and CLTS procedures were followed. In Pakistan, the government was not
directly involved in implementation: it was involved in ODF certification and in sustainability
monitoring in the outcome phase. The programme also supported government-led WASH
coordination at local government level.
Baseline access to rural WASH services and hygiene knowledge levels were relatively high in both
countries, but this still left a huge number of people under-served, given the high populations.
SAWRP explicitly targeted harder-to-reach communities that were not covered by previous WASH
interventions: for example, flood-prone areas and schools in poorer areas.66, 67
The interviews with programme managers suggested that the programme was largely
implemented independently of other WASH programmes in both countries. Despite this, in
Pakistan the evaluation did not identify significant missed opportunities for greater coordination.68
3.3.4 WASH activities
SAWRP was contracted under Lot B, hence the focus of the programme was on rural sanitation
and hygiene, though it included a modest water supply component so that small water supplies
could be provided in cases of acute water stress that potentially impacted on hygiene. SAWRP
comprised two independent workstreams:
Plan International, WaterAid, and their local implementing partners promoted sanitation and
handwashing with soap in poor rural communities using CLTS and sanitation marketing. They
aimed to deliver results across entire sub-districts. ODF was an explicit aim, and hygiene
promotion (handwashing with soap) targeted the same communities through a mixture of
household visits, mass meetings, and some mass media promotion.
Water supply improvements were not a major feature of the programme (only 3% of beneficiaries), but were included in order to provide access to some of the poorest and most under-served poor communities, where communities faced acute water supply shortages. WaterAid considered that a substantial water supply component was not feasible under PbR due to the relatively high unit cost of hardware investments. Plan International and WaterAid generally implemented in different districts.
Unilever delivered a handwashing campaign in a large number of schools in both countries,
though the focus was overwhelmingly in Bangladesh. This component had a profound effect on
the results profile overall as initially hygiene-only results were reported, following DFID
guidance notes. This said, DFID did not count hygiene-only results in the latter half of the
WASH Results Programme when reporting against its global targets. This said, DFID does not
count hygiene-only results when reporting against its global targets.
The work undertaken under the WASH Results Programme represented a continuation of ongoing
WASH initiatives. In Pakistan, for example, Plan International and WaterAid built on their earlier
work under the UNICEF-led Rural Sanitation in Flood-Affected Districts programme, which ran
from 2010 to 2012, while Unilever expanded its ongoing ‘School of 5’ handwashing campaign in
66 Particularly in Bangladesh. 67 Unilever reported using geographical targeting to identify poorer neighbourhoods. The evaluation team were not able to
establish the exact poverty criteria used. 68 The team have insufficient data to reliably comment on potential synergies in Bangladesh.
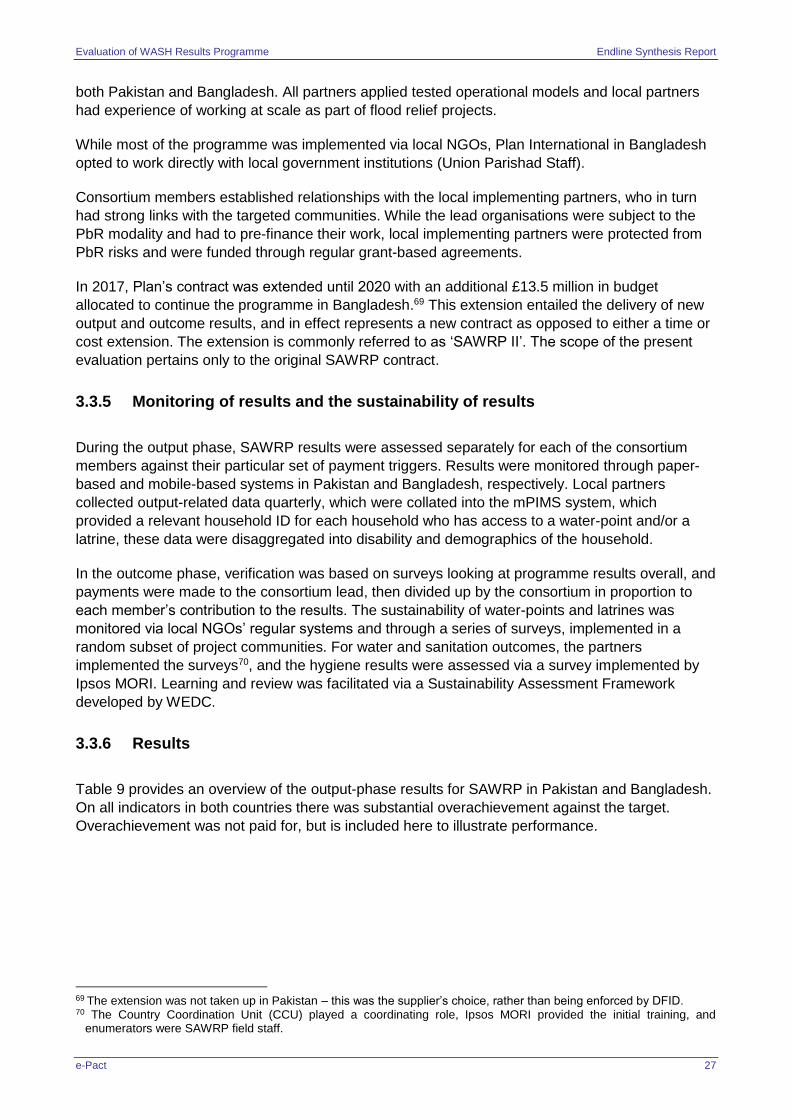
Evaluation of WASH Results Programme Endline Synthesis Report
e-Pact 27
both Pakistan and Bangladesh. All partners applied tested operational models and local partners
had experience of working at scale as part of flood relief projects.
While most of the programme was implemented via local NGOs, Plan International in Bangladesh
opted to work directly with local government institutions (Union Parishad Staff).
Consortium members established relationships with the local implementing partners, who in turn
had strong links with the targeted communities. While the lead organisations were subject to the
PbR modality and had to pre-finance their work, local implementing partners were protected from
PbR risks and were funded through regular grant-based agreements.
In 2017, Plan’s contract was extended until 2020 with an additional £13.5 million in budget
allocated to continue the programme in Bangladesh.69 This extension entailed the delivery of new
output and outcome results, and in effect represents a new contract as opposed to either a time or
cost extension. The extension is commonly referred to as ‘SAWRP II’. The scope of the present
evaluation pertains only to the original SAWRP contract.
3.3.5 Monitoring of results and the sustainability of results
During the output phase, SAWRP results were assessed separately for each of the consortium
members against their particular set of payment triggers. Results were monitored through paper-
based and mobile-based systems in Pakistan and Bangladesh, respectively. Local partners
collected output-related data quarterly, which were collated into the mPIMS system, which
provided a relevant household ID for each household who has access to a water-point and/or a
latrine, these data were disaggregated into disability and demographics of the household.
In the outcome phase, verification was based on surveys looking at programme results overall, and
payments were made to the consortium lead, then divided up by the consortium in proportion to
each member’s contribution to the results. The sustainability of water-points and latrines was
monitored via local NGOs’ regular systems and through a series of surveys, implemented in a
random subset of project communities. For water and sanitation outcomes, the partners
implemented the surveys70, and the hygiene results were assessed via a survey implemented by
Ipsos MORI. Learning and review was facilitated via a Sustainability Assessment Framework
developed by WEDC.
3.3.6 Results
Table 9 provides an overview of the output-phase results for SAWRP in Pakistan and Bangladesh.
On all indicators in both countries there was substantial overachievement against the target.
Overachievement was not paid for, but is included here to illustrate performance.
69 The extension was not taken up in Pakistan – this was the supplier’s choice, rather than being enforced by DFID. 70 The Country Coordination Unit (CCU) played a coordinating role, Ipsos MORI provided the initial training, and
enumerators were SAWRP field staff.
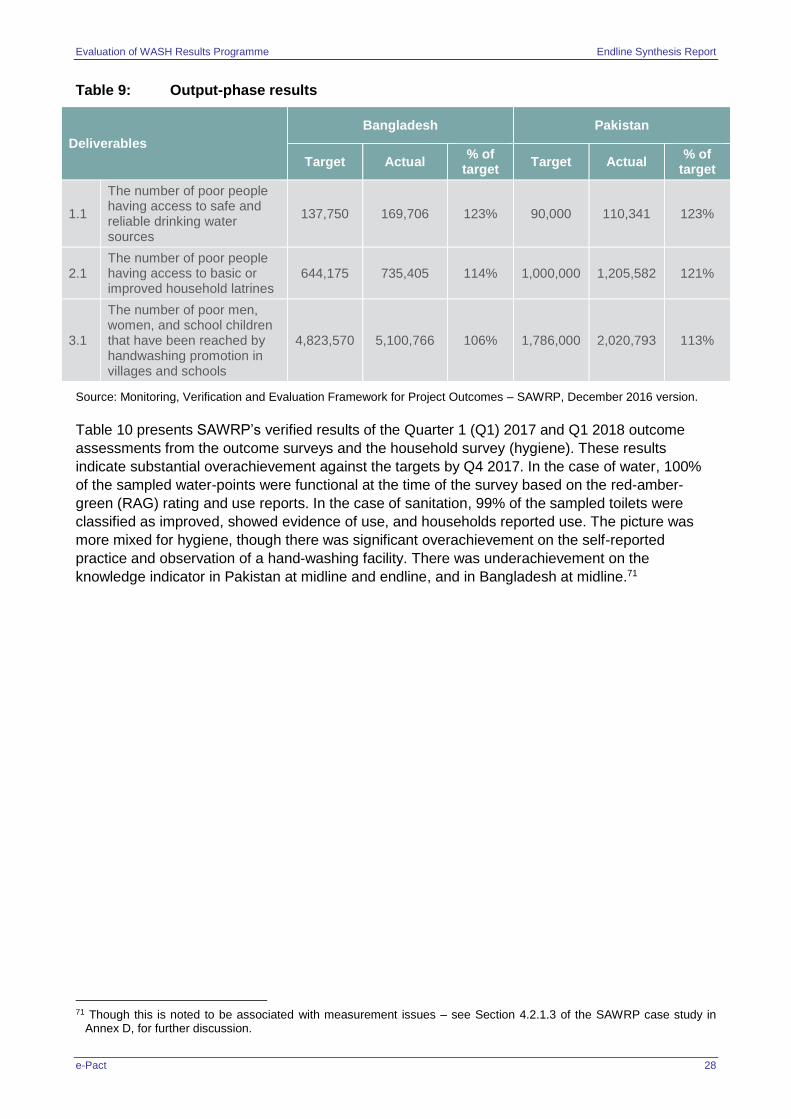
Evaluation of WASH Results Programme Endline Synthesis Report
e-Pact 28
Table 9: Output-phase results
Deliverables
Bangladesh Pakistan
Target Actual % of
target Target Actual
% of target
1.1
The number of poor people having access to safe and reliable drinking water sources
137,750 169,706 123% 90,000 110,341 123%
2.1 The number of poor people having access to basic or improved household latrines
644,175 735,405 114% 1,000,000 1,205,582 121%
3.1
The number of poor men, women, and school children that have been reached by handwashing promotion in villages and schools
4,823,570 5,100,766 106% 1,786,000 2,020,793 113%
Source: Monitoring, Verification and Evaluation Framework for Project Outcomes – SAWRP, December 2016 version.
Table 10 presents SAWRP’s verified results of the Quarter 1 (Q1) 2017 and Q1 2018 outcome
assessments from the outcome surveys and the household survey (hygiene). These results
indicate substantial overachievement against the targets by Q4 2017. In the case of water, 100%
of the sampled water-points were functional at the time of the survey based on the red-amber-
green (RAG) rating and use reports. In the case of sanitation, 99% of the sampled toilets were
classified as improved, showed evidence of use, and households reported use. The picture was
more mixed for hygiene, though there was significant overachievement on the self-reported
practice and observation of a hand-washing facility. There was underachievement on the
knowledge indicator in Pakistan at midline and endline, and in Bangladesh at midline.71
71 Though this is noted to be associated with measurement issues – see Section 4.2.1.3 of the SAWRP case study in
Annex D, for further discussion.
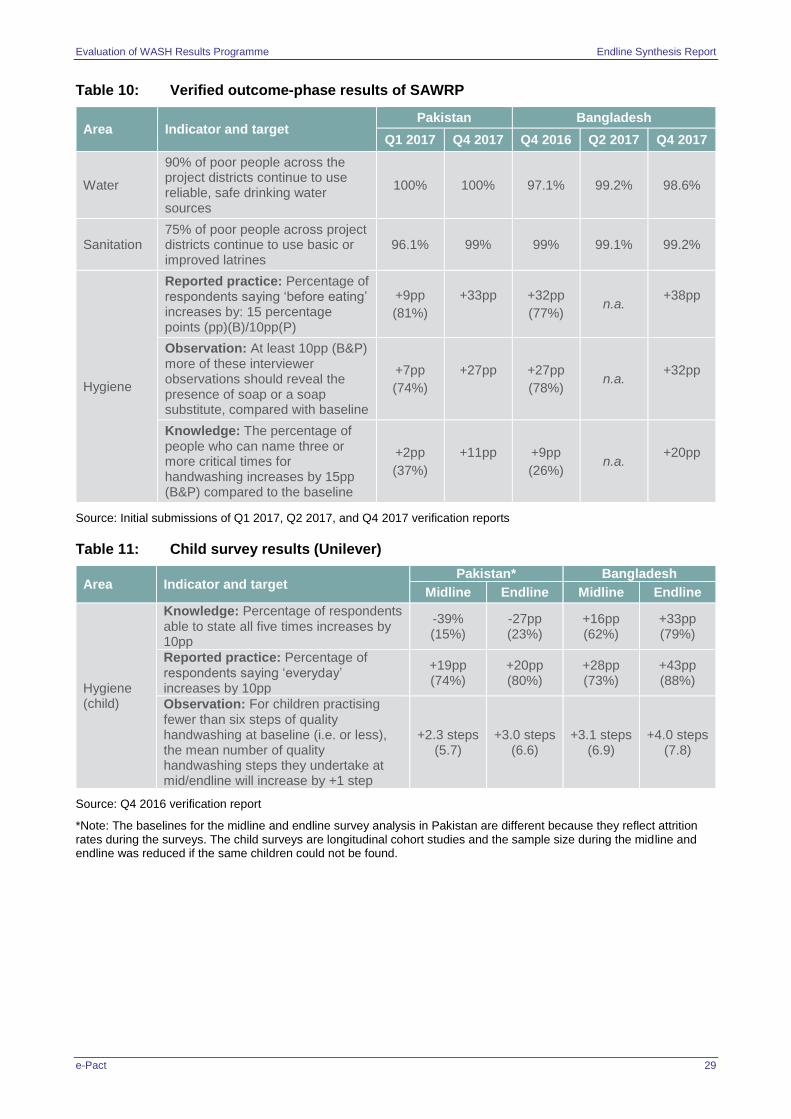
Evaluation of WASH Results Programme Endline Synthesis Report
e-Pact 29
Table 10: Verified outcome-phase results of SAWRP
Area Indicator and target Pakistan Bangladesh
Q1 2017 Q4 2017 Q4 2016 Q2 2017 Q4 2017
Water
90% of poor people across the project districts continue to use reliable, safe drinking water sources
100% 100% 97.1% 99.2% 98.6%
Sanitation 75% of poor people across project districts continue to use basic or improved latrines
96.1% 99% 99% 99.1% 99.2%
Hygiene
Reported practice: Percentage of respondents saying ‘before eating’ increases by: 15 percentage points (pp)(B)/10pp(P)
+9pp
(81%)
+33pp
+32pp
(77%) n.a.
+38pp
Observation: At least 10pp (B&P) more of these interviewer observations should reveal the presence of soap or a soap substitute, compared with baseline
+7pp
(74%)
+27pp
+27pp
(78%) n.a.
+32pp
Knowledge: The percentage of people who can name three or more critical times for handwashing increases by 15pp (B&P) compared to the baseline
+2pp
(37%)
+11pp
+9pp
(26%) n.a.
+20pp
Source: Initial submissions of Q1 2017, Q2 2017, and Q4 2017 verification reports
Table 11: Child survey results (Unilever)
Area Indicator and target Pakistan* Bangladesh
Midline Endline Midline Endline
Hygiene (child)
Knowledge: Percentage of respondents able to state all five times increases by 10pp
-39% (15%)
-27pp (23%)
+16pp (62%)
+33pp (79%)
Reported practice: Percentage of respondents saying ‘everyday’ increases by 10pp
+19pp (74%)
+20pp (80%)
+28pp (73%)
+43pp (88%)
Observation: For children practising fewer than six steps of quality handwashing at baseline (i.e. or less), the mean number of quality handwashing steps they undertake at mid/endline will increase by +1 step
+2.3 steps (5.7)
+3.0 steps (6.6)
+3.1 steps (6.9)
+4.0 steps (7.8)
Source: Q4 2016 verification report
*Note: The baselines for the midline and endline survey analysis in Pakistan are different because they reflect attrition rates during the surveys. The child surveys are longitudinal cohort studies and the sample size during the midline and endline was reduced if the same children could not be found.
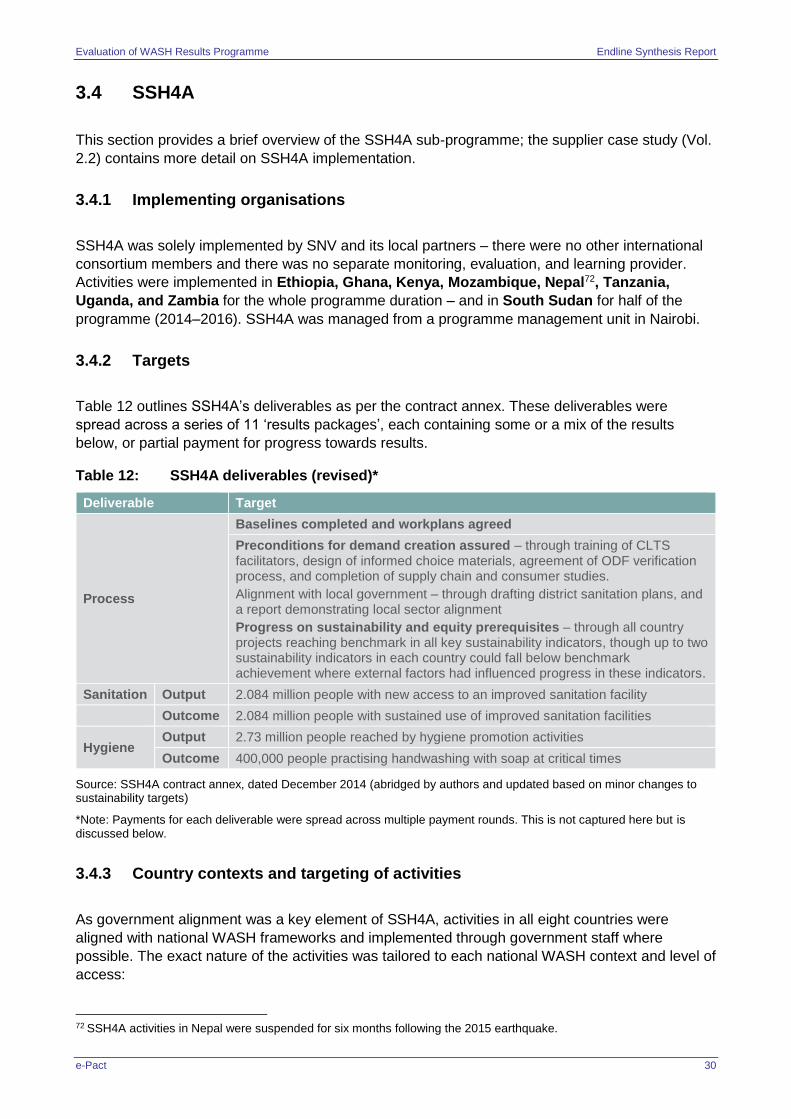
Evaluation of WASH Results Programme Endline Synthesis Report
e-Pact 30
3.4 SSH4A
This section provides a brief overview of the SSH4A sub-programme; the supplier case study (Vol.
2.2) contains more detail on SSH4A implementation.
3.4.1 Implementing organisations
SSH4A was solely implemented by SNV and its local partners – there were no other international
consortium members and there was no separate monitoring, evaluation, and learning provider.
Activities were implemented in Ethiopia, Ghana, Kenya, Mozambique, Nepal72, Tanzania,
Uganda, and Zambia for the whole programme duration – and in South Sudan for half of the
programme (2014–2016). SSH4A was managed from a programme management unit in Nairobi.
3.4.2 Targets
Table 12 outlines SSH4A’s deliverables as per the contract annex. These deliverables were
spread across a series of 11 ‘results packages’, each containing some or a mix of the results
below, or partial payment for progress towards results.
Table 12: SSH4A deliverables (revised)*
Deliverable Target
Process
Baselines completed and workplans agreed
Preconditions for demand creation assured – through training of CLTS facilitators, design of informed choice materials, agreement of ODF verification process, and completion of supply chain and consumer studies.
Alignment with local government – through drafting district sanitation plans, and a report demonstrating local sector alignment
Progress on sustainability and equity prerequisites – through all country projects reaching benchmark in all key sustainability indicators, though up to two sustainability indicators in each country could fall below benchmark achievement where external factors had influenced progress in these indicators.
Sanitation Output 2.084 million people with new access to an improved sanitation facility
Outcome 2.084 million people with sustained use of improved sanitation facilities
Hygiene Output 2.73 million people reached by hygiene promotion activities
Outcome 400,000 people practising handwashing with soap at critical times
Source: SSH4A contract annex, dated December 2014 (abridged by authors and updated based on minor changes to sustainability targets)
*Note: Payments for each deliverable were spread across multiple payment rounds. This is not captured here but is discussed below.
3.4.3 Country contexts and targeting of activities
As government alignment was a key element of SSH4A, activities in all eight countries were
aligned with national WASH frameworks and implemented through government staff where
possible. The exact nature of the activities was tailored to each national WASH context and level of
access:
72 SSH4A activities in Nepal were suspended for six months following the 2015 earthquake.
Evaluation of WASH Results Programme Endline Synthesis Report
e-Pact 31
In countries where the access to improved toilets was higher (Ethiopia, South Sudan, Uganda,
and Mozambique), SNV focused on the remaining harder-to-reach communities.
In Tanzania, SNV focused on the upgrading of sanitation facilities and on hygiene promotion,
as the country has low levels of open defecation but high levels of unimproved facilities, with
sustainability and hygiene challenges.
In Ghana, SNV focused on targeted behaviour change communication (BCC) to reduce the
number of shared latrines.
In countries where the access to improved toilets was still low (Kenya and Nepal), SNV
focused on providing specific support to build the basic capacity of the CLTS rural sanitation
actors.
Some countries had high baseline levels of WASH access, whereas others had very low levels of
access when programme activities were being designed in 2013.
3.4.4 WASH activities
The SSH4A programme dealt only with rural sanitation and hygiene promotion (Lot B) – it had no
water supply component. Activities were implemented within the framework of the existing SSH4A
programme, which has been operating in a dozen countries in Asia since 2009. The overall SSH4A
approach embodies a tested operational approach for working at scale and combines demand
creation − mostly using CLTS − with support to sanitation supply chains, BCC, and strengthening
capacity for WASH governance. Attainment of area-wide ODF was a key objective.
In several SSH4A countries under the WASH Results Programme activities were implemented by
local government partners, supported to a greater or lesser extent by NGOs referred to as Local
Capacity Builders (LCBs) by SNV. These included a mix of existing and new SNV partners, and
some (including those in Uganda, Mozambique, Nepal, and Tanzania) were initially contracted on
a PbR basis. Overall, SNV’s positioning varied within the national WASH sector and other WASH
programmes across the nine countries: in Ghana, Kenya, Nepal, and South Sudan, SNV was a
bigger player alongside a more under-funded and less structured WASH sector. In contrast, in
Ethiopia, Mozambique, Tanzania, Uganda, and Zambia, the existence of national WASH
programmes is a strong indication of their governments’ commitment to harmonising the sector
and attracting significant bilateral and multilateral funding.
In 2017 SNV’s contract was extended until 2020, with an additional £13.1 million in budget
allocated for a new phase of the programme in Ethiopia, Kenya, Mozambique, Nepal, Tanzania,
Uganda, and Zambia. The implementation activities still followed the SSH4A framework, but new
locations were added in most countries and some local implementation partners were changed.
These extension activities are outside the scope of this evaluation.
3.4.5 Monitoring of results and the sustainability of results
Largely using the existing SSH4A systems, results were monitored through household surveys,
administered through the Akvo Flow mobile-based monitoring system.73
73 See http://akvo.org/products/akvoflow/
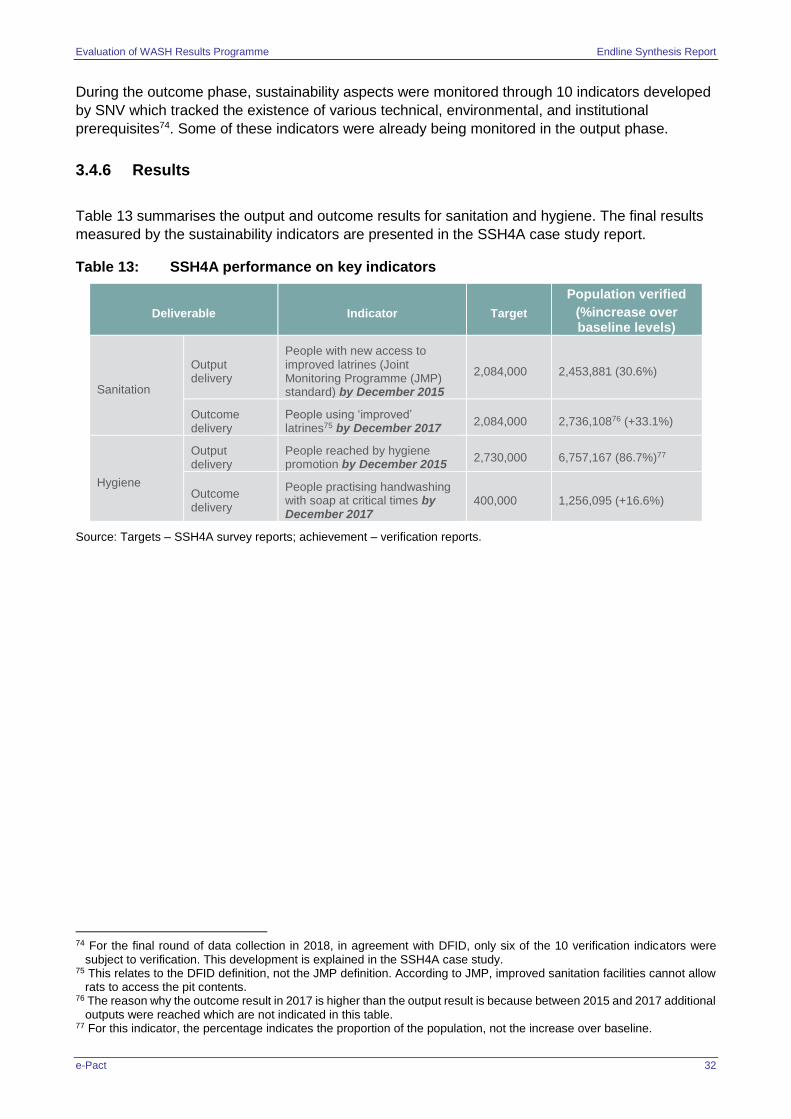
Evaluation of WASH Results Programme Endline Synthesis Report
e-Pact 32
During the outcome phase, sustainability aspects were monitored through 10 indicators developed
by SNV which tracked the existence of various technical, environmental, and institutional
prerequisites74. Some of these indicators were already being monitored in the output phase.
3.4.6 Results
Table 13 summarises the output and outcome results for sanitation and hygiene. The final results
measured by the sustainability indicators are presented in the SSH4A case study report.
Table 13: SSH4A performance on key indicators
Deliverable Indicator Target
Population verified
(%increase over baseline levels)
Sanitation
Output delivery
People with new access to improved latrines (Joint Monitoring Programme (JMP) standard) by December 2015
2,084,000 2,453,881 (30.6%)
Outcome delivery
People using ‘improved’ latrines75 by December 2017
2,084,000 2,736,10876 (+33.1%)
Hygiene
Output delivery
People reached by hygiene promotion by December 2015
2,730,000 6,757,167 (86.7%)77
Outcome delivery
People practising handwashing with soap at critical times by December 2017
400,000 1,256,095 (+16.6%)
Source: Targets – SSH4A survey reports; achievement – verification reports.
74 For the final round of data collection in 2018, in agreement with DFID, only six of the 10 verification indicators were
subject to verification. This development is explained in the SSH4A case study. 75 This relates to the DFID definition, not the JMP definition. According to JMP, improved sanitation facilities cannot allow
rats to access the pit contents. 76 The reason why the outcome result in 2017 is higher than the output result is because between 2015 and 2017 additional
outputs were reached which are not indicated in this table. 77 For this indicator, the percentage indicates the proportion of the population, not the increase over baseline.
Evaluation of WASH Results Programme Endline Synthesis Report
e-Pact 33
4 Findings and analysis
The findings presented below are organised by the DAC criteria of relevance, effectiveness,
efficiency, impacts, and sustainability.
To facilitate readability, the subsections within each category do not directly follow the evaluation
questions, but rather are formulated into a narrative that follows a more natural flow. The beginning
of each section contains a table summarising the responses to its evaluation questions.
All findings in this chapter, as well as the table summarising the responses to its evaluation
questions, synthesise the results of endline evaluation activities as detailed in the Supplier level
case studies. This chapter also includes evidence from the midline evaluation report or
occasionally other sources where explicitly noted. The structure and organization of the findings
section of the Supplier case studies intentionally have been kept as consistent as possible with this
findings section at the synthesis level to aid the reader. In most cases the section numbering is the
same between this findings section and the case studies. However, each subsection that follows
also includes a reference to the specific subsection in the Supplier case studies with more detail.
Refer also to Annex B.13 for the evaluation matrix for a mapping of data sources and methods by
detailed evaluation question.
The evaluation activities included theory of change analysis, process evaluation (including
institutional systems review), impact assessment, in-depth country case studies and contribution
analysis for a subset of detailed evaluation questions (DEQs 2.2, 2.4, 2.5, 2.6, 3.4, 5.1 and 5.2).
The contribution analysis was used to draw causal inferences to explain how change is generated,
based on a plausible theory of change and recognizing that the programme is unlikely to be the
sole factor producing change but does so in interaction with contextual factors. it helped tease out
the factors that contributed to the quality of implementation and achievement of intended outputs
and outcomes. Annex B details the methodology and provides more detail on the contribution
analysis approach specifically.
4.1 Relevance
This section addresses the DAC criterion of relevance. All of the relevance DEQs were extensively
assessed in the midline evaluation. As this is a synthesis report, Table 14 summarises the final
evaluation findings for each DEQ, incorporating both midline and endline results as appropriate.
However, this section does not seek to repeat the depth at which these topics were addressed in
the midline.
The three supplier programmes were quite different: for example, in terms of their organisational
make-up, the range of activities undertaken, the number of countries involved, and the extent to
which they applied tested operational approaches or used implementation models that needed
some fine-tuning. For these reasons, the programmes are not directly comparable.
All three programmes all met their contractual targets. As suppliers selected indicators for each
programme independently, the results are also not directly comparable. However, we have
highlighted emerging themes to the extent feasible. When reviewing the findings, the evaluators
caution readers that the WASH Results Programme was not a clean test of PbR for a variety of
reasons, such as the evolution of expectations, the characteristics of the contracting process, and
the uniquely tight timetable for the first two years.
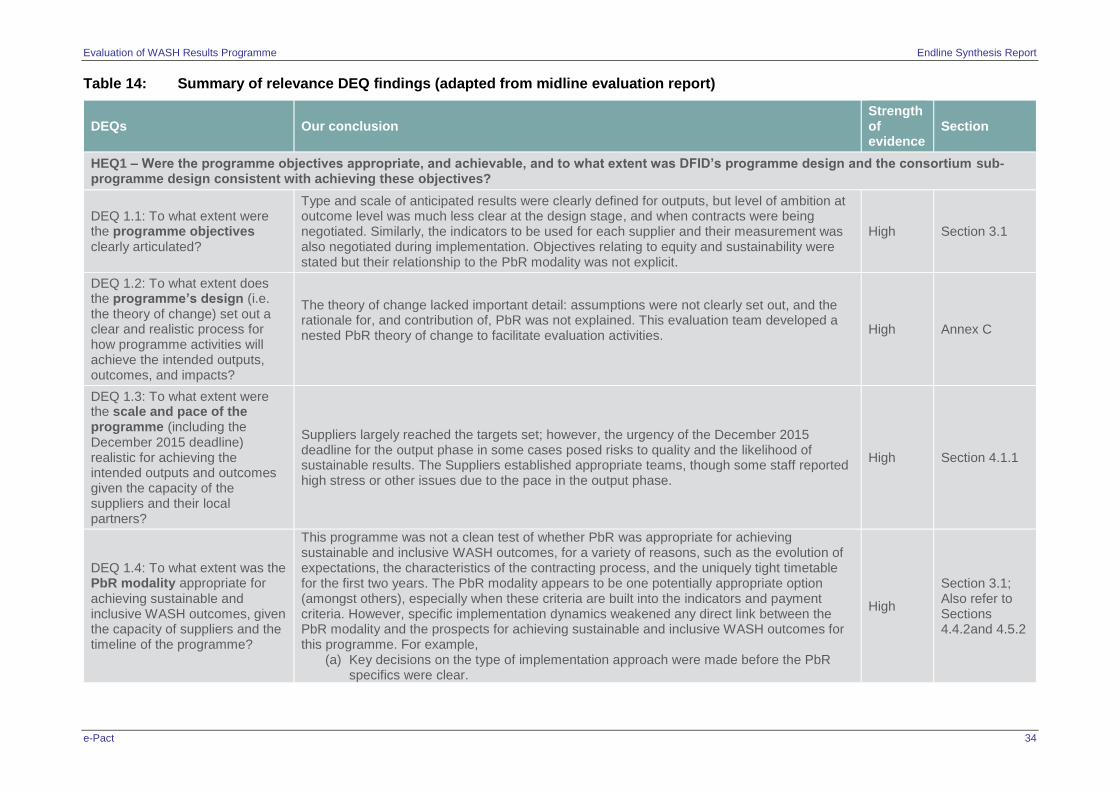
Evaluation of WASH Results Programme Endline Synthesis Report
e-Pact 34
Table 14: Summary of relevance DEQ findings (adapted from midline evaluation report)
DEQs Our conclusion Strength of evidence
Section
HEQ1 – Were the programme objectives appropriate, and achievable, and to what extent was DFID’s programme design and the consortium sub-programme design consistent with achieving these objectives?
DEQ 1.1: To what extent were the programme objectives clearly articulated?
Type and scale of anticipated results were clearly defined for outputs, but level of ambition at outcome level was much less clear at the design stage, and when contracts were being negotiated. Similarly, the indicators to be used for each supplier and their measurement was also negotiated during implementation. Objectives relating to equity and sustainability were stated but their relationship to the PbR modality was not explicit.
High Section 3.1
DEQ 1.2: To what extent does the programme’s design (i.e. the theory of change) set out a clear and realistic process for how programme activities will achieve the intended outputs, outcomes, and impacts?
The theory of change lacked important detail: assumptions were not clearly set out, and the rationale for, and contribution of, PbR was not explained. This evaluation team developed a nested PbR theory of change to facilitate evaluation activities.
High Annex C
DEQ 1.3: To what extent were the scale and pace of the programme (including the December 2015 deadline) realistic for achieving the intended outputs and outcomes given the capacity of the suppliers and their local partners?
Suppliers largely reached the targets set; however, the urgency of the December 2015 deadline for the output phase in some cases posed risks to quality and the likelihood of sustainable results. The Suppliers established appropriate teams, though some staff reported high stress or other issues due to the pace in the output phase.
High Section 4.1.1
DEQ 1.4: To what extent was the PbR modality appropriate for achieving sustainable and inclusive WASH outcomes, given the capacity of suppliers and the timeline of the programme?
This programme was not a clean test of whether PbR was appropriate for achieving sustainable and inclusive WASH outcomes, for a variety of reasons, such as the evolution of expectations, the characteristics of the contracting process, and the uniquely tight timetable for the first two years. The PbR modality appears to be one potentially appropriate option (amongst others), especially when these criteria are built into the indicators and payment criteria. However, specific implementation dynamics weakened any direct link between the PbR modality and the prospects for achieving sustainable and inclusive WASH outcomes for this programme. For example,
(a) Key decisions on the type of implementation approach were made before the PbR specifics were clear.
High
Section 3.1; Also refer to Sections 4.4.2and 4.5.2
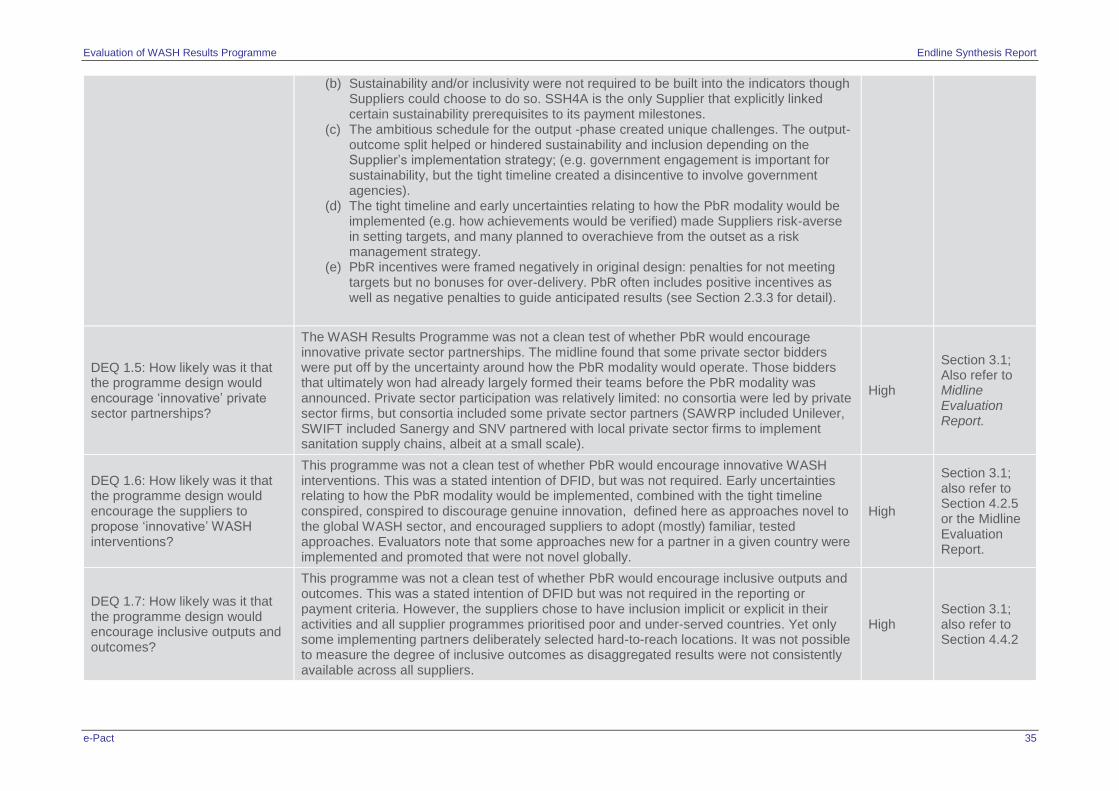
Evaluation of WASH Results Programme Endline Synthesis Report
e-Pact 35
(b) Sustainability and/or inclusivity were not required to be built into the indicators though Suppliers could choose to do so. SSH4A is the only Supplier that explicitly linked certain sustainability prerequisites to its payment milestones.
(c) The ambitious schedule for the output -phase created unique challenges. The output-outcome split helped or hindered sustainability and inclusion depending on the Supplier’s implementation strategy; (e.g. government engagement is important for sustainability, but the tight timeline created a disincentive to involve government agencies).
(d) The tight timeline and early uncertainties relating to how the PbR modality would be implemented (e.g. how achievements would be verified) made Suppliers risk-averse in setting targets, and many planned to overachieve from the outset as a risk management strategy.
(e) PbR incentives were framed negatively in original design: penalties for not meeting targets but no bonuses for over-delivery. PbR often includes positive incentives as well as negative penalties to guide anticipated results (see Section 2.3.3 for detail).
DEQ 1.5: How likely was it that the programme design would encourage ‘innovative’ private sector partnerships?
The WASH Results Programme was not a clean test of whether PbR would encourage innovative private sector partnerships. The midline found that some private sector bidders were put off by the uncertainty around how the PbR modality would operate. Those bidders that ultimately won had already largely formed their teams before the PbR modality was announced. Private sector participation was relatively limited: no consortia were led by private sector firms, but consortia included some private sector partners (SAWRP included Unilever, SWIFT included Sanergy and SNV partnered with local private sector firms to implement sanitation supply chains, albeit at a small scale).
High
Section 3.1; Also refer to Midline Evaluation Report.
DEQ 1.6: How likely was it that the programme design would encourage the suppliers to propose ‘innovative’ WASH interventions?
This programme was not a clean test of whether PbR would encourage innovative WASH interventions. This was a stated intention of DFID, but was not required. Early uncertainties relating to how the PbR modality would be implemented, combined with the tight timeline conspired, conspired to discourage genuine innovation, defined here as approaches novel to the global WASH sector, and encouraged suppliers to adopt (mostly) familiar, tested approaches. Evaluators note that some approaches new for a partner in a given country were implemented and promoted that were not novel globally.
High
Section 3.1; also refer to Section 4.2.5 or the Midline Evaluation Report.
DEQ 1.7: How likely was it that the programme design would encourage inclusive outputs and outcomes?
This programme was not a clean test of whether PbR would encourage inclusive outputs and outcomes. This was a stated intention of DFID but was not required in the reporting or payment criteria. However, the suppliers chose to have inclusion implicit or explicit in their activities and all supplier programmes prioritised poor and under-served countries. Yet only some implementing partners deliberately selected hard-to-reach locations. It was not possible to measure the degree of inclusive outcomes as disaggregated results were not consistently available across all suppliers.
High Section 3.1; also refer to Section 4.4.2
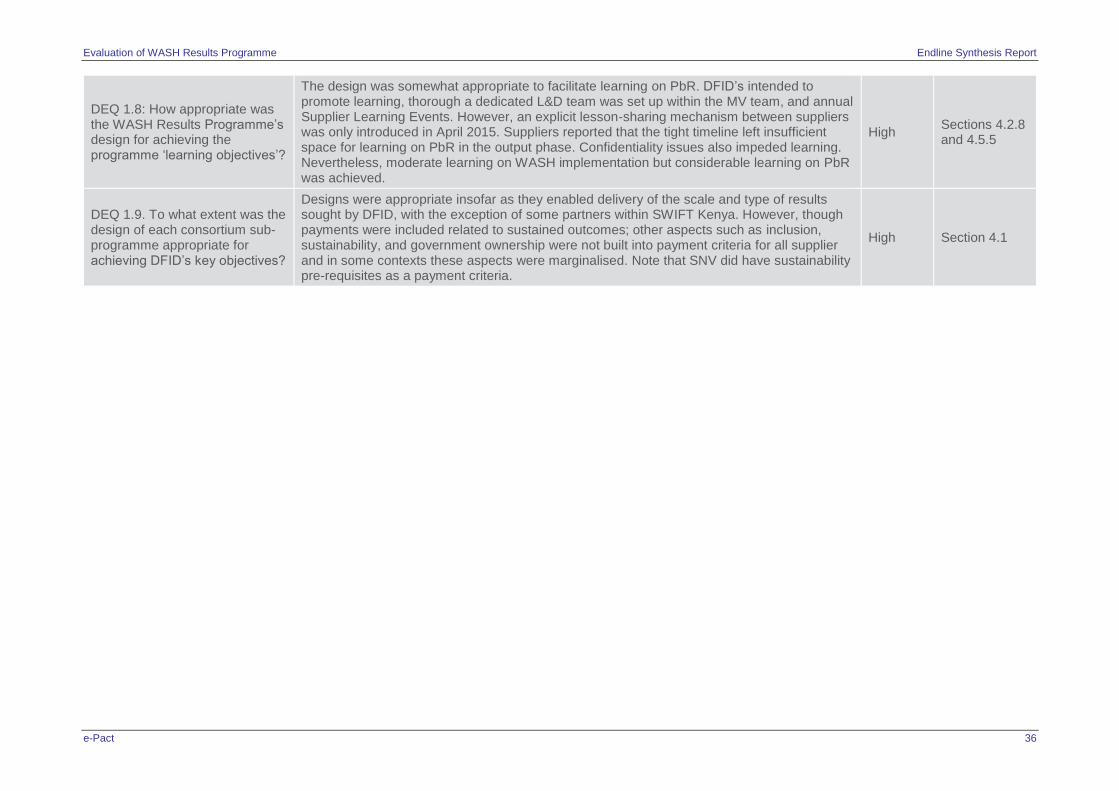
Evaluation of WASH Results Programme Endline Synthesis Report
e-Pact 36
DEQ 1.8: How appropriate was the WASH Results Programme’s design for achieving the programme ‘learning objectives’?
The design was somewhat appropriate to facilitate learning on PbR. DFID’s intended to promote learning, thorough a dedicated L&D team was set up within the MV team, and annual Supplier Learning Events. However, an explicit lesson-sharing mechanism between suppliers was only introduced in April 2015. Suppliers reported that the tight timeline left insufficient space for learning on PbR in the output phase. Confidentiality issues also impeded learning. Nevertheless, moderate learning on WASH implementation but considerable learning on PbR was achieved.
High Sections 4.2.8 and 4.5.5
DEQ 1.9. To what extent was the design of each consortium sub-programme appropriate for achieving DFID’s key objectives?
Designs were appropriate insofar as they enabled delivery of the scale and type of results sought by DFID, with the exception of some partners within SWIFT Kenya. However, though payments were included related to sustained outcomes; other aspects such as inclusion, sustainability, and government ownership were not built into payment criteria for all supplier and in some contexts these aspects were marginalised. Note that SNV did have sustainability pre-requisites as a payment criteria.
High Section 4.1
Evaluation of WASH Results Programme Endline Synthesis Report
e-Pact 37
4.1.1 Factors influencing programme design
Out of all the programme features highlighted in Section 3.1, the midline evaluation report listed
three intertwined factors as arguably the strongest determinants of how the programme was
implemented at the supplier level. These are listed below and are discussed in the following
subsections:
(a) the extremely tight and strict deadline for delivery of beneficiary number results by December 2015;
(b) the programme ‘shape’ or phasing, involving output and outcome phases; and
(c) the PbR modality of payment (including the requirement for rigorous independent verification).
4.1.1.1 Tight timetable to meet MDGs
As noted in the midline, all suppliers reported that, to varying degrees, the substantial time
pressure of the MDGs deadline to some extent cancelled out the benefits of having a flexible PbR
programme that was non-prescriptive in its implementation approach.78 Examples included the
following:
Sticking with the tried and true. With the exception of some of the SWIFT components79, all
suppliers relied on proven implementation approaches and established institutional
relationships with local government agencies and NGOs/community-based organisations, in
part to minimise risk in meeting the schedule. Adopting tested models and selecting a limited
range of projects and partners also facilitated opportunities to achieve economies of scale. In
countries that faced significant challenges with meeting targets, work was scaled down or
discontinued and those targets shifted to another area, e.g. Kenya shifting targets to DRC
under SWIFT.
Shortcuts in preparation. Some local partners were not able to undertake a detailed enough
baseline assessment within the timeframe of inception activities, to increase their
understanding of the socioeconomic, political, and environmental aspects that may have posed
challenges to WASH implementation. In northern Kenya, local partners flagged up the fact that
better understanding of the baseline context would have helped them to design different
implementation approaches. For SAWRP in Pakistan and for SSH4A in Mozambique, where a
baseline was undertaken, the baseline sanitation coverage in the target areas was found to be
higher than anticipated, requiring local partners to increase their geographical scope to meet
targets – which raised implementation costs due to the need for larger field teams, transport
provision, and other support.
78 DFID offered a three-month extension to suppliers from January to March 2016 to lessen the pressure of the MDGs
deadline; only SWIFT took advantage of this extension because it had faced more delays as a result of its implementation through government.
79 SWIFT in Kenya was a package of small- to medium-sized projects that operated largely autonomously. The range of project types in Kenya did not offer economies of scale. SWIFT in Kenya was also a rare case among the country programmes in that some partners used operational approaches that were not fully tested and ready for scaling up at the programme start.
Evaluation of WASH Results Programme Endline Synthesis Report
e-Pact 38
Suboptimal learning. Several NGO partners explained that taking stock of lessons could only
happen after completion of the output phase. Adjusting implementation approaches to improve
effectiveness was not always possible within the short timeframe of the output phase.80
4.1.1.2 Output/outcome phasing
Whilst most programme logframes or results frameworks anticipate the delivery of both outputs
and outcomes, having a formalised two-phase structure is unusual for WASH programmes in
general. The way the output to outcome split was handled varied widely by supplier and/or country,
depending on their overall implementation approach. Therefore, it is difficult to draw broader
conclusions at the overarching programme level. While suppliers shifted away from outputs
delivery to focusing their efforts on institutional strengthening and continued hygiene promotion in
the second phase, the extent of the shift and this discontinuity between phases varied significantly
by supplier. However, the implications of how this split was operationalised by supplier are
discussed as relevant throughout the findings presented in the subsequent subsections.
In general, SSH4A was implemented as a single coherent programme, with four pillars addressed
throughout both phases, and was not divided into separate activities during the output and
outcome phases.
For SAWRP, the two phases ultimately had separate strategic focus – with the output phase
focusing on CLTS, while the outcome phase focused on building the capacity of local-level
institutions (both government and community-based), with continued follow-up promotion and
monitoring. As it presented a shift in programming for the country partners, it took several months
into the outcome phase to agree and design the new implementation activities.81
For SWIFT, the Kenya and the DRC programmes were very different. In DRC, SWIFT was
implemented in a focused geographical area operating at scale using a standardised approach in
rural areas (“Village et Ecoles Assainis” (VEA)) with Community Health Clubs and a ‘semi-urban’
approach; implementation was well aligned with the national government programme (VEA).
However, for SWIFT in Kenya, the division into two phases had varying significance due to the
diversity of implementing partners, local contexts, and approaches used. In several cases, the shift
from output to outcome phase resulted in a shift away from the delivery of outputs to institutional
support, somewhat similar to that in SAWRP, SSH4A, and in the DRC. However, in other cases
the same activities continued (e.g. hygiene promotion82), and in one case there was a shift just to
monitoring rather than engaging in further activities83.
4.1.1.3 The PbR modality’s emphasis on verified results
Due to the PbR financing modality of the programme, suppliers were only paid for results that had
been independently verified. Suppliers needed robust results monitoring and reporting systems
which would provide the basis for verification of results, but suppliers were free to propose how
they would measure results. This promoted a strong focus on achieving recognisable results
during the inception phase, as well as throughout implementation. The verification process which
80 For a more detailed discussion of learning, refer to Sections 4.2.8 and 4.5.5. 81 The SAWRP strategy for the outcome phase was finalised in Q2 2016, two quarters into the outcome phase. Some
output delivery (outside of the payment milestones) and the adoption of new programme elements also continued in the outcome phase.
82 WSUP in Nairobi extending metered connections. 83 BBC Media Action.
Evaluation of WASH Results Programme Endline Synthesis Report
e-Pact 39
confirmed whether or not the supplier had delivered the agreed results thus became a central
element of the programme:
‘PbR puts the spotlight on causality, encouraging attention to be given to “how” planned
activities will lead to outputs and to outcomes.’ – SAWRP staff member, midline evaluation
stage
The independent verification of suppliers’ results adopted a systems-based approach, meaning it
was based on data generated by the supplier’s internal monitoring and reporting systems, rather
than independent data collection by the MV team. Historically, the suppliers’ monitoring systems
had not received the same level of attention as was needed for this programme. Knowing what
would be acceptable was a challenge for suppliers as the requirements only become clear when
working with the MV team during the verifiers’ inception phase (May–September 2014).
Suppliers’ internal monitoring and reporting systems and internal quality assurance procedures
were developed and/or adapted as necessary to meet the requirements established by the verifiers
during the verifiers’ inception phase (May–September 2014). The minimum level of evidence
required was agreed with the supplier for each deliverable through a process of negotiation, where
the verifier suggested items of evidence and the supplier checked the feasibility of providing this
information within the required timeframe.84, 85
For SAWRP and SWIFT, the programme also required more significant ongoing monitoring efforts
by suppliers than usual, which was also more than had been expected and budgeted for at tender
stage.
4.1.2 Operationalising the PbR modality
This subsection elaborates on how the PbR modality was operationalised by suppliers, addressing
its role in consortia selection, establishing targets, and payment indicators.
4.1.2.1 PbR modality role in consortium composition
The PbR model assumes that suppliers have funds available to pre-finance large-scale
programmes, and that they can spread risk across a portfolio of activities (Clist and Verschoor
2014). The consortia members had largely been agreed before the PbR modality had been
announced. However, the pre-finance requirements played a significant role in finalising the
membership of consortia and posed particular challenges for smaller players with limited reserves.
Consortia members needed access to sufficient reserves to pre-finance not only their own start-up
activities but also the activities of their local implementing partners, unless they were put on PbR
contracts as well.86
Evaluators also noted at the midline that suppliers had limited prior experience with PbR contracts.
This led SAWRP to choose Plan International to lead their consortium as Plan International had
prior experience of implementing PbR programmes in education (the Girls Education Challenge
Fund), whereas WaterAid did not. Neither Oxfam (SWIFT) nor SNV (SSH4A) had implemented a
84 See Midline Evaluation Report 85 Refer to Annex G for a more comprehensive summary of the verification process. 86 Refer to Box 7 of the midline evaluation report for several examples of where the PbR modality appears to have affected
the choice of implementing partners.
Evaluation of WASH Results Programme Endline Synthesis Report
e-Pact 40
PbR programme in WASH before. Also, Oxfam had already chosen its consortium partners before
the PbR modality was announced.
4.1.2.2 Establishing supplier-level targets
Each consortium decided at the tender stage what level of WASH outputs could be realistically
achieved by December 2015 (output phase), and (provisionally) what level of outcomes could be
sustained until March 2018 (outcome phase). Suppliers presented their level of ambition for the
transition from outputs to outcomes in their results frameworks, but for SWIFT and SAWRP these
targets were not finalised until late in the output phase.
According to feedback at the midline stage from the suppliers, four elements played a key role in
determining their stated ambition:
In a departure from many other PbR programmes, the PbR modality for this programme did
not reward overachievement (upside incentive), but did penalise underachievement (down-side
incentive), which led suppliers to propose realistic if not conservative targets, given the short
time available for the output phase, and given that payments were linked to the degree to
which results could be sustained until programme end (see Section 2.3.3 for detail).
Ambitions were matched to the type of implementing partner chosen: for example, the
SSH4A programme – which was implemented directly through governments in several
countries – set lower targets per country than other consortia, to match the implementation
capacity of local government. As a result, a similar number of people were reached in each of
the nine-country SSH4A programme by December 2015 as by each of the other two-country
consortia. In contrast, Unilever (SAWRP) implemented exclusively through local partners and
set its ambition based on its own organisational capacity and risk appetite, which was very high
in Bangladesh.
The baseline level of WASH access in country was another important factor in setting
targets. For example, SNV explained that while initial ambitions were based on rough baseline
data from 2012, these ambitions were revised in some countries once an updated baseline
survey was undertaken in June/July 2014. Similarly, SAWRP revised the programme’s
geographical scope after the baseline survey in Pakistan revealed significantly higher baseline
levels than partners had estimated. As a result, local partners had to renegotiate financial
aspects of their agreement with their consortium partner.
Establishing indicators was another challenging aspect. As noted in the midline evaluation
report, variations between how ‘results’ were defined under different supplier contracts led to
substantial challenges in regard to verification procedures and how to define the hygiene
output result, particularly with regard to the number of people ‘reached’ by hygiene promotion.
In the WASH sector, there is no widely accepted definition of what ‘reached’ means and what a
minimum level of performance looks like. It was not possible to provide a single definition of
‘reached’ that was applicable across the wide range of hygiene-related activities undertaken by
the three supplier programmes. As a result, each implementing partner agreed separate
definitions with the MV team. The definitions of how results were defined are discussed in
Section 4.2.1.
Setting the level of ambition for outcome targets involved significant discussions with DFID, as well
as input from the MV team on what level of achievement (i.e. outcomes as a percentage of output
numbers) could reasonably be expected for the three outcome targets, based on sector
experience. For suppliers, setting outcome targets was challenging given that much was beyond
the suppliers’ direct control – such as for handwashing practices.
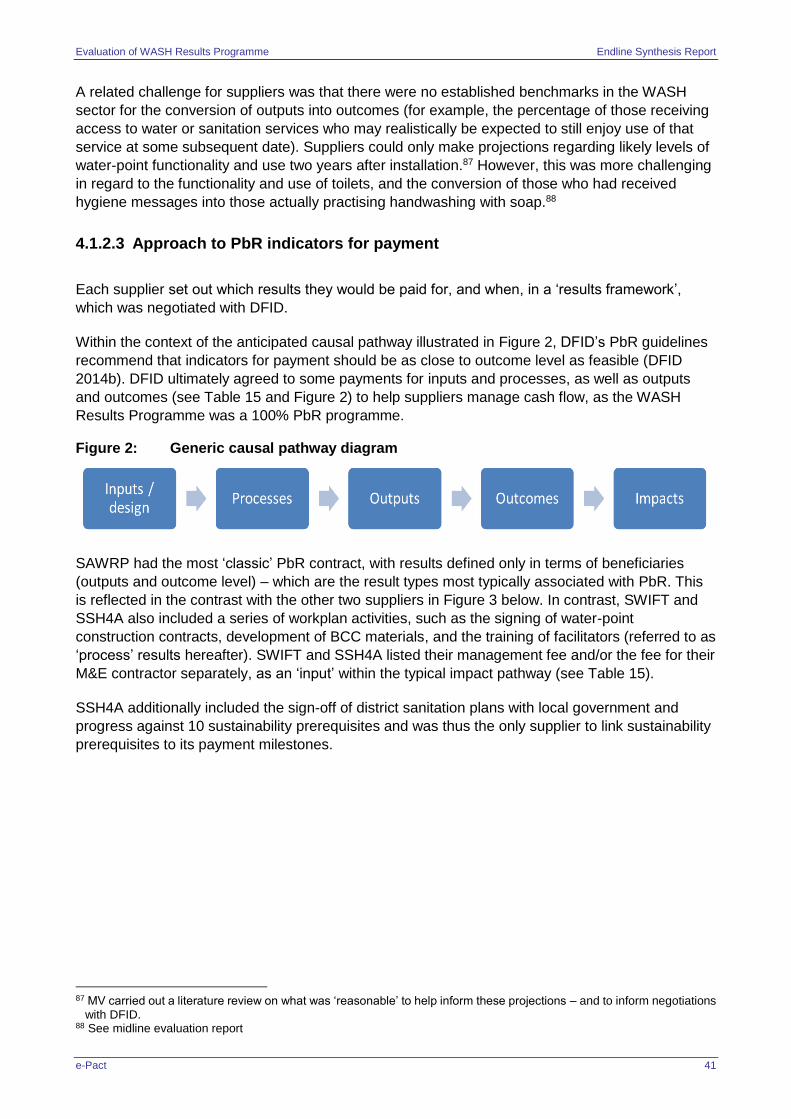
Evaluation of WASH Results Programme Endline Synthesis Report
e-Pact 41
A related challenge for suppliers was that there were no established benchmarks in the WASH
sector for the conversion of outputs into outcomes (for example, the percentage of those receiving
access to water or sanitation services who may realistically be expected to still enjoy use of that
service at some subsequent date). Suppliers could only make projections regarding likely levels of
water-point functionality and use two years after installation.87 However, this was more challenging
in regard to the functionality and use of toilets, and the conversion of those who had received
hygiene messages into those actually practising handwashing with soap.88
4.1.2.3 Approach to PbR indicators for payment
Each supplier set out which results they would be paid for, and when, in a ‘results framework’,
which was negotiated with DFID.
Within the context of the anticipated causal pathway illustrated in Figure 2, DFID’s PbR guidelines
recommend that indicators for payment should be as close to outcome level as feasible (DFID
2014b). DFID ultimately agreed to some payments for inputs and processes, as well as outputs
and outcomes (see Table 15 and Figure 2) to help suppliers manage cash flow, as the WASH
Results Programme was a 100% PbR programme.
Figure 2: Generic causal pathway diagram
SAWRP had the most ‘classic’ PbR contract, with results defined only in terms of beneficiaries
(outputs and outcome level) – which are the result types most typically associated with PbR. This
is reflected in the contrast with the other two suppliers in Figure 3 below. In contrast, SWIFT and
SSH4A also included a series of workplan activities, such as the signing of water-point
construction contracts, development of BCC materials, and the training of facilitators (referred to as
‘process’ results hereafter). SWIFT and SSH4A listed their management fee and/or the fee for their
M&E contractor separately, as an ‘input’ within the typical impact pathway (see Table 15).
SSH4A additionally included the sign-off of district sanitation plans with local government and
progress against 10 sustainability prerequisites and was thus the only supplier to link sustainability
prerequisites to its payment milestones.
87 MV carried out a literature review on what was ‘reasonable’ to help inform these projections – and to inform negotiations
with DFID. 88 See midline evaluation report
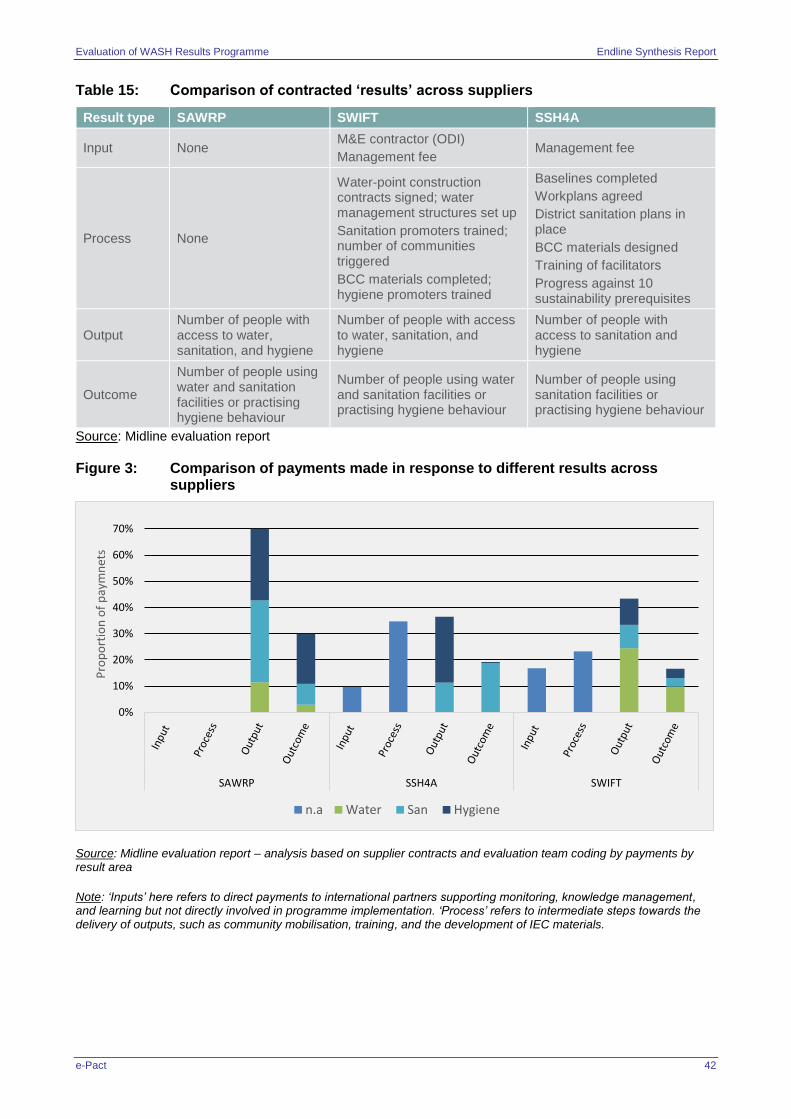
Evaluation of WASH Results Programme Endline Synthesis Report
e-Pact 42
Table 15: Comparison of contracted ‘results’ across suppliers
Result type SAWRP SWIFT SSH4A
Input None M&E contractor (ODI)
Management fee Management fee
Process None
Water-point construction contracts signed; water management structures set up
Sanitation promoters trained; number of communities triggered
BCC materials completed; hygiene promoters trained
Baselines completed
Workplans agreed
District sanitation plans in place
BCC materials designed
Training of facilitators
Progress against 10 sustainability prerequisites
Output Number of people with access to water, sanitation, and hygiene
Number of people with access to water, sanitation, and hygiene
Number of people with access to sanitation and hygiene
Outcome
Number of people using water and sanitation facilities or practising hygiene behaviour
Number of people using water and sanitation facilities or practising hygiene behaviour
Number of people using sanitation facilities or practising hygiene behaviour
Source: Midline evaluation report
Figure 3: Comparison of payments made in response to different results across suppliers
Source: Midline evaluation report – analysis based on supplier contracts and evaluation team coding by payments by result area
Note: ‘Inputs’ here refers to direct payments to international partners supporting monitoring, knowledge management, and learning but not directly involved in programme implementation. ‘Process’ refers to intermediate steps towards the delivery of outputs, such as community mobilisation, training, and the development of IEC materials.
0%
10%
20%
30%
40%
50%
60%
70%
SAWRP SSH4A SWIFT
Pro
po
rtio
n o
f p
aym
net
s
n.a Water San Hygiene
Evaluation of WASH Results Programme Endline Synthesis Report
e-Pact 43
4.1.3 Risk management
Both the PbR modality and the pressure of the MDGs deadline affected how suppliers managed
risk within their consortia and allocated targets to different partners and countries. Under the
WASH Results Programme, suppliers bore the risk for delivery even in unexpected circumstances.
The only exception to the PbR modality was the force majeure clause in the contract.89
As noted in the midline evaluation report, there were initial uncertainties regarding the contracting
terms which increased risk: such as whether shared latrines and radio-based hygiene promotion
were eligible as a basis for payment, or conditions under which payments would be reduced, and
circumstances under which the force majeure clause would apply.
Because the risks were highly centralised, suppliers managed this risk in three main ways:90
1. All suppliers aimed for beneficiary numbers that were 10%–30% above their contractual target, in the expectation that some results would be disallowed or not achieved. This buffer was designed to ensure that 100% of the target results would be verified and paid for.
2. Suppliers structured their payments over time so that 70%–80% of total payments were made within the first 18 months of the programme (by December 2015), thereby enabling some early cash flow and reducing the level of pre-financing. There was consensus at the March 2016 learning event that SNV’s approach of a high proportion of ‘process’ payments in the first year of the programme was the most astute in terms of enabling early payments and cash flow, however created some unanticipated challenges with verification.
3. Suppliers incorporated a contingency fund into their budgets (between 4% and 12% of the contract value), which could be available to consortium partners. SAWRP partners reported, however, that these funds were not sufficient to cover all possible scenarios, including the reconstruction of WASH facilities after a major unforeseen event, such as a natural disaster. After 22% of latrines in Umerkot (Sindh province of Pakistan) were destroyed following heavy rains, communities were mobilised to repair the damage at their own expense, as is common under the CLTS approach.
Risk-sharing with DFID
There were a few instances where, because of external events, results were not achieved, the two
critical examples being the prolonged drought in the ASAL region (which affected SWIFT water
results) and the Ebola crisis in West Africa (which resulted in the termination of the SWIFT Liberia
programme). In both cases DFID de facto assumed some of the financial risks associated with
these events post-hoc. In the case of the Liberia programme, this took the form of making
accommodations for the start-up and shut-down costs of the Liberia programme in re-negotiation
of the contract with SWIFT. In the case of the ASAL drought, once the MV team had corroborated
SWIFT’s claim that the drought could be considered ‘exceptional’, accommodation was made in
deciding the payment amount related to water-point functionality. For a fuller discussion of both
occasions see Section 4.3.1 of the SWIFT case study.
Risk-sharing within consortia
All three lead suppliers chose to hold a large portion of risk centrally, pre-financing their other
consortium members (SAWRP) or national NGO partners (SWIFT), or their country teams (for
SSH4A). This introduced an additional element of risk for the lead supplier, who needed to factor in
89 This was applied to the SWIFT Liberia programme, where activities could not continue due to the Ebola crisis. SWIFT
was reimbursed for expenditure incurred at inception. 90 See Midline Evaluation Report
Evaluation of WASH Results Programme Endline Synthesis Report
e-Pact 44
the likelihood of consortium partners or country teams failing to deliver, and the need to set up
procedures for how to deal with such an eventuality.
The degree to which lead suppliers passed on risks to others was mixed. The lead suppliers of
SAWRP and SWIFT did pass PbR risks on to their consortium members (all INGOs). However, in
many cases, consortium members did not pass PbR risks on to their country offices (e.g. Oxfam
GB did not pass risks on to Oxfam Kenya, and similarly SNV did not pass risks on to SNV country
offices). Similarly, the vast majority of lead suppliers were not willing to put their national
implementing partners onto PbR contracts, on the basis that these partners would not be able to
pre-finance their work or bear the risk of not being reimbursed later. One notable exception was
SNV, which used partial PbR contracts in three countries (Mozambique, Nepal, and Uganda) and
briefly used a full PbR contract for local partners in Tanzania (see Section 4.3.3 on the implication
of this for partners)91.
In Kenya, the SWIFT consortium partners were in fact all INGOs and Oxfam contracted them on a
PbR basis, though local NGOs working under these organisations were funded using grants, as in
the past – the same was true in DRC where the consortium partners had implementing partners.
Under SAWRP, Plan International and WaterAid chose to hold the PbR risk centrally, pre-financing
the country teams and other consortium members – which constituted a considerable burden. In
practice, payments to consortium partners were always at least a quarter in arrears, making it
necessary for them to draw on other internal funds to bridge gaps in their cash flow.92
Challenges with pricing risk
Under the WASH Results Programme, DFID agreed on payment levels in the contract
negotiations, which took place under the competitive tendering process. The majority of activities
funded by the WASH Results Programme involved incentivising behaviour change by
communities, and involved local and government partners. As a result, the lead suppliers, who
held the risk for non-payment, did not necessarily have direct control over the results to be
achieved.
During the midline evaluation, suppliers noted uncertainties in how to price in risk in their budget
proposals, explaining that in future they would price in the following costs more accurately:
the cost of pre-financing partners, namely the risk that partners would not achieve the intended
results and that the lead suppliers would lose out on the pre-finance payment;
inflation and salary increases; and
a buffer for slippage in timing and scope – especially as a result of some additional M&E
activities being required which had not been costed.
4.1.4 Level of government engagement
As would be expected when promoting sustainability, all supplier consortia emphasised working in
partnership with government and aligned their activities with national WASH policies where
possible throughout implementation. For example:
91 A full PbR contract meant that no advance was given and payment was made every few months, if the agreed milestone
was successfully completed. Partial PbR contracts meant that an advance was given and a final payment was made on a milestone basis, when the final target was met (e.g. for Uganda, a 20%–30% advance payment was given, followed by a progress payment of 30%–35% and a final payment of 30%–40%). If achievements did not meet the agreed target, a payment deduction could be made.
92 See Midline Evaluation Report
Evaluation of WASH Results Programme Endline Synthesis Report
e-Pact 45
The implementation model for SAWRP in Pakistan was closely aligned with the national
sanitation strategy, Pakistan Approaches to Total Sanitation; and in Bangladesh Plan
International worked with the government as its implementing partners.
Under SWIFT, in Kenya, the government was consulted on activity design and some partners
participated in implementation and monitoring work. In DRC, the implementation was aligned
with the national VEA approach.
SSH4A placed a strong emphasis on alignment with government by linking its sanitation and
hygiene targets to government district plans, and often involving government partners directly
in community-level implementation activities. In those countries where government partners
were less involved in implementation, these government partners were involved in the
monitoring of progress against these targets.
However, the extent to which the programmes were implemented directly through local
government partners varied. As found at the midline stage, the urgency of results delivery affected
the choice of implementing partners: one partner under SAWRP93 changed its implementation
modus from implementation through government partners to implementation directly through NGO
partners. Similarly, some suppliers supplemented government capacity either by seconding staff to
local government bodies (Plan in Bangladesh) or by hiring advisers to support them (in several
SNV countries94). This was done both in recognition of government capacity constraints, which
could have caused delays in delivery, and due to the need to gain greater control over
implementation activities, with scope to adjust them when needed. However, as counter-examples,
several suppliers implemented directly through government structures, namely SWIFT’s work
implemented directly through the public water utility in Kenya, and SNV’s activities in Ghana
implemented through government without local partners.
93 While WaterAid also usually implements through local government partners in Pakistan, under this programme they
chose to implement directly through NGO partners. 94 In Kenya and Tanzania, SNV supported government with district-level advisors, and in Mozambique and Zambia it
supported government with sub-district level technicians. In all other countries except Ghana, local NGOs supported government partners.
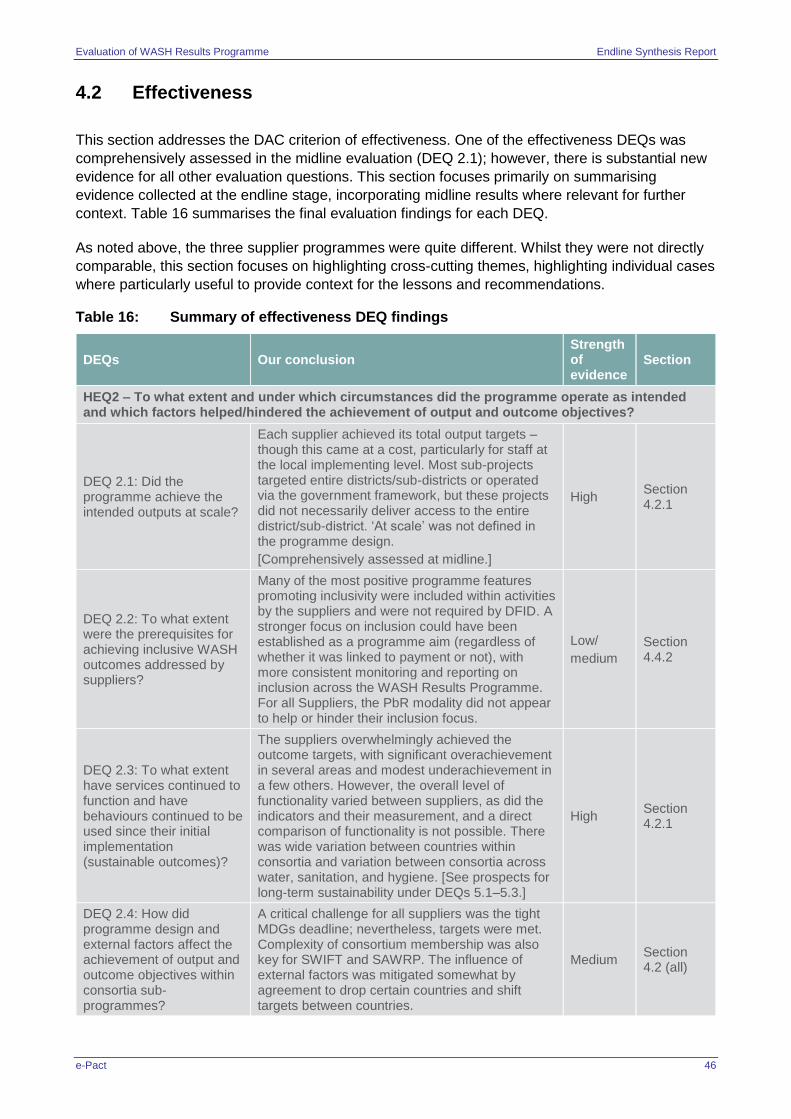
Evaluation of WASH Results Programme Endline Synthesis Report
e-Pact 46
4.2 Effectiveness
This section addresses the DAC criterion of effectiveness. One of the effectiveness DEQs was
comprehensively assessed in the midline evaluation (DEQ 2.1); however, there is substantial new
evidence for all other evaluation questions. This section focuses primarily on summarising
evidence collected at the endline stage, incorporating midline results where relevant for further
context. Table 16 summarises the final evaluation findings for each DEQ.
As noted above, the three supplier programmes were quite different. Whilst they were not directly
comparable, this section focuses on highlighting cross-cutting themes, highlighting individual cases
where particularly useful to provide context for the lessons and recommendations.
Table 16: Summary of effectiveness DEQ findings
DEQs Our conclusion Strength of evidence
Section
HEQ2 – To what extent and under which circumstances did the programme operate as intended and which factors helped/hindered the achievement of output and outcome objectives?
DEQ 2.1: Did the programme achieve the intended outputs at scale?
Each supplier achieved its total output targets – though this came at a cost, particularly for staff at the local implementing level. Most sub-projects targeted entire districts/sub-districts or operated via the government framework, but these projects did not necessarily deliver access to the entire district/sub-district. ‘At scale’ was not defined in the programme design.
[Comprehensively assessed at midline.]
High Section 4.2.1
DEQ 2.2: To what extent were the prerequisites for achieving inclusive WASH outcomes addressed by suppliers?
Many of the most positive programme features promoting inclusivity were included within activities by the suppliers and were not required by DFID. A stronger focus on inclusion could have been established as a programme aim (regardless of whether it was linked to payment or not), with more consistent monitoring and reporting on inclusion across the WASH Results Programme. For all Suppliers, the PbR modality did not appear to help or hinder their inclusion focus.
Low/
medium
Section 4.4.2
DEQ 2.3: To what extent have services continued to function and have behaviours continued to be used since their initial implementation (sustainable outcomes)?
The suppliers overwhelmingly achieved the outcome targets, with significant overachievement in several areas and modest underachievement in a few others. However, the overall level of functionality varied between suppliers, as did the indicators and their measurement, and a direct comparison of functionality is not possible. There was wide variation between countries within consortia and variation between consortia across water, sanitation, and hygiene. [See prospects for long-term sustainability under DEQs 5.1–5.3.]
High Section 4.2.1
DEQ 2.4: How did programme design and external factors affect the achievement of output and outcome objectives within consortia sub-programmes?
A critical challenge for all suppliers was the tight MDGs deadline; nevertheless, targets were met. Complexity of consortium membership was also key for SWIFT and SAWRP. The influence of external factors was mitigated somewhat by agreement to drop certain countries and shift targets between countries.
Medium Section 4.2 (all)
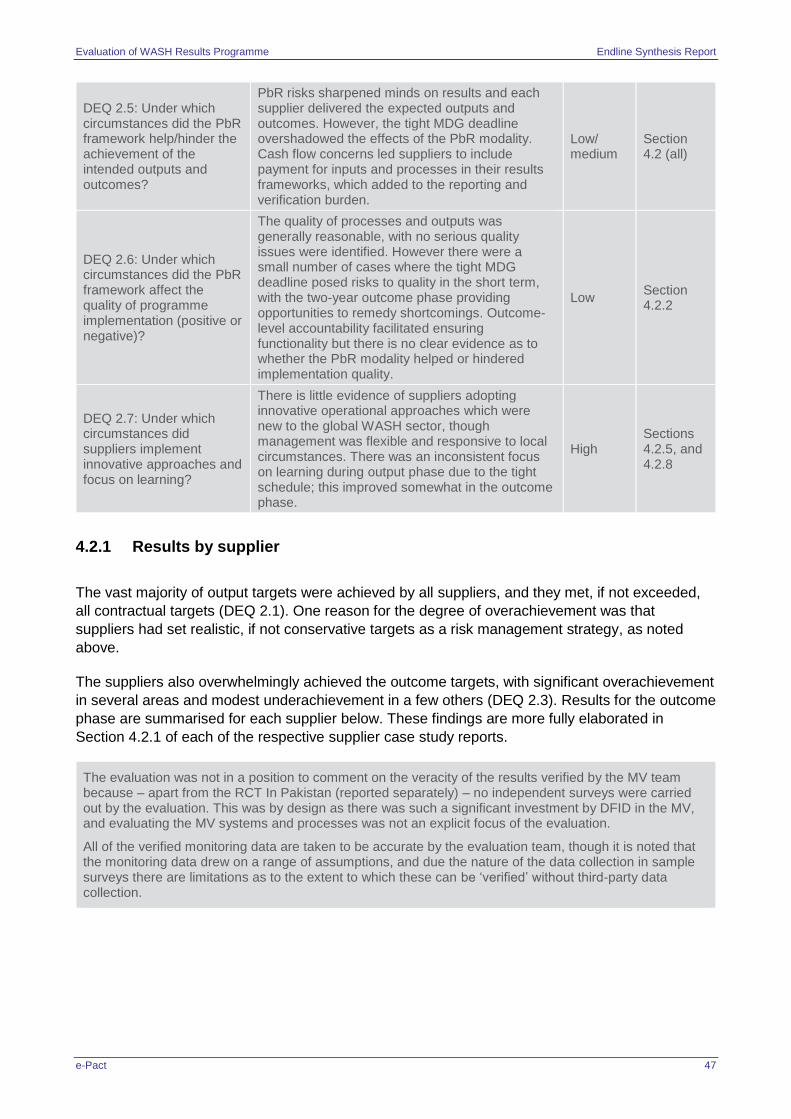
Evaluation of WASH Results Programme Endline Synthesis Report
e-Pact 47
4.2.1 Results by supplier
The vast majority of output targets were achieved by all suppliers, and they met, if not exceeded,
all contractual targets (DEQ 2.1). One reason for the degree of overachievement was that
suppliers had set realistic, if not conservative targets as a risk management strategy, as noted
above.
The suppliers also overwhelmingly achieved the outcome targets, with significant overachievement
in several areas and modest underachievement in a few others (DEQ 2.3). Results for the outcome
phase are summarised for each supplier below. These findings are more fully elaborated in
Section 4.2.1 of each of the respective supplier case study reports.
The evaluation was not in a position to comment on the veracity of the results verified by the MV team because – apart from the RCT In Pakistan (reported separately) – no independent surveys were carried out by the evaluation. This was by design as there was such a significant investment by DFID in the MV, and evaluating the MV systems and processes was not an explicit focus of the evaluation.
All of the verified monitoring data are taken to be accurate by the evaluation team, though it is noted that the monitoring data drew on a range of assumptions, and due the nature of the data collection in sample surveys there are limitations as to the extent to which these can be ‘verified’ without third-party data collection.
DEQ 2.5: Under which circumstances did the PbR framework help/hinder the achievement of the intended outputs and outcomes?
PbR risks sharpened minds on results and each supplier delivered the expected outputs and outcomes. However, the tight MDG deadline overshadowed the effects of the PbR modality. Cash flow concerns led suppliers to include payment for inputs and processes in their results frameworks, which added to the reporting and verification burden.
Low/ medium
Section 4.2 (all)
DEQ 2.6: Under which circumstances did the PbR framework affect the quality of programme implementation (positive or negative)?
The quality of processes and outputs was generally reasonable, with no serious quality issues were identified. However there were a small number of cases where the tight MDG deadline posed risks to quality in the short term, with the two-year outcome phase providing opportunities to remedy shortcomings. Outcome-level accountability facilitated ensuring functionality but there is no clear evidence as to whether the PbR modality helped or hindered implementation quality.
Low Section 4.2.2
DEQ 2.7: Under which circumstances did suppliers implement innovative approaches and focus on learning?
There is little evidence of suppliers adopting innovative operational approaches which were new to the global WASH sector, though management was flexible and responsive to local circumstances. There was an inconsistent focus on learning during output phase due to the tight schedule; this improved somewhat in the outcome phase.
High Sections 4.2.5, and 4.2.8
Evaluation of WASH Results Programme Endline Synthesis Report
e-Pact 48
4.2.1.1 SSH4A outcomes
Broadly speaking, SSH4A reached and exceeded its outcome targets for both sanitation and
hygiene. However, there was wide variation in conversion rates across counties, as highlighted
below:
SSH4A’s sanitation outcome target, which aimed for a population of 2.084 million people95 to
continue using improved latrines until programme end, was reached and exceeded96 but
achievements varied considerably between countries. Substantial improvements were seen for
Ethiopia, Nepal, Tanzania, and Zambia, varying from 37 to 80 percentage points above
baseline levels, but more limited improvements were seen for Ghana, Kenya, Mozambique,
and Uganda, varying from 10 to 21 percentage points above baseline levels.
The hygiene target was set at 400,000 people continuing to practise handwashing with soap at
critical times, and was reached and exceeded (an increase of 16.6 percentage points above
baseline levels was achieved). As with sanitation outcomes, achievement varied considerably
between countries. Substantial improvements were seen for Ethiopia, Nepal, Tanzania, and
Zambia, varying from 21 to 66 percentage points above baseline levels, but more limited
improvements were seen for Ghana, Kenya, Mozambique, and Uganda, varying from 2.4 to
10.5 percentage points above baseline levels.
4.2.1.2 SWIFT outcomes
SWIFT reached, or nearly reached, all of its outcome targets. In DRC SWIFT performed better
overall than in the ASAL region in Kenya, and this is assumed to be primarily due to challenges
related to the ASAL region’s prolonged drought. The evaluators note that functionality did improve
during the outcome phase for each of the three target categories, presumably because the
suppliers remained active in ensuring functionality, though this effect was less pronounced in the
Kenya ASAL region97. The outcome results broadly lend strong support to the notion that the
programme activities were effective in sustaining results – though the variation in performance and
areas of underachievement highlight that this was variable across the programme. The
performance highlights were:
● SWIFT’s outcome target for water was “use sustained of at least 75% of water points”, for
which SWIFT achieved 98.6% of this goal overall, i.e. the vast majority of systems remained
functional above the 75% threshold. Though due to the way the data were aggregated it
cannot be interpreted as just under 75% of all systems remained functional across SWIFT
(i.e. 98.6% achievement does not mean 73.95% functionality).98 While several areas
overachieved, the ASAL region in Kenya was below 75%. The DRC survey results indicated
that over 90% of water points were used by output beneficiaries (as reported via household
surveys), and around 80%99 of the complex systems in the ASAL region remained functional.
Functionality of simple systems in the ASAL region was considerably lower.
95 This refers to a total population at programme end, meaning these were not necessarily only the original people targeted.
SSH4A could target new beneficiaries to make up for losses. 96 An increase of 33%% above baseline levels was achieved. 97 Due to peculiarities in the way indicators were calculated and aggregated, it is difficult to summarise further here. A more
comprehensive discussion is provided in each of the supplier case studies as it pertained to their specific methods of aggregation.
98 SWIFT was the only consortium with a substantial water component. 99 Both as reported by HH surveys and Functionality reported by Water User Committee
Evaluation of WASH Results Programme Endline Synthesis Report
e-Pact 49
● The sanitation outcome target was “use sustained for at least 70% of each target
population”100. 100% of the target was achieved, i.e. beneficiary use of sanitation facilities
was consistently above the 70% threshold across the suppliers - continued use of sanitation
facilities was between 73% - 87% across partners and countries101.
● For hygiene, the outcome target was “behaviour change obtained for at least 15% of each
target population”. 99.6% of the target was achieved. Due to the aggregation methods this is
not readily translated into an overall figure for beneficiary numbers across partners.102 The
only area of underachievement was in relation to Sanergy’s activities in Nairobi.
4.2.1.3 SAWRP outcomes
The water supply and sanitation use targets were met with considerable overachievement for
SAWRP in both Pakistan and Bangladesh. There was, however, a slight shortfall in the case of
handwashing practices at points in both countries. Highlights were as follows:
The water outcome target for SAWRP was ‘90% of poor people across the project districts
continue to use reliable, safe drinking water sources,’ the results of which were overwhelmingly
positive – with significant overachievement against target in both countries.103
The sanitation outcome target was ‘75% of poor people across project districts continue to use
basic or improved latrines,’ the outcome survey results indicated that 99% of output
beneficiaries continued to use facilities – i.e. there was overachievement against the target.104
As with SWIFT, the sanitation results improved over time. Though not reflected in the results
data, suppliers in Pakistan reported an ODF conversion rate of around 98% (note that this has
not been verified by e-Pact). By global standards, this is exceptional and is therefore
controversial. Programme stakeholders attributed this to concerted and prolonged promotional
efforts stimulated by greater accountability for outcome-level results.105
SAWRP’s outcome target for hygiene changed from one expressed in terms of beneficiary
numbers to a composite indicator based around three components (knowledge, reported
behaviour, and observed behaviour) with percentage point target increases.106 Targets were
slightly higher in Bangladesh. Also, in Pakistan all sanitation beneficiaries were assumed to
also be hygiene beneficiaries.107 The hygiene target was met in most cases, though there were
points in both countries where the target was not met on the knowledge component108.
100 The wording was later revised in the Form 2 to “At least 70% of the beneficiaries that are reached at output level
continue to use latrines that meet SWIFT standards (*hereafter referred to as 'hygienic' latrines*)” in DRC and the ASAL regions; and “At least 70% of the beneficiaries that are reached at output level continue to use Fresh Life Toilets (FLTs)” for Sanergy
101 See Annex 5 of the Q4 2017 verification report. 102 The measurement of this indicator is more complex and there is considerable sector debate surrounding the appropriate
measurement and measurement validity. Refer to Section 4.2.1 of the SWIFT case study for more elaboration on this issue.
103 The results arose from an aggregation of red/amber/green (RAG) ratings where the indicator has a degree of acceptance of non-functionality across the year built into it.
104 SAWRP used the output-phase beneficiary database as the sample frame for the endline surveys in sanitation. By contrast, SWIFT and SSH4A surveyed the entire population in their implementation areas (including beneficiaries and non-beneficiaries). As such the SAWRP results indicate the extent to which specific output-phase beneficiaries continued to use their facilities, but does not give an indication of the population-wide usage levels in programme communities.
105 Refer to 4.2.1 of the SAWRP case study for more information on this point. 106 There was substantial debate regarding the methodology for the compound indicators, which is elaborated further in
Section 4.2.1 of the SAWRP case study. 107 At the output level for example, if a household constructed a latrine during the output phase those household members
were assumed to be both sanitation beneficiaries and reached by hygiene promotion. 108 See SAWRP’s annex for details. There were several changes to the measurement of the hygiene indicator during the
outcome phase. Notably that in Pakistan the initial outcome survey included respondents that were beneficiaries and non-beneficiaries (this was later changed to include only beneficiaries with the baseline retrospectively adjusted).
Evaluation of WASH Results Programme Endline Synthesis Report
e-Pact 50
4.2.2 Quality – level and issues that impacted on it
This section explores whether aspects in the programme design had an influence on the approach to quality, which relates directly to DEQ 2.6.
The quality of processes and outputs was generally reasonable, with no serious quality issues were identified. Several aspects in the programme design affected quality positively or negatively — such as the tight output-phase timetable or the output/outcome split:
For SSH4A, the evaluation team found that monitoring progress towards outcomes throughout
the programme appeared to increase the quality of latrines and handwashing stations over
time. For example, improvements in the technical quality of latrines was driven by SSH4A
deliberately promoting ‘small do-able actions’ to improve the quality of the current household
latrine, while also promoting options which help households move up the sanitation ladder.
One SWIFT partner noted that meeting the December 2015 output deadline while maintaining
high quality standards was difficult, and the three-month extension facilitated higher quality,
e.g. for water tanks. Also, due in part to staff reductions between phases, two other partners
reported suboptimal staff levels to engage adequately with communities or county governments
in the output phase.
For SAWRP, stakeholders offered differing opinions on whether the PbR modality itself
incentivised a focus on quality or whether the activities simply reflected existing operational
priorities. Regardless, the intense mobilisation and monitoring requirements added a layer of
scrutiny of the results that acted to incentivise quality, though the pressure to deliver ambitious
output targets by December 2015 meant that some processes were rather rushed. However,
they were able to ‘catch up’ and improve implementation quality109 (e.g. latrine quality) via
community commitments in the outcome phase.
As a result, there were some cases where the quantity of results was given priority over quality110.
As the individual findings on quality itself (e.g. relating to technology, materials used, capacity
building and/or processes) varied considerably between different countries and subcomponents
high-level generalisations are not meaningful. Readers should refer to Section 4.2.2 of each of the
suppliers’ respective supplier case study reports for a deeper discussion of findings relating to
quality.
In relation to the effect of PbR specifically, there was no clear indication that the PbR modality
helped or hindered implementation quality, though most stakeholders reported that accountability
for outcome-level results meant that they followed up to ensure that the functionality and use of
WASH facilities continued until the end of the outcome phase, which positively reflects on the
overarching programme design.
4.2.3 PbR influence on effectiveness of suppliers’ monitoring systems
The discussion in this section centres on the degree to which the supplier monitoring systems
generated data that were fit-for-purpose – and the influence of the PbR modality on this (DEQs 3.3
and 3.4). How efficient these systems were is considered separately in Section 4.3.3. More details
can be found in Section 4.2.3 of the respective supplier case study reports. Refer to Annex G for
more elaboration on the verification process of the supplier monitoring systems, and the midline
109 This was a specific programme aim for Plan International in Pakistan. Though it is noted that output results were paid on the basis of agreed quality standards with DFID – which included the definition of ‘basic’ latrines. 110 See midline evaluation report for specific examples.
Evaluation of WASH Results Programme Endline Synthesis Report
e-Pact 51
evaluation report for an earlier discussion of the effectiveness and efficiency of the monitoring
systems through the output phase, the key themes of which are incorporated below.
As suppliers were free to propose how they would measure results for their sub-programme, the
resulting monitoring systems varied widely. Monitoring built upon the suppliers’ existing monitoring
systems to the extent feasible, with SSH4A largely using existing systems whilst SAWRP and
SWIFT made more significant modifications.
Suppliers worked with verifiers iteratively to agree what was required and then implemented this as
appropriate. The repeated rounds of system appraisals conducted as part of the verification show
a clear pattern of improvement of monitoring systems over time.
After an extended period of modifications, the supplier monitoring systems were reasonably fit-for-
purpose in the end, with numerous satisfactory points. However, a few challenges remained, as
outlined below. That suppliers were only paid for independently verified results due to the PbR
modality substantially influenced the monitoring and reporting systems. Explicitly linking payments
to outcomes triggered a much deeper discussion around outcome measurement and the validity of
those measurements in particular.
SWIFT and SAWRP consistently reported that the MV burden was heavier than with other grant-
funded programmes, yet they overwhelmingly noted that it contributed to them strengthening their
monitoring systems. One of the most significant areas of improvement related to outcome
measurement, especially the level of rigour applied to surveys, given that such rigorous outcome
assessment was not common in WASH programmes at the time the WASH Results Programme
began, though outcome measurement was already part of the SSH4A approach. Suppliers also
reported having more confidence in the results they had achieved.
Suppliers also recognised that the monitoring data supported their risk management. For example,
the SSH4A programme management unit carried out a dummy check against the verification forms
to make sure the evidence would satisfy all the verification criteria. In those cases where it did not,
the supplier had the option of retracting its evidence before it was verified, to allow it to address
gaps.111 This approach helped to substantially reduce the number of queries verifiers made on the
evidence received. SNV also noted that having some of the enumerators on partial PbR contracts
substantially improved the quality of survey data.
During the outcome phase SAWRP partners continued to monitor the functionality of latrines and
water-points outside of the MV requirements – partially as a risk management strategy. For the
extension (SAWRP III) the consortium was able to develop clear monitoring and reporting
guidelines from the start. In addition, SAWRP stakeholders reported that having the entire team
involved in monitoring activities helped in building the capacity of the whole team.
WaterAid Pakistan reported that being forced to identify meaningful indicators and behaviour
change targets was a positive aspect of the PbR modality, and that it had since incorporated some
good practices, such as spot checks and back checks, into other, grant-funded projects. Similarly,
SNV indicated that it will continue to use surveys to track progress (rather than routine monitoring
systems) in future programmes – suggesting that the benefits of monitoring system strengthening
will continue beyond the lifetime of the WASH Results Programme. However, few SWIFT partners
chose to carry forward the higher standard of monitoring into other programmes.
Any benefits of strengthened monitoring systems were largely confined to the suppliers’ partners –
and did not include focusing on strengthening government monitoring, in the limited cases where it
111 From the midline evaluation report.
Evaluation of WASH Results Programme Endline Synthesis Report
e-Pact 52
was potentially relevant. Regardless, governments had more credible data on sanitation
improvements in locations where the programme had worked.
There is also evidence that the verification framework was sufficient to identify some issues related
to data collection. Notable examples for SWIFT in the outcome phase included: identifying issues
in Sanergy’s data transfer protocols and raising concerns over a large number of unexplained non-
responses in WSUP’s survey, as well as focus group discussion (FGD) evidence not being well
triangulated with survey results. In both cases this triggered action through the After-Action Review
process with DFID and the MV team, and subsequent systems appraisals identified improvements.
Notable examples for SSH4A included how to correctly sample for a population-wide survey, and
how to take into account population growth other time. Further examples are listed in the supplier
case studies.
SAWRP faced issues related to the measurement of hygiene. One issue was that the baseline
figures were unexpectedly high; another challenge was the fact that a sample for one verification
round included both beneficiaries and non-beneficiaries.
One broader ongoing challenge was SWIFT and SAWRP’s reliance on the use of multipliers for
calculating beneficiary numbers for indicator measurement at the output and outcome levels112.
While multipliers are common in WASH programmes, the specific values were often contested in
this programme, which increased tension as they were linked to supplier payments.
For example, SWIFT faced challenges related to the calculation of the number of people ‘reached’
with hygiene promotion via radio broadcasts in Kenya’s ASAL region. Similarly, SAWRP faced
challenges related to calculating school attendance. That the verification protocols triggered
scrutiny and debate surrounding these multipliers consequently led to more reliable multipliers and
therefore more reliable estimates of beneficiary numbers.
This raises the question of the value of the data generated and for what purposes they are used.
Different levels of data quality are needed for different purposes. For example, SWIFT recognised
improvements in the strength of its monitoring and the credibility of the data, yet viewed the effort
as beyond that needed for programme management, and regarded the investment in more
credible data as primarily for upward accountability purposes, or ‘compliance’. A further point is
that it was primarily quantitative data that were used for key payments; and that focusing on
quantitative data ran the risk of distracting from other more qualitative information on the
programme functioning, which would also have been useful to programme managers.
4.2.4 Experiences of anticipated heightened management attention
As indicated in the midline evaluation report,113 all three suppliers noted that the WASH Results
Programme was a new departure for the sector and would attract much external attention.
Conscious of reputational risk, all suppliers reported going to great lengths to ensure that targets
were met.
In the output phase, for example, there were several occasions in Kenya when implementing
partners drew on alternative sources of funding to resolve obstacles to progress: Oxfam paid for a
112 SNV did not use multipliers to estimate beneficiaries based on outputs constructed, but instead measured the number
of beneficiaries directly through household surveys. 113 This section is adapted, with non-material changes, from the midline evaluation report.
Evaluation of WASH Results Programme Endline Synthesis Report
e-Pact 53
power supply to a borehole when the utility failed to do so (this was the utility’s responsibility under
a cost-sharing agreement).114
Other behaviours were, however, less beneficial: Oxfam’s management, for example, waived
some of its procurement rules to speed up internal processes. Pressure was also put on staff and
on local partners to speed up implementation, with additional scrutiny of implementation activities.
Not all these examples of the programme being treated as a special case can be regarded as
desirable in the longer term. A common theme across suppliers was that the management burden
(including M&E) was greater than expected and was an area reportedly under-budgeted for
initially.
4.2.5 PbR modality and innovation in practice
This subsection addresses the degree to which innovation in implementation approaches
manifested for the suppliers, as well as what (if any) aspects of programme design influenced this.
Innovation in this context is taken to refer to innovations in programme approach – that is, where
there was an application of approaches that were novel to the global WASH sector to overcome
previous challenges. This framing of innovation around programme approach is rooted in the
assumption115 that PbR enables greater scope for innovation by removing donor requirements
related to implementation approaches. (DEQ 2.7)
As noted in the midline evaluation report, little evidence of innovations that were novel to the global
WASH sector were found as the suppliers implemented mostly familiar, tried and tested
programme approaches, in part to reduce the risk of not meeting targets, with the exception of
some of SWIFT’s activities in the ASAL region in Kenya.116 The SWIFT components that were not
fully tested at the start (at least not in the targeted locations) exacerbated PbR-related risks. For
example, Sanergy’s operational model evolved significantly over the course of the programme due
to strategic changes that were not related exclusively to SWIFT – but this meant that the
verification and payment criteria had to be revised, such as when the programme focus shifted
from public to shared residential toilets.
SSH4A country teams cited examples of cases where implementation approaches were developed
or adopted that were not in the original workplan and/or had not been used by SNV in that specific
country before.117 Yet, in all cases, these approaches were not new to the global WASH sector, but
rather just to SNV in that country.
In terms of technology, minor examples of local innovations mentioned by suppliers included the
use of solar-powered water pumps in SWIFT Kenya, mobile-based monitoring by SAWRP, and
developing and launching Safi latrines by SNV in Tanzania. These developments were beneficial
for the diffusion of new technologies. However, they were not strictly ‘innovative’, in the sense that
they were all technologies used by WASH practitioners elsewhere.118
114 NGOs sometimes shift funds from other sources to top-up under grant-funded programmes as well. 115 From much of the PbR literature – and was a causal mechanism that was included in the PbR theory of change
developed by the evaluation team and used in the contribution analysis. 116 For example, Practical Action and Oxfam’s application of CLTS in ASAL were new for them, but the approaches
themselves were well established in the sector. 117 For example, SNV added an option to pay back the cost of Safi latrines in instalments in Zambia, and used emo-demo
at children vaccination centres to promote handwashing in Tanzania. Refer to Section 4.2.4.1 of the SSH4A case study report for more examples of using known approaches in new contexts.
118 See Midline Evaluation Report
Evaluation of WASH Results Programme Endline Synthesis Report
e-Pact 54
For more details on innovation by supplier refer to Section 4.2.4.1 of their respective supplier case
study reports.
4.2.6 PbR modality and flexibility in practice
As with innovation, the framing of flexibility here is rooted in the assumption that under the
programme’s PbR modality, suppliers were expected to have greater autonomy over
implementation activities and over budget allocations as these were not reporting requirements
imposed by the donor.119
There was consistent feedback from all suppliers that the PbR modality contributed to there being
greater flexibility in budget management and choice of activities at the programme level. The
benefits appear to have been more pronounced in the larger country programmes than in SWIFT’s
diverse small programmes in Kenya’s ASAL region.120 Also, numerous interviewees noted that the
potential for flexibility was mitigated by the tight deadline for the output phase.
As was reported at the midline stage, the main benefit suppliers noted under the WASH Results
Programme, in comparison to non-PbR programmes, was having the flexibility to move funds
between budget lines. While suppliers still reported spending against budget lines internally, not
having to report and justify to DFID any changes in spending against budget lines gave suppliers
the flexibility to adjust the activities undertaken. For example, spending allocated to one region
could be moved to another if increased efforts were needed there, or more funds could be
allocated to community visits if increased efforts were needed in this regard. SWIFT stressed that
this transferability was particularly helpful in fragile-state contexts, where it was more challenging
to stay within the 10% variation required for each budget line under grant programmes. Several
SSH4A country managers noted that they changed the sequencing or scope of activities under
various SSH4A pillars.
As the majority of local implementing partners for all three suppliers were on grant agreements or
otherwise had highly structured workplans, the flexibility experienced at these levels was
significantly lower than that experienced at the international or national level.
In some cases, the MV requirements also limited potential flexibility. For example, a supplier that
was considering shifting its focus to a different area had to ensure that a new baseline was
established, which was often not feasible in the output phase within the timeframe and budget.
However, it was easier to shift additional targets to an existing area. Nevertheless, the SWIFT
team noted that transferring targets between areas was not always straightforward, as unit costs
varied hugely between projects and locations, and it was essential to work within the overall
budget ceiling for the country programme.
In some cases, the choice of implementation partners also limited potential flexibility. Where
programmes were implemented through government partners or utilities, the supplier had limited
control over any adjustments to the workplan or implication location. For example, when working
with water utilities, SWIFT had limited control over its procurement processes for water supply
equipment. For SSH4A, SNV held quarterly planning sessions with local government partners in
an attempt to jointly adapt programme activities where necessary.
119 Supplanted by reporting only on results. 120 Alternatively, the degree of flexibility from DFID – notably in SWIFT’s output-phase extension, allowing the transfer of
beneficiaries, and arbitrating on the significance of the drought in Kenya – was significant to partners avoiding significant financial losses.
Evaluation of WASH Results Programme Endline Synthesis Report
e-Pact 55
For more details on flexibility by supplier refer to Section 4.2.4.2 of their respective supplier case
study reports.
4.2.7 Experiences of adaptation and learning at the implementation level
This section discusses the degree to which adjustments at the implementation level were made to
improve effectiveness, based on insights gained from near real-time monitoring data or
evaluations. This is distinguished from innovation in programme approach more broadly, as well as
flexibility (as framed above). As with innovation and flexibility this framing is rooted in the context of
this programme and an assumption121 that the PbR modality would incentivise such adaptation at
the implementation level to ensure targets were met effectively and therefore facilitate or increase
payments.
In the absence of a counterfactual, it was not straightforward for the evaluation to assess whether
any adaptation at the implementation level was greater than usual, nor whether the PbR modality
specifically brought about more adaptation at the implementation level. One would expect
programme management to be responsive to learning, whether or not there is a PbR framework,
and this is likely to have been encouraged by the organisations themselves – regardless of PbR.
Given this caveat, for some suppliers it does appear that the pressure to deliver results
encouraged a closer examination of which activities were most effective – especially when the
regular monitoring data revealed that some activities were clearly not delivering the desired results.
This effect appeared to be particularly noticeable under SSH4A: almost all interviewed SNV
country teams agreed that having a feedback loop from the progress data was very useful – as it
allowed teams to see where progress was faster or slower, and to then prioritise their
interventions. One SNV team summarised this as ‘failure was not an option, we needed to find a
solution every time’. A key SSH4A stakeholder reported that the fundamental shift was that
programming was driven by the M&E and its feedback loop with adaptive programming – as
opposed to programming being driven by milestones in workplans. It appears that having a short
feedback cycle between the progress being reported and management action being taken was
key, as all SNV country teams reviewed progress data at least on a monthly basis.122 Holding
reflection meetings with the district partners based on routine monitoring data – a standard
approach under SSH4A – was a mechanism through which to them operationalise adaptive
programming.
However, other partners reported that the tight timeline and variations in the capacity of local
partners limited the ability to adjust programming based on evidence of (lack of) effectiveness. For
example, SNV staff noted that the technical ability to respond depended on the capacity of the
local implementer, and on the quality of progress data collected, which likely affected the number
of issues revealed in a timely fashion. Similarly, SAWRP noted that the limited degree of flexibility
at the implementation level due to prescribed workplans and/or the tight timetable during the output
phase made significant shifts in implementation at local level unrealistic. Both SWIFT in DRC and
SAWRP noted that there was more space to reflect and adapt during the outcome phase PbR.
121 Included in the PbR theory of change developed by the evaluation team and used in the contribution analysis as a
testable proposition. 122 Particularly notable was revising BCC approaches – the effectiveness of which was widely questioned in the sector –
in order to improve their ability to change handwashing behaviour, such as introducing ‘emo-demos’ in Tanzania to deliver handwashing messaging to mothers in a health clinic setting, because the messages were more effective when delivered to mothers who were concerned about their children’s health.
Evaluation of WASH Results Programme Endline Synthesis Report
e-Pact 56
Nonetheless, the evaluators found evidence of SAWRP and SWIFT taking remedial actions in
response to challenges on the ground, such as replacing or repairing non-functioning equipment in
response to monitoring data which flagged a drop in functionality. This was partly aided by the fact
that in Pakistan, SAWRP local partners spent more time in communities, due to stringent
monitoring requirements, which allowed them to respond to local issues faster.123 SWIFT
stakeholders reported that the accountability for outcomes triggered action, as opposed to the
monitoring data. Partners saw value in the improved monitoring as – combined with greater
accountability for outcomes – it helped them improve programme operations.
For more details of adaptation and learning at the implementation level by supplier, refer to Section
4.2.5 of the respective supplier case study reports.
4.2.8 Learning in practice
This section briefly discusses learning activities within the supplier consortia, further details of
which are addressed in Section 4.2.6 of each case study report. Wider sectoral learning is
discussed in Section 4.5.3.1. First, learning on implementation by each supplier is discussed. Next,
programme-wide learning on PbR by the Itad L&D team is discussed. As indicated in the midline
evaluation, the design was somewhat appropriate to facilitate learning on PbR: DFID intended to
promote learning, thorough a dedicated L&D team was set up within the MV team, and annual
Supplier Learning Events. However, an explicit lesson-sharing mechanism between suppliers was
only introduced in April 2015.
As noted in the midline evaluation report, Itad’s L&D group was the mechanism for enabling
learning on PbR across the programme. At various points during the WASH Results Programme
implementation the L&D group organised several learning events that brought together the three
parties (DFID, suppliers, and the MVE team) implementing the WASH Results Programme. While
the majority of these learning events involved only those organisations implementing the
programme, the WASH MVE blog (https://washresultsmve.wordpress.com) acts as a
dissemination channel for key learnings. Table 17 provides an overview of the learning events and
outputs produced by the L&D team. The MV team also held annual internal workshops with the
evaluation team to consolidate the lessons learned about verification. Further guidance is currently
being written by ITAD on how to design a verification system, how to set up a systems-based
verification system and how to select good indicators.
Suppliers reported considerable internal learning – with mechanisms built into aspects of the
programme design to ensure that this learning was applied across the programme (particularly the
after-action reviews under the verification framework). In addition to this it is clear that there were
efforts to disseminate learning at the global level: notably at several WEDC conferences and World
Water Week in Stockholm in 2018. What varied more was the dissemination at the national sector
level – in some cases (particularly Pakistan and Kenya) there could have been a greater focus on
consolidating and sharing learning at the national level. Furthermore, both of the learning partner
(WEDC and ODI) reported that their learning function was ‘crowded out’ in favour of supporting the
development of monition frameworks – particularly in the first half of the programme. This is
partially related to the fact that the monitoring and verification burden was more intensive than the
suppliers expected and due in part to the rushed nature of the Output-phase implementation. A
similar experience was reported by country level implementation staff that highlighted at these
times a focus on learning was constrained by the pressure to deliver results.
123 See midline evaluation report
Evaluation of WASH Results Programme Endline Synthesis Report
e-Pact 57
Each of the three suppliers reported formal and informal learning within their consortia, though the
extent of attention given varied between suppliers and countries and all were challenged with
regard to having enough time and resources to dedicate to learning, particularly in the first two
years. The key internal learning activities of each Supplier consortia are detailed below:
SSH4A placed a strong emphasis on learning: capacity building and sector strengthening was
one of the four pillars of SSH4A and SNV as a knowledge-based organisation placed great
importance on capacity building. SNV conducted a variety of within- and across-country
learning activities, including regular webinars and annual workshops, to bring together
programme staff and government counterparts from all SSH4A countries to capture learning
and compare experiences. Country teams found these to be extremely useful as opportunities
to exchange experiences and to learn from other countries: for example, on how to deal with
the tight MDGs deadline and the PbR modality. Government partners were also invited to
SSH4A learning events.124 At the midline stage, several SNV staff felt that there was less
space for learning in the first two years, due to the time pressure of the MDGs deadline.
SWIFT stakeholders reported clear learning benefits, largely confined to learning around PbR
within the consortium, yet there were also lost opportunities related to further utilising the data
collected for verification across the consortia125, due in part to the tight schedule in the output
phase. During the output phase there were two internal reviews and many meetings between
consortium members; a website was also established. While partners noted learning –
especially related to how to manage a PbR contract – there was not a conscious effort to
share lessons with other sector stakeholders in Kenya, in DRC there was a more clear effort to
share this learning at the sector level through national level events on running PbR
programmes. Some partners were also explicit that they viewed retaining the learning on
managing PbR contracts as part of maintaining a competitive edge over other organisations.
In the outcome phase, learning was not emphasised in SWIFT Kenya, but was given
substantially more attention in the larger programme in DRC. SWIFT global programme
managers noted significant staff development under the programme. Consortium partners
valued ODI’s role as the learning partner, such as its formative and operational research
(predominantly in DRC) and in supporting survey implementation (relevant in both countries).
Though ODI noted that its research role was slightly crowded out in favour of supporting
monitoring efforts – especially in the output phase. The focus of the monitoring efforts was on
upward accountability. Both ODI and SWIFT global management highlighted that there was
perhaps a missed opportunity as regarded utilising these data for learning.
Key SAWRP learning activities included facilitation of multiple workshops and learning with consortium members and implementing partners in Bangladesh and Pakistan, the development of a series of case studies on programme implementation, and presentations at multiple conferences126. Partners reported that learning was somewhat marginalised, as staff were preoccupied with quarterly reporting and meeting contractual targets. Nevertheless, there was a great deal of learning through experience, e.g. on programme monitoring and the partnership models. WEDC was the SAWRP learning partner; earlier on in the programme they reported the focus of their support was around developing the monitoring frameworks127; with the focus later shifting more towards learning.
124 SNV felt it had the internal capacity to foster learning across country teams without a dedicated learning partner. 125 This point was a reflection of the learning partner (ODI). Specifically, that should the MV requirements have been clearer
from the start there could have been a greater focus on harmonising the data collected across contexts and/or using the data collected for learning purposes.
126 Including several of the WEDC conferences, World Water Week in Stockholm and SACOSAN – these are discussed more in Section 4.2.6 of the SAWRP case study and in Section 4.5.6 of this report.
127 Particularly in agreeing the indicators and measurement methods of the MVO and MVOC, and in supporting the development of the SAFs.
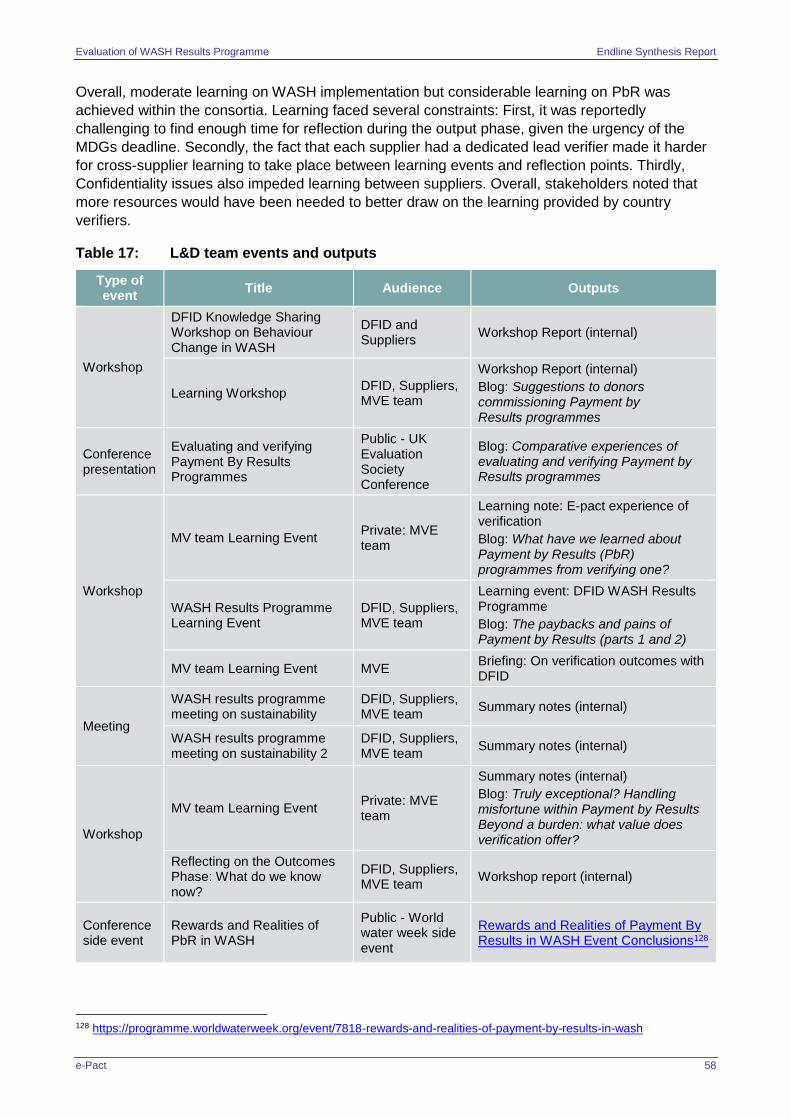
Evaluation of WASH Results Programme Endline Synthesis Report
e-Pact 58
Overall, moderate learning on WASH implementation but considerable learning on PbR was
achieved within the consortia. Learning faced several constraints: First, it was reportedly
challenging to find enough time for reflection during the output phase, given the urgency of the
MDGs deadline. Secondly, the fact that each supplier had a dedicated lead verifier made it harder
for cross-supplier learning to take place between learning events and reflection points. Thirdly,
Confidentiality issues also impeded learning between suppliers. Overall, stakeholders noted that
more resources would have been needed to better draw on the learning provided by country
verifiers.
Table 17: L&D team events and outputs
Type of event
Title Audience Outputs
Workshop
DFID Knowledge Sharing Workshop on Behaviour Change in WASH
DFID and Suppliers
Workshop Report (internal)
Learning Workshop DFID, Suppliers, MVE team
Workshop Report (internal)
Blog: Suggestions to donors commissioning Payment by Results programmes
Conference presentation
Evaluating and verifying Payment By Results Programmes
Public - UK Evaluation Society Conference
Blog: Comparative experiences of evaluating and verifying Payment by Results programmes
Workshop
MV team Learning Event Private: MVE team
Learning note: E-pact experience of verification
Blog: What have we learned about Payment by Results (PbR) programmes from verifying one?
WASH Results Programme Learning Event
DFID, Suppliers, MVE team
Learning event: DFID WASH Results Programme
Blog: The paybacks and pains of Payment by Results (parts 1 and 2)
MV team Learning Event MVE Briefing: On verification outcomes with DFID
Meeting
WASH results programme meeting on sustainability
DFID, Suppliers, MVE team
Summary notes (internal)
WASH results programme meeting on sustainability 2
DFID, Suppliers, MVE team
Summary notes (internal)
Workshop
MV team Learning Event Private: MVE team
Summary notes (internal)
Blog: Truly exceptional? Handling misfortune within Payment by Results Beyond a burden: what value does verification offer?
Reflecting on the Outcomes Phase: What do we know now?
DFID, Suppliers, MVE team
Workshop report (internal)
Conference side event
Rewards and Realities of PbR in WASH
Public - World water week side event
Rewards and Realities of Payment By Results in WASH Event Conclusions128
128 https://programme.worldwaterweek.org/event/7818-rewards-and-realities-of-payment-by-results-in-wash
Evaluation of WASH Results Programme Endline Synthesis Report
e-Pact 59
4.2.9 PbR influence on achievement of outcomes
The PbR framework was a significant factor contributing to the outcome level results, since
suppliers had to meet their outcome level targets if they were to avoid a financial penalty (though
payments in the outcome phase were generally much smaller than at output level). This does not
imply, however, that PbR is the only means by which a funding agency can focus suppliers’
attention on outcomes, and in this case the fact that the programme design featured distinct output
and outcome phases was also very significant. Most WASH programmes adopt outcome level
targets, but few actually measure their achievements in this area; often the focus remains on
output delivery right up to programme end. The WASH Results Programme was different in that
DFID made it clear from the outset that it would assess progress at both output and outcome level,
hence suppliers had to put in place processes both for delivering and measuring outcome level
results.
Looking at the sector more broadly, the SDGs are now leading development agencies and
governments globally to focus more on outcomes, given the SDG focus on ‘safely managed’ water
supplies and sanitation. These targets cannot be met simply by providing access to infrastructure,
hence programmes will increasingly need to focus on outcome level results, with or without PbR.
It is also important to note that the structure of the verification cycles included a mechanism (the
‘After action reviews’) to ensure that key learning surrounding measurement and verification of
indicators was applied in subsequent verification rounds. This is well reflected in improvements in
the periodical systems appraisals conducted by the MV team; which document improvements in
supplier monitoring process across the programme (see Section 4.2.3 for further details).
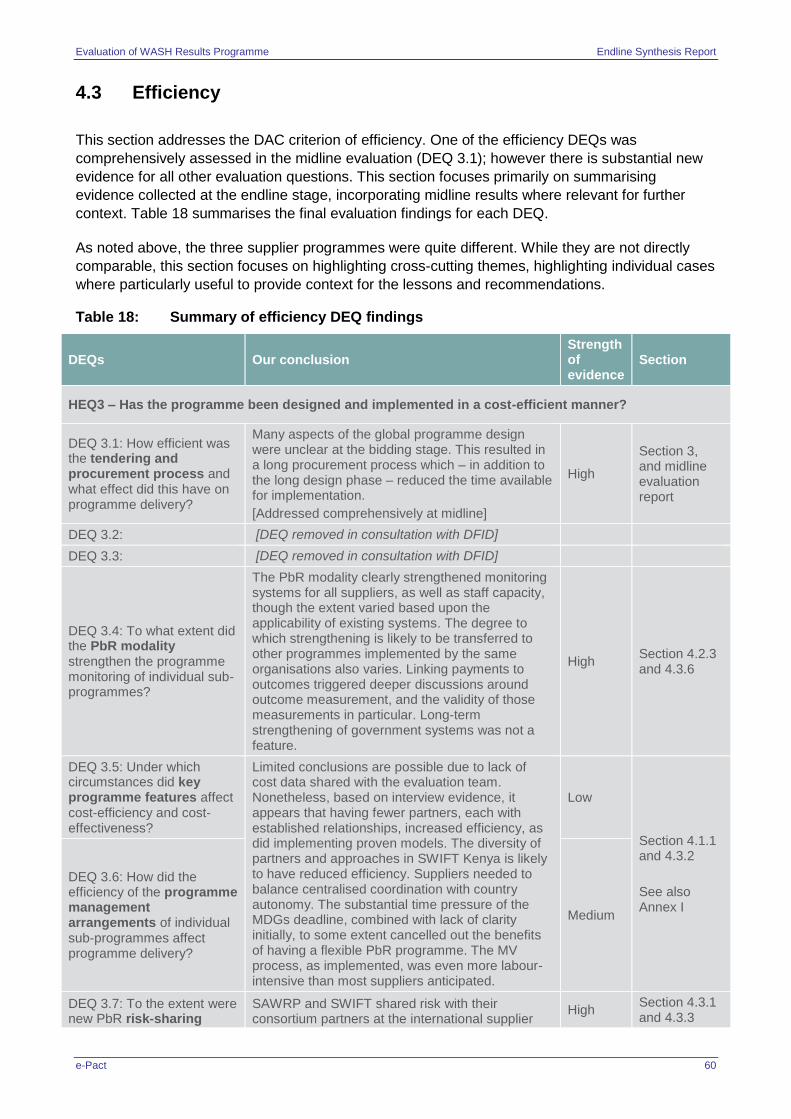
Evaluation of WASH Results Programme Endline Synthesis Report
e-Pact 60
4.3 Efficiency
This section addresses the DAC criterion of efficiency. One of the efficiency DEQs was
comprehensively assessed in the midline evaluation (DEQ 3.1); however there is substantial new
evidence for all other evaluation questions. This section focuses primarily on summarising
evidence collected at the endline stage, incorporating midline results where relevant for further
context. Table 18 summarises the final evaluation findings for each DEQ.
As noted above, the three supplier programmes were quite different. While they are not directly
comparable, this section focuses on highlighting cross-cutting themes, highlighting individual cases
where particularly useful to provide context for the lessons and recommendations.
Table 18: Summary of efficiency DEQ findings
DEQs Our conclusion Strength of evidence
Section
HEQ3 – Has the programme been designed and implemented in a cost-efficient manner?
DEQ 3.1: How efficient was the tendering and procurement process and what effect did this have on programme delivery?
Many aspects of the global programme design were unclear at the bidding stage. This resulted in a long procurement process which – in addition to the long design phase – reduced the time available for implementation.
[Addressed comprehensively at midline]
High
Section 3, and midline evaluation report
DEQ 3.2: [DEQ removed in consultation with DFID]
DEQ 3.3: [DEQ removed in consultation with DFID]
DEQ 3.4: To what extent did the PbR modality strengthen the programme monitoring of individual sub-programmes?
The PbR modality clearly strengthened monitoring systems for all suppliers, as well as staff capacity, though the extent varied based upon the applicability of existing systems. The degree to which strengthening is likely to be transferred to other programmes implemented by the same organisations also varies. Linking payments to outcomes triggered deeper discussions around outcome measurement, and the validity of those measurements in particular. Long-term strengthening of government systems was not a feature.
High Section 4.2.3 and 4.3.6
DEQ 3.5: Under which circumstances did key programme features affect cost-efficiency and cost-effectiveness?
Limited conclusions are possible due to lack of cost data shared with the evaluation team. Nonetheless, based on interview evidence, it appears that having fewer partners, each with established relationships, increased efficiency, as did implementing proven models. The diversity of partners and approaches in SWIFT Kenya is likely to have reduced efficiency. Suppliers needed to balance centralised coordination with country autonomy. The substantial time pressure of the MDGs deadline, combined with lack of clarity initially, to some extent cancelled out the benefits of having a flexible PbR programme. The MV process, as implemented, was even more labour-intensive than most suppliers anticipated.
Low
Section 4.1.1 and 4.3.2
See also Annex I
DEQ 3.6: How did the efficiency of the programme management arrangements of individual sub-programmes affect programme delivery?
Medium
DEQ 3.7: To the extent were new PbR risk-sharing
SAWRP and SWIFT shared risk with their consortium partners at the international supplier
High Section 4.3.1 and 4.3.3
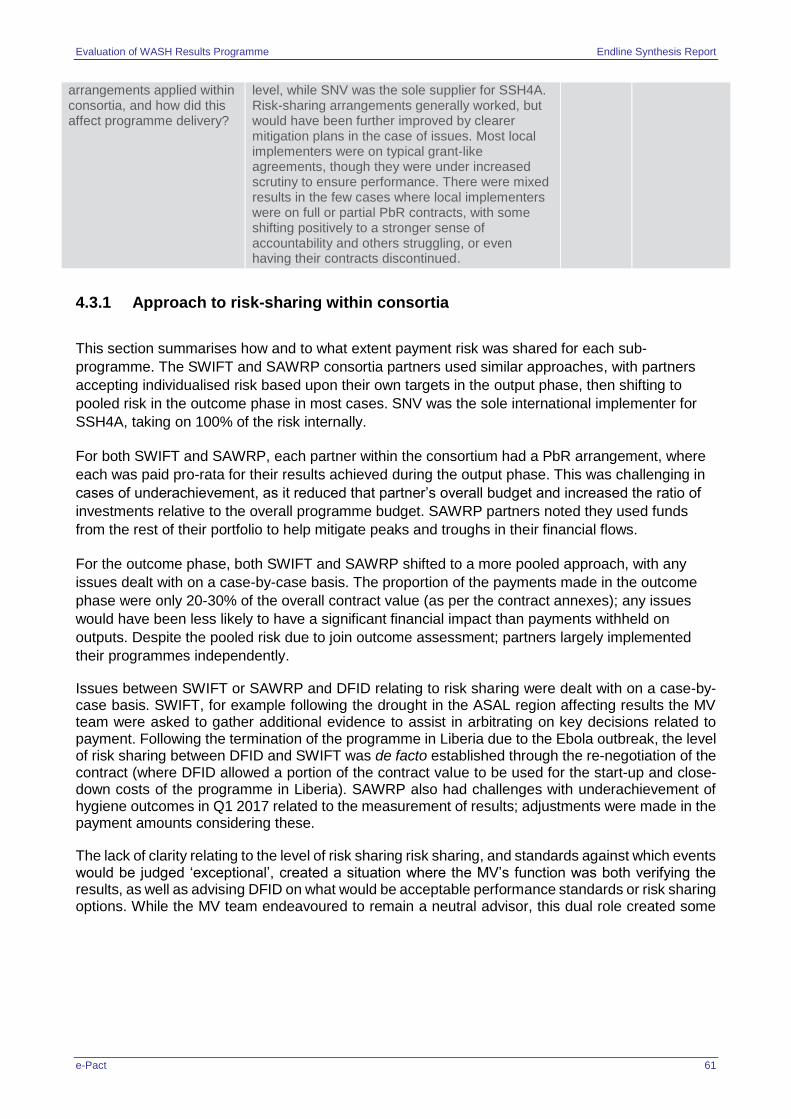
Evaluation of WASH Results Programme Endline Synthesis Report
e-Pact 61
4.3.1 Approach to risk-sharing within consortia
This section summarises how and to what extent payment risk was shared for each sub-
programme. The SWIFT and SAWRP consortia partners used similar approaches, with partners
accepting individualised risk based upon their own targets in the output phase, then shifting to
pooled risk in the outcome phase in most cases. SNV was the sole international implementer for
SSH4A, taking on 100% of the risk internally.
For both SWIFT and SAWRP, each partner within the consortium had a PbR arrangement, where
each was paid pro-rata for their results achieved during the output phase. This was challenging in
cases of underachievement, as it reduced that partner’s overall budget and increased the ratio of
investments relative to the overall programme budget. SAWRP partners noted they used funds
from the rest of their portfolio to help mitigate peaks and troughs in their financial flows.
For the outcome phase, both SWIFT and SAWRP shifted to a more pooled approach, with any
issues dealt with on a case-by-case basis. The proportion of the payments made in the outcome
phase were only 20-30% of the overall contract value (as per the contract annexes); any issues
would have been less likely to have a significant financial impact than payments withheld on
outputs. Despite the pooled risk due to join outcome assessment; partners largely implemented
their programmes independently.
Issues between SWIFT or SAWRP and DFID relating to risk sharing were dealt with on a case-by-case basis. SWIFT, for example following the drought in the ASAL region affecting results the MV team were asked to gather additional evidence to assist in arbitrating on key decisions related to payment. Following the termination of the programme in Liberia due to the Ebola outbreak, the level of risk sharing between DFID and SWIFT was de facto established through the re-negotiation of the contract (where DFID allowed a portion of the contract value to be used for the start-up and close-down costs of the programme in Liberia). SAWRP also had challenges with underachievement of hygiene outcomes in Q1 2017 related to the measurement of results; adjustments were made in the payment amounts considering these.
The lack of clarity relating to the level of risk sharing risk sharing, and standards against which events would be judged ‘exceptional’, created a situation where the MV’s function was both verifying the results, as well as advising DFID on what would be acceptable performance standards or risk sharing options. While the MV team endeavoured to remain a neutral advisor, this dual role created some
arrangements applied within consortia, and how did this affect programme delivery?
level, while SNV was the sole supplier for SSH4A. Risk-sharing arrangements generally worked, but would have been further improved by clearer mitigation plans in the case of issues. Most local implementers were on typical grant-like agreements, though they were under increased scrutiny to ensure performance. There were mixed results in the few cases where local implementers were on full or partial PbR contracts, with some shifting positively to a stronger sense of accountability and others struggling, or even having their contracts discontinued.
Evaluation of WASH Results Programme Endline Synthesis Report
e-Pact 62
tension through a degree of conflict of interest within the triangular relationship involving DFID, the Suppliers, and the MV team129.
With the exception of WaterAid Bangladesh’s local implementers under SAWRP, all other local implementers for SWIFT and SAWRP were contracted using ‘normal’ grant agreements.130
Regardless, all local implementers were managed closely to ensure performance. Suppliers also planned a built-in level of overachievement in some cases as a risk management strategy.
As SSH4A was led solely by SNV and not implemented by a consortium, the overall DFID payment
risk was held solely by SNV and not shared with anyone at the international level.131 This was a
deliberate choice by SNV to simplify any risk-sharing arrangements (midline finding). Within SNV,
the programme management unit of SSH4A in Nairobi held the risk and held responsibility for all
national budgets, and country offices were not penalised if there was a financial penalty for
delayed results or for underperformance. The programme management unit could shift funding
between countries and held some funding in reserve, which could be deployed to manage
unexpected developments. At a country level, SNV managed the financial risk of
underachievement by using full or partial PbR contracts for some local implementers, and by using
a partial PbR ethos with local government partners (see Section 4.3.3 for its implications on
partners).
Overall, SNV managed the financial risk of underachievement by only agreeing programme-wide
targets with DFID. As a result, overachievement in one country could balance underachievement in
another. SSH4A is the only consortium which did not have country-specific targets with DFID,
though SNV set country-specific targets for internal planning purposes.
This issue is further addressed in Section 4.3.1 of each of the supplier case study reports.
4.3.2 Efficiency of management arrangements
Due to the lack of detailed financial data it is impossible for the evaluators to make a firm appraisal
of the efficiency of the management arrangements. The assessment is further complicated by the
fact that each supplier took a different approach to the management arrangements. SSH4A,
SAWRP, and SWIFT in DRC all applied existing implementation models and often also had
established relations, which served to increase efficiency. The diversity of subcomponents, as well
as some new approaches for SWIFT in Kenya, is likely to have reduced efficiency, but may have
had other offsetting benefits. Highlights by supplier follow:
SNV was the sole international implementer for SSH4A, and implemented a pre-existing
framework. Therefore, the management arrangements and reporting lines appeared to be clear
and straightforward, though specific reporting structures varied somewhat by country.
Oxfam, as the SWIFT lead, was responsible for aggregating results and reporting to DFID. The
project management burden was reportedly considerable due to the number of projects and
verification requirements – especially during the output phase, when the verification rounds
were more frequent. Also, there were many meetings with implementing partners as
operational systems were being established, which were viewed as informative though time-
129 The Conflict of Interest could arise from, for example, the verifier potentially being predisposed to finding positive
results when suppliers used approaches which the verifier recommended and/or finding negatives where the verifier’s suggestions were not incorporated by suppliers. 130 WaterAid Bangladesh used a system of both upside incentives and penalties.
131 As discussed above, SNV used partial PbR contracts at the local level in some SSH4A countries where implementation
involved NGOs.
Evaluation of WASH Results Programme Endline Synthesis Report
e-Pact 63
consuming. The management burden reduced considerably during the outcome phase, when
the partners worked largely independently. It is possible that the large number of partners in
Kenya decreased efficiency, though this was not due to the PbR modality.
The SAWRP consortium was able to take advantage of Plan International and WaterAid’s
existing working relationship, combined with applying a tested operational model to increase
efficiency, though the sub-programme had more administrative layers than would normally be
the case. A dedicated Country Co-ordination Unit (CCU) intended to take some of the
administrative burden off the country managers. The role of the CCU changed over time from
what was initially envisaged, this changing role created some confusion and at times some
minor tensions, for example, some felt that the CCU was over-reaching at times, by asking for
too much information on programme activities.
For more details by supplier refer to Section 4.3.2 of their respective supplier case study reports.
4.3.3 Effect on relationships with partners and government
The PbR modality did not appear to significantly influence relationships with local implementing
partners (either NGOs or governments) in most cases, though several partners reported
frustrations with the tight timeline for the output phase. However, SSH4A experienced a different
dynamic, with the subset of local implementing partners which SNV put on full or partial PbR
contracts. Overall, the social capital resulting from having established relationships with local
NGOs and government partners significantly contributed to maintaining good relationships even
under tight timelines.
SAWRP Pakistan staff reported that local implementing partners, which, for WaterAid and Plan
International, were all NGOs, still felt responsible for meeting agreed targets, even if they were not
on PbR contracts – going so far as to contribute their own ‘core’ funds to cover unexpected
expenses. In contrast, SWIFT noted that it was at times challenging to put pressure on local
NGOs, especially in DRC, where some NGOs were used to receiving grant funding without strict
deadlines.132
In the case of local government partners, country programme managers exerted pressure through
regular supervision and monitoring. Both SSH4A and SWIFT reported that the pressure to deliver
under the programme put a strain on some valuable relationships because government partners
were asked to prioritise programme activities over other ongoing projects. More positively, local
government in Pakistan remarked that the increased credibility of the data gave them greater
confidence in the results.
Noteworthy was SNV’s use of full or partial PbR contracts for local implementers in some SSH4A
countries – an approach not used by any other supplier.133 As noted in the midline evaluation
report, SNV exerted a high level of management and supervisory control, which strained local
implementer confidence, trust, and commitment.
For some local NGO implementers, the risk-sharing arrangement appears to have led to a shift in
culture: they had a stronger sense of accountability. However, numerous local implementers for
SSH4A on full or partial PbR contracts struggled, for a variety of reasons, including the extreme
132 See midline evaluation report for further details 133 SNV used a grant arrangement in Ethiopia, used partial PbR contracts in three countries (Mozambique, Nepal, and
Uganda), and briefly used a full PbR contract for local implementers in Tanzania. A full PbR contract meant that no advance was given and payment was made every few months, if the agreed milestone was met. Partial PbR contracts meant that an advance was given and a final payment was made on a milestone basis, when the final target was met. If achievements did not meet the agreed target, a payment deduction could be made.
Evaluation of WASH Results Programme Endline Synthesis Report
e-Pact 64
time pressure of the output phase, lack of experience with performance-based payments, or the
degree of documentation required, as well as limited pre-financing capabilities, which created cash
flow issues. The dynamic caused stress for many and a few staff left their organisations because
they could not deliver at the pace required. SNV also discontinued some contracts due to poor
performance.
For SSH4A’s government partners, risk-sharing appears to have increased ownership and buy-in.
For the three countries where implementation was through local government partners (Kenya,
Tanzania, and Zambia), SNV followed a partial PbR ethos, with payment made only after
submission of evidence. However, payments were linked to completion of activities, as opposed to
linked to the population reached. SNV succeeded in instilling government commitment to results
through memorandums of understanding (MOUs), by setting non-binding district targets, creating
competition between districts, and by only reimbursing expenses based on evidence. In some
cases, however – for example in Tanzania – government partners reported that some government
staff were uncomfortable working under PbR terms, whilst others were more willing. As with NGO
staff, some government staff – especially at the lower levels of government – struggled to pre-
finance their expenses.
Refer to Section 4.3.1.2 of each of the supplier case study reports for more details.
4.3.4 Effect on supplier staff
The tight timetable in the output phase, in conjunction with the new PbR modality, increased
pressure and challenges, though it also provided learning opportunities for supplier staff. The level
of effort needed to meet monitoring requirements was also more than most country teams
anticipated. Numerous staff reported working extra hours on nights and weekends, and a few staff
left due, at least in part, to the pressure. In some instances, additional staff were added to meet
requirements. This suggests that even though the programme achieved – and often overachieved
– its targets, this came with sacrifices, particularly for staff at the local implementing level. This
finding held across all suppliers:
Different country teams varied in their ability to manage this additional pressure –
probably due to a variation in staff competencies and a variation in the staff’s previous
experience with PbR. For instance, staff for SSH4A Nepal – which was the only country
that had previously implemented the SSH4A approach – felt more able to integrate the
programme’s requirements into their working pattern. In contrast, SSH4A Tanzania staff
reported that in hindsight they could have benefited from a more careful risk analysis at the
onset, to help foresee some of the challenges they encountered.
The pressure to deliver results had various effects on the social capital which
organisations had with respect to their national partners. On the one hand, there were
reports that some partners used up part of this social capital, in order to deliver the
programme within the tight timeframe. For example, international partners in Kenya said
that they tended to give SWIFT priority over their other projects, given the reputational and
financial risks associated with the programme. Alternative resources were sometimes used
to resolve short-term problems, plug gaps, and ensure a smooth flow of funds, which would
not necessarily be sustainable over time. Reputational risk was itself a strong motivator for
the suppliers, beyond the financial incentives. On the other hand, several SAWRP staff
members felt that the PbR modality enhanced accountability and focused implementation
around results, as opposed to implementing workplans.
Evaluation of WASH Results Programme Endline Synthesis Report
e-Pact 65
One unexpected benefit reported by some partners was the strengthened role of
M&E in programming of the supplier NGOs. Several SAWRP partners and Practical
Action in Kenya said that the pressure to deliver results fostered greater collaboration
between departments within the organisation. For example, the M&E team and finance
teams’ functions had greater overlap and integration. This is discussed in more detail in
Section 4.2.3
Refer to Section 4.3.1.1 of the supplier case study reports for more details.
4.3.5 Supplier views on relations with verifiers
All suppliers reported relations with the verifiers as being cordial, yet also involving some
challenges. For example, some noted that developing and agreeing the verification protocols and
indicators at the start of the programme was a time-consuming process. During implementation,
there were times when multiple requests for clarification or additional information from the MV
team was challenging due to the time it took suppliers to collect the information.
Partly to manage the risk of miscommunication across a multi-country programme, SNV decided
that all interaction between SNV and the MV team should be centralised. As a result, the country
verifier and the country teams could not communicate directly, which made the verifiers’ work more
challenging at times.134
Verification also validated the suppliers’ work, which supplier staff appreciated. In addition, in some
cases, supplier staff said that it increased government ownership of the programme.
All verifier staff were experienced WASH professionals who felt they had relevant advice to offer
on programming but the provision of advice to country teams was not allowed within their
verification role. Instead, the MV team was only set up to advise DFID. Verifiers were unsatisfied
with this dynamic, yet it would have presented a conflict of interest for them to have been more
proactively engaged.135
More details on this issue are given in Section 4.3.3.1 of the respective supplier case study
reports.
4.3.6 Efficiency of monitoring
This section focuses on the efficiency of supplier monitoring systems. Refer to Section 4.2.3 above
for a discussion of effectiveness. More supplier-level details can be found in Section 4.2.3 of the
respective supplier case study reports. Refer to Annex G for more elaboration on the verification
process of the supplier monitoring systems.
Without cost data it is impossible for the evaluation to make definite conclusions on the efficiency
of the monitoring systems for the supplier sub-programmes. Nevertheless, key themes have
emerged on what is likely to have either increased or reduced efficiency overall. It is important to
stress that meeting MV requirements was fairly expensive relative to norms under grant-funded
134 For example, as near the beginning of the programme, it was time consuming for the verification to understand what
the differences were in implementation approach between the various countries. 135 The terms of reference (TORs) for the verifiers specified them to be technical advisers to DFID, but not to suppliers, to
avoid influencing implementation approaches.
Evaluation of WASH Results Programme Endline Synthesis Report
e-Pact 66
WASH programmes and cumbersome because the WASH Results Programme was the first of its
kind – a future programme may have a less steep learning curve.
Key elements that improved efficiency of monitoring were the extent to which suppliers could use
existing systems, as well as the degree to which the same monitoring approaches and verification
indicators could be deployed across all countries, even if it meant that a local implementer’s
systems had to be adapted to the common framework.
At one extreme, SNV was able to use its existing systems across all SSH4A countries with only
minor modifications. However, SSH4A was the only supplier for whom tailored evidence
requirements had to be designed for most results packages – especially those in the output phase
(when surveys were repeated, the same evidence requirements could be re-used). This was a
time-consuming exercise, particularly for ‘process milestones’, where the evidence submitted
sometimes ran to thousands of pages. To simplify the process, SNV made several revisions to the
methodology for its sustainability indicators, as the long list of sub-indicators was unwieldy for
verification, especially given the increased number of focus groups required. However, the sample
was still so small that there was a risk that sustainability results could be skewed by outliers.
Both SAWRP and SWIFT had to make substantial modifications to their systems to meet verifier
requests at the beginning of the output phase, which were significantly beyond that anticipated. For
example, SAWRP and SWIFT DRC had to develop adapted/tailored monitoring systems for the
WASH Results Programme. Once systems for each phase were in place, the level of ongoing
effort was fairly predictable, if time-consuming at the level of detail required. Though many of the
outcome indicators were not finalised until after the monitoring systems had been established and
suppliers reported some challenges in responding to additional evidence requirements for the
purposes of verification.
The diversity of components and implementing partners under SWIFT Kenya limited opportunities
for economies of scale for the verification process, as verification requirements were negotiated
with each implementing partner. This issue was exacerbated by SWIFT’s initial impression that
existing monitoring systems in Kenya would suffice – only after the programme began did it
become clear that changes would be needed, e.g. increasing spot checks by implementing
partners.
The requirements for baseline surveys was a particular challenge. For example, SWIFT faced
issues when there was a mismatch between the communities surveyed and those locations where
work actually proceeded. Some SSH4A countries also faced challenges with baselines, such as
when government partners requested SNV to begin operating in additional areas. As noted above,
the baseline survey requirement also limited flexibility in terms of shifting targets away from
underperforming areas to other locations.
SAWRP staff highlighted another challenge faced during the output phase, when the verifier
requested additional information that required teams to revisit villages and households to collect
the missing data. SAWRP in Pakistan also highlighted the potential burden the MV process could
put on beneficiaries, if visits were not sufficiently coordinated. In the outcome phase, most
households were likely to be visited at least three, and up to six times for latrine status checks
relating to monitoring or quality assurance, often by people community members did not know (e.g.
representing different consortium management levels).
The use of paper-based surveys, later keyed into Excel databases, in some countries decreased
efficiency, and there were cases of shifts to some form of mobile-based data collection during the
WASH Results Programme.
Evaluation of WASH Results Programme Endline Synthesis Report
e-Pact 67
Suppliers provided some examples, though inconsistently, of how experience with MV under the
WASH Results Programme has led to improvements for use in other programmes. For example,
WaterAid in Bangladesh adapted some of the monitoring improvements introduced under SAWRP
for use in other programmes, such as mechanisms for feeding back the findings of monitoring
activities to implementing partners; using mobile phone-based reporting; making spot checks;
quality assuring monitoring systems; and strengthening accountability for the delivery of results.
Similarly, SNV has adopted some of the quality checks on survey data in other programmes.
In cases where suppliers included process and activity milestones to improve early cash flow
and/or for risk management this inadvertently created additional MV workload that could not be
built upon over time. The programme generated a vast quantity of data that were largely used only
as evidence for payments. For evaluators, there appears to have been a lost opportunity to explore
packaging the data in ways that could be of broader use to inform learning by suppliers, DFID, or
the sector as a whole.
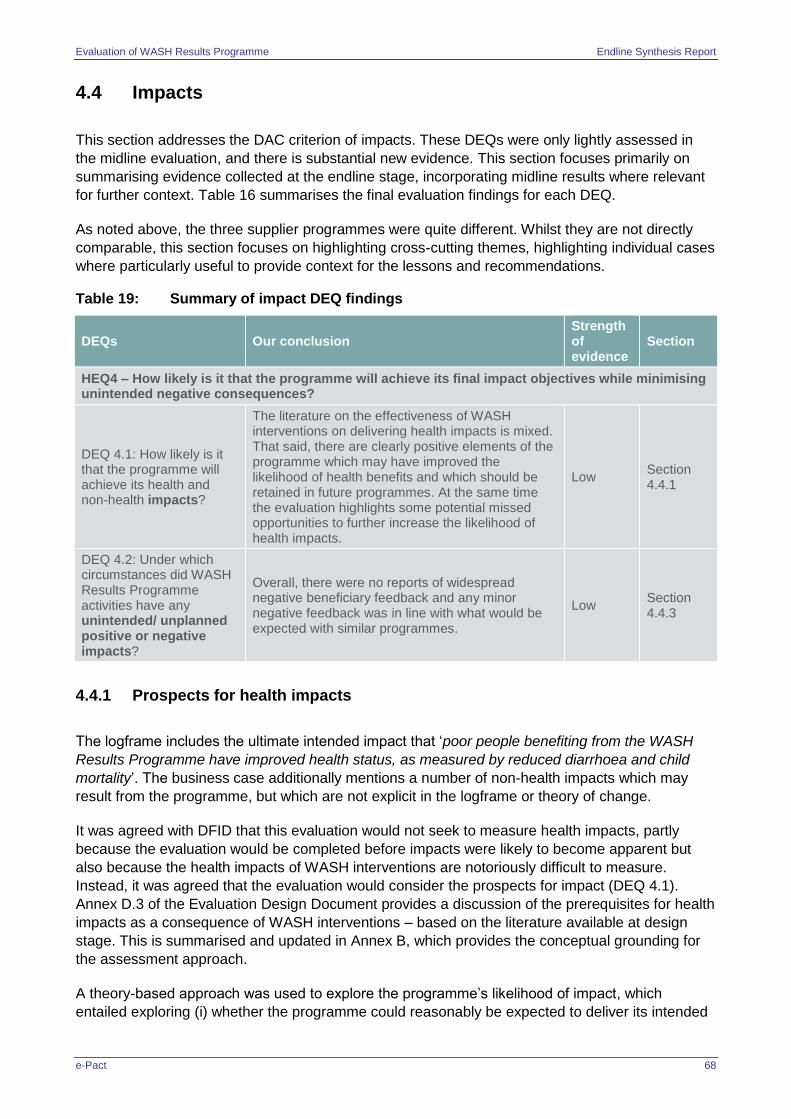
Evaluation of WASH Results Programme Endline Synthesis Report
e-Pact 68
4.4 Impacts
This section addresses the DAC criterion of impacts. These DEQs were only lightly assessed in
the midline evaluation, and there is substantial new evidence. This section focuses primarily on
summarising evidence collected at the endline stage, incorporating midline results where relevant
for further context. Table 16 summarises the final evaluation findings for each DEQ.
As noted above, the three supplier programmes were quite different. Whilst they are not directly
comparable, this section focuses on highlighting cross-cutting themes, highlighting individual cases
where particularly useful to provide context for the lessons and recommendations.
Table 19: Summary of impact DEQ findings
DEQs Our conclusion Strength of evidence
Section
HEQ4 – How likely is it that the programme will achieve its final impact objectives while minimising unintended negative consequences?
DEQ 4.1: How likely is it that the programme will achieve its health and non-health impacts?
The literature on the effectiveness of WASH interventions on delivering health impacts is mixed. That said, there are clearly positive elements of the programme which may have improved the likelihood of health benefits and which should be retained in future programmes. At the same time the evaluation highlights some potential missed opportunities to further increase the likelihood of health impacts.
Low Section 4.4.1
DEQ 4.2: Under which circumstances did WASH Results Programme activities have any unintended/ unplanned positive or negative impacts?
Overall, there were no reports of widespread negative beneficiary feedback and any minor negative feedback was in line with what would be expected with similar programmes.
Low Section 4.4.3
4.4.1 Prospects for health impacts
The logframe includes the ultimate intended impact that ‘poor people benefiting from the WASH
Results Programme have improved health status, as measured by reduced diarrhoea and child
mortality’. The business case additionally mentions a number of non-health impacts which may
result from the programme, but which are not explicit in the logframe or theory of change.
It was agreed with DFID that this evaluation would not seek to measure health impacts, partly
because the evaluation would be completed before impacts were likely to become apparent but
also because the health impacts of WASH interventions are notoriously difficult to measure.
Instead, it was agreed that the evaluation would consider the prospects for impact (DEQ 4.1).
Annex D.3 of the Evaluation Design Document provides a discussion of the prerequisites for health
impacts as a consequence of WASH interventions – based on the literature available at design
stage. This is summarised and updated in Annex B, which provides the conceptual grounding for
the assessment approach.
A theory-based approach was used to explore the programme’s likelihood of impact, which
entailed exploring (i) whether the programme could reasonably be expected to deliver its intended
Evaluation of WASH Results Programme Endline Synthesis Report
e-Pact 69
impacts given the way it was designed and structured, and (ii) the extent to which it was likely to do
so, and the reasons why. Our null hypothesis was that the WASH Results Programme would
achieve similar health impacts to other WASH programmes of similar scope and scale. Many
factors contribute to the presence or absence of water-related disease and most WASH
programmes only affect some of them, and/or operate on too small a scale to remove risks to
health across entire districts or regions. Within this context, the assessment of the prospects for
health impact focused on four questions:
1. To what extent have services and behaviours continued to function and be used since their initial implementation (sustainable outcomes)?
2. To what extent have the utilisation of water and sanitation services and the uptake of hygiene practices reached all members of target populations (inclusive outcomes)?
3. To what extent has the programme advocated for, and successfully influenced, attempts to bring about sustainable WASH services across entire districts (or beyond)?
4. What other obstacles exist to the realisation of the full potential health benefits of the WASH programme, in areas such as nutrition, shelter, livelihoods, and education?
The midline highlighted several factors relevant to the likelihood of health impacts. Firstly,
beneficiary numbers may be spread widely geographically, and across subcomponents (water,
sanitation, and hygiene). DFID’s design expressed no preference for geographically-focused
programming, and included no requirement for community-wide ODF achievement – both of which
would help achieve a ‘critical mass’ of promotional intervention, which is more likely to result in
health benefits. Annex B.3 contains the evaluation team’s summary of the literature on this linkage,
noting that since the midline several high-quality impact evaluations have been published in this
area. Secondly, the programme allowed proposals under different lots. Lot A programmes included
water,136 sanitation, and hygiene, while Lot B covered sanitation and hygiene only. A limitation of
the SSH4A programme under Lot B was that it offered no scope for resolving those situations
where acute water shortages limited a community’s ability to adopt hygienic practices. The midline
concluded that the degree of integration of water, sanitation, and hygiene activities was not
unusually low compared to other programmes globally.
Turning to the endline assessment by question:
1. To what extent have services and behaviours continued to function and be used since their initial implementation (sustainable outcomes)?
The targets across the three supplier’s regarding functionality were largely achieved; with substantial overachievement in some areas, and the outcome phase was a positive feature of the programme with regards to incentivising suppliers to maintain functionality. Water, Sanitation and Hygiene functionality/sustained behaviour change are discussed in turn with a focus on where health risks may remain.
- Water - The water functionality results were largely positive, and in most cases the targets
were achieved with improvements in functionality across the outcome phase. However
there are cases where SWIFT infrastructure became non-functional137. Functionality in the
136 Only SWIFT had a substantial water supply component, which included some standalone urban water projects, while
SAWRP’s water component was fairly small. 137 This was attributed to the drought in the region – see Sections 3.4.1 and 4.2.1.1. of the SWIFT case study report for
discussion
Evaluation of WASH Results Programme Endline Synthesis Report
e-Pact 70
ASAL region at endline was 66% for simple water systems,138 and 79% for complex
systems139. The critical question with regards to health impacts is what other systems
people used when SWIFT infrastructure became non-functional, as Brown et al. (2011)
highlight that even occasional exposure to unsafe water can undermine health gains. In the
case of urban water supply in the ASAL the interview evidence suggests that tanker truck140
water and water rationing were strategies used by the Water Service Providers during
drought periods. In term of health impacts, this means that for those households with non-
functional water supply infrastructure, some transmission pathways remained open –
potentially undermining health gains.
- Sanitation - For SWIFT the target was achieved but the use of latrines was under 80% in
all cases; that is, while the target was achieved there still remains a level of non-use of
latrines in programme areas. For SSH4A while overall the SSH4A target was achieved
there were cases where the result data indicate significant non-functionality in some
counties141. The sanitation functionality targets were largely achieved, and in many cases
with substantial overachievement. However, within in each consortia the results data do
indicate a degree of non-functionality. From a programming perspective this is to a degree
expected; though from a health risk perspective it remains the case that some households
not using latrines in programme areas is likely introduce some health risks in those areas.
- Hygiene - The definition and measurement of hygiene outcomes and the relationship
between outputs and outcomes is less well understood for hygiene than for water and
sanitation. While the targets were largely met, the results indicate that among those
reached with hygiene promotion, as well as the wider population in programme areas, there
remain a large number of people not verified as practising handwashing at critical times.
This represents a health risk because an individual with poor sanitation and hygiene
practices poses a health risk to all neighbouring households, not only to the individual’s
own health, based on the various ways faecal matter spreads.
2. To what extent have the utilisation of water and sanitation services and the uptake of hygiene practices reached all members of target populations (inclusive outcomes)?
As is discussed further in Section 4.4.2, community-wide coverage was not an explicit overall programme aim, and the outcome data vary substantially across suppliers in terms of the degree to which they capture the extent of community-wide coverage. SWIFT and SSH4A data were available to assess coverage levels in programme areas – though not a granular view of the distribution of benefits within communities, or the levels of community-wide achievement – while for SAWRP no suitable data were available to assess coverage levels. For SWIFT, the outcome surveys indicate that the programme achieved its targets, though a sizeable population within programme areas remain without functional services. About half of the SSH4A country programmes achieved more than 90% latrine access – but the remaining countries only reached 50–60%.
Despite SAWRP and SSH4A choosing to aim for ODF achievement, the fact that the WASH Results Programme targets lacked an explicit focus on ODF or other indicators related to the level of community-wide achievement represents a potential missed opportunity in terms of incentivising positive health outcomes. Some recent impact evaluations in sanitation suggest that community-wide reductions in open defecation are an important factor in contributing to
138 As reported by water users associations. The survey result for functionality was 55%. 139 As reported by water users associations. Actual meter readings confirmed that the systems were delivering sufficient
water for their design populations in 82% of cases. 140 With Oxfam contributing support to this provision 141 Kenya and Mozambique.
Evaluation of WASH Results Programme Endline Synthesis Report
e-Pact 71
positive health outcomes142. Similarly, not having a requirement to report on the level of coverage of achievements meant that there are varying levels of insight into the distribution of benefits. Beyond explicitly incentivising community-wide outcomes there could have also been a greater focus on monitoring inclusion more consistently across the three suppliers – regardless of whether or not this was linked to payment.
3. To what extent has the programme advocated for, and successfully influenced, attempts to bring about sustainable WASH services across entire districts (or beyond)?
Though the WASH Results Programme did not have an explicit advocacy component, in all cases the supplier consortia engaged with the government and community structures to promote sanitation and hygiene for the wider population. For SWIFT and SSH4A this was partially reflected in some of the payment milestones related to payment143. In contrast, SAWRP’s payment milestones were related only to output- and outcome-level indicators and process payments were not included - this does not imply that this wider engagement did not happen, only that this was not reported to DFID under the verification framework.
The scale of the programme within the districts was another significant factor with regards to district-wide achievement. Here, SSH4A differed from the other consortia in that in all SSH4A areas there was an explicit aimed to operate at the district level, with process-related payments linked to building district-level capacity. Similarly, SWIFT in DRC operated at a district-wide scale (known as health zone-wide in DRC) – in fact, achieving a greater scale per district than SNV in terms of the reach within the districts it targeted. In contrast, the SWIFT programme in Kenya included a more diverse set of projects and the scale of each partner’s activities in each area was lower. Whilst there was engagement with district-level structures, this was less intensive than in DRC. While SAWRP operated at a relatively large scale in the districts it operated in, and engaged with government structures, there was not an explicit common approach to strengthening district governance or explicitly targeting district-wide coverage.
4. What other obstacles exist to the realisation of full potential health benefits of the WASH programme, in areas such as nutrition, shelter, livelihoods, and education?
There is anecdotal evidence that some country programmes attempted to coordinate with other interventions, to ensure that these other interventions could address other obstacles – such as linking communities up to social protection programmes or to programmes able to provide water supply (where this was not covered under the WASH Results Programme). These efforts will have gone some way towards overcoming obstacles. However, not enough data were available to the evaluation team to assess the extent of potential other barriers to health impacts in a systematic manner.
142 Okullo et al. (2017), a study in Kenya, concludes that ODF status has a significant impact on water quality. Harris et al.
(2018), a study in Mali, concludes that child height-for-age had a significant and positive linear relationship with community latrine coverage, while child weight-for-age and household water quality had nonlinear relationships. Child growth and water quality were not associated with individual household latrine ownership. The extrapolation being that the latrine status of the households surrounding the ‘index household’ was identified as a more significant influence on health that the latrine ownership status of the ‘index household’.
143 For example, the SWIFT payment related to ‘Early sustainability’ often included evidence related to the capacity building efforts of the partners. Similarly, many of the indicators included in SSH4A’s early results packages and included in the sustainability indicators clearly highlight SNV’s wider engagement and advocacy.
Evaluation of WASH Results Programme Endline Synthesis Report
e-Pact 72
Summary assessment regarding health impacts:
Our assessment noted some positive features of the WASH Results Programme as implemented
that are likely to have contributed to the prerequisites for improving health in the target population.
Functionality of water-points and latrines remained high until programme end and the outcome
phase was seen to have contributed to higher functionality rates than there would have otherwise
been.
For water there was a small number of cases where a significant proportion of the WASH Results
Programme’s water supply infrastructure of a given partner became non-functional. This implies
that people had to use other sources – potentially undermining health gains. Similarly, the outcome
results themselves indicate that a large proportion of the target population do not practise hygienic
handwashing behaviours. This is a challenge in many WASH programmes.
Conversely, that many suppliers aimed for community-wide impacts, despite these not being linked
to payment, is likely to contribute to improving health impacts. There are clear examples of
suppliers engaging at the district level and building district-level capacity – especially SWIFT in
DRC and SSH4A, though to a lesser degree for SWIFT in Kenya and SAWRP. However, where
there are data on this aspect, they highlight that there remain many people within programme
districts who do not yet have access to services or practise desirable sanitation and hygiene-
related behaviours.
In summary, there are clearly positive elements of the programme that should be retained in future
programmes; at the same time, our assessment highlights some potential missed opportunities to
further increase the likelihood of health impacts.
For a more detailed discussion by supplier across the four areas of investigation readers should
refer to Section 4.4.1 of the suppliers’ respective supplier case study reports.
4.4.2 Prospects for inclusive outcomes
Annex B.3 outlines the methodological approach taken to review the inclusion focus within the
WASH Results Programme.144 As illustrated in Table 18, a framework of three categories
addressing programme planning and implementation, monitoring, and institutional barriers was
developed and applied for the case study countries where there were sufficient suitable data.145
Overall, the programme design and implementation aspects appeared to support an inclusion
focus across all three suppliers, with almost all regions assessed as having a medium to high
likelihood of achieving inclusive outcomes, in a relatively consistent pattern for the relevant
questions. The picture was more mixed by supplier with regards to the monitoring of inclusion, with
SSH4A assessed higher than SWIFT or SAWRP for the countries examined. Our review suggests
that the risks to inclusion from institutional barriers was comparatively higher for all suppliers, as
indicated by the low to medium assessments shown in Table 18 (overleaf). The three areas are
discussed in turn below.
144 Annex B.2 integrates and summarises discussion from the Evaluation Design Document related to the conceptual
grounding of the approach and from the Endline Design Note related to how this would be applied. 145 The framework was only applied with reference to the case study counties, namely Pakistan (SAWRP), Kenya (SWIFT),
and Tanzania and Uganda (SSH4A), as the remote interviews with the programme managers in the other WASH Results Programme countries did not provide enough reliable insight to complete the framework.
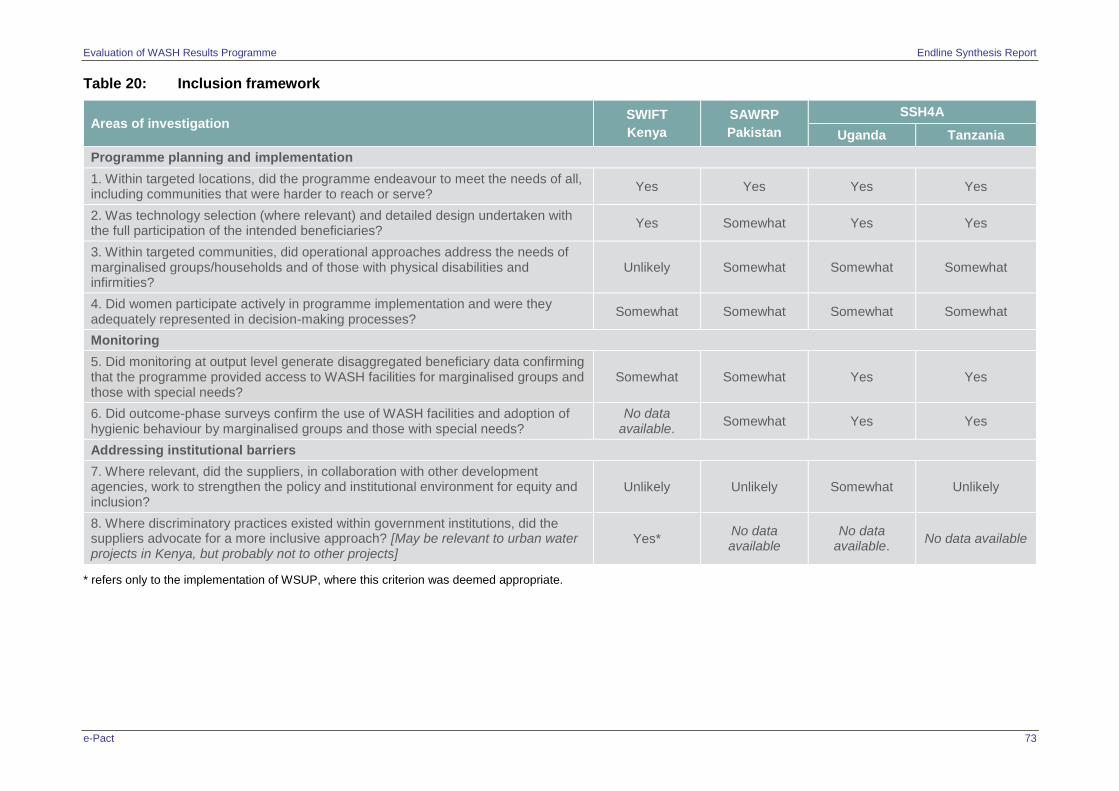
Evaluation of WASH Results Programme Endline Synthesis Report
e-Pact 73
Table 20: Inclusion framework
Areas of investigation SWIFT
Kenya
SAWRP
Pakistan
SSH4A
Uganda Tanzania
Programme planning and implementation
1. Within targeted locations, did the programme endeavour to meet the needs of all, including communities that were harder to reach or serve?
Yes Yes Yes Yes
2. Was technology selection (where relevant) and detailed design undertaken with the full participation of the intended beneficiaries?
Yes Somewhat Yes Yes
3. Within targeted communities, did operational approaches address the needs of marginalised groups/households and of those with physical disabilities and infirmities?
Unlikely Somewhat Somewhat Somewhat
4. Did women participate actively in programme implementation and were they adequately represented in decision-making processes?
Somewhat Somewhat Somewhat Somewhat
Monitoring
5. Did monitoring at output level generate disaggregated beneficiary data confirming that the programme provided access to WASH facilities for marginalised groups and those with special needs?
Somewhat Somewhat Yes Yes
6. Did outcome-phase surveys confirm the use of WASH facilities and adoption of hygienic behaviour by marginalised groups and those with special needs?
No data available.
Somewhat Yes Yes
Addressing institutional barriers
7. Where relevant, did the suppliers, in collaboration with other development agencies, work to strengthen the policy and institutional environment for equity and inclusion?
Unlikely Unlikely Somewhat Unlikely
8. Where discriminatory practices existed within government institutions, did the suppliers advocate for a more inclusive approach? [May be relevant to urban water projects in Kenya, but probably not to other projects]
Yes* No data available
No data available.
No data available
* refers only to the implementation of WSUP, where this criterion was deemed appropriate.
Evaluation of WASH Results Programme Endline Synthesis Report
e-Pact 74
Programme planning and implementation. The overall programme design had no requirement
for total sanitation, ODF, or any similar articulation of high levels of sanitation usage across
targeted communities. Nonetheless, all suppliers undertook sanitation programming through
CLTS-type approaches and aimed for community-wide outcomes to greater and lesser degrees,
despite this not being a DFID requirement.
Addressing each supplier in turn, SAWRP’s programme design featured measures to achieve
inclusive outcomes, via: involving marginalised groups in planning and decision making; ensuring
that communal facilities met the needs of people with disabilities; and involving children in
sanitation and hygiene promotion and encouraging them to be change agents. The SAWRP
programme in both countries also selected challenging and/or hard to reach areas to work in.
The SSH4A framework – as well as SNV as an organisation – placed a clear emphasis on
inclusion. In each country, SNV chose to operate in marginalised areas with low WASH access
and carried out targeted studies to help diagnose who the marginalised groups were and why they
had lower access to latrines and/or lower knowledge of handwashing practices. SNV also
produced handbooks describing latrine options for those unable to squat.
SWIFT’s implementation in Kenya varied by partner – though, broadly speaking, the programme
design appeared to support an equity focus – especially with regard to the location selection, or
programme targeting. In addition, some individual projects included specific measures intended to
ensure that affordable services could be accessed by the poorest and/or by marginalised members
of the targeted communities.
Monitoring. The monitoring of the level of inclusion was less consistent across the suppliers. At
the output and outcome level, all SSH4A countries explicitly monitored the level of inclusion,
routinely disaggregated beneficiary results by gender and wealth quintiles. SWIFT and SAWRP,
meanwhile, disaggregated beneficiaries only by gender, and did not adopt a definition of ‘poor
people’, though there was a clear pro-poor focus in their programme designs. As a result, it is not
possible to verify to what extent people in the lowest wealth quintile benefited from the WASH
Results Programme in the targeted locations across the three suppliers. The focus on monitoring
was less clear for SAWRP in Pakistan and for SWIFT in Kenya. Nonetheless, both SAWRP and
SWIFT carried out periodic monitoring related to equity146. As part of the outcome surveys both
SAWRP and SWIFT also collected data relevant to inclusion – though these did not form part of
the reporting to DFID. There could have been a stronger focus on more consistently monitoring the
level of inclusion across the whole WASH Results Programme – regardless of whether or not this
was explicitly linked to payment.
Addressing institutional barriers. Strengthening the policy and institutional environment for
equity and inclusion was a weak aspect across all suppliers. While SSH4A had a strong focus on
capacity building and advocacy at a national level147, shortage of sectoral funding still poses risks
to the ability of central and local government to continue to deliver equitable WASH services
across SSH4A countries. Several SNV country managers felt that there was not enough time
spent, or emphasis, on address sector-wide barriers to a more inclusive approach148. This was
echoed by managers of SAWRP and SWIFT. Very limited data were available on any efforts by
suppliers to advocate against discriminatory practices which exist within government institutions.
146 For SAWRP, this monitoring was done through SAFs. 147 For example, in Uganda SSH4A used ‘institutional triggering’ to sensitise the relevant district government officers on
the situation with the sanitation, water and solid waste in Uganda. 148 The focus on overcoming institutional barriers was slightly greater for Uganda, where SNV sought synergies with social
protection programmes that target the poorest people, such as SAGE and Operation Wealth Creation, funded by government.
Evaluation of WASH Results Programme Endline Synthesis Report
e-Pact 75
4.4.3 Effect of PbR modality on inclusion focus
As noted in the midline evaluation report, all supplier programmes prioritised poor and under-
served countries, yet only some implementing partners deliberately selected hard-to-reach
locations: for example, in Pakistan (Plan International and WaterAid) and Kenya (Oxfam, Practical
Action, Concern Worldwide) and Nepal (SNV).
The PbR modality does not appear to have significantly helped nor hindered the inclusion focus of
any of the three suppliers. That is, the focus on inclusion within the programme was largely rooted
in the organisational values – with the partners undertaking many initiatives to strengthen inclusion
outside of the results that were tied to payment. Many of the most positive programme features
regarding inclusivity, such as targeting, programme approach, and participation, were embedded
within the programme design chosen by suppliers. All suppliers monitored inclusion to some
degree, and responded to issues raised by this monitoring, yet there was a missed opportunity, as
there was no requirement from DFID for benefits to be community-wide.
For a more detailed discussion by supplier readers should refer to Section 4.4.2 of the respective
supplier case study reports for suppliers.
4.4.4 Unintended positive or negative impacts
Due to the design of the evaluation, only limited primary data could be obtained on intended and
unintended positive or negative impacts for beneficiaries.149 The information presented here
primarily draws upon the following types of information: (1) community visits as part of midline and
endline case studies; (2) supplier feedback at all levels, including from community meetings and
focus groups they conducted, as well as their formalised complaint mechanisms; (3) verifier
feedback and verification reports; and (4) DFID documentation, including Annual Reviews.
Overall, there were no reports of significant or widespread positive or negative beneficiary
feedback. The limited negative feedback received was in line with what would be expected from
the programme interventions, including some groups reporting challenges with certain
technologies (e.g. the elderly challenged by squatting).
For those activities which were demand-led as opposed to hardware-based, one possible
implication of the PbR modality could have been that the pressure to change behaviours would
lead to NGOs putting undue pressure on households to build latrines or adapt hygienic
handwashing practices. SAWRP staff in Pakistan emphasised that the repeated visits for
monitoring strained the relationships with the community due largely to respondent fatigue. SNV
Tanzania also reported that local government partners visited households repeatedly, until the
household built a latrine. However, there is only anecdotal insight from one NGO partner for
SSH4A Uganda that in the output phase some local field staff actually used coercive measures
against households that were reluctant to improve their sanitation status150. Conversely, in Nepal
SSH4A took specific steps to stop coercive measures by government staff, which has historically
been a common government approach in Nepal151. Similarly, SNV in Ethiopia and Uganda
149 There was insufficient evaluation endline budget to carry out comprehensive assessments at the community level. To
maximise value for money at the endline, it was agreed with DFID that the modest budget originally allocated for community assessments would be reallocated to obtaining more comprehensive feedback from the country managers not involved in case study visits.
150 Evaluators were unable to further corroborate this claim, nor ascertain how representative this experience was. 151 In Nepal households are issued with a toilet card by the government when they build a latrine. In the past, some district
governments withheld services from households without a toilet card – blocking school enrolment, blocking payments by
Evaluation of WASH Results Programme Endline Synthesis Report
e-Pact 76
discouraged enforcement approaches traditionally used by government and community leaders
that are known to interfere with demand-led approaches. Without a counterfactual and with very
limited interviews at the lowest level of implementers and with communities the evaluation could
not ascertain whether the level of community follow-up – a standard ingredient of CLTS – was
higher than normal or entailed any coercive measures, or whether this had negative effects on
households or on the sustainability of the behaviour change.
The positive and negative effects experienced by supplier staff, partners, and local governments
are discussed as relevant in Section 4.3: for example, stress on supplier and partner staff, and
increased confidence in results by local governments.
the employment programme, and not issuing birth and death certificates. In response to SNV’s advocacy work, the government issued a memo against these types of sanctions in 2016.
Evaluation of WASH Results Programme Endline Synthesis Report
e-Pact 77
4.5 Sustainability
These DEQs related to sustainability were only lightly assessed in the midline evaluation, and
there is substantial new evidence. This section focuses primarily on summarising evidence
collected at the endline stage, incorporating midline results where relevant for further context.
Table 19 summarises the final evaluation findings for each DEQ. This section focuses on
highlighting cross-cutting themes and highlighting individual cases where particularly useful to
provide context for the lessons and recommendations, a detailed discussion by suppliers can be
found in Section 3.5 of the supplier case studies.
It is important to note that the continuing use of water and sanitation facilities at the end of the outcome phase is not the same as the achievement of sustainable service provision. The latter requires the simultaneous fulfilment of numerous pre-requisites at community, local and national government levels, as summarised in Table 21. The achievements at the end of the outcome phase, in other words, are a necessary but not sufficient condition for the achievement of sustainability. In this section we focus on the likelihood of the programme’s results demonstrating true sustainability in this non-time-limited sense.
Table 21: Summary of sustainability DEQ findings
DEQs Our conclusion Strength of
evidence Section
HEQ5 – How likely is it that the WASH outcomes achieved by the programme will be sustained beyond
the end of the programme in 2018?
DEQ 5.1: To what
extent were the
individual sub-
programmes designed
and implemented to
maximise the likelihood
of achieving long-term
sustainable WASH
outcomes and
impacts?
The design of the individual sub-programmes included
addressing elements related to the long-term
sustainability of services, particularly in the outcome
phase. However, groundwork for sustainability was
marginalised in some projects due to the tight output-
phase deadline. Suppliers contributed to reducing risks
and supporting sustainability in many ways. However,
clear inherent risks remain, many of which are beyond
the control of suppliers: for example, national-level
institutional capacity; some aspects of district-level
institutional capacity; and long-term environmental
conditions.
Medium
Sections
4.5.1 and
4.5.2
DEQ 5.2: Under which
circumstances has the
PbR modality affected
the likelihood of long-
term sustainability of
the outcomes and
impacts?
The PbR modality did not appear to help or hinder the
suppliers in taking actions supportive of long-term
sustainability. However, having payments associated
with outcomes incentivised partners to repair
infrastructure or revisit communities in order to maintain
functionality during the outcome phase.
Medium Section
4.5.4
DEQ 5.3: Under which
circumstances have
other programme
features affected the
likelihood of the long-
term sustainability of
Three key factors improved the likelihood of sustainability by enhancing accountability and incentivising it: (i) the outcome phase focused on outcomes (roughly two years of community and government engagement in the period after the delivery
Medium Section
4.5.1– 4.5.3
Evaluation of WASH Results Programme Endline Synthesis Report
e-Pact 78
the outcomes and
impacts?
of outputs), (ii) outcome results were measured, and (iii) payments were contingent on outcome results.
In contrast, the rushed output phase in some cases was
likely detrimental to efforts to enhance the likelihood of
sustainable services.
DEQ 5.4: Under which circumstances did the WASH Results Programme contribute to enhanced sector learning to inform better evidence-based WASH policy and programming?
Suppliers made numerous efforts to disseminate
learning at the global level, though efforts were more
varied at national sector level.
Low Section
4.5.6
4.5.1 Approach to sustainability by suppliers
The degree to which the suppliers articulated their approach to sustainability varied; this is
reflected not only in the programme approach and how implementation changed between phases,
but also in the approach taken to monitoring progress on sustainability indicators and the payment
indicators selected. In many ways SSH4A had the most clearly articulated approach to
sustainability and was the only supplier to link payments to related progress on sustainability
indicators.
The midline findings highlighted significant differences between SWIFT and SAWRP vis-à-vis
SSH4A regarding the approach to sustainability. Whilst all suppliers were committed to delivering
sustainable WASH services, the abbreviated nature of the output phase and the focus on
quantifiable results made it difficult for at least some SWIFT and SAWRP partners to give
adequate attention to sustainability; and there were some cases where the quantity of results was
given priority over quality152. In contrast, there were also several examples of cases where partners
prioritised initiatives in support of sustainability despite the time pressure in the first half of the
programme153. The midline evaluation also highlighted that monitoring the enabling conditions for
sustainability was a crucial aspect in tracking progress and flagging potential risks to sustainability.
During the outcome phase, the suppliers varied in how they formalised their approach to sustainability. Though a common element of the outcome phase for all suppliers was a focus on the government and community-level structures responsible for managing services in the long term, and throughout the outcome phase Suppliers continued to play an active role in monitoring and ensuring service functionality.
Key elements of each consortia’s approach to sustainability are discussed in turn below, with further detail in the supplier case studies154:
SSH4A. Under the SSH4A approach, building the capacity of local and central government was
also one of the four pillars of the SSH4A programme. Across all countries, SSH4A signed MOUs
with district government counterparts to ensure handover of service delivery after programme-end,
152 See the midline evaluation report for specific examples. 153 See the midline evaluation report for specific examples. 154 Sections 3.4.5 in SAWRP case study and Sections 3.5.5 and 3.4.5 in the SSH4A case study
Evaluation of WASH Results Programme Endline Synthesis Report
e-Pact 79
drew up district sanitation plans, trained a cadre of government CLTS facilitators, contributed to the
national ODF verification process, and ensured all its efforts were aligned with local government
efforts. SNV strengthened private sector capacity on sanitation marketing and set up a supply
chain for a locally appropriate improved latrine model across all SSH4A countries. SSH4A included
sustainability components in its payment milestones though it was not required by DFID at tender
stage. Drawing up district sanitation plans, for example, was an explicit SSH4A deliverable;
sanitation marketing was also introduced at an early stage.
SNV monitored progress on sustainability achievements through 10 sustainability indicators, which
tracked the existence of various technical, environmental, and institutional prerequisites for
sustainability and equity. This is not to say that the other suppliers did not focus on monitoring
sustainability, but that as a consortium SSH4A articulated a clearer vision from the start of the
programme.
SWIFT. SWIFT in DRC also placed a strong focus on sustainability in the outcome phase, where
efforts centred on building the capacity of government and community-level support structures and
monitoring. SWIFT also signed MOUs with district government counterparts and contributed to the
national ODF verification process. With regards to water, the focus was on professionalising the
management of the water services at the local level, though both Oxfam and Tearfund remained
active in supporting the water user committees in addressing breakdowns. SWIFT’s approach to
sustainability varied considerably in Kenya, related to the diverse nature of the sub-programmes.
For the ASAL partners, the approach to sustainability in water can be broadly characterised as
providing capacity support to the institutions with responsibility for maintaining service functionality
beyond the life of SWIFT (water utilities, water user associations, and to a lesser extent the county
government). WSUP’s work in Nairobi focused even more clearly on institutional strengthening, as
there was an explicit MOU with Nairobi Water and Sewerage Company, and a clear handover of
responsibilities at the end of the outcome phase. For sanitation and hygiene, the picture is more
mixed. BBC Media Action has on ongoing relationship with (at least some of) the local radio
stations but had no implementation activities planned during the outcome phase – in which the
majority of the capacity building efforts of other partners were focused. As a social enterprise,
Sanergy’s efforts towards sustainability centred on the financial sustainability of its business model
– with the shifts in strategy highlighted above forming a major development during the outcome
phase.
Under SWIFT the focus on monitoring institutional strengthening was a stronger programme
feature in DRC than in Kenya. In DRC the monitoring of the functioning of the local structures went
far beyond what was required for payment related to outcomes, and SWIFT partners actively
monitored the functioning of these institutions155. In Kenya the programme focused its monitoring
efforts on the payment indicators and the monitoring of sustainability was primarily through periodic
narrative reporting (which was consortium-wide and was also done in DRC).
SAWRP. For SAWRP, the focus in the outcome phase in Pakistan had three main elements: i)
continuing household-level promotion activities to try and instil behaviour change, ii) support and
guidance to local government stakeholders for continuing the work, and iii) intensive monitoring of
functionality, with remedial action taken when needed. In Bangladesh the focus was similar. It was
noted that in both countries the suppliers also continued to deliver some outputs.
155 For example, the criteria used to monitor the functioning of the Water Management Committees were: i) having water
safety plans in place; ii) having official internal regulations; iii) having physical offices; iv) having systems in place for managing the finances; v) working in collaboration with local leaders; and vi) still having their maintenance kit. Similar assessments were done in respect of the village committees and sanitation.
Evaluation of WASH Results Programme Endline Synthesis Report
e-Pact 80
SAWRP monitored sustainability through periodic assessments under its Sustainability
Assessment Frameworks (SAFs). These frameworks were developed by WEDC and other
SAWRP partners under the WASH Results Programme to track progress in relation to four
dimensions of sustainability: functionality; equity and inclusion; institutional and financial
sustainability; and environmental sustainability. Initially, it was envisaged that two SAF
assessments would take place – one in the output phase and one in the outcome phase. Due to
pressures in the output phase the first assessment did not happen until early in the outcome
phase, but, crucially, it included a feedback mechanism for feeding back into programming by
requiring a management response.
Readers should refer to Section 3.4.5 in the supplier case study reports for each supplier, for
details of their respective approaches to increasing the likelihood of sustainability, and Section
3.4.6 for details of their approach to monitoring sustainability.
4.5.2 Assessment of prospects for sustainability
The approach taken to evaluation sustainability was rooted in the context of programme
implementation by international NGOs working in partnership with local NGOs, and local and
national governments. However, most of the content is also applicable to a situation where
implementation is by local governments, either directly or through outsourcing. A sustainable
service is most fundamentally interpreted as a behaviour or practice which persists over time.
However, to place a time limitation on sustainability is unhelpful. Sustainability is certainly about
the time dimension, but no limit must be placed on that time dimension. A distinction is therefore
made between indications that services or practices have been sustained to the present date, and
the way in which we might determine whether services and practices are indeed sustainable over
the foreseeable future.
The framework developed for assessing sustainability under this evaluation is an attempt to
synthesise the prerequisites; combining both backward-looking and forward-looking elements. The
framework also distinguishes between implementation and institutional levels. The fundamental
logic being that prerequisites at the user / community level all need to be reinforced at the level of
the local administration. Similarly, all actions undertaken at local government level must be
supported by the actions of higher-level government organisations and foreign/international NGOs,
agencies, and donors. In the framework, repetition is avoided by listing only the highest priority
actions at levels higher than the local community. Readers are referred to Annex B.3 for further
details of the approach taken to assessing the likelihood of sustainability.
Table 22 combines all of the sustainability frameworks completed for the programme, i.e. wherever
sufficient data were available and disaggregated as appropriate, due to differences in country
approaches. These frameworks were only applied for SWIFT in Kenya, for SAWRP in Pakistan,
and for SSH4A in Uganda and Tanzania.
For the table: risks scoring 1–2 are considered negligible risks and are colour-coded green; risks
scoring 3–4 are considered moderate risks and colour-coded amber; risks scoring 6+ are
considered high-risk areas and are colour-coded red, and risks of 9 are considered critical and
coloured purple. The risk scores are a product of likelihood and impact. The strength of evidence
supporting the assessment is included in parenthesis and is high (H), medium (M), or low (L). The
same method was used for each case study. Where a criterion is not seen as relevant to a
particular organisation’s implementation the cell is coloured light grey and marked N/A, and where
there was insufficient evidence to make an informed assessment the cell is coloured dark grey and
left blank.
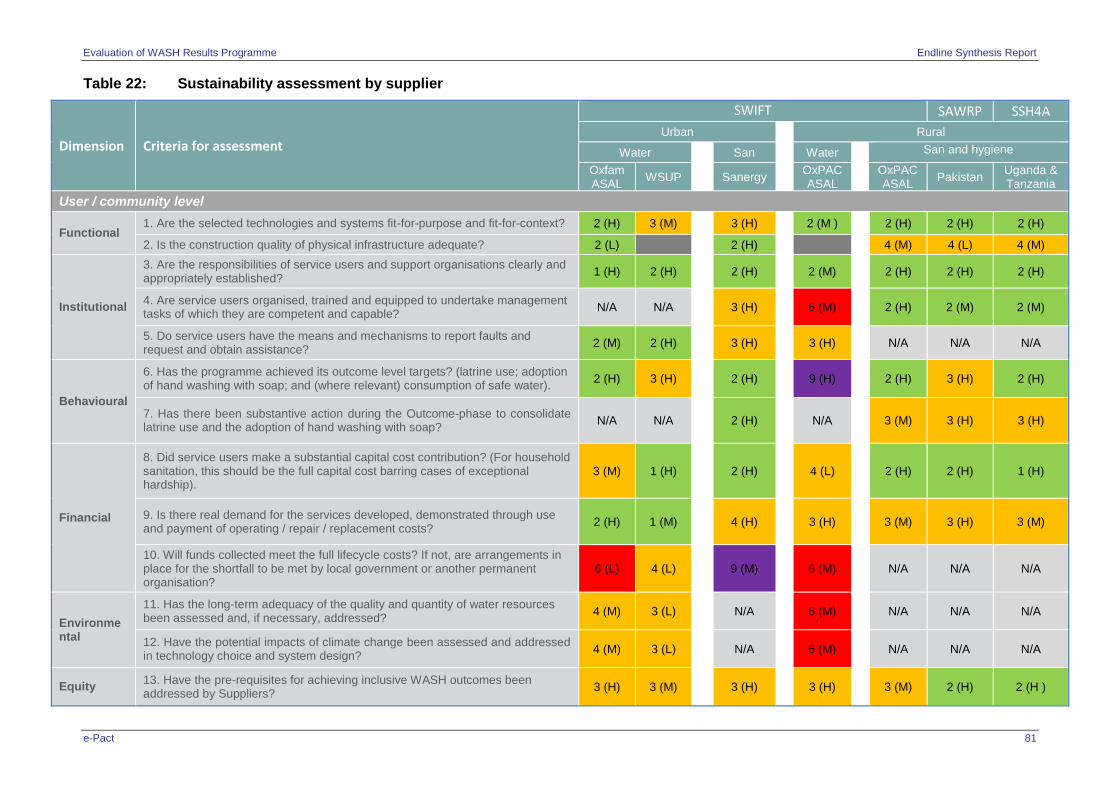
Evaluation of WASH Results Programme Endline Synthesis Report
e-Pact 81
Table 22: Sustainability assessment by supplier
Dimension Criteria for assessment
SWIFT SAWRP SSH4A
Urban Rural
Water San Water San and hygiene
Oxfam ASAL
WSUP
Sanergy OxPAC ASAL
OxPAC ASAL
Pakistan Uganda & Tanzania
User / community level
Functional 1. Are the selected technologies and systems fit-for-purpose and fit-for-context? 2 (H) 3 (M) 3 (H) 2 (M ) 2 (H) 2 (H) 2 (H)
2. Is the construction quality of physical infrastructure adequate? 2 (L) 2 (H) 4 (M) 4 (L) 4 (M)
Institutional
3. Are the responsibilities of service users and support organisations clearly and appropriately established?
1 (H) 2 (H)
2 (H) 2 (M)
2 (H) 2 (H) 2 (H)
4. Are service users organised, trained and equipped to undertake management tasks of which they are competent and capable?
N/A N/A
3 (H) 6 (M)
2 (H) 2 (M) 2 (M)
5. Do service users have the means and mechanisms to report faults and request and obtain assistance?
2 (M) 2 (H)
3 (H) 3 (H)
N/A N/A N/A
Behavioural
6. Has the programme achieved its outcome level targets? (latrine use; adoption of hand washing with soap; and (where relevant) consumption of safe water).
2 (H) 3 (H)
2 (H) 9 (H)
2 (H) 3 (H) 2 (H)
7. Has there been substantive action during the Outcome-phase to consolidate latrine use and the adoption of hand washing with soap?
N/A N/A
2 (H) N/A
3 (M) 3 (H) 3 (H)
Financial
8. Did service users make a substantial capital cost contribution? (For household sanitation, this should be the full capital cost barring cases of exceptional hardship).
3 (M) 1 (H)
2 (H) 4 (L)
2 (H) 2 (H) 1 (H)
9. Is there real demand for the services developed, demonstrated through use and payment of operating / repair / replacement costs?
2 (H) 1 (M)
4 (H) 3 (H)
3 (M) 3 (H) 3 (M)
10. Will funds collected meet the full lifecycle costs? If not, are arrangements in place for the shortfall to be met by local government or another permanent organisation?
6 (L) 4 (L)
9 (M) 6 (M)
N/A N/A N/A
Environmental
11. Has the long-term adequacy of the quality and quantity of water resources been assessed and, if necessary, addressed?
4 (M) 3 (L)
N/A 6 (M)
N/A N/A N/A
12. Have the potential impacts of climate change been assessed and addressed in technology choice and system design?
4 (M) 3 (L)
N/A 6 (M)
N/A N/A N/A
Equity 13. Have the pre-requisites for achieving inclusive WASH outcomes been addressed by Suppliers?
3 (H) 3 (M)
3 (H) 3 (H)
3 (M) 2 (H) 2 (H )
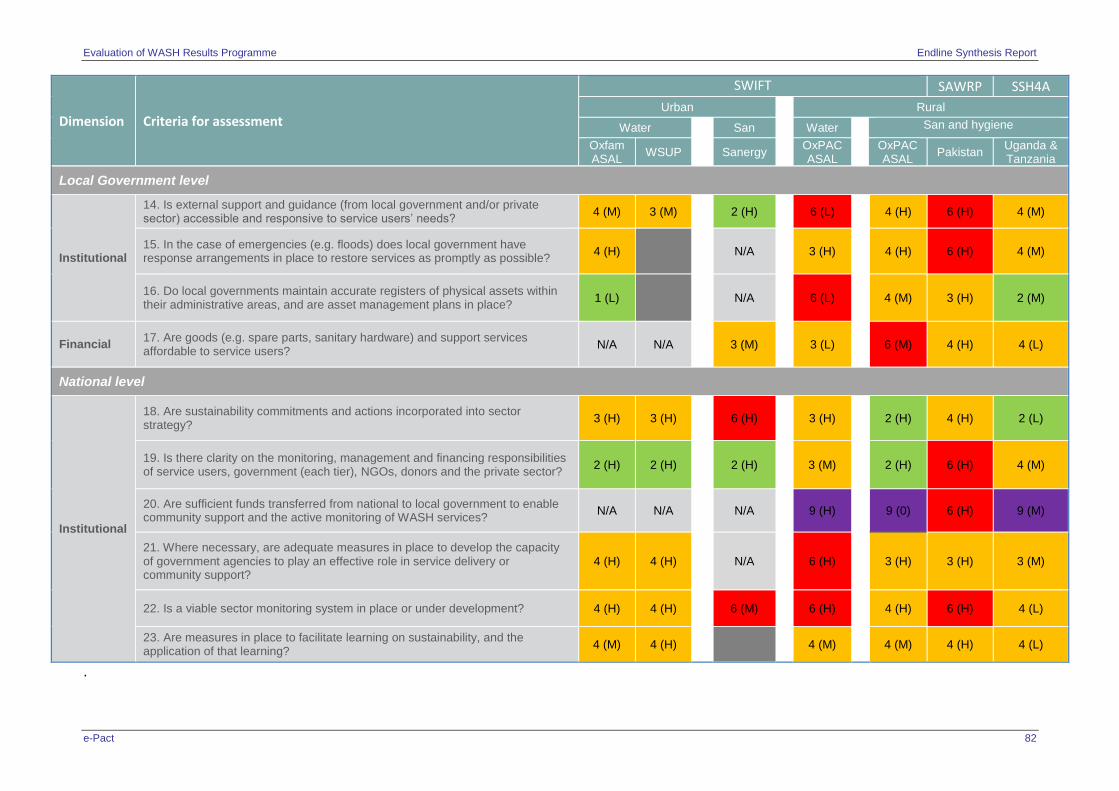
Evaluation of WASH Results Programme Endline Synthesis Report
e-Pact 82
Dimension Criteria for assessment
SWIFT SAWRP SSH4A
Urban Rural
Water San Water San and hygiene
Oxfam ASAL
WSUP
Sanergy OxPAC ASAL
OxPAC ASAL
Pakistan Uganda & Tanzania
Local Government level
Institutional
14. Is external support and guidance (from local government and/or private sector) accessible and responsive to service users’ needs?
4 (M) 3 (M)
2 (H) 6 (L)
4 (H) 6 (H) 4 (M)
15. In the case of emergencies (e.g. floods) does local government have response arrangements in place to restore services as promptly as possible?
4 (H)
N/A 3 (H)
4 (H) 6 (H) 4 (M)
16. Do local governments maintain accurate registers of physical assets within their administrative areas, and are asset management plans in place?
1 (L)
N/A 6 (L)
4 (M) 3 (H) 2 (M)
Financial 17. Are goods (e.g. spare parts, sanitary hardware) and support services affordable to service users?
N/A N/A
3 (M) 3 (L)
6 (M) 4 (H) 4 (L)
National level
Institutional
18. Are sustainability commitments and actions incorporated into sector strategy?
3 (H) 3 (H)
6 (H) 3 (H)
2 (H) 4 (H) 2 (L)
19. Is there clarity on the monitoring, management and financing responsibilities of service users, government (each tier), NGOs, donors and the private sector?
2 (H) 2 (H)
2 (H) 3 (M)
2 (H) 6 (H) 4 (M)
20. Are sufficient funds transferred from national to local government to enable community support and the active monitoring of WASH services?
N/A N/A
N/A 9 (H)
9 (0) 6 (H) 9 (M)
21. Where necessary, are adequate measures in place to develop the capacity of government agencies to play an effective role in service delivery or community support?
4 (H) 4 (H)
N/A 6 (H)
3 (H) 3 (H) 3 (M)
22. Is a viable sector monitoring system in place or under development? 4 (H) 4 (H)
6 (M) 6 (H) 4 (H) 6 (H) 4 (L)
23. Are measures in place to facilitate learning on sustainability, and the application of that learning?
4 (M) 4 (H)
4 (M) 4 (M) 4 (H) 4 (L)
.
Evaluation of WASH Results Programme Endline Synthesis Report
e-Pact 83
4.5.3 Discussion by supplier
4.5.3.1 Common themes across suppliers
It is difficult to generalise across the programme – partially due to the diversity of the projects.
However, some patterns do emerge, specifically:
the risks to sustainability were lower at the community level and the worst performing area are
lifecycle costing;
in several cases there was not enough relevant data to comment on environmental risks, but
where there was, these risks are moderate; and
many of the greatest risks to sustainability are related to institutional aspects at the regional
and national levels.
Rural sanitation and hygiene is the one subsector where a comparison across suppliers is
possible, due to common elements in programming. Rural sanitation is also distinct as a subsector
as the responsibility for continuing services rests comparably more (than in the other subsectors)
on households, as opposed to local government institutions. This is both related to the nature of
the service (predominantly the fact that infrastructure is limited to being only at the household
level) and the outcomes sought (related to behaviour), though local and national governments
have a prominent role in service monitoring and continued promotion. These facets are reflected in
the assessment of the risks to sustainability. Those risks at the community level are generally
regarded as lower; this is supported by the strong performance against target regarding
functionality, up to the end of the outcome phase. The areas of greatest concern relate to the
infrastructure itself, as the impact of latrine collapse on services is high, and a degree of latrine
collapse was reported during the outcome phase across suppliers (with remedial action taken by
the suppliers).
The risks to service sustainability related to the local and national government levels are seen as
much higher than those at the community level. At the local government level these predominantly
relate to the capacity of local government to respond to, or to support households to respond to,
service failure. Between the national and local government levels a critical risk is the lack of
continued funding to local government institutions. While, as acknowledged above, the suppliers
worked to build capacity at the district (or equivalent) and community levels the continued funding
of rural sanitation is something that is arguably beyond the control of the suppliers to meaningfully
influence in the longer term in a programme such as this.
The overall conclusion is that whilst there are many aspects where all suppliers have contributed to
reducing the risks and supporting sustainability, clear risks to sustainability remain. However, the
actions needed to mitigate many of these risks are beyond the scope of the WASH Results
Programme – particularly those related to long-term environmental risk and institutional capacity at
the national level, as well as some aspects of district institutional capacity.
The remainder of this section discusses the risks and mitigating actions taken by supplier
consortia.
Evaluation of WASH Results Programme Endline Synthesis Report
e-Pact 84
4.5.3.2 SSH4A (rural sanitation and hygiene in Uganda and Tanzania)
The risk-based framework suggests that sustainability risks at community level are generally low.
This is because the technologies selected by SNV in Uganda and Tanzania were generally fit-for-
purpose and fit-for-context, and sufficient demand was created at community level for households
to pay for, construct, and maintain latrines and handwashing stations. While demand has clearly
been created, the fact that community structures are voluntary in Uganda and Tanzania, with
competing demands on their time and without funding, limits their ability and motivation to continue
following up with communities and sustaining behaviour change.
In Uganda and Tanzania, local government and the private sector were needed to provide support
and guidance, so that voluntary community structures and households could maintain services in
the face of challenges beyond their means to address. In Uganda and Tanzania SNV engaged in
strengthened private sector capacity on sanitation marketing156. Not enough entrepreneurs could
be interviewed to assess if the supply chains are sustainable, or to assess to what extent these
enterprises have expanded latrine sales outside the SSH4A intervention area157.
SSH4A has clearly contributed to strengthening government capacity at various levels. There was
no noticeable effect of the outcome phase in regard to boosting capacity building in SSH4A
countries, with the exception of Uganda158. Staff and funding shortages at local government level
posed risks to the ability of local government to continue supporting communities in both Uganda
and Tanzania, and in both countries issues were raised with regard to district-level staffing levels
and there being limited budget for promotion activities and travel. In several other countries, SNV
mentioned that due to a shortage of government funding for district staff, more emphasis has been
placed on voluntary community structures, which can continue operating despite lack of funding.
There is a risk that this places a greater burden on households and communities.
In all SSH4A countries, an MOU between SNV and the relevant district government structure was
established at the start of the programme, which entailed drawing up a District Sanitation Plan –
which was revisited annually – culminating in an exit strategy in 2018. In Tanzania, SNV secured a
commitment from the government to continue reporting sanitation and hygiene outcomes to SNV
after project-end. Securing this political buy-in has increased the potential for sustainability. SNV
has also contributed to strengthening the WASH sector processes more widely. In Uganda, SNV
advisers contributed to sanitation planning at district and national level by advising on the ongoing
development of the ODF verification protocol. In Tanzania, where SNV implemented directly
through government, SNV created strong government ownership and commitment to sanitation,
which is likely to continue in project districts beyond programme end. SNV also influenced the
planning and implementation of the National Sanitation Campaign beyond project districts. In some
countries, SNV also contributed to strengthening the WASH sector monitoring, though the
government monitoring systems in Uganda and Tanzania remain mostly paper-based, and the lack
of updates means slippage in villages is still difficult to detect.
A shortage of sectoral funding poses risks to the ability of central and local government to continue
to support communities across SSH4A countries. In Uganda, SNV has had limited success in
156 In Uganda this included setting up a supply chain for SaTo pan distribution in collaboration with the INGO Water for
People, and working with entrepreneurs to make and sell tippy taps. SNV worked with savings groups (SACCOs) and Village Health Teams to promote the pans at low cost. In Tanzania, SNV similarly set up a supply chain for the Safi latrine, for which there seems to be particular demand in areas of collapsing soils.
157 In Uganda, SaTo pan availability and jerry can availability (for handwashing) sometimes appeared patchy in remote places.
158 Where from 2016 onwards (what SNV called Phases IV and X) there was a transition to more activities implemented directly by the district/sub-county teams, with increased focus by SNV on capacity building of local government and community structures, as opposed to capacity building of local implementing partners.
Evaluation of WASH Results Programme Endline Synthesis Report
e-Pact 85
influencing district government WASH budget. In Tanzania, sanitation is not seen a big priority for
the government, and the National Sanitation Campaign is dependent on donor funding. Lack of
sectoral funding was also mentioned as a key risk by SNV staff in Ethiopia, Kenya, Mozambique,
Nepal, and Zambia.
4.5.3.3 SWIFT (urban and rural water and sanitation in Kenya)
There are some general patterns of note across the SWIFT partners in Kenya: i) broadly speaking,
the risks at the community level associated with technology choice and construction, community-
level institutions, and behavioural factors are negligible or moderate; ii) community-level risks
associated with lifecycle costs financial, operations and maintenance, and environmental issues
are a concern in many projects; iii) risks at the local government and national levels are relatively
high in the ASAL region; and iv) the urban projects generally had less prominent risks, as
compared to the rural projects, with the exception of those associated with revenues being
sufficient to meet lifecycle costs.
One finding which is true for both urban and rural ASAL projects is that the enabling environment
for sustainability remains weak in several key areas:
County governments (particularly water and health departments) have a pivotal role to play in
terms of backup technical support and ongoing sanitation and hygiene promotion to water
users associations and rural communities in general. However, NGOs have very little control or
influence over county government priorities, budget allocations, or responsiveness to
community needs, and in the context of recent devolution local government spending priorities
are increasingly politicised.
The remoteness of many rural communities makes it difficult and expensive for them to access
essential hardware and skills. The promotion of small WASH enterprises, as is often done via
sanitation marketing, for example, is probably not viable in such a sparsely populated
environment.
Poverty, compounded by environmental fragility, poses additional challenges to communities,
with the return of drought being an ever-present risk. Moreover, SWIFT has been operating
alongside humanitarian relief projects under which communities receive direct material
assistance and this can make it doubly difficult to resume a development-oriented approach
based on self-reliance once the emergency is over.
Beyond this, it is difficult to generalise about the risks across such a diverse range of projects in
SWIFT. Key points by supplier are discussed below in turn.
OxPAC urban water. OxPAC worked with Water Service Providers in Lodwar and Kakuma in the
ASAL region. The construction quality and functionality towards the end of the outcome phase
(aspects under the direct control of SWIFT) was generally seen as adequate and presenting
relatively low risk. What presents a greater risk is that the revenues collected are insufficient to
maintain systems: a risk that is more pertinent in the ASAL region, which is partially reflective of
the different contexts. This is a common risk in many contexts and the evaluation team recognise
the efforts of the suppliers in addressing this issue.
WSUP urban water. The sustainability prospects for the Dandora project look very positive: the
bulk supply to the settlement has been improved and the transition from illegal connections to
legal, shared connections is progressing well. If there continues to be large numbers of illegal
connections this would be a threat to the sustainability of the official service, but the risk of this is
now considered low as control measures have been successfully enforced. Losses through
Evaluation of WASH Results Programme Endline Synthesis Report
e-Pact 86
leakage also need to be managed but this, too, is manageable given that most of the distribution
network is new, and bulk meters are being installed at strategic points to help monitor losses.
Another positive is that demand for shared metered connections has been higher than expected.
Following the midline survey, WSUP conducted a small affordability survey, which found that the
connections are affordable for the great majority of residents (landlords pay for the connections
and metered consumption but may pass on some of the costs in increased rent). This being said,
there are some people living illegally on railway land at the edge of the settlement, and Nairobi City
Water and Sewerage Company cannot install services there. Alternative solutions may still need to
be sought.
OxPAC rural water. As is common in other contexts, the management of rural systems draws on
a community-based management model, and in Kenya this is relatively well formalised, with the
Water Users Associations being formally recognised and elected bodies. Though the institutional
framework is relatively clear, the assessment highlights some issues with capacity at the Water
Users Association level: specifically, that while the associations are equipped to deal with minor
operation and maintenance, more serious issues (such as pump breakdown) require support from
the county government. The assessment also raises concerns surrounding environmental risks to
the long-term sustainability of services. This is also reflected in the functionality results over the
outcome phase. In the ASAL region, roughly a third of systems were reported by Water Users
Associations as non-functional in the final outcome verification round. This was attributed to the
prolonged drought in the region, which was deemed ‘exceptional’, and compensation was made in
payments to SWIFT. Nonetheless, looking forward, it is seen as likely that such events will affect
service functionality in the future, given the pattern of environmental change in the region due to
climate change.
Sanergy Urban Sanitation. As Sanergy operates as a social enterprise the focus of the
discussion of sustainability relates to the long-term viability of the business. While institutional
factors are important considerations, they are arguably less relevant to Sanergy than in cases
where implementation is tied to the continued action of government institutions. When Sanergy
made the strategic shift to focus on shared residential toilets, many of the public toilets established
during the output phase closed down due to a drop in demand (out of 257 in total, only 202 were
still in operation by February 2018). While the technical feasibility of Fresh Life Toilets has been
established, Sanergy acknowledges that there remain challenges to becoming financially self-
sustaining beyond donor funding. At present, roughly half of the operating costs are reportedly
funded by donors. Sanergy is in the process of developing its financial exit strategy. Its medium-
term objective is to further reduce the operating cost through increasing the density of its network,
and to replace the grant funding with a service contract with Nairobi City Water and Sewerage
Company or the municipality for the provision and emptying of shared residential toilets. It is far
from certain that this will happen, however, given especially that Sanergy serves informal
settlements. These are not a government priority and there is no indication so far that the city
authorities would be interested in paying for the service.
4.5.3.4 SAWRP (rural sanitation and hygiene in Pakistan)
The assessment highlights that, while much was done to consolidate latrine use during the
outcome phase, and to promote simple, affordable technologies that can be maintained at
community level, the enabling environment for sustainability remains weak in terms of ongoing
support and monitoring by local government agencies beyond the outcome phase. Particular
issues here are inadequate operational funding at local level and a lack of clarity over the roles and
responsibilities of specific government agencies; arguably factors outside of the control of SAWRP
to substantially influence.
Evaluation of WASH Results Programme Endline Synthesis Report
e-Pact 87
Accountability for outcome-phase results incentivised suppliers to ensure the continued
functionality and use of water and sanitation facilities up to the end of the outcome phase.
However, this is not attributable exclusively to the PbR modality; it seems highly likely that Country
Programmes would have done the same under grant funding if they were held accountable for
achievements at outcome level.
Country Programmes recognised the importance of developing the capacity and motivation of
government to provide a long-term, supportive role to communities once SAWRP had ended.
However, the PbR framework defined results only in in terms of beneficiary numbers and this
tended to marginalise programme efforts on institutional strengthening.
At least two of the implementing partners were expecting to continue operating in some of the
programme locations after SAWRP ended. There was potential scope, therefore, for the NGOs to
provide further motivational and supportive inputs to some communities: for example, by
encouraging maintenance or repairs when latrines filled or were damaged by floods. However,
much depended on the motivation of these organisations to do so, the funding available, and the
extent to which they could accommodate this additional work alongside their other commitments.
With regards to rural sanitation and hygiene in Pakistan, the assessment highlights that the
majority of the risks to sustainability relate to the institutional capacity and motivation of
government to support functionality and use. While the partners made clear efforts to strengthen
the capacity of local government it remains debatable as to the level of impact a programme of this
character (centrally managed, results focused, and using an NGO delivery channel) can
reasonably be expected to have on institutional capacity.
4.5.4 Effect of PbR modality on sustainability
The PbR modality does not appear to have significantly helped or hindered the sustainability focus
of any of the three suppliers. That is, the focus on sustainability within the programme was largely
rooted in the organisational values – with the partners taking steps to tackle specific sustainability
prerequisites (see Section 4.5.1). For SAWRP and SWIFT, the timing and intensity of activities
related to sustainability was seen to represent a change compared to normal ways of working, in
response to the rushed nature of the output phase and there subsequently being an outcome
phase. For SSH4A the sustainability approach was well defined prior to implementation and it
seems clear that the PbR modality did not hinder the extent of the focus on sustainability. If
anything, it is plausible that sustainability benefited from the flexible programming resulting from
PbR, based on anecdotal insights from Nepal. Achieving government buy-in has no standard
recipe and sufficient flexibility in programming is needed to allow the implementer to try different
ways of getting sustainability prerequisites in place.
Despite being the only supplier to link payments to sustainability prerequisites, SNV does not
appear to have changed its sustainability approach as a result of this PbR incentive. Linking
payments to internal sustainability indicators carried risks for SNV because putting in place the
prerequisites for sustainability was outside the direct control of SNV and required close
collaboration with government and the private sector. As a result, SNV only linked around 8% of
total payments to sustainability achievements. SNV agreed with DFID in 2017 to drop the
requirement to show progress on baseline levels and agreed with DFID that progress would only
be verified for six out of 10 indicators – thus in increasing the relative weight of those indicators in
relation to payment – but that reporting would continue for all 10 indicators. Despite these steps
taken by SNV to reduce the burden of verification, it appears that the extent of the focus on
Evaluation of WASH Results Programme Endline Synthesis Report
e-Pact 88
sustainability by SNV did not change due to the introduction of PbR. Capacity building and sector
strengthening remained a core part of the SSH4A approach, regardless of PbR.
The two-year outcome phase appears to have encouraged suppliers to take actions to ensure
functionality, and in doing so enhanced the sustainability focus for SAWRP and SWIFT. In the
case of the ASAL, key informants highlighted that the length of engagement they had with the
community-based and county-level institutions was longer than in normal programming. This was
attributed to the length of the outcome phase and the fact that the partners remained accountable
for functionality. This was a sentiment that was echoed in Pakistan, where many implementation-
level staff remarked that the outcome phase was a departure from normal programming and led
them to focus more on activities that supported instilling long-term behaviour change over focusing
only on outputs. However, the team note that most of the activities remained similar in character to
those conducted as a matter of course in many WASH programmes (e.g. household follow-up
visits and capacity building of local government).
4.5.5 Dissemination and learning
This section addresses dissemination and learning from a sectoral perspective, external to the
programme. Refer to Section 4.2.8 for internal learning between and within supplier consortia.
As noted in Section 4.2.8, a key mechanism for learning on PbR for the WASH Results
Programme was Itad’s L&D team, as part of the MV contract, which issued various blogs and
learning products and held annual learning events.159 DFID participated in events as appropriate
and reviewed learning products.
With regards to wider sector dissemination, the Suppliers have engaged in global and national
level learning activities to varying degrees:
SSH4A proactively engaged in learning activities to shape wider sector learning at both a
national and a global level. At the global level, SNV presented at a variety of conferences,
produced several blogs and impact stories for the SNV website, and is planning further
learning papers. Country-level activities differed by country, and included regular
government district-level planning meetings, joint monitoring visits with government
partners, and contributions to national WASH working groups. However, some SSH4A
country teams felt that finding time to document learning was a challenge throughout
implementation, especially in the output phase. Also, geographic proximity influenced
opportunities to share learning. For example, in Ethiopia the SNV country manager was
well placed to share learning with the sector working groups, whereas SNV country teams
based away from the capital city (as was the case in Zambia) were probably less able to
influence.
SAWRP shared its experience in global and regional fora including SACOSAN VI in 2016
and at a variety of WEDC conferences160and a national conference on PbR. It also held a
SAWRP UK learning event in Feb 2018. Also some provincial governments jointly
published project summary briefs highlighting successes. SAWRP did not have a structured
plan to engage in sharing lessons from SAWRP with national governments or other sector
stakeholders, but, Plan International, WaterAid and their partners continued to be active
159 See, for example, the blog at https://washresultsmve.wordpress.com/ 160 WEDC conferences (2015 – PbR, 2016 – PbR, and sustainability, 2017 – behaviour change, MHM, MVE, E&I, 2018 –
sustainability assessment, institutional sustainability)
Evaluation of WASH Results Programme Endline Synthesis Report
e-Pact 89
supporters of District WASH Forums and supported development of district ODF Plans and
suppliers had ongoing dialogue with key provincial government agencies on WASH
matters, though this was not related to SAWRP specifically. SAWRP’s learning partner,
WEDC was in the process of developing a number of learning publications at the time of
the evaluation interviews.
The SWIFT learning approach varied by country. SWIFT has some ongoing operational
research in DRC. Learning initiatives in Kenya during the outcome phase included a cross-
country learning event in Nairobi in 2017; Oxfam and Practical Action are also developing
(separate) papers on the applicability of CLTS in ASAL; and Oxfam has some learning
work on utilities, via a research project with Oxford University, though this is not part of
SWIFT. The programme has not (so far) been actively involved in sharing lessons from
SWIFT with national government or other sector stakeholders in Kenya. In DRC the
programme was more active and hosted three events (two on implementing PbR and one
on the semi-urban approach). SWIFT also documented much of its learning on the
programme website (swiftconsortium.org).
It is clear that there were efforts to disseminate learning at the global level: notably at several
WEDC conferences and World Water Week in Stockholm in 2018. What varied more was the
dissemination at the national sector level – in some cases (particularly Pakistan and Kenya) there
could have been a greater focus on consolidating and sharing learning at the national level.
Furthermore, both of the learning partners (WEDC and ODI) reported that their learning function
was ‘crowded out’ in favour of supporting the development of monition frameworks – particularly in
the first half of the programme. This is partially related to the fact that the MV burden was more
intensive than the suppliers expected and due to the rushed nature of the output phase
implementation. A similar experience was reported by country-level implementation staff, who
highlighted that at these times a focus on learning was constrained by the pressure to deliver
results.
Evaluation of WASH Results Programme Endline Synthesis Report
e-Pact 90
5 Lessons learned and recommendations
This section first presents some reflections on WASH programming more generally, then moves to
the evaluators’ lessons learned and recommendations for the WASH Results Programme.
The lessons and recommendations presented in this section are framed around the core objectives
of this evaluation, which were to assess:
whether the programme successfully achieved its stated objectives;
the influence of programme design, including the PbR modality, on this achievement; and
lessons for applying PbR in WASH programming in future.
As this is an endline evaluation, the evaluators focused on broader lessons relevant for the future
for individual Suppliers, DFID and/or the WASH sector as a whole. This section does not attempt
to comprehensively repeat all of the lessons and recommendations from the midline evaluation
(see full list from the midline in Annex A), though several themes carry through.
5.1 High-level reflections relating to water, sanitation, and hygiene programming aspects
The findings of this evaluation, together with broader sector learning on sustainability of water and
sanitation services and hygiene practices, can contribute to DFID’s evolving thinking around
sustainable WASH programming.
We highlight three key implications for future WASH programming:
First, it is important to design in a sustainability focus from the outset - the inclusion of
programme design features that may inadvertently or unintentionally lead suppliers to
postpone addressing sustainability to later stages can never be endorsed as good practice.
An early assessment of context and the risks to sustainability is important to meaningfully
being able to take action on sustainability over the course of a programme cycle. Using
PbR to incentivise short-term post-implementation functioning and utilisation of services (as
in this programme) can be helpful, but finding effective ways to incentivise true
sustainability is more challenging; more work is needed to develop and test such incentive
frameworks.
Second, it is important for DFID and its suppliers to clearly conceptualise and measure
progress on sustainability. In this programme SAWRP’s SAF framework and SNV’s
Sustainability Indicators exemplify such conceptual frameworks and indicators. Such
frameworks provide an important way to initially assess, and then later track progress on
addressing the risks to sustainability.161 However it is important to note that such
frameworks (including the risk based analysis used in this evaluation) are by nature
generic, and certain dimensions will be more or less relevant in different contexts. In WASH
programming, generic frameworks and indicators must be modified for context.
161 Although the WASH sector does not currently have a clear set of proxy indicators that have evidence showing their predictive value for future sustainability.
Evaluation of WASH Results Programme Endline Synthesis Report
e-Pact 91
Third, important aspects of true sustainability – the continued functioning of services and
practices with no time limit – lie beyond the control of donors and suppliers engaged in
programmes of limited duration (including this one). We have highlighted a number of such
external factors, related to the broader enabling environment for sustainable WASH service
delivery. These observations offer important lessons for donors and implementers of
WASH programmes. Donors and suppliers should consider which aspects of the enabling
environment in the country context are particularly critical for sustainability; these should
then be addressed within WASH programmes or other parallel initiatives which aim to
strengthen institutional arrangements for service delivery. For DFID, an important wider
question is the balance to be struck between funding programmes which deliver first-time
access and short-term functionality, and those addressing weaknesses in the enabling
environment (or the downstream / upstream balance, to use UNICEF’s terminology). In our
view programmes addressing first time access should also include aspects of systems
strengthening, since the credibility given by the former often gives the “seat at the table” to
influence the latter.
5.2 Lessons learned
The lessons presented in this section are framed around the core objectives of this evaluation,
which were to assess:
whether the programme successfully achieved its stated objectives;
the influence of programme design, including the PbR modality, on this achievement; and
lessons for applying PbR in WASH programming in future.
As this is an endline evaluation, the evaluators focused on broader lessons relevant for the future
for individual Suppliers, DFID and/or the WASH sector as a whole. This section does not attempt
to comprehensively repeat all of the lessons and recommendations from the midline evaluation
(see full list from the midline in Annex A), though several themes carry through.
5.2.1 Whether the programme successfully achieved its stated objectives
A. All three supplier consortia were successful in delivering their targets, through there is a question of how replicable this achievement is. Each supplier achieved its total output targets and overwhelmingly achieved the outcome targets, with significant overachievement in several areas and modest underachievement in a few others. They achieved, if not exceeded, all contractual targets – due to the possibility to shift over-achievement to cover underperformance within some subcategories. However, the tight timetable in the output phase placed a high burden on staff; particularly during the output phase. Numerous staff reported working extra hours on nights and weekends, and a few staff left, due, at least in part, to the pressure. The WASH Results Programme was exceptional in that it was the first large-scale application of PbR in the WASH sector; it was a high-profile programme which presented great financial and reputational risks for the suppliers. With this came heightened management attention. Among the suppliers’ portfolio of projects the WASH Results Programme was very much a ‘special case’. These exceptional factors are significant because they raise some questions surrounding how replicable the achievements of the programme are.
B. Suppliers’ programme approaches were generally well aligned with DFID’s expectations, but in some cases the fact that DFID did not articulate these expectations more clearly resulted in a missed opportunity. Despite the tight timetable
Evaluation of WASH Results Programme Endline Synthesis Report
e-Pact 92
for the output phase, combined with the PbR modality, the programmatic approaches chosen by the suppliers generally met DFID’s expectations, such as operating at scale162, inclusivity, and sustainability. However, not requiring a focus on community-wide coverage (in sanitation, ODF status) or other best practice for achieving sustainable and inclusive outcomes presented a missed opportunity – though it is noted that in many cases ODF was still pursued as a programme objective by suppliers. DFID not explicitly setting all of their expectations at the bidding stage created a risk for potential suppliers, onto whom the risk of delivery was transferred under a PbR contract.
C. The PbR modality strengthened supplier monitoring systems, though in many cases undertaking improvements to monitoring systems was more burdensome than suppliers anticipated. The monitoring systems of most of the supplier consortia partners required moderate to significant modifications to meet verification requirements. On the one hand, these modifications brought several benefits, including a higher accuracy of monitoring data, and (in the case of the introduction of mobile-based monitoring) increased efficiency of monitoring. On the other hand, two of the three suppliers reported that the burden was heavier than under grant-based programmes throughout implementation. When considering the optimal monitoring intensity, striking a balance between the increased rigour and the corresponding increased opportunity cost -- with regards to staff time and money -- is important.
D. Suppliers reported substantial learning on how to manage and price risk. Based on the programme’s experience, the following approaches worked well, some of which can be considered normal good practice: (1) setting realistic (if not conservative) targets; (2) using reliable implementation partners; (3) applying tested approaches; (4) including a contingency fund as a buffer for slippage in timing and scope (e.g. due to additional PbR requirements); (5) considering inflation and salary increases in the total price; (6) considering the risk that partners (e.g. local government) would not achieve the intended results and that the lead suppliers would lose out on the pre-financed investments; and (7) taking advantage of the increased monitoring to facilitate risk management.
5.2.2 The influence of programme design, including the PbR modality, on this achievement
E. DFID gave suppliers substantial flexibility and freedom to design and implement their own approaches, but this flexibility largely manifested only to higher levels of programme management163. Suppliers were able to propose the indicators, and the frequency with which they would be assessed, and each individually negotiated a different ‘results framework’ with DFID under which they were paid. Suppliers appreciated this flexibility at the design stage, as well as the flexibility allowed during implementation. The most valued aspects of this flexibility were the ability to shift between budget line items without getting higher-level approval, choice of activities at the programme level, and the ability to shift targets between areas, to the extent that monitoring approaches including baseline requirements allowed. This flexibility was largely confined to higher levels of programme management, as field teams were tightly managed, and where there were local implementing partners they generally operated on grant agreements which retained financial and activity reporting.
F. Implementation approaches for the three supplier consortia varied widely yet overwhelmingly relied on proven approaches and existing relationships with NGOs and governments. The evaluators uncovered little evidence of genuine innovation in
162 Taken here to mean reaching a large number of people 163 This lesson is also supported by evidence from the wider PbR literature. See Soucat, A., Dale, E., Mathauer, I., Kutzin,
J. (2017) ‘Pay-for-Performance Debate: Not Seeing the Forest for the Trees’. Health Systems & Reform 2017; 3:74–79; and Renmans, D., Holvoet, N., Orach, C. G. and Criel, B. (2016) ‘Opening the “black box” of performance-based financing in low- and lower middle-income countries: a review of the literature’. Health Policy and Planning, 31(9), 1297–1309. doi: 10.1093/heapol/czw045
Evaluation of WASH Results Programme Endline Synthesis Report
e-Pact 93
programmatic approaches – meaning that no approaches that were novel to the global WASH sector were developed, though it is important to note that evaluators found several instances of adaptive programming. Also, per Clist’s (2017) classification, the WASH Results Programme constitutes ‘small PbR’, which is characterised by lesser quality measures, greater oversight required to track inputs and negotiate approaches, shorter agreements, and a tendency to implement through NGOs and the private sector – all of which Clist suggests combine to create less space for autonomy and innovation.
G. The split between output and outcome phases had mixed results. The urgency of the December 2015 deadline for the output phase in some cases limited suppliers’ ability to adapt and posed risks to quality, at least in the short term, and the sustainability of results. While it was clearly beneficial to have longer-term engagement with the institutions (government or community-level) with responsibility for managing services, this could have been achieved without formal phasing. Similarly, while imposing accountability for outcomes was beneficial and improved functionality, this could also have been achieved without formal phasing. SSH4A, which created no distinction between output- and outcome phase activities (see detail in Chapter 3), faced fewer challenges in prioritising sustainability than SWIFT or SAWRP, which followed formal phasing.
5.2.3 Lessons for applying PbR in WASH programming in future
H. The WASH Results Programme was not a clean test of PbR, for a variety of reasons,
such as the evolution of expectations, the characteristics of the contracting process, and
the uniquely tight timetable for the first two years. For example, many programmatic
decisions had already been made by suppliers, by verifiers and by DFID before the PbR
modality was fully understood, and before the indicators for which suppliers would be
judged were negotiated. While the WASH Results Programme offers several interesting
and indicative lessons, its contribution to the broader evidence base for PbR in WASH is
limited.
I. PbR appeared to be a viable option for funding WASH programmes, but 100% PbR
was neither necessary nor optimal. The WASH Results Programme was DFID’s first
100% PbR programme in the WASH sector. To help manage cash flow and other risks, two
suppliers selected several process or activity targets, however these activities were time-
consuming to document and verify. These could easily have been reimbursed in a more
traditional way, without reducing the overall stimulus a PbR contract provides. For example,
grant funding could be reserved for inception activities, learning activities, a management
fee, or important process-related indicators (see next point).
J. A PbR approach using disincentives only, without bonus opportunities, put
potentially undue, and unintended, burden on Suppliers. Suppliers put in a great deal
of effort to not only achieve but overachieve many targets, but were not rewarded for doing
so. The option of including incentives as well as penalties, as done by some other PBR
programmes to guide desired results, were not used in this PBR programme (see Section
2.3).
K. The efforts of suppliers were not solely informed by financial incentives. As the suppliers contracted under the WASH Results Programme had strong organisational values, which led them to take action on aspects not directly linked to payment, and while much of the evidence suggests that the focus of the programme was related to the payment indicators suppliers were also responsive to DFID’s requests and concerns outside of these. Furthermore, in many cases the reputational risk associated with not meeting given targets was a powerful motivator – as illustrated by the heightened senior management attention of the suppliers.
Evaluation of WASH Results Programme Endline Synthesis Report
e-Pact 94
L. Clarity on guiding principles of how major events, such as natural disasters or epidemics, would be handled between DFID and suppliers was important in a PbR context. In two cases involving SWIFT, DFID de facto assumed some of the financial risk after events, by agreeing to change payment terms due to an Ebola epidemic and due to an exceptional drought. Because the level of risk-sharing and the level of evidence expected was not clearly specified at contract stage, time and resources were invested in negotiating the level of risk sharing on a case-by-case basis, causing inefficiencies.
M. The high level of uncertainty at invitation to tender stage discouraged several bidders. Specifically, the lack of clarity surrounding the results and how they would be verified meant that some private sector actors viewed the programme as very high risk. The risk was perceived as lower by INGOs (both successful and unsuccessful bidders), partially due to there being established working relationships between DFID and the INGOs which implemented the WASH Results Programme.
N. Under the WASH Results Programme, in part because of the lack of clarity on how
the PbR modality would operate, the PbR incentives were better able to act on tried
and tested implementation approaches than on untested operational models. Tried
and tested implementation approaches had a framework within which incentives could act
to tweak delivery. Otherwise, incentives could have acted in either a positive or negative
direction, with a risk that they lead to movement away from the overarching objectives. The
experience of some SWIFT partners highlights the risk of using untested operational
models in the context of a PbR programme: those few partners who used models new to
them did not reach the expected output levels.
O. The lack of an inception phase – to design verification requirements before
implementation began – caused inefficiencies because the verification process had
to be repeatedly adapted as the supplier’s systems changed or became better-known
by the MV team. For suppliers, responding to evolving MV requirements created
inefficiencies in some cases. However evolving MV requirements were also beneficial,
because they adapted as the supplier’s systems changed or became better-known by the
MV team.
P. The value of including process-related indicators as payment indicators was
dependent on context. Process related indicators were used for payment in two main
ways: i) relating to start-up activities in the early stages of the programme and ii) in the
case of SSH4A only, related to progress towards their sustainability indicators (SIs). As
mentioned above, the evaluators perceived that the process indicators related to start-up
activities were included primarily to minimise the risk of non-payment for the suppliers and
to facilitate cash flow in early stages rather than incentivise supplier attention on specific
aspects of programming164. This was suboptimal and inefficient when these indicators are
costly and time-consuming to document and verify. The experience of this programme
shows that more complex aspects of programming (e.g. sustainability prerequisites or
learning – see point ii) above) which lack agreed standards are difficult to measure. There
is value in reporting on process indicators related to these complex aspects of
programming when DFID seeks to encourage certain aspects in programme
implementation. Though this reporting does not necessarily need to be linked to result-
based payments165. Both SWIFT and SAWRP included periodic assessments related to
sustainability similar to SNV’s Sustainability Indicators, which led to course corrections in
implementation despite not being linked to payment. If progress on these aspects is linked
164 This indicates that it is less likely that such process indicators would be included in future if a significant part of the
programme was grant-funded. 165 If aspects such as inclusion were linked to a result-based payment, these payments could for example reward the
following: (a) Work in under-served geographical areas could be rewarded by allowing a higher unit price-per-beneficiary. (b) Bonus payments could reward survey results which confirm that equity targets and water-point functionality targets have been met after a certain period.
Evaluation of WASH Results Programme Endline Synthesis Report
e-Pact 95
to payment, there is a risk that selecting the wrong indicators could lead to only a
superficial engagement with the issues to ensure payment – or, worse, could incentivise
activities not relevant or optimal in certain contexts.
Q. The PbR mechanism was better able to incentivise the desired results in those cases
where suppliers had more control over results. In those cases where implementation
was through government, the PbR incentive acted less strongly – and suppliers often used
up existing social capital as an additional mechanism. In the case of incentivising behaviour
change – which was partly outside of the control of suppliers – the PbR incentive also acted
less strongly.
R. Larger international partners were better able to handle the pre-financing, risk
management, and flexibility necessary under PbR than small organisations. All three
lead suppliers chose to hold a large portion of risk centrally, pre-financing their other
consortium members (SAWRP) or national partners (SWIFT), or their country teams (for
SSH4A). This was possible due to the significant cash reserves held by these
organisations, relative to the pre-financing requirements. There were mixed results in the
few cases where local implementers were on full or partial PbR contracts, with some
shifting positively to a stronger sense of accountability, while others were less able to cope
and in some cases had their contracts discontinued.
S. Establishing appropriate outcome level targets was challenging. Setting the level of ambition for outcome targets involved significant discussions with DFID, as well as input from the MV team, on what level of achievement could reasonably be expected for the water, sanitation, and hygiene outcome targets because much was beyond the suppliers’ direct control. There are few, if any, established benchmarks for the conversion of WASH outputs into outcomes. The challenge of measuring hygiene outcomes has posed challenges for setting targets. The PbR mechanism based on beneficiary numbers also may have inadvertently marginalised other aspects related to institutional strengthening – and created sustainability risks.
T. Several lessons emerged on how the PbR modality could best strengthen supplier monitoring systems: In the WASH Results Programme, explicitly linking payments to outcomes triggered intensive discussion around outcome measurement, and the validity of those measurements in particular. Outcome-level monitoring, as well as accountability, played a facilitative role in ensuring functionality. The increased monitoring also supported supplier risk management strategies. It is also noted that suppliers were generally positive about the MV’s contribution to strengthening monitoring. Other lessons relating to monitoring include the following:
o Where possible166, mobile-based monitoring was better suited for verification than paper-based systems.
o Consortia with fewer institutional layers were more efficient: for example, reducing the risk of duplication of quality assurance efforts.
o Where suppliers undertook spot checks (small-scale random checks of the monitoring data) before submitting results to verifiers, this was able to reduce the frequency of queries or challenged results.
o In some cases, verification of results increased local partners’ ownership of the programme. For one supplier, showing progress to neighbouring district government staff worked well to motivate all districts to perform better and take ownership of results.
166 GPS-enabled devices were not allowed by the Pakistani or DRC government, for security reasons.
Evaluation of WASH Results Programme Endline Synthesis Report
e-Pact 96
U. Several missed opportunities for learning occurred under the WASH Results Programme: Firstly, while a large quantity of data were produced, the data were primarily used for progress reporting/compliance, as opposed to learning –partially due to the nature of the data: Primarily quantitative data were used for payments, which can be less useful to programme managers than more qualitative information on programme functioning. One consortium learning partner also felt that some of the data were not packaged in a way that was meaningful for learning. Secondly, the tight schedule in the output phase also limited opportunity for deeper learning and reflection. Thirdly, differences in how indicators were calculated between suppliers also made them less comparable for broader learning. Fourthly, having different verifiers for different suppliers was less conducive to facilitating cross-learning, though may well have had other benefits. Itad attempted to mitigate this issue through regular cross-programme learning activities.
5.3 Recommendations for future WASH PbR programmes
These recommendations are primarily for donors, such as DFID, that are considering the use of
PbR in future WASH programmes.
1. At design stage clarify the purpose of using PbR and consider the implications of
PbR for the type of supplier expected to bid. When considering PbR, it is important to
think critically about how important financial incentives and disincentives may be to the
particular type of supplier involved. While the potential benefits of PbR generally are well
documented, it is important to set out in the programme design what the specific rationale
is for using PbR in this case, and to define the added value that it should offer. The
mechanism for how PbR is expected to deliver its intended benefits should be clearly set
out in a theory of change. This will allow the donor to more easily check under which
circumstances intended benefits have, or have, not been manifested, allowing important
contributions to be made for sector learning on this topic. The purpose of using PbR should
be reflected in the size of the PbR component and the type of result specified, and the
indicators used. Furthermore, these should be considered in relation to the type of supplier
anticipated – or desired – to bid.
2. 100% PbR is undesirable – the size of the PbR component should be tailored to the
purpose specified and to the feasibility of measuring results. The experience of the
WASH Results Programme was that it was resource intensive and methodologically
inefficient to measure and verify progress on some ‘process’ aspects. Similarly it was
methodologically-challenging to verify hygiene related outcomes, even if it resulted in
important sector learning on hand washing measurement. Given the low degree of control
which suppliers have over the achievement of WASH behaviour change, we recommend a
hybrid design where a part of supplier payments are grant-based, with a smaller
percentage used as an incentive for good performance in key areas167. This incentive could
be an upside incentive rather than a penalty. If PbR is used to incentivise action related to
aspects of programming which are important but difficult to measure168, then great care
should be given to the indicators used as they will likely be related to processes (and
therefore challenging to verify), and furthermore it is unlikely that the indicators defined in
advance of commencing a programme will be relevant in all contexts and/or over the
167 Experience with PbR in other sectors also suggests that the value of PbR lies not in reimbursing the direct costs of
implementation (as NGOs are already motivated to do this) but in linking PbR payments so as to incentivise only those dimensions which might otherwise be marginalised, albeit unintentionally
168 These aspects include: creating an enabling environment for sustainability; ensuring meaningful action on equity and inclusion; and allowing space for learning.
Evaluation of WASH Results Programme Endline Synthesis Report
e-Pact 97
course of programming. Alternatively, if these aspects are not linked directly to payment
indicators they could be embedded within programming, either as grant requirements (e.g.
requiring outcomes to be community-wide) or reported on over the course of the
programme, with a feedback loop established between reporting and implementation (e.g.
repeated sustainability assessments over the course of the programme with a management
response).
3. Where possible, streamline the verification burden on suppliers. This relates both to
the indicators used for payment purposes and how the effort is applied by verifiers.
Indicators should only be used for payment where there is a clear rationale for doing so,
and as far as possible unnecessarily verifying process indicators should be avoided.
Complex multi-criteria payment indicators should be avoided because these reduce the
power of the incentives169. Furthermore, a risk-based approach to focusing the verification
could be applied. Where verifiers are satisfied that a supplier’s internal quality assurance
and monitoring systems are of a good standard, then verification need not be undertaken
for every milestone, though the verifier would reserve the right to do so at any time.
4. At design stage, the funding agency should, as far as possible, provide more clarity
on the results to be achieved and the accompanying verification requirements. In
some instances there may be a tension between over-specifying requirements prior to
contracting, which could restrict suppliers in terms of the programme approaches or areas
they select to work in, and minimising uncertainty at tender stage with regards to the MV
requirements, which is desirable. This may include appointing the verification provider
before implementation begins and/ or being more prescriptive on standards for verification
requirements170. Better defining verification requirements up front will enable suppliers and
verifiers to develop better methodologies and operational plans, to deploy the right type and
number of personnel, and to get up to speed faster once the programme begins. Guidelines
on the evidence requirements for verifying WASH outputs, outcomes, and sustainability
prerequisites should be drawn up before implementation begins.
5. As far as possible, at tender stage clarify donor/supplier risk-sharing arrangements
in the event of exceptional events. While it is unlikely that the level of risk-sharing can be
determined in advance of such events, what can sometimes be better specified at
contracting stage is the process for deciding on the appropriate level of risk-sharing,
including the level and type of evidence expected. This will be more significant where PbR
is used in fragile contexts, and the appropriate level of risk-sharing may be a factor when
DFID is contracting programmes that work across fragile and non-fragile contexts. In fragile
settings, organisational flexibility and social capital may be even more important in regard
to suppliers being able to manage the risks of PbR.
6. In future programmes ensure there is a sufficient inception phase. At the March 2016
Learning Event there was consensus among suppliers, verifiers, and DFID regarding the
benefits of a sufficiently long inception period: ensuring that verification requirements are
clear before any implementation activities begins was seen as essential for clarifying MV
169 This recommendation is also supported by evidence from the wider PbR literature: See Witter, S., Zulfiquar, T., Javeed,
S., Khan, A., Bar, A. (2011) ‘Paying health workers for performance: a district-based case study in Pakistan’. Human Resources for Health 9, 23. www.human-resources-health.com/content/9/1/23
170 This recommendation is also supported by evidence from the wider PbR literature. See Witter, S. et al. (2018) ‘(How)
does RBF strengthen strategic purchasing of health care? Comparing the experience of Uganda, Zimbabwe and the Democratic Republic of the Congo’. Submitted for publication.
Evaluation of WASH Results Programme Endline Synthesis Report
e-Pact 98
requirements and for allowing suppliers to sufficiently resource their support to the
verification process. The length of the inception phase should be related to the level of
uncertainty: the greater the level of uncertainty the longer the planned inception phase
should be.
7. Ensure that the learning by the MV team and suppliers on measuring and verifying
key WASH indicators (especially outcome-level indicators) is captured and
disseminated at the sector level. Guidance has been written by ITAD on how to design a
verification system, set up a systems-based verification system and select good indicators.
This guidance could be used to update DFID’s guidance on monitoring key WASH
indicators.
Evaluation of WASH Results Programme Endline Synthesis Report
e-Pact 99
Bibliography
Arnold B F, et. al. (2013) Cluster-randomised controlled trials of individual and combined water, sanitation, hygiene and nutritional interventions in rural Bangladesh and Kenya: the WASH Benefits study design and rationale. BMJ Open 2013;3:e003476. doi:10.1136/bmjopen-2013- 003476
Arnold et.al. (2018). Implications of WASH Benefits trials for water and sanitation – Authors reply’. Voulme 6, e616-e617; https://www.thelancet.com/pdfs/journals/langlo/PIIS2214-109X(18)30229-8.pdf
Battye, F. (2015). ‘Payment by Results in the UK: Progress to date and future directions for evaluation’. Evaluation 21(2):189–203.
Boyes-Watson, T. (2015). ‘How the increasing use by DFID of Contracts and Payment by Results may affect INGOs.’ Research Paper. Mango: London. www.mango.org.uk/getconnected/mangocampaigns/paymentbyresults.
Bertone, M.P. and Meesen, B. (2012). ‘Studying the link between institutions and health system performance: A framework and an illustration with the analysis of two performance-based financing schemes in Burundi’. Health Policy Plan.
Boyes-Watson, T. (2015). ‘How the increasing use by DFID of Contracts and Payment by Results may affect INGOs.’ Research Paper. Mango: London. www.mango.org.uk/getconnected/mangocampaigns/paymentbyresults
Birdsall, N. and Savedoff, W. D. (2010) ‘Cash on Delivery: A New Approach to Foreign Aid’. Publication of the Center For Global Development (CGD), Washington, D.C. URL: www.cgdev.org/publication/9781933286600-cash-delivery-new-approach-foreign-aid
Carter R C (2013) Editorial: researching “how” rather than “why”. Waterlines, 32 (1), pp3-4. January 2013. http://practicalaction.metapress.com/content/n28v0301u18831r8/
Carter, R. (2016; in review). ‘Can and should sanitation and hygiene programmes be expected to achieve health impacts?’ (draft)
Carvalho, S. and White H. (1997). ‘Combining the quantitative and qualitative approaches to poverty measurement and analysis’, Technical Paper 366. The World Bank: Washington D.C.
Castalia. (2015). Review of Results-Based Financing Schemes in WASH. Available at: https://www.ircwash.org/sites/default/files/rbf_in_wash_final_report_full_jan_2015.pdf
Cairncross S and Valdmanis V (2006) Water supply, sanitation, and hygiene promotion. In: Disease Control Priorities in Developing Countries (2nd Edition). New York: Oxford University Press. 771-792.
Chinfatt, S. & Carson, M. (2017). Supplier access to pre-finance in payment by result contracts. Available at: https://assets.publishing.service.gov.uk/media/5a3568fced915d5a62fdc5a5/EXTERNAL_REPORT_-_Supplier_Access_to_Prefinance_in_Payment_by_Results_Co....pdf
Clist, P. and Dercon, S. (2014). 12 ‘Principles for Payment By Results (PBR) in International Development’. URL: www.gov.uk/dfid-research-outputs/12-principles-for-payment-by-results-pbr-in-international-development.
Clist, P. and Verschoor, P. (2014). ‘The Conceptual Basis of Payment by Results’. University of East Anglia, Norwich, UK. URL: http://r4d.dfid.gov.uk/Output/195131/
Clist, P. (2017). Full Report: Review of Payment by Results in DFID: Establishing the Evidence Base: Objective 2: What works for Payment by results Mechanisms in DFID Programs. Available at: https://assets.publishing.service.gov.uk/government/uploads/system/uploads/attachment_data/file/684278/full-report-UEA2-merged.pdf
Evaluation of WASH Results Programme Endline Synthesis Report
e-Pact 100
Cronin et al. (2017) for a discussion of the importance of focusing on community-wide impacts in reference to the SDGs – authored by senior global WASH leaders within UNICEF. https://equityhealthj.biomedcentral.com/track/pdf/10.1186/s12939-017-0709-5
Coffey and Spears (2018). Implications of WASH Benefits trials for water and sanitation https://www.thelancet.com/pdfs/journals/langlo/PIIS2214-109X(18)30225-0.pdf
Cummings and Curtis (2018). Implications of WASH Benefits trials for water and sanitation‘; Volume 6, e613-e614; https://www.thelancet.com/pdfs/journals/langlo/PIIS2214-109X(18)30192-X.pdf
Dar O A, Khan M S (2011) Millennium development goals and the water target: details, definitions and debate. Tropical Medicine and International Health,16(5), 540-4. doi: 10.1111/j.1365-3156.2011.02736.x.
de Albuquerque C (2014) Realising the human rights to water and sanitation: a handbook. Book 7 Principles. http://www.rural-water-supply.net/en/resources/details/654
DFID (2012). Water, Sanitation and Hygiene Portfolio Review March 2012. www.gov.uk/government/uploads/system/uploads/attachment_data/file/214187/DFID_20WASH_20Portfolio_20Review.pdf.
DFID (2013a). Water, Sanitation and Hygiene Evidence Paper, May 2013. URL: www.gov.uk/government/uploads/system/uploads/attachment_data/file/193656/WASH-evidence-paper-april2013.pdf.
DFID (2013b). Business Case and Intervention Summary, Water, Sanitation and Hygiene (WASH) Results Programme. URL: http://iati.dfid.gov.uk/iati_documents/4116096.odt.
DFID (2014a). Sharpening incentives to perform: DFID’s Strategy for Payment by Results. https://assets.publishing.service.gov.uk/government/uploads/system/uploads/attachment_data/file/323868/Sharpening_incentives_to_perform_DFIDs_Strategy_on_Payment_by_Results.pdf
DFID (2014b). Designing and Delivering Payment by Results Programmes: Short Technical Guidance. July 2014. URL: www.gov.uk/government/uploads/system/uploads/ attachment_data/file/352519/Designing-Delivering-PbR-Programmes.pdf.
DFID (2014c). First Annual Review of the WASH Results Programme. URL: http://iati.dfid.gov.uk/iati_documents/4571521.odt.
DFID (2015a). Designing and Delivering Payment by Results Programmes: Full Technical Guidance (unpublished document).
DFID (2015b). Second Annual Review of the WASH Results Programme. URL: http://iati.dfid.gov.uk/iati_documents/4979606.odt.
DFID (2015c). DFID’s Evaluation Framework for Payment by Results. URL: www.gov.uk/government/publications/dfids-evaluation-framework-for-payment-by-results.
DFID (2016). Third Annual Review of the WASH Results Programme. URL: http://iati.dfid.gov.uk/iati_documents/5498968.odt.
Duvendack, M. (2017). Full Report: Review of Payment by Results in DFID: Establishing the Evidence Base: Semi-systematic review to understand Payment-by-Results mechanisms in developing countries. Available at: https://assets.publishing.service.gov.uk/government/uploads/system/uploads/attachment_data/file/684277/full-report-UEA1-merged.pdf
Eichler, R., Auxila, P., Antoine, U., Desmanglesena, B. (2009) ‘Haiti: Going to Scale with a Performance Incentive Model’, in: Performance Incentives for Global Health: Potential and Pitfalls. Center for Global Development, Washington, DC.
Esseku, H. & Roberts, L. (2013) Development of results-based financing framework for sanitation delivery. Briefing Paper 1770. WEDC International Conference, Nakuru, Kenya. Available at: https://dspace.lboro.ac.uk/dspace-jspui/bitstream/2134/30895/2/Esseku-1770.pdf
Evaluation of WASH Results Programme Endline Synthesis Report
e-Pact 101
Engel, J and S. Nicolai (2012). ‘Using case studies to untangle complexity and learn from progress’. ODI Development Progress. Project Note 2. www.developmentprogress.org/using-case-studies-untangle-complexity-and-learn-progress-0’
Feeny, E. (2016). Implementing WASH programmes in a Payment by Results context. Consortium for Sustainable Water, Sanitation and Hygiene in Fragile Contexts. Available at: https://assets.publishing.service.gov.uk/media/57a3610ae5274a31e0001b61/PbR_Learning_Brief_web.pdf
Fritsche, G., Bèla, R., Soeters, and Meessen, B. (2014). Performance-Based Financing Toolkit. Washington, DC: World Bank.
Global Partnership on Output-Based Aid. (2016). Water Sector Experience of Output-Based Aid. World Bank, Washington, DC. Available at: https://openknowledge.worldbank.org/handle/10986/24674
Gosling L (2010) Equity and inclusion: a rights-based approach. WaterAid, London. http://www.wateraid.org/uk/what-we-do/our-approach/research-and-publications/view-publication?id=d98d98ad-b605-4894-97cf-0c7682e62b04
Gwatkin, D. R. (2009). ‘Ensuring that the Poor Share Fully in the Benefits of Results-Based Financing Programs in Health’. World Bank Working Paper
House of Commons Public Administration and Constitutional Affairs Committee. (2018). After Carillion: Public sector outsourcing and contracting – Seventh report of Session 2017-19. Available at: https://publications.parliament.uk/pa/cm201719/cmselect/cmpubadm/748/748.pdf
Hunter, P.R. and Prüss-Ustün, A. (2016). ‘Have We Substantially Underestimated the Impact of Improved Sanitation Coverage on Child Health? A Generalized Additive Model Panel Analysis of Global Data on Child Mortality and Malnutrition’. PLoS ONE 11(10): e0164571.
ICF International. (2015). Payment by results: Learning from the Literature. A review prepared for the National Audit Office. Available at: https://www.nao.org.uk/wp-content/uploads/2015/06/Payment-by-Results-Learning-from-the-Literature.pdf
Jenkins, M. (2016). How can we reach the poor with market-based approaches? 2016 Colorado WASH Symposium, University of Colorado Boulder. Available at: https://www.colorado.edu/washsymposium/sites/default/files/attached-files/ucolorado_reaching_the_poorest_mar1_2016_v1_to_post.pdf
Jenkins, M. & Pedi, D. (n.d.). Guidance Note 8: Equity in Sanitation Marketing: How can we support the market to reach the poorest? UNICEF Sanitation Marketing Learning Series. Available at: https://www.unicef.org/wash/files/Guidance_Note_8_-_Reaching_the_Poor.pdf
Jones H and Wilbur J (2014) Compendium of accessible WASH technologies. WEDC / WaterAid / Share. www.wateraid.org/accessibleWASHtechnologies
Josephson, E., Gergen, J., Coe, M., Ski, S., Madhavan, S., and Bauhoff, S. (2017) ‘How do performance-based financing programmes measure quality of care? A descriptive analysis of 68 quality checklists from 28 low-and middle-income countries’. Health policy and planning, 32(8), 1120–1126.
Lindenenauer et al. (2007). ‘Public reporting and pay for performance in hospital quality improvement’. New England Journal of Medicine 356(5): 486–496.
Luby et. al (2018). ‘Effects of water quality, sanitation, handwashing, and nutritional interventions on diarrhoea and child growth in rural Bangladesh: a cluster randomised controlled trial’ Lancet Global Health; Volume 6, Issue 3, PE302-E315. https://www.thelancet.com/pdfs/journals/langlo/PIIS2214-109X(17)30490-4.pdf
National Audit Office (2015a). ‘Payment by results: Analytical framework for decision-makers. A review of National Audit Office’. London, UK.
Evaluation of WASH Results Programme Endline Synthesis Report
e-Pact 102
National Audit Office. (2015b). Outcome-based payment schemes: government’s use of payment by results. Available at: https://www.nao.org.uk/wp-content/uploads/2015/06/Outcome-based-payment-schemes-governments-use-of-payment-by-results.pdf
Null et. al (2018). ‘Effects of water quality, sanitation, handwashing, and nutritional interventions on diarrhoea and child growth in rural Kenya: a cluster-randomised controlled trial’ Lancet Global Health; Volume 6, Issue 3, PE316-E329. https://www.thelancet.com/journals/langlo/article/PIIS2214-109X(18)30005-6/fulltext?code=lancet-site
Okullo, J. O., Moturi, W. N., & Ogendi, G. M. (2017). Open Defaecation and Its Effects on the Bacteriological Quality of Drinking Water Sources in Isiolo County, Kenya. Environmental Health Insights, 11, 1178630217735539. http://doi.org/10.1177/1178630217735539
O’Donnel M. & Longhurst, R. (2014). Payment by Results: What it means for UK NGOs. Available at: https://www.bond.org.uk/sites/default/files/resource-documents/bond_pbr_what_it_means_for_ngos_nov14.pdf
OECD. (2017). Strengthening the results chain: Synthesis of case studies of results-based management by providers. Discussion paper. Available at: https://www.oecd.org/dac/peer-reviews/results-strengthening-results-chain-discussion-paper.pdf
Perakis, R. & Savedoff, W. (2015). Does Results-Based Aid Change Anything? Pecuniary Interests, Attention, Accountability and Discretion in Four Case Studies. Available at: https://www.cgdev.org/publication/does-results-based-aid-change-anything-pecuniary-interests-attention-accountability-and
Perrin, B. (2013). ‘Evaluation of Payment by Results (PBR): Current Approaches, Future Needs’. Working Paper 39. DFID, London. Available at: https://www.gov.uk/government/uploads/system/uploads/attachment_data/file/213938/payment-results-current-approaches-future-needs.pdf
Pruss-Ustun el al (2014) Burden of disease through inadequate water sanitation and hygiene in low and middle income settings: a retrospective analysis of data from 145 countries. Tropical Medicine and International Health 19(8) 894-905
Quinn Patton, M. (2015). Qualitative research and evaluation methods: Integrating theory and practice. Sage, Fourth edition.
Rabie, T and Curtis, V. (2006): Handwashing and risk of respiratory infections: a quantitative systematic review. Tropical Medicine and International Health, 11(3), 258-267.
Renmans, D., Holvoet, N., Orach, C. G. and Criel, B. (2016) ‘Opening the “black box” of performance-based financing in low- and lower middle-income countries: a review of the literature’. Health Policy and Planning, 31(9), 1297–1309. doi: 10.1093/heapol/czw045
Rodriguez, Diego J., Suardi, M. A., Ham, M., Mimmi, L. M., Goksu, A. J. (2014). Applying results-based financing in water investments (English). Water papers; Water partnership program (WPP). Washington, DC : World Bank Group. http://documents.worldbank.org/curated/en/862681468326999086/Applying-results-based-financing-in-water-investments
Schmidt W-P (2014) The elusive effect of water and sanitation on the global burden of disease. Tropical Medicine and International Health, 19(5) pp 522–527. doi:10.1111/tmi.12286 .
Schweitzer R, Grayson C and Lockwood H (2014) Mapping of water, sanitation and hygiene sustainability tools. Working Paper 10, IRC / Aguaconsult / Triple-S. http://www.waterservicesthatlast.org/media/publications/mapping_of_wash_sustainability_tools
Sida (2015). ‘Results Based Financing Approaches (RBFA) – What are they? A methodological introduction’. URL: www.sida.se/English/publications/Publication_database/publications-by-year1/2015/november/results-based-financing-approaches-rbfa--what-are-they/
Evaluation of WASH Results Programme Endline Synthesis Report
e-Pact 103
Stern et al. (2012) Broadening the Range of Designs and Methods for Impact Evaluations. Working Paper 38. DFID. London, UK. www.gov.uk/government/uploads/system/uploads/attachment_data/file/67427/design-method-impact-eval.pdf
Soucat, A., Dale, E., Mathauer, I., Kutzin, J. (2017) ‘Pay-for-Performance Debate: Not Seeing the Forest for the Trees’. Health Systems & Reform 2017; 3:74–79
UNESCAP. (2013). Development Financing for Tangible results: A Paradigm Shift to Impact Investing and Outcome Models – the Case of Sanitation in Asia. Available at: https://www.unescap.org/sites/default/files/Development%20Financing%20for%20Tangible%20Results-A%20Paradigm%20Shift%20to%20Impact%20Investing%20and%20Outcome%20Models.pdf
USAID. (2018a). WAS-FIN Kenya project Brief – Access to commercial finance for WASH in Kenya: Looking back on SUWASA and to the future with WASH-FIN. Available at: https://files.globalwaters.org/water-links-files/WASH-FIN-Kenya-Project-Brief.pdf
USAID. (2018b). Scaling Market-Based Sanitation: Desk Review on Market-Based Rural Sanitation Development Programs. Available at: https://www.issuelab.org/resources/31021/31021.pdf?download=true
Wagner E G and Lanoix J N (1959) Water supply for rural areas and small communities. Monograph 42, World Health Organisation, Geneva.
Witter, S. et al. (2018) ‘(How) does RBF strengthen strategic purchasing of health care? Comparing the experience of Uganda, Zimbabwe and the Democratic Republic of the Congo’. Submitted for publication.
White, H. and Phillips D. (2012). ‘Addressing attribution of cause and effect in small impact evaluation: towards an integrated framework,’ 3ie Working Paper 15.
WHO (2016) Water, Sanitation and Hygiene for Acceleration and Sustaining Progress on Neglected Tropical Disease: a global Strategy WHO Geneva, 2016. Accessed from http://www.who.int/water_sanitation_health/publications/wash-and-ntd-strategy/en/
WSUP (2011) Evaluating health impact of urban WASH programmes: an affordable approach for enhancing effectiveness. WSUP / SHARE Discussion Paper 001, October 2011.
WYG International Limited (2017) ‘IPME Evaluation – Final Report’.
List of relevant blogs and newspaper articles identified
Edwards, S. (2018). New results-based financing tool targets clean water for schools. Available at: https://www.devex.com/news/new-results-based-financing-tool-targets-clean-water-for-schools-92521 Gustafsson-Wright, E. (2018). From Davos: Is paying for results with blended finance easy to take off? Available at: https://www.brookings.edu/blog/education-plus-development/2018/02/01/from-davos-is-paying-for-results-with-blended-finance-ready-to-take-off/ Robinson, Andy. (2018). WASH verification: in vino veritas, in aqua sanitas. Available at: http://www.snv.org/update/wash-verification-vino-veritas-aqua-sanitas Elynn Walter, Guy Howard, Jan Willem Rosenboom, Jeff Albert, Susan Davis, Yi Wei. (2017). Available at: http://washfunders.org/blog/the-power-of-incentives-lessons-learned-from-designing-and-implementing-results-based-wash-programs/ Jozwiak, G. (2017). Former DFID political adviser on UK aid direction and his new role at Plan. Available at: https://www.devex.com/news/former-dfid-political-adviser-on-uk-aid-direction-and-his-new-role-at-plan-90224
Evaluation of WASH Results Programme Endline Synthesis Report
e-Pact 104
The Economist. (2016). Pay Up: Payment by results is much criticised. But is it wrong to conclude it has failed. Available at: https://www.economist.com/britain/2016/06/02/pay-up Green, D. (2016). Payment by Results take 2: what I learned from the response to last month’s rant. Available at: https://oxfamblogs.org/fp2p/payment-by-results-take-2-what-i-learned-from-the-response-to-last-months-rant/ Green, D. (2016). Payment by Results hasn’t produced much in the way of results, but aid donors are doing it anyway. Why? Available at: https://oxfamblogs.org/fp2p/payment-by-results-hasnt-produced-much-in-the-way-of-results-but-aid-donors-are-doing-it-anyway-why/ Hourdin, M. (2016). Vers un financement commercial de l’aide international. Available at: https://blogs.mediapart.fr/manon-hourdin/blog/141016/vers-un-financement-commercial-de-l-aide-internationale Lancefield, D. & Gagliardi, C. (2016). What to know before you sign a payment-by-results contract. Available at: https://hbr.org/2016/09/what-to-know-before-you-sign-a-payment-by-results-contract Larsson, N. (2016). Does payment by results dehumanise aid work or encourage success? Oxfam, Swift Consortium and Opportunity International share their experiences of running PbR programmes. Available at: https://www.theguardian.com/global-development-professionals-network/2016/apr/25/payment-by-results-dehumanise-aid-work-encourage-success Lowe, T. & Evans, K. (2016). Paying for data production: The problem with payment by results. NCVO blogs. Available at: https://blogs.ncvo.org.uk/2016/06/14/paying-for-data-production-the-problem-with-payment-by-results/ Webster, R. (2016). The pros and cons of Payment by results. Available at: http://www.russellwebster.com/the-pros-and-cons-of-payment-by-results/ Gash, T. (2014). Payment by results fails to encourage smaller suppliers to bid for contracts – Government has tried to encourage bids by smaller companies, but a new report recognises three trends that threaten progress. Available at: https://www.theguardian.com/public-leaders-network/2014/jan/23/local-gov-lessons-central-gov-suppliers? Harvey, A. (2014). OPINION: Securing safe water and good hygiene practices through results-based aid in Uganda. CDKN blog. Available at: https://cdkn.org/2014/03/promising-preliminary-results-from-results-based-aid-in-securing-safe-water-in-uganda/?loclang=en_gb Bill & Melinda Gates Foundation. (n.d.). Bill Gates Visits Nigeria to Boost Global Fight Against Polio - Bill & Melinda Gates Foundation: Nigerian government to receive more than 100 million doses of oral polio vaccine (OPV) through innovative financing mechanism. Press Room. Available at: https://www.gatesfoundation.org/Media-Center/Press-Releases/2009/02/Bill-Gates-Visits-Nigeria-to-Boost-Global-Fight-Against-Polio Chambers, R. (n.d.). Perverse Payment by Results: frogs in a pot and straitjackets for obstacle courses. IDS Participation, Power and Social Change blog. Available at: https://participationpower.wordpress.com/2014/09/03/perverse-payment-by-results-frogs-in-a-pot-and-straitjackets-for-obstacle-courses/ Social Finance. (n.d.) Outcomes Funds. Available at: https://www.socialfinance.org.uk/sites/default/files/publications/sf_outcomes_fund_note_feb_2018.pdf
Evaluation of WASH Results Programme Endline Synthesis Report
e-Pact 105
WB. Program-for-Results Financing (PforR). Available at:
http://www.worldbank.org/en/programs/program-for-results-financing
CS WASH Fund Projects. (n.d). Water, Sanitation and Hygiene Outputbased Aid (WASHOBA) – Cambodia, Laos and Vitenam (Australian Aid). Available at: http://www.cswashfund.org/our-work/about/grantee-profiles/thrive-networks
Also see: Thrive’s CS WASH Fund project is helping the government to extend water supply networks to households in areas affected by salinity intrusion - Vietnam (Australian Aid). Available at: http://www.cswashfund.org/our-work/postcards-from-the-field/oba-action Also see other project documents and papers on Thrive Network website. Available at: http://thrivenetworks.org/output-based-aid-delivering-wash-services-vietnam-ensuring-sustainability-reaching-poor/ Also see: Nyugen, H. (2016). The effect of OBA subsidies combined with sanitation marketing (SanMark) on Latrine Uptake Mong Rural Populations in Cambodia. Available at: http://iwcan.org/effect-oba-subsidies-combined-sanitation-marketing-sanmark-latrine-uptake-among-rural-populations-cambodia/ Also see: Civil Society WASH Fund Management Facility/Aguaconsult. (2018). Effective Approaches and Innovations in the Civil Society WASH Fund: Research Report. Available at: https://www.aguaconsult.co.uk/wp-content/uploads/CSWASHFund_2018_Effectiveness-WASH-Approaches-Research-Report.pdf
Water Sector Trust Fund. (n.d.). Output-Based Aid programme brings affordable piped water to
Murang'a South. Available at: http://www.waterfund.go.ke/stories/oba-muranga-south
e-Pact Consortium. (2016). DFID WASH Results Programme: Learning Event. e-Pact Consortium. Available at: https://assets.publishing.service.gov.uk/media/57a86655ed915d0971000000/Report_from_DFID_WASH_Results_Programme_March_2016_Learning_Event__2_.pdf