monitoring vmware esx server on microsoft system center … esx on scom 2007 v2.2.pdf · monitoring...
TRANSCRIPT

Monitoring VMWare ESX Server On Microsoft System Center
Operations Manager 2007
Version 2.2 Date: 10th September 2007
Writer: Jonathan Hambrook
Email: [email protected] Blog: http://opsmgr.wordpress.com

Monitoring VMWare ESX on SCOM 2007 v2.2
Page 2 of 59
Table of Contents Table of Contents ................................................................................................................. 2 1 Document Overview Information................................................................................. 3
1.1 About this Document................................................................................................................. 3 1.2 Decision Matrix ......................................................................................................................... 3 1.3 Why monitor the VMWare ESX layer?.......................................................................................... 3 1.4 Systems Understandings............................................................................................................ 3 1.5 Limitations................................................................................................................................ 3 1.6 References ............................................................................................................................... 4
1.6.1 SNMP Tools ...............................................................................................................................................4 1.6.2 MIB Sites...................................................................................................................................................4 1.6.3 IBM References .........................................................................................................................................4 1.6.4 MOM 2005 References ...............................................................................................................................4 1.6.5 Microsoft SCOM 2007 Training Videos .........................................................................................................4
1.7 Terminology ............................................................................................................................. 5 2 Configuring the ESX Server .......................................................................................... 6
2.1 Configuring SysLog ................................................................................................................... 6 2.2 Testing SysLog Configuration ..................................................................................................... 6 2.3 Configure SNMP Trap to be sent to RMS...................................................................................... 7
3 Discovering ESX Servers in SCOM ................................................................................ 8 3.1 Create a Management Pack for ESX .......................................................................................... 10 3.2 Create Group for ESX Servers................................................................................................... 11
4 SCOM SysLog Configuration ....................................................................................... 14 4.1 Create VMWare ESX SysLog Alert Rule for Hardware Monitoring.................................................. 14
4.1.1 Example kern.crit .....................................................................................................................................14 4.1.2 Example daemon.err (Test with Dell Temperature Probe Trigger & Alert) ....................................................16
4.2 Create VMWare ESX Alerts (Alert View) ..................................................................................... 19 5 SCOM SNMP Configurations ....................................................................................... 20
5.1 Create ‘Trap Rule’ to capture Events from the hardware layer ..................................................... 20 5.2 Create a ‘Trap Monitor’ for Alerting ........................................................................................... 27 5.3 Disable the Trap Rule .............................................................................................................. 34
6 Configure usability ..................................................................................................... 35 6.1 Create Views .......................................................................................................................... 35
6.1.1 VMWare ESX Servers (State View) ............................................................................................................35 6.1.2 VMWare ESX Environment (Diagram View) ................................................................................................36
6.2 Create Tasks........................................................................................................................... 40 6.2.1 Create task to run ‘PuTTY’ ........................................................................................................................40 6.2.2 Create task to run ‘Virtual Center 1.31’......................................................................................................42 6.2.3 Create task to run ‘Virtual Center 2.02’......................................................................................................43 6.2.4 Create task to run ‘WinSCP 4.03’...............................................................................................................44
6.3 Create Alerting........................................................................................................................ 46 6.3.1 Create User Role – “VMWare ESX Operators”.............................................................................................46 6.3.2 Create a Recipient....................................................................................................................................48 6.3.3 Create a Subscription ...............................................................................................................................49
7 What the operators will see in SCOM......................................................................... 53 7.1 Example of the VMWare Management Pack Views...................................................................... 53 7.2 Example of the ‘VMWare ESX Environment’ View ....................................................................... 53 7.3 Example of the ‘VMWare ESX Alerts’ View with Alert................................................................... 53 7.4 Example of the ‘VMWare ESX Servers’ View ............................................................................... 54 7.5 Example of the Health Explorer View for an ESX Server .............................................................. 54 7.6 Example of the SNMP Tasks when you have selected an ESX Server ............................................ 54
8 Creating Virtual Center Alerts in the Event Log ......................................................... 55 9 Appendix A – SysLog Facility & Severity Reference................................................... 56 10 Appendix B – Common Enterprise MIB Numbers ................................................... 57 11 Appendix C – Expression Examples for Guidance .................................................. 58
11.1 Example 1 .............................................................................................................................. 58 11.2 Example 2 .............................................................................................................................. 58 11.3 Example 3 .............................................................................................................................. 59

Monitoring VMWare ESX on SCOM 2007 v2.2
Page 3 of 59
1 Document Overview Information
1.1 About this Document This document contains step-by-step instructions on how to monitor VMWare ESX Servers on SCOM 2007. While I admit there are many possible ways to do this, I believe this document will
demonstrate 2 of the most effective ways, allowing for greater granularity and accuracy in Alerting.
The 2 ways to monitor the VMWare ESX and the Hardware are via SNMP Traps & SysLog. The first
section of this document refers to SysLog and the second to SNMP Traps.
Feedback is always welcome. Please email me at [email protected] or visit my blog at http://opsmgr.wordpress.com
1.2 Decision Matrix Alert Type SNMP SysLog
Server Alerts YES YES
Good for Alerting to Flight Desk from SCOM
YES – Will change Health State
in SCOM
YES – Will change Health State
in SCOM
Support Notification YES – Email, IM or SMS YES – Email, IM or SMS
Install Software in SC YES – Agent to send SNMP NO
Ease of Setup Medium Very
Support Management Board YES NO
1.3 Why monitor the VMWare ESX layer? Monitoring the ESX layer is an important part of maintaining a VMWare environment as part of the security features are that the Operating systems that you load on the system can not interface
directly with the hardware so should you have a failure of one of your systems it doesn’t effect the others. This means that just running the SCOM Agent on the clients will not report if a HDD, Power
Supply or Disk has failed even with the Hardware vendors management pack.
1.4 Systems Understandings As you may or may not know, VMWare uses its own Linux Operating System referred to as ‘ESX’. This
means using the SCOM Agent is not possible as it is only compatible with Microsoft Windows Operating Systems.
There are 2 other ways of setting up monitoring of devices in SCOM, one is via the SCOM Agent and the other is via SNMP.
1.5 Limitations These instructions are limited to VMWare ESX. You will also require hardware from a vendor that supports a Linux agent for their hardware. I know the following do:
• IBM
• HP
• DELL
You will find that as we are collecting from a SysLog and even though we configure which servers we
are gathering from, you will be unable to get the Status to change from Green to Red should a
SysLog Alert be generated for a particular device. This is a limitation to SCOM and how it handles SysLog Alerts. The reason for this is because the method the ESX server is added and its alive status
is monitored via SNMP. To get the status to change you will need to create an SNMP Trap Monitor.

Monitoring VMWare ESX on SCOM 2007 v2.2
Page 4 of 59
1.6 References
1.6.1 SNMP Tools GetIf
http://www.wtcs.org/snmp4tpc/getif.htm
1.6.2 MIB Sites MIBSearch - http://www.mibsearch.com/
OIDView - http://www.oidview.com/mibs/detail.html IP Monitor SNMP Center - http://support.ipmonitor.com/snmp_center.aspx
IP Monitor MIB OID Tree - http://support.ipmonitor.com/mibs_byoidtree.aspx
Simple Web - http://www.simpleweb.org/ietf/mibs/
1.6.3 IBM References Download Agent Software
https://www14.software.ibm.com/webapp/iwm/web/reg/download.do?source=dmp&
S_PKG=director_x_520&lang=en_US&cp=UTF-8#x12
Which Agent to use http://www-
941.haw.ibm.com/collaboration/ibmwiki/pages/viewpage.action?pageId=8911 Configuration of SNMP for IBM Director Agents
http://publib.boulder.ibm.com/infocenter/eserver/v1r2/topic/diricinfo/fqm0_t_enablin
g_snmp_access_and_trap_forwarding_vmware.html Implementing IBM Director 5.20
http://www.redbooks.ibm.com/abstracts/sg246188.html IBM Management Documentation
http://publib.boulder.ibm.com/infocenter/eserver/v1r2/index.jsp
1.6.4 MOM 2005 References MOM 2005 Trap Information
http://www.momresources.org/momarticles/MOMTelecomSNMP.pdf
1.6.5 Microsoft SCOM 2007 Training Videos http://www.microsoft.com/winme/0701/28666/About_Monitors.asx http://www.microsoft.com/winme/0701/28666/Management_Packs_Demo.asx
http://www.microsoft.com/winme/0703/28666/Add_Monitoring_Edited.asx http://www.microsoft.com/winme/0703/28666/Adjusting_Monitors_with_Overrides_Edit.asx
http://www.microsoft.com/winme/0701/28666/Tasks_Demo.asx
http://www.microsoft.com/winme/0701/28666/Views_Demo.asx http://www.microsoft.com/winme/0701/28666/Rules_Demo.asx
http://www.microsoft.com/winme/0703/28666/Whats_New_for_Ops_Mgr_05_Edited.asx http://www.microsoft.com/winme/0701/28666/The_Monitoring_Space.asx
http://www.microsoft.com/winme/0703/28666/Adjusting_Monitors_with_Overrides_Edit.asx http://www.microsoft.com/winme/0610/28666/DistributedApplicationDesigner_RTM_300k.asx

Monitoring VMWare ESX on SCOM 2007 v2.2
Page 5 of 59
1.7 Terminology Blog – Is short for Weblog, An online journal on a specific topic or range of topics.
OID – Object Identifier, A permanent number assigned to an object for storage (persistence). It is typically a long integer, such as 128 bits, that can be
computed using various methods to create a unique number. It functions in a
similar manner to the way a key field does in a relational database record uniquely identifies that record in a table.
MIB – Management Information Base, An SNMP structure that describes the
particular device being monitored
RMS – Root Management Server
SCOM – System Center Operations Manager 2007
SNMP – Simple Network Message Protocol
SNMP Trap – A notification event issued by a managed device to the network management station when a significant event (not necessarily an outage, a fault, or a security violation) occurs.
SysLog – A System Log using the defacto standard common on Linux and Network Devices. Uses UDP port 514.
VMWare – The company that produces VMWare ESX Server
VMWare ESX Server – An application that allows a single piece of hardware to run multiple Operating Systems of many flavours
Monitoring VMWare ESX on SCOM 2007 v2.2
Page 6 of 59
2 Configuring the ESX Server
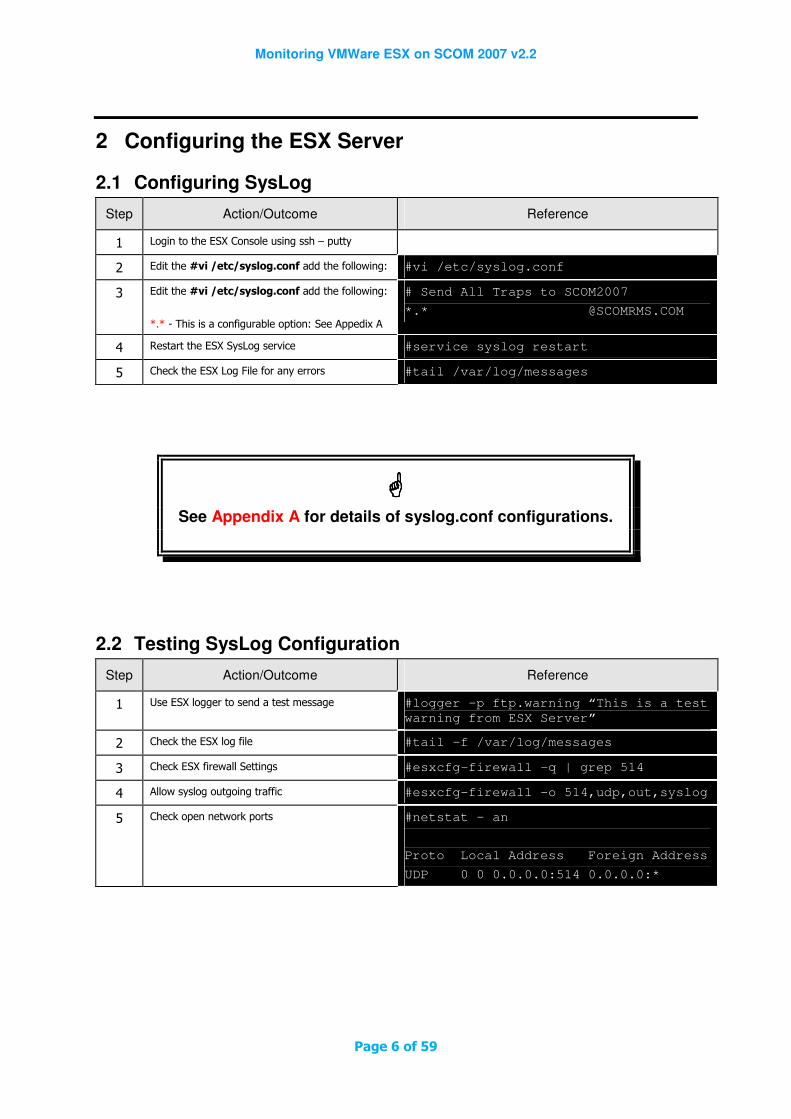
2.1 Configuring SysLog
Step Action/Outcome Reference
1 Login to the ESX Console using ssh – putty
2 Edit the #vi /etc/syslog.conf add the following: #vi /etc/syslog.conf
3 Edit the #vi /etc/syslog.conf add the following:
*.* - This is a configurable option: See Appedix A
# Send All Traps to SCOM2007
*.* @SCOMRMS.COM
4 Restart the ESX SysLog service #service syslog restart
5 Check the ESX Log File for any errors #tail /var/log/messages
���� See Appendix A for details of syslog.conf configurations.
2.2 Testing SysLog Configuration
Step Action/Outcome Reference
1 Use ESX logger to send a test message #logger –p ftp.warning “This is a test
warning from ESX Server”
2 Check the ESX log file #tail –f /var/log/messages
3 Check ESX firewall Settings #esxcfg-firewall –q | grep 514
4 Allow syslog outgoing traffic #esxcfg-firewall –o 514,udp,out,syslog
5 Check open network ports #netstat – an
Proto Local Address Foreign Address
UDP 0 0 0.0.0.0:514 0.0.0.0:*

Monitoring VMWare ESX on SCOM 2007 v2.2
Page 7 of 59
2.3 Configure SNMP Trap to be sent to RMS.
Step Action/Outcome Reference
1 Edit the snmpd.conf file #vi /etc/snmp/snmpd.conf
2 This is where we will configure it to point to the Root Management Server as well as the community string to use.
Enter the following:
trapsink 10.0.0.0
Note: You can’t have duplicate entries in this file. It is suggested you configure the other parameters, sysname, syscontact, syslocation.
3 Restart the snmpd service #service snmpd restart
4 Enable snmpd to pass-through the ESX firewall #esxcfg-firewall –e snmpd
5 Verify SNMP is functioning #snmpwalk -v 1 -c public localhost
system

Monitoring VMWare ESX on SCOM 2007 v2.2
Page 8 of 59
3 Discovering ESX Servers in SCOM
Step Action/Outcome Reference
1 Open the System Center Operations Manager Console
2 Click on the Administration tab
3 Right-click Administration
Select Discovery Wizard
4 Under Advanced discovery
Select Network Devices
Click

Monitoring VMWare ESX on SCOM 2007 v2.2
Page 9 of 59
Step Action/Outcome Reference
5 Fill the IP Address Start: and End: fields for your ESX Server.
Click
6 Please wait…
7 When the device is found
- Tick
Click

Monitoring VMWare ESX on SCOM 2007 v2.2
Page 10 of 59
Step Action/Outcome Reference
8 Click
3.1 Create a Management Pack for ESX
Step Action/Outcome Reference
1 Open the System Center Operations Manager Console
2 Click on the Administration tab
3 Right-click Administration
Select Create Management Pack

Monitoring VMWare ESX on SCOM 2007 v2.2
Page 11 of 59
Step Action/Outcome Reference
4 Fill in the following fields:
Name: VMWare ESX
Click
5 Click
3.2 Create Group for ESX Servers
Step Action/Outcome Reference
1 Open the System Center Operations Manager Console
2 Click on the Authoring tab
3 Right-click Groups
Select Create a new Group…

Monitoring VMWare ESX on SCOM 2007 v2.2
Page 12 of 59
Step Action/Outcome Reference
4 Fill in the following fields:
Name: VMWare ESX Servers
Under Management Pack
Select VMWare ESX
Click
5 Click and add your VMWare ESX Server. This will be represented by its IP Address.
Click
Note: If you are able to create a ‘Dynamic Members’ rule then skip this step.
6 Click
Note: If you are able to create a ‘Dynamic Members’ rule create it here. ie: if all your ESX Servers are in a group of IP’s.

Monitoring VMWare ESX on SCOM 2007 v2.2
Page 13 of 59
Step Action/Outcome Reference
7 Click
8 Click

Monitoring VMWare ESX on SCOM 2007 v2.2
Page 14 of 59
4 SCOM SysLog Configuration
4.1 Create VMWare ESX SysLog Alert Rule for Hardware Monitoring
4.1.1 Example kern.crit
Step Action/Outcome Reference
1 Open the System Center Operations Manager Console
2 Click on the Authoring tab
3 Right-click Rules
Select Create a new rule…
4 Under Alert Generating Rule\Event Based
Select Syslog (Alert)
Under Management Pack
Select VMWare ESX
Click
Note: Do not select Syslog under collection rules as you will not get any alerts generated.

Monitoring VMWare ESX on SCOM 2007 v2.2
Page 15 of 59
Step Action/Outcome Reference
5 Fill in the following fields:
Rule Name: VMWare ESX SysLog 2.2
Description: 2.2 = kern.crit used for Hardware Alerts
Under Rule target:
Select VMWare ESX Servers
Click
6
Click
Parameter Operator Value
Severity Equals 2
Facility Equals 2
Click
Note: This filter looks for the Severity and Facility parameter to equal 2 which is kern.crit where most of your hardware alerts should show up.
7 Fill in the following fields:
Alert Description
Alert Message: $Data/EventData/DataItem/Message$ Hostname: $Data/EventData/DataItem/HostName$ Priority Name: $Data/EventData/DataItem/PriorityName$ Severity: $Data/EventData/DataItem/Severity$
Click

Monitoring VMWare ESX on SCOM 2007 v2.2
Page 16 of 59
4.1.2 Example daemon.err (Test with Dell Temperature Probe Trigger & Alert)
Step Action/Outcome Reference
1 Open the System Center Operations Manager Console
2 Click on the Authoring tab
3 Right-click Rules
Select Create a new rule…
4 Under Alert Generating Rule\Event Based
Select Syslog (Alert)
Under Management Pack
Select VMWare ESX
Click
Note: Do not select Syslog under ‘Collection Rules’ as you will not get any alerts generated.
5 Fill in the following fields:
Rule Name: VMWare ESX SysLog 4.3
Description: 4.3 = daemon.err used Dell Openview Alerts
Under Rule target:
Select VMWare ESX Servers
Click

Monitoring VMWare ESX on SCOM 2007 v2.2
Page 17 of 59
Step Action/Outcome Reference
6
Click
Parameter Operator Value
Severity Equals 4
Facility Equals 3
Click
Note: This filter looks for the Severity and Facility parameter to equal 2 which is daemon.err where most of your hardware alerts should show up.
7 Fill in the following fields:
Alert Description
Alert Message: $Data/EventData/DataItem/Message$ Hostname: $Data/EventData/DataItem/HostName$ Priority Name: $Data/EventData/DataItem/PriorityName$ Severity: $Data/EventData/DataItem/Severity$
Click
8 Open Dell OpenManage website
Go to Temperature and change the Maximum Warning Threshold to a value less that the Reading.
Maximum Warning Threshold: 25.0
Click Apply Changes
9 Open the System Center Operations Manager Console

Monitoring VMWare ESX on SCOM 2007 v2.2
Page 18 of 59
Step Action/Outcome Reference
10 Click on the Monitoring tab
11 Select Active Alerts
You should see an alert in the Active Alerts View
12 Double-click the active VMWare ESX 4.3 Alert
!! Note the Alert Description
13 Select the Alert Context tab
!! Note the Event Data

Monitoring VMWare ESX on SCOM 2007 v2.2
Page 19 of 59
4.2 Create VMWare ESX Alerts (Alert View)
Step Action/Outcome Reference
1 Open the System Center Operations Manager Console
2 Click on the Monitoring tab
3 In the Navigation Pane
Right-click VMWare ESX
Select New
Select Alert View
4 Fill in the following Fields:
Name: VMWare ESX Alerts
Show data contained in a specific group: VMWare ESX Servers
Tick of a specific severity
Click specific
Tick Warning
Tick Critical
Click
Tick with specific resolution state
Click specific
Tick New (0)
Click
Click

Monitoring VMWare ESX on SCOM 2007 v2.2
Page 20 of 59
5 SCOM SNMP Configurations This section will be written differently as this is where I will endeavour to, as the saying goes, “Teach you to fish instead of giving you the fish”. I am writing this section this way because depending on
your Hardware Vendor etc you will be using different data and the screens could look different to the
examples I will use. However, I hope to demonstrate the techniques required to create a monitor.
To understand this process you will need to understand a little about SNMP and OID’s. First we will be setting up a capture for all Traps from a specific device and MIB OID. Second, we will use the data
gained to create a Monitor for a specific requirement.
5.1 Create ‘Trap Rule’ to capture Events from the hardware layer We need to create a Trap Rule to find out the OID of the Hardware layer being used. In this example
I am using Dell Hardware.
You can also find out MIB OID info from the following sites: (More can be found in Chapter 1.6.2)
http://www.oidview.com/mibs/detail.html http://support.ipmonitor.com/mibs_byoidtree.aspx
Step Action/Outcome Reference
1 Open the System Center Operations Manager Console
2 Click on the Authoring tab
3 Right-click Rules
Select Create a new rule…
4 Under Alert Generating Rule\Event Based
Select Snmp Trap (Alert)
Under Management Pack
Select VMWare ESX
Click
Note: Do not select Syslog under collection rules as you will not get any alerts generated.

Monitoring VMWare ESX on SCOM 2007 v2.2
Page 21 of 59
Step Action/Outcome Reference
5 Fill in the following fields:
Rule Name: VMWare ESX SNMP Rule Monitor - Hardware Layer
Under Monitor target:
Select SNMP Network Device
Click
Note: You must select SNMP Network Device for this type of rule to work.
6 Select Use custom community string
Type public (or what ever you have setup in your ESX snmpd.conf file)
Tick All Traps
Click
7 Click

Monitoring VMWare ESX on SCOM 2007 v2.2
Page 22 of 59
• To test we will now generate two Hardware alerts. To demonstrate I will change the Temperature
setting of the CPU through Dell OpenManage. Secondly, I will remove a physical Hard Disk.
• First we will change the Threshold Settings of a CPU to be beneath the current temperature
reading. This will now generate an SNMP Trap that SCOM will receive.
• If you open the Operations Manager Console and look in Active Alerts and you will see the
VMWare ESX SNMP Rule Monitor – Hardware Layer alert.

Monitoring VMWare ESX on SCOM 2007 v2.2
Page 23 of 59
• Double click on the alert and click on the Alert Context tab, and you will see the OID for the Dell
Server. The first parameter of the SNMP trap is the OID, 1.3.6.1.4.1.674.10892.1 this represents the Hardware Layer. The 764 of the number indicated that OID is from a DELL MIB. See
Appendix B for more.
Monitoring VMWare ESX on SCOM 2007 v2.2
Page 24 of 59
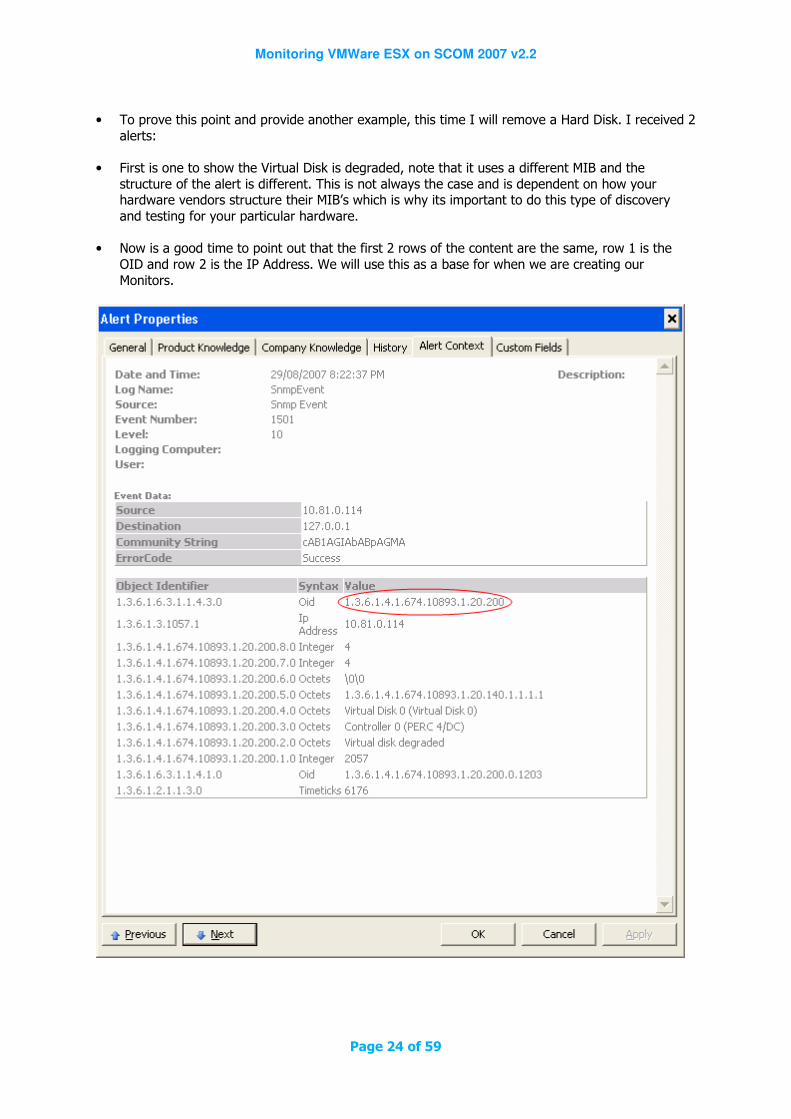
• To prove this point and provide another example, this time I will remove a Hard Disk. I received 2
alerts:
• First is one to show the Virtual Disk is degraded, note that it uses a different MIB and the
structure of the alert is different. This is not always the case and is dependent on how your hardware vendors structure their MIB’s which is why its important to do this type of discovery
and testing for your particular hardware.
• Now is a good time to point out that the first 2 rows of the content are the same, row 1 is the
OID and row 2 is the IP Address. We will use this as a base for when we are creating our
Monitors.

Monitoring VMWare ESX on SCOM 2007 v2.2
Page 25 of 59
• Second, you will see that the Rebuild has started, again note the OID.
���� See Appendix B for a list of Common Enterprise OID’s.

Monitoring VMWare ESX on SCOM 2007 v2.2
Page 26 of 59
• You can now find out exactly what these OID’s are by using sites listed in Chapter 1.6.2.
• Here are the details of the 2 OID’s I have received from 2 different sites.
OID produced by Temperature.
OID produced by Hard Disk failure
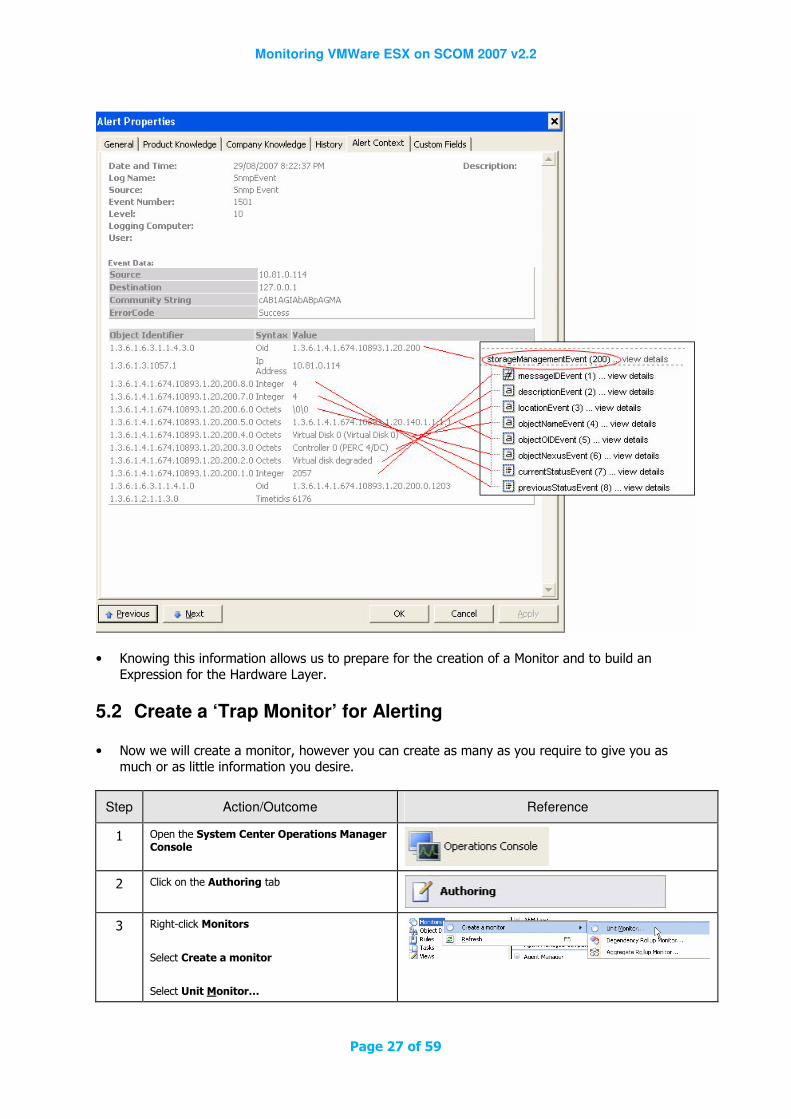
• If we take this information and overlay it with our alert you can see from the below images how
the OID data relates to the Alert generated in SCOM.
Monitoring VMWare ESX on SCOM 2007 v2.2
Page 27 of 59
• Knowing this information allows us to prepare for the creation of a Monitor and to build an
Expression for the Hardware Layer.
5.2 Create a ‘Trap Monitor’ for Alerting
• Now we will create a monitor, however you can create as many as you require to give you as
much or as little information you desire.
Step Action/Outcome Reference
1 Open the System Center Operations Manager Console
2 Click on the Authoring tab
3 Right-click Monitors
Select Create a monitor
Select Unit Monitor…

Monitoring VMWare ESX on SCOM 2007 v2.2
Page 28 of 59
Step Action/Outcome Reference
4 Expand SNMP + Trap Based Detection + Simple Trap Detection
Select Event Monitor – Single Event and Single Event
Under Management Pack
Select VMWare ESX
Click
5 Fill in the following fields:
Name: VMWare ESX SNMP Alert Monitor - Hardware Layer OID 1.3.6.1.4.1.674.10893.1.20.200
Monitor target:
Select SNMP Network Device
Parent Monitor:
Select Availability
Click
Note: You must select SNMP Network Device for this type of monitor to work.
6 Select Use custom community string
Type public (or what ever you have configured in your ESX snmpd.conf file)
Under Object Identifier Properties
Type 1.3.6.1.4.1.674.10893.1.20.200
Click
Note: This is the OID we just generated and collected after removing a Hard Disk.
Monitoring VMWare ESX on SCOM 2007 v2.2
Page 29 of 59
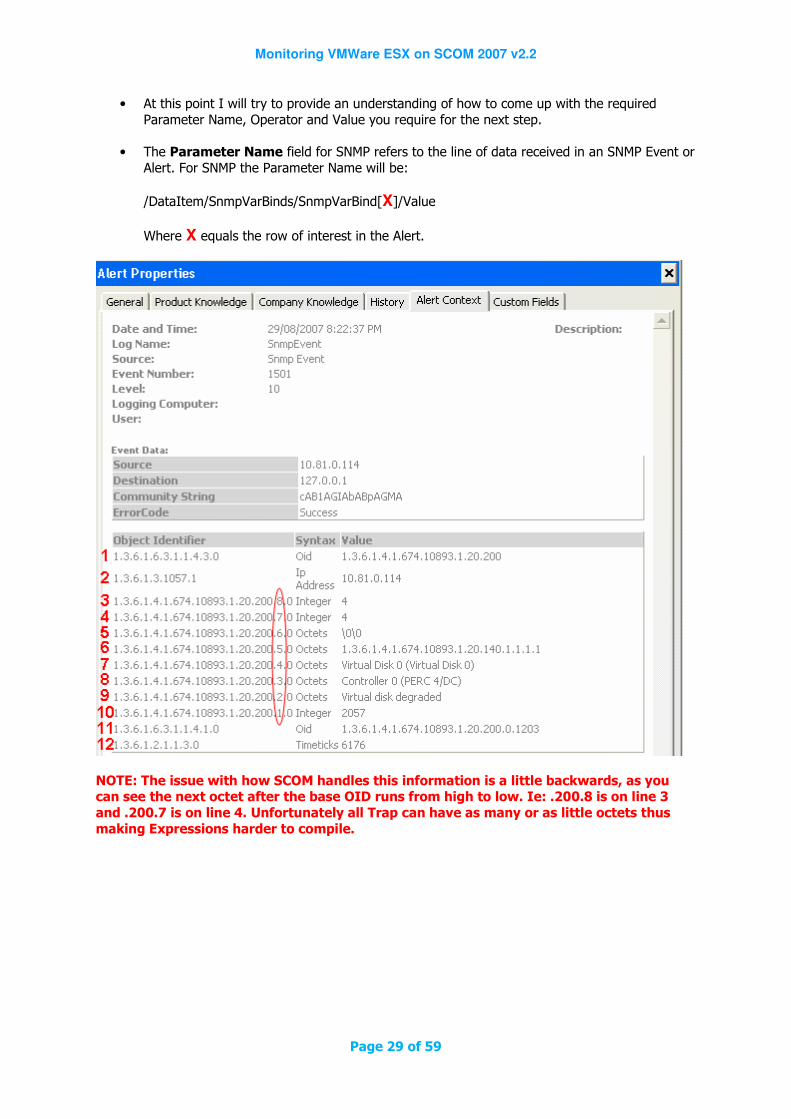
• At this point I will try to provide an understanding of how to come up with the required
Parameter Name, Operator and Value you require for the next step.
• The Parameter Name field for SNMP refers to the line of data received in an SNMP Event or
Alert. For SNMP the Parameter Name will be:
/DataItem/SnmpVarBinds/SnmpVarBind[X]/Value
Where X equals the row of interest in the Alert.
NOTE: The issue with how SCOM handles this information is a little backwards, as you can see the next octet after the base OID runs from high to low. Ie: .200.8 is on line 3 and .200.7 is on line 4. Unfortunately all Trap can have as many or as little octets thus making Expressions harder to compile.

Monitoring VMWare ESX on SCOM 2007 v2.2
Page 30 of 59
• From one of the many website that have a list of all the MIB I found what the data for the
currentStatusEvent field was.
7 To continue we will need to create an Expression.
���� See
Appendix C
for more Expression examples.
Click
8 Select Use custom community string
Type public (or what ever you have setup in your ESX snmpd.conf file)
Under Object Identifier Properties
Type 1.3.6.1.4.1.674.10893.1.20.200
Click
Note: This is the OID we just generated and collected from the ‘Hardware Rule’.

Monitoring VMWare ESX on SCOM 2007 v2.2
Page 31 of 59
9 To continue we will need to create an Expression.
���� See
Appendix C
for more Expression examples.
Click
10 This is where we will now specify that if the 1st Expression conditions are met to set the alert to Critical and if the 2nd Expression conditions are met to set the alert back to Healthy.
Change First Event Raised Health State
to Critical
Click
11 Tick Generate Alerts for this monitor
Click
• For steps 7 & 9 you will need to create your own Expression and from the information provided I
hope I have shown the method finding out how to figure this out.

Monitoring VMWare ESX on SCOM 2007 v2.2
Page 32 of 59
���� See Appendix C for more Expression examples.

Monitoring VMWare ESX on SCOM 2007 v2.2
Page 33 of 59
• You can now test this Alert by doing the same test as in Chapter 5.1.
• Here I will generate a Hardware alert again, I have created a couple of monitors for each of the
OID’s I expect to receive. To prove this monitor is working I will change the Temperature setting
of the CPU through Dell OpenManage.
• I would suggest that you clear out the old alerts from the Active Alerts view for easy identification
and testing.
• Change the Threshold Settings of a CPU to be beneath the current temperature reading. This will
now generate an SNMP Trap that SCOM will receive.
• Open the Operations Manager Console and look in Active Alerts and you will the VMWare ESX SNMP Alert Monitor – Hardware Layer alert.
• Since we now have a monitor functioning you can now select the Network Device State and
see that the state of that device has changed from Healthy to Critical.

Monitoring VMWare ESX on SCOM 2007 v2.2
Page 34 of 59
5.3 Disable the Trap Rule To reduce the number of alerts when a Hardware Trap is sent we can now either delete or disable the Hardware Rule alert. Search the rule for ESX, highlight VMWare ESX SNMP Rule Monitor – Hardware Layer and select either Disable or Delete.

Monitoring VMWare ESX on SCOM 2007 v2.2
Page 35 of 59
6 Configure usability Having completed the Alerting setup now we need to create some views that will make Administration easy.
6.1 Create Views I believe most environments would benefit from 3 main Views.
1. VMWare ESX Alerts – Used by System Administrators of your ESX Environment
2. VMWare ESX Servers – This will allow you to view the Status of all your ESX Servers.
3. VMWare ESX Environment – A diagrammatic view of your ESX servers.
Earlier we already created the VMWare ESX Alerts view.
6.1.1 VMWare ESX Servers (State View) I find the following settings work well:
Under the VMWare ESX folder in Monitoring, Create a State View with the following settings:
Your Display will look like this:

Monitoring VMWare ESX on SCOM 2007 v2.2
Page 36 of 59
6.1.2 VMWare ESX Environment (Diagram View) If you would like to view or break down your environment into a nice single icon or group of icons to
show the health of your environment then this chapter should help with that.
Step Action/Outcome Reference
1 Open the System Center Operations Manager Console
2 Click on the Authoring tab
3 Right-click Monitors
Select Create a monitor
Select Dependency Rollup Monitor
4 Fill in the following fields:
Name: VMWare ESX Dependency Monitor
Under Monitor target:
Select VMWare ESX Servers
Under Parent Monitor:
Select Availability
Under Management Pack:
Select VMWare ESX
Click
Note: You must select SNMP Network Device for this type of monitor to work.
5 Expand Entity (Membership) + Entity Health
Select Availability
Click

Monitoring VMWare ESX on SCOM 2007 v2.2
Page 37 of 59
Step Action/Outcome Reference
6 Select the appropriate setting for your situation.
Click
7 Click

Monitoring VMWare ESX on SCOM 2007 v2.2
Page 38 of 59
Under the VMWare ESX folder in Monitoring, Create a Diagram View with the following
settings:

Monitoring VMWare ESX on SCOM 2007 v2.2
Page 39 of 59

Monitoring VMWare ESX on SCOM 2007 v2.2
Page 40 of 59
Your Display will look like this:
6.2 Create Tasks
6.2.1 Create task to run ‘PuTTY’
Step Action/Outcome Reference
1 Download and copy a copy of the PuTTY application to a directory of your choice.
For these instructions I have copied a copy to C:\Tools on the machine that runs the Operations Console
2 Open the System Center Operations Manager Console
3 Click on the Authoring tab

Monitoring VMWare ESX on SCOM 2007 v2.2
Page 41 of 59
Step Action/Outcome Reference
4 Under Console Tasks
Select Command Line
Click
5 Fill in the following fields:
Task name: PuTTY
Under Monitor target:
Select SNMP Network Device
Click
6 Fill in the following fields:
Application: putty.exe
Parameters: $Target/Property[Type="System!System.Entity"]/DisplayName$
Tick Display output when task is run
Click
Note: If you just put the name of the .exe file in the Application field the .exe file must reside in directory specified in the the OS’s ‘PATH’ statement. You can also put the full path in this field.

Monitoring VMWare ESX on SCOM 2007 v2.2
Page 42 of 59
6.2.2 Create task to run ‘Virtual Center 1.31’
Step Action/Outcome Reference
1 Install Virtual Center on the machines that will be used to monitor your Virtual Center environment.
2 Open the System Center Operations Manager Console
3 Click on the Authoring tab
4 Under Console Tasks
Select Command Line
Click
5 Fill in the following fields:
Task name: Virtual Center 1.31
Under Monitor target:
Select SNMP Network Device
Click

Monitoring VMWare ESX on SCOM 2007 v2.2
Page 43 of 59
Step Action/Outcome Reference
6 Fill in the following fields:
Application: C:\Program Files\VMware\VMware VirtualCenter\vpxClient.exe
Click
6.2.3 Create task to run ‘Virtual Center 2.02’
Step Action/Outcome Reference
1 Download and copy a copy of the PuTTY application to a directory of your choice.
For these instructions I have copied a copy to C:\Tools on the machine that runs the Operations Console
2 Open the System Center Operations Manager Console
3 Click on the Authoring tab
4 Under Console Tasks
Select Command Line
Click

Monitoring VMWare ESX on SCOM 2007 v2.2
Page 44 of 59
Step Action/Outcome Reference
5 Fill in the following fields:
Task name: VMware Virtual Infrastructure Client 2.02
Under Monitor target:
Select SNMP Network Device
Click
6 Fill in the following fields:
Application: C:\Program Files\VMware\VMware Virtual Infrastructure Client 2.0\vpxClient.exe
Click
6.2.4 Create task to run ‘WinSCP 4.03’
Step Action/Outcome Reference
1 Download and copy WinSCP to a directory of your choice.
For these instructions I have copied a copy to C:\Program Files\WinSCP on the machine that runs the Operations Console
2 Open the System Center Operations Manager Console
3 Click on the Authoring tab

Monitoring VMWare ESX on SCOM 2007 v2.2
Page 45 of 59
Step Action/Outcome Reference
4 Under Console Tasks
Select Command Line
Click
5 Fill in the following fields:
Task name: WinSCP 4.03
Under Monitor target:
Select SNMP Network Device
Click
6 Fill in the following fields:
Application: C:\Program Files\WinSCP\winscp403.exe
Parameters: $Target/Property[Type="System!System.Entity"]/DisplayName$
Click

Monitoring VMWare ESX on SCOM 2007 v2.2
Page 46 of 59
6.3 Create Alerting
6.3.1 Create User Role – “VMWare ESX Operators”
Step Action/Outcome Reference
1 Open the System Center Operations Manager Console
2 Click on the Administration tab
3 Right-click Administration
Select New User Role
Select Operator…
4 Fill in the following fields:
User role name: VMWare ESX Operators
Click and select all users required from your Active Directory
Click
5 De-Select the first tick box (Management Group)
Select only: VMWare ESX Servers
Click

Monitoring VMWare ESX on SCOM 2007 v2.2
Page 47 of 59
Step Action/Outcome Reference
6 You have the option to allow any users to only have access to PuTTY or any other application individually. If you leave the default they will have access to all Task that are in the Management Pack. If you completed the previous chapter this will include PuTTY.
Click
7 De-Select all
Tick VMWare ESX
Click
8 Click

Monitoring VMWare ESX on SCOM 2007 v2.2
Page 48 of 59
6.3.2 Create a Recipient If you haven’t already got a Recipient setup, the you will need to create one.
Step Action/Outcome Reference
1 Open the System Center Operations Manager Console
2 Click on the Administration tab
3 Right-click Administration
Select New Notification Recipient
4 In the General Tab
Select the username of the recipient
And the notification times

Monitoring VMWare ESX on SCOM 2007 v2.2
Page 49 of 59
Step Action/Outcome Reference
5 In the Notification Devices Tab
Click and fill in the appropriate settings.
Click
6.3.3 Create a Subscription
Step Action/Outcome Reference
1 Open the System Center Operations Manager Console
2 Click on the Administration tab
3 Right-click Administration
Select New Notification Subscription

Monitoring VMWare ESX on SCOM 2007 v2.2
Page 50 of 59
Step Action/Outcome Reference
4 Fill in the following fields:
Subscription name: VMWare ESX Alerting Subscription
Click and select the appropriate user/s.
Click
5 If you are working in a locked down environment then I would suggest you
Tick VMWare ESX Operators
Click
6 Tick VMWare ESX Servers
Click

Monitoring VMWare ESX on SCOM 2007 v2.2
Page 51 of 59
Step Action/Outcome Reference
7 Depending on your environment you may like to select additional classes.
Click
8 This step is specific to your requirements, if unsure leave the default and you can come back and fine tune later.
Click
9 If you want to be alerted repeatedly as the alert gets older the you can change this setting.
Click

Monitoring VMWare ESX on SCOM 2007 v2.2
Page 52 of 59
Step Action/Outcome Reference
10 Depending on how you would like your alerts (email, IM or SMS) to appear, you can change them here.
Click
Monitoring VMWare ESX on SCOM 2007 v2.2
Page 53 of 59
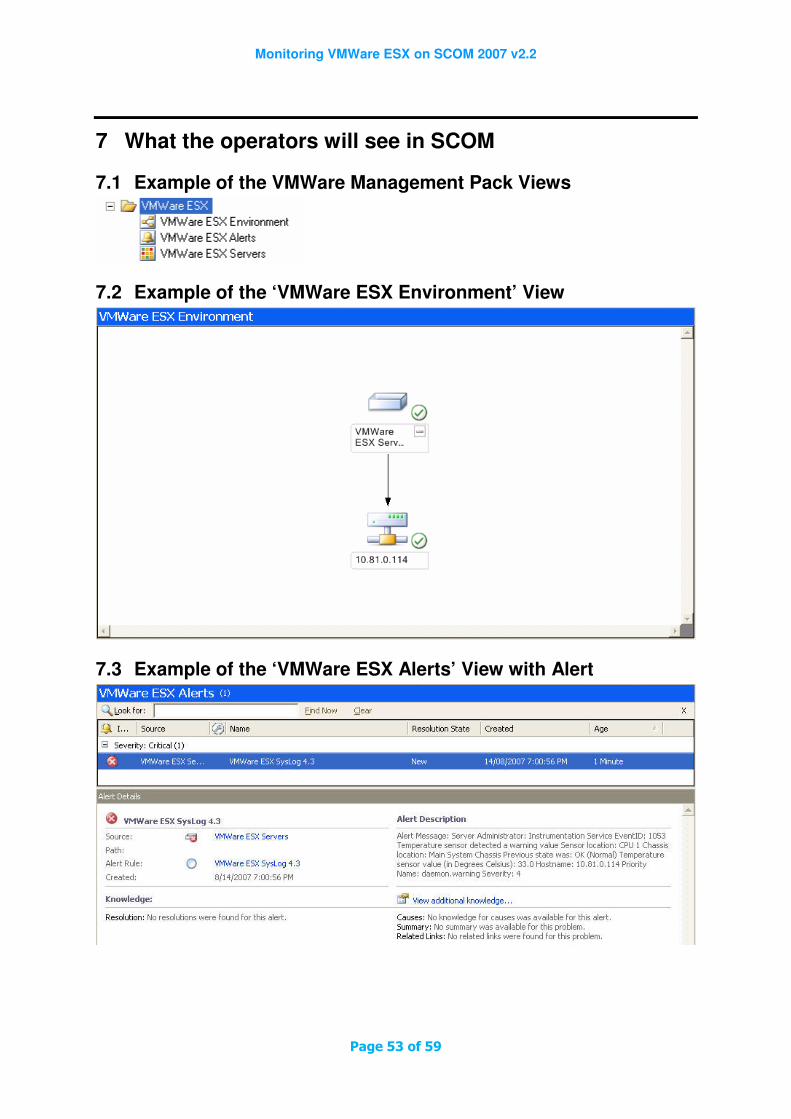
7 What the operators will see in SCOM
7.1 Example of the VMWare Management Pack Views
7.2 Example of the ‘VMWare ESX Environment’ View
7.3 Example of the ‘VMWare ESX Alerts’ View with Alert

Monitoring VMWare ESX on SCOM 2007 v2.2
Page 54 of 59
7.4 Example of the ‘VMWare ESX Servers’ View
7.5 Example of the Health Explorer View for an ESX Server
7.6 Example of the SNMP Tasks when you have selected an ESX Server

Monitoring VMWare ESX on SCOM 2007 v2.2
Page 55 of 59
8 Creating Virtual Center Alerts in the Event Log This chapter is a supplement and while I will not go in to much detail I will highlight the steps that
you can use to add Virtual Center Alerts in to the Event Log.
1. Create a vbs script and save it as VCtoEventviewer.vbs
' Takes alerts from VirtualCenter and puts them in the EventLog
Const LogName = "Application"
EventID = WScript.Arguments.Item(0)
Source = WScript.Arguments.Item(1)
Description = WScript.Arguments.Item(2)
Set WshShell=WScript.CreateObject("WScript.Shell")
strCommand="eventcreate /T Warning /ID "& EventID & " /L "&LogName&" /SO "& _
Chr(34) & Source& Chr(34)& " /D " & Chr(34) & Description & Chr(34)
WshShell.Run strCommand
All this script does is take 3 parameters, and creates a Warning event to the Application Event Log,
the parameters are:
1. Event id, number between 1 and 1000. 2. Event Title
3. Event Description
2. Copy the script to a folder on your Virtual Center Server. (C:\scripts\VCtoEventviewer.vbs)
3. You can pass parameters to the script from VirtualCenter, In this example I have chosen
{alarmName} {newStatus} and {eventDescription} as the most appropriate
4. There are other parameters that can be passed to the script, but the above seems to work well. Other parameters:
{eventDescription}
{targetName} {alarmName}
{triggeringSummary} {declaringSummary}
{oldStatus} {newStatus}
{target}
To configure: In VirtualCenter select an Alert, i.e. ESX Host Connection Status; Select Actions, and
add an action of Run Script, and enter the following script command to run:
cscript c:\scripts\VCtoEventviewer.vbs 700 "{alarmName} {newStatus}" "{eventDescription}"
This will then call the vbs script and log events in the event log, it seems to work for all alerts. The only thing I suggest changing is the event ID for each alert.
5. Now you can create a Rule or Monitor in SCOM and capture the Eventlog of the Virtual Center Server and alert as appropriate.

Monitoring VMWare ESX on SCOM 2007 v2.2
Page 56 of 59
9 Appendix A – SysLog Facility & Severity Reference *.* referrers to Facility.Severity
If you specify 2.4 then you will be forwarding all alerts from kern with a warning or lower alert eg: Warning, err, crit, alert and emerg. * represents ALL. Facility reference:
Facility SCOM Representation
Description
user 1 Generated by user processes. This is the default facility; messages
not fitting any of the other listed categories here are classified as facility user.
kern 2 Generated by the system kernel
mail 3 Generated by the email system
daemon 4 Generated by system daemons, such as ftpd.
auth 5 Generated by authorisation programs login, su, getty.
lpr 6 Generated by the printing system
news 7 Generated by Usenet News system
uccp 8 Generated by UUCP system
cron 9 Generated by cron and at
local0-7 Generated by up to eight locally defined categories numbered 0 through 7
mark Generated by syslog itself for time stamping logs
Severity reference:
Severity SCOM Representation
Description
emerg 0 The most severe messages that prevent continuation of operation, such as immediate system shutdown.
alert 1 System conditions require immediate attention (for example corrupt
system database, insufficient disk space, run out of file descriptors, etc)
crit 2 Most serious system/application malfunctioning, such as failing
hardware (hard device errors) or software. Usually non-recoverable.
err 3 Mostly correctable errors, for example errors other than hard device
errors. Continuation of the operation is possible. Usually all err
conditions are automatically recoverable.
warning 4 Warning messages
notice 5 Notices requiring attention at a later time. Non-error conditions that
might require special handling. Difference between warning is not clear.
info 6 Informational Messages
debug 7 Messages for debugging purposes
none 8 Messages are not sent from the indicated facility to the selected file.

Monitoring VMWare ESX on SCOM 2007 v2.2
Page 57 of 59
10 Appendix B – Common Enterprise MIB Numbers
Company Enterprise MIB String Enterprise ID IBM 1.3.6.1.4.1. 2
Hewlett Packard 1.3.6.1.4.1. 11 DELL 1.3.6.1.4.1. 674
Linux 1.3.6.1.4.1. 2021 VMWare 1.3.6.1.4.1. 6876
Net-SNMP 1.3.6.1.4.1. 8072

Monitoring VMWare ESX on SCOM 2007 v2.2
Page 58 of 59
11 Appendix C – Expression Examples for Guidance
11.1 Example 1 This example refers to the exact error in the form of the OID. Note the first line ensures that you have a base OID so that the rule doesn’t apply across the board to all SNMP Traps.
1st Expression
Parameter Name Operator Value
/DataItem/SnmpVarBinds/SnmpVarBind[1]/Value Equals 1.3.6.1.4.1.674.10893.1.20.200
/DataItem/SnmpVarBinds/SnmpVarBind[6]/Value Equals 1.3.6.1.4.1.674.10893.1.20.200.140.1.1.1.1
2nd Expression
Parameter Name Operator Value
/DataItem/SnmpVarBinds/SnmpVarBind[1]/Value Equals 1.3.6.1.4.1.674.10893.1.20.200
/DataItem/SnmpVarBinds/SnmpVarBind[6]/Value Equals 1.3.6.1.4.1.674.10893.1.20.200.130.4.1.1.2
11.2 Example 2 This example shows that you can look for specific wording in an error, again you will need to use a
base OID to keep the Monitor specific.
1st Expression
Parameter Name Operator Value
/DataItem/SnmpVarBinds/SnmpVarBind[1]/Value Equals 1.3.6.1.4.1.674.10893.1.20.200
/DataItem/SnmpVarBinds/SnmpVarBind[9]/Value Contains disk degraded
2nd Expression
Parameter Name Operator Value
/DataItem/SnmpVarBinds/SnmpVarBind[1]/Value Equals 1.3.6.1.4.1.674.10893.1.20.200
/DataItem/SnmpVarBinds/SnmpVarBind[9]/Value Contains disk Rebuild complete

Monitoring VMWare ESX on SCOM 2007 v2.2
Page 59 of 59
11.3 Example 3 This example shows how we can use a field dedicated to a current status to base the alert on. From
one of the many websites that have a list of all the MIB I found what the data for the
‘currentStatusEvent’ field was.
1st Expression
Parameter Name Operator Value
/DataItem/SnmpVarBinds/SnmpVarBind[1]/Value Equals 1.3.6.1.4.1.674.10893.1.20.200
/DataItem/SnmpVarBinds/SnmpVarBind[4]/Value Greater than or equals to 5
2nd Expression
Parameter Name Operator Value
/DataItem/SnmpVarBinds/SnmpVarBind[1]/Value Equals 1.3.6.1.4.1.674.10893.1.20.200
/DataItem/SnmpVarBinds/SnmpVarBind[4]/Value Less than or equal to 4