monobutyrin reduces liver cholesterol and improves
TRANSCRIPT
nutrients
Article
Monobutyrin Reduces Liver Cholesterol andImproves Intestinal Barrier Function in RatsFed High-Fat Diets
Thao Duy Nguyen * , Olena Prykhodko , Frida F. Hållenius and Margareta Nyman
Department of Food Technology, Engineering and Nutrition, Kemicentrum, Lund University, PO Box 124,SE-221 00 Lund, Sweden; [email protected] (O.P.); [email protected] (F.F.H.);[email protected] (M.N.)* Correspondence: [email protected]; Tel.: +46-46-222-8321
Received: 7 December 2018; Accepted: 23 January 2019; Published: 1 February 2019�����������������
Abstract: Butyric acid has been shown to reduce high-fat diet-related metabolic disturbances andto improve intestinal barrier function due to its potent anti-inflammatory capacity. This studyinvestigates whether a butyric acid ester, monobutyrin (MB) affects lipid profiles and gut barrierfunction in a dose-response manner in rats fed butter- or lard-based high-fat diets. Four-week-oldmale Wistar rats were fed butter-based diets containing 0, 0.25, 0.75 and 1.5 MB g/100 g (dry weightbasis) or 0.5 glycerol g/100 g, and diets with lard (La) containing 0 and 0.5 MB g/100 g or a low-fatcontrol diet for 3–4 weeks. Lipid profiles in blood and liver tissue, intestinal permeability and cecalshort-chain fatty acids were examined. The results showed a dose-dependent decrease in liver totalcholesterol for 1.5 MB (p < 0.05) and liver triglycerides for 0.75 MB (p < 0.05) and 1.5 MB (p = 0.08)groups compared to the high-fat control group. Furthermore, a lower excretion of mannitol in urinein the 1.5 MB group indicated improved intestinal barrier function. When MB was supplemented inthe lard-based diet, serum total cholesterol levels decreased, and total amount of liver high-densitylipoprotein-cholesterol increased. Thus, MB dietary supplementation can be effective in counteractinglipid metabolism disturbances and impaired gut barrier function induced by high-fat diets.
Keywords: butyrate; lipid metabolism; cecal SCFA; butter; lard; Wistar rat; lactulose/mannitol test;intestinal permeability
1. Introduction
Consuming a diet, high in fat and low in fiber will result in metabolic disorders implicated in awide variety of diseases associated to the heart and liver, but such a diet composition may also induceinflammation in the colon [1–3]. At molecular level, high-fat diets provoke imbalanced homeostasis,stimulating chronic pro-inflammatory stages, primarily initiated in the gut and eventually affectingperipheral organs, even the brain, as shown in animal models [4,5]. In contrast, several studiesperformed in humans and rats have demonstrated that dietary fiber may counteract the harmful effectscaused by high-fat diets [6–8]. This is often explained by the short-chain fatty acids (SCFA), especiallybutyric- and propionic acids, formed by the colon microbiota.
SCFA, the end products derived from bacterial fermentation of dietary fibers, are suggested toplay a protective role against high-fat driven disturbances. Indeed, studies in mice have reportedthat SCFA may strengthen the defense of the gut wall by increasing expression of tight junctionproteins [9,10], leading to reduced pro-inflammatory responses caused by translocation of bacterialcomponents such as lipopolysaccharides (LPS) to the circulation [1,4]. Intestinal barrier dysfunctioncan be detected by measuring levels of tight junction proteins in the gut tissues, LPS in blood or
Nutrients 2019, 11, 308; doi:10.3390/nu11020308 www.mdpi.com/journal/nutrients
Nutrients 2019, 11, 308 2 of 17
non-metabolizable sugars such as lactulose and mannitol in urine. The latter provides a simple andnon-invasive test predicting intestinal permeability [11]. Notably, an increased lactulose/mannitol ratioin urine has been found before establishment of type 1 diabetes [12]. Increased intestinal permeabilityis also linked to increased serum concentrations of zonulin, a modulatory protein of intercellular tightjunctions/intestinal permeability [12] that is related to obesity, inflammatory bowel diseases, andcancers [13].
Besides increasing the nutritional status of the gut, SCFA exert effective roles in lipid metabolism.In fact, addition of SCFA into rat diets leads to a reduction in blood cholesterol concentrations bysuppressing hepatic cholesterol synthesis and expression of genes involved in lipid metabolism [14,15].Particularly, butyrate has been shown to decrease circulating lipids in human intestinal cells byinhibiting production of intestinal lipid transfer proteins [16]. However, our recently published studiesdemonstrated that it is also possible to improve lipid profiles and attenuate inflammatory markersin rats by supplementing high-fat diets with monobutyrin (MB), a glycerol ester of butyric acid [17].Furthermore, when supplementing feed given to chickens having problems with too high intake offiber, a combination of monobutyrin and tributyrin were shown to decrease serum cholesterol [18,19].Humans are recommended to increase the intake of dietary fiber, especially those that are giving highamounts of butyric acid during colonic fermentation, but it may for some reason be of interest toincrease the amount without adding fiber to the diet.
We have previously shown that adding 0.5 MB g/100 g (dry weight basis) to a high-fat dietcontaining butter results in lowered liver cholesterol levels in association with changes in expressionof bile acid related genes and gut microbiota in rats [17]. Based on these results, we hypothesizedthat increasing levels of MB could have more pronounced effects on lipid profiles and gut barrierfunction. The aim of this study was (i) to evaluate whether MB could retain similar effects on liverlipid profiles in a dose-dependent range and (ii) whether it is linked with changes in gut permeabilityand concentrations of SCFA in the hindgut of rats. In some early papers (1959 and 1976, respectively),relatively high amounts of monobutyrin and tributyrin, as measured by gas-chromatography, weredetermined in butter (0.189 mM in 100 g of extracted fat from butter and 3–4 g/100 g butter,respectively) [20,21], which may interfere with results of the added MB. Thus, lard as anotheranimal-derived source of saturated fat was used in a separate experiment. In that study, we decided(iii) to investigate whether MB also could change lipids in circulating blood, and whether there wereany changes and after how long time.
2. Materials and Methods
2.1. Animals and Diets
This study was approved by the Local Ethical Review Committee for animal research in Lund,Sweden (approval number M 114–15).
Male Wistar rats, weighing 115 g (SEM 1) and being 4-week-old (Taconic, Denmark), consumedhigh-fat diets containing butter (180 g/kg dry weight, corresponding to 44 Energy %) as describedin Supplementary Table S1. Rats were randomly divided into five groups (n = 7/group) and given ahigh-fat-butter control diet (0 MB), or diets supplemented with three doses (0.25, 0.75, and 1.5 g/100 gon a dry weight basis) of MB (Perstorp AB, Sweden), giving the following description of the groups:0, 0.25, 0.75, and 1.5 MB. Since glycerol has been reported to stimulate cholesterol synthesis in ratsand consists 39% of the MB, a group supplemented with 0.5 glycerol g/100 g (VWR, USA) was alsoincluded, abbreviated as 0.5 G. The doses of MB chosen were based on the reduced levels of livertotal and LDL-cholesterol seen in a previous study [17] and below reported non-toxic levels (27 g ofMB/kg body weight/day) in rats [22]. The rats had free access to the assigned diets and water for 3weeks. However, the feed intake was recorded by weighing feed residues and the amount distributed.Five days before the end of the study, the lactulose/mannitol test was carried out for 24 h. At theend of the study, hepatic portal vein blood, liver and cecum including its content were collected for
Nutrients 2019, 11, 308 3 of 17
measurements of lipids (portal vein blood and liver) and SCFA (cecum). Cecum was weighed withand without its content and frozen.
During the dose-response study it was figured out that butter may contain butyric acid in the formof monobutyrin and tributyrin [20,21]. We therefore performed another set of experiment, where thefat source was lard (Dragsbaek, Denmark). This study was designed in the same way as the first one,i.e., the same initial weight of the rats and composition of the high-fat diets and the rats had free accessto the diets and water. Rats were randomly divided into 3 groups (n = 7/group) fed the followingdiets: low-fat (LF), high-fat-lard (La) control, and high-fat-lard supplemented with 0.5 MB g/100 g(La + 0.5 MB). At the end of the study, liver and blood (from the hepatic portal vein and aorta) werecollected for lipid analyses. Changes in blood lipid levels were also evaluated weekly in the tail veinto figure out if it was possible to measure changes in blood lipids during an on-going experiment. Dueto the assumed difficulties to detect differences in lipid content of the circulated lipids in the tail, theexperiment was prolonged for another week, to four weeks, before finishing.
Body weight and food intake were tracked weekly in both experiments.
2.2. Lipid Analysis in Serum and the Liver
Total cholesterol (esterified and free), triglycerides (TG), low-density lipoprotein- (LDL-)cholesterol, and high-density lipoprotein- (HDL-) cholesterol in portal vein and aortic serum andliver tissues were determined using enzymatic colorimetric kits purchased from Thermo Scientific(Middletown, USA). The blood and liver tissues were collected from anesthetized animals in thefollowing order. First, the abdomen was opened and blood (approximately 2 mL) was collectedfrom the hepatic portal vein into a sterile syringe and transferred into serum collection tubes (BectonDickinson BD Vacutainer® SST™, Franklin Lakes, NJ, USA) containing sprayed-coated silica. Next, thethorax was opened and blood from the aorta (approximately 2 mL) was collected into another syringeand immediately transferred into the BD tubes. The blood samples were standing for 30 min at roomtemperature, before centrifuged at 2000 g for serum collection. At last, when a cut-off of the heart wasperformed and the animal was considered being euthanized, the liver was dissected out, weighed, andsaved at −40 ◦C for freeze-drying procedure [23].
Serum samples were assayed directly, while lipids in the freeze-dried livers were extracted inhexane and iso-propanol (ratio 3:2) with 0.005% (v/w) 2,6-di-tert-butyl-4-metylphenol, as previouslydescribed [17]. The supernatants from the extraction were collected after centrifugation and driedunder nitrogen flow at room temperature. The dried extracted lipids were re-dissolved in isopropanolcontaining 1% Triton X100 (v/v) and were then used for lipid determination.
2.3. Short-Chain Fatty Acids in Cecal Content
SCFA in cecal contents were analyzed by a gas-chromatographic method developed at our labby following Zhao et al. [24]. Briefly, cecal contents were extracted in acidified water without usingany organic solvents, and centrifuged. The supernatants were injected into a gas chromatographicsystem (Agilent 6890N GC) equipped with a flame ionization detector (FID) for determination ofSCFA. A fused-silica capillary column with a free fatty acid phase and rather water-resistant was used(DB-FFAP 125-3237, J&W Scientific, Agilent Technologies Inc., Santa Clara, CA, USA). The temperatureof the injection port and the FID was 200 and 240 ◦C, respectively. The initial oven temperature was100 ◦C and it was kept there for 0.5 min, increased to 180 ◦C at 8 ◦C/min and maintained there for1.0 min, before being raised to 200 ◦C (20 ◦C/min), and kept there for 5 min. The flow rates of thecarrier gas (helium), make-up gas (nitrogen), hydrogen and air were 14.4, 20, 30, and 300 mL/min,respectively. For each sample, the injected volume was 1 µL and the running time was 17.5 min. Themethodology has been shown to be reproducible and give good precision.
Nutrients 2019, 11, 308 4 of 17
2.4. Lactulose/Mannitol Test in Urine
The permeability test was carried out at 9 am, as described by Meddings and Gibbons [11].A 2-mL fresh solution containing 0.04 g/mL mannitol and 0.06 g/mL lactulose was given to each ratby oral gavage. Rats were placed individually in metabolic cages. After 2 h fasting, they were allowedfree access to water. Urine was collected over 24 h into tubes attached to the cage bottom. Thymol(10% dissolved in isopropanol) was added to the collecting tubes to prevent degradation of urinarysugars due to bacterial growth. Concentrations of the sugars were measured using the EnzyChromTMIntestinal Permeability Assay Kit (EIPM-100) purchased from BioAssay System (Hayward, CA, USA).
2.5. Calculations and Statistical Analyses
Since the liver weights of the rats differed considerably, the pool size (total amount) of lipids maybe more correct to compare. This was obtained by multiplying the analyzed concentration of lipidswith the liver weight.
All statistical analyses were evaluated in GraphPad Prism software (version 7; San Diego, CA,USA). Differences in means between the high-fat control groups and the test groups were identifiedby one-way ANOVA and significances were then evaluated by the post-hoc Dunnett’s test. Whencomparing differences between only two groups (e.g., group 0 vs. group 0.5 G), an unpaired, 2-tailedt-test was used. Data are presented as means and their standard errors. Spearman’s test was used to findcorrelation between non-parametric variables. Projections to Latent Structures Discriminant Analysis(PLS-DA, SIMCA software version 15, Umetrics, Umeå, Sweden) were used to display relationshipsbetween the measured variables and the different diets. p < 0.05 was considered significant, while ap value < 0.1 was evaluated as tendency. p values ≤ 0.2 were reported for some variables of interest.
3. Results
3.1. Dose-Response Effects of Monobutyrin in Butter-Based Diets
3.1.1. Lipids in the Liver and Portal Vein Serum
Liver
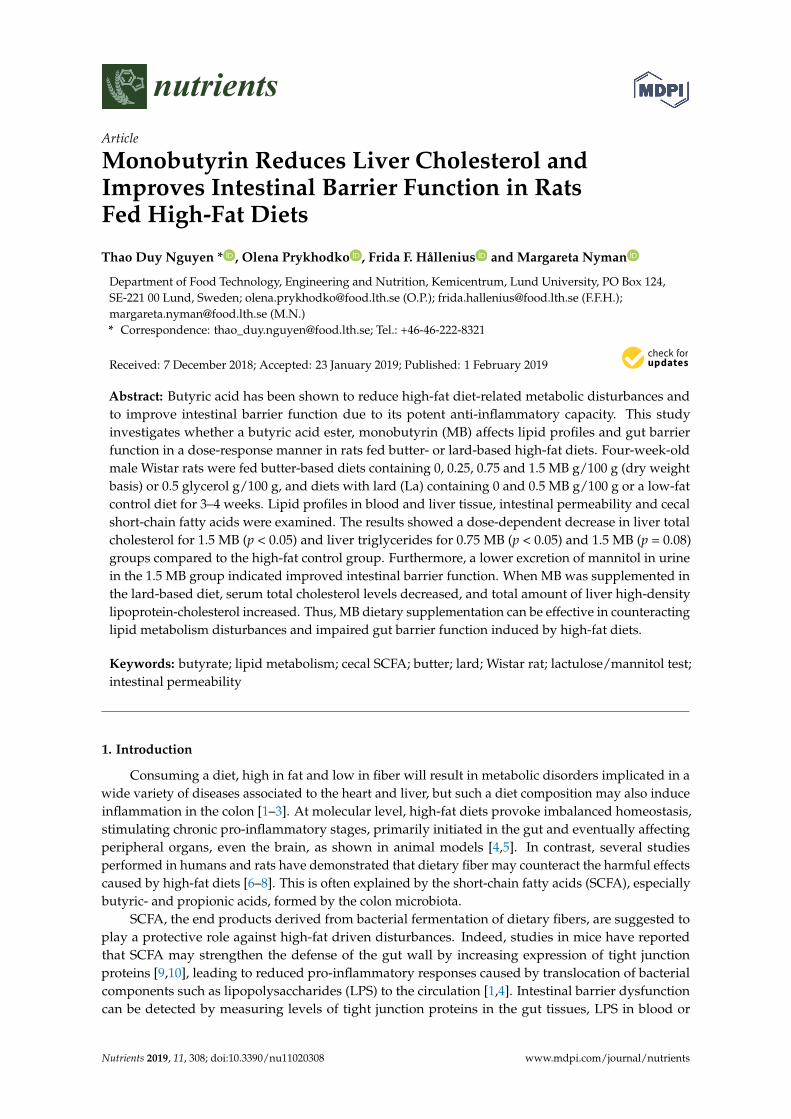
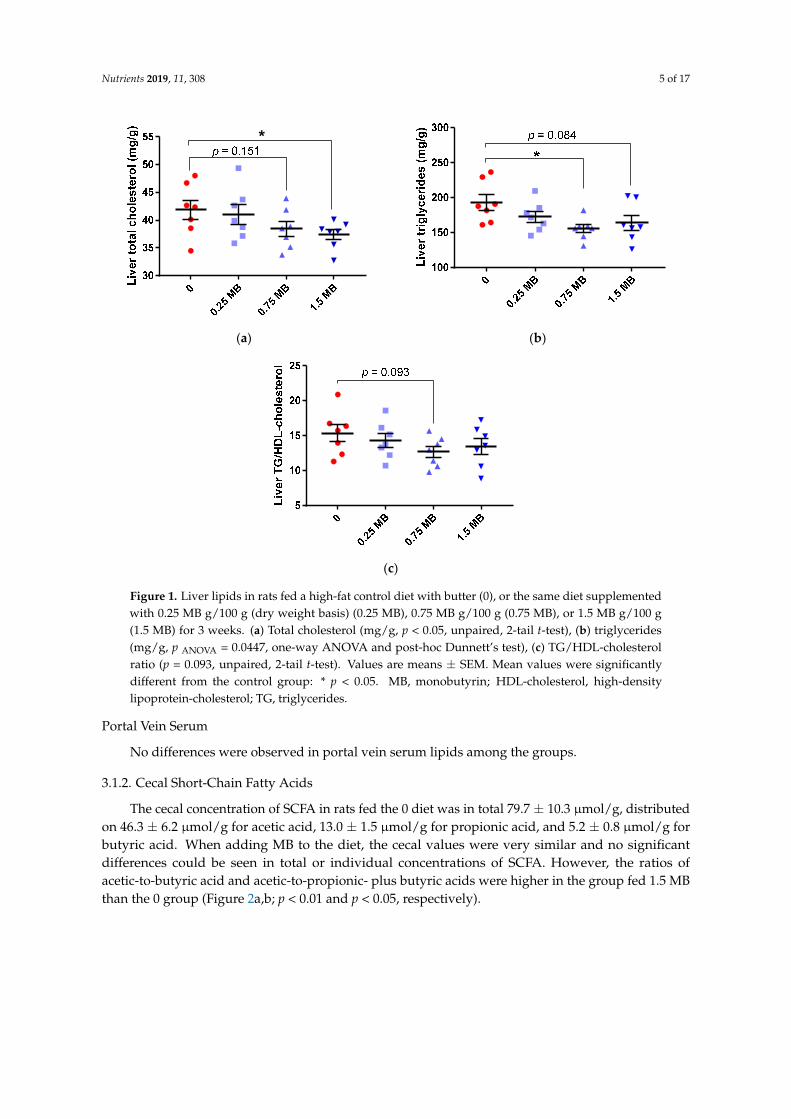
When increasing amounts of MB were added to a high-fat diet, there was a gradual decline in theliver concentrations of total cholesterol and triglycerides. These values reached significance for thehighest amount of MB concerning cholesterol (1.5 MB group compared with the 0 group containingno MB, p = 0.047) and for 0.75 MB concerning triglycerides (0.75 MB group compared with the 0group, p = 0.02) (Figure 1a,b, respectively). Although insignificant, the other values on total cholesterol(0.75 MB) and triglycerides (1.5 MB) were lower (p = 0.151 and p = 0.084, respectively). LDL- andHDL-cholesterol concentrations were not affected by MB and were similar between groups, but theratio of TG-to-HDL-cholesterol, a strong factor associated with insulin resistance and cardiometabolicdiseases [25], tended to be lower in rats fed the diet containing 0.75 MB than in rats consuming the 0diet (Figure 1c, p = 0.093).
Glycerol 0.5 g/100 g (0.5 G) had no significant effect on liver lipids compared with the 0 group(Figure S1).
Nutrients 2019, 11, 308 5 of 17Nutrients 2019, 11, x FOR PEER REVIEW 5 of 18
*
(a) (b)
(c)
Figure 1. Liver lipids in rats fed a high-fat control diet with butter (0), or the same diet supplemented with 0.25 MB g/100 g (dry weight basis) (0.25 MB), 0.75 MB g/100 g (0.75 MB), or 1.5 MB g/100 g (1.5 MB) for 3 weeks. (a) Total cholesterol (mg/g, p < 0.05, unpaired, 2-tail t-test), (b) triglycerides (mg/g, p ANOVA = 0.0447, one-way ANOVA and post-hoc Dunnett’s test), (c) TG/HDL-cholesterol ratio (p = 0.093, unpaired, 2-tail t-test). Values are means ± SEM. Mean values were significantly different from the control group: * p < 0.05. MB, monobutyrin; HDL-cholesterol, high-density lipoprotein-cholesterol; TG, triglycerides.
Portal Vein Serum
No differences were observed in portal vein serum lipids among the groups.
3.1.2. Cecal Short-Chain Fatty Acids
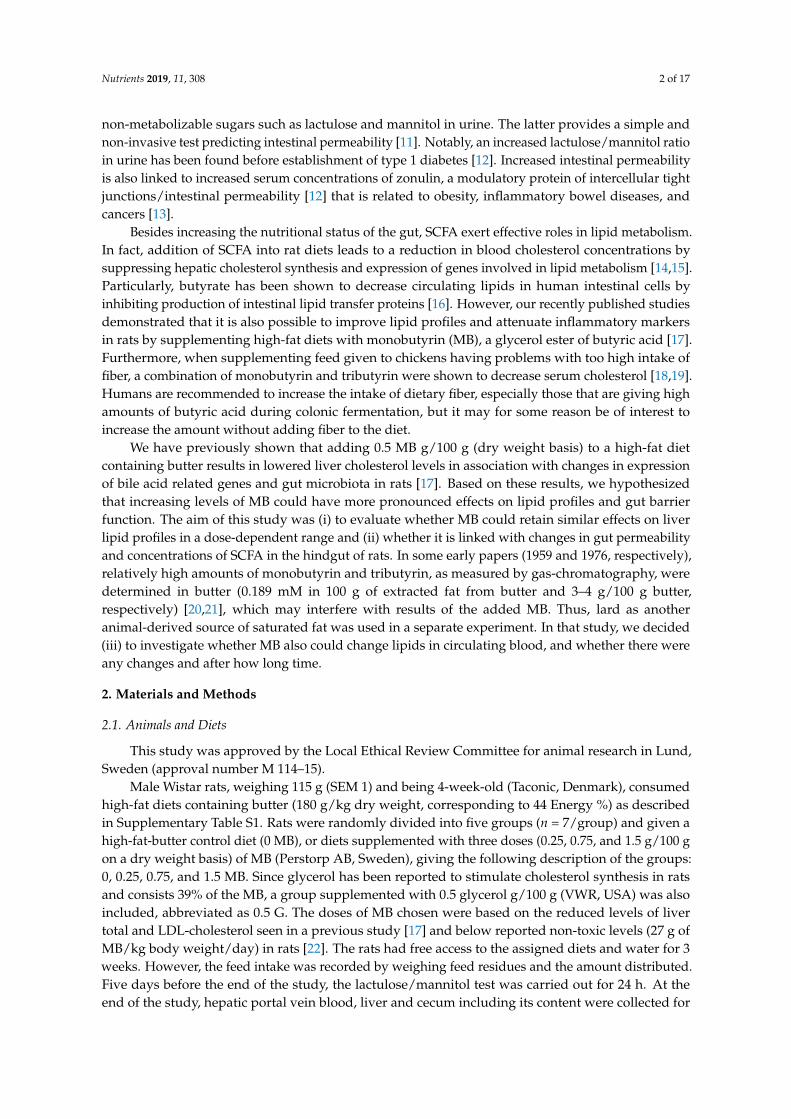
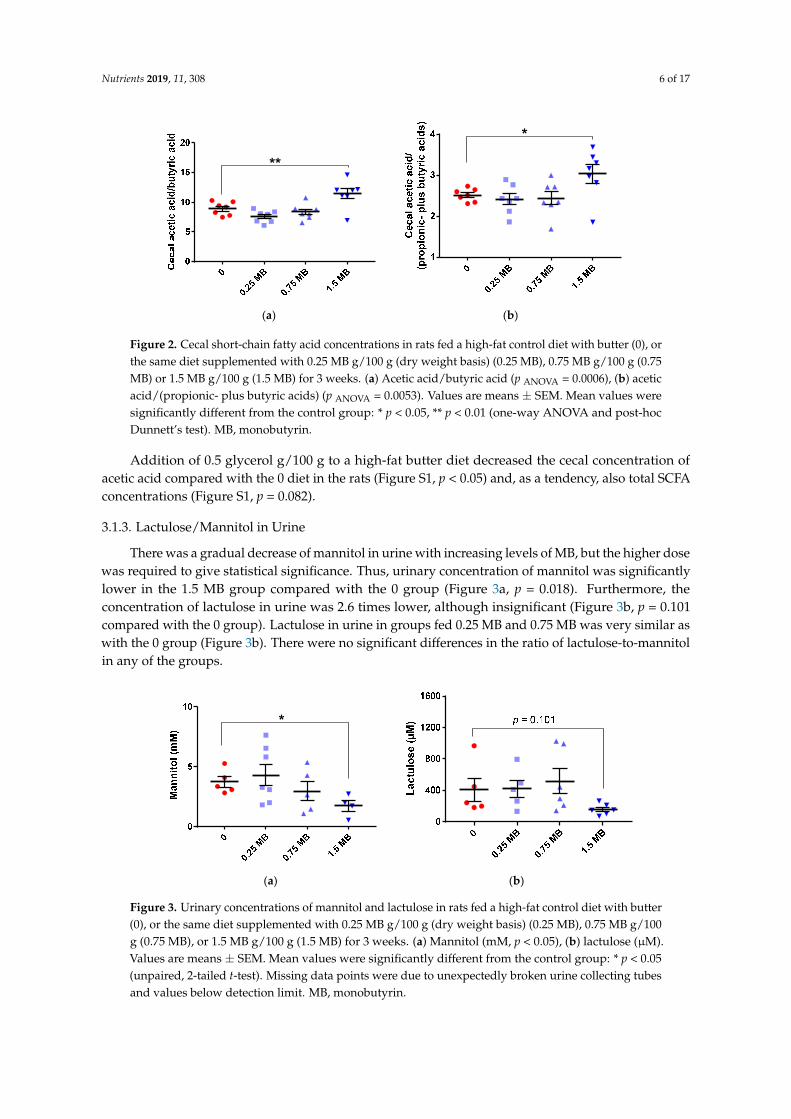
The cecal concentration of SCFA in rats fed the 0 diet was in total 79.7 ± 10.3 µmol/g, distributed on 46.3 ± 6.2 µmol/g for acetic acid, 13.0 ± 1.5 µmol/g for propionic acid, and 5.2 ± 0.8 µmol/g for butyric acid. When adding MB to the diet, the cecal values were very similar and no significant differences could be seen in total or individual concentrations of SCFA. However, the ratios of acetic-to-butyric acid and acetic-to-propionic- plus butyric acids were higher in the group fed 1.5 MB than the 0 group (Figure 2a,b; p < 0.01 and p < 0.05, respectively).
Figure 1. Liver lipids in rats fed a high-fat control diet with butter (0), or the same diet supplementedwith 0.25 MB g/100 g (dry weight basis) (0.25 MB), 0.75 MB g/100 g (0.75 MB), or 1.5 MB g/100 g(1.5 MB) for 3 weeks. (a) Total cholesterol (mg/g, p < 0.05, unpaired, 2-tail t-test), (b) triglycerides(mg/g, p ANOVA = 0.0447, one-way ANOVA and post-hoc Dunnett’s test), (c) TG/HDL-cholesterolratio (p = 0.093, unpaired, 2-tail t-test). Values are means ± SEM. Mean values were significantlydifferent from the control group: * p < 0.05. MB, monobutyrin; HDL-cholesterol, high-densitylipoprotein-cholesterol; TG, triglycerides.
Portal Vein Serum
No differences were observed in portal vein serum lipids among the groups.
3.1.2. Cecal Short-Chain Fatty Acids
The cecal concentration of SCFA in rats fed the 0 diet was in total 79.7 ± 10.3 µmol/g, distributedon 46.3 ± 6.2 µmol/g for acetic acid, 13.0 ± 1.5 µmol/g for propionic acid, and 5.2 ± 0.8 µmol/g forbutyric acid. When adding MB to the diet, the cecal values were very similar and no significantdifferences could be seen in total or individual concentrations of SCFA. However, the ratios ofacetic-to-butyric acid and acetic-to-propionic- plus butyric acids were higher in the group fed 1.5 MBthan the 0 group (Figure 2a,b; p < 0.01 and p < 0.05, respectively).
Nutrients 2019, 11, 308 6 of 17Nutrients 2019, 11, x FOR PEER REVIEW 6 of 18
**
*
(a) (b)
Figure 2. Cecal short-chain fatty acid concentrations in rats fed a high-fat control diet with butter (0), or the same diet supplemented with 0.25 MB g/100 g (dry weight basis) (0.25 MB), 0.75 MB g/100 g (0.75 MB) or 1.5 MB g/100 g (1.5 MB) for 3 weeks. (a) Acetic acid/butyric acid (p ANOVA = 0.0006), (b) acetic acid/(propionic- plus butyric acids) (p ANOVA = 0.0053). Values are means ± SEM. Mean values were significantly different from the control group: * p < 0.05, ** p < 0.01 (one-way ANOVA and post-hoc Dunnett’s test). MB, monobutyrin.
Addition of 0.5 glycerol g/100 g to a high-fat butter diet decreased the cecal concentration of acetic acid compared with the 0 diet in the rats (Figure S1, p < 0.05) and, as a tendency, also total SCFA concentrations (Figure S1, p = 0.082).
3.1.3. Lactulose/Mannitol in Urine
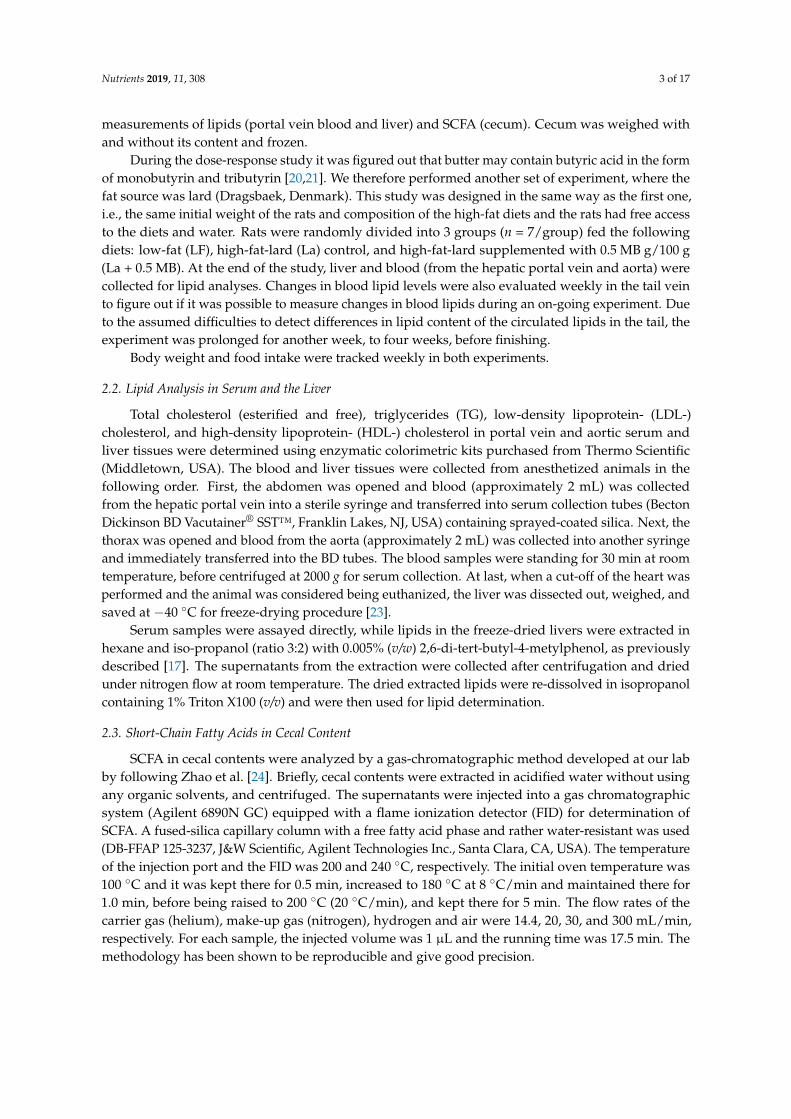
There was a gradual decrease of mannitol in urine with increasing levels of MB, but the higher dose was required to give statistical significance. Thus, urinary concentration of mannitol was significantly lower in the 1.5 MB group compared with the 0 group (Figure 3a, p = 0.018). Furthermore, the concentration of lactulose in urine was 2.6 times lower, although insignificant (Figure 3b, p = 0.101 compared with the 0 group). Lactulose in urine in groups fed 0.25 MB and 0.75 MB was very similar as with the 0 group (Figure 3b). There were no significant differences in the ratio of lactulose-to-mannitol in any of the groups.
*
(a) (b)
Figure 3. Urinary concentrations of mannitol and lactulose in rats fed a high-fat control diet with butter (0), or the same diet supplemented with 0.25 MB g/100 g (dry weight basis) (0.25 MB), 0.75 MB g/100 g (0.75 MB), or 1.5 MB g/100 g (1.5 MB) for 3 weeks. (a) Mannitol (mM, p < 0.05), (b) lactulose (µM). Values are means ± SEM. Mean values were significantly different from the control group: * p < 0.05 (unpaired, 2-tailed t-test). Missing data points were due to unexpectedly broken urine collecting tubes and values below detection limit. MB, monobutyrin.
Figure 2. Cecal short-chain fatty acid concentrations in rats fed a high-fat control diet with butter (0), orthe same diet supplemented with 0.25 MB g/100 g (dry weight basis) (0.25 MB), 0.75 MB g/100 g (0.75MB) or 1.5 MB g/100 g (1.5 MB) for 3 weeks. (a) Acetic acid/butyric acid (p ANOVA = 0.0006), (b) aceticacid/(propionic- plus butyric acids) (p ANOVA = 0.0053). Values are means ± SEM. Mean values weresignificantly different from the control group: * p < 0.05, ** p < 0.01 (one-way ANOVA and post-hocDunnett’s test). MB, monobutyrin.
Addition of 0.5 glycerol g/100 g to a high-fat butter diet decreased the cecal concentration ofacetic acid compared with the 0 diet in the rats (Figure S1, p < 0.05) and, as a tendency, also total SCFAconcentrations (Figure S1, p = 0.082).
3.1.3. Lactulose/Mannitol in Urine
There was a gradual decrease of mannitol in urine with increasing levels of MB, but the higher dosewas required to give statistical significance. Thus, urinary concentration of mannitol was significantlylower in the 1.5 MB group compared with the 0 group (Figure 3a, p = 0.018). Furthermore, theconcentration of lactulose in urine was 2.6 times lower, although insignificant (Figure 3b, p = 0.101compared with the 0 group). Lactulose in urine in groups fed 0.25 MB and 0.75 MB was very similar aswith the 0 group (Figure 3b). There were no significant differences in the ratio of lactulose-to-mannitolin any of the groups.
Nutrients 2019, 11, x FOR PEER REVIEW 6 of 18
**
*
(a) (b)
Figure 2. Cecal short-chain fatty acid concentrations in rats fed a high-fat control diet with butter (0), or the same diet supplemented with 0.25 MB g/100 g (dry weight basis) (0.25 MB), 0.75 MB g/100 g (0.75 MB) or 1.5 MB g/100 g (1.5 MB) for 3 weeks. (a) Acetic acid/butyric acid (p ANOVA = 0.0006), (b) acetic acid/(propionic- plus butyric acids) (p ANOVA = 0.0053). Values are means ± SEM. Mean values were significantly different from the control group: * p < 0.05, ** p < 0.01 (one-way ANOVA and post-hoc Dunnett’s test). MB, monobutyrin.
Addition of 0.5 glycerol g/100 g to a high-fat butter diet decreased the cecal concentration of acetic acid compared with the 0 diet in the rats (Figure S1, p < 0.05) and, as a tendency, also total SCFA concentrations (Figure S1, p = 0.082).
3.1.3. Lactulose/Mannitol in Urine
There was a gradual decrease of mannitol in urine with increasing levels of MB, but the higher dose was required to give statistical significance. Thus, urinary concentration of mannitol was significantly lower in the 1.5 MB group compared with the 0 group (Figure 3a, p = 0.018). Furthermore, the concentration of lactulose in urine was 2.6 times lower, although insignificant (Figure 3b, p = 0.101 compared with the 0 group). Lactulose in urine in groups fed 0.25 MB and 0.75 MB was very similar as with the 0 group (Figure 3b). There were no significant differences in the ratio of lactulose-to-mannitol in any of the groups.
*
(a) (b)
Figure 3. Urinary concentrations of mannitol and lactulose in rats fed a high-fat control diet with butter (0), or the same diet supplemented with 0.25 MB g/100 g (dry weight basis) (0.25 MB), 0.75 MB g/100 g (0.75 MB), or 1.5 MB g/100 g (1.5 MB) for 3 weeks. (a) Mannitol (mM, p < 0.05), (b) lactulose (µM). Values are means ± SEM. Mean values were significantly different from the control group: * p < 0.05 (unpaired, 2-tailed t-test). Missing data points were due to unexpectedly broken urine collecting tubes and values below detection limit. MB, monobutyrin.
Figure 3. Urinary concentrations of mannitol and lactulose in rats fed a high-fat control diet with butter(0), or the same diet supplemented with 0.25 MB g/100 g (dry weight basis) (0.25 MB), 0.75 MB g/100g (0.75 MB), or 1.5 MB g/100 g (1.5 MB) for 3 weeks. (a) Mannitol (mM, p < 0.05), (b) lactulose (µM).Values are means ± SEM. Mean values were significantly different from the control group: * p < 0.05(unpaired, 2-tailed t-test). Missing data points were due to unexpectedly broken urine collecting tubesand values below detection limit. MB, monobutyrin.
Nutrients 2019, 11, 308 7 of 17
Glycerol 0.5 g/100 g had no effect on intestinal permeability compared with the 0 group(Figure S1).
3.1.4. Correlations and Multivariate Data Analysis
A negative correlation was found between liver triglyceride concentrations and the cecal ratioof acetic-to-propionic- plus butyric acids (p = 0.074, r = −0.305). Furthermore, there was a negativecorrelation between LDL-cholesterol concentrations and cecal concentrations of total SCFA (p = 0.042,r = −0.346), acetic acid (p = 0.007, r = −0.447), propionic acid (p = 0.042, r = −0.041), and butyric acid(p = 0.059, r = −0.322).
Lactulose in urine correlated negatively with cecal concentrations of acetic acid (r = −0.326,p = 0.091), and the ratio of lactulose and mannitol with total SCFA (r = −0.374, p = 0.042), acetic acid(r = −0.492, p = 0.006), propionic acid (r = −0.344, p = 0.063) and acetic-to-isobutyric- plus isovalericacids (r = −0.401, p = 0.028).
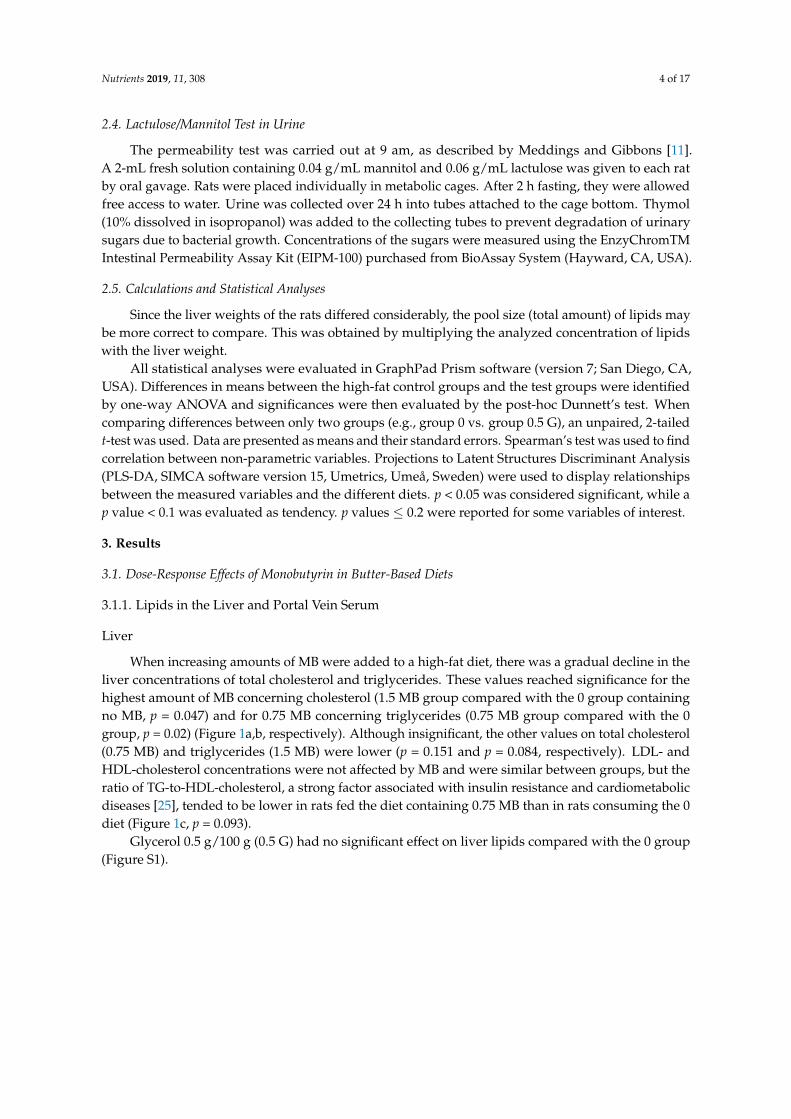
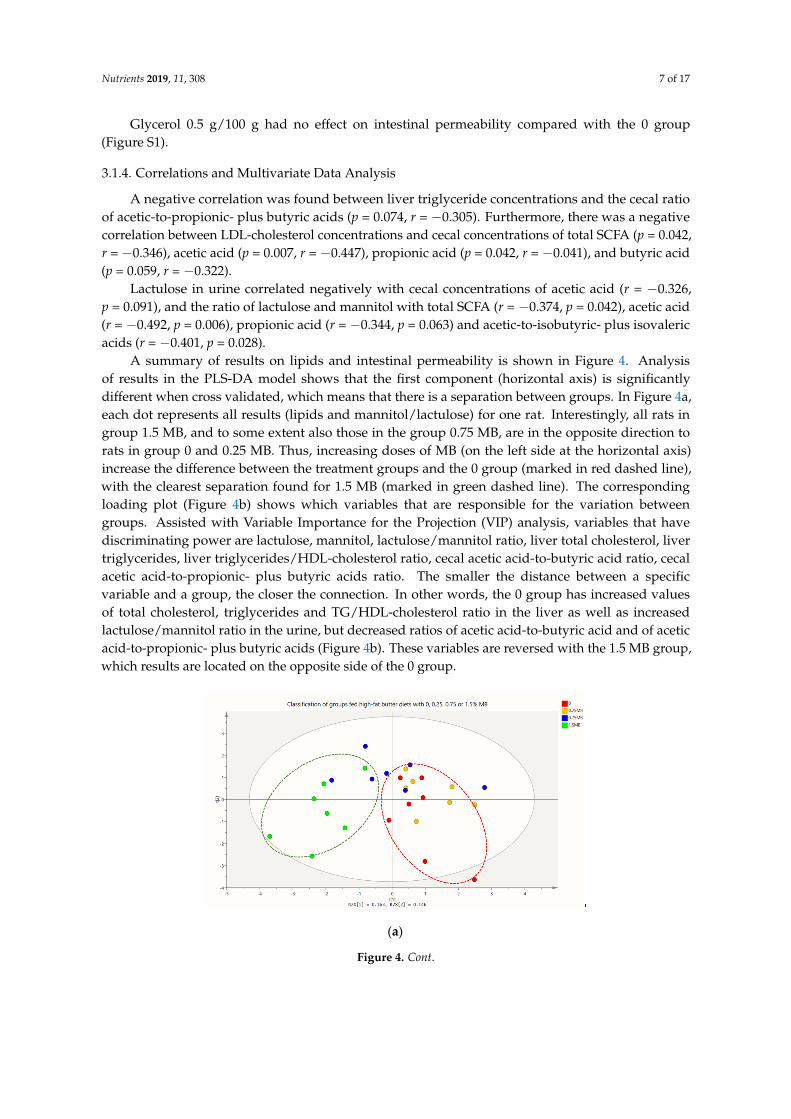
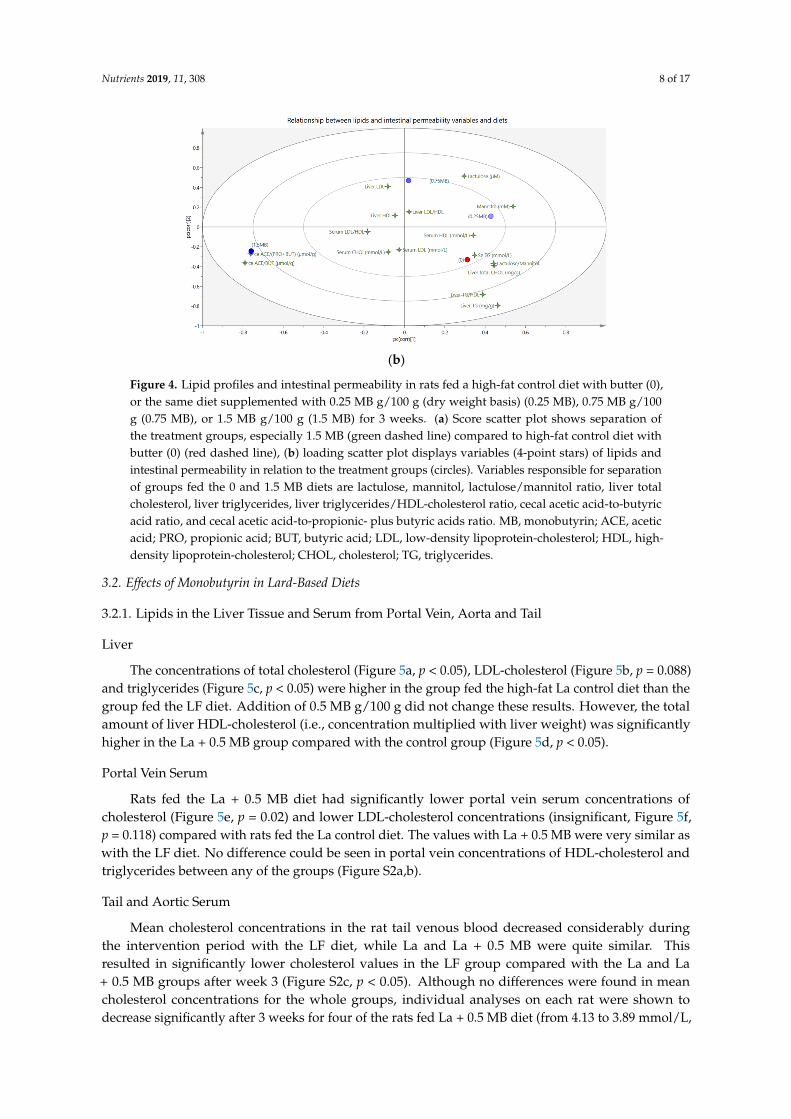
A summary of results on lipids and intestinal permeability is shown in Figure 4. Analysisof results in the PLS-DA model shows that the first component (horizontal axis) is significantlydifferent when cross validated, which means that there is a separation between groups. In Figure 4a,each dot represents all results (lipids and mannitol/lactulose) for one rat. Interestingly, all rats ingroup 1.5 MB, and to some extent also those in the group 0.75 MB, are in the opposite direction torats in group 0 and 0.25 MB. Thus, increasing doses of MB (on the left side at the horizontal axis)increase the difference between the treatment groups and the 0 group (marked in red dashed line),with the clearest separation found for 1.5 MB (marked in green dashed line). The correspondingloading plot (Figure 4b) shows which variables that are responsible for the variation betweengroups. Assisted with Variable Importance for the Projection (VIP) analysis, variables that havediscriminating power are lactulose, mannitol, lactulose/mannitol ratio, liver total cholesterol, livertriglycerides, liver triglycerides/HDL-cholesterol ratio, cecal acetic acid-to-butyric acid ratio, cecalacetic acid-to-propionic- plus butyric acids ratio. The smaller the distance between a specificvariable and a group, the closer the connection. In other words, the 0 group has increased valuesof total cholesterol, triglycerides and TG/HDL-cholesterol ratio in the liver as well as increasedlactulose/mannitol ratio in the urine, but decreased ratios of acetic acid-to-butyric acid and of aceticacid-to-propionic- plus butyric acids (Figure 4b). These variables are reversed with the 1.5 MB group,which results are located on the opposite side of the 0 group.
Nutrients 2019, 11, x FOR PEER REVIEW 8 of 18
(a)
(b)
Figure 4. Lipid profiles and intestinal permeability in rats fed a high-fat control diet with butter (0), or the same diet supplemented with 0.25 MB g/100 g (dry weight basis) (0.25 MB), 0.75 MB g/100 g (0.75 MB), or 1.5 MB g/100 g (1.5 MB) for 3 weeks. (a) Score scatter plot shows separation of the treatment groups, especially 1.5 MB (green dashed line) compared to high-fat control diet with butter (0) (red dashed line), (b) loading scatter plot displays variables (4-point stars) of lipids and intestinal permeability in relation to the treatment groups (circles). Variables responsible for separation of groups fed the 0 and 1.5 MB diets are lactulose, mannitol, lactulose/mannitol ratio, liver total cholesterol, liver triglycerides, liver triglycerides/HDL-cholesterol ratio, cecal acetic acid-to-butyric acid ratio, and cecal acetic acid-to-propionic- plus butyric acids ratio. MB, monobutyrin; ACE, acetic acid; PRO, propionic acid; BUT, butyric acid; LDL, low-density lipoprotein-cholesterol; HDL, high- density lipoprotein-cholesterol; CHOL, cholesterol; TG, triglycerides.
3.2. Effects of Monobutyrin in Lard-Based Diets
3.2.1. Lipids in the Liver Tissue and Serum from Portal Vein, Aorta and Tail
Liver
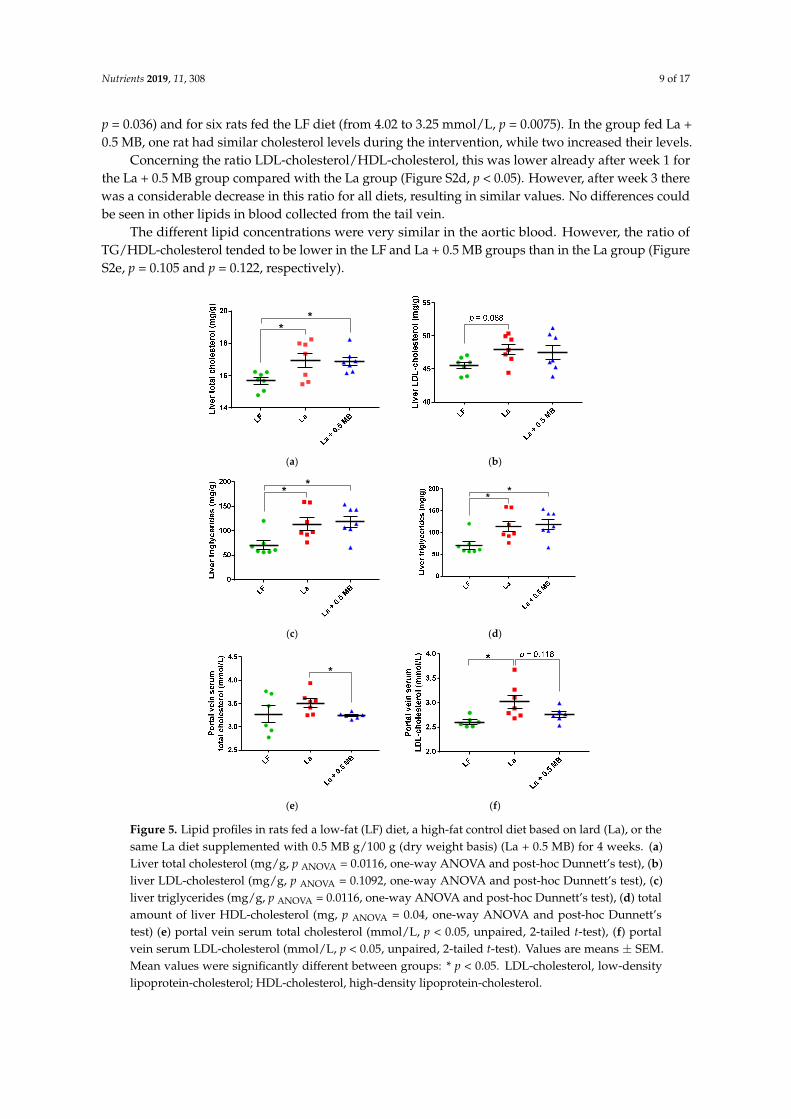
The concentrations of total cholesterol (Figure 5a, p < 0.05), LDL-cholesterol (Figure 5b, p = 0.088) and triglycerides (Figure 5c, p < 0.05) were higher in the group fed the high-fat La control diet than the group fed the LF diet. Addition of 0.5 MB g/100 g did not change these results. However, the total
Figure 4. Cont.
Nutrients 2019, 11, 308 8 of 17
Nutrients 2019, 11, x FOR PEER REVIEW 8 of 18
(a)
(b)
Figure 4. Lipid profiles and intestinal permeability in rats fed a high-fat control diet with butter (0), or the same diet supplemented with 0.25 MB g/100 g (dry weight basis) (0.25 MB), 0.75 MB g/100 g (0.75 MB), or 1.5 MB g/100 g (1.5 MB) for 3 weeks. (a) Score scatter plot shows separation of the treatment groups, especially 1.5 MB (green dashed line) compared to high-fat control diet with butter (0) (red dashed line), (b) loading scatter plot displays variables (4-point stars) of lipids and intestinal permeability in relation to the treatment groups (circles). Variables responsible for separation of groups fed the 0 and 1.5 MB diets are lactulose, mannitol, lactulose/mannitol ratio, liver total cholesterol, liver triglycerides, liver triglycerides/HDL-cholesterol ratio, cecal acetic acid-to-butyric acid ratio, and cecal acetic acid-to-propionic- plus butyric acids ratio. MB, monobutyrin; ACE, acetic acid; PRO, propionic acid; BUT, butyric acid; LDL, low-density lipoprotein-cholesterol; HDL, high- density lipoprotein-cholesterol; CHOL, cholesterol; TG, triglycerides.
3.2. Effects of Monobutyrin in Lard-Based Diets
3.2.1. Lipids in the Liver Tissue and Serum from Portal Vein, Aorta and Tail
Liver
The concentrations of total cholesterol (Figure 5a, p < 0.05), LDL-cholesterol (Figure 5b, p = 0.088) and triglycerides (Figure 5c, p < 0.05) were higher in the group fed the high-fat La control diet than the group fed the LF diet. Addition of 0.5 MB g/100 g did not change these results. However, the total
Figure 4. Lipid profiles and intestinal permeability in rats fed a high-fat control diet with butter (0),or the same diet supplemented with 0.25 MB g/100 g (dry weight basis) (0.25 MB), 0.75 MB g/100g (0.75 MB), or 1.5 MB g/100 g (1.5 MB) for 3 weeks. (a) Score scatter plot shows separation ofthe treatment groups, especially 1.5 MB (green dashed line) compared to high-fat control diet withbutter (0) (red dashed line), (b) loading scatter plot displays variables (4-point stars) of lipids andintestinal permeability in relation to the treatment groups (circles). Variables responsible for separationof groups fed the 0 and 1.5 MB diets are lactulose, mannitol, lactulose/mannitol ratio, liver totalcholesterol, liver triglycerides, liver triglycerides/HDL-cholesterol ratio, cecal acetic acid-to-butyricacid ratio, and cecal acetic acid-to-propionic- plus butyric acids ratio. MB, monobutyrin; ACE, aceticacid; PRO, propionic acid; BUT, butyric acid; LDL, low-density lipoprotein-cholesterol; HDL, high-density lipoprotein-cholesterol; CHOL, cholesterol; TG, triglycerides.
3.2. Effects of Monobutyrin in Lard-Based Diets
3.2.1. Lipids in the Liver Tissue and Serum from Portal Vein, Aorta and Tail
Liver
The concentrations of total cholesterol (Figure 5a, p < 0.05), LDL-cholesterol (Figure 5b, p = 0.088)and triglycerides (Figure 5c, p < 0.05) were higher in the group fed the high-fat La control diet than thegroup fed the LF diet. Addition of 0.5 MB g/100 g did not change these results. However, the totalamount of liver HDL-cholesterol (i.e., concentration multiplied with liver weight) was significantlyhigher in the La + 0.5 MB group compared with the control group (Figure 5d, p < 0.05).
Portal Vein Serum
Rats fed the La + 0.5 MB diet had significantly lower portal vein serum concentrations ofcholesterol (Figure 5e, p = 0.02) and lower LDL-cholesterol concentrations (insignificant, Figure 5f,p = 0.118) compared with rats fed the La control diet. The values with La + 0.5 MB were very similar aswith the LF diet. No difference could be seen in portal vein concentrations of HDL-cholesterol andtriglycerides between any of the groups (Figure S2a,b).
Tail and Aortic Serum
Mean cholesterol concentrations in the rat tail venous blood decreased considerably duringthe intervention period with the LF diet, while La and La + 0.5 MB were quite similar. Thisresulted in significantly lower cholesterol values in the LF group compared with the La and La+ 0.5 MB groups after week 3 (Figure S2c, p < 0.05). Although no differences were found in meancholesterol concentrations for the whole groups, individual analyses on each rat were shown todecrease significantly after 3 weeks for four of the rats fed La + 0.5 MB diet (from 4.13 to 3.89 mmol/L,
Nutrients 2019, 11, 308 9 of 17
p = 0.036) and for six rats fed the LF diet (from 4.02 to 3.25 mmol/L, p = 0.0075). In the group fed La +0.5 MB, one rat had similar cholesterol levels during the intervention, while two increased their levels.
Concerning the ratio LDL-cholesterol/HDL-cholesterol, this was lower already after week 1 forthe La + 0.5 MB group compared with the La group (Figure S2d, p < 0.05). However, after week 3 therewas a considerable decrease in this ratio for all diets, resulting in similar values. No differences couldbe seen in other lipids in blood collected from the tail vein.
The different lipid concentrations were very similar in the aortic blood. However, the ratio ofTG/HDL-cholesterol tended to be lower in the LF and La + 0.5 MB groups than in the La group (FigureS2e, p = 0.105 and p = 0.122, respectively).
Nutrients 2019, 11, x FOR PEER REVIEW 10 of 18
**
(a) (b)
* *
* *
(c) (d)
*
(e) (f)
Figure 5. Lipid profiles in rats fed a low-fat (LF) diet, a high-fat control diet based on lard (La), or the same La diet supplemented with 0.5 MB g/100 g (dry weight basis) (La + 0.5 MB) for 4 weeks. (a) Liver total cholesterol (mg/g, p ANOVA = 0.0116, one-way ANOVA and post-hoc Dunnett’s test), (b) liver LDL-cholesterol (mg/g, p ANOVA = 0.1092, one-way ANOVA and post-hoc Dunnett’s test), (c) liver triglycerides (mg/g, p ANOVA = 0.0116, one-way ANOVA and post-hoc Dunnett’s test), (d) total amount of liver HDL-cholesterol (mg, p ANOVA = 0.04, one-way ANOVA and post-hoc Dunnett’s test) (e) portal vein serum total cholesterol (mmol/L, p < 0.05, unpaired, 2-tailed t-test), (f) portal vein serum LDL-cholesterol (mmol/L, p < 0.05, unpaired, 2-tailed t-test). Values are means ± SEM. Mean values were significantly different between groups: * p < 0.05. LDL-cholesterol, low-density lipoprotein-cholesterol; HDL-cholesterol, high-density lipoprotein-cholesterol.
3.2.2. Correlation and Multivariate Data Analysis
Figure 5. Lipid profiles in rats fed a low-fat (LF) diet, a high-fat control diet based on lard (La), or thesame La diet supplemented with 0.5 MB g/100 g (dry weight basis) (La + 0.5 MB) for 4 weeks. (a)Liver total cholesterol (mg/g, p ANOVA = 0.0116, one-way ANOVA and post-hoc Dunnett’s test), (b)liver LDL-cholesterol (mg/g, p ANOVA = 0.1092, one-way ANOVA and post-hoc Dunnett’s test), (c)liver triglycerides (mg/g, p ANOVA = 0.0116, one-way ANOVA and post-hoc Dunnett’s test), (d) totalamount of liver HDL-cholesterol (mg, p ANOVA = 0.04, one-way ANOVA and post-hoc Dunnett’stest) (e) portal vein serum total cholesterol (mmol/L, p < 0.05, unpaired, 2-tailed t-test), (f) portalvein serum LDL-cholesterol (mmol/L, p < 0.05, unpaired, 2-tailed t-test). Values are means ± SEM.Mean values were significantly different between groups: * p < 0.05. LDL-cholesterol, low-densitylipoprotein-cholesterol; HDL-cholesterol, high-density lipoprotein-cholesterol.
Nutrients 2019, 11, 308 10 of 17
3.2.2. Correlation and Multivariate Data Analysis
Spearman correlation test showed a positive relationship between portal vein LDL-cholesterolwith portal vein TG (p = 0.031, r = 0.495) and liver LDL-cholesterol (p = 0.013, r = 0.556) and TG(p = 0.002, r = 0.674).
Effects of MB in lard-based diets are shown in Figure S3 in a PLS-DA plot. Addition of 0.5 MBg/100 g to a lard diet shifts the location of the La + 0.5 MB group to the opposite side of the Lagroup, i.e., to the same side where values from the LF group are located (Figure S3a). In line withthis, higher values of LDL-cholesterol and LDL-cholesterol/HDL-cholesterol in the portal vein andTG/HDL-cholesterol in the aorta were associated with the La group, while these variables were lowerin the La + 0.5 MB and LF groups (Figure S3b).
3.3. Effects of Monobutyrin on Body-Weight Gain and Organ Weights
3.3.1. Butter Diets
Groups fed the MB-supplemented diets did not differ from the 0 group in final body weight andtissue weights, except for the 1.5 MB group that tended to have higher relative liver weights comparedwith the 0 group (Table S2, p = 0.087).
Glycerol in the diet (0.5 G) increased the final body weight and body weight gain (p = 0.019 andp = 0.013, respectively) compared with the 0 group, and tended to give heavier liver weights (p = 0.057).
3.3.2. Lard Diets
Rats given the high-fat diets consumed less amount of food but gained more weight than those onthe LF diet, as shown by the higher food efficiency ratio (body weight gain/total food intake) for theLa and La + 0.5 MB groups (Table S2, p < 0.05). Relative weights of liver and spleen were significantlylower in the La group compared with the LF group (p < 0.05). No differences concerning organ weightscould be seen between the La and La + 0.5 MB group.
4. Discussion
4.1. Dose-Dependent Lowering Effect on Liver Total Cholesterol
Addition of MB to a high-fat butter diet decreased diet-induced elevated liver total cholesterolconcentrations in a dose-dependent manner. This result is consistent with our previous workwhere a similar reduction in liver cholesterol was accompanied by down-regulation of genesinvolved in bile acid synthesis (specifically, cholesterol 7-alpha-hydroxylase/Cyp7a1 and sterol12-alpha-hydroxyalse/Cyp8b1) in rats fed high-fat diets supplemented with 0.5 MB g/100 g [17].However, in that study we also observed a decrease in liver LDL-cholesterol concentrations, whichcould not be seen in the present study. The reason for these discrepancies is currently unknown. It maybe speculated that MB is acting preferably on cholesterol absorption/excretion via bile acid metabolismrather than directly on LDL-cholesterol uptake by the liver, although there are also other factorsthat can influence cholesterol metabolism. Indeed, SCFA have shown to reduce hepatic cholesterollevels by lowering substrates for cholesterol synthesis (e.g., liver 3-hydroxy-3-methylglutaryl-CoA),suppressing genes regulating these substrates (e.g., ATP-citrate lyase), or promoting fecal bile acidexcretion [14,15]. Specifically, butyric acid has been shown to influence intestinal lipid absorption byinhibiting expression of microsomal triglyceride transfer protein [16].
It should be mentioned that the total cholesterol measured in this study included both esterifiedand free cholesterol, originally present in samples. Free/unesterified cholesterol seems to have morenegative effects than esterified cholesterol under certain diseased conditions. For instance, fasterremoval from blood followed by greater vessel tissue deposition of free cholesterol compared withcholesteryl ester was found in coronary artery disease (CAD) patients [26]. Furthermore, diminishedtransfer of unesterified cholesterol to HDL was reported in CAD patients with and without type 2
Nutrients 2019, 11, 308 11 of 17
diabetes [27]. However, it should be mentioned that cholesterol transfer may differ between humansand rats, since rats are naturally deficient in cholesteryl ester transfer protein. Recent data in CADpatients indicated the ratio of unesterified/esterified cholesterol in lipoprotein fractions as a strongerpredictor of atherogenicity than other cholesterol subfractions [28]. Thus, further investigations ofthe presence of different lipids may reveal potential impact of MB supplementation on cholesterolesterification profile.
4.2. Reduction of Liver Triglycerides
Apart from the observed lowering effect of MB on total liver cholesterol, reduction in livertriglyceride concentrations was also found in the groups fed the MB diets in a dose-response manner,with effects seen already at 0.75 MB g/100 g. No effects on triglycerides could be seen in our previousstudy where a dose of 0.5 MB g/100 g was added to butter-based diets [17]. The reason for thesediverging results is not strange per se, and may be attributed to the lower dose used in that study. Thus,MB inhibits glycerol uptake in the rat, leaving less substrate available for the formation of triglyceridebackbone [29]. SCFA are also able to decrease liver triglycerides by promoting lipid oxidation, andto suppress lipolysis and non-esterified fatty acids in blood via activation of their receptors suchas GPR109A and GPR43 (highest affinity to acetate) [30–32]. Furthermore, acetic acid is reportedto suppress triglyceride biosynthesis by upregulating expression of acyl-CoA oxidase, an enzymeinvolved in fatty acid oxidation [15]. Although there were no changes in acetic acid concentration inthe present study, higher ratios of acetic-to-propionic- plus butyric acids were seen in rats fed the 1.5MB diet compared with those in the control group, suggesting a potential reverse relationship betweenacetic acid and liver triglycerides.
Although indirect, it can be of importance to discuss the reduced liver triglycerides in associationwith activation of peroxisome proliferator-activated receptor alpha (PPARα), a ligand-activatedtranscription factor involved in regulation of genes that stimulate removal of triglycerides fromthe bloodstream and enhance β-oxidation in the liver. Tributyrin, a similar sibling of monobutyrin,has been shown to increase mRNA and protein expression of PPARα, and β-oxidation related genesin rat liver [33]. These effects were mediated by increased acetylation of histone H3 in the liver,subsequently leading to inhibition of inflammatory markers and liver injury, and reduced levels ofplasma triglycerides, total and LDL-cholesterol after 24 h LPS challenge. Especially, fibrates, ligands ofPPARα are clinically used to treat dyslipidemia [34]. In addition, activation of PPARα also reducedhepatic expression of a glycerol transporter aquaporin 9 (AQP9) in male Wistar rats [35]. This evidencesuggests the effects of MB could be explained by similar mechanisms. However, further investigationswith specific aims are needed to confirm these potential suggestions.
Positive effects of MB as an effective hepatic glycerol uptake inhibitor have been reported [29].Our current data show that supplementation of MB to the high-fat diets caused reduction in liverconcentrations of cholesterol and triglycerides, further establishing a potent impact of MB on lipidmetabolism. Indeed, dietary supplementation of MB given to rats on high-fat diets led to a reductionin liver succinic acid [17], a metabolite elevated in metabolic diseases, such as diabetes, and capable ofincreasing blood pressure via activation of its receptor GPR91 [36,37]. Furthermore, tributyrin has beenshown to reduce liver triglyceride accumulation and insulin levels in high-fat fed mice [38]. Tributyrinlipid emulsion was reported to bind to LDL and selectively taken up by cellular LDL receptors [39].Therefore, it remains to be determined if there is a link between the effects of MB and these receptorsor other SCFA receptors.
4.3. Improved Intestinal Barrier Function
Consumption of high-fat diets compromises the gut barrier both in rodents and humans,facilitating the onset of obesity and associated metabolic disorders [4,40,41]. Studies in rats haveshown that there is a considerable increase in paracellular permeability seen as early as within oneweek of high-fat feeding in the small intestine, and after 3 weeks in the colon, coinciding with elevated
Nutrients 2019, 11, 308 12 of 17
LPS binding protein (LBP) in blood [2]. Studies have failed to show that MB in dose of 0.5 g/100 g in thehigh-fat diet can lower blood LBP levels in rats [17] while tributyrin in dose 2.0 g/kg body weight canchange LPS levels in mice [38]. However, sustained expression and co-localizations of tight junctionproteins, and reduced intestinal permeability were reported in mouse models of gut injury or colitisafter tributyrin treatments [9,42]. These data led us to the hypothesis that MB could have potentialeffects on intestinal paracellular permeability. Intriguingly, the present data showed a prominentreduction in urinary concentrations of mannitol, as well as a decreased ratio of lactulose to mannitol(although insignificant) in the rats fed the high-fat diet supplemented with 1.5 MB g/100 g. Theurinary excretion of these two sugars has been evaluated as a good indicator of small intestinal in vivopermeability in rats [11]. In humans, increased ratio of lactulose-to-mannitol in urine has been foundin diabetes and obesity [12,41,43]. In fact, increase in this ratio is also linked to an increase in insulinand a decline in HDL-cholesterol concentration in obese subjects [41]. The decreasing effect of MB onintestinal permeability found in this study may provide a probable mechanism linking obesity-relatedsymptoms and gut permeability as previously seen in humans [12,41,43]. Altogether, the data fromthis study show, for the first time that MB, at a dose of 1.5 g/100 g, is protective against high-fatdiet-induced gut impairment by partly modulating small intestinal barrier function, complementingthe anti-inflammatory actions of MB previously reported [17].
Another compound that needs to be considered in relation to gut permeability is glycerol, whichaccounted for 39% (w/w) of MB composition. The results from the dose-response study did not showany differences in lipid profiles and intestinal permeability between the glycerol-fed group and thehigh-fat control group, except a significant decrease in cecal concentrations of acetic acid in the groupfed glycerol. Therefore, the effect of glycerol seems less probable and the observed lipid-loweringimpact of MB was solely linked to MB.
4.4. Effect of Fat Source on Lipid Profiles
It may be discussed why the effects of MB could be seen on portal vein cholesterol andLDL-cholesterol in rats fed lard-based diets, but not in rats receiving butter-based diets. One reasoncould be the difference in lipid composition between butter and lard. Thus, the cholesterol contentin butter is higher than in lard (219 vs. 95 mg/100 g, respectively) [21,44] which makes it harder toaffect cholesterol results. It cannot be excluded that the longer experimental time in the lard-based dietstudy (4 weeks) than in the butter-based diet study (3 weeks) was another reason for the discrepancies.Furthermore, butter has a higher ratio of saturated-to-polyunsaturated acids compared to lard (16.8 vs.3.5). Saturated fatty acids, especially palmitic acid, was shown to reduce LDL-receptors in the liver,resulting in a subsequent elevation of LDL in blood [45]. However, the distribution of saturated fattyacids at the stereospecific numbering position 2 (sn-2) of triglycerides is higher in lard than in butter(59 vs. 39 mol %), and saturated fatty acids attached at this position are preferentially delivered to theliver [46], potentially explaining the lowering effects of MB on liver lipids seen in rats fed butter-diets,but not with those fed lard-diets. Besides these dietary factors, it should be emphasized that bloodcholesterol is regulated by many factors, such as intestinal cholesterol absorption, hepatic cholesterolsynthesis, as well as biliary excretion and cellular use [47]. Of note, SCFA, including butyric acid, exerta wide impact on these factors as mentioned throughout the paper.
Saturated fat is an important factor when inducing metabolic disorders in animal models, such asincreased levels of total cholesterol, LDL-cholesterol, triglycerides, and decreased HDL-cholesterol [48].Lard is generally used as the fat source in both mice and rat studies. However, lard is not that commonlyused in human diets, while butter is, and this was also the reason why we used butter initially. Both fatsources have high amounts of saturated fatty acids, although the composition is even poorer in butterthan in lard. On the other hand, butter has been reported to contain 3–4 g/100 g of tributyrin [21] and0.189 mM/100 g of extracted fat of monoglycerides [20], which might affect/change the results in apositive way. In this respect, it is important to point out that the presence of MB and TB in butter usedin our study was below detection of limit (<0.001% weight) by using gas-chromatography. With this
Nutrients 2019, 11, 308 13 of 17
background, we decided to evaluate effects of MB on lipid profile when lard was used as the mainfat source. As expected, presence of lard strongly elevated lipids in the liver, while adding of MB inthe lard diet tended to increase liver HDL-cholesterol concentrations, also leading to a consequentdecline in LDL-cholesterol/HDL-cholesterol ratio. Furthermore, and perhaps more importantly, theconcentrations of total cholesterol in portal vein blood were lower (p = 0.02) in the MB-fed rats thanin rats fed high-fat control containing lard. The same changes could also be seen in LDL-cholesterolconcentrations that remained similar between the LF and MB group. These results could be possiblylinked to the ability of SCFA to inhibit lipolysis and plasma free fatty acids via activation of GPR43 orGPR109A [31]. Improvements such as HDL elevation in treating dyslipidemia have also been reportedfor GPR109A [49]. Overall, the lipid lowering effects of MB are persistent, with parameters of lipidprofile being differently affected depending on the organs/locations and fat source investigated.
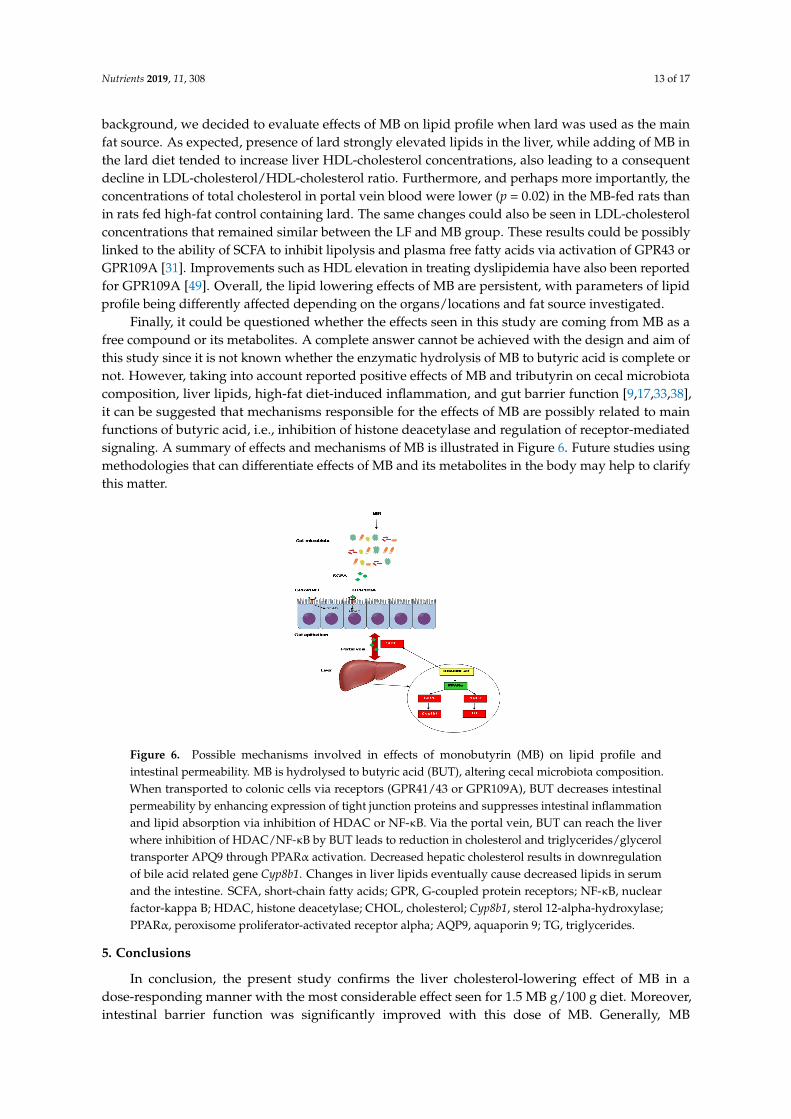
Finally, it could be questioned whether the effects seen in this study are coming from MB as afree compound or its metabolites. A complete answer cannot be achieved with the design and aim ofthis study since it is not known whether the enzymatic hydrolysis of MB to butyric acid is complete ornot. However, taking into account reported positive effects of MB and tributyrin on cecal microbiotacomposition, liver lipids, high-fat diet-induced inflammation, and gut barrier function [9,17,33,38],it can be suggested that mechanisms responsible for the effects of MB are possibly related to mainfunctions of butyric acid, i.e., inhibition of histone deacetylase and regulation of receptor-mediatedsignaling. A summary of effects and mechanisms of MB is illustrated in Figure 6. Future studies usingmethodologies that can differentiate effects of MB and its metabolites in the body may help to clarifythis matter.
Nutrients 2019, 11, x FOR PEER REVIEW 14 of 18
= 0.02) in the MB-fed rats than in rats fed high-fat control containing lard. The same changes could also be seen in LDL-cholesterol concentrations that remained similar between the LF and MB group. These results could be possibly linked to the ability of SCFA to inhibit lipolysis and plasma free fatty acids via activation of GPR43 or GPR109A [31]. Improvements such as HDL elevation in treating dyslipidemia have also been reported for GPR109A [49]. Overall, the lipid lowering effects of MB are persistent, with parameters of lipid profile being differently affected depending on the organs/locations and fat source investigated.
Finally, it could be questioned whether the effects seen in this study are coming from MB as a free compound or its metabolites. A complete answer cannot be achieved with the design and aim of this study since it is not known whether the enzymatic hydrolysis of MB to butyric acid is complete or not. However, taking into account reported positive effects of MB and tributyrin on cecal microbiota composition, liver lipids, high-fat diet-induced inflammation, and gut barrier function [9,17,33,38], it can be suggested that mechanisms responsible for the effects of MB are possibly related to main functions of butyric acid, i.e., inhibition of histone deacetylase and regulation of receptor-mediated signaling. A summary of effects and mechanisms of MB is illustrated in Figure 6. Future studies using methodologies that can differentiate effects of MB and its metabolites in the body may help to clarify this matter.
Figure 6. Possible mechanisms involved in effects of monobutyrin (MB) on lipid profile and intestinal permeability. MB is hydrolysed to butyric acid (BUT), altering cecal microbiota composition. When transported to colonic cells via receptors (GPR41/43 or GPR109A), BUT decreases intestinal permeability by enhancing expression of tight junction proteins and suppresses intestinal inflammation and lipid absorption via inhibition of HDAC or NF-κB. Via the portal vein, BUT can reach the liver where inhibition of HDAC/NF-κB by BUT leads to reduction in cholesterol and triglycerides/glycerol transporter APQ9 through PPARα activation. Decreased hepatic cholesterol results in downregulation of bile acid related gene Cyp8b1. Changes in liver lipids eventually cause decreased lipids in serum and the intestine. SCFA, short-chain fatty acids; GPR, G-coupled protein receptors; NF-κB, nuclear factor-kappa B; HDAC, histone deacetylase; CHOL, cholesterol; Cyp8b1, sterol 12-alpha-hydroxylase; PPARα, peroxisome proliferator-activated receptor alpha; AQP9, aquaporin 9; TG, triglycerides.
5. Conclusions
In conclusion, the present study confirms the liver cholesterol-lowering effect of MB in a dose-responding manner with the most considerable effect seen for 1.5 MB g/100 g diet. Moreover, intestinal barrier function was significantly improved with this dose of MB. Generally, MB supplementation was effective in lowering portal vein blood cholesterol when mixed into high-fat diets with lard as a fat source. These findings suggest promising potential of MB as a dietary supplement to prevent metabolic disturbances and reduce the risk factors for disease development associated with high-fat consumption.
Figure 6. Possible mechanisms involved in effects of monobutyrin (MB) on lipid profile andintestinal permeability. MB is hydrolysed to butyric acid (BUT), altering cecal microbiota composition.When transported to colonic cells via receptors (GPR41/43 or GPR109A), BUT decreases intestinalpermeability by enhancing expression of tight junction proteins and suppresses intestinal inflammationand lipid absorption via inhibition of HDAC or NF-κB. Via the portal vein, BUT can reach the liverwhere inhibition of HDAC/NF-κB by BUT leads to reduction in cholesterol and triglycerides/glyceroltransporter APQ9 through PPARα activation. Decreased hepatic cholesterol results in downregulationof bile acid related gene Cyp8b1. Changes in liver lipids eventually cause decreased lipids in serumand the intestine. SCFA, short-chain fatty acids; GPR, G-coupled protein receptors; NF-κB, nuclearfactor-kappa B; HDAC, histone deacetylase; CHOL, cholesterol; Cyp8b1, sterol 12-alpha-hydroxylase;PPARα, peroxisome proliferator-activated receptor alpha; AQP9, aquaporin 9; TG, triglycerides.
5. Conclusions
In conclusion, the present study confirms the liver cholesterol-lowering effect of MB in adose-responding manner with the most considerable effect seen for 1.5 MB g/100 g diet. Moreover,intestinal barrier function was significantly improved with this dose of MB. Generally, MB

Nutrients 2019, 11, 308 14 of 17
supplementation was effective in lowering portal vein blood cholesterol when mixed into high-fat dietswith lard as a fat source. These findings suggest promising potential of MB as a dietary supplement toprevent metabolic disturbances and reduce the risk factors for disease development associated withhigh-fat consumption.
Supplementary Materials: The following figures are available online at http://www.mdpi.com/2072-6643/11/2/308/s1: Figure S1. Effects of glycerol on cecal SCFA, liver lipids and intestinal permeability in rats fed a high-fatcontrol diet with butter (0) or the same diet supplemented with 0.5 glycerol g/100 g (dry weight basis) (0.5 G)for 3 weeks; Figure S2. Serum lipids in rats fed a low-fat (LF) diet, a high-fat control diet based on lard (La), orthe same La diet supplemented with 0.5 MB g/100 g (dry weight basis) (La + 0.5 MB) for 4 weeks; Figure S3.Effects of MB on lipids profiles in rats fed a low-fat (LF) diet, a high-fat control diet with lard (La), or the samediet supplemented with 0.5 MB g/100 g (dry weight basis) (La + 0.5 MB) for 4 weeks; Table S1. Compositionof the experimental diets (g/kg dry weight); Table S2. Final body weight (g), body weight gain (g), actual andrelative (normalized to body weight) tissue weights (g and % body weight), total food intake (mean g/rat), foodefficiency ratio (body weight gain/food intake, g/g) in rats fed a high-fat control diet with butter (0), or the samediet supplemented with 0.25 MB g/100 g (dry weight basis) (0.25 MB), 0.75 MB g/100 g (0.75 MB), 1.5 MB g/100 g(1.5 MB), or 0.5 glycerol g/100 g (0.5 G) for 3 weeks, or in rats fed a low-fat (LF) diet, a high-fat control diet withlard (La), or the same diet supplemented with 0.5 MB g/100 g (La + 0.5 MB) for 4 weeks. MB, monobutyrin.
Author Contributions: Conceptualization: T.D.N., F.F.H., and M.N.; Investigation: T.D.N.; Formal analysis:T.D.N.; Results interpretation and discussion: T.D.N., O.P., F.F.H., and M.N. Funding Acquisition: M.N.;Supervision: O.P., F.F.H., and M.N.; Original Draft Preparation: T.D.N.; Review & Editing: T.D.N., O.P., F.F.H., andM.N.
Funding: This research was funded by the Mekong 1000 Scholarship (Vietnam) and Perstorp AB (Sweden). 50%of the APC was funded by Lund University.
Acknowledgments: We would like to thank Alf Gunnarsson (Perstorp AB) and Koen Schwarzer (PerstorpHolding BV) for informative comments and the contribution of monobutyrin. We would also like to thank CamillaBjörklöv for the animal care and help with the oral feeding of lactulose/mannitol test.
Conflicts of Interest: The authors declare no conflict of interest. The funders had no role in the design of thestudy; in the collection, analyses, or interpretation of data; in the writing of the manuscript, or in the decision topublish the results.
References
1. Cani, P.D.; Bibiloni, R.; Knauf, C.; Waget, A.; Neyrinck, A.M.; Delzenne, N.M.; Burcelin, R. Changes ingut microbiota control metabolic endotoxemia-induced inflammation in high-fat diet-induced obesity anddiabetes in mice. Diabetes 2008, 57, 1470–1481. [CrossRef]
2. Hamilton, M.K.; Boudry, G.; Lemay, D.G.; Raybould, H.E. Changes in intestinal barrier function andgut microbiota in high-fat diet-fed rats are dynamic and region dependent. Am. J. Physiol. Gastrointest.Liver Physiol. 2015, 308, G840–G851. [CrossRef] [PubMed]
3. von Frankenberg, A.D.; Marina, A.; Song, X.; Callahan, H.S.; Kratz, M.; Utzschneider, K.M. A high-fat,high-saturated fat diet decreases insulin sensitivity without changing intra-abdominal fat in weight-stableoverweight and obese adults. Eur. J. Nutr. 2017, 56, 431–443. [CrossRef] [PubMed]
4. de La Serre, C.B.; Ellis, C.L.; Lee, J.; Hartman, A.L.; Rutledge, J.C.; Raybould, H.E. Propensity to high-fatdiet-induced obesity in rats is associated with changes in the gut microbiota and gut inflammation. Am. J.Physiol. Gastrointest. Liver Physiol. 2010, 299, G440–G448. [CrossRef] [PubMed]
5. Braniste, V.; Al-Asmakh, M.; Kowal, C.; Anuar, F.; Abbaspour, A.; Toth, M.; Korecka, A.; Bakocevic, N.;Ng, L.G.; Kundu, P.; et al. The gut microbiota influences blood-brain barrier permeability in mice.Sci. Transl. Med. 2014, 6, 263ra158. [CrossRef] [PubMed]
6. Ghanim, H.; Batra, M.; Abuaysheh, S.; Green, K.; Makdissi, A.; Kuhadiya, N.D.; Chaudhuri, A.; Dandona, P.Antiinflammatory and ROS Suppressive Effects of the Addition of Fiber to a High-Fat High-Calorie Meal.J. Clin. Endocrinol. Metab. 2017, 102, 858–869. [CrossRef]
7. Jakobsdottir, G.; Xu, J.; Molin, G.; Ahrne, S.; Nyman, M. High-fat diet reduces the formation of butyrate,but increases succinate, inflammation, liver fat and cholesterol in rats, while dietary fibre counteracts theseeffects. PLoS ONE 2013, 8, e80476. [CrossRef] [PubMed]
Nutrients 2019, 11, 308 15 of 17
8. Zhong, Y.; Marungruang, N.; Fak, F.; Nyman, M. Effects of two whole-grain barley varieties on caecal SCFA,gut microbiota and plasma inflammatory markers in rats consuming low- and high-fat diets. Br. J. Nutr.2015, 113, 1558–1570. [CrossRef] [PubMed]
9. Cresci, G.A.; Bush, K.; Nagy, L.E. Tributyrin Supplementation Protects Mice from Acute Ethanol-InducedGut Injury. Alcohol. Clin. Exp. Res. 2014, 38, 1489–1501. [CrossRef] [PubMed]
10. Peng, L.; Li, Z.R.; Green, R.S.; Holzman, I.R.; Lin, J. Butyrate enhances the intestinal barrier by facilitatingtight junction assembly via activation of AMP-activated protein kinase in Caco-2 cell monolayers. J. Nutr.2009, 139, 1619–1625. [CrossRef] [PubMed]
11. Meddings, J.B.; Gibbons, I. Discrimination of site-specific alterations in gastrointestinal permeability in therat. Gastroenterology 1998, 114, 83–92. [CrossRef]
12. Sapone, A.; de Magistris, L.; Pietzak, M.; Clemente, M.G.; Tripathi, A.; Cucca, F.; Lampis, R.; Kryszak, D.;Carteni, M.; Generoso, M.; et al. Zonulin upregulation is associated with increased gut permeability insubjects with type 1 diabetes and their relatives. Diabetes 2006, 55, 1443–1449. [CrossRef] [PubMed]
13. Fasano, A. Intestinal permeability and its regulation by zonulin: Diagnostic and therapeutic implications.Clin. Gastroenterol. Hepatol. 2012, 10, 1096–1100. [CrossRef] [PubMed]
14. Hara, H.; Haga, S.; Aoyama, Y.; Kiriyama, S. Short-chain fatty acids suppress cholesterol synthesis in ratliver and intestine. J. Nutr. 1999, 129, 942–948. [CrossRef] [PubMed]
15. Fushimi, T.; Suruga, K.; Oshima, Y.; Fukiharu, M.; Tsukamoto, Y.; Goda, T. Dietary acetic acid reduces serumcholesterol and triacylglycerols in rats fed a cholesterol-rich diet. Br. J. Nutr. 2006, 95, 916–924. [CrossRef][PubMed]
16. Marcil, V.; Delvin, E.; Garofalo, C.; Levy, E. Butyrate impairs lipid transport by inhibiting microsomaltriglyceride transfer protein in Caco-2 cells. J. Nutr. 2003, 133, 2180–2183. [CrossRef] [PubMed]
17. Nguyen, T.D.; Prykhodko, O.; Fak Hallenius, F.; Nyman, M. Effects of monobutyrin and tributyrin on liverlipid profile, caecal microbiota composition and SCFA in high-fat diet-fed rats. J. Nutr. Sci. 2017, 6, e51.[CrossRef] [PubMed]
18. Bedford, A.; Yu, H.; Squires, E.J.; Leeson, S.; Gong, J. Effects of supplementation level and feeding scheduleof butyrate glycerides on the growth performance and carcass composition of broiler chickens. Poult. Sci.2017, 96, 3221–3228. [CrossRef]
19. Jozefiak, D.; Rutkowski, A.; Jensen, B.B.; Engberg, R.M. The effect of beta-glucanase supplementation ofbarley- and oat-based diets on growth performance and fermentation in broiler chicken gastrointestinal tract.Br. Poultry Sci. 2006, 47, 57–64. [CrossRef]
20. Jensen, R.G.; Duthie, A.H. The Monoglyceride Content of Butter. J. Dairy Sci. 1959, 42, 902. [CrossRef]21. Agriculture, U.D.O. Composition of Foods: Dairy and Egg Products. In US Department of Agriculture
Handbook 8-1; US Department of Agriculture: Washington, DC, USA, 1976.22. Birkhahn, R.H.; McMenamy, R.H.; Border, J.R. Intravenous feeding of the rat with short chain fatty acid
esters. I. Glycerol monobutyrate. Am. J. Clin. Nutr. 1977, 30, 2078–2082. [CrossRef] [PubMed]23. Jakobsdottir, G.; Jadert, C.; Holm, L.; Nyman, M.E. Propionic and butyric acids, formed in the caecum of rats
fed highly fermentable dietary fibre, are reflected in portal and aortic serum. Br. J. Nutr. 2013, 110, 1565–1572.[CrossRef] [PubMed]
24. Zhao, G.H.; Nyman, M.; Jonsson, J.A. Rapid determination of short-chain fatty acids in colonic contentsand faeces of humans and rats by acidified water-extraction and direct-injection gas chromatography.Biomed. Chromatogr. 2006, 20, 674–682. [CrossRef]
25. Gutierrez-Salmean, G.; Meaney, E.; Lanaspa, M.A.; Cicerchi, C.; Johnson, R.J.; Dugar, S.; Taub, P.;Ramirez-Sanchez, I.; Villarreal, F.; Schreiner, G.; et al. A randomized, placebo-controlled, double-blindstudy on the effects of (−)-epicatechin on the triglyceride/HDLc ratio and cardiometabolic profile of subjectswith hypertriglyceridemia: Unique in vitro effects. Int. J. Cardiol. 2016, 223, 500–506. [CrossRef] [PubMed]
26. Couto, R.D.; Dallan, L.A.; Lisboa, L.A.; Mesquita, C.H.; Vinagre, C.G.; Maranhao, R.C. Deposition of freecholesterol in the blood vessels of patients with coronary artery disease: A possible novel mechanism foratherogenesis. Lipids 2007, 42, 411–418. [CrossRef] [PubMed]
27. Sprandel, M.C.; Hueb, W.A.; Segre, A.; Ramires, J.A.; Kalil-Filho, R.; Maranhao, R.C. Alterations in lipidtransfers to HDL associated with the presence of coronary artery disease in patients with type 2 diabetesmellitus. Cardiovasc. Diabetol. 2015, 14, 107. [CrossRef] [PubMed]

Nutrients 2019, 11, 308 16 of 17
28. Bagheri, B.; Alikhani, A.; Mokhtari, H.; Rasouli, M. The Ratio of Unesterified/esterified Cholesterol is theMajor Determinant of Atherogenicity of Lipoprotein Fractions. Med. Arch. 2018, 72, 103–107. [CrossRef]
29. Westergaard, N.; Madsen, P.; Lundgren, K. Characterization of glycerol uptake and glycerol kinase activityin rat hepatocytes cultured under different hormonal conditions. Biochim. Biophys. Acta 1998, 1402, 261–268.[CrossRef]
30. Thangaraju, M.; Cresci, G.A.; Liu, K.; Ananth, S.; Gnanaprakasam, J.P.; Browning, D.D.; Mellinger, J.D.;Smith, S.B.; Digby, G.J.; Lambert, N.A.; et al. GPR109A is a G-protein-coupled receptor for the bacterialfermentation product butyrate and functions as a tumor suppressor in colon. Cancer Res. 2009, 69, 2826–2832.[CrossRef]
31. Ge, H.; Li, X.; Weiszmann, J.; Wang, P.; Baribault, H.; Chen, J.L.; Tian, H.; Li, Y. Activation of G protein-coupledreceptor 43 in adipocytes leads to inhibition of lipolysis and suppression of plasma free fatty acids.Endocrinology 2008, 149, 4519–4526. [CrossRef]
32. den Besten, G.; Bleeker, A.; Gerding, A.; van Eunen, K.; Havinga, R.; van Dijk, T.H.; Oosterveer, M.H.;Jonker, J.W.; Groen, A.K.; Reijngoud, D.J.; et al. Short-Chain Fatty Acids Protect Against High-FatDiet-Induced Obesity via a PPARgamma-Dependent Switch From Lipogenesis to Fat Oxidation. Diabetes2015, 64, 2398–2408. [CrossRef] [PubMed]
33. Miyoshi, M.; Iizuka, N.; Sakai, S.; Fujiwara, M.; Aoyama-Ishikawa, M.; Maeshige, N.; Hamada, Y.;Takahashi, M.; Usami, M. Oral tributyrin prevents endotoxin-induced lipid metabolism disorder.Clin. Nutr. ESPEN 2015, 10, e83–e88. [CrossRef] [PubMed]
34. Keating, G.M. Fenofibrate: A review of its lipid-modifying effects in dyslipidemia and its vascular effects intype 2 diabetes mellitus. Am. J. Cardiovasc. Drugs 2011, 11, 227–247. [CrossRef] [PubMed]
35. Lebeck, J.; Cheema, M.U.; Skowronski, M.T.; Nielsen, S.; Praetorius, J. Hepatic AQP9 expression in male ratsis reduced in response to PPARalpha agonist treatment. Am. J. Physiol. Gastrointest. Liver Physiol. 2015, 308,G198–G205. [CrossRef] [PubMed]
36. Sadagopan, N.; Li, W.; Roberds, S.L.; Major, T.; Preston, G.M.; Yu, Y.; Tones, M.A. Circulating succinate iselevated in rodent models of hypertension and metabolic disease. Am. J. Hypertens. 2007, 20, 1209–1215.[CrossRef] [PubMed]
37. Toma, I.; Kang, J.J.; Sipos, A.; Vargas, S.; Bansal, E.; Hanner, F.; Meer, E.; Peti-Peterdi, J. Succinate receptorGPR91 provides a direct link between high glucose levels and renin release in murine and rabbit kidney.J. Clin. Investig. 2008, 118, 2526–2534. [CrossRef] [PubMed]
38. Vinolo, M.A.R.; Rodrigues, H.G.; Festuccia, W.T.; Crisma, A.R.; Alves, V.S.; Martins, A.R.; Amaral, C.L.;Fiamoncini, J.; Hirabara, S.M.; Sato, F.T.; et al. Tributyrin attenuates obesity-associated inflammation andinsulin resistance in high-fat-fed mice. Am. J. Physiol.-Endocrinol. Metab. 2012, 303, E272–E282. [CrossRef]
39. Su, J.; He, L.; Zhang, N.; Ho, P.C. Evaluation of tributyrin lipid emulsion with affinity to low-densitylipoprotein: Pharmacokinetics in adult male Wistar rats and cellular activity on Caco-2 and HepG2 cell lines.J. Pharmacol. Exp. Ther. 2006, 316, 62–70. [CrossRef]
40. Cani, P.D.; Possemiers, S.; Van de Wiele, T.; Guiot, Y.; Everard, A.; Rottier, O.; Geurts, L.; Naslain, D.;Neyrinck, A.; Lambert, D.M.; et al. Changes in gut microbiota control inflammation in obese mice through amechanism involving GLP-2-driven improvement of gut permeability. Gut 2009, 58, 1091–1103. [CrossRef]
41. Teixeira, T.F.; Souza, N.C.; Chiarello, P.G.; Franceschini, S.C.; Bressan, J.; Ferreira, C.L.; Peluzio Mdo, C.Intestinal permeability parameters in obese patients are correlated with metabolic syndrome risk factors.Clin. Nutr. 2012, 31, 735–740. [CrossRef]
42. Leonel, A.J.; Teixeira, L.G.; Oliveira, R.P.; Santiago, A.F.; Batista, N.V.; Ferreira, T.R.; Santos, R.C.;Cardoso, V.N.; Cara, D.C.; Faria, A.M.; et al. Antioxidative and immunomodulatory effects of tributyrinsupplementation on experimental colitis. Br. J. Nutr. 2013, 109, 1396–1407. [CrossRef] [PubMed]
43. Bosi, E.; Molteni, L.; Radaelli, M.G.; Folini, L.; Fermo, I.; Bazzigaluppi, E.; Piemonti, L.; Pastore, M.R.;Paroni, R. Increased intestinal permeability precedes clinical onset of type 1 diabetes. Diabetologia 2006, 49,2824–2827. [CrossRef] [PubMed]
44. USDA National Nutrient Database_Lard. Available online: https://ndb.nal.usda.gov/ndb/foods/show/635?fgcd=&manu=&lfacet=&format=&count=&max=50&offset=&sort=default&order=asc&qlookup=lard&ds=&qt=&qp=&qa=&qn=&q=&ing= (accessed on 25 January 2018).

Nutrients 2019, 11, 308 17 of 17
45. Mustad, V.A.; Ellsworth, J.L.; Cooper, A.D.; Kris-Etherton, P.M.; Etherton, T.D. Dietary linoleic acid increasesand palmitic acid decreases hepatic LDL receptor protein and mRNA abundance in young pigs. J. Lipid Res.1996, 37, 2310–2323. [PubMed]
46. Berry, S.E. Triacylglycerol structure and interesterification of palmitic and stearic acid-rich fats: An overviewand implications for cardiovascular disease. Nutr. Res. Rev. 2009, 22, 3–17. [CrossRef] [PubMed]
47. Lecerf, J.M.; de Lorgeril, M. Dietary cholesterol: From physiology to cardiovascular risk. Br. J. Nutr. 2011,106, 6–14. [CrossRef]
48. Buettner, R.; Parhofer, K.G.; Woenckhaus, M.; Wrede, C.E.; Kunz-Schughart, L.A.; Scholmerich, J.;Bollheimer, L.C. Defining high-fat-diet rat models: Metabolic and molecular effects of different fat types.J. Mol. Endocrinol. 2006, 36, 485–501. [CrossRef]
49. Carlson, L.A. Nicotinic acid: The broad-spectrum lipid drug. A 50th anniversary review. J. Int. Med. 2005,258, 94–114. [CrossRef]
© 2019 by the authors. Licensee MDPI, Basel, Switzerland. This article is an open accessarticle distributed under the terms and conditions of the Creative Commons Attribution(CC BY) license (http://creativecommons.org/licenses/by/4.0/).