monolithic double resonator for quartz enhanced
TRANSCRIPT

HAL Id: hal-03260067https://hal.archives-ouvertes.fr/hal-03260067
Submitted on 14 Jun 2021
HAL is a multi-disciplinary open accessarchive for the deposit and dissemination of sci-entific research documents, whether they are pub-lished or not. The documents may come fromteaching and research institutions in France orabroad, or from public or private research centers.
L’archive ouverte pluridisciplinaire HAL, estdestinée au dépôt et à la diffusion de documentsscientifiques de niveau recherche, publiés ou non,émanant des établissements d’enseignement et derecherche français ou étrangers, des laboratoirespublics ou privés.
Monolithic Double Resonator for Quartz EnhancedPhotoacoustic Spectroscopy
Roman Rousseau, Diba Ayache, Nicolas Maurin, Wioletta Trzpil, MichaëlBahriz, Aurore Vicet
To cite this version:Roman Rousseau, Diba Ayache, Nicolas Maurin, Wioletta Trzpil, Michaël Bahriz, et al.. MonolithicDouble Resonator for Quartz Enhanced Photoacoustic Spectroscopy. Applied Sciences, MDPI, 2021,11 (5), pp.2094. �10.3390/app11052094�. �hal-03260067�

Appl. Sci. 2021, 11, 2094. https://doi.org/10.3390/app11052094 www.mdpi.com/journal/applsci
Article
Monolithic Double Resonator for Quartz Enhanced
Photoacoustic Spectroscopy
Roman Rousseau, Diba Ayache, Nicolas Maurin, Wioletta Trzpil, Michael Bahriz and Aurore Vicet *
IES, University Montpellier, CNRS, 34090 Montpellier, France; [email protected]‐montp2.fr (R.R.);
[email protected]‐montp2.fr (D.A.); [email protected]‐montp2.fr (N.M.);
[email protected]‐montp2.fr (W.T.); [email protected] (M.B.)
* Correspondence: [email protected]
Abstract: A new approach for Quartz Enhanced Photoacoustic Spectroscopy is presented, based on
an acoustic excitation from the outside of the prongs of a quartz tuning fork, to increase the
sensitivity of the sensor. For this purpose, we introduce a monolithic acoustic double‐resonator
(double‐mR) in a T‐shape configuration, using 3D printing. It was modelized and experimentally
characterized using a 1392 nm distributed feedback laser diode, targeting a water vapor absorption
line. The setup showed a two‐factor enhancement of the signal, compared to a classical off‐beam
QEPAS approach and confirmed the strong interest of photolithographic printing techniques for
acoustic developments.
Keywords: photoacoustics; infrared; laser; sensing; QEPAS
1. Introduction
Gas sensing is strongly demanding on sensitive, selective, and efficient techniques, to
be implemented on laboratories experiments, environmental, medical, or industrial pur‐
poses. Since its invention in 2002 [1], Quartz Enhanced Photoacoustic Spectroscopy
(QEPAS) demonstrated many advantages among techniques based on tunable sources
and indirect gas absorption detection.
Photoacoustic spectroscopy relies on light absorption, through a specific gaseous
species, when an absorption line corresponds to the emitted wavelength of a source. The
source can be a laser or a broader source such as a light emitting diode [2]. While the source
intensity is modulated, the light absorption is modulated as well, and gives rise to a
localized sound wave at the modulation frequency. This indirect photonic effect is called
the photoacoustic effect, which has been exploited for years [3], using resonant acoustic
cells and microphones for sound sensing. In QEPAS, the sound wave interacts with a
mechanical transducer (a quartz tuning fork or QTF), leading to a piezoelectric current.
Thanks to the very high quality factor of the QTF (~10,000 at atmospheric pressure), it is
unnecessary to use any resonant acoustic cell, as done in classical microphone
photoacoustics sensing.
In order to enhance the pressure wave amplitude, some small tubes called micro‐
resonators (mR) can be added to the optical setup, leading to two main configurations
(on‐beam/off‐beam). In the on‐beam configuration [4], the resonator tubes are placed on
both sides of the QTF plane, leaving a small air gap (<100 μm) with the QTF prongs. In
the off‐beam configuration [5], the resonator tube is located on one side of the QTF, in the
center alongside the prongs. On‐beam QEPAS exhibits a good signal enhancement factor
of around 30 [6,7], but it requires a stringent optical alignment to avoid photothermal ef‐
fects, due to direct illumination of the QTF. Standard commercial QTF are not adapted to
long wavelength sources such as quantum cascade lasers because of the small gap (0.3
mm) between the prongs, leading to the development of large custom QTF, first for THz
Citation: Rousseau, R.; Ayache, D.;
Maurin, N.; Trzpil, W.; Bahriz, M.;
Vicet, A. Monolithic Double
Resonator for Quartz Enhanced
Photoacoustic Spectroscopy. Appl.
Sci. 2021, 11, 2094.
https://doi.org/10.3390/app11052094
Academic Editor: Bernhard Wilhelm
Roth
Received: 27 January 2021
Accepted: 23 February 2021
Published: 26 February 2021
Publisher’s Note: MDPI stays
neutral with regard to jurisdictional
claims in published maps and
institutional affiliations.
Copyright: © 2021 by the authors.
Licensee MDPI, Basel, Switzerland.
This article is an open access article
distributed under the terms and
conditions of the Creative Commons
Attribution (CC BY) license
(http://creativecommons.org/licenses
/by/4.0/).

Appl. Sci. 2021, 11, 2094 2 of 9
sensing [8,9], and their successful use in several applications. Despite a smaller signal
enhancement, the off‐beam configuration reduces optical constraints, gives more
flexibility to the setup developments, and can be competitive in terms of sensitivity with
on‐beam QEPAS. This configuration was studied theoretically [10] and successfully
implemented in molecular spectroscopy, for many purposes [11–15].
The two QTF prongs move symmetrically and are best coupled with a cylindrical
acoustic wave, when the longitudinal axis of the wave is located in between the two
prongs. Both on‐beam and off‐beam satisfy this condition—one acoustic source
symmetrically acting on the inner surface of both prongs. Alternatively, the QTF can be
excited by applying a force on the external surface of both prongs, but it requires two
acoustic sources. We rethought the design of the spectrophone to be able to excite the
QTF from the outside of the two prongs.
A comparable approach was realized at the same time by Hu and Al [16,17]. This
design was based on a QTF‐embedded, double‐pass, off‐beam spectrophone. Similar to
the original off‐beam mR [5], the spectrophone is made of two cylindrical mRs with a slit
in the center. The QTF is embedded in the mRs, the slit is large enough to partly immerse
the QTF prong inside the mR cavity. In this configuration, two acoustic sources (from the
two mRs) were employed to excite the external surfaces of the prongs.
The novelty of our approach relied on a monolithic double‐resonator (double mR) in
a T‐shape configuration, 3D‐printed (stereolithography = SLA) characterized, and
modelized, thanks to our experience on single resonator evaluation [15]. In this paper, we
pre‐sent this new configuration, its design, characterization, and evaluation, using an
open‐air QEPAS configuration dedicated to ambient water vapor sensing with a 1392 nm
DFB laser.
2. Experimental Setup
The QEPAS spectrophone was designed to excite the QTF from the outside of the
prongs. We used two off‐beam mRs placed in a mirror symmetry and the QTF located in
between (Figure 1). The optical path was more complex, compared to a classical off‐beam
QEPAS approach. The laser beam went through one microresonator (mR 1), underwent
two right angle reflections that brought it parallel to the incoming beam with a lateral shift
(δ), and finally crossed the other microresonator (mR 2).
In this configuration, one could consider two acoustic sources photogenerated with
the same laser. In order to maximize the excitation of the QTF, the two acoustic sources
must be in‐phase. Considering two identical mRs and two identical mR‐QTF gaps, the
phase shift Δφ between the two acoustic sources could be calculated with the optical
path difference ΔL, between the two mRs:
Δφ = kL = 1.3 ∙ 10‐5 rad (1)
With k as the wave vector, ΔL = 2.2 cm (2LmR + δ the optical path between the 2 mRs).
The phase shift was negligible; therefore, the 2 mRs were considered to be acoustically in
phase.
The dimensions of the monolithic double mR were chosen, after the characterization
of several individual mR. A set of many different mR with various dimensions, fabricated
from aluminum micromachined blocks, were characterized following the setup described
in [15]. We chose a large main hole (RmR = 0.5 mm) to help the alignment process. The
acoustic response of these individual mRs was studied using a photoacoustic signal
generated by the absorption of a water line of a 1392 nm single frequency laser
(https://eblanaphotonics.com/ (accessed on 02/26/21)). The laser was fully characterized,
as shown in Figure 2.
The target H2O line had a line strength of 1.5 × 10⁻²⁰ cm−1/(molecule × cm−2), centered
in 1392.54 nm (7181.18 cm−1). The amplitude of acoustic wave, based on a given ambient
water absorption (absolute humidity ~1% in volume ratio), corresponded to an optical

Appl. Sci. 2021, 11, 2094 3 of 9
absorption coefficient of 1.15 × 10⁻² cm−1, which was relatively high, as compared to
standard gas sensor experiments, but convenient for making a proof of concept.
Figure 1. (a) Optical QEPAS setup of the double microresonator (double mR) with the 2 right angle mirrors and the QTF
position. (b) Picture of the setup. (c) Picture of the complete bench, including the laser, the focusing lens, and QEPAS
spectrophone.
Figure 2. Characteristics of the EBLANA 1392 nm DFB laser. (a) LIV curves and (b) 1f‐QEPAS response in an off‐beam
configuration with a single microresonator. The spikes at higher currents were due to insignificant experimental artefacts.
The QEPAS response was obtained for a laser temperature of 28 °C and ambient humidity of 50% RH.

Appl. Sci. 2021, 11, 2094 4 of 9
We used a standard MEMS microphone (Knowles SPU0410LR5H‐QB) to record the
frequency response of the resonators [15]. These characterizations were conducted using
mRs with lengths around λ/2 for a 215 Hz acoustic wave, adjusted to the theoretical QTF
resonant frequency. The best frequency‐adjusted response was obtained for a length be‐
tween 5 and 5.5 mm (Figure 3). We also fabricated 3D stereolithography printed mRs and
noticed that changing the material did not modify the resonant properties—the quality
factor (Q = 9 for ref a9) and the resonant frequency remained the same. Following these
results, we decided to choose LmR = 5.3 mm to fit as properly as possible to the QTF resonant
frequency.
Figure 3. (a) Sectional view and dimensions of 3 mRs a7, a8, and a9, sharing the same radius and different length. r0 = 0.25
mm, t0 = 0.3 mm. (b) Normalized experimental acoustic resonance of the 3 resonators.
In this double mR configuration, the two individual mRs were uncoupled, the
acoustic wave was mainly confined in the main tube. Its amplitude quickly decreased out
of the T tube, as can be seen in Figure 4. To evaluate the normalized sound distribution
inside and outside the mRs, a thermo‐acoustic frequency analysis of the pressure wave
was realized by the finite element method (COMSOL). As predicted by analytical
approaches [10,15], the wave was not entirely confined into the tube—about 30% of the
total pressure extended outside due to the open ends effect and because of the T‐shape.
Figure 4. (a) Detailed dimensions of the monolithic double mR. The laser beam is represented in red. It is reflected by the
right angle mirrors. (b) Normalized acoustic pressure generated into the double mR for f = 32,815 Hz, corresponding to
the QTF resonant frequency.
a7 a8 a9
RmR (mm) 0.5 0.5 0.5
LmR (mm) 5 5.5 6
a)
b)
QTF
mR 1 mR 21
0
0.5
1.6 mm
2.2 mm 1 mm
mR 2mR 1
⏀ 0.5 mm
5.3 m
m
QTF
y
x
a) b)

Appl. Sci. 2021, 11, 2094 5 of 9
The two mRs were accurately pre‐positioned thanks to the monolithic design. They
were spaced with a distance equal to the width of the QTF, plus an ideal gap of 70 μm on
each side [15]. The two mirrors were glued onto a plate, thus setting an angle of 90° be‐
tween the two reflective surfaces. The back plate slid along a shoulder in the back of the
holder. Therefore, the two mirrors could be translated in the x direction, offering a simple
mean of adjusting the distance between the in/out beams.
The setup was pre‐aligned using a red laser. The visible laser was positioned instead
of the IR laser and sent to mR 1. The mirrors were translated until the exiting beam
consistently crossed mR 2. Next, the red laser was replaced by the IR laser and a focusing
lens (f = 4 mm, Thorlabs C036TME‐D). A power meter was used to monitor the output
power. The exiting beam was sent to the power meter by using a tiny flat mirror, without
cutting the incoming beam. The beam had to cross the 2 mRs without impinging their wall,
meaning the beam size width had to be smaller than the mR radius over a distance ΔL
equal to 2.2 cm. The laser was positioned about 20 cm far from the spectrophone to obtain
a slowly converging beam. Using Gaussian optics and considering a beam waist of 1
μm at the laser output and the given lens, it could be shown that the laser beam could
cross the double mR without any reflection. Approximately half of the initial optical power
was measured at the output. This value could be mainly explained by the contribution of
direct absorption by ambient water vapor (for a path length of 25 cm, and 50% RH, the
power loss reached 36%). The remaining losses could come from reflections on the
aluminum mirrors. An xyz translation stage was used to accurately position the QTF in
between the mRs. The QTF resonance was measured by means of electronic excitation
and used as a control signal during the descent inside the monolithic double mR setup.
This continuous control technique was necessary to prevent the QTF collision and
breakage. The frequency responses of the QTF, free and inside the mR, were compared,
showing a Q factor of 14,140 and 9300, respectively (Figure 5). The Q value decrease (of
about 30%) in this configuration was similar to the off‐beam one. It was mainly due to the
acoustic coupling between the QTF and mR [11]. The large signal offset observed in the
characterization was due to the parallel capacitance of the coaxial cable connecting the
transimpedance amplifier and could be easily suppressed. The parasitic capacitance could
be suppressed by placing the amplifier closer to the QTF.
Figure 5. Frequency response of a QTF in free space (red) and positioned inside the double mR
(black).

Appl. Sci. 2021, 11, 2094 6 of 9
The Q factor was determined through the curve fitting with the Butterworth Von
Dyke model.
3. Experimental Evaluation
The QTF was inserted in between the mRs, and the laser beam crossed the two mRs.
The QEPAS signal was monitored as a function of the QTF position, in the y and z direction
(Figure 6). The signal amplitude directly indicated the double mR‐QTF coupling
efficiency. In the z direction, the response grew significantly when the top of the prongs
arrived in front of the slit and then decreased slowly as the lever became small. The
response versus the y direction exhibited a mirror symmetry with the ordinate axis, and
a maximum when y = 0, when the prong and the mR slit best overlapped.
Figure 6. Evolution of the QEPAS signal when moving the QTF in the z (a) and y (b) direction. (c) Schematic of the mR
and the QTF in the defined referential. The QTF is represented in the (0, 0, 0) position.
After the optimization of the QTF position, we studied the effect of each individual
mR and compared it to the single off‐beam configuration (with a single mR). To this end,
we first measured the QEPAS signal as a function of the mirrors position. The mirrors were
translated in the perpendicular direction with respect to the incoming beam, using a
micrometric translation stage, thus changing the value of δ (Figure 1a). At first, the laser
beam only crossed the mR 1, giving a QEPAS signal maximum of about 20 mV (Figure 7).
When the mirror was translated, the beam crossed the mR 2 and the signal rose to 40 mV,
doubling the initial value of the signal. The signal presented a plateau over 200 μm. The
results could also be presented in terms of the QEPAS signal versus the laser current, with
the typical 1f signal shape (Figure 7b). We added the signal obtained with the
conventional off‐beam, whose amplitude was about 30 mV. The amplitude difference
between the off‐beam and the misaligned monolithic double mR setup was associated
with the mR resonance. In the off‐beam configuration, the slit was considered almost open
while in the double mR configuration, the slit should be considered as almost closed,
thus changing the acoustic resonant frequency.
Appl. Sci. 2021, 11, 2094 7 of 9
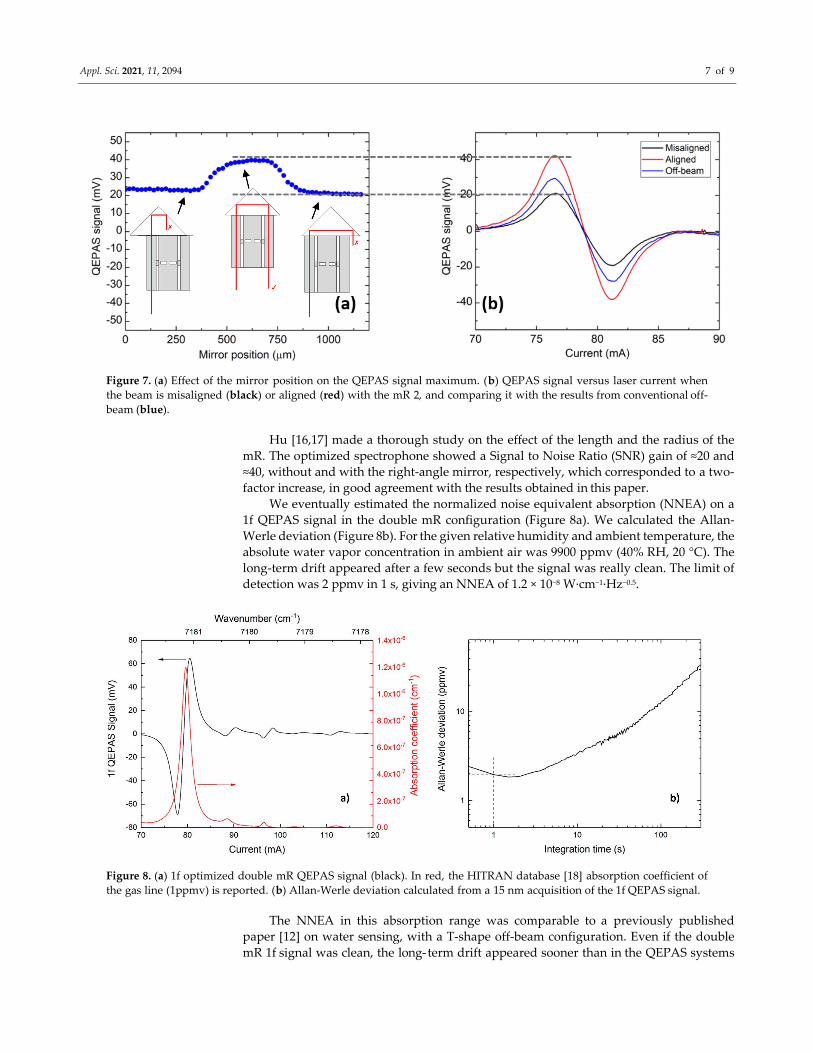
Figure 7. (a) Effect of the mirror position on the QEPAS signal maximum. (b) QEPAS signal versus laser current when
the beam is misaligned (black) or aligned (red) with the mR 2, and comparing it with the results from conventional off‐
beam (blue).
Hu [16,17] made a thorough study on the effect of the length and the radius of the
mR. The optimized spectrophone showed a Signal to Noise Ratio (SNR) gain of ≈20 and
≈40, without and with the right‐angle mirror, respectively, which corresponded to a two‐
factor increase, in good agreement with the results obtained in this paper.
We eventually estimated the normalized noise equivalent absorption (NNEA) on a
1f QEPAS signal in the double mR configuration (Figure 8a). We calculated the Allan‐
Werle deviation (Figure 8b). For the given relative humidity and ambient temperature, the
absolute water vapor concentration in ambient air was 9900 ppmv (40% RH, 20 °C). The
long‐term drift appeared after a few seconds but the signal was really clean. The limit of
detection was 2 ppmv in 1 s, giving an NNEA of 1.2 × 10⁻⁸ W∙cm−1∙Hz−0.5.
Figure 8. (a) 1f optimized double mR QEPAS signal (black). In red, the HITRAN database [18] absorption coefficient of
the gas line (1ppmv) is reported. (b) Allan‐Werle deviation calculated from a 15 nm acquisition of the 1f QEPAS signal.
The NNEA in this absorption range was comparable to a previously published
paper [12] on water sensing, with a T‐shape off‐beam configuration. Even if the double
mR 1f signal was clean, the long‐ term drift appeared sooner than in the QEPAS systems

Appl. Sci. 2021, 11, 2094 8 of 9
using closed cells. This value might be improved using a more stable configuration, with
an enclosed gas cell.
4. Conclusions
A novel design was proposed, using 2 mRs in a monolithic setup, to increase the
acoustic pressure actuating on the two external sides of QTF prongs. The double mR
was 3D printed, showing the ability and flexibility of the stereolithography method in
printing small and complex parts.
While off‐beam configuration might be less sensitive than on‐beam, its advantages
on the laser beam alignment and physics phenomena decoupling, offers many interests.
The double mR spectrophone combine these advantages with a better acoustic excitation,
thus, there is an increased value of the QEPAS signal. The strength of the double mR
method relies on the large enhancement of the mR and QTF coupling. The surface of the
prong was normal to the wave propagation direction, thus the acoustic pressure
efficiently actuated the QTF. The weakness of the technique was the sensitivity to the QTF
positioning, compared to the conventional off‐beam. However, the required spatial
accuracy (10–30 μm) was definitely reachable, using micropositioners.
The gap between the 2 mRs was adjusted at the printing level, simplifying the process
of the QTF positioning. An enhancement could be obtained by adjusting the mRs
dimensions to better fit the QTF frequency. It would be interesting to evaluate the use of
custom QTF [9,19] specifically developed to enhance coupling due to an external prong
excitation. Finally, the high‐resolution 3D‐printing should be considered in the design of
acoustic resonant cells, such as Helmholtz configurations coupled with mechanical
resonators.
Author Contributions: R.R. was in charge of the methodology, the software, and the investigation,
under the supervision of A.V. He was assisted by D.A., N.M., and W.T. for data curation. The
article was written by R.R. and A.V., reviewed and edited by M.B. and A.V. All authors have read
and agreed to the published version of the manuscript.
Funding: This research was funded by ANR MULTIPAS project (ANR‐16‐CE04‐0012). It was
partially supported by the French “Investment for the Future” program: EquipEx EXTRA, (ANR‐
11‐EQPX‐0016) and Montpellier University MUSE SENSIR project (ANR‐16‐IDEX‐0006).
Informed Consent Statement: Not applicable
Institutional Review Board Statement: Not applicable
Conflicts of Interest: The authors declare no conflict of interest.
References
1. Kosterev, A.A.; Bakhirkin, Y.A.; Curl, R.F.; Tittel, F.K. Quartz‐enhanced photoacoustic spectroscopy. Opt. Lett. 2002, 27, 1902–
1904, doi:10.1364/OL.27.001902.
2. Köhring, M.; Böttger, S.; Willer, U.; Schade, W. LED‐absorption‐QEPAS sensor for biogas plants. Sensors 2015, 15, 12092–12102,
doi:10.3390/s150512092.
3. Palzer, S. Photoacoustic‐based gas sensing: A review. Sensors 2020, 20, 2745, doi:10.3390/s20092745.
4. Weidmann, D.; Kosterev, A.A.; Tittel, F.K.; Ryan, N.; McDonald, D. Application of a widely electrically tunable diode laserto
chemical gas sensing with quartz‐enhanced photoacoustic spectroscopy. Opt. Lett. 2004, 29, 1837–1839,
doi:10.1364/OL.29.001837.
5. Liu, K.; Guo, X.; Yi, H.; Chen, W.; Zhang, W.; Gao, X. Off‐beam quartz‐enhanced photoacoustic spectroscopy. Opt. Lett. 2009,
34, 1594–1596, doi:10.1364/OL.34.001594.
6. Dong, L.; Kosterev, A.A.; Thomazy, D.; Tittel, F.K. QEPAS spectrophones: Design, optimization, and performance. Appl. Phys.
B 2010, 100, 627–635, doi:10.1007/s00340‐010‐4072‐0.
7. Yi, H.; Chen, W.; Guo, X.; Sun, S.; Liu, K.; Tan, T.; Zhang, W.; Gao, X. An acoustic model for microresonator in on‐beam quartz‐
enhanced photoacoustic spectroscopy. Appl. Phys. B 2012, 108, 361–367, doi:10.1007/s00340‐012‐4988‐7.
8. Borri, S.; Patimisco, P.; Sampaolo, A.; Beere H.E.; Ritchie, D.A.; Vitiello, M.S.; Scamarcio, G.; Spagnolo, V. Terahertz quartz
enhanced photo‐acoustic sensor. Appl. Phys. Lett. 2013, 103, 021105, doi:10.1063/1.4812438.
9. Patimisco, P.; Sampaolo, A.; Zheng, H.; Dong, L.; Tittel, F.K.; Spagnolo, V. Quartz–enhanced photoacoustic spectrophones
exploiting custom tuning forks: A review. Adv. Phys. X 2017, 2, 169–187, doi:10.1080/23746149.2016.1271285.

Appl. Sci. 2021, 11, 2094 9 of 9
10. Yi, H.; Liu, K.; Sun, S.; Zhang, W.; Gao, X. Theoretical analysis of off beam quartz‐enhanced photoacoustic spectroscopy sensor.
Opt. Commun. 2012, 285, 5306–5312, doi:10.1016/j.optcom.2012.07.056.
11. Liu, K.; Yi, H.; Kosterev, A.A.; Chen, W.; Dong, L.; Wang, L.; Tan, T.; Zhang, W.; Tittel, F.K.; Gao, X. Trace gas detection based
on off‐beam quartz enhanced photoacoustic spectroscopy: Optimization and performance evaluation. Rev. Sci. Instrum. 2010,
81, 103103, doi:10.1063/1.3480553.
12. Yi, H.; Chen, W.; Sun, S.; Liu, K.; Tan, T.; Gao, X. T‐shape microresonator‐based high sensitivity quartz‐enhanced photoacoustic
spectroscopy sensor. Opt. Express 2012, 20, 9187–9196, doi:10.1364/OE.20.009187.
13. Rück, T.; Bierl, R.; Matysik, F. NO2 trace gas monitoring in air using off‐beam quartz enhanced photoacoustic spectroscopy
(QEPAS ) and interference studies towards CO2 , H2O and acoustic noise. Sens. Actuators B Chem. 2018, 255, 2462–2471,
doi:10.1016/j.snb.2017.09.039.
14. Maurin, N.; Rousseau, R.; Trzpil, W.; Aoust, G.; Hayot, M.; Mercier, J.; Bahriz, M.; Gouzi, F.; Vicet, A. First clinical evalua‐tion
of a quartz enhanced photo‐acoustic CO sensor for human breath analysis. Sens. Actuators B Chem. 2020, 128247,
doi:10.1016/j.snb.2020.128247.
15. Rousseau, R.; Loghmari, Z.; Bahriz, M.; Chamassi, K.; Teissier, R.; Baranov, A.N.; Vicet, A.Off‐beam QEPAS sensor using an 11‐
μm DFB‐QCL with an optimized acoustic resonator. Opt. Express 2019, 27, 7435–7446, doi:10.1364/OE.27.007435.
16. Hu, L.; Zheng, C.; Zheng, J.; Wang, Y.; Tittel, F.K. Quartz tuning fork embedded off‐beam quartz‐enhanced photoacoustic
spectroscopy. Opt. Lett. 2019, 44, 2562, doi:10.1364/OL.44.002562.
17. Hu, L.; Zheng, C.; Zhang, M.; Yao, D.; Zheng, J.; Zhang, Y.; Wang, Y.; Tittel, F.K. Quartz‐enhanced photoacoustic spectroscopic
methane sensor system using a quartz tuning fork‐embedded, double‐pass and off‐beam configuration. Photoacoustics 2020,
100174, doi:10.1016/j.pacs.2020.100174.
18. Gordon, I.E.; Rothman, L.S.; Hill, C.; Kochanov, R.V.; Tan, Y.; Bernath, P.F.; Zak, E.J. The HITRAN2016 molecular spectroscopic
database. J. Quant. Spectrosc. Radiat. Transf. 2017, 203, 3–69, doi:10.1016/j.jqsrt.2017.06.038.
19. Duquesnoy, M.; Aoust, G.; Melkonian, J.M.; Lévy, R.; Raybaut, M.; Godard, A. Quartz enhanced photoacoustic spectroscopy
based on a custom quartz tuning fork. Sensors 2019, 19, 1362, doi:10.1080/23746149.2016.1271285.