monopoly slides - department of economics
TRANSCRIPT

Market Structure and Borrower Welfare in Microfinance
Jon de Quidt, Thiemo Fetzer & Maitreesh Ghatak
London School of Economics
Shanghai, December, 2013
Maitreesh Ghatak (LSE) Market Structure & Borrower Welfare Shanghai, December, 2013 1 / 64

Commercialization has been a terrible wrong turn formicrofinance, and it indicates a worrying “mission drift” in themotivation of those lending to the poor. Poverty should beeradicated, not seen as a money-making opportunity.
Muhammad Yunus in NYT, January 2011
Maitreesh Ghatak (LSE) Market Structure & Borrower Welfare Shanghai, December, 2013 2 / 64

Three Stylized Facts
Fact 1
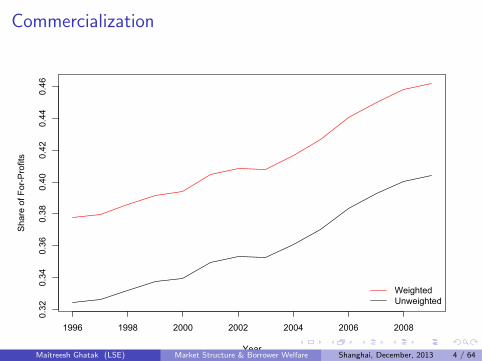
There has been a steady increase in the market share of for-profitlenders.
From the cross-section of 1,106 MFIs that reported to the MIXMarket dataset in 2009, this rises from 32 percent of institutions (38percent of loans) in 1996, to 39 percent of institutions (46 percent ofloans) in 2009.
”Unweighted” counts the number of institutions in existence at agiven date, ”weighted” weights institutions by size, measured asnumber of loans outstanding in 2009.
Maitreesh Ghatak (LSE) Market Structure & Borrower Welfare Shanghai, December, 2013 3 / 64
Commercialization
1996 1998 2000 2002 2004 2006 2008
0.32
0.34
0.36
0.38
0.40
0.42
0.44
0.46
Year
Sha
re o
f For
-Pro
fits
WeightedUnweighted
Maitreesh Ghatak (LSE) Market Structure & Borrower Welfare Shanghai, December, 2013 4 / 64

Three Stylized Facts
Fact 2
Non-profit lenders are more likely to use group-based lending methodsthan for-profit lenders.
In our full sample of 712 MFIs with both legal status and lendingmethodology data for 2009, the mean share of ”solidarity group”loans for non-profits is 37 percent, while for for-profits it is 34 percent.
Maitreesh Ghatak (LSE) Market Structure & Borrower Welfare Shanghai, December, 2013 5 / 64
Three Stylized Facts
Fact 3
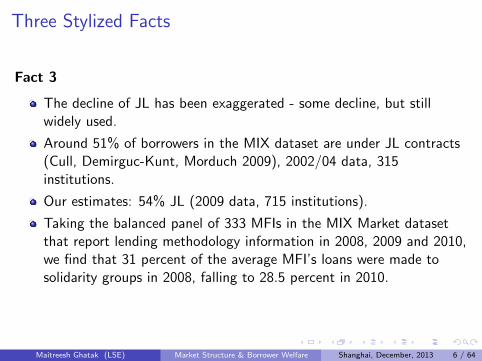
The decline of JL has been exaggerated - some decline, but stillwidely used.
Around 51% of borrowers in the MIX dataset are under JL contracts(Cull, Demirguc-Kunt, Morduch 2009), 2002/04 data, 315institutions.
Our estimates: 54% JL (2009 data, 715 institutions).
Taking the balanced panel of 333 MFIs in the MIX Market datasetthat report lending methodology information in 2008, 2009 and 2010,we find that 31 percent of the average MFI’s loans were made tosolidarity groups in 2008, falling to 28.5 percent in 2010.
Maitreesh Ghatak (LSE) Market Structure & Borrower Welfare Shanghai, December, 2013 6 / 64

Decline of Joint Liability0.25
0.35
0.45
0.55
Year
Sol
idar
ity G
roup
Sha
re
unweightedweightedweighted without outliers
2008 2009 2010
Maitreesh Ghatak (LSE) Market Structure & Borrower Welfare Shanghai, December, 2013 7 / 64

Use the measure ”Solidarity Group Share” which is the ratio of eachlender’s number of solidarity group loans to solidarity group andindividual loans.
Then compute the mean of this measure across all MFIs to find theaverage solidarity group share (”unweighted”).
Compute the weighted mean (by number of loans outstanding) tofind the share of JL in all loans, with/without two outliers.
Two very large lenders (BRAC in Bangladesh and Bandhan in India)switched from solidarity group to individual in 2009.
Further discussion
Maitreesh Ghatak (LSE) Market Structure & Borrower Welfare Shanghai, December, 2013 8 / 64

For-profit lending on the backs of the poor?
Need to understand better these trends and their inter-connections
Yunus quote reflects concern about commercialization and abuse ofmarket power in microfinance. Through shift from non-profit tofor-profit, microcredit “[gave] rise to its own breed of loan sharks.”.
Some MFIs are alleged to be profiteering at the expense of poorborrowers, attracted by the high repayment rates, and charging veryhigh interest rates which seemingly contradicts the original purpose ofthe MFI
From its mission-oriented, not-for-profit roots, microfinance nowattracts large scale private investment through venture capital, largeinvestment vehicles, IPOs (e.g. SKS India, Compartamos Mexico,LAPO Nigeria).
Maitreesh Ghatak (LSE) Market Structure & Borrower Welfare Shanghai, December, 2013 9 / 64

Market power
In India, the five biggest MFIs account for more than 50% of themarket. Globally, market concentration varies widely (Baquero et al.,2012).
Anecdotal evidence suggests existence of market power Anecdotal evidence
This paper shows that commercialization and presence of marketpower could explain particular resistance to JL on the part ofborrowers, and also, reluctance to use it on the part of lenders
Maitreesh Ghatak (LSE) Market Structure & Borrower Welfare Shanghai, December, 2013 10 / 64

This paper
This papercompares for-profit or commercial lending in microfinance,with and without market power, to a benevolent non-profitmaximizing borrower welfare subject to a break-even constraint.
Two points of departure from the existing literature where
I Lenders are assumed to be a benevolent non-profit who try tomaximize borrower welfare subject to some break even constraint;
I A partial equilibrium framework that focuses on one MFI and a givenset of borrowers
Maitreesh Ghatak (LSE) Market Structure & Borrower Welfare Shanghai, December, 2013 11 / 64

This paper
Majority of work on microfinance looks at repayment rates
For welfare judgement, this assumes zero-profit lending: borrowers getall the surplus, and so repayment rates are sufficient.
Naturally, the size and allocation of this surplus depends on lendermotivation and information structure.
Interest rates, type of loan, and degree of rationing matter forborrower welfare as well.
Need to go beyond partial equilibrium
Part of a broader agenda: don’t just focus on contracts, look at themarket/institutional environment in it operates (as in Besley.Burchardi, and Ghatak, 2012)
Maitreesh Ghatak (LSE) Market Structure & Borrower Welfare Shanghai, December, 2013 12 / 64

This paper
Much of the microfinance literature has shown how joint liabilitylending can be used by MFIs to leverage borrowers’ social capital andlocal information in order to lend to otherwise unbankable customersand increase their welfare.
Using a simple, tractable model we show that when the lender is afor-profit with market power he can instead leverage these to extracthigher rents at the borrowers’ expense.
In particular, borrowers with more social capital may be worse offthan those with less.
However, given that borrowers are credit constrained and have veryfew outside options, they are better off borrowing than not borrowing,and they are better off borrowing under joint liability (when thelender chooses to use it) than under individual liability.
Maitreesh Ghatak (LSE) Market Structure & Borrower Welfare Shanghai, December, 2013 13 / 64
This paper
We then show that competition between for-profit lenders can closedown this channel, but has an ambiguous effect on borrower welfareas competition undermines borrowers’ incentives to repay their loansand thus leads to credit rationing.
One of the interesting trade-offs that emerges therefore is that of rentextraction under monopoly with the enforcement externality undercompetition.
Maitreesh Ghatak (LSE) Market Structure & Borrower Welfare Shanghai, December, 2013 14 / 64

This paper
We show that for-profit lenders - both with and without market power- inefficiently under-use joint liability relative to the altruisticnon-profit benchmark.
Since joint liability is associated with tighter repayment incentiveconstraints (because larger amounts are due, when a group member isunable to pay her loan), it is relatively less attractive to for-profitlenders.
This suggests that the apparent decline in the use of joint liabilityloans relative to individual liability loans may indeed be related tochanges in market structure, e.g., increasing commercialization.
Maitreesh Ghatak (LSE) Market Structure & Borrower Welfare Shanghai, December, 2013 15 / 64

Preview - Simulation
We simulate the model using empirical estimates of the parameters. Thisis also part of a broader agenda: trying to bridge theory and policythrough quantitative analysis. Results:
We expected that inefficient contract choice and exploitation of socialcapital by monopolists would have large effects on borrower welfare.
Turns out this effect is relatively modest - forcing the lender to switchfrom IL to JL increases borrower welfare by 12%-20%.
In contrast, switching to a non-profit lender increases borrowerwelfare by 54%-73%, mostly through lower interest rates.
Despite credit rationing, competition achieves similar borrower welfareto non-profit lending.
Non-profit lenders predicted to always use JL. Competitive lenders ormonopolist only use JL for social capital worth at least 15% of theloan size.
Qualitative results are robust to alternative parameter values.
Maitreesh Ghatak (LSE) Market Structure & Borrower Welfare Shanghai, December, 2013 16 / 64

Literature
Non-contractible output enforcement problem: Bolton & Scharfstein(1990), Besley and Coate (1995), Rai & Sjostrom (2004), Bhole andOgden (2010)
Groups without JL: Rai & Sjostrom (2010), de Quidt, Fetzer andGhatak (2012b).
Social capital: Karlan (2007), Cassar and Wydick (2010), Feigenberg,Field and Pande (2011), Bloch, Genicot and Ray (2008), Greif (1993)
Competition: McIntosh and Wydick (2005), McIntosh, de Janvry andSadoulet (2005), Genicot & Ray (2006), Baquero et al., (2012)
Reviews of the industry: Cull et al. (2009), Cull et al. (2007)
Maitreesh Ghatak (LSE) Market Structure & Borrower Welfare Shanghai, December, 2013 17 / 64

Table of Contents
1 Model
2 Competition
3 Simulation
4 Appendix
Maitreesh Ghatak (LSE) Market Structure & Borrower Welfare Shanghai, December, 2013 17 / 64

Preview - Theory
We take a weak enforcement/ex-post moral hazard setting: JLinduces high social capital borrowers to guarantee one another’sinterest payments, increasing total surplus (Besley and Coate, 1995).
We show once you have relaxed the assumption of perfectlycompetitive lenders or a benevolent non-profit the following happens:
I JL will not necessarily be chosen when it is optimal - it will beunder-used by for-profit lenders
I This can explain its alleged declineI Borrowers with high social capital can be ”exploited” by a lender with
market powerI So some borrowers could be worse off with JL
Competition is no panacea unless lenders can share borrower history -credit rationing will have to be used to give incentives
JL will be under-used relative to non-profits, but not so relative to amonopolist
Maitreesh Ghatak (LSE) Market Structure & Borrower Welfare Shanghai, December, 2013 18 / 64

Model setup
Enforcement problem with limited liability.
Borrowers risk neutral, discount factor δ, no savings. Invest 1,generate independent stochastic output:
Y =
{R p
0 1− p
Lender’s opportunity cost of capital ρ. Opportunity cost of labournormalized to 0. Positive social surplus: pR > ρ.
Gross interest rate r .
V is the continuation value of a lending relationship for the borrower,Π the profits of the lender.
Maitreesh Ghatak (LSE) Market Structure & Borrower Welfare Shanghai, December, 2013 19 / 64

Model setup
Output is not observable to the lender. Borrowers need to be givenrents + dynamic incentives to prevent strategic default.
Unsuccessful borrowers involuntarily default (no savings).
Output is observable to borrowers within a group: potential formutual repayment guarantees backed by social sanctions.
Maitreesh Ghatak (LSE) Market Structure & Borrower Welfare Shanghai, December, 2013 20 / 64

Contracts
Sticking with much of the literature we restrict contractual forms:I Borrowers are either individually or jointly liable.I No partial repayment.I Punishment for default is permanent termination of lending.I JL is a natural contract choice in our simple environment, might not be
in richer settings (Rai & Sjostrom, 2004, 2010, de Quidt et al., 2013)
The lender commits forever to a lending contract specifying arepayment r and JL/IL.
JL groups are two borrowers, both terminated unless repayment is 2r .
Maitreesh Ghatak (LSE) Market Structure & Borrower Welfare Shanghai, December, 2013 21 / 64

Social Capital
Social capital is the discounted lifetime utility “S” that a friend orpartner can credibly threaten to destroy as a “social sanction”.
S can also be a non-pecuniary cost a friend or partner can impose onyou
S is pair-specific (bilateral) but could have many friends (parallel).Each friendship is worth S to both (symmetric).
Friends are valued additively, worth∑n
i=1 Si .
Can model S as generated from a repeated “social game” with someinteresting implications, explored in other work. Formalization of S
Alternative models: social ostracism (Greif, 1993); network-basedapproach (Bloch, Genicot & Ray, 2008); reputation (Guttman, 2010)
Maitreesh Ghatak (LSE) Market Structure & Borrower Welfare Shanghai, December, 2013 22 / 64

Loan Repayment
Borrowers play a simultaneous-move “repayment game” each period.
Borrowers agree amongst themselves a repayment rule, specifyingrepayments in each state, enforced by social sanctions.
Some examples:I Repay r whenever own output is R, nothing otherwise.I Repay 2r in state (R, 0), r in (R,R), 0 in (0,R) or (0, 0).I Default in all states.
Any deviation from the agreed rule is punished by destruction of S .
For simplicity, focus on symmetric, stationary, jointwelfare-maximizing equilibria.
Maitreesh Ghatak (LSE) Market Structure & Borrower Welfare Shanghai, December, 2013 23 / 64

Constraints on the lender
Limited Liability Constraint (LLC): The largest required repaymentmust be feasible given limited liability. For simplicity, we assumeparameters such that this is slack (δp ≤ 1
2).
If π is the repayment probability, then V = pR−πr1−δπ
Incentive Constraint 1 (IC1) : R ≤ R −r IL + δV IL
The continuation value for a representative borrower (δV ) mustexceed the interest payment (r).
Otherwise all borrowers, individual or group, default immediately.
Borrowers cannot be made worse off than if they took one loan anddefaulted
Maitreesh Ghatak (LSE) Market Structure & Borrower Welfare Shanghai, December, 2013 24 / 64

Constraints on the lender
It turns out this constraint is identical for any contract with strictdynamic incentives
Using the value of V under IL we get:
r ≤ δpR ≡ rIC1
Maitreesh Ghatak (LSE) Market Structure & Borrower Welfare Shanghai, December, 2013 25 / 64

Constraints on the lender
Incentive Constraint 2 (IC2): under JL, borrowers sometimes haveto repay 2r . This must be incentive compatible, given S .
IC2: 2rJL ≤ δ(V JL + S).
Let repayment probability under JL be q
Continuation value of borrower under JL (with repayment probabilityq)
V JL =pR − qrJL
1− δq
Maitreesh Ghatak (LSE) Market Structure & Borrower Welfare Shanghai, December, 2013 26 / 64

Timing
Period zero:
1 Lender observes S and makes a take-it-or-leave-it contract offer
2 Borrowers agree a repayment rule.
Then, each period
1 Loans disbursed and output realisations observed by the borrowers.
2 Repayment game.
3 Conditional on repayment, contracts renewed and/or social sanctionscarried out.
Maitreesh Ghatak (LSE) Market Structure & Borrower Welfare Shanghai, December, 2013 27 / 64

Individual Liability
Suppose the borrower repays whenever successful:
V IL = p(R − r IL) + δpV IL
=p(R − r IL)
1− δp.
IC1: r IL ≤ δV
Implies r IL ≤ δpR ≡ rIC1
Maitreesh Ghatak (LSE) Market Structure & Borrower Welfare Shanghai, December, 2013 28 / 64

Individual Liability
Zero profit condition: r IL = ρp .
IL is usable if it earns non-negative profits, i.e. prIC1 ≥ ρ.
We assume this condition holds strictly:
Assumption
δp2R > ρ
Maitreesh Ghatak (LSE) Market Structure & Borrower Welfare Shanghai, December, 2013 29 / 64

Joint Liability
Borrowers must repay 2r whenever at least one succeeds.
Repayment probability is 1− (1− p)2 = p(2− p). Define:
q ≡ p(2− p)
Both loans are repaid and contracts renewed with probability q so:
V JL =pR − qrJL
1− δq
Maitreesh Ghatak (LSE) Market Structure & Borrower Welfare Shanghai, December, 2013 30 / 64

Joint Liability
IC1: r ≤ rIC1 = δpR
IC2: 2rJL ≤ δ(V JL + S).
Define the interest rate at which IC2 binds as:
rIC2(S) ≡ δ[pR + (1− δq)S ]
2− δq
rIC2(S) ≤ rIC1 for S ≤ S ≡ pR.
For S > S , IC1 binds and IC2 no longer relevant.
Maitreesh Ghatak (LSE) Market Structure & Borrower Welfare Shanghai, December, 2013 31 / 64

Interest rates
Maitreesh Ghatak (LSE) Market Structure & Borrower Welfare Shanghai, December, 2013 32 / 64

Joint Liability
JL usable if it earns non-negative profits: requiring qrJL − ρ ≥ 0 or
q min{rIC1, rJLIC2(S)} ≥ ρ
This is satisfied for all S ≥ S
S ≡ max
{0,
(2− δq)ρ− (2− p)δp2R
δq(1− δq)
}.
Maitreesh Ghatak (LSE) Market Structure & Borrower Welfare Shanghai, December, 2013 33 / 64

Nonprofit lender
Nonprofit lender assumed to choose the contract that maximisesborrower utility, subject to a zero profit condition.
r IL =ρ
p> rJL =
ρ
q
V IL =pR − ρ1− δp
< V JL =pR − ρ1− δq
Proposition
Borrowers are strictly better off under JL, so JL is always offered by thenonprofit when S ≥ S .
Constant opportunity cost of capital: the lender serves the wholemarket.
S is not ”used” in equilibrium, so no welfare loss on that count
Maitreesh Ghatak (LSE) Market Structure & Borrower Welfare Shanghai, December, 2013 34 / 64

Monopolist lender
A for-profit monopolist chooses whatever contract and interest ratemaximises profits, subject to the LLC, IC1 and IC.
r IL = rIC1
V IL =p(R − rIC1)
1− δp= pR
rJL(S) = min{rIC1, rJLIC2(S)}
V JL =pR − q min{rIC1, r
JLIC2(S)}
1− δq≥ pR
Observation
The monopolist “exploits” the borrowers’ social capital: rJL is increasingand V JL is decreasing in S for all S ≤ S .
Maitreesh Ghatak (LSE) Market Structure & Borrower Welfare Shanghai, December, 2013 35 / 64

Monopolist lender
One way of viewing this result is that the lender’s motivation mattersmore as the amount of borrower social capital increases, as thedifference between borrower welfare under the nonprofit and for-profitmonopolist increases.
Much of the microfinance literature has shown how different aspectsof MFIs’ lending methodologies can be thought of as leveraging socialcapital and local information among borrowers to address variousasymmetric information or weak enforcement issues where as thisresult shows that this not need be a force for good from theperspective of borrowers
With endogenous social capital, this would lead to decrease
Maitreesh Ghatak (LSE) Market Structure & Borrower Welfare Shanghai, December, 2013 36 / 64

Monopolist lender
Proposition
Even with a monopolist lender who exploits their social capital, borrowersare weakly better off under JL than under simple IL, strictly so for S < S .
“Weakly” follows from the fact that the same IC1 applies to both.“Strictly” when IC2 is tight and the lender needs to give more rentsto the borrowers to incentivise repayment.Under JL, the monopoly interest rate is weakly lower and therepayment/renewal probability strictly higher.For S ≥ S , IC1 binds and borrower welfare is equal to pR under bothIL and JL.Under both contracts, the lender is constrained by IC1: it must beindividually rational to repay a loan, at least when the partner isrepaying - this constraint puts a lower bound on borrower welfare atthe IL levelHowever, compared to a non-profit lender borrowers are worse off,and more so the greater is S
Maitreesh Ghatak (LSE) Market Structure & Borrower Welfare Shanghai, December, 2013 37 / 64

Monopolist Contract Choice
Repayment probability is higher but interest rate weakly lower underJL than under IL.
For simplicity we assume the lender is myopic: maximizes per-periodprofit from each borrower.
Profit with arbitrary repayment probability π:
Π = πr − ρ
As with the non-profit, the lender serves the whole market.
Maitreesh Ghatak (LSE) Market Structure & Borrower Welfare Shanghai, December, 2013 38 / 64
Monopolist Contract Choice
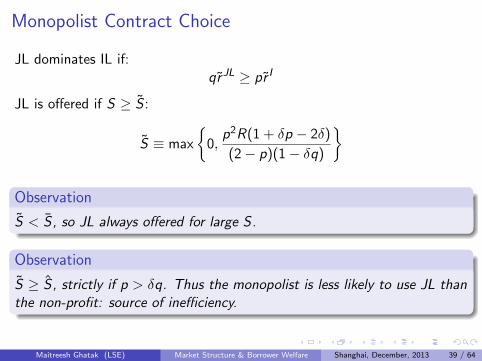
JL dominates IL if:qrJL ≥ pr I
JL is offered if S ≥ S :
S ≡ max
{0,
p2R(1 + δp − 2δ)
(2− p)(1− δq)
}
Observation
S < S , so JL always offered for large S.
Observation
S ≥ S , strictly if p > δq. Thus the monopolist is less likely to use JL thanthe non-profit: source of inefficiency.
Maitreesh Ghatak (LSE) Market Structure & Borrower Welfare Shanghai, December, 2013 39 / 64

Lender profit and borrower utility under IL and JL
Maitreesh Ghatak (LSE) Market Structure & Borrower Welfare Shanghai, December, 2013 40 / 64

Equilibrium profit and borrower utility in red
Maitreesh Ghatak (LSE) Market Structure & Borrower Welfare Shanghai, December, 2013 40 / 64

Intuition
The for-profit monopolist is less willing to offer joint liability loansthan the non-profit, because when social capital is low the need togive borrowers incentives to help one another (IC2) constrains his rentextraction.
Intuitively, the non-profit is willing to offer JL whenever the borrowershave sufficient social capital for JL to break even, while the for-profitmonopolist only offers JL when doing so is more profitable than IL.
This result is consistent with the current debate over the decline ofjoint liability lending in microfinance, which goes hand in hand withincreasing commercialization of microfinance lending.
An analogous result carries over to competitive equilibrium
Maitreesh Ghatak (LSE) Market Structure & Borrower Welfare Shanghai, December, 2013 41 / 64

Policy implication: Interest rate caps
First-order effect of interest rate caps (a key component of the IndianMicrofinance Bill): lower interest rates under both IL and JL,obviously good for the borrowers.
Effect on contract choice: the advantage of IL for the lender is thehigher interest rates. The cap erodes this advantage and may inducean efficient switch to JL.
Therefore, interest rate caps have potential as a tool for borrowerprotection.
Note that in our model the lender always supplies the whole market,ruling out any supply-side effects.
Maitreesh Ghatak (LSE) Market Structure & Borrower Welfare Shanghai, December, 2013 42 / 64

Table of Contents
1 Model
2 Competition
3 Simulation
4 Appendix
Maitreesh Ghatak (LSE) Market Structure & Borrower Welfare Shanghai, December, 2013 42 / 64

Competition
So far, we assumed no competition. Lender is either a non-profit orfor-profit monopolist, serving the whole market.
Hoff & Stiglitz (1997): competition between lenders imposesenforcement externalities. Repayment incentive constraints becometighter.
How does this fit into the benchmark model? Contract choice?Borrower welfare?
Maitreesh Ghatak (LSE) Market Structure & Borrower Welfare Shanghai, December, 2013 43 / 64

Summary of Results
Competition between for-profit lenders closes down the rentextraction channel, but has an ambiguous effect on borrower welfaredue as it undermines borrowers’ incentives to repay their loans andthus leads to credit rationing.
One of the interesting trade-offs that emerges therefore is that of rentextraction under monopoly with the enforcement externality undercompetition.
Even under competition, JL is used less than non-profits but more sothan monopoly for-profit.
Since the termination threat is weaker under competition than with asingle lender, more social capital will be required for lenders to beable to break even in competitive equilibrium than for the non-profitto break even
Maitreesh Ghatak (LSE) Market Structure & Borrower Welfare Shanghai, December, 2013 44 / 64

A simple model of competition
There is a population of size 1 of pairs of borrowers, and size l ofcompetitive lenders.
Each lender can serve exactly 2 IL borrowers or one JL pair.
No information sharing between lenders: a defaulting borrower or paircan go on to borrow from another lender.
Each period, unmatched lenders post contracts, unmatched borrowersare randomly matched to lenders.
Borrowers stay matched until they default, then rejoin the unmatchedpool.
Maitreesh Ghatak (LSE) Market Structure & Borrower Welfare Shanghai, December, 2013 45 / 64

A simple model of competition
Observation
There will always be credit rationing (l < 1) in equilibrium.
If not, unmatched borrowers would rematch immediately - noincentive for borrowers/groups to repay.
Standard efficiency wage argument, a la Shapiro & Stiglitz (1984)
In contrast, our monopolist/nonprofit is able to serve the wholemarket as they are able to fully terminate defaulting borrowers.
Proponents of commercialization argue that access to capital marketswill expand industry scale. We rule this channel out and find anopposing effect - commercialization can lead to more rationing.
Maitreesh Ghatak (LSE) Market Structure & Borrower Welfare Shanghai, December, 2013 46 / 64

Equilibrium contracts
Denote the welfare of an unmatched borrower by U.
If a borrower defaults, she is terminated by her current lender andearns U.
IC1: δ(V − U) ≥ r .
IC2: δ(V + S − U) ≥ 2r .
When S is small, IC2 is relatively tight: market entrants can earnhigher profits under IL than under JL.
Thus for small S , equilibrium contract will be IL.
For large S , equilibrium switches to JL.
Maitreesh Ghatak (LSE) Market Structure & Borrower Welfare Shanghai, December, 2013 47 / 64

Equilibrium market scale
Unmatched borrower welfare U is endogenous: determined by entry ofcompetitive lenders.
For low S , the JL IC2 is tight, this constrains entry, so U is low.
Low U implies that the IL IC1 is slack, so equilibrium is vulnerable toentry by an IL lender.
As S increases, the JL IC2 becomes slacker, permitting entry, until ILis no longer viable.
Maitreesh Ghatak (LSE) Market Structure & Borrower Welfare Shanghai, December, 2013 48 / 64

Maitreesh Ghatak (LSE) Market Structure & Borrower Welfare Shanghai, December, 2013 49 / 64

Summary
The relevant welfare measure (Z ) includes both current borrowers andrationed “unmatched” borrowers.
Increases in market scale relax credit rationing - Z improves as Sincreases.
Proposition
When S is small, and thus market scale is small, total welfare can behigher under monopolistic lending than competitive lending.
Theory detail
Maitreesh Ghatak (LSE) Market Structure & Borrower Welfare Shanghai, December, 2013 50 / 64

Interest rate caps
In the competitive market, lenders earn zero profits so interest ratecaps have less potential to improve borrower welfare and might drivelenders out.
However, since the JL repayment rate is higher, JL interest rates arelower - therefore a cap could force a switch from IL to JL.
Credit rationing will worsen, but welfare can still increase.
Maitreesh Ghatak (LSE) Market Structure & Borrower Welfare Shanghai, December, 2013 51 / 64

Table of Contents
1 Model
2 Competition
3 Simulation
4 Appendix
Maitreesh Ghatak (LSE) Market Structure & Borrower Welfare Shanghai, December, 2013 51 / 64

Simulation
We calibrate the model parameters using simple estimates from theMIXmarket data and other sources. This enables us to plot valuefunctions, interest rates etc.
This enables us to get a sense of the magnitude and relativeimportance of the effects analyzed.
Generalize the model to groups of size 5 (otherwise JL typically neverprofitable - limited liability too tight)
Maitreesh Ghatak (LSE) Market Structure & Borrower Welfare Shanghai, December, 2013 52 / 64

Parameters
p = 0.921: estimated from Portfolio At Risk data, accounting forIL/JL shares in portfolio.
ρ = 1.098: estimated from MIX cost data.
R = 1.737: from de Mel et al. (2008) average returns to investmentof around 1.6, implying pR ≈ 1.6.
δ = 0.864: trickiest one. We take the midpoint of δ impied by USlong run real interest rate and a calibration from MIX interest ratedata.
Detail
Summary Stats
Maitreesh Ghatak (LSE) Market Structure & Borrower Welfare Shanghai, December, 2013 53 / 64

Summary
Abuse of lending methods: forcing the monopolist to use JL whenIL is preferred increases welfare by 12%-20%.
Impact of market power: Switching to a non-profit lender increaseswelfare by 54%-73%, mostly through lower interest rates.
Effect of competition: Despite credit rationing, competitionachieves similar borrower welfare to non-profit lending.
Use of joint liability: Non-profit lenders predicted to always use JL.Competitive lenders or monopolist only use JL for social capital worthat least 15% of the loan size.
Maitreesh Ghatak (LSE) Market Structure & Borrower Welfare Shanghai, December, 2013 54 / 64
Full Sample results
0.0 0.1 0.2 0.3 0.4 0.5
2.0
2.5
3.0
3.5
Social Capital
Bor
row
er W
elfa
re
0.0 0.1 0.2 0.3 0.4 0.5
1.1
1.2
1.3
1.4
1.5
Social Capital
Inte
rest
Rat
es
0.0 0.1 0.2 0.3 0.4 0.5
0.68
0.70
0.72
0.74
0.76
0.78
Social Capital
Mar
ket S
cale
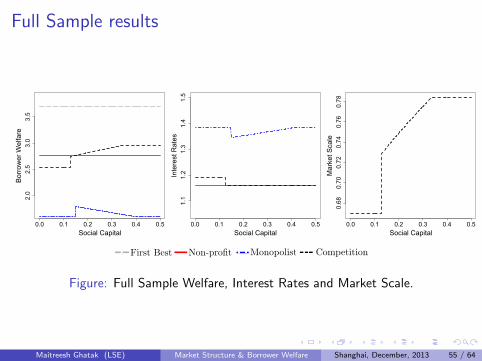
Figure: Full Sample Welfare, Interest Rates and Market Scale.
Maitreesh Ghatak (LSE) Market Structure & Borrower Welfare Shanghai, December, 2013 55 / 64

Basic results: Non-Profit and Monopolist
For the benchmark simulation we obtain the following:
The non-profit lender always offers JL
The for-profit monopolist switches from IL to JL at S = 0.148, i.e.social capital worth 14.8% of the loan size.
IC1 is tighter than the LLC and binds at S = 0.4 or 40% of loan size,above which social capital has no further impact.
The non-profit (break-even) interest rate is 16%.
The for-profit monopolist charges 38% under IL, 35% under JL at Sand 38% under JL at S .
Maitreesh Ghatak (LSE) Market Structure & Borrower Welfare Shanghai, December, 2013 56 / 64

Basic results: Welfare
(Present value of) borrower welfare with the non-profit lender is 2.76
Aggregate welfare under competition varies from 2.54 to 2.95
Under the monopolist, welfare is 1.6 under IL, 1.796 at S and 1.6 atS ≥ S .
Regional Results
Maitreesh Ghatak (LSE) Market Structure & Borrower Welfare Shanghai, December, 2013 57 / 64

Sensitivity
We check sensitivity of the results to varying each parameter in turn.
For simplicity focus on borrower welfare holding S = 0 (since welfareeffect of S relatively modest) and S thresholds.
Qualitative conclusions are generally robust.
Maitreesh Ghatak (LSE) Market Structure & Borrower Welfare Shanghai, December, 2013 58 / 64
Sensitivity
Observation 1: Borrower welfare under monopolist is insensitive asmonopolist extracts part of the surplus gained/lost.
Observation 2: Welfare under competition and non-profit track oneanother quite closely, strengthening the conclusion that non-profit andcompetition have similar performance (i.e. enforcement externality islow).
Observation 3: The S thresholds for competition and the non-profitfollow each other closely and are insensitive to parameter values - theregion of inefficiency is robust.
Maitreesh Ghatak (LSE) Market Structure & Borrower Welfare Shanghai, December, 2013 59 / 64

0.75 0.85 0.95
02
46
810
δ
Bor
row
er W
elfa
re
0.86 0.90 0.94
01
23
p
Bor
row
er W
elfa
re
1.00 1.10 1.20
01
23
4
ρ
Bor
row
er W
elfa
re
1.5 1.6 1.7 1.8 1.9
01
23
45
R
Bor
row
er W
elfa
re
0.75 0.85 0.95δ
Inte
rest
Rat
e1.
201.
301.
401.
50
0.86 0.90 0.94p
Inte
rest
Rat
e1.
201.
301.
40
1.00 1.10 1.20ρ
Inte
rest
Rat
e1.
001.
101.
201.
30
1.5 1.6 1.7 1.8 1.9R
Inte
rest
Rat
e1.
201.
40
0.75 0.85 0.95δ
S th
resh
olds
0.00
0.10
0.20
0.30
0.86 0.90 0.940.0
0.2
0.4
0.6
0.8
1.0
p
S th
resh
olds
1.00 1.10 1.20 1.300.0
0.1
0.2
0.3
0.4
ρ
S th
resh
olds
1.5 1.6 1.7 1.8 1.90.00
0.10
0.20
0.30
R
S th
resh
olds
Figure: Sensitivity Analysis. Vertical lines indicate full sample parameterestimates.

An aside - competition dominates the non-profit?
This result follows from the fact that the non-profit must use stricttermination threats.
Competition process essentially acts as a weaker termination threat -borrowers can reborrow in future. Entry occurs until repaymentconstraint binds.
Nevertheless, competition is inefficient: free entry may not select theoptimal contract from borrowers’ perspective. + credit rationing.
Non-profit can do better using e.g. stochastic termination upondefault.
We work out a simple example. Mech. design approach in Bhole &Ogden (2010). Simulation Results.
Maitreesh Ghatak (LSE) Market Structure & Borrower Welfare Shanghai, December, 2013 61 / 64

Concluding remarks - Summary
The monopolist for-profit lender does exploit the borrowers’ socialcapital and this has economically meaningful effects on interest ratesand welfare.
However, these are substantially smaller than the change in interestrates and welfare when switching to a large non-profit lender -“mission drift” concerns of Muhammad Yunus raised earlier seem tohave some validity
The theoretical welfare effects of competition are ambiguous, due tothe trade-offs between credit rationing, lower interest rates and theability of borrowers to reborrow after an involuntary default.
However, for the parameters estimated from our full sample and mostregions considered, welfare under competition is approximately thesame as under non-profit lending.
Findings corroborate the theoretical prediction that for-profit lendersare less likely to offer JL than the non-profit.
Maitreesh Ghatak (LSE) Market Structure & Borrower Welfare Shanghai, December, 2013 62 / 64

Concluding remarks - Future Directions
In our model there is no multiple borrowing and lenders areconstrained to use dynamic incentives only, no coercion
These are some of the key ingredients of the recent controversies.
The main general argument in favor of non-profits is that becausefinancial incentives are muted, they are less likely to pursue narrowprofit maximization at the expense of other social goals.
This includes not to use harsh loan collection practices
Maitreesh Ghatak (LSE) Market Structure & Borrower Welfare Shanghai, December, 2013 63 / 64

Concluding remarks - Future Directions
For-profits however might be more efficient than non-profits in termsof cutting costs of operations, being able to raise capital, andreaching out to more borrowers - but less likely to reach out to poorerborrowers whose projects may have lower financial returns, but highsocial ones
In our set up non-profit is effectively a social planner - in ongoingwork we study organizational issues that would create a genuinetrade-off between non-profit and for-profit status (e.g. Glaeser &Shleifer, 2001).
As interest rates are observable but coercion less so, a cost-qualitylike trade off could arise
Maitreesh Ghatak (LSE) Market Structure & Borrower Welfare Shanghai, December, 2013 64 / 64

Table of Contents
1 Model
2 Competition
3 Simulation
4 Appendix
Maitreesh Ghatak (LSE) Market Structure & Borrower Welfare Shanghai, December, 2013 64 / 64

Market Power & Commercialization
“[Yunus] takes pride in the industry’s achievement in reaching100 million poor clients, but does not acknowledge thatcommercialization is precisely how much of that goal wasachieved.Mr. Yunus rightly says that the lure of profits has, in some cases,attracted players with questionable motivations and withpractices that must be condemned. But as with the problems ofthe American subprime mortgage market, the solution is not toabolish the mortgage business but to demand that the marketbe sound, transparent and well regulated. . . . Microfinanceinstitutions aim to reach the two billion people who lack accessto basic financial services. To do that, we need to harness thecapital markets, not abandon them.”
Michael Schlein, Chief Executive of Accion in NYT, January 2011
Back to motivation
Maitreesh Ghatak (LSE) Market Structure & Borrower Welfare Shanghai, December, 2013 65 / 64

Market Power & Commercialization
“In most countries, the microcredit market is still immature, withlow penetration of the potential clientele by MFIs and littlecompetition so far.”
Rosenberg et al., 2009 [CGAP]
“In many countries in the region [Asia], the majority ofmicrocredit is provided by a few leading institutions, andcompetition among them is mostly on non-price terms”
Fernando, 2006 [ADB]
Back to Social Capital intro.
Maitreesh Ghatak (LSE) Market Structure & Borrower Welfare Shanghai, December, 2013 66 / 64

Why Joint Liability?
Gine & Karlan (2011): roughly speaking, JL seems not to matter toomuch for repayment. But this is in an environment with almost nodefault.
Gine, Krishnaswamy & Ponce (2012): JL influences behavior astheory predicts: groups cluster into repay/default dependent onfraction of the group that is repaying.
Attanasio et al. (2011) study: JL loans outperformed individual loansin consumption and entrepreneurship outcomes.
Carpena, Cole, Shapiro & Zia (2010): study an MFI that switchedfrom IL to JL.
Banerjee (2012): we currently lack clear evidence of JL matteringsignificantly for default rates, but otherwise it does seem to work astheory predicts along several channels.
Go back
Maitreesh Ghatak (LSE) Market Structure & Borrower Welfare Shanghai, December, 2013 67 / 64

Social capital
A simple model of endogenous social capital. Each period, each pair offriends plays a “social game” with payoffs:
C D
C s, s as, bs
D bs, as 0, 0
We assume
a + b < 2 so (C ,C ) is Pareto dominant
a ≤ 0 so (D,D) is a stage-game Nash equilibrium.
Two types of game:
b ≤ 1: “coordination game”. (C ,C ) is a stage-game NE
b > 1: “opportunism game”. (C ,C ) may be SPNE in infinitelyrepeated game.
Back to Social Capital Setup
Maitreesh Ghatak (LSE) Market Structure & Borrower Welfare Shanghai, December, 2013 68 / 64

Social capital
Definition
Social capital is the expected discounted lifetime payoff from the socialgame. If borrowers expect to play (C ,C ) in every period, S = s
1−δ .
Social capital is sustainable if (C ,C ) can be supported as a SPNE of theinfinitely repeated game under trigger strategies.
Definition
Social capital is sustainable if b ≤ 11−δ
Social capital is always sustainable in the cooperation game but may notbe in the opportunism game.
Since (D,D) is NE, switching to (D,D) forever is a credible threat andcould be used to enforce cooperation in the repayment game also.We assume the game is a coordination game. This implies we can treat Sas exogenous to the lending arrangement.
Back to Social Capital Setup
Maitreesh Ghatak (LSE) Market Structure & Borrower Welfare Shanghai, December, 2013 69 / 64

Competition - theory
Suppose fraction η lenders offer IL.
We assume that in equilibrium lenders offer JL if both IL and JLbreak even (rules out mixed equilibria, which only occur for a singlevalue of S anyway).
Each period, (1− p)ηl IL lenders and (1− q)(1− η)l JL lenders havespare capacity. There are (1− p)ηl + (1− q)(1− η)l + (1− l)unmatched borrowers.
Maitreesh Ghatak (LSE) Market Structure & Borrower Welfare Shanghai, December, 2013 70 / 64

Value functionsDenoting the utility of an unmatched borrower by U and a matched
borrower by ˜V , and using r IL = ρp and rJL = ρ
q :
˜V IL =pR − ρ+ δ(1− p)U
1− δp
˜V JL =pR − ρ+ δ(1− q)U
1− δq
U = χ(l , η)pR − ρ1− δ
with:
χ(l , η) ≡(1− p)(1− δq)ηl + (1− q)(1− δp)(1− η)l
(1− δp)(1− δq)(1− l) + (1− p)(1− δq)ηl + (1− q)(1− δp)(1− η)l
Maitreesh Ghatak (LSE) Market Structure & Borrower Welfare Shanghai, December, 2013 71 / 64

Welfare
Total welfare:
Z = ηl ˜V IL + (1− η)l ˜V JL + (1− l)U
=
[χ(l , η)
1− δ+ l(1− χ(l , η))
(η
1− δp+
1− η1− δq
)](pR − ρ)
Maitreesh Ghatak (LSE) Market Structure & Borrower Welfare Shanghai, December, 2013 72 / 64

Constraints
Under IL the tightest constraint is IC1/IC2:
δV − ρ
p≥ δU
orρ
p≤ δpR
1− χ(l , η)
1− δpχ(l , η)≡ r ILIC1(χ)
Similarly, we obtain for JL ρq ≤ min{rJLIC1(χ), rJLIC2(S , χ)}:
rJLIC1(χ) ≡ δpR1− χ(l , η)
1− δqχ(l , η)
rJLIC2(χ,S) ≡ δ[(1− χ(l , η))pR + (1− δq)S ]
2− δq − δqχ(l , η)
All constraints are tighter as χ, (i.e. U) increases: this is the competitioneffect.
Maitreesh Ghatak (LSE) Market Structure & Borrower Welfare Shanghai, December, 2013 73 / 64

Equilibrium
In equilibrium, it must not be profitable to enter offering either IL or JL.Therefore, in equilibrium:
ρ = max{pr ILIC1(χ),min{qrJLIC1(χ), qrJLIC2(S , χ)}}
For each S , there is a unique value of χ that satisfies this condition.
If pr ILIC1(χ) < ρ, no IL lending. If min{qrJLIC1(χ), qrJLIC2(S , χ)} < ρ, noJL lending.
This enables us to solve for η and l .
Maitreesh Ghatak (LSE) Market Structure & Borrower Welfare Shanghai, December, 2013 74 / 64

Summary of results
For S < ˜S ≡ p−δqδq(1−δq)ρ the unique equilibrium is IL-only lending. If
p − δq there is only JL lending in equilibrium.
For S > ˜S the unique equilibrium is JL-only lending, with scale lincreasing in S until S = ρ
δq .
At S = ˜S , lending switches from IL to JL and scale increasesdiscontinuously.
Welfare Z is strictly increasing in l , which is weakly increasing in S .As l increases:
I Credit rationing falls: more borrowers receive ˜V and fewer receive U.I Unmatched borrowers rematch with higher probability, so U increases.
I ˜V increases in U (involuntary default is less painful).
Back to summary
Maitreesh Ghatak (LSE) Market Structure & Borrower Welfare Shanghai, December, 2013 75 / 64

Parameters
p:
MIX reports two fairly standardized measures: Portfolio At Risk (30days and 90 days).
We use 30 days. This is not ideal - not all PAR30 will default (+vebias), but PAR90 will be -vely biased due to rapidly growing portfolios.
Let θ be fraction of IL loans and (1− θ) be JL (observed). π(p,m) isthe (binomial) repayment probability under JL, depends on p and m,the minimum number of “successes” needed for repayment.
1− PAR = pθ + π(p,m)(1− θ)
p and m estimated using (Weighted) Non-Linear Least Squares.
Estimated p is 0.921.
Maitreesh Ghatak (LSE) Market Structure & Borrower Welfare Shanghai, December, 2013 76 / 64

Parameters
ρ:
MIX reports data on administrative and financial expenses, xa and xf .We want to know the cost per $ disbursed.
Disbursals are not reported, only gross loan portfolio. We obtaineddisbursal figures for 26 of the 50 largest MFIs, weighted averageDisbursal/Portfolio ratio is 1.91.
For lender i , ρi = 1 +xa,i+xf ,i
GrossLoanPortfolio∗1.91 .
Weighted mean ρ = 1.098.
Maitreesh Ghatak (LSE) Market Structure & Borrower Welfare Shanghai, December, 2013 77 / 64

Parameters
R:We need some estimate of returns to investment in microenterprises
De Mel, McKenzie and Woodruff (2008) find annual real expectedreturns of around 60% to random cash and capital grants tomicroenterprises in Sri Lanka.
Other studies find similar figures.
Implies pR = 1.6.
Dividing by p = 0.921, we obtain R = 1.737.
Maitreesh Ghatak (LSE) Market Structure & Borrower Welfare Shanghai, December, 2013 78 / 64

Parameters
δ:The trickiest one:
Empirical estimates of discount rates for typical microfinance clientsvary widely, and often implausible.
Usually elicited using “cash today vs cash tomorrow” approaches,which are problematic.
Instead, we estimate an upper and lower bound, take the midpoint.
δU : 0.975 implied by long run real yield on US bonds around 2.5%.
δL: 0.753. Model implies δ ≥ rpR . We observe a proxy for r , use the
mean to avoid outliers.
Therefore we use δ = 0.864.
Back to summary
Maitreesh Ghatak (LSE) Market Structure & Borrower Welfare Shanghai, December, 2013 79 / 64

Summary Statistics and Parameter Estimates
MFIs Loans % Full IL share IL share Interest p R ρ δ(m) Sample (number)a (value) rate
Full Sample 715 65.217 100.0% 46.0% 81.9% 1.206 0.921 1.737 1.098 0.864
Central America 60 1.671 2.6% 93.8% 98.8% 1.190 0.881 1.816 1.112 0.860South America 133 6.884 10.6% 97.7% 99.3% 1.237 0.928 1.724 1.102 0.874Eastern Africa 20 2.439 3.7% 38.7% 70.4% 1.152 0.831 1.925 1.115 0.848Northern Africa 20 1.735 2.7% 37.5% 59.2% 1.227 0.984 1.626 1.115 0.871Western Africa 48 1.184 1.8% 60.5% 89.2% 1.306 0.882 1.814 1.173 0.896South Asia 133 44.067 67.6% 34.8% 33.3% 1.180 0.926 1.728 1.083 0.856South East Asia 85 4.296 6.6% 45.7% 68.3% 1.389 0.988 1.619 1.164 0.922South West Asia 61 0.865 1.3% 75.0% 93.8% 1.272 0.967 1.655 1.106 0.885
Back to summary
Maitreesh Ghatak (LSE) Market Structure & Borrower Welfare Shanghai, December, 2013 80 / 64
Regional results
0.0 0.1 0.2 0.3 0.4 0.5Social Capital
Bor
row
er W
elfa
re2.
02.
53.
03.
5
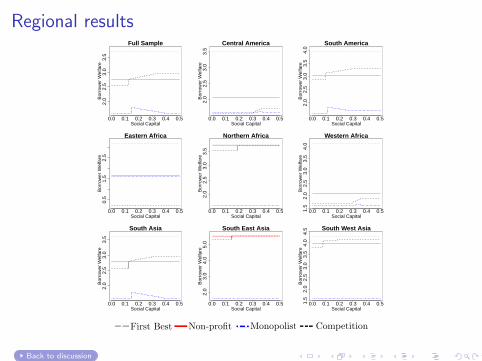
Full Sample
0.0 0.1 0.2 0.3 0.4 0.5Social Capital
Bor
row
er W
elfa
re2.
02.
53.
03.
5
Central America
0.0 0.1 0.2 0.3 0.4 0.5Social Capital
Bor
row
er W
elfa
re2.
02.
53.
03.
54.
0
South America
0.0 0.1 0.2 0.3 0.4 0.5Social Capital
Bor
row
er W
elfa
re0.
51.
52.
5
Eastern Africa
0.0 0.1 0.2 0.3 0.4 0.5Social Capital
Bor
row
er W
elfa
re2.
02.
53.
03.
5
Northern Africa
0.0 0.1 0.2 0.3 0.4 0.5Social Capital
Bor
row
er W
elfa
re1.
52.
02.
53.
03.
54.
0
Western Africa
0.0 0.1 0.2 0.3 0.4 0.5Social Capital
Bor
row
er W
elfa
re2.
02.
53.
03.
5
South Asia
0.0 0.1 0.2 0.3 0.4 0.5Social Capital
Bor
row
er W
elfa
re2.
03.
04.
05.
0
South East Asia
0.0 0.1 0.2 0.3 0.4 0.5Social Capital
Bor
row
er W
elfa
re1.
52.
02.
53.
03.
54.
04.
5 South West Asia
Back to discussion

Optimal λ
0.0 0.1 0.2 0.3 0.4 0.5
2.0
2.5
3.0
3.5
Social Capital
Bor
row
er W
elfa
re
0.0 0.1 0.2 0.3 0.4 0.50.46
0.50
0.54
0.58
Social Capital
λ
Non-profit can improve by offering stochastic renewal: graph depictstwo scenarios, mimicking equilibrium under competition or choosingrenewal probability optimally (Bhole and Ogden (2010))
Back to discussion.