monro, inc. third quarter fiscal 2019 earnings call
TRANSCRIPT

Monro, Inc.Third Quarter Fiscal 2019 Earnings Call
January 31, 2019

Certain statements in this presentation, other than statements of historical fact, including estimates, projections, statementsrelated to our business plans and operating results are forward-looking statements within the meaning of the PrivateSecurities Litigation Reform Act of 1995. Monro has identified some of these forward-looking statements with words suchas “anticipates,” “believes,” “expects,” “estimates,” “is likely,” “predicts,” “projects,” “forecasts,” “may,” “will,” “should,” and“intends” and the negative of these words or other comparable terminology. These forward-looking statements are basedon Monro’s current expectations, estimates, projections and assumptions as of the date such statements are made, and aresubject to risks and uncertainties that may cause results to differ materially from those expressed or implied in the forward-looking statements. Additional information regarding these risks and uncertainties are described in the Company’s filingswith the Securities and Exchange Commission, including in the “Risk Factors” and “Management’s Discussion and Analysisof Financial Condition and Results of Operations” sections of our most recently filed periodic reports on Forms 10-K andForm 10-Q, which are available on Monro’s website at https://corporate.monro.com/investors/financial-information/. Monroassumes no obligation to update or revise these forward-looking statements for any reason, even if new informationbecomes available in the future.
This presentation contains references to Adjusted Earnings Per Share (EPS), which is a “non-GAAP financial measure” asthis term is defined in Item 10(e) of Regulation S-K under the Securities Act of 1933 and the Securities Exchange Act of1934 and Regulation G under the Securities Exchange Act of 1934. In accordance with these rules, Monro has reconciledthis non-GAAP financial measure to its most directly comparable U.S. GAAP measure. Management views this non-GAAPfinancial measure as a way to assess comparability between periods.
This non-GAAP financial measure is not intended to represent, and should not be considered more meaningful than, or asan alternative to, its most directly comparable GAAP measure. This non-GAAP financial measure may be different fromsimilarly titled non-GAAP financial measures used by other companies.
Safe Harbor Statement and Non-GAAP Measures
2

-8.0%
-6.0%
-4.0%
-2.0%
0.0%
2.0%
4.0%
6.0%
8.0%
10.0%
Jan-18 Feb-18 Mar-18 Apr-18 May-18 Jun-18 Jul-18 Aug-18 Sep-18 Oct-18 Nov-18 Dec-18
Third Quarter Fiscal 2019 Highlights
▪ Comparable store sales increased by 2.2%, or
3.3% when adjusted for one less selling day in the
quarter, compared to a decline of 3.1% in the prior
year period
▪ Sales from new stores added $19.8M, including
sales from recent acquisitions of $14.3M
Achieved Fourth Consecutive Quarter of Positive Comparable Store Sales Growth
Quarterly Comps TrendsY/Y Comps Trends
▪ Brakes: 12%
▪ Tires: 3%
▪ Alignments: 1%
▪ Maintenance: Flat
▪ Front End/Shocks: -4%
3QFY19
Key Highlights3
3QFY19
Key Highlights
3
1Results have been adjusted for the extra selling week2Results have been adjusted for the Memorial Day holiday calendar shift3Results have been adjusted for one less selling day in 3QFY19 due to the Christmas holiday calendar shift
1 2 2
-4.0%
-3.0%
-2.0%
-1.0%
0.0%
1.0%
2.0%
3.0%
4.0%
3QFY18 4QFY18 1QFY19 2QFY19 3QFY1921
3
3

A Scalable Platform: Recent Acquisitions
Acquisitions Completed and Announced to Date in Fiscal 2019 Represent $87M in Annualized Sales
1Greenfield stores include new construction as well as the acquisition of one to four store operations
Announced Acquisitions
▪ Announced a definitive agreement to acquire 12 retail locations in Louisiana
▪ Enters a new state, expanding the Company’s presence in the southern markets
▪ $15M in annualized sales, breakeven to EPS in FY19
▪ Sales mix of 35% service and 65% tires
Completed Acquisitions
▪ Completed acquisition of five retail locations in Ohio, filling in an existing market
▪ $5M in annualized revenue, breakeven to EPS in FY19
▪ Sales mix of 70% service and 30% tires
▪ Completed acquisition of 13 retail locations in Florida, filling in an existing market
▪ $12M in annualized revenue, breakeven to EPS in FY19
▪ Sales mix of 65% service and 35% tires
Greenfield Openings1
▪ Added three greenfield locations during the third quarter
4

Monro.Forward Progress Update
❑ Successfully implemented Monro playbook and store re-image initiative pilot at 31
locations in Rochester, NY during 3QFY19, leading to improved conversion and
customer satisfaction
❑ Modernized store layout to be rolled out across the Company’s remaining markets
and store formats over the next 3 to 5 years
Improve Customer
Experience
Monro.Forward Initiatives Well Underway and Advancing as Planned
5

Monro.Forward Progress Update (Cont.)
❑ Continuing to execute customer satisfaction and online reputation management
program across Monro’s store base
❑ Focus on the in-store experience is having significant impact on Company online
reviews and has increased “Star Ratings” to 4.7 Year-to-Date and 4.5 All-time
Improve Customer
Experience
Monro.Forward Initiatives Well Underway and Advancing as Planned
*Through 1/25/19
3.7
4.0
4.24.3
4.4 4.5
4.1
4.5
4.7 4.7 4.74.7
-
20,000
40,000
60,000
80,000
100,000
120,000
Q3 FY18 Q4 FY18 Q1 FY19 Q2 FY19 Q3 FY19 YTD FY19
Num
ber
of
Revie
ws
Negative Neutral Positive End of Quarter All Time Star Rating Quarterly Rating
6
*

Monro.Forward Progress Update (Cont.)
❑ Retail website driving increase in online appointments and mobile calls
❑ Expanding direct marketing through CRM platform following strong pilot campaigns
❑ Data-driven “new customer” marketing initiatives on track for 4QFY19 launch
❑ Collaboration with Amazon.com at nearly 400 stores supports omnichannel strategy
Enhance Customer-
Centric Engagement
❑ Optimized store staffing model after rightsizing overstaffed and understaffed stores
❑ Data-driven store scheduling and staffing software to be implemented in FY20
❑ Recently launched Monro University training program pilot
Accelerate Productivity
& Team Engagement
❑ Continued momentum of Good-Better-Best product and service packages
❑ Optimized tire sales and pricing strategy driving strength in tires
❑ Introduction of new tire brands to optimize tire assortment in 4QFY19
Optimize Product &
Service Offering
Monro.Forward Initiatives Well Underway and Advancing as Planned
7
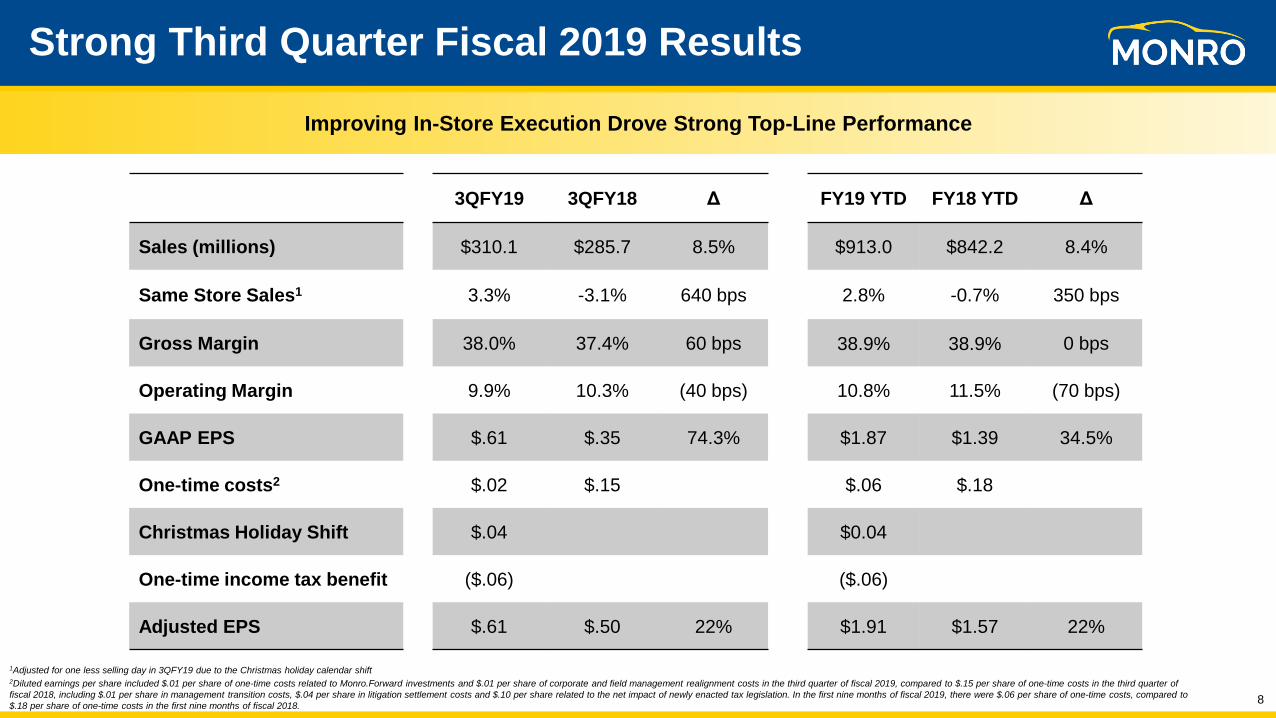
Improving In-Store Execution Drove Strong Top-Line Performance
Strong Third Quarter Fiscal 2019 Results
3QFY19 3QFY18 Δ FY19 YTD FY18 YTD Δ
Sales (millions) $310.1 $285.7 8.5% $913.0 $842.2 8.4%
Same Store Sales1 3.3% -3.1% 640 bps 2.8% -0.7% 350 bps
Gross Margin 38.0% 37.4% 60 bps 38.9% 38.9% 0 bps
Operating Margin 9.9% 10.3% (40 bps) 10.8% 11.5% (70 bps)
GAAP EPS $.61 $.35 74.3% $1.87 $1.39 34.5%
One-time costs2 $.02 $.15 $.06 $.18
Christmas Holiday Shift $.04 $0.04
One-time income tax benefit ($.06) ($.06)
Adjusted EPS $.61 $.50 22% $1.91 $1.57 22%
1Adjusted for one less selling day in 3QFY19 due to the Christmas holiday calendar shift2Diluted earnings per share included $.01 per share of one-time costs related to Monro.Forward investments and $.01 per share of corporate and field management realignment costs in the third quarter of fiscal 2019, compared to $.15 per share of one-time costs in the third quarter of
fiscal 2018, including $.01 per share in management transition costs, $.04 per share in litigation settlement costs and $.10 per share related to the net impact of newly enacted tax legislation. In the first nine months of fiscal 2019, there were $.06 per share of one-time costs, compared to
$.18 per share of one-time costs in the first nine months of fiscal 2018. 8

Disciplined Capital Allocation
Executing on Growth Strategy While Maintaining a Disciplined Approach to Capital Allocation
Investing in the Business
▪ Capex of $30.8M in the first nine months of fiscal 2019
▪ Continue to expect ~$75M of incremental Capex over the next 5 years to invest in store re-image and technology
Returning Cash to Shareholders
▪ Paid $20.1M in dividends in the first nine months of fiscal 2019
▪ Currently $.20 per share quarterly, an increase of 11% from 3QFY18
Executing on M&A Opportunities
▪ Spent $46.1M on acquisitions in the first nine months of fiscal 2019
▪ Signed definitive agreement to acquire 12 stores, bringing annualized sales from fiscal 2019 acquisitions to $87M
Utilizing Strong Balance Sheet
▪ Generated $128.6M of operating cash flow in the first nine months of fiscal 2019
▪ Debt-to-EBITDA ratio as of December 2018 of 2.1x provides significant flexibility to fund M&A strategy
9

Fiscal 2019 Outlook
FY19 FY18 Δ
Sales (millions) $1,185 to $1,215 $1,128 5.1% to 7.7%
Same Store Sales
(on a 52-week basis)+1% to +3% -0.1%
110 bps to
310 bps
GAAP EPS $2.30 to $2.40 $1.92 20% to 25%
Guide to Upper End of Fiscal 2019 Comparable Store Sales and Reiterate EPS Guidance
Operating Margin
▪ Assumes operating margin of ~11% at midpoint of FY19 sales guidance
▪ Expect stable tire and oil costs year-over-year
▪ Expect to generate earnings increase on a comparable store sales increase
above ~1%
Tax Savings
▪ Estimate ~$.40 tax benefit from newly enacted tax legislation
▪ Tax rate expected to be reduced from ~37% to ~22% in FY19
Reinvestment of Tax Savings
▪ Reinvestment of ~35%, or ~$.14, to support Monro.Forward strategy
($.09 of recurring expenses and $.05 of one-time items in FY19):
– Improve Customer Experience – (~$.05)
– Enhance Customer Engagement – (~$.01)
– Accelerate Productivity & Team Engagement – (~$.08)
Additional Guidance Assumptions (at the midpoint)
▪ Interest expense of ~$28 million
▪ Depreciation and amortization of ~$56 million
▪ EBITDA of ~$187 million
▪ 33.6 million weighted average number of diluted shares outstanding
Stores and Weeks
▪ Guidance includes recently announced and completed acquisitions
and excludes any additional potential acquisitions
▪ Guidance includes eight ground-up greenfield store openings in FY19
▪ FY19 represents a 52 week year compared to 53 weeks for FY18
10

Third Quarter Fiscal 2019 Key Takeaways
▪ Delivered fourth consecutive quarter of comparable store sales growth
▪ Successfully implemented Monro playbook and store reimage pilot, and on track to
expand initiative across store base
▪ Completed acquisitions of 18 stores and signed definitive agreement to acquire 12
stores, entering a new market in the fourth quarter and bringing annualized sales from
fiscal 2019 acquisitions to $87 million
▪ Guide to upper end of fiscal 2019 comparable store sales and reiterate EPS guidance
11

Appendix
12

Q2 FY19 Q3 FY19 Q4 FY19 Q2 FY20 Q3 FY20 Q4 FY20Q4 FY18 FY20FY19 FY21
Monro.Forward Strategic Initiatives
Pilot store refresh & operationalexcellence
New store comp plansMonro University pilot (includes career path, LMS)
Technology based in-store experience
Data-driven “new customer” marketing
Monro omnichannel & e-commerce
Store staffing & scheduling system
Improve Customer Experience
Enhance Customer-Centric Engagement
Optimize Product & Service Offering
Accelerate Productivity & Team Engagement
Foundational technology & tools
New in-store sales packages
Scheduled maintenance in-store selling
Data-driven CRM
New websites
Tire category management
Scale store refresh & operational excellence
= Completed Initiatives
13