monroe · measuring mobile broadband networks in europe ... in the last quarter of 2016, ... mifi...
TRANSCRIPT

MONROEMeasuring Mobile Broadband Networks in Europe
H2020-ICT-11-2014Project number: 644399
Deliverable D1.3Final Implementation
Editor(s): Miguel Peón-Quirós, Vincenzo MancusoContributor(s): Miguel Peón-Quirós, Thomas Hirsch, Stefan Alfredsson, Jonas Karlsson, Ali Safari
Khatouni, Özgü Alay
Work Package: 1 / System Design and System ImplementationRevision: 1.0Date: February 28, 2017Deliverable type: R (Report)Dissemination level: Confidential, only for members of the consortium
(including the Commission Services)
Ref. Ares(2017)1077199 - 28/02/2017

D1.3Final Implementation
ConfidentialRev. 1.0/ February 28, 2017
Abstract
This report describes the updates on the platform’s final implementation with extensions and
modifications. Specifically, the document describes the web user interface, the scheduling sys-
tem, the management and maintenance system, the software running on the MONROE nodes
(core components, default experiments and EaaS infrastructure, the repositories and data im-
porter, the central database and the online visualization tool).
Participant organisation name Short name
SIMULA RESEARCH LABORATORY AS (Coordinator) SRL
CELERWAY COMMUNICATION AS Celerway
TELENOR ASA Telenor
NEXTWORKS NXW
FUNDACIÓN IMDEA NETWORKS IMDEA
KARLSTADS UNIVERSITET KaU
POLITECNICO DI TORINO POLITO
2 of 25 Project no. 644399

D1.3Final Implementation
ConfidentialRev. 1.0/ February 28, 2017
Contents
1 Introduction 4
2 SW in the MONROE nodes 6
2.1 Core components . . . . . . . . . . . . . . . . . . . . . . . . . . . . . . . . . . . . . . . . . . . . . 6
2.2 Containers . . . . . . . . . . . . . . . . . . . . . . . . . . . . . . . . . . . . . . . . . . . . . . . . . 7
2.3 SW ecosystem in the MONROE nodes . . . . . . . . . . . . . . . . . . . . . . . . . . . . . . . . . 8
2.4 Metadata creation and flow in the nodes . . . . . . . . . . . . . . . . . . . . . . . . . . . . . . . . 9
2.5 Tstat & mPlane in the MONROE nodes . . . . . . . . . . . . . . . . . . . . . . . . . . . . . . . . . 9
2.5.1 mPlane architecture . . . . . . . . . . . . . . . . . . . . . . . . . . . . . . . . . . . . . . . 10
2.5.2 mPlane integration in the MONROE platform . . . . . . . . . . . . . . . . . . . . . . . . . 10
2.5.3 Tstat Round Robin Database . . . . . . . . . . . . . . . . . . . . . . . . . . . . . . . . . . . 11
2.5.4 Tstat logs . . . . . . . . . . . . . . . . . . . . . . . . . . . . . . . . . . . . . . . . . . . . . . 11
3 Node management and maintenance 12
3.1 Configuration maintenance . . . . . . . . . . . . . . . . . . . . . . . . . . . . . . . . . . . . . . . 12
3.2 Health monitoring . . . . . . . . . . . . . . . . . . . . . . . . . . . . . . . . . . . . . . . . . . . . . 13
3.3 Node inventory . . . . . . . . . . . . . . . . . . . . . . . . . . . . . . . . . . . . . . . . . . . . . . 14
3.4 Manual remote inspection . . . . . . . . . . . . . . . . . . . . . . . . . . . . . . . . . . . . . . . . 14
3.5 Node recovery . . . . . . . . . . . . . . . . . . . . . . . . . . . . . . . . . . . . . . . . . . . . . . . 15
4 User access and scheduling system 15
4.1 Development cycle . . . . . . . . . . . . . . . . . . . . . . . . . . . . . . . . . . . . . . . . . . . . 16
4.2 Scheduling system . . . . . . . . . . . . . . . . . . . . . . . . . . . . . . . . . . . . . . . . . . . . 17
4.2.1 Scheduling policies . . . . . . . . . . . . . . . . . . . . . . . . . . . . . . . . . . . . . . . . 17
4.3 Transfer of user experiment results . . . . . . . . . . . . . . . . . . . . . . . . . . . . . . . . . . . 18
5 Remote repositories and databases 18
5.1 Database . . . . . . . . . . . . . . . . . . . . . . . . . . . . . . . . . . . . . . . . . . . . . . . . . . 19
5.2 Example scripts and utilities . . . . . . . . . . . . . . . . . . . . . . . . . . . . . . . . . . . . . . . 19
5.3 Access to the data . . . . . . . . . . . . . . . . . . . . . . . . . . . . . . . . . . . . . . . . . . . . . 20
5.4 Backup systems . . . . . . . . . . . . . . . . . . . . . . . . . . . . . . . . . . . . . . . . . . . . . . 21
6 Visualization tool 21
7 Conclusions 21
3 of 25 Project no. 644399
D1.3Final Implementation
ConfidentialRev. 1.0/ February 28, 2017
1 Introduction
The main goal of MONROE is to build and operate a platform to conduct measurements and execute
experiments on operational mobile networks. This document describes the platform implementation at
M24, which not only addresses the initial technical problems of the prototype platform but also implements
new features and extensions based on the feedback from the first open call external users. Although WP1 is
concluded with this deliverable, MONROE consortium is committed to improve the platform by fixing the
bugs as well as adding new features based on external user’s requests. These will be addressed under the
Maintenance Work Package (WP4) until the end of the project.
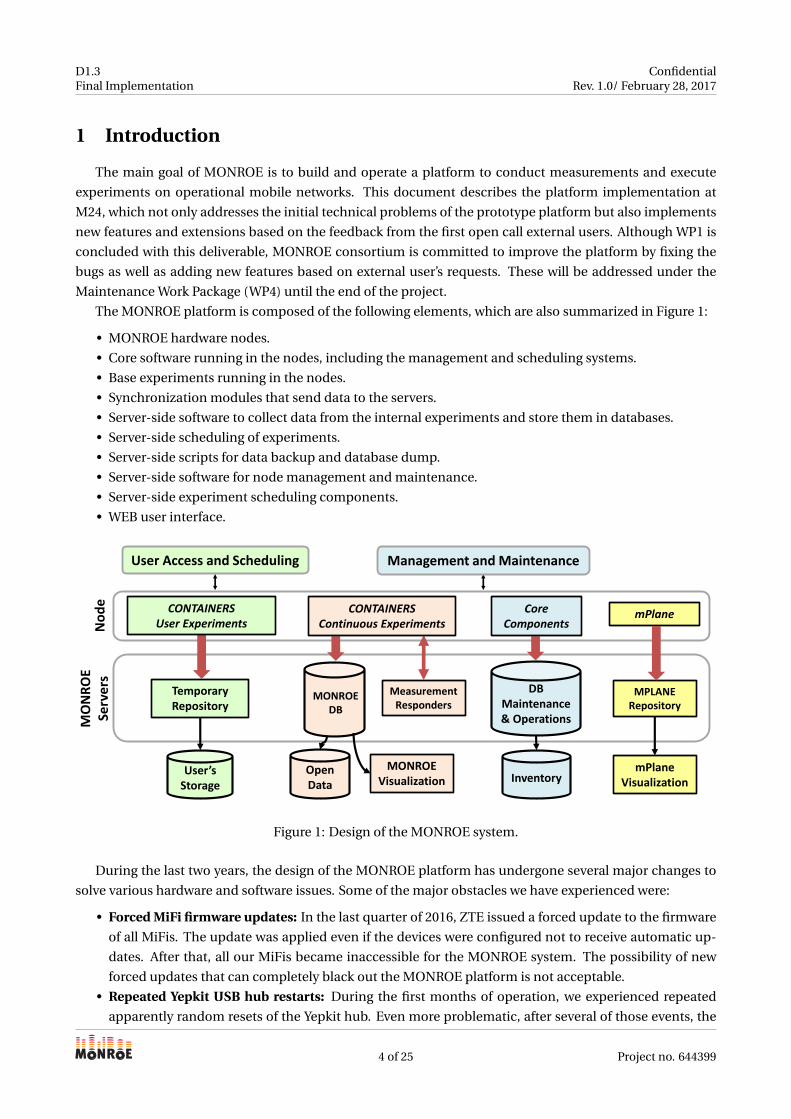
The MONROE platform is composed of the following elements, which are also summarized in Figure 1:
• MONROE hardware nodes.
• Core software running in the nodes, including the management and scheduling systems.
• Base experiments running in the nodes.
• Synchronization modules that send data to the servers.
• Server-side software to collect data from the internal experiments and store them in databases.
• Server-side scheduling of experiments.
• Server-side scripts for data backup and database dump.
• Server-side software for node management and maintenance.
• Server-side experiment scheduling components.
• WEB user interface.
MEASURING MOBILE BROADBAND NETWORKS IN EUROPE
Temporary Repository
Open Data
MONROEVisualization
MO
NR
OE
Serv
ers
MONROEDB
DBMaintenance & Operations
No
de
User’s Storage
Inventory
MeasurementResponders
User Access and Scheduling Management and Maintenance
CONTAINERSContinuous Experiments
CONTAINERSUser Experiments
CoreComponents
mPlane
MPLANERepository
mPlaneVisualization
Figure 1: Design of the MONROE system.
During the last two years, the design of the MONROE platform has undergone several major changes to
solve various hardware and software issues. Some of the major obstacles we have experienced were:
• Forced MiFi firmware updates: In the last quarter of 2016, ZTE issued a forced update to the firmware
of all MiFis. The update was applied even if the devices were configured not to receive automatic up-
dates. After that, all our MiFis became inaccessible for the MONROE system. The possibility of new
forced updates that can completely black out the MONROE platform is not acceptable.
• Repeated Yepkit USB hub restarts: During the first months of operation, we experienced repeated
apparently random resets of the Yepkit hub. Even more problematic, after several of those events, the
4 of 25 Project no. 644399
D1.3Final Implementation
ConfidentialRev. 1.0/ February 28, 2017
MiFis hang. In some cases, the only way to recover them is draining their batteries, or perform a (labour
dependent) manual reboot by pushing the power button.
• Unstable MiFis: The modems themselves seem to be prone to resets or to enter a working state (trans-
parent PPP) from which they can only be brought back into normal operation by draining their batter-
ies or performing a manual reboot.
• Bloated MiFi batteries: After a few months of work, some of the MiFis showed clear signs of bloated
batteries. This problem creates serious safety concerns for the deployment of nodes at places other
than our own (controlled) premises.
The above described obstacles suggested the strong need to modify the platform design, particularly to
avoid clear safety risks.
Re-design of the MONROE nodes The prototype MONROE node design was consisted of a PC Engines
APU1D4, a Yepkit self-powered USB hub, three USB-based CAT4 MF910 MiFis from ZTE, one miniPCI ex-
press WiFi card and one miniPCI express (USB-protocol) Sierra Wireless MC7403 modem. The new node
design, considering all the above mentioned problems, is based on a dual PC Engines APU2 system. One of
the APU2 in each node has two Sierra Wireless MC7455 miniPCI express (USB 3.0) modems; the other has
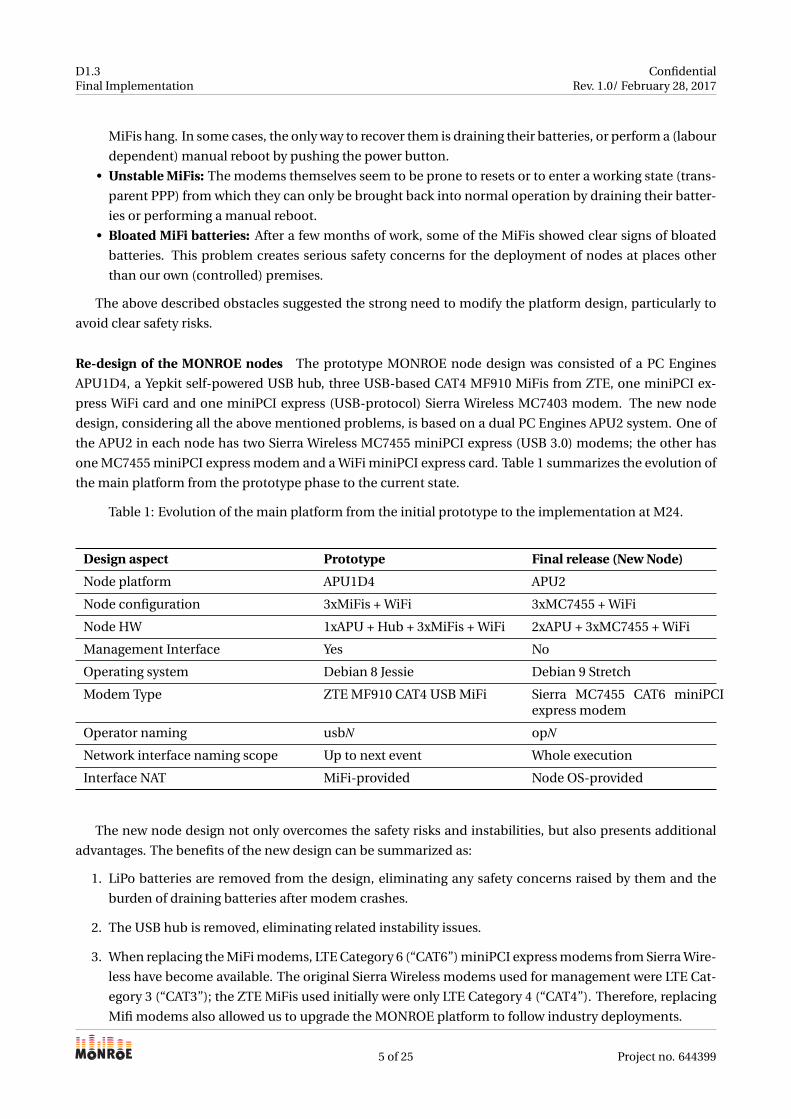
one MC7455 miniPCI express modem and a WiFi miniPCI express card. Table 1 summarizes the evolution of
the main platform from the prototype phase to the current state.
Table 1: Evolution of the main platform from the initial prototype to the implementation at M24.
Design aspect Prototype Final release (New Node)
Node platform APU1D4 APU2
Node configuration 3xMiFis + WiFi 3xMC7455 + WiFi
Node HW 1xAPU + Hub + 3xMiFis + WiFi 2xAPU + 3xMC7455 + WiFi
Management Interface Yes No
Operating system Debian 8 Jessie Debian 9 Stretch
Modem Type ZTE MF910 CAT4 USB MiFi Sierra MC7455 CAT6 miniPCIexpress modem
Operator naming usbN opN
Network interface naming scope Up to next event Whole execution
Interface NAT MiFi-provided Node OS-provided
The new node design not only overcomes the safety risks and instabilities, but also presents additional
advantages. The benefits of the new design can be summarized as:
1. LiPo batteries are removed from the design, eliminating any safety concerns raised by them and the
burden of draining batteries after modem crashes.
2. The USB hub is removed, eliminating related instability issues.
3. When replacing the MiFi modems, LTE Category 6 (“CAT6”) miniPCI express modems from Sierra Wire-
less have become available. The original Sierra Wireless modems used for management were LTE Cat-
egory 3 (“CAT3”); the ZTE MiFis used initially were only LTE Category 4 (“CAT4”). Therefore, replacing
Mifi modems also allowed us to upgrade the MONROE platform to follow industry deployments.
5 of 25 Project no. 644399

D1.3Final Implementation
ConfidentialRev. 1.0/ February 28, 2017
4. Sierra modems are simpler devices than the ZTE MiFis (which were full Android systems); that will
reduce overheads in the chain from the MONROE node protocol stacks to the MBB network.
5. The prototype platform used the NAT mechanism provided by the ZTE MF910 MiFis. As the second
iteration of the platform design uses only miniPCI express Sierra Wireless modems without NAT, this
functionality has been moved to the operating system itself, where it can be controlled and configured
by the MONROE platform.
6. The prototype exposed the network interfaces of the nodes to the experiments running in the contain-
ers using names in the form usbN (usb0, usb1, ...). The association between an interface name and the
MiFi/SIM/operator connected to it could change after events such as modem disconnection, even dur-
ing an experiment execution. That forced experiments to read the new operator association for each
interface from the metadata stream before selecting the interface they were binding to after any net-
working events. In contrast, the final implementation uses a naming schema where interface names
in the form of opN (op0, op1, ...) associate the interface with a given modem. This association persists
through the entire uptime of the node, and is only reset at bootup. Therefore, experiments need to wait
for metadata information only once, simplifying their design.
One drawback of the new design is that due to unavailability of the fifth interface, the new node comes
without a dedicated management interface. This requires modifications to the core components to enable
the transfer of metadata and experiment results through the other modems where they are free from experi-
ment traffic.
Finally, it is worth to mention that despite the above described obstacles, the MONROE project was able
to continuously operate a sufficient number of nodes, and provide service to the participant projects of the
first Open Call.
The following sections provide an overview of different components of the MONROE platform focusing
on the details of the design and the final implementation.
2 SW in the MONROE nodes
The software in the MONROE nodes is based on a Linux Debian Stretch distribution. On top of the oper-
ating system, several core components keep the node in a healthy and updated state. Experiment code runs
inside Docker containers, which offer lightweight virtualization and a convenient, efficient, way of software
distribution.
In general, core components perform low-level work more or less in line with the normal work expected
on any mobile device or computer (e.g., device and network management, service watchdogs). For user
experiments, the software ecosystem composed of the scheduling system, background experiments and ex-
periment services is more important, as experimenters should be aware of any potential interferences with
their own experiments.
2.1 Core components
The core components of the MONROE node ensure that the node remains operational and enable remote
update of all the other software components. The main ones, shown in Figure 2, are:
• System-wide Watchdog: Responsible for ensuring that all core services are running. In case of anoma-
lies, it restarts the affected services.
6 of 25 Project no. 644399

D1.3Final Implementation
ConfidentialRev. 1.0/ February 28, 2017
Figure 2: Core components in the MONROE nodes.
• USB restarter: Restarts or power-cycles USB devices.
• Device Listener (“network-listener”): Detects, configures and connects USB network devices.
• Routing daemon (“multi”): Acquires an IP address through DHCP, sets up routing tables (only IPv4).
• Network monitor: Based on the Dynamic Load Balancer (“dlb”). Monitors interface state. Checks the
connectivity of the different interfaces. Configures default routes.
• Metadata multicast & exporter: Broadcasts the stream of metadata (e.g., node status, connection tech-
nology, GPS) as JSON objects to all the applications in the node using a publish-subscriber paradigm
based on ZeroMQ.1 Different experiments can subscribe to specific relevant information, for example
to correlate GPS/operator with a throughput measurement. The metadata is also collected, transferred
to the MONROE server and stored in the MONROE (Cassandra) database for post-processing and cor-
relation with experiments.
2.2 Containers
Both default MONROE experiments and user experiments are executed inside Docker containers, which
provide resource isolation from the host node. Docker containers are based on a layered file system, where
a container can reuse layers shared with other containers. MONROE provides a default base image for the
experiment containers under the name monroe/base. This base image provides a base operating system
1http://www.zeromq.org
7 of 25 Project no. 644399

D1.3Final Implementation
ConfidentialRev. 1.0/ February 28, 2017
MEASURING MOBILE BROADBAND NETWORKS IN EUROPE
Node management
Scheduler
Synchronization to servers
Node update and configuration Scheduled active
MONROE experiments
HTTP performance
Traceroute
User experiments
User container
Continuous active MONROE experiments
Ping
Background services
Metadata broadcast (GPS, modem coverage, CPU temp, …)
Metadata exporter
mP
lane
Figure 3: SW ecosystem in the MONROE nodes.
installation with default tools that are potentially useful for many experiments. When users base their own
containers on the MONROE base image, they get automatic access to its underlying contents. This is a rel-
evant consideration because it allows lightweight containers to provide just the contents that are unique
for the particular experiment, significantly reducing the download and deployment time and traffic volume.
As the base image resides permanently in the nodes, nodes need to transfer only the new layers created by
the users for their experiments, saving data quota usage on our SIM subscriptions and hence, leaving more
quota to run experiments. Our public software repositories contain all the files necessary to build new user
experiments.
Experiments running inside a container have access to the experimental network interfaces. They can
read and write on their own file system, overlaid over that of the base MONROE image. They can use any
software tool installed in the base image, or they can install their own tools and libraries in the overlaid file
system. Finally, there are specific paths (e.g., /monroe/results/) where the experiments can write their
results; the node will automatically transfer them to the MONROE servers.
2.3 SW ecosystem in the MONROE nodes
Figure 3 presents the different software elements that coexist in a MONROE node. In the first place,
the node management software runs continuously in the background. It includes the scheduling system,
which periodically checks for new experiments to run in the node and deploys these in advance to their
scheduled execution time. It schedules the start and stop times of the container using operating system
functions. During experiment execution, it also checks if the current one has exceeded its allocated resource
quotas. Synchronization of experiment results and metadata (JSON) files is performed by a background
rsync process. Node package and configuration updates are at charge of an ansible process. Second, some
services such as metadata broadcasting run continuously on the background. The impact of those services
on node performance is negligible for most experiments.
MONROE nodes continuously run some default experiments. Currently, this is limited to the ping ex-
8 of 25 Project no. 644399

D1.3Final Implementation
ConfidentialRev. 1.0/ February 28, 2017
Modem GPS System
Status
Scheduler
Status
Metadata multicast & exporter
Cele
rway C
ore
Syste
m
ZMQ
Metadata SubscriberExperiment Containers
Metadata Subscriber
RSYNC
Metadata Importer
Local Node
Cassandra DB
Metadata Storage
Central repository
Metadata Collection &
Dissemination
Figure 4: Flow of metadata in the MONROE nodes.
periment, which sends an ICMP PING probe every second through each interface. Experimenters should be
aware of any impact that this condition might have on their own experiments. Similarly, certain MONROE
base experiments such as http_download and traceroute are executed in the node. However, those exper-
iments, which are more resource and bandwidth intensive, are scheduled periodically in exclusion with any
other experiment, including user ones. Thus, users may be unable to run their experiment at a certain time
on a certain node because one of the base experiments is already scheduled, but, once the scheduling of a
user experiment is approved, it will not be executed at the same time than the scheduled active MONROE
experiments. User experiments execute, inside their Docker containers, in the node under the supervision
of the scheduler. Finally, the mPlane Tstat probe runs continuously in all MONROE nodes to supervise all
the network events in the platform.
2.4 Metadata creation and flow in the nodes
Figure 4 shows the flow of metadata inside the MONROE nodes. Different subsystems generate meta-
data messages, which are received by the metadata exporter. The exporter formats the information from
different sources as JSON single-line objects. ZeroMQ is used to create a publisher/subscriber model, where
the metadata exporter acts as publisher and any other piece of software, including user experiments, may
become subscribers. The receiving mechanism is based on a ZeroMQ TCP socket abstraction.
A special MONROE module, the metadata subscriber, receives all metadata messages and writes them
to a predefined location in the node file system (/monroe/results/xxx.json). rsync is used to transfer the
JSON files to the MONROE server over a secure SSH channel. At the server, the files are parsed and imported
into the Cassandra database. Finally, JSON files are backed up daily and automatically copied to a second
machine at IMDEA Networks. An additional backup of that machine is made at IMDEA discretionarily.
Individual metadata messages are labeled by topic. Applications can subscribe only to specific topics, or
to the whole stream. The format of the individual metadata messages is detailed in the user manual.
2.5 Tstat & mPlane in the MONROE nodes
Here, the most important features of the mPlane and Tstat architecture are summarized.
9 of 25 Project no. 644399
D1.3Final Implementation
ConfidentialRev. 1.0/ February 28, 2017
probe repository
supervisor
client
capability -specification -
result
capability -specification -
result
indirect export
capability -specification -
result
reasoner
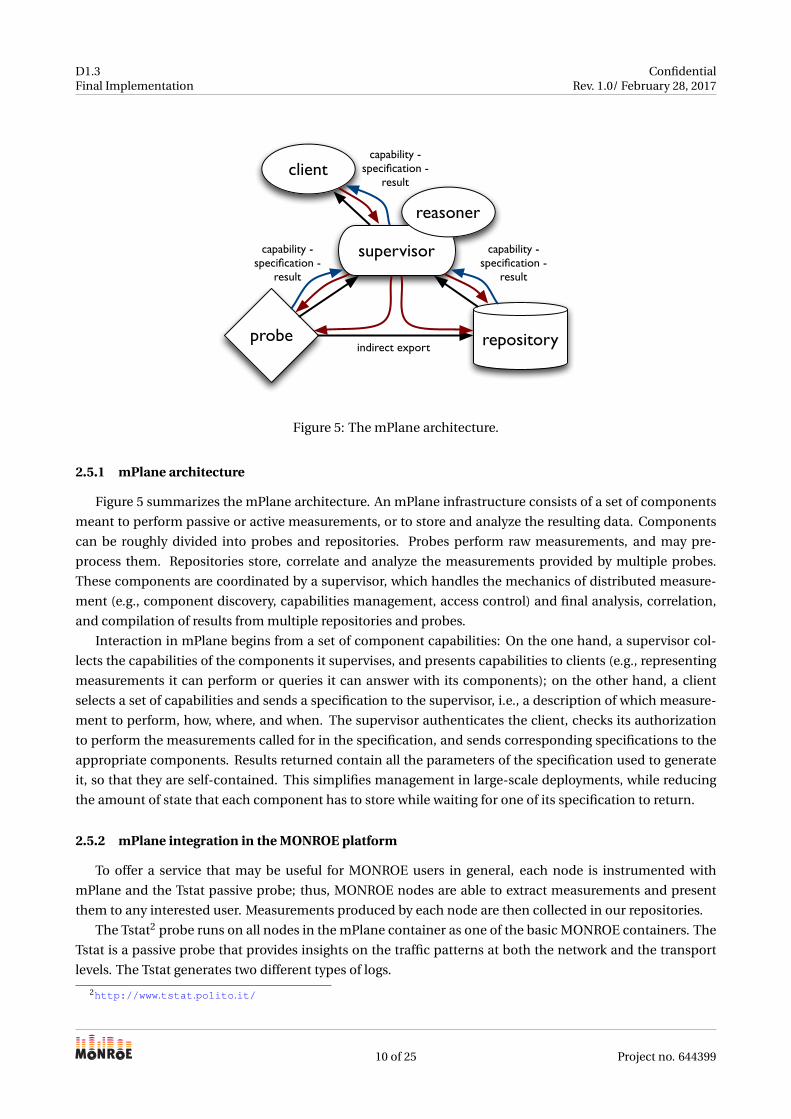
Figure 5: The mPlane architecture.
2.5.1 mPlane architecture
Figure 5 summarizes the mPlane architecture. An mPlane infrastructure consists of a set of components
meant to perform passive or active measurements, or to store and analyze the resulting data. Components
can be roughly divided into probes and repositories. Probes perform raw measurements, and may pre-
process them. Repositories store, correlate and analyze the measurements provided by multiple probes.
These components are coordinated by a supervisor, which handles the mechanics of distributed measure-
ment (e.g., component discovery, capabilities management, access control) and final analysis, correlation,
and compilation of results from multiple repositories and probes.
Interaction in mPlane begins from a set of component capabilities: On the one hand, a supervisor col-
lects the capabilities of the components it supervises, and presents capabilities to clients (e.g., representing
measurements it can perform or queries it can answer with its components); on the other hand, a client
selects a set of capabilities and sends a specification to the supervisor, i.e., a description of which measure-
ment to perform, how, where, and when. The supervisor authenticates the client, checks its authorization
to perform the measurements called for in the specification, and sends corresponding specifications to the
appropriate components. Results returned contain all the parameters of the specification used to generate
it, so that they are self-contained. This simplifies management in large-scale deployments, while reducing
the amount of state that each component has to store while waiting for one of its specification to return.
2.5.2 mPlane integration in the MONROE platform
To offer a service that may be useful for MONROE users in general, each node is instrumented with
mPlane and the Tstat passive probe; thus, MONROE nodes are able to extract measurements and present
them to any interested user. Measurements produced by each node are then collected in our repositories.
The Tstat2 probe runs on all nodes in the mPlane container as one of the basic MONROE containers. The
Tstat is a passive probe that provides insights on the traffic patterns at both the network and the transport
levels. The Tstat generates two different types of logs.
2http://www.tstat.polito.it/
10 of 25 Project no. 644399

D1.3Final Implementation
ConfidentialRev. 1.0/ February 28, 2017
Figure 6: Graphite GUI of the Tstat RRD logs.
2.5.3 Tstat Round Robin Database
The RRD (Round Robin Database) log is an average of samples of each packet during the last 5 min. The
detailed description of the RRD logs is available on the Tstat documentation3. RRDs are available at: http:
//monroe-repository.polito.it:8080/
The Graphite GUI provides a tool to present RRD logs and save interesting plots. For example, Fig. 6 shows
the bit rate of ICMP packets for node 38 on interface op0 over the last 24 h. There is also the possibility to
create a dashboard to monitor the experiments and interfaces’ status. Fig. 7 illustrates an example of saved
dashboard to monitor the volume of traffic on one node.
2.5.4 Tstat logs
Tstat generates detailed flow-level logs for TCP, UDP, and HTTP flows. These are text file with more than
100 metrics, with information on client and server addresses, network and application level metrics, and DNS
queries. The description of the metrics can be read at: http://tstat.polito.it/measure.shtml#LOG.
In MONROE, Tstat is configured to generate four different logs:
• log_tcp_complete: Every TCP connection that has been tracked
• log_tcp_nocomplete: All the connections for which the three-way handshake is not properly seen
• log_udp_complete: Every tracked UDP flow pair
• log_http_complete: Information from every HTTP request and response
Logs are available in two ways:
3http://tstat.polito.it/HOWTO.shtml#RRD
11 of 25 Project no. 644399

D1.3Final Implementation
ConfidentialRev. 1.0/ February 28, 2017
Figure 7: An example dashboard on Tstat RRD GUI.
1. Real time access on the nodes. The last three generated logs are shared with MONROE experimenters
at /monroe/tstat. Thus, MONROE users can use passive traces collected by Tstat during their experi-
ment. The three logs can cover at most the last three hours.
2. On demand. Logs from all nodes are imported into the MONROE database. The table schemas
are available in the MONROE repository at: https://github.com/MONROE-PROJECT/Database/
blob/master/db_schema.cql. The columns (NodeId,Iccid,DataId) allow joining entries in those ta-
bles with the rest of metadata.
The complete description of the logs is available at: http://tstat.polito.it/measure.shtml#LOG
3 Node management and maintenance
The operations team uses several mechanisms to monitor node status and ensure that they remain op-
erational with minimum manual intervention. It is based on a combination of software running both in the
nodes and in the maintenance servers, which are operated by Celerway. Additionally, a ticketing system for
maintenance issues has been created to allow identifying repeated maintenance actions that should be in-
corporated into maintenance routines. The following sections describe the different mechanisms involved
in the process of node maintenance.4
3.1 Configuration maintenance
Monroe node configuration is managed and synchronized through an automatic configuration manage-
ment system (ansible). In regular intervals, a private git repository is checked out and the configuration
updates applied to the node. No action is taken unless a task is updated. Updates to the packages installed
4Part of the information in this section is explained in deeper detail in Deliverable 4.1.
12 of 25 Project no. 644399

D1.3Final Implementation
ConfidentialRev. 1.0/ February 28, 2017
and node configuration are handled exclusively through the ansible system. Site-specific variables, such as
WiFi configuration, can be set in an imported file on the node.
3.2 Health monitoring
The software environment in the MONROE nodes consists of several layers, all of which must be oper-
ational to make the node available for experimenters, and to ensure the correctness of the measurement
results. The following is a list of the different software components that run on the nodes:
• Maintenance access.
• Software watchdog.
• Kernel patches.
• Core software (routing, load balancer, network-listener).
• Sensors.
• Metadata-exporter.
• MONROE base experiments.
• Usage monitoring.
• Scheduling client.
• Container and virtualization system.
Some of the mechanisms implemented that monitor the status of the nodes are as follows:
• Network assessment: Low data throughput checks are run every 5 min in order to assess all different
interfaces. The management interface is the default for all maintenance activities; however, if it is not
available due to a problem or lack of coverage, the node will switch to the MiFi interface with the best
quality, hence maximizing the likelihood that maintenance activities can be carried out.
• Hardware watchdogs for rebooting the node: The hardware watchdog triggers a reboot if the system
becomes unresponsive, e.g., in the case of a kernel failure. The watchdog checks if a device file has been
written to at least once. If this is the case, but no subsequent writes occur within a defined period, a
reboot is triggered. A software daemon in the node writes to the device inside the defined interval,
preventing node reboots. Thus, the node will reboot only in the case of severe system corruption.
• Software watchdogs for rebooting the node: The daemon5 that writes to the watchdog device can run
the tools that define a test procedure; it also has a repair procedure to run if the test fails. Should a
repair action fail, the watchdog will trigger a reboot. This watchdog is designed for monitoring system
level operations; more complex tests are handled by the MONROE watchdog.
• MONROE watchdog: High level watchdog that runs at regular intervals to monitor all necessary ser-
vices. This watchdog can implement more complex tests, repair actions, and resolutions. In particular,
it can move the node to maintenance mode (below), trigger a reboot, or initiate a complete reinstal-
lation of the base system through the BootOS. Only if the tests defined in this watchdog succeed, a
successful boot flag is written. In particular, repeated failures to boot the node into a working state will
eventually trigger a reinstallation of the system by the BootOS.
• Maintenance mode: When the node is up, but configuration errors are observed or certain tests fail,
the node goes into maintenance mode. In this mode, all Docker containers are stopped immediately
5http://linux.die.net/man/8/watchdog
13 of 25 Project no. 644399

D1.3Final Implementation
ConfidentialRev. 1.0/ February 28, 2017
Figure 8: Screenshot of the node inventory developed by Celerway for MONROE where the status of thenodes in Spain can be monitored.
and a message is written to syslog (every minute). Additionally, the node status is set to maintenance in
the scheduler, disallowing new experiments. An email is sent to the maintainer of the node to initiate
troubleshooting procedures. Maintenance mode has to be manually reversed by the engineering team
once the issue is resolved.
3.3 Node inventory
Celerway’s inventory system allows monitoring the status of all the nodes in the MONROE platform. Fig-
ure 8 shows how the MONROE maintainers can quickly check the status of all the nodes in their site.
The inventory system is organized around a database that stores the status information sent continuously
by the nodes. For example, each node sends periodically a “heartbeat” message to the inventory to signal
that it remains active. The nodes report also the status of each of their network connections, including the
management interfaces (in the first design iteration), Ethernet and WiFi interfaces.
In addition to monitor the status of the nodes, site maintainers can use the inventory web interface to
change the configuration of the nodes. For example, the status of a node can be defined as “testing,” “de-
ployed,” “storage” or as part of private projects not used in MONROE.
3.4 Manual remote inspection
In order to ease the process of problem diagnosis, particularly during the early phases of the platform
deployment, Celerway enabled an access mechanism to the nodes based on reverse SSH tunnels. MONROE
maintainers can use their private SSH key to access Celerway server and then connect to any nodes at their
sites. As an example, commands such lsusb, ifconfig, or any of the MONROE tools for MiFi monitoring
14 of 25 Project no. 644399

D1.3Final Implementation
ConfidentialRev. 1.0/ February 28, 2017
(mf910-*) can be executed at the nodes. Site maintainers may also reboot nodes to try to fix hardware issues,
if appropriate.
This access mechanism is strictly reserved for MONROE maintainers. Users of the platform (experi-
menters) cannot use the reverse tunnel mechanism, as it enables access to the nodes outside the virtualized
environment provided by containers.
3.5 Node recovery
This section briefs the procedures designed to enable a hard restart and bring automatically the system
back to a known working state.6
The various watchdogs in the nodes check for critical conditions. When triggered, they set a flag signaling
the severity of the issues found. Errors resulting in a reinstall flag being set are resolved by a reinstallation
of the node from the BootOS. This method can recover a node both from file system errors that prevent
system boot-up (e.g., because of frequent sudden power loses in mobile nodes), and also due to software
configurations that lead to loss of connectivity.
The nodes have a two-stage boot loader process. In the first stage, the BootOS, which is kept entirely
in RAM and only uses read-only hard-drive access for its normal operation, is started. The BootOS uses a
standard Linux kernel with the same version used in the MainOS. Upon start, the BootOS verifies that the
filesystem of the node is not corrupt, and that no forced reinstallation has been requested. The MainOS
partition is mounted and that installation is chain-loaded via kexec, performing an in-memory replacement
of the currently executing kernel and starting the new kernel. The MainOS is then booted, which contains
the MONROE system software.
If the filesystem is corrupt and cannot be automatically repaired, or if a forced reinstallation is requested,
the BootOS reinstalls the system from a known working installation image. This is using a simple reinstalla-
tion strategy, where a filesystem archive is unpacked onto a newly formatted filesystem, which is very efficent
(completes in five minutes) and gives consistent installations.
The BootOS has a communication channel with the MainOS, implemented as a file in the filesystem
(/.bootos). This file contains a boot counter (incremented by the BootOS in each boot and zeroed by the
MainOS watchdog after each successful restart) and a boolean flag that the MainOS can use to forcefully trig-
ger a reinstallation. If the boot counter reaches a configurable threshold, it means that the MainOS watchdog
has been unable to run successfully, for whatever reason, and bootos then performs a clean reinstallation to
bring the node back into a known working state.
4 User access and scheduling system
User access to the experimental platform is provided via a web interface that enables users to schedule
and run new experiments, monitor their status and collect results. The user interface also enables monitor-
ing of the node status and location. Finally, the interface shows the remaining quotas and history for each
user.
The user interface is divided in two parts. First, web content is written using a combination of HTML and
AngularJS (Javascript) modules with Bootstrap support. Second, the scheduling system is a Python appli-
cation that uses SQLite 3 for data storage. Nginx is the server used to serve the web content and to act as a
proxy for the scheduler.
6Further information is provided in Deliverable 2.3.
15 of 25 Project no. 644399

D1.3Final Implementation
ConfidentialRev. 1.0/ February 28, 2017
Design experiment
Configure container
for experiment
Store container in
repository
Schedule container
in testing mode
Deployment + test
MONROE
certification
Schedule
experiment
Deployment /
execution
Retrieval of results
(per node / per
schedule)
Experiment design
phase
Testing phase Experimentation
phase
Figure 9: Experimental workflow.
In addition to the web interface, users may develop their own scripts to access directly the REST API
exposed by the scheduler through our Nginx server. We are developing a reference script to illustrate direct
access to the REST API.
The user interface employs SSL certificates to authenticate MONROE servers and the users. The server
certificate is issued by Let’s Encrypt.7 User certificates are issued by iMinds and are compatible with the
Fed4Fire platform. The user manual explains how to obtain and install user certificates.
4.1 Development cycle
Experiments conducted in the MONROE platform follow the workflow shown in Figure 9. They consist
of three phases: Experiment design, testing and experimentation. During the experiment design phase, the
experiment goals and properties are defined and the container required to deploy it in MONROE nodes is
configured. During the testing phase, the container is executed on nodes specifically devoted to testing new
experiments. If the experiment passes all the safety and behavior tests, a MONROE manager will digitally
sign the container image. Signed containers cannot be further modified without running again through the
testing phase. Finally, the experimenter is free to schedule the experiment container on any nodes, subject
to the specific quotas assigned to their project.During the phase of debugging or test of user experiments, it may be useful to log in directly to the nodes
to run tools from the command line or debug processes during execution. The user interface allows askingfor an SSH connection to the container during execution. For this, the experimenter has to provide a publicSSH key to the scheduler. Once the experiment is running, the user interface will show complete connectionstring that can be employed to connect to the running container in the node. For security reasons, this is theonly occasion when direct SSH access to the nodes is allowed, and can be used only during the developmentphase on testing nodes. Deployed nodes do not allow SSH connections to the containers. An example ofconnection string is:
ssh -o StrictHostKeyChecking=no -o UserKnownHostsFile=/dev/null -i your_private_key
-p 30299 [email protected]
7https://letsencrypt.org/
16 of 25 Project no. 644399

D1.3Final Implementation
ConfidentialRev. 1.0/ February 28, 2017
MEASURING MOBILE BROADBAND NETWORKS IN EUROPE
• Deploy containers. •Start containers. •Monitor container execution. •Stop containers. •Report task status. •Report resource usage.
Nodes
• Manage availability calendar. •Reservation API
Scheduler
Scheduling DB
Heartbeats, schedules
Users (Web interface or direct REST API)
Figure 10: Structure of the scheduling system. The scheduling database is implemented with SQLite 3 andruns in the MONROE server.
4.2 Scheduling system
The scheduling system allows experiment execution guaranteeing no conflicts between them. Figure 10
shows the overall structure of the scheduling system.
The scheduling system is split in two parts. The scheduling server runs on a MONROE server behind an
Nginx proxy. It uses an SQLite 3 database to store user roles, node and experiment status, and schedules. It
offers a REST API that can be accessed through the web user interface or directly through the Nginx proxy
if users develop their own access scripts. The client part of the scheduler runs on each MONROE node. It
periodically contacts the scheduler in the server to send “heartbeats” and traffic statistics, and check for
new schedules for the node. Due to connectivity constraints, particularly in mobile nodes, deployment of
experiments to the nodes is pre-empted relative to the scheduled execution times. When new schedules are
available, the scheduler preloads up to three containers, depending on criteria such as available storage in
the node and time until schedule. It also schedules the start and stop times of each container using operating
system functions. When the time to execute a new container arrives, the operating system executes the
container using the Docker tools. Finally, the scheduler monitors the experiments to check if they exceed
the allocated resources and to transfer any result files and inform of result codes.
4.2.1 Scheduling policies
The following policies are currently respected for the scheduling of experiments:
• Experiment scheduling is based on time slots. Each experiment may request one fixed time slot in the
range of 5 min to 24 h.
• Priority is on a first-come, first-served basis, but user quotas are enforced to ensure fairness in the use
of available resources (currently, data quotas for the MBB subscriptions and execution time).
• Normal user experiments are executed in isolation (except for continuous background MONROE ex-
periments such as ping). However, an experiment may define itself as “shared,” meaning that it will
allow execution of other experiments that also define the same flag. Normal experiments do not share
execution and thus will not be executed concurrently with others, even if those declare themselves as
“shared.”
• The scheduler supports the definition of periodic experiments. The minimum repetition period is 1 h;
the maximum length for a periodic schedule is 1 month. Thus, for example, an experiment may execute
every day at noon for half an hour during two weeks. A periodic schedule is treated as atomic, i.e., all
slots will be allocated or none will be.
17 of 25 Project no. 644399

D1.3Final Implementation
ConfidentialRev. 1.0/ February 28, 2017
Figure 11: Folder containing the results of an individual schedule, transferred to MONROE’s servers.
• Experiments can be scheduled over several nodes concurrently (for any given requested period, peri-
odic or not). Schedules over several nodes are treated as atomic, i.e., if not all nodes are available for
the requested time slots, the whole schedule will be refused.
• Nodes may be of different types: Testing or deployed; static or mobile. They can be placed at different
countries and sites (e.g., Norway, Sweden, Spain). Scheduling requests can specify or reject any type of
node using filters, or simply accept any available node selected automatically by the scheduler.
4.3 Transfer of user experiment results
Any files written during the experiment to the /monroe/results/ directory will be synchronized to the
experiment repository. This operation happens continuously during experiment execution and then upon
its finalization.
The folder contains, in addition to the files generated by the experiment, log files detailing the deploy-
ment, startup and stop phases of the container execution.
The result files and log files can be accessed through the user interface: For experiments that have already
been started, the interface presents a link under the column “Results” that redirects the user to the HTTP
folder (Figure 11) that contains the files already synchronized from the node where the experiment runs to
the repository. In this way, the experimenter can retrieve result files even for partial experiments that fail or
are canceled.
In addition, the experiment may use any network functionalities to communicate with outside servers
as needed (e.g., scp some files to an external server). In order to improve safety, private keys should be
restricted to the experiments and discarded after a reasonable time. Additionally, instead of saving keys in
the container itself, users may want to pass them as additional options during experiment scheduling. The
values will be available during container execution as a JSON file at /monroe/config. This file is created by
the node scheduler. The same effect is achievable when the containers are run manually in user development
nodes adding the -v option to the command line. To map both a locally created config file and the results
folder of the container to a node folder, in development nodes without a scheduler, the following command
line options may be used:
docker run ... -v /monroe/results:/monroe/results
-v /monroe/config:/monroe/config:ro ...
5 Remote repositories and databases
The results of the passive metadata measurements and of the continuous background experiments (e.g.,
ping) are collected in the nodes in JSON format and transferred to the MONROE servers using rsync over
a secure SSH channel. Once at the server, the metadata-importer processes the JSON files and inserts their
18 of 25 Project no. 644399

D1.3Final Implementation
ConfidentialRev. 1.0/ February 28, 2017
contents into the Cassandra database. Each metadata topic and MONROE experiment has its own database
table. The schema of all the tables can be checked at:
https://github.com/MONROE-PROJECT/Database/ (file db_schema.cql).
5.1 Database
MONROE database is based on a NoSQL system, Apache Cassandra version 3.4.8 The database follows
an experiment-oriented design, where user and application queries have a central role in the design. The
database is divided into two collections of tables, one for collected metadata and one for the results of default
experiments:
• Metadata tables:
monroe_meta_
device_gps
device_modem
node_event
node_sensor
• Default experiment tables:
monroe_exp_
ping
http_download
exhaustive_paris
simple_traceroute
tstat_http_complete
tstat_tcp_complete
tstat_tcp_nocomplete
tstat_udp_complete
The primary database is currently located in a virtual machine hosted in a server at KaU. The metadata-
importer runs in the same machine, which is also the destination for the synchronization of the JSON files
arriving from the nodes. In this way, network latencies between components are minimized. Figure 12 shows
the flow of data between components of the MONROE platform, as explained in the following paragraphs.
5.2 Example scripts and utilities
MONROE public git repositories host a small set of examples for accessing the Cassandra database from
Python:
• dailyCassandra2CSV.py: This example corresponds to the tool that produces the daily CSV dumps in
our database servers.
• GPS2KML.py: Given a node number and starting and ending timestamps, this example writes a KML
file with the GPS positions of the node during the specified period. The KML file can be imported
directly in Google Earth.
• CoverageGPS.py: Given a node number and operator name, this example extracts data from the GPS
and modem metadata tables between two specified timestamps. The data are then correlated to pro-
duce a KML file that shows, for every position, the type of connection and signal quality detected by the
modem connected to the specified operator. The files Mark_*.png must be present in the same folder
than the generated KML file when opening it with Google Earth.8http://cassandra.apache.org/
19 of 25 Project no. 644399

D1.3Final Implementation
ConfidentialRev. 1.0/ February 28, 2017
MONROE Server at KaU
IMDEA Server 2 IMDEA Server 1
SSHtunnel
JSON Files
Metadataimporter
Cassandra DB
Backupscripts
CSV dumps
Compressed JSON files
WebUI
Nodes
Rsync over SSH
tunnel
(Cron job)Rsync over SSH
Storage
(Cron job)Rsync over SSH
Metadata importer
Cassandra DBreplica
Compressed JSON files
External users
Figure 12: Flow of data between components of the MONROE platform, including backup servers and accesspoints for external users.
5.3 Access to the data
External users can access MONROE metadata and the results of the default experiments in three ways.
First, a dump of every table in the Cassandra database is generated in the main database server daily at 07:00
CET. The files are moved to a location that is accessible through the web user interface at 12:00 CET. In this
way, users can easily get a daily download of the new contents for all the database tables in the previous
day.9 This process can even be automated, e.g., using wget with the certificate that users employ normally
to access the user interface. The URL for accessing the daily CSV dumps is:
https://www.monroe-system.eu/user/dailyDumps/
Second, users can access a Cassandra database replica located at IMDEA directly. To avoid that corrupted
data from this publicly-accessible replica propagates to the main MONROE database, this replica is not di-
rectly connected to the main one. Instead, the compressed JSON files are pushed into that machine by the
machine that acts as backup at IMDEA. That is, compressed JSON files are copied by a machine at IMDEA
that acts as backup server and this same machine copies them to a different machine at IMDEA that hosts
the Cassandra open replica. The process starts everyday at about 09:00 CET (just when the files are copied
from the main MONROE servers at KaU). A normal metadata-importer process runs in the replica machine
to parse the JSON files and import them into the database, just as it happens in the primary database copy.
As it takes some time to process the quite large number of JSON files that the nodes generate every day, data
from the previous day is normally available in the replica around noon.
Users access the database replica through an SSH connection. However, the user they use has no permis-
9Our automated scripts run on a server that uses CET times, but timestamps from the nodes refer always to UTC time. Thus, usersshould be aware of changing Winter/Summer calendars when looking for data at sensitive day boundaries.
20 of 25 Project no. 644399

D1.3Final Implementation
ConfidentialRev. 1.0/ February 28, 2017
sion to run a shell in the server. Thus, they can only use the connection to establish a tunnel to a port at their
local machines. Afterwards, they are free to write their own scripts that connect to their local port as if they
were connected directly to the database replica. Queries executed by the script run in our database replica
server, while any post-processing performed by their scripts runs locally in their machines. This helps also
to ease the load in our servers.
Finally, all data produced by the MONROE consortium will be published as OpenData periodically in
Zenodo repository.
5.4 Backup systems
The JSON files that arrive from the nodes are compressed daily at 03:00 CET to a folder in the database
machine. A cron script running in a machine at IMDEA Networks uses rsync over a secure SSH tunnel to
copy the compressed files for off-site backup purposes. The backup is performed daily at 09:00 CET. IMDEA
personnel produces additional local copies of the backup files discretionarily.
The CSV files containing the daily dumps of the database tables are copied to the same machine at IMDEA
every day at 09:00 CET.
6 Visualization tool
Data and metadata stored in the database can be visualized using MONROE’s web-based visualization
tool. This tool provides a graphical representation of the MONROE platform, including interactive graphs
such as time-based performance measurements, connection type/quality tracking and GPS location. As an
example, Figure 13 shows the main page of the visualization tool and Figure 14 presents the basic statistics
reported for a concrete node in a given 6 h period. Figure 15 details the RTT graph for the ping experiment
across all its MBB interfaces.
From an architectural point of view, the visualization tool is composed of two layers:
• Back-end server: Connects to the MONROE (Cassandra) database to retrieve node capabilities, device
positions and monitoring information. Data is exposed to the upper layer through a REST interface.
• Front-end client: Handles web pages and their contents, including third-party libraries that create
formatted output (e.g., charts, maps, tables).
The back-end layer is based on NodeJS and the Express web application framework. The front-end layer
is implemented using the AngularJS javascript framework.
The visualization tool is publicly accessible from a server hosted by KaU at:
http://visual.monroe-system.eu
7 Conclusions
This document has presented that implementation of the MONROE platform at M24, explaining the
modifications introduced to cope with the difficulties encountered during the development phase and the
feedback from the first users of the platform. In particular, this document has covered the software archi-
tecture of the platform, from the software running in the nodes to the backup scripts in the different servers.
Particular interest has been placed on explaining the user interface and scheduling systems, the manage-
ment and maintenance systems and the metadata visualization tool.
21 of 25 Project no. 644399

D1.3Final Implementation
ConfidentialRev. 1.0/ February 28, 2017
Figure 13: Main page of the MONROE visualization tool showing the location of nodes at the different plat-form sites.
22 of 25 Project no. 644399

D1.3Final Implementation
ConfidentialRev. 1.0/ February 28, 2017
Figure 14: Basic statistics shown for a node built from data gathered through the MONROE platform meta-data database.
23 of 25 Project no. 644399

D1.3Final Implementation
ConfidentialRev. 1.0/ February 28, 2017
Figure 15: Interactive RTT chart produced by the MONROE visualization tool.
24 of 25 Project no. 644399

D1.3Final Implementation
ConfidentialRev. 1.0/ February 28, 2017
Disclaimer
The views expressed in this document are solely those of the author(s). The European Commis-
sion is not responsible for any use that may be made of the information it contains.
All information in this document is provided “as is”, and no guarantee or warranty is given that
the information is fit for any particular purpose. The user thereof uses the information at its sole
risk and liability.
25 of 25 Project no. 644399