montana highway patrol 2015 annual report€¦ · montana highway patrol 2015 annual report photo...
TRANSCRIPT

Montana Highway Patrol 2015 Annual Report
Photo provided by Trooper Seth Adams – Sunset near Culbertson Prepared by the Montana Highway Patrol

Montana Highway Patrol 2014 Annual Report
Table of Contents
Content Page Table of contents Attorney General Tim Fox Colonel Tom Butler Division Goals Mission Statement Core Values Montana Highway Patrol District Map Montana Highway Patrol Districts District 1—Missoula 1 District 2—Great Falls 2 District 3—Butte 3 District 4—Billings 4 District 5—Glendive 5 District 6—Kalispell 6 District 7—Bozeman 7 District 8—Havre 8 Strategic Traffic Enforcement Team 9 Highway Patrol Activity 10 General Crash Information Annual Traffic Rates 11 Where Crashes Occurred 12 Crashes by County 13 Crashes by Day of Week 14 Crashes by Month 15 Crashes by Light Condition 16 Crashes by Road Condition 17 Crashes by Weather Condition 18 Crashes by Trafficway 19 Crashes by Collision 20

Vehicle Information Vehicles by First Harmful Event 21 Vehicles by Most Harmful Event 22 Vehicles by Body Style 23 Motorcycle Crashes 24 Helmet Use 25 Occupant Information Driver-Related Contributing Circumstances 26 Top 10 Contributing Circumstances Chart 27 Drivers by Belt Use 28 Non-Drivers by Belt Use 29 Crash/Injury Severity Daylight Hours 30 Crash/Injury Severity Non-Daylight Hours 31 Drivers by Age and Sex Chart Fatality Information Fatalities by Age and Sex Chart Fatalities by County 1935-2010 32-40 Fatal Calendar 41 Fatalities during Major Holiday Periods 42 Total Fatalities Chart 2001-2020 43


OUR MISSION
The mission of your Montana Highway Patrol is to focus on
safeguarding the lives, property, and constitutional
rights of people traveling the ways of our state.

Service is what the MHP is about. Service is “to be of assistance to.” This can take the form of: Service to the citizens of Montana, Service to those passing through our state, Service to other agencies, and Service to each other. Many times, this service is performed through the enforcement of traffic and criminal codes. For example, by removing a DUI suspect from our highways, we have potentially saved an innocent person from death or injury. The same goes for enforcement of speed and safety belt violations. Changing human behavior through education and enforcement of the standards set by society serves all. Integrity means having the personal ability to be honorable and upright and exercising that ability in every situation. Basically, we are to be honest in our dealings with each other, our agency, the citizens that we serve, and ourselves. This value is the key to everything else we do. It is the behavioral foundation of the individual employee, who in turn is the foundation of the agency. Without integrity on an individual or collective level, we are nothing. Respect is an unbiased consideration and regard for rights, values, beliefs and property. It is much more than just being polite; it is a deeper commitment to the beliefs stated in the Constitution of the United States, which is something those of us in uniform took an oath to uphold. Respect can and must be shown to all those we contact, even those who may not respect us or our authority to enforce society’s laws. These core values will be the foundation on which the vision is built. The vision in turn will decide the direction that the agency will take in the future. The Colonel has made it clear that it is his desire that the MHP become a leader in the world of law enforcement in the northwestern United States. Something this bold will take the input and efforts of all of us.

MONTANA HIGHWAY PATROL DISTRICTSMONTANA HIGHWAY PATROL DISTRICTS
Scale in Kilometers
Scale in Miles
10 0 10 20 30 40 505
10 0 10 20 30 40 505
PREPARED BY THESTATE OF MONTANA
DEPARTMENT OF TRANSPORTATIONROAD INVENTORY AND MAPPING SECTIONCreated January 2014 in ArcGIS 10.2 using ArcMap. Esri, Inc.
NAD 1983 StatePlane Montana FIPS 2500Lambert Conformal Conic
L i n c o l n
F l a t h e a d
S a n d e r sL a k e
G l a c i e r
M i n e r a l
M i s s o u l a
R a v a l l i
B e a v e r h e a d
L e w i sa n d
C l a r k
J e f f e r s o nG r a n i t e
P o w e l l
D e e rL o d g e
S i l v e r B o w
M a d i s o n
G a l l a t i nP a r k
S w e e t G r a s s
B r o a d -w a t e r
M e a g h e r
W h e a t l a n d
T o o l e
L i b e r t y
H i l l
C h o u t e a u
C a s c a d e
T e t o n
J u d i t hB a s i n
P o n d e r a
B l a i n eP h i l l i p s V a l l e y
F e r g u sP e t r o l e u m G a r f i e l d
D a n i e l s S h e r i d a n
R o o s e v e l t
M c C o n e
R i c h l a n d
D a w s o n
P r a i r i eW i b a u x
G o l d e nV a l l e y
M u s s e l s h e l l
Y e l l o w s t o n e
S t i l l -w a t e r
C a r b o nB i g H o r n
F a l l o n
C a r t e rP o w d e rR i v e r
C u s t e r
T r e a s u r e
R o s e b u d
Map Legend
County
MHP Districts
Montana Highway PatrolDistrict Number4

1
District I - Missoula 2681 Palmer, Suite B
Missoula, MT. 59808-1700 Phone: (406) 329-1500 Fax: (406) 329-1549
Commander Captain James Kitchin Detachments
111 Missoula Sgt. Shawn Smalley (406) 329-1514 112 Missoula Sgt. Sean Finley (406) 329-1513 113 Hamilton Sgt. Scott Bennett (406) 777-2517 114 Superior Sgt. Roman Zylawy (406) 822-6699
2013 2014 2015 Population 167,169 167,169 169,335 FTE Uniform Positions 32 32 32 Vehicle Miles Driven 745,748 724,555 720,697 Calls for Service 27,317 28,187 26,838 Assists Citizen 591 2,249 2,392 Crashes Investigated 1,728 1,956 2,132 Traffic Stops 16,647 17,221 14,490 Total Citations 11,865 12,317 12,096 Total Warnings 19,108 22,442 22,860 Total Fatal Crashes in Area 30 24 26

2
District II – Great Falls
812 14th Street North Great Falls, MT 59401-5595
Phone: (406) 453-1121 Fax: (406)454-2119 Commander Captain Chad Dever Detachments 212 Great Falls Sgt. Ben Havron (406) 453-1121
213 Great Falls Sgt. Josef Kinsey (406) 453-1121 222 Lewistown Sgt. Paul Pfau (406) 538-8718
2013 2014 2015
Population 109,354 109,354 109,869 FTE Uniform Positions 22 22 22 Vehicle Miles Driven 568,862 578,454 549,526 Calls for Service 14,493 15,253 16,636 Citizen Assists 507 1,442 1535 Crashes Investigated 784 840 930 Traffic Stops 11,153 10,759 10,489 Total Citations 7,506 7,598 7,611 Total Warnings 12,285 12,830 13,467 Total Fatal Crashes in Area 15 23 22

3
District III - Butte
3615 Wynne Butte, MT. 59701
Phone: (406) 494-3233 Fax: (406) 494-8264
Commander Captain Gary Becker Detachments 311 Butte Sgt. Tammy Perkins (406) 533-6622 313 Butte Sgt. Dave Oliverson (406) 533-6623 321 Helena Sgt. Jay Nelson (406) 442-0477 322 Helena Sgt. Alex Betz (406) 442-0476
2013 2014 2015 Population 139,458 139,458 140,707 FTE Uniform Positions 29 29 29 Vehicle Miles Driven 788,516 846,135 795,281 Calls for Service 27,717 27,201 25,169 Citizen Assists 452 2,122 2,480 Crashes Investigated 1,511 1,731 1,797 Traffic Stops 18,249 17,248 13,100 Total Citations 12,010 10,935 10,265 Total Warnings 15,752 16,565 14,674 Total Fatal Crashes in Area 25 21 28

4
District IV - Billings 615A South 27 Street Billings, MT 59101
Phone: (406) 896-4351 Fax: (406) 896-4355
Commander Captain Keith Edgell
Detachments
421 Billings Sgt. Scott Ayers (406) 896-4357 422 Billings Sgt. Craig Baum (406) 896-4359
423 Columbus Sgt. Tony Beehler (406) 322-6173 424 Billings Sgt. John O’Neill (406) 896-4358 2013 2014 2015
Population 187,870 187,870 192,270 FTE Uniform Positions 32 32 32 Vehicle Miles Driven 835,368 745,405 784,824 Calls for Service 23,036 22,050 24,337 Citizen Assists 669 2,576 2,813 Crashes Investigated 1,679 1,637 1,808 Traffic Stops 12,750 11,233 11,309 Total Citations 10,050 8,864 9,719 Total Warnings 12,011 11,640 14,216 Total Fatal Crashes in Area 38 27 39

5
District V - Glendive 76 Highway 16
Glendive, MT 59330 Phone: (406) 377-5238 Fax: (406) 377-8504
Commander Captain Edward Hilbert Detachments
511 Glendive Sgt. Troy Muri (406) 377-5238 511 Wolf Point Sgt. Jeffrey Kent (406) 653-6708 512 Miles City Sgt. Daniel Martin (406) 874-3395 514 Sidney Sgt. Nyle Obergfell (406) 433-4475
2013 2014 2015 Population 77,017 77,017 78,997 FTE Uniform Positions 33 33 33 Vehicle Miles Driven 921,699 818,130 1,003,590 Calls for Service 23,673 20,735 25,962 Citizen Assists 863 1,934 2,736 Crashes Investigated 917 892 962 Traffic Stops 18,591 15,687 19,323 Total Citations 11,749 9,443 12,431 Total Warnings 20,152 16,908 26,307 Total Fatal Crashes in Area 25 25 24

6
District VI - Kalispell 73 Alder Drive
Kalispell, MT 59901 Phone: (406) 755-6688 Fax: (406) 756-6606
Commander
Captain Duane Bowers Detachments 621 Libby Sgt. Neil Duram (406) 293-5150
622 Kalispell Sgt. David Baggs (406) 755-6688 623 Polson Sgt. Josh Brown (406) 883-4766 624 Kalispell Sgt. Larry Adorni (406) 755-6688
2013 2014 2015 Population 140,110 140,110 143,148 FTE Uniform Positions 31 31 31 Vehicle Miles Driven 640,501 665,005 760,877 Calls for Service 20,517 21,806 22,600 Citizen Assists 608 2,079 2,528 Crashes Investigated 1,846 2,002 2,089 Traffic Stops 13,823 13,790 12,188 Total Citations 8,393 8,369 9,291 Total Warnings 16,211 17,142 18,924 Total Fatal Crashes in Area 34 20 22
Population

7
District VII - Bozeman 1045 Reeves Road East, Suite B
Bozeman, MT 59718 Phone: (406) 587-4525 Fax: (406) 587-4534
Commander Captain Mark Wilfore
Detachments 712 Bozeman Sgt. Patrick McLaughlin (406) 587-4525 721 Bozeman Sgt. Patrick McCarthy (406) 587-4525 723 Bozeman Sgt. Glen Barcus (406) 587-4525 725 Livingston Sgt. Eric Gilbert (406) 222-4618 2013 2014 2015 Population 123,594 123,594 128,528 FTE Uniform Positions 29 29 28 Vehicle Miles Driven 824,717 780,675 741,493 Calls for Service 21,888 22,736 23,869 Citizen Assists 317 1,777 1,818 Crashes Investigated 1,587 1,721 1,849 Traffic Stops 13,937 14,396 12,293 Total Citations 8,222 7,927 7,710 Total Warnings 14,839 16,801 16,726 Total Fatal Crashes in Area 16 21 22

8
District VIII - Havre 1708 Second Street West, Suite A
Havre, MT 59501 Phone: (406)-265-6420 Fax: (406)-265-6430
Commander
Captain James Hunter Detachments
811 Shelby Sgt. Robert Bender (406) 424-8778 821 Havre Sgt. Jason Wickum (406) 265-6420
2013 2014 2015 Population 60,569 60,569 60,725 FTE Uniform Positions 17 17 17 Vehicle Miles Driven 574,244 529,164 460,376 Calls for Service 13,530 14,045 13,053 Citizen Assists 472 962 837 Crashes Investigated 578 487 521 Traffic Stops 9,997 10,324 9,027 Total Citations 6,964 6,684 5,957 Total Warnings 9,921 10,988 10,084 Total Fatal Crashes in Area 20 15 21

9
SAFETY ENFORCEMENT TRAFFIC TEAM (SETT)
Sgt Phil Freed Trooper Lynwood Bateman Trooper Jeremy Lee Trooper Barry Mitchell Trooper Dell Aman Trooper Jonathan Scheer In 2013 the name for the STET team of the Montana Highway Patrol was changed to Safety Enforcement Traffic Team (SETT). Funded by the Department of Transportation, Highway Traffic Safety Division, this team of troops consists of 5 full-time troopers and 1 sergeant. The SETT team provides high visibility enforcement to selected areas and regions of the state using strategically deployed, aggressive, inter-agency enforcement patrols. The team bolsters high visibility enforcement efforts to educate the public about a variety of behaviors that contribute to traffic crashes, including the dangers of speeding, impaired driving, aggressive driving, distracted/inattentive driving, and the lack of safety belt usage. SETT enforcement has had a very positive effect on the areas patrolled, the 4,123 hours of concentrated enforcement during fiscal year 2015 yielded:
2013 2014 2015 Suspended licenses 198 333 339 Uninsured motorists 109 212 171 Seat belt citations 1,151 1,137 1,080 DUI and drug arrests 170 448 416 Speed citations 1,023 921 1,121 Speed warnings 1,345 1,024 783 Total citations and warnings 10,286 11,587 10,468 Total citizen contacts 4,799 4,970 4,444

2,578 2,177 1,979 2,005 2,240 2,434769 578 545 637 681 699
39,222 35,314 37,068 35,983 34,757 34,56611,517 11,038 9,202 7,739 7,994 8,44712,039 10,552 8,797 10,515 10,344 11,11085,089 78,452 78,610 76,759 77,088 80,439
160,716 151,552 139,528 126,760 135,285 152,172
Stolen Vehicles Recovered 23 4 29 37 40 70Warrants Served 834 455 392 507 513 573Traffic Stops 106,146 95,959 118,622 115,147 110,658 102,219
13,361 10,291 9,165 9,611 10,086 10,9298,513 5,932 5,771 6,746 8,895 8,8788,441 6,219 5,651 6,174 13,959 14,4309,323 6,783 6,805 7,363 7,339 8,252
622 442 440 411 502 459392 870 958 1,235 1,953 2,539429 312 336 296 136 141
4 7 10 17 16 1654,620 52,304 156,784 173,171 172,464 178,464
6,529,534 5,736,271 6,160,140 6,127,618 6,070,527 6,251,4714,243 4,253 4,059 4,206 4,230 4,273School Bus Inspections
Total Warnings
2013
2010 2013
Total Miles Driven
Illegal Drug ArrestsIllegal Possession, Alcohol
Safety Education Talks
Number of:
Furn. Liquor to a MinorCalls for Service
2011
Seat Belt Total Citations
D.U.I./Per Se
2012
Highway Patrol Activity
2010Citations Issued 2011 2012 2014
2014
2015
2015
Assist PublicAssist Other Gvt. Agency
Investigations - Traffic non-accidentAssist Other Law Enf.
Speed - Basic Rule Speed - Over Legal Liability Insurance
10

11
ANNUAL TRAFFIC RATES 2012 2013 2014 2015
Total Crashes 20,295 21,155 22,152 22,927 Fatalities 205 229 192 224 Fatal Crashes 192 203 176 204 Injury Crashes 5,426 5,249 5,357 5,444 # of Injuries 7,470 7,131 7,362 7,596 Property Damage Crashes (PDO) 14,670 15,703 16,619 17,279 Private Property Crashes 414 639 764 578 (Private Property crashes investigated by MHP)
# of Crashes every day 56 58 61 63 One Crash every 26 minutes 25 minutes 24 minutes 23 minutes One Fatality every 43 hours 38 hours 46 hours 39 hours One Injury every 70 minutes 74 minutes 71 minutes 69 minutes # of Persons injured every day 20 20 20 21 # of PDO crashes every day 40 43 46 47
WHEN CRASHES OCCURRED IN 2015 More Crashes Occurred:
Between 5:00 p.m. and 6:00 p.m. than any other hour of the day
On Friday than any other day of the week
In December than any other month of the year
More Fatal Crashes Occurred:
Between 5:00 p.m. and 6:00 p.m. than any other hour of the day
On Monday than any other day of the week
In August than any other month of the year

Fatal *Percent Total *PercentCrashes Change Crashes Change
37 11.00% 4,976 5.00%78 8.00% 8,196 6.00%23 -8.00% 1,559 8.00%32 31.00% 1,244 -2.00%34 38.00% 6,463 5.00%0 0.00% 489 -32.00%
204 14.00% 22,927 4.00%
53%47%
Male 18,931 Drivers InvolvedFemale 13,141Unknown 1,106
Total 33,178
ROADS 2011 2012 2013 2014 2015Interstate 84.40% 82.80% 82.00% 83.56% 86.50%Primary 80.90% 80.10% 67.80% 61.78% 65.90%Secondary* 78.00% 73.71% 74.30%Urban/City 67.60% 65.70% 67.60% 73.76% 70.60%Other 68.80% 70.50% 61.30% 74.91% 71.10%All Roads 76.90% 76.30% 79.00% 77.38% 76.80%
Source: State Highway Traffic Safety Bureau, MT. Dept. of Transportation
12
* New Category starting in 2013
Seat Belt Usage Rates
* Percent change is the percent increase (+) or decrease (-) from the previous year.
Highway PatrolOther Agencies
Where Crashes Occurred 2015
Interstate Highways
Where
Unknown
Primary HighwaysRural RoutesSecondary RoutesUrban Streets
Crashes Investigated By
Total

Beaverhead 202 2 67 133 McCone 28 0 7 21Big Horn 190 11 58 121 Meagher 33 0 18 15Blaine 55 3 18 34 Mineral 320 3 67 250Broadwater 131 2 33 96 Missoula 2,741 15 666 2,060Carbon 222 8 54 160 Musselshell 81 2 25 54Carter 10 2 1 7 Park 364 4 78 282Cascade 2,121 9 465 1,647 Petroleum 15 0 4 11Choteau 96 5 20 71 Phillips 78 2 19 57Custer 226 3 42 181 Pondera 61 0 14 47Daniels 20 0 5 15 Powder River 54 1 11 42Dawson 307 3 47 257 Powell 211 2 50 159Deer Lodge 128 3 38 87 Prairie 53 0 20 33Fallon 25 0 2 23 Ravalli 743 3 127 613Fergus 282 3 66 213 Richland 407 1 60 346Flathead 2,107 12 509 1,586 Roosevelt 141 6 43 92Gallatin 1,872 10 467 1,395 Rosebud 137 4 39 94Garfield 25 1 9 15 Sanders 282 5 79 198Glacier 129 4 50 75 Sheridan 63 1 21 41Golden Valley 20 0 7 13 Silver Bow 729 5 136 588Granite 157 1 32 124 Stillwater 261 2 63 196Hill 308 6 38 264 Sweet Grass 166 1 34 131Jefferson 373 3 104 266 Teton 104 4 24 76Judith Basin 67 3 31 33 Toole 112 1 29 82Lake 571 6 130 435 Treasure 41 0 10 31Lewis & Clark 1,683 12 336 1,335 Valley 93 2 24 67Liberty 20 0 1 19 Wheatland 31 1 6 24Lincoln 252 4 80 168 Wibaux 27 0 7 20Madison 199 6 49 144 Yellowstone 3,753 17 1,004 2,732
Totals 22,927 204 5,444 17,27913
Injury Crashes
Prop Dam Crashes
Crashes by County 2015
County CountyAll Crashes
Fatal Crashes
Injury Crashes
Prop Dam Crashes
All Crashes
Fatal Crashes
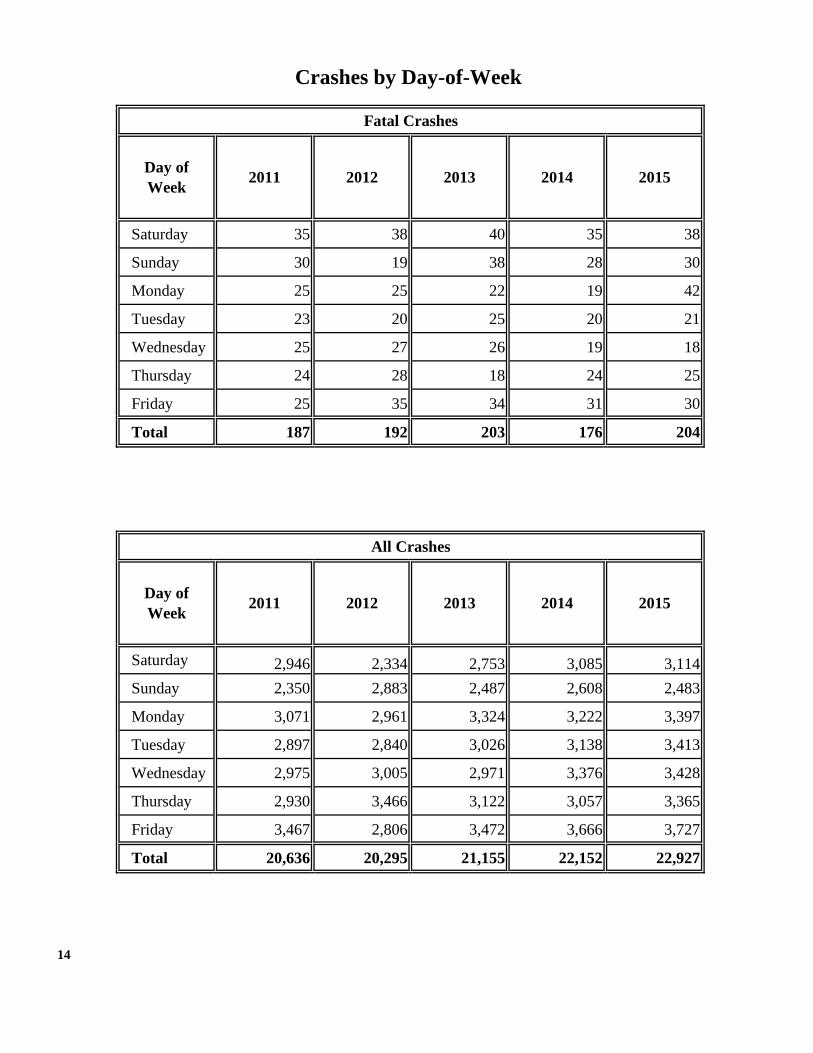
Saturday 35 38 40 35 38
Sunday 30 19 38 28 30
Monday 25 25 22 19 42
Tuesday 23 20 25 20 21
Wednesday 25 27 26 19 18
Thursday 24 28 18 24 25
Friday 25 35 34 31 30
Total 187 192 203 176 204
Saturday 2,946 2,334 2,753 3,085 3,114Sunday 2,350 2,883 2,487 2,608 2,483
Monday 3,071 2,961 3,324 3,222 3,397
Tuesday 2,897 2,840 3,026 3,138 3,413
Wednesday 2,975 3,005 2,971 3,376 3,428
Thursday 2,930 3,466 3,122 3,057 3,365
Friday 3,467 2,806 3,472 3,666 3,727
Total 20,636 20,295 21,155 22,152 22,927
14
Fatal Crashes
Crashes by Day-of-Week
All Crashes
20142013
Day of Week
Day of Week
2011 20132012
2011 2012
2014
2015
2015

January 5 10 13 10 5February 9 10 10 6 5March 5 10 17 8 13April 14 15 16 13 10May 9 13 15 14 16June 13 29 18 18 20July 27 25 15 26 31August 32 27 29 24 37September 15 18 18 17 18October 24 15 26 17 20November 15 11 14 14 15December 19 9 12 9 14
Total 187 192 203 176 204
January 1,188 1,560 2,305 1,980 2,043 February 2,114 1,547 1,395 2,305 1,473 March 1,436 1,469 1,377 1,560 1,427 April 1,259 1,286 1,436 1,188 1,402 May 1,359 1,481 1,542 1,491 1,611 June 1,485 1,697 1,652 1,595 1,918 July 1,782 1,659 1,805 1,778 2,001 August 1,745 1,698 1,779 1,806 1,891 September 1,698 1,616 1,640 1,655 1,945 October 1,627 1,762 1,908 1,677 1,914 November 2,166 2,041 1,967 2,595 2,481 December 1,863 2,244 2,545 2,522 2,821
Total 19,722 20,060 21,351 22,152 22,927
15
All Crashes
2015
Crashes by Month
Month 2014 2015
Month 2014
20122011
2011 2012 2013
2013
Fatal Crashes

Dark-Lighted 14 6 16 7 13Dark-not Lighted 65 74 78 63 65Dawn 1 3 1 2 5Daylight 99 98 104 93 112Dusk 7 9 4 9 8Unknown 1 2 0 2 1Total 187 192 203 176 204
Dark-Lighted 1,830 1,960 1,875 1,911 1,904Dark-not Lighted 4,155 4,324 4,426 4,608 5,047Dawn 393 352 424 431 522Daylight 13,562 12,949 13,693 14,347 14,515Dusk 500 522 488 547 613Unknown 196 188 249 308 326Total 20,636 20,295 21,155 22,152 22,927
16
2014 2015Light Condition 2013
Crashes by Light Condition
Fatal Crashes
Light Condition 2013
All Crashes
2011 2012
2011 2012 20152014

Dry 142 169 162 142 168Wet, Water 16 11 18 15 17Snow or Slush 9 0 7 5 5Ice 12 11 11 9 9Sand, Mud, Dirt, Oil 8 0 2 3 4Debris 0 0 0 0 0Loose Gravel 0 0 0 0 0Other 0 1 0 0 0Unknown 0 0 3 2 1
Total 187 192 203 176 204
Dry 12,901 14,085 13,896 13,081 15,736Wet, Water 1,954 1,710 1,813 1,985 1,877Snow or Slush 2,350 1,884 2,193 3,048 2,288Ice 2,928 2,108 2,772 3,508 2,484Sand, Mud, Dirt, Oil 347 361 292 233 248Debris 0 0 0 0 0Loose Gravel 0 0 0 0 0Other 28 28 26 40 26Unknown 128 119 163 257 268
Total 20,636 20,295 21,155 22,152 22,927
17
Crashes by Road Condition
Road Condition
Fatal Crashes
2013
All Crashes
20152011 2012 2014
2014 2015Road Condition 20132011 2012
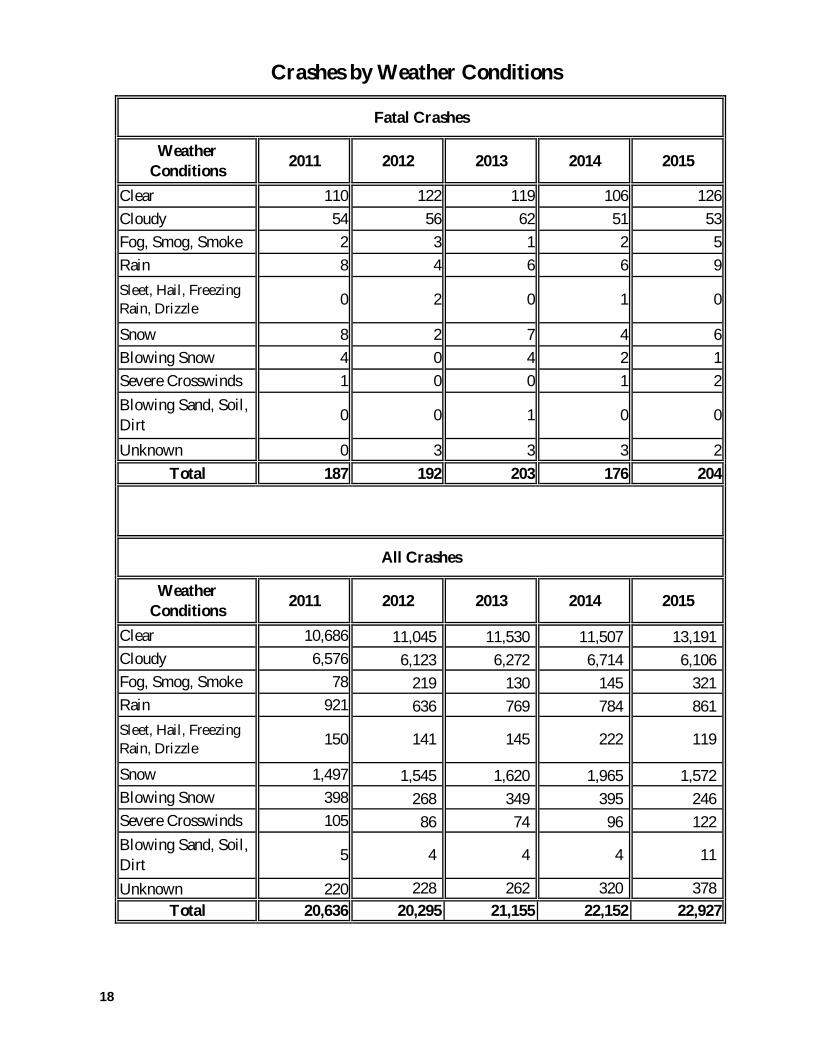
Clear 110 122 119 106 126Cloudy 54 56 62 51 53Fog, Smog, Smoke 2 3 1 2 5Rain 8 4 6 6 9
Snow 8 2 7 4 6Blowing Snow 4 0 4 2 1Severe Crosswinds 1 0 0 1 2
Unknown 0 3 3 3 2Total 187 192 203 176 204
Clear 10,686 11,045 11,530 11,507 13,191 Cloudy 6,576 6,123 6,272 6,714 6,106 Fog, Smog, Smoke 78 219 130 145 321 Rain 921 636 769 784 861
Snow 1,497 1,545 1,620 1,965 1,572 Blowing Snow 398 268 349 395 246 Severe Crosswinds 105 86 74 96 122
Unknown 220 228 262 320 378 Total 20,636 20,295 21,155 22,152 22,927
18
Blowing Sand, Soil, Dirt 4
Sleet, Hail, Freezing Rain, Drizzle
Weather Conditions 2013
5 4
2011 2012
Crashes by Weather Conditions
Fatal Crashes
Weather Conditions 2013 20152011 2012 2014
All Crashes
Blowing Sand, Soil, Dirt
Sleet, Hail, Freezing Rain, Drizzle
1
0 0
0
20
00
1
0
2015
119
11
150 141 145
2014
222
4

Interstate 42 37 37 33 37U.S. Route 96 72 85 72 78State Route 14 30 35 22 32County Road 21 29 11 28 23City Street 13 24 35 21 34Other 1 0 0 0 0
Total 187 192 203 176 204
Interstate 4,710 4,552 4,672 4,739 4,976U.S. Route 7,804 7,527 7,303 7,728 8,196State Route 1,103 1,106 1,157 1,252 1,244County Road 1,546 1,490 1,423 1,553 1,559City Street 5,233 5,207 6,445 6,094 6,463Other 240 413 155 786 489
Total 20,636 20,295 21,155 22,152 22,927
19
Trafficway
All Crashes
2013
2015
20152011 2012
2014
2014
Crashes by Trafficway
Trafficway
Fatal Crashes
20132011 2012

4,652 20.29% 7 3.43% 1,196 21.97%1,720 7.50% 2 0.98% 152 2.79%
551 2.40% 6 2.94% 98 1.80%196 0.85% 1 0.49% 54 0.99%296 1.29% 3 1.47% 98 1.80%
3,576 15.60% 22 10.78% 1,032 18.96%95 0.40% 1 0.49% 13 0.24%30 0.13% 0 0.00% 10 0.18%
445 1.94% 18 8.82% 171 3.14%740 3.23% 2 0.98% 105 1.93%
10,626 46.35% 142 69.61% 2,515 46.20%22,927 99.99% 204 100.00% 5,444 100.00%
30,547 92.11% 173 64.79% 7,421 88.11%1,190 3.59% 43 16.10% 526 6.25%
79 0.24% 0 0.00% 40 0.47%624 1.88% 38 14.23% 242 2.87%
0 0.00% 0 0.00% 0 0.00%723 2.18% 13 4.87% 193 2.29%
33,163 100.00% 267 100.00% 8,422 100.00%
20
Unknown
Single VehicleTotal
Drivers by Police Reported Alcohol/Drugs Presence 2015
Not Reported
Police Reported Alcohol / Drugs Presence
Drivers in All
Crashes
Drivers in Fatal
Crashes
Drivers in Injury
Crashes
Total
Neither Alcohol nor DrugsAlcohol PresentDrugs PresentAlcohol and Drugs Present
Other
Rear EndSideswipe, Same Direction
Collision Type
Sideswipe, Opposite DirectionLeft Turn, Same Direction
Head-On
Crashes by Collision 2015
Left Turn, Opposite DirectionRight Angle
Right Turn, Opposite Direction
All Crashes Fatal Crashes Injury Crashes
Right Turn, Same Direction
All Fatal Injury All Fatal InjuryCrashes Crashes Crashes Crashes Crashes Crashes
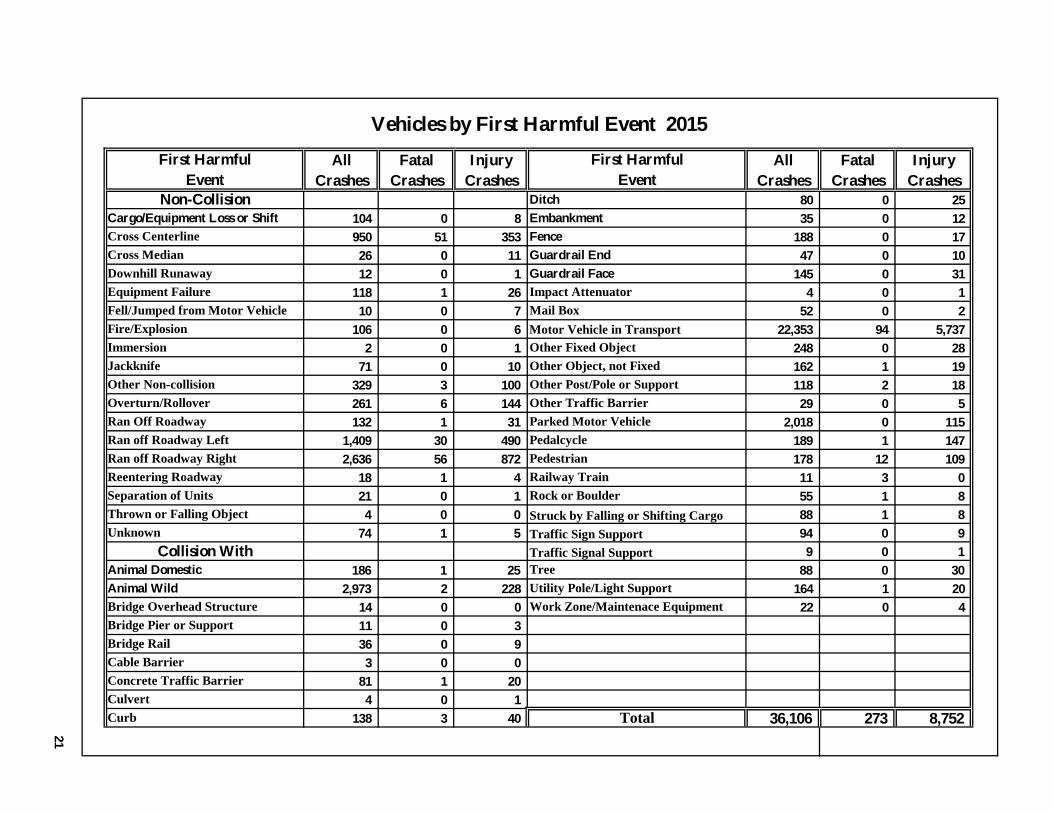
80 0 25104 0 8 35 0 12950 51 353 188 0 1726 0 11 47 0 1012 0 1 145 0 31
118 1 26 4 0 110 0 7 52 0 2
106 0 6 Motor Vehicle in Transport 22,353 94 5,7372 0 1 248 0 28
71 0 10 162 1 19329 3 100 118 2 18261 6 144 29 0 5132 1 31 2,018 0 115
1,409 30 490 189 1 1472,636 56 872 178 12 109
18 1 4 11 3 021 0 1 55 1 84 0 0 88 1 8
74 1 5 94 0 99 0 1
186 1 25 88 0 302,973 2 228 164 1 20
14 0 0 22 0 411 0 336 0 93 0 0
81 1 204 0 1
138 3 40 36,106 273 8,752
21
CulvertCurb
Parked Motor VehiclePedalcycle
Total
Concrete Traffic Barrier
Animal DomesticAnimal Wild
Ran Off Roadway
Separation of Units
Cargo/Equipment Loss or Shift
Downhill Runaway
Immersion
Other Non-collision
Vehicles by First Harmful Event 2015First Harmful
EventNon-Collision
First HarmfulEvent
Impact AttenuatorGuardrail Face
EmbankmentDitch
Cross CenterlineCross Median
Cable Barrier
Mail Box
Reentering Roadway
Equipment FailureFell/Jumped from Motor Vehicle
Collision With
Bridge Overhead StructureBridge Pier or Support
Jackknife
Fire/Explosion
Overturn/Rollover
Ran off Roadway LeftRan off Roadway Right
Unknown
Other Fixed ObjectOther Object, not Fixed
Thrown or Falling Object
Bridge Rail
Other Traffic Barrier
Guardrail EndFence
Utility Pole/Light SupportWork Zone/Maintenace Equipment
Traffic Sign SupportTraffic Signal Support
PedestrianRailway TrainRock or Boulder
Tree
Struck by Falling or Shifting Cargo
Other Post/Pole or Support

22
All Fatal Injury All Fatal InjuryCrashes Crashes Crashes Crashes Crashes Crashes
489 1 13777 0 4 297 8 980 0 0 693 1 630 0 0 171 2 490 0 0 437 1 810 0 0 12 0 1
18 1 15 86 0 1133 3 13 Motor Vehicle in Transport 22,787 120 5,85320 0 7 400 1 5872 0 5 196 0 24
145 0 44 199 2 262,439 100 1,247 17 0 3
0 0 0 2,067 1 1350 0 0 189 1 1480 0 0 185 14 1120 0 0 14 3 10 0 0 115 1 154 0 0 86 1 9
57 0 3 174 1 1224 0 3
187 0 25 482 8 1552,899 0 204 359 1 76
22 0 4 22 0 410 0 571 0 1963 0 2
217 1 4752 0 1762 1 22 36,049 273 8,747
Thrown or Falling Object
Bridge Rail
Other Traffic Barrier
Guardrail EndFence
Utility Pole/Light SupportWork Zone/Maintenace Equipment
Traffic Sign SupportTraffic Signal Support
PedestrianRailway TrainRock or Boulder
Tree
Struck by Falling or Shifting Cargo
Other Post/Pole or Support
Cable Barrier
Mail Box
Reentering Roadway
Equipment FailureFell/Jumped from Motor Vehicle
Collision With
Bridge Overhead StructureBridge Pier or Support
Jackknife
Fire/Explosion
Overturn/Rollover
Ran off Roadway LeftRan off Roadway Right
Unknown
Other Fixed ObjectOther Object, not Fixed
Cargo/Equipment Loss or Shift
Downhill Runaway
Immersion
Other Non-collision
Vehicles by Most Harmful Event 2015Most Harmful
EventNon-Collision
Most HarmfulEvent
Impact AttenuatorGuardrail Face
EmbankmentDitch
Cross CenterlineCross Median
CulvertCurb
Parked Motor VehiclePedalcycle
Total
Concrete Traffic Barrier
Animal DomesticAnimal Wild
Ran Off Roadway
Separation of Units

Body Style All Crashes Fatal Crashes Injury Crashes
Passenger Car (Unknown)
Sport Utility 7,151 52 1,761Passenger Van
(Vans and Mini Vans)Cargo Van (10,000 lbs or less) 121 0 25Pickup
Motorhome 79 1 10School Bus 89 1 17Transit Bus 13 0 2Motor Coach 4 0 0Other Bus 47 0 7Motorcycle 473 24 377Moped 15 0 11Low Speed Vehicle (Includes bicycles)Other Light Trucks (includes tow trucks in transit)All Terrain Vehicle 92 11 69Snowmobile 5 0 2Medium/Heavy Trucks 1,356 17 279Other
Snowplow 26 0 5Unknown 1,326 0 237
Total 36,110 273 8,751
23
Vehicles by Body Style 2015
(Subcompact, compact, mid-size, large passenger cars and station wagons)
(Small and standard pickups and pickups with campers)
(includes Ambulances, fire trucks, farm tractors and machinery and construction
equipment-working and not)
14,038 75 3,367
1,376 3 321
9,018 85 2,062
145 1 114
102 1 23
634 2 62

4602436725408
Total Fatal Total Fatal Total Fatal110 6 97 0 13 631 7 1 0 30 725 4 19 1 6 38 0 6 0 2 0
276 5 44 2 232 310 2 9 2 1 0
460 24 176 5 284 19
24
Persons Injured
* Rural = Statewide minus City
340Other Trafficways
Alcohol PresentAlcohol and Drugs PresentDrugs Present
*Rural
Total
24Total
Unknown
Statewide City
Not Reported
(drivers only)Neither Alcohol nor Drugs Present
Motorcyclist Sobriety
3460
City Streets
Total69216533485
Fatal
County Roads
Where Crash OccurredInterstate HighwaysU.S. Highways
3122State Highways
Total CrashesFatal CrashesInjury CrashesPersons Killed
Motorcycle Crashes 2015

Used Not Used Not Used Not Used Not Used Not Used Not
1 2 0 0 1 2 0 0 0 0 0 01 4 0 0 0 2 0 0 1 2 0 03 5 0 1 0 2 0 1 3 3 0 0
28 21 0 0 11 16 0 0 17 5 0 032 40 2 3 14 20 0 1 18 20 2 2
119 153 1 10 22 71 0 1 97 82 1 916 12 2 3 4 2 0 1 12 10 2 21 1 0 0 0 1 0 0 0 0 0 0
201 238 5 17 52 116 0 4 148 122 5 13
Used Not Used Not Used Not Used Not Used Not Used Not
2 1 0 0 0 1 0 0 2 1 0 02 2 0 0 0 0 0 0 2 1 0 00 0 0 0 0 0 0 0 0 0 0 00 2 0 0 0 2 0 0 1 2 0 02 8 0 1 0 4 0 1 2 8 0 0
20 21 0 2 1 10 0 0 19 21 0 20 1 0 0 0 0 0 0 0 1 0 00 0 0 0 0 0 0 0 0 0 0 0
26 35 0 3 1 17 0 1 26 34 0 2
25
* Rural = Statewide minus City
Total
25 to 3435 to 6465 & OverNot Stated
20 to 24
65 & Over
Helmet Usage by Age of PassengerStatewide City *Rural
Age Fatal Total FatalTotal Fatal Total
14 & Under15 to 1718 to 19
Helmet Usage by Age of Driver 2015*Rural
Total FatalAge Total Fatal
Total
Statewide City
Total Fatal
Not Stated
14 & Under15 to 1718 to 1920 to 2425 to 3435 to 64

26
Totals TotalFatals Totals Fatal Total Fatal Total Fatals Total Fatals Total Fatal
Cell Phone, Electronic Comm Device 0 33 2 54 0 31 0 30 0 63 2 215Disregarded Traffic Mark/Sign/Signal 0 111 1 266 1 15 0 14 1 171 3 583Exceeded Posted Speed Limit 1 16 6 46 4 7 1 12 3 58 15 169Failed to Keep in Proper Lane 1 151 10 207 2 24 1 37 2 105 16 556Failed to Yield Right of Way 2 314 6 936 1 65 1 49 3 908 13 2298Fell Asleep, Fainted, Etc. 0 112 4 140 0 29 0 29 0 67 4 385Followed too Closely 0 322 2 664 0 46 0 21 0 248 2 1305Improper Backing Operation 0 22 0 95 0 10 0 63 0 490 0 680Improper Parking or Parking Maneuver 0 3 0 13 0 2 0 6 0 86 0 110Improper Passing 0 10 0 59 0 9 0 4 0 32 0 114Failed to use Proper Signal(s) 0 4 0 12 0 2 0 2 0 6 0 26Improper Turn 0 56 1 166 0 12 0 6 0 103 1 345Inattentive driving 14 1106 16 1834 3 246 5 294 6 1509 44 5077License Restriction Non-Compliance 0 4 0 18 0 1 0 0 0 12 0 35Operated Motor Vehicle in Erratic, Reckless, Careless, Negligent Manner 2 69 10 166 8 71 6 99 5 234 31 701Other Contributing Actions 1 146 1 252 0 30 0 53 1 284 3 771Other Electronic Devices (Navigation Device, DVD Player, Etc.) 0 14 0 22 0 13 0 11 0 26 0 86Over-Correcting, Over- Steering 2 98 5 103 1 38 2 58 0 89 10 406Ran Off Roadway 6 131 8 188 8 81 1 150 3 197 26 799Swerved or Avoided Due to Wind, Slippery Surface, Motor Vehicle, Object or Person in Roadway, Etc. 0 120 4 152 0 43 0 57 1 63 5 445Too Fast For Conditions 6 887 4 606 2 136 6 296 6 648 24 2621 Alcohol Present 9 98 22 260 19 110 14 165 19 313 83 1112 Drugs Present 12 34 27 70 13 27 12 31 11 68 75 380Unknown 0 21 1 56 1 10 1 17 1 82 4 194Wrong Side or Wrong Way 2 9 1 28 0 0 0 7 0 30 3 80
Total 58 3891 131 6413 63 1058 50 1511 62 5892 364 19493
Driver-Related Contributing CircumstancesBy Roadway Type 2015
Rural/County Urban/LocalInterstate Primary SecondaryContributing Circumstances

Inattentive driving 3,646 Alcohol PresentToo Fast For Conditions 3,317 Drugs PresentFailed to Yield Right of Way 2,216 Ran Off RoadwayOperated Motor Vehicle in Erratic, 1,658 Operated Motor Vehicle in Erratic,Followed too Closely 1,209 Inattentive drivingAlcohol Present 1,000 Failed to Keep in Proper LaneOther Contributing Actions 783 Too Fast For ConditionsRan Off Roadway 763 Swerved or Avoided Due to Wind,Improper Backing Operation 648 UnknownDisregarded Traffic Mark/Sign/Signal 551 Exceeded Posted Speed LimitFailed to Keep in Proper Lane 538 Failed to Yield Right of WayOver-Correcting, Over- Steering 388 Over-Correcting, Over- SteeringSwerved or Avoided Due to Wind, 428 Disregarded Traffic Mark/Sign/SignalFell Asleep, Fainted, Etc. 397 Cell Phone, Electronic Comm DeviceImproper Turn 356 Wrong Side or Wrong WayDrugs Present 289 Other Contributing ActionsCell Phone, Electronic Comm Device 203 Fell Asleep, Fainted, Etc.Unknown 177 Improper PassingExceeded Posted Speed Limit 140 License Restriction Non-ComplianceImproper Passing 109 Followed too CloselyOther Electronic Devices (Navigation 73 Improper Backing OperationWrong Side or Wrong Way 63 Improper TurnImproper Parking 59 Improper ParkingImproper Signals 23 Other Electronic Devices (Navigation License Restriction Non-Compliance 20 Improper SignalsImproper Lane Change 0 Improper Lane Change
Inattentive driving 5,077 Alcohol PresentToo Fast For Conditions 2,621 Drugs PresentFailed to Yield Right of Way 2,299 Inattentive drivingFollowed too Closely 1,306 Drove in Erratic, Reckless, NegligentAlcohol Present 1,115 Ran Off RoadwayRan Off Roadway 800 Too Fast For ConditionsOther Contributing Actions 771 Failed to Keep in Proper LaneOperated Motor Vehicle in Erratic, 701 Exceeded Posted Speed LimitImproper Backing Operation 680 Failed to Yield Right of WayDisregarded Traffic Mark/Sign/Signal 583 Over-Correcting, Over-Steering

7056362527131786710442356301000000
83754431262416151310

27
5,077
2,6212,299
1,306 1,115800 771 701 680 583
0
1,000
2,000
3,000
4,000
5,000
6,000
Top 10 Contributing Circumstances-All Crashes
8375
44
3126 24
16 15 13 10
0
10
20
30
40
50
60
70
80
90
Top 10 Contributing Circumstances-Fatal Crashes

28
555 183 320 200 82 0 54 1,394
260 19 9 3 0 0 1 292
136 10 12 4 0 0 0 162
21,055 1,963 1,262 298 36 3 228 24,845
2 0 0 0 0 0 2
3791 374 126 49 6 3 1297 5,646
5 6 1 1 3 0 0 16
25,802 2,557 1,730 555 127 6 1,580 32,357
Drivers by Belt Use/Injury Classification 2015
Restraint Use
No Injury
Possible Injury
Non-Incapac. Injury
non-motorists (bicyclists, etc) since belt use does not apply to non-motorists.
Improper Use
Incapac. Injury
* The total number of drivers in this table will be smaller than the total number of drivers in other tables because this table excludes
Fatal Injury Died Prior to Crash Total
None Used
Total
Shoulder Belt Only
Use Unknown
Lap Belt Only
Shoulder & Lap Belt
Unknown
Other

455 111 177 107 34 0 24 908
66 6 3 0 0 0 1 76
181 20 9 4 0 0 1 215
7,652 683 444 100 10 0 48 8,937
1,493 110 38 3 0 0 19 1,663
16 1 2 0 0 0 0 19
1,089 120 48 10 4 1 44 1,316
11 8 5 1 2 0 0 27
10,963 1,059 726 225 50 1 137 13,161
29
Total
None Used
Shoulder Belt Only
Lap Belt Only
Non-Drivers by Belt Use/Injury Classification 2015
Restraint Use
No Injury
Possible Injury
Non-Incapac. Injury
Incapac. Injury
Fatal Injury
Died Prior to Crash Unknown
Improper Use
* The total number of non-drivers in this table will be smaller than the total number of non-drivers in other tables because this table exclude non-motorists (bicyclists, etc) since belt use does not apply to non-motorists.
Shoulder & Lap Belt
Child Safety Seat
Use Unknown
Total
Other

*All Roads
18 47 18 11 16 0 110
123 216 58 44 80 9 530
268 503 106 115 260 43 1,295
402 789 64 72 479 47 1,853
2,218 3,648 408 589 3,264 344 10,471
27 72 10 22 107 17 255
3,056 5,275 664 853 4,206 460 14,514
*AllRoads
72 198 58 28 36 0 392
320 620 165 97 184 29 1,415
607 1,397 267 243 687 127 3,328
1,093 2,383 213 167 1374 135 5,365
5,106 8,792 820 1,240 7566 868 24,392
65 182 22 46 194 19 528
7,263 13,572 1,545 1,821 10,041 1,178 35,420
30
Total
Unknown
Unknown
Crash Severity
Incapacitating Injury
Non-incapacitating Injury
Fatal
Fatal
No Injury
Possible Injury
Possible Injury
Incapacitating Injury
* Injury Severity
Total
Non-incapacitating Injury
Crash/Injury Severity During Daylight Hours 2015
Crash severity represents the most severe injury that was sustained by any person involved in a crash.
Interstate Primary Secondary Rural Urban
Injury severity represents the actual injuries sustained by all the people involved in a crash.
Property Damage Only
Number of Crashes
Number of Injuries
Unknown
Unknown
* All Roads Includes Interstate, Primary, Secondary, Rural and Urban*Injury severity does not include "died prior to accident".
Interstate Primary Secondary Rural Urban
*All Roads
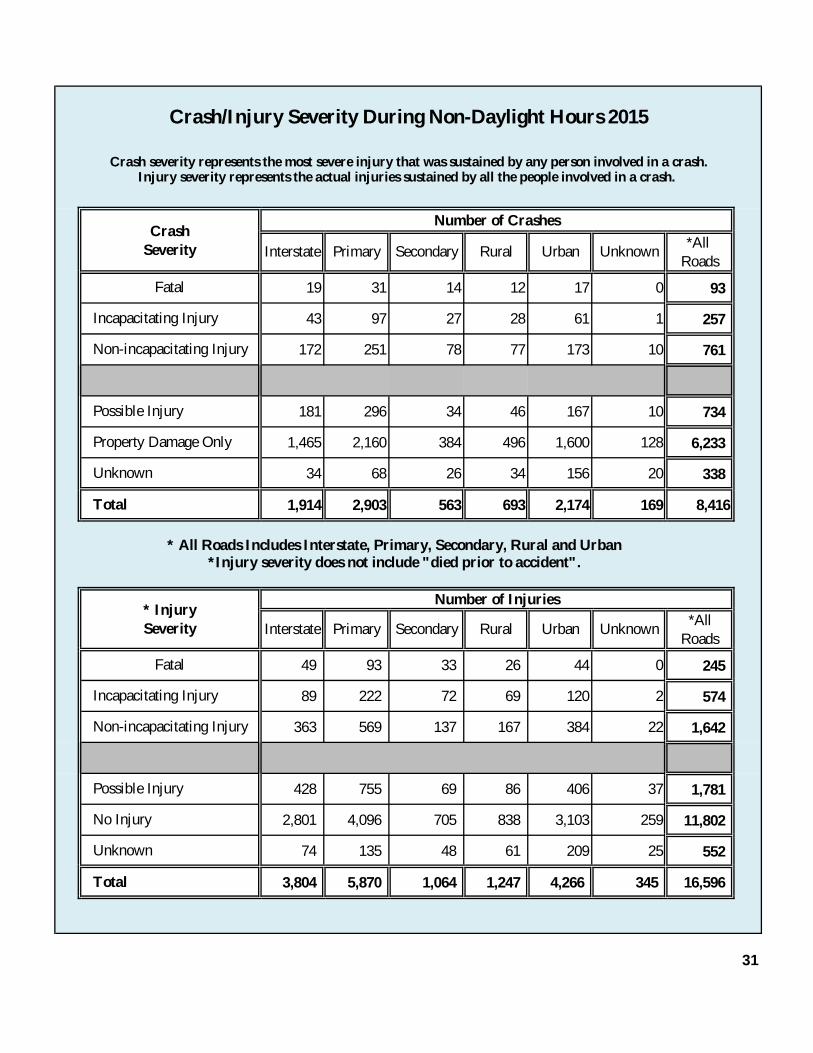
19 31 14 12 17 0 93
43 97 27 28 61 1 257
172 251 78 77 173 10 761
181 296 34 46 167 10 734
1,465 2,160 384 496 1,600 128 6,233
34 68 26 34 156 20 338
1,914 2,903 563 693 2,174 169 8,416
*AllRoads
49 93 33 26 44 0 245
89 222 72 69 120 2 574
363 569 137 167 384 22 1,642
428 755 69 86 406 37 1,781
2,801 4,096 705 838 3,103 259 11,802
74 135 48 61 209 25 552
3,804 5,870 1,064 1,247 4,266 345 16,596
31
Property Damage Only
Number of Crashes
Number of Injuries
Unknown
Unknown
* All Roads Includes Interstate, Primary, Secondary, Rural and Urban*Injury severity does not include "died prior to accident".
Interstate Primary Secondary Rural Urban
Crash/Injury Severity During Non-Daylight Hours 2015
Crash severity represents the most severe injury that was sustained by any person involved in a crash.
Interstate Primary Secondary Rural Urban
Injury severity represents the actual injuries sustained by all the people involved in a crash.
Total
Unknown
Unknown
Crash Severity
Incapacitating Injury
Non-incapacitating Injury
Fatal
Fatal
No Injury
Possible Injury
Possible Injury
Incapacitating Injury
* Injury Severity
Total
Non-incapacitating Injury


32
1935 1936 1937 1938 1939 1940 1941 1942 1943 1944 Page Total 1935 1936 1937 1938 1939 1940 1941 1942 1943 1944 Page
Total
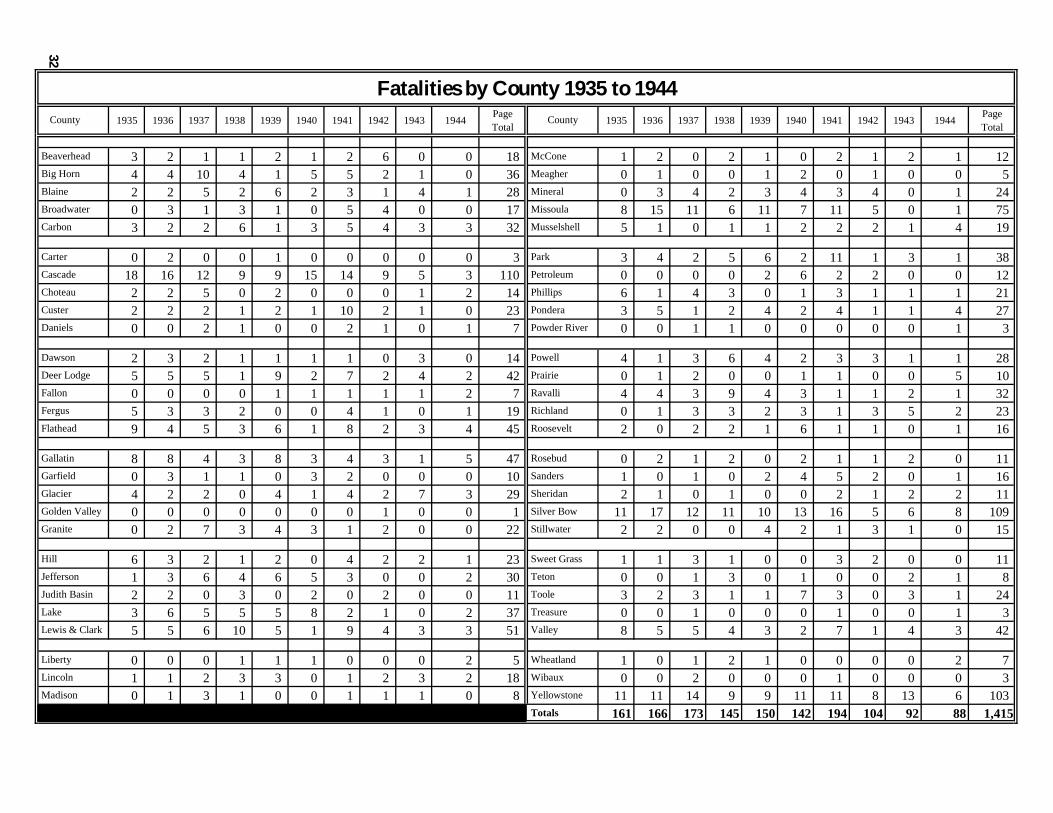
3 2 1 1 2 1 2 6 0 0 18 1 2 0 2 1 0 2 1 2 1 124 4 10 4 1 5 5 2 1 0 36 0 1 0 0 1 2 0 1 0 0 52 2 5 2 6 2 3 1 4 1 28 0 3 4 2 3 4 3 4 0 1 240 3 1 3 1 0 5 4 0 0 17 8 15 11 6 11 7 11 5 0 1 753 2 2 6 1 3 5 4 3 3 32 5 1 0 1 1 2 2 2 1 4 19
0 2 0 0 1 0 0 0 0 0 3 3 4 2 5 6 2 11 1 3 1 3818 16 12 9 9 15 14 9 5 3 110 0 0 0 0 2 6 2 2 0 0 122 2 5 0 2 0 0 0 1 2 14 6 1 4 3 0 1 3 1 1 1 212 2 2 1 2 1 10 2 1 0 23 3 5 1 2 4 2 4 1 1 4 270 0 2 1 0 0 2 1 0 1 7 0 0 1 1 0 0 0 0 0 1 3
2 3 2 1 1 1 1 0 3 0 14 4 1 3 6 4 2 3 3 1 1 285 5 5 1 9 2 7 2 4 2 42 0 1 2 0 0 1 1 0 0 5 100 0 0 0 1 1 1 1 1 2 7 4 4 3 9 4 3 1 1 2 1 325 3 3 2 0 0 4 1 0 1 19 0 1 3 3 2 3 1 3 5 2 239 4 5 3 6 1 8 2 3 4 45 2 0 2 2 1 6 1 1 0 1 16
8 8 4 3 8 3 4 3 1 5 47 0 2 1 2 0 2 1 1 2 0 110 3 1 1 0 3 2 0 0 0 10 1 0 1 0 2 4 5 2 0 1 164 2 2 0 4 1 4 2 7 3 29 2 1 0 1 0 0 2 1 2 2 110 0 0 0 0 0 0 1 0 0 1 11 17 12 11 10 13 16 5 6 8 1090 2 7 3 4 3 1 2 0 0 22 2 2 0 0 4 2 1 3 1 0 15
6 3 2 1 2 0 4 2 2 1 23 1 1 3 1 0 0 3 2 0 0 111 3 6 4 6 5 3 0 0 2 30 0 0 1 3 0 1 0 0 2 1 82 2 0 3 0 2 0 2 0 0 11 3 2 3 1 1 7 3 0 3 1 243 6 5 5 5 8 2 1 0 2 37 0 0 1 0 0 0 1 0 0 1 35 5 6 10 5 1 9 4 3 3 51 8 5 5 4 3 2 7 1 4 3 42
0 0 0 1 1 1 0 0 0 2 5 1 0 1 2 1 0 0 0 0 2 71 1 2 3 3 0 1 2 3 2 18 0 0 2 0 0 0 1 0 0 0 30 1 3 1 0 0 1 1 1 0 8 11 11 14 9 9 11 11 8 13 6 103
161 166 173 145 150 142 194 104 92 88 1,415
Garfield
Glacier
Big Horn
Blaine
Broadwater
Carbon
Daniels
Fatalities by County 1935 to 1944County
Beaverhead
Carter
Cascade
Choteau
Custer
Golden Valley
Granite
Dawson
Deer Lodge
Fallon
Fergus
Flathead
Park
Hill
Jefferson
Lincoln
Judith Basin
Lake
Lewis & Clark
Petroleum
Gallatin
McCone
Meagher
Mineral
Missoula
Musselshell
Phillips
Pondera
Powder River
Powell
Sweet Grass
Prairie
Ravalli
Richland
Roosevelt
Rosebud
County
Wheatland
Wibaux
Yellowstone
Toole
Treasure
Sanders
Sheridan
Silver Bow
Stillwater
Valley
Teton
Totals
Madison
Liberty

1945 1946 1947 1948 1949 1950 1951 1952 1953 1954 Page Total 1945 1946 1947 1948 1949 1950 1951 1952 1953 1954 Page
Total
3 1 5 3 3 0 4 4 3 2 28 0 0 1 1 0 0 1 4 5 2 141 3 6 1 2 2 5 4 7 3 34 0 2 0 1 0 2 4 3 3 1 160 2 8 3 5 8 9 0 8 4 47 1 2 3 0 10 2 2 5 1 4 302 2 2 3 0 2 2 1 0 0 14 8 12 6 4 7 15 3 9 8 8 806 6 6 5 3 5 3 8 7 6 55 1 1 0 2 2 3 2 1 2 3 17
0 0 1 0 0 1 2 0 0 1 5 4 2 0 3 4 2 4 9 3 4 357 12 11 19 4 11 12 14 13 18 121 0 0 0 0 1 2 3 0 0 0 62 2 1 1 2 1 2 5 5 4 25 4 3 3 3 1 4 4 7 2 4 353 7 2 1 3 6 2 5 4 7 40 0 0 0 2 4 1 3 6 6 2 241 0 1 0 0 3 0 2 0 1 8 1 1 1 0 1 1 1 0 1 2 9
1 2 5 2 2 5 1 6 8 4 36 4 2 1 5 3 2 1 8 2 3 311 8 4 1 0 8 8 6 3 6 45 0 0 0 1 2 2 1 1 4 3 142 2 0 2 0 0 3 1 0 0 10 4 4 1 3 3 2 1 4 3 4 292 3 10 6 3 9 3 3 4 7 50 2 0 1 3 0 3 3 2 1 2 172 7 7 12 3 2 11 7 18 11 80 3 2 3 1 8 5 3 10 5 12 52
3 5 4 4 9 11 7 7 3 8 61 1 5 4 6 1 3 2 2 6 2 321 0 0 1 1 0 0 0 7 2 12 1 3 7 3 3 0 2 1 6 0 260 3 4 4 4 6 2 5 7 9 44 2 3 1 3 2 3 0 6 0 3 230 0 1 1 1 0 0 0 1 1 5 5 8 11 4 7 10 10 13 15 10 932 2 1 3 1 4 2 1 3 2 21 1 4 4 1 2 7 7 0 0 4 30
1 4 0 2 2 3 6 2 2 4 26 1 1 2 0 1 4 3 6 5 1 244 1 5 0 4 1 5 11 7 4 42 2 4 1 0 3 3 1 1 4 0 192 0 1 4 2 2 1 2 2 1 17 2 4 0 2 3 4 5 5 6 1 322 0 5 5 6 1 2 2 7 8 38 0 1 1 3 2 1 0 2 0 2 122 10 3 0 7 12 2 8 4 5 53 1 2 4 2 2 2 9 2 12 6 42
0 0 1 0 0 0 0 0 1 0 2 0 2 0 4 5 3 0 0 0 3 170 3 0 6 1 2 3 8 9 6 38 0 1 1 1 1 3 1 0 1 0 90 2 2 0 1 0 0 5 2 2 14 14 6 15 17 15 8 9 17 14 8 123
112 162 167 164 162 202 182 241 250 220 1,86233
Totals
County
Wheatland
Wibaux
Yellowstone
Toole
Treasure
Valley
Stillwater
Sweet Grass
Teton
Rosebud
Sanders
Sheridan
Silver Bow
Richland
Roosevelt
Powder River
Powell
Prairie
Petroleum
Phillips
Pondera
McCone
Meagher
Mineral
Missoula
Ravalli
Liberty
Jefferson
Lincoln
Madison
Judith Basin
Lake
Lewis & Clark
Golden Valley
Granite
Hill
Gallatin
Garfield
Glacier
Deer Lodge
Fallon
Fergus
Flathead
Custer
Daniels
Dawson
Cascade
Choteau
Big Horn
Blaine
Broadwater
Carbon
Fatalities by County 1945 to 1954County
Beaverhead
Carter
Musselshell
Park

34
1955 1956 1957 1958 1959 1960 1961 1962 1963 1964 Page Total 1955 1956 1957 1958 1959 1960 1961 1962 1963 1964 Page
Total
4 2 6 4 4 5 2 3 5 4 39 0 0 4 1 2 1 3 1 0 0 128 11 2 4 2 4 7 7 15 10 70 1 0 2 0 3 0 1 3 4 0 141 3 2 3 6 2 7 5 2 5 36 4 3 0 1 4 5 7 10 9 1 441 4 5 5 6 1 0 0 3 0 25 17 15 8 10 19 6 11 7 9 6 1083 4 4 2 6 2 5 2 3 6 37 10 5 2 4 0 1 4 2 0 0 28
1 1 0 0 0 2 0 0 0 0 4 3 6 6 3 6 5 5 4 3 5 4612 13 13 14 10 13 24 24 12 15 150 0 0 0 0 0 1 0 0 0 1 2
2 6 2 1 5 0 2 4 3 7 32 2 6 5 1 0 5 0 7 0 1 273 5 5 3 7 4 11 2 2 5 47 3 7 4 3 3 2 9 3 1 3 381 1 0 3 1 0 0 1 0 0 7 2 5 1 0 2 0 1 0 1 0 12
9 2 5 4 0 3 1 2 4 6 36 4 10 0 5 3 4 8 1 2 5 428 11 4 3 3 5 8 6 5 6 59 0 2 2 5 0 2 3 7 4 2 272 1 2 2 0 1 0 0 0 0 8 1 4 5 8 6 5 1 7 1 6 446 4 2 1 5 3 5 6 5 6 43 4 4 3 3 3 1 2 7 6 3 364 9 5 2 14 12 15 11 2 13 87 14 6 9 5 7 13 2 7 5 7 75
4 7 4 7 8 9 23 5 13 13 93 3 5 5 3 10 3 3 7 4 5 480 0 1 6 1 1 2 0 3 5 19 1 0 4 5 5 3 0 1 3 4 26
13 14 1 7 8 12 8 8 10 7 88 3 2 3 0 3 3 1 3 1 2 212 0 1 1 2 0 3 2 4 1 16 6 8 5 4 6 4 3 15 4 9 640 2 0 9 3 2 1 5 1 0 23 2 2 2 2 2 3 3 5 2 0 23
9 9 6 4 4 9 6 6 5 6 64 3 2 1 2 6 2 1 3 6 5 317 3 9 2 8 4 7 2 2 4 48 0 8 2 0 1 2 2 1 3 4 231 1 2 4 2 4 9 1 2 1 27 6 1 5 4 1 1 3 2 3 7 335 10 4 3 4 11 4 8 10 7 66 1 2 3 1 0 1 2 0 2 1 131 8 8 3 6 12 15 4 6 12 75 8 10 8 6 11 10 7 7 9 1 77
4 0 6 1 2 0 0 0 1 1 15 4 1 7 4 2 3 5 0 2 2 308 6 7 4 3 4 5 6 6 3 52 1 1 1 0 1 0 0 1 1 0 61 3 0 1 5 1 4 6 5 3 29 13 12 7 10 17 10 14 19 14 33 149
236 267 210 193 248 222 275 256 228 259 2,394 Totals
County
Wheatland
Wibaux
Yellowstone
Toole
Treasure
Valley
Sanders
Sheridan
Silver Bow
Stillwater
Sweet Grass
Teton
Prairie
Ravalli
Richland
Roosevelt
Rosebud
Petroleum
Phillips
Pondera
Powder River
Powell
McCone
Meagher
Mineral
Missoula
Musselshell
Liberty
Park
Hill
Jefferson
Lincoln
Madison
Judith Basin
Lake
Lewis & Clark
Gallatin
Garfield
Glacier
Golden Valley
Granite
Dawson
Deer Lodge
Fallon
Fergus
Flathead
Carter
Cascade
Choteau
Custer
Daniels
Fatalities by County 1955 to 1964County
Beaverhead
Big Horn
Blaine
Broadwater
Carbon

1965 1966 1967 1968 1969 1970 1971 1972 1973 1974 Page Total 1965 1966 1967 1968 1969 1970 1971 1972 1973 1974 Page
Total
5 11 5 5 6 3 3 4 4 6 52 0 3 1 3 5 1 6 3 1 1 249 10 11 17 11 19 11 9 14 5 116 1 1 4 1 2 0 0 2 2 1 143 2 11 3 3 3 4 10 3 4 46 8 3 9 7 6 12 3 8 11 6 730 2 1 1 0 3 2 12 1 0 22 25 21 20 10 18 19 33 35 25 16 2226 4 5 2 3 6 3 3 3 4 39 3 1 1 1 1 1 5 6 3 5 27
2 2 5 1 0 0 0 2 0 1 13 1 10 4 6 5 5 6 5 7 9 5817 17 17 7 23 23 15 15 8 16 158 1 0 0 0 4 1 1 1 2 1 11
2 1 4 3 5 7 1 6 11 1 41 4 1 3 3 3 4 5 3 2 4 324 2 3 4 6 2 9 13 8 8 59 1 6 5 2 13 4 5 4 1 0 411 1 1 5 2 1 0 0 2 2 15 1 0 3 3 10 4 3 0 0 2 26
2 6 4 10 5 5 3 9 3 4 51 6 7 11 10 9 5 6 11 10 7 825 7 6 7 2 5 4 6 5 5 52 4 0 1 2 3 1 5 1 2 0 191 1 0 1 3 2 1 4 2 1 16 7 5 8 10 5 7 7 8 9 5 715 5 1 5 7 3 3 6 6 8 49 3 0 4 3 4 2 2 4 2 3 27
10 6 23 8 15 19 21 16 25 13 156 8 3 6 6 4 2 6 9 3 6 53
8 9 4 13 13 11 13 13 11 10 105 4 5 1 6 7 20 9 3 8 7 703 0 2 1 1 0 2 3 1 2 15 2 8 4 5 2 4 1 5 1 4 365 15 3 9 13 8 17 10 11 9 100 1 3 6 3 3 4 4 5 2 0 310 0 0 1 4 1 3 3 1 2 15 13 13 10 3 13 10 5 12 13 10 1026 1 6 4 5 6 2 1 2 4 37 2 1 4 5 9 0 2 6 3 6 38
5 5 12 5 4 5 5 9 0 3 53 11 5 6 5 0 0 4 6 9 1 476 4 5 4 6 6 5 9 8 8 61 4 1 1 0 8 4 2 5 0 2 270 2 9 5 4 1 1 3 1 1 27 3 2 5 5 0 4 1 0 3 2 25
10 9 11 13 8 16 19 16 11 16 129 0 1 1 3 0 3 0 1 1 0 1011 21 10 6 15 15 14 15 8 14 129 6 5 7 10 6 8 3 6 5 7 63
1 0 0 5 8 1 0 3 2 2 22 1 0 0 1 1 0 1 7 2 2 157 9 9 10 6 4 15 5 12 7 84 3 1 1 1 0 1 1 1 2 1 125 3 6 2 1 3 2 9 1 2 34 18 15 19 18 19 14 24 24 30 33 214
280 276 319 289 339 318 328 395 323 299 3,16635
Fatalities by County 1965 to 1974County
Beaverhead
Carter
Musselshell
Park
Cascade
Choteau
Big Horn
Blaine
Broadwater
Carbon
Deer Lodge
Fallon
Fergus
Flathead
Custer
Daniels
Dawson
Golden Valley
Granite
Hill
Gallatin
Garfield
Glacier
Liberty
Jefferson
Lincoln
Madison
Judith Basin
Lake
Lewis & Clark
Petroleum
Phillips
Pondera
McCone
Meagher
Mineral
Missoula
Ravalli
Richland
Roosevelt
Powder River
Powell
Prairie
Stillwater
Sweet Grass
Teton
Rosebud
Sanders
Sheridan
Silver Bow
Totals
County
Wheatland
Wibaux
Yellowstone
Toole
Treasure
Valley

36
1975 1976 1977 1978 1979 1980 1981 1982 1983 1984 Page Total 1975 1976 1977 1978 1979 1980 1981 1982 1983 1984 Page
Total
12 11 6 5 10 6 11 4 6 2 73 0 1 3 1 2 3 6 2 4 0 2215 14 3 8 14 11 14 7 5 5 96 1 4 1 5 3 4 4 0 1 0 23
2 4 11 4 4 3 6 5 3 5 47 6 3 6 8 11 7 1 5 9 1 572 0 2 4 5 2 2 2 1 3 23 23 21 20 21 28 28 16 20 17 14 2080 1 5 3 3 5 3 5 3 2 30 1 2 4 1 1 2 1 0 2 2 16
0 3 0 0 2 1 1 0 2 2 11 1 5 3 5 8 6 3 7 6 3 4720 20 35 19 20 20 17 14 18 10 193 0 1 0 0 0 0 2 0 2 0 5
3 2 2 2 1 3 3 4 1 0 21 0 3 11 2 7 12 7 3 2 2 495 3 3 4 2 2 8 3 1 3 34 4 3 4 1 6 4 1 2 0 2 272 3 0 0 0 5 1 2 1 0 14 1 2 0 1 1 1 0 2 2 2 12
1 5 3 1 2 6 9 2 3 4 36 4 9 1 5 7 6 6 5 5 7 556 4 8 4 4 3 1 1 4 2 37 3 0 0 2 1 3 0 0 1 1 113 1 0 0 2 1 2 2 1 3 15 7 7 4 8 2 6 9 9 8 4 644 3 6 8 3 11 3 1 9 5 53 1 4 4 3 5 6 11 8 3 4 49
12 12 26 18 21 17 19 5 17 25 172 11 7 6 6 8 6 14 8 6 9 81
8 10 10 12 10 8 15 12 7 9 101 12 7 11 7 7 5 4 2 10 6 711 0 1 1 2 1 1 2 4 3 16 9 10 1 3 9 3 9 3 11 8 66
14 17 13 14 16 14 9 9 12 5 123 1 1 1 1 2 4 2 2 3 2 190 5 0 0 2 0 2 2 0 0 11 16 10 10 3 11 8 10 8 4 5 856 0 1 4 3 5 3 1 1 1 25 0 5 1 4 9 4 5 3 2 3 36
5 5 12 0 8 6 7 11 3 2 59 10 1 4 4 0 2 1 4 4 3 334 8 8 9 3 3 2 6 6 9 58 5 4 5 1 2 2 3 3 2 0 272 1 0 3 1 1 0 3 0 4 15 3 9 3 0 1 1 3 3 4 3 30
18 9 8 11 13 11 14 13 9 6 112 2 1 2 0 1 0 0 0 1 0 714 8 9 10 15 12 12 13 11 8 112 0 1 6 3 2 6 9 8 1 2 38
0 2 1 1 1 0 0 0 6 1 12 2 0 0 3 0 0 1 0 2 1 94 4 4 3 4 2 6 3 5 6 41 0 0 0 3 1 2 1 0 0 3 103 9 5 6 6 4 5 2 5 3 48 9 15 22 16 20 31 33 13 30 23 212
298 300 315 271 332 325 338 254 286 238 2,957
Fatalities by County 1975 to 1984County
Beaverhead
Big Horn
Blaine
Broadwater
Carbon
Carter
Cascade
Choteau
Custer
Daniels
Dawson
Deer Lodge
Fallon
Fergus
Flathead
Gallatin
Garfield
Glacier
Golden Valley
Granite
Hill
Jefferson
Lincoln
Madison
Judith Basin
Lake
Lewis & Clark
McCone
Meagher
Mineral
Missoula
Musselshell
Liberty
Park
Petroleum
Phillips
Pondera
Powder River
Stillwater
Powell
Prairie
Ravalli
Richland
Roosevelt
County
Wheatland
Wibaux
Yellowstone
Toole
Treasure
Rosebud
Sanders
Sheridan
Silver Bow
Valley
Sweet Grass
Teton
Totals

1985 1986 1987 1988 1989 1990 1991 1992 1993 1994 Page Total 1985 1986 1987 1988 1989 1990 1991 1992 1993 1994 Page
Total
4 5 4 6 3 3 3 3 6 12 49 1 3 0 2 0 0 1 0 0 0 75 5 8 12 5 11 12 8 10 10 86 3 0 1 0 0 1 2 0 1 0 82 5 0 1 5 8 3 2 4 1 31 2 3 2 6 2 5 2 5 6 3 365 1 1 0 5 0 1 1 1 3 18 22 8 12 15 22 14 11 11 9 10 1344 3 2 3 1 1 2 3 3 2 24 0 1 2 3 1 2 0 1 1 0 11
0 2 1 0 0 0 1 1 1 0 6 3 3 3 4 3 1 3 6 1 4 3111 9 12 12 10 14 16 13 11 14 122 0 0 1 0 0 0 3 0 0 0 4
2 3 1 1 2 3 0 0 1 3 16 2 1 5 3 0 3 1 1 1 0 170 4 3 6 1 2 2 2 1 2 23 0 7 2 3 0 3 0 0 1 3 190 1 0 0 0 0 0 0 0 0 1 0 3 2 1 0 1 1 2 1 1 12
3 1 5 1 0 2 2 3 1 3 21 4 5 8 2 2 6 2 4 2 5 405 2 5 0 7 6 2 0 1 1 29 0 1 1 0 0 1 0 0 0 0 31 2 1 0 0 0 0 0 1 0 5 9 6 7 5 1 3 4 5 0 12 523 0 6 2 5 3 7 3 3 3 35 4 0 3 3 0 4 2 2 1 1 20
15 10 22 19 14 16 16 17 13 7 149 5 9 3 8 5 5 3 3 10 4 55
13 4 13 5 1 5 22 15 5 5 88 8 7 3 2 5 6 2 8 7 3 510 1 1 1 0 0 1 0 0 1 5 0 3 3 2 7 7 4 1 2 2 31
11 6 14 5 6 1 10 4 11 6 74 1 2 1 2 0 0 0 1 1 0 82 1 1 0 0 1 0 0 0 0 5 2 10 2 5 8 11 3 5 7 9 623 3 0 1 0 5 2 3 1 3 21 1 4 3 1 4 2 0 2 4 5 26
4 7 4 0 3 4 5 2 7 2 38 1 2 3 3 2 0 1 0 2 1 157 2 1 2 2 7 4 3 4 7 39 0 0 5 3 1 1 1 2 1 2 160 0 0 4 0 2 1 2 2 0 11 1 5 2 2 1 0 0 2 2 0 157 11 12 10 8 10 8 8 9 21 104 0 0 0 2 0 0 1 3 0 0 69 9 15 13 7 6 8 10 11 3 91 3 5 3 1 4 2 1 2 1 2 24
0 0 0 0 0 0 0 0 1 1 2 2 1 0 1 1 1 0 1 0 1 812 6 8 2 3 6 4 5 9 6 61 0 0 2 0 1 0 0 0 1 1 5
2 4 6 4 2 4 1 0 3 1 27 19 26 9 9 21 13 19 15 12 16 159223 222 234 198 181 212 200 190 194 202 2,056
Fatalities by County 1985 to 1994County
Carter
County
Carbon
Beaverhead
Big Horn
Blaine
Cascade
Choteau
Custer
Daniels
Broadwater
Dawson
Deer Lodge
Fallon
Fergus
Flathead
Gallatin
Garfield
Glacier
Golden Valley
Granite
Liberty
Park
Hill
Jefferson
Lincoln
Judith Basin
Lake
Lewis & Clark
McCone
Meagher
Mineral
Missoula
Musselshell
Petroleum
Phillips
Pondera
Powder River
Powell
Prairie
Ravalli
Richland
Roosevelt
Rosebud
Sanders
Sheridan
Silver Bow
Stillwater
Wheatland
Wibaux
Toole
Treasure
Valley
37
Sweet Grass
Teton
Totals
Yellowstone Madison

38
1995 1996 1997 1998 1999 2000 2001 2002 2003 Page Total All Years 1995 1996 1997 1998 1999 2000 2001 2002 2003 Page
TotalAll
Years
10 9 2 3 2 5 2 5 4 42 301 0 1 0 0 0 0 0 2 1 4 957 5 6 6 13 11 10 17 10 85 523 1 2 1 1 1 0 0 1 3 10 905 2 1 3 4 8 4 2 5 34 269 2 10 9 5 3 8 8 5 5 55 3193 0 1 1 0 2 5 2 1 15 134 11 16 19 15 16 25 16 12 15 145 9724 0 8 4 13 3 3 11 5 51 268 0 1 3 1 0 1 0 2 0 8 126
0 0 3 1 1 0 0 0 1 6 48 1 8 7 5 5 5 7 6 9 53 3085 6 10 15 11 13 12 8 13 93 947 0 1 0 1 0 0 3 0 0 5 453 4 2 1 2 3 1 6 5 27 176 2 0 3 2 5 3 1 1 2 19 2002 1 2 0 0 3 1 3 1 13 239 4 4 4 2 1 0 5 4 5 29 2051 1 0 1 0 0 0 1 0 4 56 0 0 6 1 0 2 2 4 1 16 90
1 2 1 2 0 1 2 0 0 9 203 3 0 1 3 1 10 6 6 6 36 3147 2 7 6 3 1 2 2 2 32 296 1 2 0 1 0 0 0 2 1 7 911 2 0 0 0 0 1 1 0 5 66 9 11 6 12 4 9 11 5 9 76 3681 2 5 6 2 5 4 5 1 31 280 0 1 1 3 2 4 1 0 2 14 186
11 14 18 17 12 14 21 14 22 143 832 7 2 6 4 6 3 6 5 4 43 375
6 10 17 14 9 15 14 17 23 125 620 3 5 4 4 4 1 1 1 2 25 3082 1 3 0 0 0 4 1 0 11 88 6 3 5 4 2 3 6 4 5 38 2390 4 13 12 8 8 2 11 9 67 525 0 0 0 4 0 0 2 0 0 6 1191 1 0 1 0 0 0 0 0 3 56 6 8 9 4 9 3 2 6 7 54 5692 0 4 3 3 4 4 2 1 23 172 5 2 2 5 11 3 2 5 4 39 207
7 5 10 2 4 1 2 2 2 35 298 0 5 0 1 1 3 5 4 0 19 1804 1 8 12 2 2 3 5 4 41 319 3 1 1 0 2 2 3 1 1 14 1340 0 0 2 0 0 4 0 0 6 114 1 0 3 3 1 1 3 6 0 18 177
17 11 15 8 13 13 8 18 23 126 612 0 0 0 0 1 0 1 2 2 6 5711 7 4 8 12 3 4 12 5 66 577 4 2 2 2 2 3 2 2 7 26 312
3 0 0 1 1 1 0 2 0 8 66 4 0 0 1 1 3 2 0 1 12 983 3 12 4 1 8 7 5 7 50 344 0 1 1 0 1 0 0 1 0 4 498 3 5 1 3 2 0 6 3 31 191 17 16 15 19 22 19 15 24 23 170 1,130
215 198 265 237 220 237 230 269 262 2,133 15,983
County
Wheatland
Wibaux
Yellowstone
Toole
Treasure
Valley
Sweet Grass
Teton
Totals
Sanders
Sheridan
Silver Bow
Stillwater
Prairie
Ravalli
Richland
Roosevelt
Rosebud
Petroleum
Phillips
Pondera
Powder River
Powell
McCone
Meagher
Mineral
Missoula
Musselshell
Liberty
Park
Hill
Jefferson
Lincoln
Madison
Judith Basin
Lake
Lewis & Clark
Gallatin
Garfield
Glacier
Golden Valley
Granite
Dawson
Deer Lodge
Fallon
Fergus
Flathead
Carter
Cascade
Choteau
Custer
Daniels
Fatalities by County 1995 to 2003County
Beaverhead
Big Horn
Blaine
Broadwater
Carbon

2004 2005 2006 2007 2008 2009 2010 2011 2012 Page Total All Years 2004 2005 2006 2007 2008 2009 2010 2011 2012 Page
TotalAll
Years
5 4 3 1 8 6 5 3 4 39 333 3 0 0 0 1 0 3 1 0 8 1028 10 9 11 12 9 13 7 9 88 595 1 2 1 1 3 0 0 1 1 10 983 3 2 4 4 1 3 3 3 26 289 5 4 7 7 7 3 3 2 3 41 3555 2 4 4 2 3 1 1 4 26 155 13 18 16 23 20 15 13 17 7 142 1,0906 2 4 4 3 7 4 2 7 39 298 0 1 2 6 0 1 0 3 0 13 136
0 0 0 0 4 0 1 1 1 7 53 5 5 5 6 1 3 1 4 5 35 33410 9 11 13 7 6 5 10 7 78 1,008 2 4 0 2 0 1 0 1 0 10 545 5 2 2 3 4 2 1 0 24 199 1 3 1 4 1 2 1 4 0 17 2131 5 1 6 4 2 2 1 2 24 260 5 1 2 0 0 4 4 2 5 23 2210 0 0 0 0 0 0 1 1 2 56 2 0 4 2 0 0 1 0 2 11 99
3 1 0 2 1 2 5 3 1 18 217 1 5 3 5 1 6 2 2 3 28 3371 3 3 2 1 3 0 1 1 15 309 0 0 1 1 1 1 0 3 3 10 952 1 0 0 0 2 0 1 0 6 71 6 7 6 10 4 6 5 4 5 53 4111 5 3 2 9 0 4 4 4 32 304 3 2 4 4 7 0 2 7 3 32 208
19 17 30 26 25 16 9 13 11 166 974 0 1 3 5 3 5 3 5 4 29 395
16 11 22 14 13 7 10 10 12 115 713 5 6 7 3 3 12 2 3 8 49 3460 1 0 1 0 1 0 2 0 5 91 7 6 7 8 7 7 11 3 6 62 292
11 5 8 14 7 5 4 6 3 63 579 1 0 1 1 0 0 2 0 2 7 1240 1 0 1 0 1 1 0 0 4 60 6 7 6 3 5 10 2 2 2 43 6083 5 1 2 2 3 0 1 0 17 188 6 3 1 4 1 1 0 2 1 19 223
3 1 3 4 3 2 3 3 6 28 317 2 3 1 3 1 1 0 3 0 14 1916 5 3 8 5 8 6 8 6 55 360 1 0 1 3 1 0 3 1 0 10 1430 2 1 4 0 0 3 4 1 15 124 0 4 2 0 0 0 0 0 0 6 183
12 14 22 10 5 8 7 4 6 88 689 0 0 1 1 1 0 1 0 0 4 614 11 11 11 13 13 9 7 8 87 649 4 2 4 1 1 3 3 2 3 23 330
0 1 0 0 0 0 0 0 1 2 67 0 3 0 2 0 0 0 2 1 8 1031 7 6 6 3 6 10 5 6 50 383 1 3 3 0 0 0 0 0 1 8 564 7 5 6 6 1 2 9 5 45 222 20 23 20 13 22 24 18 24 18 182 1,270
229 251 263 276 231 221 189 209 205 2,061 17,641
39
Choteau
Custer
Fatalities by County 2004 - 2012County
Carbon Musselshell
Beaverhead
Big Horn
Blaine
Broadwater
Carter
Cascade
Fallon
Fergus
Flathead
Daniels
Dawson
Deer Lodge
Gallatin
Garfield
Glacier
Golden Valley
Granite
McCone
Meagher
Mineral
Missoula
Liberty
Lincoln
Madison
Judith Basin
Lake
Lewis & Clark
Hill
Jefferson
Powder River
Powell
Prairie
Park
Petroleum
Phillips
Pondera
Silver Bow
Ravalli
Richland
Roosevelt
Totals
County
Wheatland
Wibaux
Yellowstone
Toole
Treasure
Valley
Stillwater
Sweet Grass
Teton
Rosebud
Sanders
Sheridan

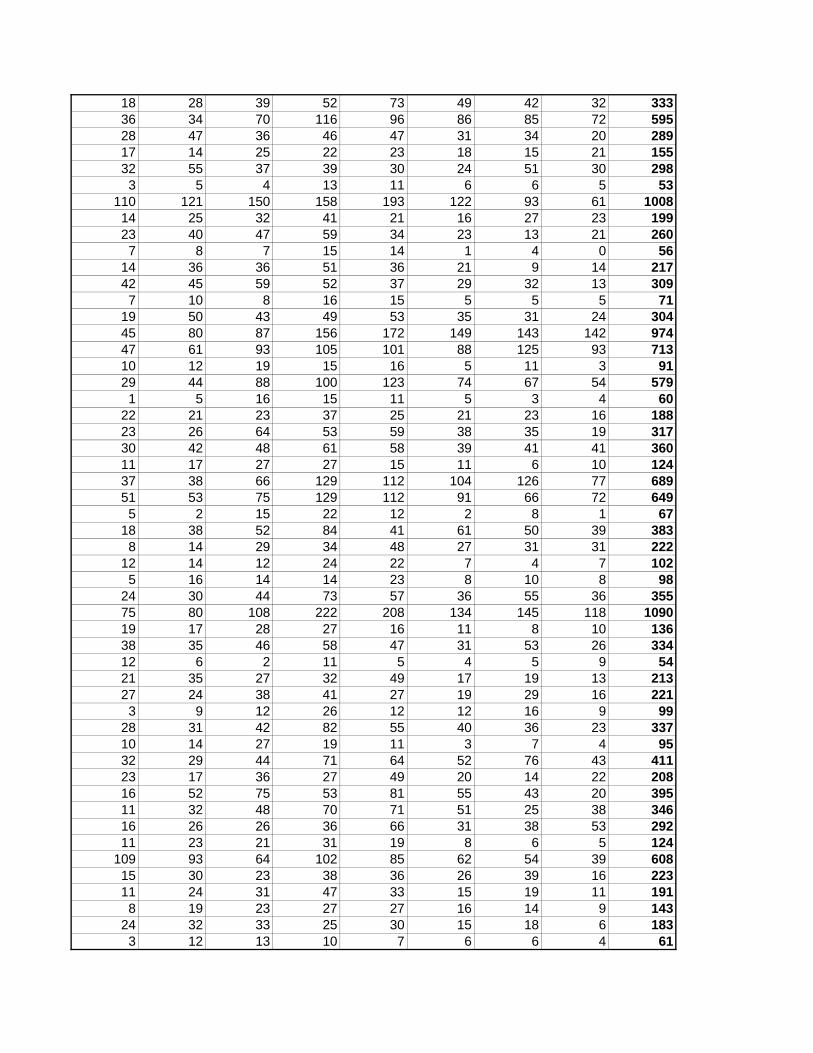
18 28 39 52 73 49 42 32 33336 34 70 116 96 86 85 72 59528 47 36 46 47 31 34 20 28917 14 25 22 23 18 15 21 15532 55 37 39 30 24 51 30 2983 5 4 13 11 6 6 5 53
110 121 150 158 193 122 93 61 100814 25 32 41 21 16 27 23 19923 40 47 59 34 23 13 21 2607 8 7 15 14 1 4 0 56
14 36 36 51 36 21 9 14 21742 45 59 52 37 29 32 13 3097 10 8 16 15 5 5 5 71
19 50 43 49 53 35 31 24 30445 80 87 156 172 149 143 142 97447 61 93 105 101 88 125 93 71310 12 19 15 16 5 11 3 9129 44 88 100 123 74 67 54 5791 5 16 15 11 5 3 4 60
22 21 23 37 25 21 23 16 18823 26 64 53 59 38 35 19 31730 42 48 61 58 39 41 41 36011 17 27 27 15 11 6 10 12437 38 66 129 112 104 126 77 68951 53 75 129 112 91 66 72 6495 2 15 22 12 2 8 1 67
18 38 52 84 41 61 50 39 3838 14 29 34 48 27 31 31 222
12 14 12 24 22 7 4 7 1025 16 14 14 23 8 10 8 98
24 30 44 73 57 36 55 36 35575 80 108 222 208 134 145 118 109019 17 28 27 16 11 8 10 13638 35 46 58 47 31 53 26 33412 6 2 11 5 4 5 9 5421 35 27 32 49 17 19 13 21327 24 38 41 27 19 29 16 2213 9 12 26 12 12 16 9 99
28 31 42 82 55 40 36 23 33710 14 27 19 11 3 7 4 9532 29 44 71 64 52 76 43 41123 17 36 27 49 20 14 22 20816 52 75 53 81 55 43 20 39511 32 48 70 71 51 25 38 34616 26 26 36 66 31 38 53 29211 23 21 31 19 8 6 5 124
109 93 64 102 85 62 54 39 60815 30 23 38 36 26 39 16 22311 24 31 47 33 15 19 11 1918 19 23 27 27 16 14 9 143
24 32 33 25 30 15 18 6 1833 12 13 10 7 6 6 4 61

42 42 77 63 38 24 26 18 3307 17 30 15 9 8 12 5 1033 9 6 12 10 5 4 7 56
103 123 149 214 212 159 170 140 12701415 1862 2394 3166 2957 2056 2133 1658 17641

Beaverhead Ravalli Big Horn Richland Blaine Roosevelt Broadwater Rosebud Carbon Sanders Carter Sheridan Cascade Silver Bow Choteau Stillwater Custer Sweet Grass Daniels Teton Dawson Toole Deer Lodge Treasure Fallon Valley Fergus Wheatland Flathead Wibaux Gallatin Yellowstone Garfield Glacier Golden Valley Granite Hill Jefferson Judith Basin Lake Lewis & Clark Liberty Lincoln Madison McCone Meagher Mineral Missoula Musselshell Park Petroleum Phillips Pondera Powder River Powell Prairie


40
2013 2014 2015 2016 2017 2018 2019 2010 2013 Page Total All Years 2013 2014 2015 2016 2017 2018 2019 2020 2021 Page
TotalAll
Years
3 0 2 5 338 1 1 0 2 1048 9 12 29 624 1 1 0 2 1001 3 4 8 297 4 1 3 8 3632 4 2 8 163 15 15 15 45 1,1352 2 9 13 311 0 1 2 3 139
0 1 2 3 56 1 4 4 9 34310 15 9 34 1,042 1 1 0 2 562 2 8 12 211 1 2 2 5 2182 0 3 5 265 3 0 0 3 2240 1 0 1 57 1 1 1 3 102
4 0 3 7 224 3 3 2 8 3452 1 4 7 316 1 0 0 1 960 0 0 0 71 8 5 3 16 4272 1 3 6 310 7 3 1 11 21919 13 12 44 1,018 1 5 6 12 407
8 9 10 27 740 4 4 4 12 3581 1 1 3 94 3 6 5 14 306
10 7 6 23 602 1 3 1 5 1290 0 0 0 60 7 7 6 20 6282 1 1 4 192 4 0 2 6 229
1 2 7 10 327 3 1 1 5 1963 9 4 16 376 1 3 4 8 1510 2 5 7 131 2 0 1 3 1869 6 6 21 710 0 2 0 2 635 6 15 26 675 2 3 4 9 339
0 0 0 0 67 1 0 1 2 1056 3 5 14 397 0 0 0 0 564 4 6 14 236 21 18 17 56 1,326
229 192 224 0 0 0 0 0 0 619 18,260
Choteau
Custer
Fatalities by County 2013 - 2021County
Carbon Musselshell
Beaverhead
Big Horn
Blaine
Broadwater
Carter
Cascade
Fallon
Fergus
Flathead
Daniels
Dawson
Deer Lodge
Gallatin
Garfield
Glacier
Golden Valley
Granite
McCone
Meagher
Mineral
Missoula
Liberty
Lincoln
Madison
Judith Basin
Lake
Lewis & Clark
Hill
Jefferson
Powder River
Powell
Prairie
Park
Petroleum
Phillips
Pondera
Silver Bow
Ravalli
Richland
Roosevelt
Totals
County
Wheatland
Wibaux
Yellowstone
Toole
Treasure
Valley
Stillwater
Sweet Grass
Teton
Rosebud
Sanders
Sheridan
18 28 39 52 73 49 42 32 33336 34 70 116 96 86 85 72 59528 47 36 46 47 31 34 20 28917 14 25 22 23 18 15 21 15532 55 37 39 30 24 51 30 2983 5 4 13 11 6 6 5 53
110 121 150 158 193 122 93 61 100814 25 32 41 21 16 27 23 19923 40 47 59 34 23 13 21 2607 8 7 15 14 1 4 0 56
14 36 36 51 36 21 9 14 21742 45 59 52 37 29 32 13 3097 10 8 16 15 5 5 5 71
19 50 43 49 53 35 31 24 30445 80 87 156 172 149 143 142 97447 61 93 105 101 88 125 93 71310 12 19 15 16 5 11 3 9129 44 88 100 123 74 67 54 5791 5 16 15 11 5 3 4 60
22 21 23 37 25 21 23 16 18823 26 64 53 59 38 35 19 31730 42 48 61 58 39 41 41 36011 17 27 27 15 11 6 10 12437 38 66 129 112 104 126 77 68951 53 75 129 112 91 66 72 6495 2 15 22 12 2 8 1 67
18 38 52 84 41 61 50 39 3838 14 29 34 48 27 31 31 222
12 14 12 24 22 7 4 7 1025 16 14 14 23 8 10 8 98
24 30 44 73 57 36 55 36 35575 80 108 222 208 134 145 118 109019 17 28 27 16 11 8 10 13638 35 46 58 47 31 53 26 33412 6 2 11 5 4 5 9 5421 35 27 32 49 17 19 13 21327 24 38 41 27 19 29 16 2213 9 12 26 12 12 16 9 99
28 31 42 82 55 40 36 23 33710 14 27 19 11 3 7 4 9532 29 44 71 64 52 76 43 41123 17 36 27 49 20 14 22 20816 52 75 53 81 55 43 20 39511 32 48 70 71 51 25 38 34616 26 26 36 66 31 38 53 29211 23 21 31 19 8 6 5 124
109 93 64 102 85 62 54 39 60815 30 23 38 36 26 39 16 22311 24 31 47 33 15 19 11 1918 19 23 27 27 16 14 9 143
24 32 33 25 30 15 18 6 1833 12 13 10 7 6 6 4 61

42 42 77 63 38 24 26 18 3307 17 30 15 9 8 12 5 1033 9 6 12 10 5 4 7 56
103 123 149 214 212 159 170 140 12701415 1862 2394 3166 2957 2056 2133 1658 17641

Beaverhead Ravalli Big Horn Richland Blaine Roosevelt Broadwater Rosebud Carbon Sanders Carter Sheridan Cascade Silver Bow Choteau Stillwater Custer Sweet Grass Daniels Teton Dawson Toole Deer Lodge Treasure Fallon Valley Fergus Wheatland Flathead Wibaux Gallatin Yellowstone Garfield Glacier Golden Valley Granite Hill Jefferson Judith Basin Lake Lewis & Clark Liberty Lincoln Madison McCone Meagher Mineral Missoula Musselshell Park Petroleum Phillips Pondera Powder River Powell Prairie


S M T W T F S S M T W T F S S M T W T F S1
1 1 1 1 1 1 21 1 1 1 1 2
1 1 1 1 11 1 1
6 5 13
6 11 24
S M T W T F S S M T W T F S S M T W T F S1 2 1 2 1
1 2 1 1 1 1 3 1 1 11 1 2 1 1 1 1 1 1 1
1 1 3 3 1 2 21 1 1 1
11 16 2135 51 72
S M T W T F S S M T W T F S S M T W T F S2 1 2
5 1 1 3 1 3 1 2 1 4 3 1 1 42 3 1 3 1 2 1 3 1 1 2 1 22 1 1 3 1 2 1 5 1 1 1 1
1 3 1 1 1 3 3 2 4 12
36 40 25
108 148 173
S M T W T F S S M T W T F S S M T W T F S1 2 1 2 1 21 1 3 1 1 2 2
1 1 1 1 2 1 12 2 1 1 1 1 1 1 1
2 2 1 3 2 1 1
20 16 15
193 209 224
41
Total for Month:Total for Year:
Total for Month:Total for Year:
JuneMay
Total for Year:
Fatality Calendar 2015
Total for Month:Total for Year:
Total for Month:
January February March
April
Total for Year:
Total for Month:
Total for Year:
Total for Month:
Total for Year:Total for Month:Total for Year:
Total for Year:Total for Month:
Total for Year: Total for Year:
Total for Month:
July August
December
Total for Month:Total for Year:
Total for Month:
September
October November
Total for Month:

42
Fatal Fatal Fatal Fatal Fatal FatalCrashes Fatalities Crashes Fatalities Crashes Fatalities Crashes Fatalities Crashes Fatalities Crashes Fatalities
Memorial Day 2 3 0 0 0 0 1 1 4 4 7 8
Independence Day 2 4 2 2 0 0 1 1 5 5 10 12
Labor Day 0 0 2 3 3 3 2 2 2 3 9 11
Thanksgiving 1 1 1 1 2 2 0 0 1 1 5 5
Christmas 1 1 0 0 0 0 0 0 0 0 1 1
New Year's 0 0 1 1 1 1 0 0 0 0 2 2
Total 6 9 6 7 6 6 4 4 12 13 34 39
*
the day of the holiday. If a holiday falls on a Monday the holiday period begins a 6 pm on Friday and ends at midnight on Monday If a holiday falls on a Friday the holiday period begins at 6 pm on Thursday and ends at midnight on Sunday.
Fatalities During Major Holiday Periods*
TotalHoliday
2013 20142011 2012 2015

43
251
263
276
229
221
189
209205
229
192
224
150
200
250
300
2005 2006 2007 2008 2009 2010 2011 2012 2013 2014 2015
Total Number of Fatalities by Year 2005-2015

2005 2512006 2632007 2762008 2292009 2212010 1892011 2092012 2052013 2292014 1922015 224

The Montana Highway Patrol is looking for qualified applicants to become part of our team. You may be eligible to join the Patrol if
you possess any of the following: ► High School Diploma (or GED) ► Montana Basic POST certificate ► Out of State POST certificate
Testing dates and locations are posted on our website
http://dojmt.gov/highwaypatrol
If you are interested in being a part of Montana’s premier law enforcement agency, now is your chance. For more information call 406-444-3259 or the number below.
The Montana Highway Patrol is an AA/EEO Employer