monte carlo simulations of projections in computed tomography
TRANSCRIPT

MONTE CARLO SIMULATION OF PROJECTIONS IN COMPUTED TOMOGRAPHY
B. Chyba,1 M. Mantler,1 and M. Reiter2
1Vienna University of Technology, Vienna, Austria
2Upper Austria University of Applied Sciences, Wels, Austria ABSTRACT Results from Monte Carlo simulations of 2D-projections for a simple real sample (an aluminium cube with a cylindrical hole filled by air or steel) in a realistic experimental environment are presented. A meaningful comparison with measurements was therefore possible. Coherent and incoherent scattering as well as excitation of fluorescent radiation are accounted for; multiple sequences of these interactions are followed up to a selectable order. Such simulations are important aids to modern metrological applications of computed tomography where the dimensional accuracy of hidden or inaccessible components of work pieces is determined. The complex process requires a high level of optimization of the instrumental parameters for each sample type whereby the accurate simulation of the physical interactions between X-rays and the sample material is a supplement and alternative to time consuming measurements. INTRODUCTION Computed tomography (CT) is used for the investigation of prototypes or quality control within manufacturing chains where object criteria must meet the specifications of a construction drawing. The basic procedure is to measure a narrow, parallel beam transmitted by a sample for a sequence of translational positions and rotational orientations of the sample. 2D information (a slice in the plane of translation and beam directions) of the inner geometry of the sample can be thereby reconstructed [1]. The alternative is to use a cone shaped (divergent) beam together with a flat panel detector. Thereby the translations are not required and a 3D image can be reconstructed. This advantage comes at the price of a significantly higher influence of scattered radiation onto the acquired projection images caused by the interaction between X-rays and the sample. A detailed estimation of these interactions is therefore desired in order to understand (and possibly avoid) the artefacts induced within the reconstruction. Practice has shown that such artefacts can be minimized by optimizing the instrumental parameters (e.g., X-ray tube voltage, preliminary absorber plates, etc.) or by taut clamping the sample under test. Figure 1 demonstrates the need of an optimization process—it shows the results of a poor choice of parameters on the left and an almost perfect choice on the right, which improves the contrast, preserves edges, and reduces artefacts from beam hardening and scattered radiation. The
Figure 1. CT results differing in quality according to the choice of experimental parameters.
236Copyright ©JCPDS-International Centre for Diffraction Data 2008 ISSN 1097-0002Advances in X-ray Analysis, Volume 51

This document was presented at the Denver X-ray Conference (DXC) on Applications of X-ray Analysis. Sponsored by the International Centre for Diffraction Data (ICDD). This document is provided by ICDD in cooperation with the authors and presenters of the DXC for the express purpose of educating the scientific community. All copyrights for the document are retained by ICDD. Usage is restricted for the purposes of education and scientific research. DXC Website – www.dxcicdd.com
ICDD Website - www.icdd.com
Advances in X-ray Analysis, Volume 51
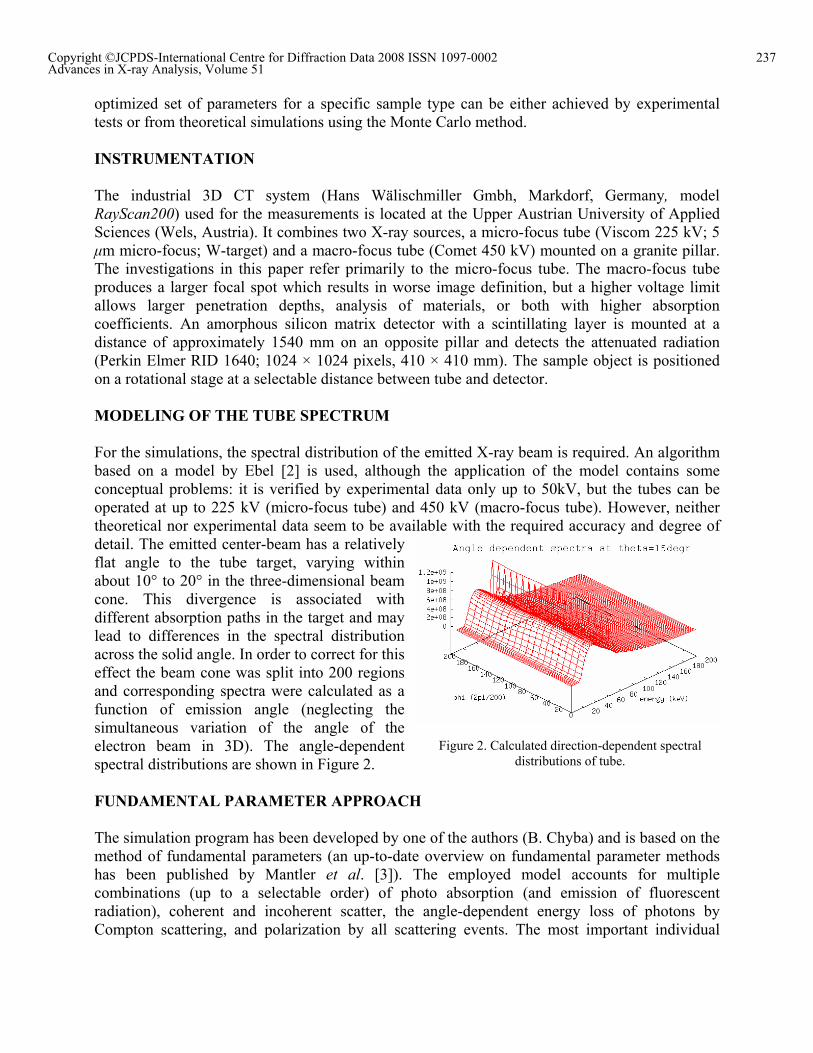
optimized set of parameters for a specific sample type can be either achieved by experimental tests or from theoretical simulations using the Monte Carlo method. INSTRUMENTATION The industrial 3D CT system (Hans Wälischmiller Gmbh, Markdorf, Germany, model RayScan200) used for the measurements is located at the Upper Austrian University of Applied Sciences (Wels, Austria). It combines two X-ray sources, a micro-focus tube (Viscom 225 kV; 5 µm micro-focus; W-target) and a macro-focus tube (Comet 450 kV) mounted on a granite pillar. The investigations in this paper refer primarily to the micro-focus tube. The macro-focus tube produces a larger focal spot which results in worse image definition, but a higher voltage limit allows larger penetration depths, analysis of materials, or both with higher absorption coefficients. An amorphous silicon matrix detector with a scintillating layer is mounted at a distance of approximately 1540 mm on an opposite pillar and detects the attenuated radiation (Perkin Elmer RID 1640; 1024 × 1024 pixels, 410 × 410 mm). The sample object is positioned on a rotational stage at a selectable distance between tube and detector. MODELING OF THE TUBE SPECTRUM For the simulations, the spectral distribution of the emitted X-ray beam is required. An algorithm based on a model by Ebel [2] is used, although the application of the model contains some conceptual problems: it is verified by experimental data only up to 50kV, but the tubes can be operated at up to 225 kV (micro-focus tube) and 450 kV (macro-focus tube). However, neither theoretical nor experimental data seem to be available with the required accuracy and degree of detail. The emitted center-beam has a relatively flat angle to the tube target, varying within about 10° to 20° in the three-dimensional beam cone. This divergence is associated with different absorption paths in the target and may lead to differences in the spectral distribution across the solid angle. In order to correct for this effect the beam cone was split into 200 regions and corresponding spectra were calculated as a function of emission angle (neglecting the simultaneous variation of the angle of the electron beam in 3D). The angle-dependent spectral distributions are shown in Figure 2. FUNDAMENTAL PARAMETER APPROACH The simulation program has been developed by one of the authors (B. Chyba) and is based on the method of fundamental parameters (an up-to-date overview on fundamental parameter methods has been published by Mantler et al. [3]). The employed model accounts for multiple combinations (up to a selectable order) of photo absorption (and emission of fluorescent radiation), coherent and incoherent scatter, the angle-dependent energy loss of photons by Compton scattering, and polarization by all scattering events. The most important individual
Figure 2. Calculated direction-dependent spectral distributions of tube.
237Copyright ©JCPDS-International Centre for Diffraction Data 2008 ISSN 1097-0002Advances in X-ray Analysis, Volume 51

interaction is Compton scattering, which dominates at energies above 50 keV for Al and 130 keV for Fe (Figure 3). The effect of beam-hardening resulting from preferred absorption of low energy radiation is thereby automatically included. On the other hand, the transmitted beam acquires also an additional soft component because of the energy loss by Compton scattering. This means that the intensity of scattered radiation will rise towards the detector fringe because of increasing energy loss at greater scattering angles (and multiple scattering sequences, however with unpredictable final photon direction). In order to study these effects more closely, the spectral distribution of photons arriving at each detector pixel is recorded in a selectable energy range and a selectable energy resolution (up to 200 channels). This can be used to model the actually obtained detector output (which serves as the input to the image reconstruction-algorithms) as soon as more reliable data about the energy dependence of the detector counting efficiency are available. Preliminary estimates indicate a maximum counting efficiency near 70 keV so that Al-K and Fe-K fluorescent radiations (from within the Al-cube) have no significant influence on the image even if absorption in air is avoided or neglected. SOFTWARE CONSIDERATIONS The software was build upon a classical Monte Carlo approach. The final data include information about: (1) detector pixel receiving the photons, (2) photon energy (in steps of 1 to 20 keV), (3) number of interactions before a photon hits the detector, and (4) number if initial photons in direction of detector. The maximum number of detector pixels considered is 1k × 1k, and the maximum number of energy channels per detector pixel is 200. The resulting size of the output files is 1.8 GB per image/history file. The programming language used is C, C++. The software was implemented at the PHOENIX-cluster of the IT Services Center of the Vienna University of Technology running a Linux operating system. Computing times were typically around 24 h CPU per image shown in this work when using 48 to 64 nodes. The computer cluster has 66 dual-processor (single-core) nodes and 5 dual-processor, dual-core nodes available for scientific calculations. Each single-core AMD Opteron processor runs at a clock speed of 2.4 GHz, and has a theoretical peak performance of 4.8 GFlop/s. Processors on each node share 4 GB of memory. Numerical values of fundamental parameters, including the differential scattering cross-sections for the simulations, have been taken mainly from Brunetti et al. [4]; a few external routines are based on the data by Elam et al. [5] and Chantler [6]. At this stage no back-calculation (image reconstruction) of the calculated data is performed.
Figure 3. Cross sections (photo, incoherent scattering) of Al and Fe (incoherent almost overlapping).
Cross Sections of Al, Fe
0,001
0,01
0,1
1
10
100
1000
10000
1 50 100 150
keV
cm²/g
incoh Alphoto Alincoh Fephoto Fe
238Copyright ©JCPDS-International Centre for Diffraction Data 2008 ISSN 1097-0002Advances in X-ray Analysis, Volume 51

RESULTS The projection image from a simple real sample was simulated. Two geometrical arrangements for the measurements were considered: one near the detector screen (X1) and one near the X-ray source (X2). The simulated tube voltage was 200 kV (tube target: W); the sample was an Al-cube with a cylindrical hole; a tightly fitting steel cylinder was optionally inserted into the hole. A comparison of (a) theoretical and (b) experimental data is shown in Figures 4–7.
Figure 5. Full 1024 × 1024 pixel array with sample in position X1 (small projection image). Disruptions in the back of the measured data (b) come from the specimen holder.
(a)
(a) (b)
(b)
Figure 4. Full 1024 × 1024 pixel array of white tube beam without sample, used for bright/dark corrections.
239Copyright ©JCPDS-International Centre for Diffraction Data 2008 ISSN 1097-0002Advances in X-ray Analysis, Volume 51

DISCUSSION Aside from an obvious (but very minor) positional difference of the sample, the general agreement with the measurement is good with respect of general behaviour (e.g., curvature of the flat ranges), which conforms to the expectations. Nevertheless, some discrepancies in the absolute numbers of transmitted photons (Figure 8) invite improvements and further investigations. The ratio of transmitted to incident intensities is directly related to the total absorption of the polychromatic spectrum by the sample. This is predicted with 5% to 6% agreement between theory and measurement, which is equivalent to the differences of 50% to 60% at the low level of absolute transmitted intensities (Figure 9). Possible and most probable sources of errors are the detector response function, the spectral distribution of tube photons, and the numerical values of fundamental parameters. ACKNOWLEDGMENT This work was supported by the Österreichische Forschungsförderungsgesellschaft mbH, project 812136-SCK/KUG.
Figure 6. Central 200 × 200 pixels corresponding to small centered image. Note that the edges appear much sharper than below, because of the more perpendicular incidence of the tube radiation. The target size of the tube
has less influence.
Figure 7. All 1024 × 1024 detector pixels corresponding to the almost full size image.
(a) (b)
(a) (b)
240Copyright ©JCPDS-International Centre for Diffraction Data 2008 ISSN 1097-0002Advances in X-ray Analysis, Volume 51

Integrated intensities measurement/simulation
0
0,2
0,4
0,6
0,8
1
1,2
0 100 200 300 400 500 600 700 800 900 1000
pixel#
norm
ed in
tens
itysimmeas
Figure 8. Measurement and simulation.
Deviation difference/measurement
-0,2
0
0,2
0,4
0,6
0,8
0 100 200 300 400 500 600 700 800 900 1000
pixel#
devi
atio
n
deviation
Figure 9. Deviation difference/measurement.
REFERENCES [1] Radon, J. In Bericht Sächsische Akademie der Wissenschaften; Saxon Academy of Sciences:
Leipzig, 1917; Vol. 69, pp. 262–267. [2] Ebel, H. Adv. X-ray Anal. 2006, 49, 267–273. [3] Mantler, M.; Willis, J. P.; Lachance, G. R.; Vrebos, B. A. R.; Mauser, K.-E.; Kawahara, N.;
Rousseau, R. M.; Brouwer, P. N. In Handbook of Practical X-Ray Fluorescence Analysis; Beckhoff, B.; Kanngießer, B.; Langhoff, N.; Wedell, R.; Wolff, H., Eds.; Springer: Berlin, 2006; pp. 309–429.
[4] Brunetti, A.; Sanchez del Rio, M.; Golosio, B.; Simionovici, A.; Somogyi, A. Spectrochim. Acta, Part B 2004, 59, 1725–1731.
[5] Elam, W. T.; Ravel, B. D.; Sieber, J. R. Radiat. Phys. Chem. 2002, 63, 121–128. [6] Chantler, C. T.; Olsen, K.; Dragoset, R. A.; Chang, J.; Kishore, A. R.; Kotochigova, S. A.;
Zucker, D. S. X-Ray Form Factor, Attenuation and Scattering Tables (version 2.1) <http://physics.nist.gov/ffast>.
241Copyright ©JCPDS-International Centre for Diffraction Data 2008 ISSN 1097-0002Advances in X-ray Analysis, Volume 51