monte-carlo study of the mrpc prototype for the upgrade of
TRANSCRIPT
Prepared for submission to JINST
13th Workshop on Resistive Plate Chambers and Related Detectors(RPC2016)Feb. 22-26, 2016Ghent, Belgium
Monte-Carlo study of the MRPC prototype for theupgrade of BESIII
F.F. An, a,1 S.S. Sun, a H.M. Liu, a W.G. Li, a Z.Y. Deng, a H.H. Liu, a J.Y. Liu a
and R.X. Yangb
aInstitute of High Energy Physics, Chinese Academy of Science,Beijing 100049, China
bUniversity of Science and Technology of China, Hefei,Anhui 230026, China
E-mail: [email protected]
Abstract: A GEANT4-based simulation is developed for the endcap time of flight(ETOF) upgrade based on multi-gap resistive plate chambers (MRPC) for the BESIIIexperiment. The MRPC prototype and the simulation method are described. Using a fullMonte-Carlo simulation, the influence of high voltage and threshold on time resolution anddetection efficiency are investigated. The preliminary results from simulation are presentedand are compared with the experimental data taken with the prototype MRPC modules.
Keywords: Resistive-plate chambers, Detector modelling and simulations II (electricfields, charge transport, multiplication and induction, pulse formation, electron emission,etc), Gaseous detectors
1Corresponding author.
arX
iv:1
605.
0215
5v1
[ph
ysic
s.in
s-de
t] 7
May
201
6
Contents
1 Introduction 1
2 Experiment setup 1
3 Simulation method 23.1 Primary ionization 23.2 Electron multiplication 33.3 Signal induction 33.4 Signal charge to time conversion 4
4 Comparison with experimental results 5
5 Conclusion 6
1 Introduction
The BESIII experiment [1] is designed to study τ -charm physics (√s=2-4.6 GeV) in e+e−
collisions at the double-ring Beijing Electron-Positron Collider (BEPCII). The time-of-flight(TOF) subdetector of BESIII plays an important role in particle identification (PID). In2013, BESIII started an endcap TOF (ETOF) upgrade based on multi-gap resistive platechambers (MRPC), which could effectively reduce the influence of multiple scattering effectswith the main drift chamber (MDC) [2], and significantly improve the PID ability [3]. In2015, two prototype MRPC modules were installed for performance check, and participatedin data taking during physics runs under a series of high voltages and thresholds.
Monte-Carlo (MC) simulation is necessary in understanding the behavior of the MRPCdetector and minimizing systematic uncertainties in the future physics analysis at the BE-SIII experiment. Therefore a reliable simulation software is desirable to describe the new de-tector and physical interactions. A simulation package has been built based on GEANT4 [4].It has been implemented into the BESIII Offline Software System (BOSS) [5], capable toperform full simulation and reconstruction. In this paper, the MRPC prototype and thesimulation method are described in detail. The performance is studied related with timeresolution and detection efficiency based on the experimental data taken with the prototypemodules.
2 Experiment setup
The BESIII detector is a general-purpose spectrometer consisting of five main componentsarranged cylindrically symmetric around the interaction point. Starting from the innermost,
– 1 –

it consists of a MDC, a scintillator TOF, a crystal electromagnetic calorimeter (EMC),a superconducting solenoid magnet surrounding the EMC barrel with an axial uniformmagnetic field of 1.0 T, and an outermost muon chamber (MUC) embedded within thereturn yoke of the magnet. The ETOF system is mounted inside the EMC endcap. Twoprototype MRPC modules are installed into ETOF, taking place of four scintillators witha coverage of 1/18 in azimuth, as shown in Figure 1(a).
The design of one MRPC module is shown in Figure 1(b). It has 12 gas gaps arrangedin a double stack. The gaps are 0.22 mm thick separated by 0.4 mm thick inner glasses,which are used as resistive plates with volume resistivity of about 1013 Ω cm. The 0.55mm thick outer glasses are coated with graphite film, which is used as the electrodes. Theelectrodes are separated from the readout strips by mylar films. In each module, there are12 double-ended readout strips embedded in printed circuit boards (PCB), each of whichis 25 mm wide with a 4 mm interval between them. PCBs are covered with honeycombboards to hold the whole structure. The module is enclosed in a 25 mm thick gas-tightaluminum box shown in Figure 1(c), which is filled with a gas mixture of 90% C2F4H2, 5%SF6 and 5% iso-C4H10. The front-end electronics (FEE) are contained in the additionalboxes at both sides and on the top of the aluminum box.
(a) (b) (c)
Figure 1. Experimental setup for MRPC performance check: (a) One TOF endcap with twoMRPC modules installed; (b) Schematic representation of one MRPC bare chamber; (c) A singleMRPC module.
3 Simulation method
The exact description of the geometry and material and the physics processes involving theinteraction between the incident particles and the working gas, are realized using GEANT4.The main processes in simulation consist of primary ionization, electron multiplication,signal induction, and conversion from charge signals to time information. These processeshave been discussed in Ref. [3, 6, 7]. Here we mainly present some primary results relatedto each process.
3.1 Primary ionization
The primary ionization is characterized by the average number of clusters per unit lengthand the probability distribution of the number of electrons per cluster. In simulation these
– 2 –

parameters of the working gas are determined by GEANT4. The simulation results areillustrated in Figure 2: there is an average of about 4 clusters in one gap, and each clustermost likely starts from 3-4 primary electrons.
Entries 19025
Mean 3.883
RMS 3.294
Primary Cluster Number in One Gap0 5 10 15 20 25
Num
ber
of C
ount
s
0
500
1000
1500
2000
2500
3000
3500
4000
4500 Entries 19025
Mean 3.883
RMS 3.294
Entries 1340338
Mean 3.581
RMS 7.359
Primary Cluster Size0 50 100 150 200 250
Num
ber
of C
ount
s
1
10
210
310
410
510Entries 1340338
Mean 3.581
RMS 7.359
Figure 2. Left: the number of primary clusters in one gap. Right: the number of primaryelectrons in one cluster.
3.2 Electron multiplication
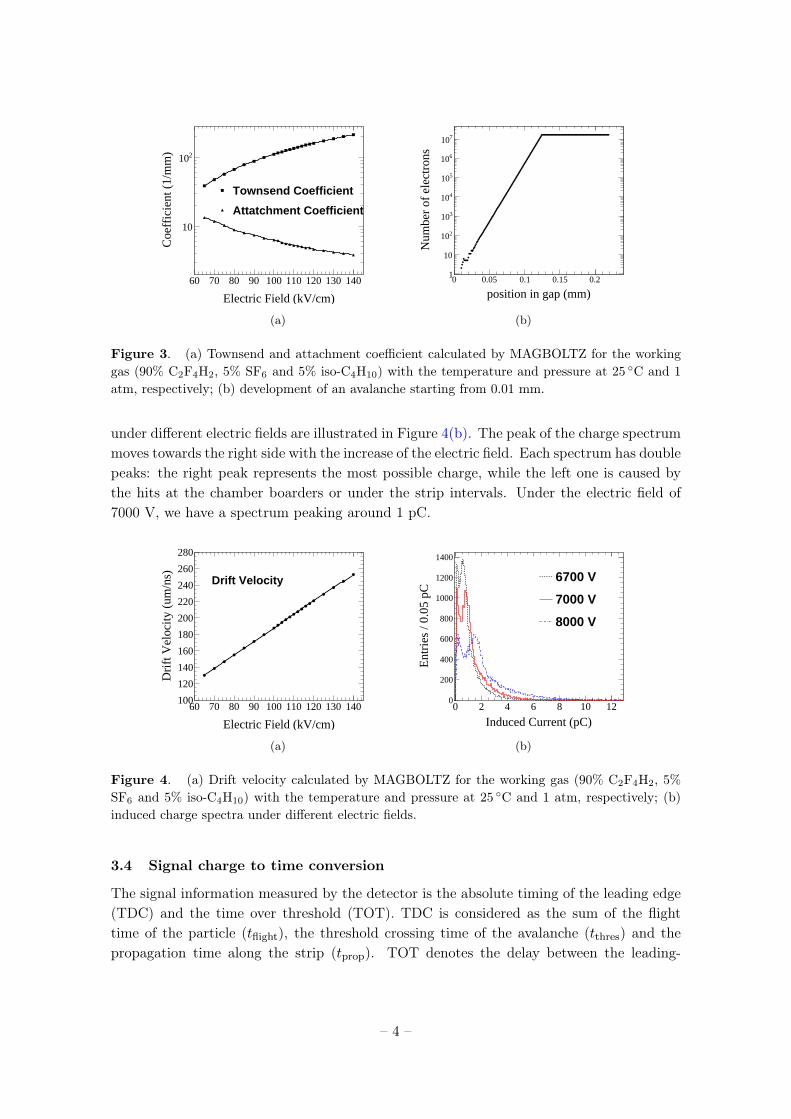
Two parameters are used to characterize the multiplication process: one is the Townsendcoefficient α describing the probability of multiplication due to secondary ionization, andthe other is the attachment coefficient η describing the probability of attachment. Thevariation of both coefficients with electric field are calculated using MAGBOLTZ [8], as isshown in Figure 3(a) for the working gas under standard temperature and pressure.
Figure 3(b) shows the development of one avalanche along the gas gap starting from0.01 mm. It grows almost exponentially at the early stage, and stops growing when theavalanche contains electrons more than Nsat (1.5×10⁷ in this study, close to the limitfor avalanche-streamer transition [9]) for consideration about the space charge effect. Anaccurate simulation of the space charge effect involving the dynamic calculation of theelectric field contributed by the avalanche charges is investigated in Ref. [10]. In this study,a simple cut-off is used because the time resolution and detection efficiency which reallyconcern us are only sensitive to the early stage of an avalanche where the space chargeeffect can be neglected. We vary the value of Nsat and observe no obvious change in theresolution and efficiency of the collision data.
3.3 Signal induction
The signal caused by positive and negative ions is neglected because their velocities are verysmall. The induced current from electrons is calculated using the Ramo’s theorem [11]:
i(t) = EweightvdriftQeN(t), (3.1)
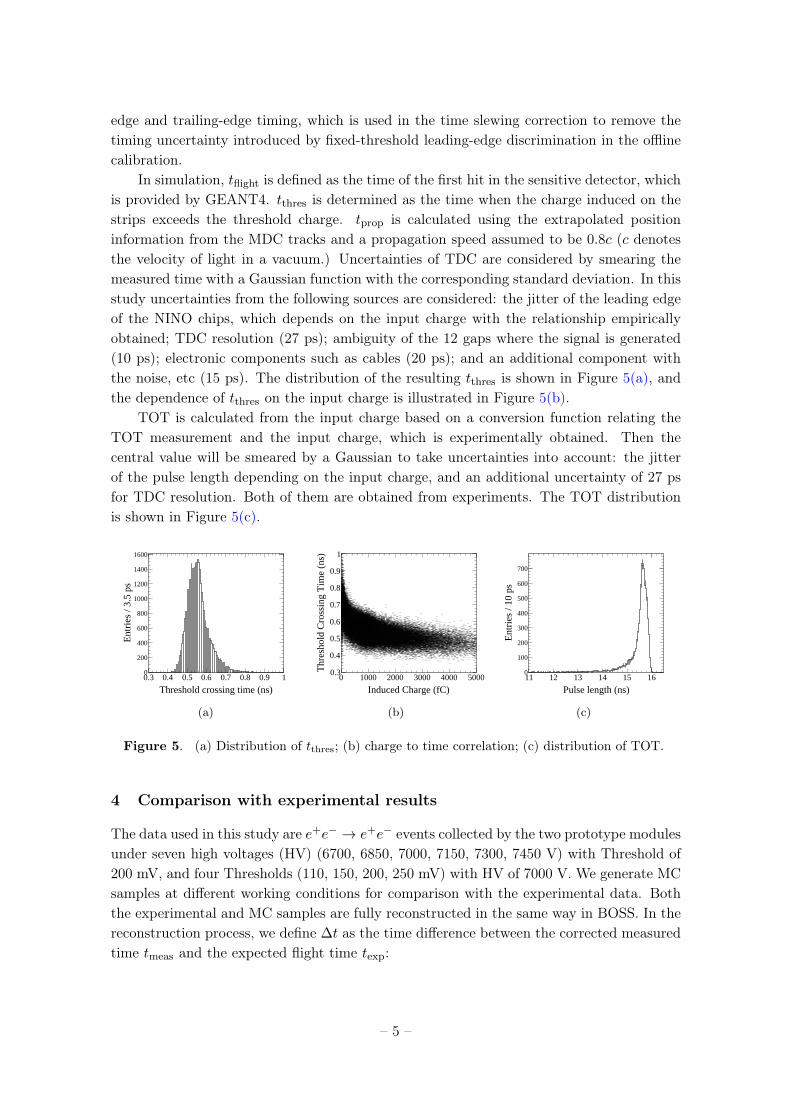
with Eweight being the weighting field [7], vdrift the drift velocity, Qe the electron charge,and N(t) the number of electrons at time t. The vdrift variation with the electric fieldis calculated using MAGBOLTZ, as is shown in Figure 4(a). The induced charge spectra
– 3 –
Electric Field (kV/cm)
60 70 80 90 100 110 120 130 140
Coe
ffic
ient
(1/
mm
)
10
210
Townsend Coefficient
Attatchment Coefficient
(a)
position in gap (mm)0 0.05 0.1 0.15 0.2
Num
ber
of e
lect
rons
1
10
210
310
410
510
610
710
(b)
Figure 3. (a) Townsend and attachment coefficient calculated by MAGBOLTZ for the workinggas (90% C2F4H2, 5% SF6 and 5% iso-C4H10) with the temperature and pressure at 25 C and 1atm, respectively; (b) development of an avalanche starting from 0.01 mm.
under different electric fields are illustrated in Figure 4(b). The peak of the charge spectrummoves towards the right side with the increase of the electric field. Each spectrum has doublepeaks: the right peak represents the most possible charge, while the left one is caused bythe hits at the chamber boarders or under the strip intervals. Under the electric field of7000 V, we have a spectrum peaking around 1 pC.
Electric Field (kV/cm)
60 70 80 90 100 110 120 130 140
Dri
ft V
eloc
ity (
um/n
s)
100
120
140
160
180
200
220
240
260
280
Drift Velocity
(a)
Induced Current (pC)0 2 4 6 8 10 12
Ent
ries
/ 0.
05 p
C
0
200
400
600
800
1000
1200
1400
6700 V
7000 V
8000 V
(b)
Figure 4. (a) Drift velocity calculated by MAGBOLTZ for the working gas (90% C2F4H2, 5%SF6 and 5% iso-C4H10) with the temperature and pressure at 25 C and 1 atm, respectively; (b)induced charge spectra under different electric fields.
3.4 Signal charge to time conversion
The signal information measured by the detector is the absolute timing of the leading edge(TDC) and the time over threshold (TOT). TDC is considered as the sum of the flighttime of the particle (tflight), the threshold crossing time of the avalanche (tthres) and thepropagation time along the strip (tprop). TOT denotes the delay between the leading-
– 4 –
edge and trailing-edge timing, which is used in the time slewing correction to remove thetiming uncertainty introduced by fixed-threshold leading-edge discrimination in the offlinecalibration.
In simulation, tflight is defined as the time of the first hit in the sensitive detector, whichis provided by GEANT4. tthres is determined as the time when the charge induced on thestrips exceeds the threshold charge. tprop is calculated using the extrapolated positioninformation from the MDC tracks and a propagation speed assumed to be 0.8c (c denotesthe velocity of light in a vacuum.) Uncertainties of TDC are considered by smearing themeasured time with a Gaussian function with the corresponding standard deviation. In thisstudy uncertainties from the following sources are considered: the jitter of the leading edgeof the NINO chips, which depends on the input charge with the relationship empiricallyobtained; TDC resolution (27 ps); ambiguity of the 12 gaps where the signal is generated(10 ps); electronic components such as cables (20 ps); and an additional component withthe noise, etc (15 ps). The distribution of the resulting tthres is shown in Figure 5(a), andthe dependence of tthres on the input charge is illustrated in Figure 5(b).
TOT is calculated from the input charge based on a conversion function relating theTOT measurement and the input charge, which is experimentally obtained. Then thecentral value will be smeared by a Gaussian to take uncertainties into account: the jitterof the pulse length depending on the input charge, and an additional uncertainty of 27 psfor TDC resolution. Both of them are obtained from experiments. The TOT distributionis shown in Figure 5(c).
Threshold crossing time (ns)0.3 0.4 0.5 0.6 0.7 0.8 0.9 1
Ent
ries
/ 3.
5 ps
0
200
400
600
800
1000
1200
1400
1600
(a)
Induced Charge (fC)0 1000 2000 3000 4000 5000
Thr
esho
ld C
ross
ing
Tim
e (n
s)
0.3
0.4
0.5
0.6
0.7
0.8
0.9
1
(b)
Pulse length (ns)11 12 13 14 15 16
Ent
ries
/ 10
ps
0
100
200
300
400
500
600
700
(c)
Figure 5. (a) Distribution of tthres; (b) charge to time correlation; (c) distribution of TOT.
4 Comparison with experimental results
The data used in this study are e+e− → e+e− events collected by the two prototype modulesunder seven high voltages (HV) (6700, 6850, 7000, 7150, 7300, 7450 V) with Threshold of200 mV, and four Thresholds (110, 150, 200, 250 mV) with HV of 7000 V. We generate MCsamples at different working conditions for comparison with the experimental data. Boththe experimental and MC samples are fully reconstructed in the same way in BOSS. In thereconstruction process, we define ∆t as the time difference between the corrected measuredtime tmeas and the expected flight time texp:
– 5 –
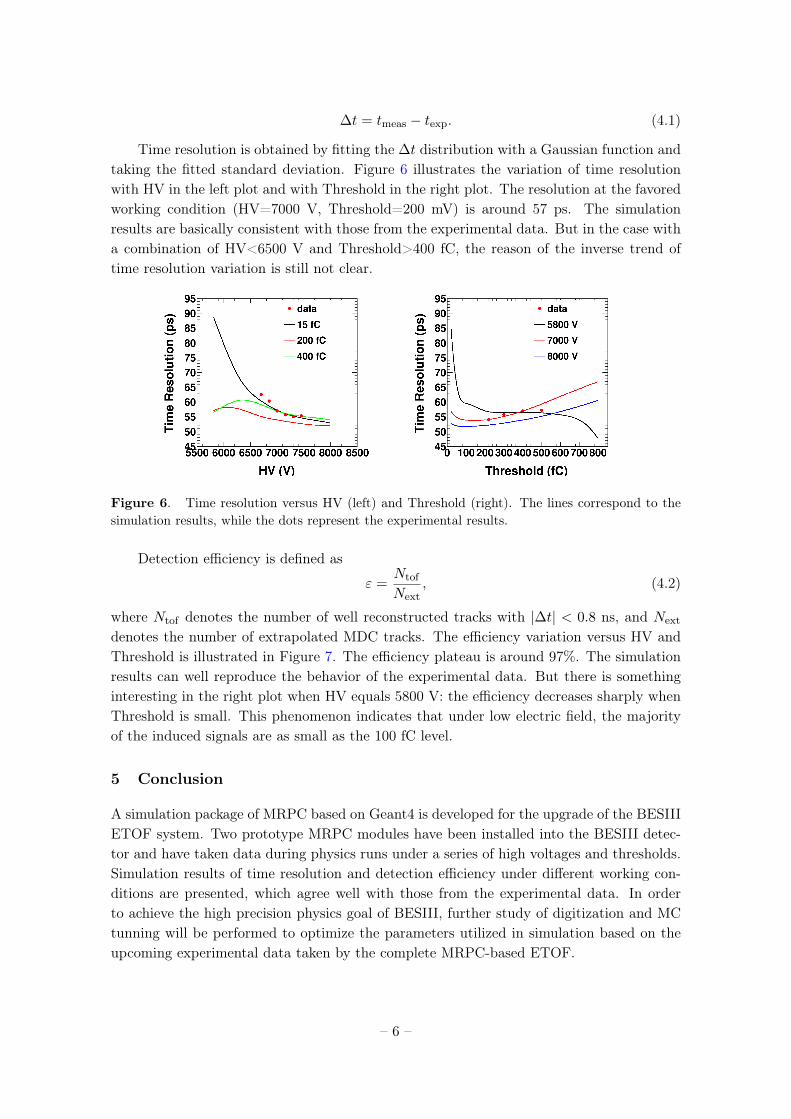
∆t = tmeas − texp. (4.1)
Time resolution is obtained by fitting the ∆t distribution with a Gaussian function andtaking the fitted standard deviation. Figure 6 illustrates the variation of time resolutionwith HV in the left plot and with Threshold in the right plot. The resolution at the favoredworking condition (HV=7000 V, Threshold=200 mV) is around 57 ps. The simulationresults are basically consistent with those from the experimental data. But in the case witha combination of HV<6500 V and Threshold>400 fC, the reason of the inverse trend oftime resolution variation is still not clear.
Figure 6. Time resolution versus HV (left) and Threshold (right). The lines correspond to thesimulation results, while the dots represent the experimental results.
Detection efficiency is defined as
ε =Ntof
Next, (4.2)
where Ntof denotes the number of well reconstructed tracks with |∆t| < 0.8 ns, and Next
denotes the number of extrapolated MDC tracks. The efficiency variation versus HV andThreshold is illustrated in Figure 7. The efficiency plateau is around 97%. The simulationresults can well reproduce the behavior of the experimental data. But there is somethinginteresting in the right plot when HV equals 5800 V: the efficiency decreases sharply whenThreshold is small. This phenomenon indicates that under low electric field, the majorityof the induced signals are as small as the 100 fC level.
5 Conclusion
A simulation package of MRPC based on Geant4 is developed for the upgrade of the BESIIIETOF system. Two prototype MRPC modules have been installed into the BESIII detec-tor and have taken data during physics runs under a series of high voltages and thresholds.Simulation results of time resolution and detection efficiency under different working con-ditions are presented, which agree well with those from the experimental data. In orderto achieve the high precision physics goal of BESIII, further study of digitization and MCtunning will be performed to optimize the parameters utilized in simulation based on theupcoming experimental data taken by the complete MRPC-based ETOF.
– 6 –

Figure 7. Detection efficiency versus HV (left) and Threshold (right). The lines correspond tothe simulation results, while the dots represent the experimental results.
Acknowledgments
This work is supported by National Natural Science Foundation of China (NSFC) underContracts No. 11575225 and National Key Basic Research Program of China under Con-tracts No. 2015CB856706.
References
[1] M. Ablikim et al., Design and construction of the BESIII detector, Nucl. Instrum. Meth.A 614 (2010) 345.
[2] H. Zhang et al., A GEANT4 Simulation Study of BESIII endcap TOF Upgrade, Chin. Phys.C 37, No. 9, 096002 (2013).
[3] M. Ullrich, W. Kuhn, Y. Liang, B. Spruck and M. Werner, Simulation of the BESIII EndcapTime of Flight Upgrade, Nucl. Instrum. Meth. A 769 (2015) 32.
[4] S. Agostinelli, et al. (GEANT4 Collaboration), Nucl. Instrum. Meth. A 506 (2003) 250.
[5] W. Li, et al., The offline software for the BESIII experiment, The Proceedings of CHEP06,Mumbai (2006).
[6] Riegler W, Lippmann C and Veenhof, Detector physics and simulation of resistive platechambers, Nucl. Instrum. Meth. A 500 (2003) 144.
[7] M. Shao, et al., Simulation Study on the operation of a multi-gap resistive plate chamber,Meas. Sci. and Technol. 17 (2006) 123.
[8] S. Biagi, Monte Carlo simulation of electron drift and diffusion in counting gases under theinfluence of electric and magnetic fields, Nucl. Instrum. Meth. A 421 (1999) 234.
[9] P. Fonte, V. Peskov and F. Sauli, Feedback and breakdown in parallel-plate chambers, Nucl.Instrum. Meth. A 305 (1991) 91.
[10] Lippmann C and Riegler W, Space charge effects in Resistive Plate Chambers, Nucl.Instrum. Meth. A 517 (2004) 54.
[11] S. Ramo, Currents Induced by Electron Motion, Proc. IRE 27 (1939) 584.
– 7 –