month 6 west london ccg finance and activity performance ... m6 west fa pack... · month 6 west...
TRANSCRIPT

28-Oct-15
Month 6 West London CCG Finance and Activity Performance Report
Cover

Acronym Full Provider Name
ASP Ashford And St Peter's Hospitals NHS Foundation TrustBLT Barts Health NHS TrustC&W Chelsea And Westminster Hospital NHS Foundation TrustCLCH Central London Community Healthcare NHS TrustCNWL Central And North West London MH NHS Foundation TrustEHT Ealing Hospital NHS TrustESH Epsom And St Helier University Hospitals NHS TrustGOSH Great Ormond Street Hospital For Children NHS Foundation TrustGSTT Guys And St Thomas NHS Foundation TrustHRCH Hounslow And Richmond Community Healthcare NHS TrustHUH Homerton University Hospital NHS Foundation TrustHWP Heatherwood And Wexham Park Hosps NHS Foundation TrustICHT Imperial College Healthcare NHS TrustKCH Kings College Hospital NHS Foundation TrustKHT Kingston Hospital NHS TrustMEH Moorefield's Eye Hospital NHS Foundation TrustNWLHT North West London Hospitals NHS TrustRBH Royal Brompton And Harefield NHS Foundation TrustRFT Royal Free London NHS Foundation TrustRMH The Royal Marsden Hospital NHS Foundation TrustRNOH Royal National Orthopaedic Hospital NHS TrustRSC Royal Surrey County NHS Foundation TrustSGT St George's Healthcare NHS TrustSLAM South London And Maudsley NHS Foundation TrustSWL&StG South West London And St George's Mental Health NHS TrustTHH The Hillingdon Hospital NHS Foundation TrustUCLH University College London NHS Foundation TrustWHH The Whittington Hospital NHS TrustWLMH West London Mental Health NHS TrustWMUH West Middlesex University Hospital NHS Trust
high quality support to commissioners to improve health and wellbeing
The following acronyms are used throughout this pack.
Key message
Contract Acronyms
Acronyms

Executive summary Page Contracts performance Page
Executive Summary 2 Acute Contracts YTD Performance 19
CCG Finance dashboard 3 Acute Provider Finance Performance - C&W 20
Risks & Opportunities 4 Acute Provider Finance Performance - ICHT 21
Main Acute Providers: Key issues and actions 5 Key issues and actions - C&W (i) 22
Movements of Variances including Running Costs 6 Key issues and actions - C&W (ii) 23
Investments Plan 7-8 Key issues and actions - ICHT i & ii 24- 25
Underlying Position 9 Progress on strategic priorities - ICHT 26
Key issues and actions - Out of Area Trusts 27
Key issues and actions - Community Contract, CLCH 28
Overall financial position Page Appendices
CWHHE Risk Share 10 Appendix 1.1: Revenue resource limit A1
Surplus/deficit including running costs 11 Appendix 2.1: RAG Rating Definitions A2
Breakdown of running cost spend 12 Appendix 3.1: CLCH Deep Dive A3
Provider Contract: Deep Dive timetable 13 Appendix 4.1: Mental Health, CNWL A4 - A5
Breakdown of reserves 14 Appendix 5.1: Collaborative Management Infrastructure A6
QIPP 15
Capital, creditor payments and cash 16
Better Care Fund 17
Investment Outturn summary 18
high quality support to commissioners to improve health and wellbeing
Contents
1

Status
Overall
financial
position
•
Green
Risks and
Opportunities
•
Green
Contract
performance
•
•
Green
Running
Costs
•
Green
QIPP delivery•
Green
Investment &
reserves
•
Green
Source: Team analysis
In M6 the CCG is reporting a year-to-date and a full year outturn position on plan for 2015/16, which is in line with the NHSE control total of £23.7m. This
forecast is supported by the £2.9m (year to date) and £5.5m (full year utilisation) of available reserves and the expectation of the full delivery of West
London’s QIPP schemes which are phased toward the second half of the year. Thereby highlighting the importance of maintaining QIPP delivery in line with
plan for the rest of 2015/16 .
As at M6 the CCG is in a favourable position before CWHHE risk share with a likely net opportunity of £0.1m. The likely risks totalling £10.4m are fully
mitigated both by the £10.5m of likely available opportunities which include contingency and uncommitted reserves no longer required following contract
settlement.
The details of the risks and opportunities faced are presented in page 4 of the M6 Finance and Activity report. The main risks are:
1. £1.5m to cover emerging risks in acute services;
2. £0.8m for covering CLCH Whole systems support costs;
3. £1.0m for covering potential QIPP under- achievement;
4. £1.6m of emergent NHS Property Services costs for the West London Estate. The estates team is investigating a claim for actuals £1.6m greater than
budget for 2015-16.
The main opportunities are:
1. £2.7m (£5.5m pre risk adjusted) emerging from a M6 assessment of potential slippage of West London’s 2015/16 Investment plan;
2. £3.7m emerging from the limited calls currently on West London’s Contingency fund;
3. £1.0m from creditors / accrual established at 2014/15 year end not being needed because anticipated invoices were unforthcoming;
4. £1.8m emerging from the limited calls currently on other 2015/16 budgets and reserves.At M6 acute contracts are reporting a marginal pressure year-to-date variance of £1.9m and an adverse full year outturn of £2.9m. The position is now
reported against agreed contract values with Imperial contributing an adverse outturn performance of £3.0m, which has been managed through the release
of available acute reserves.
The key areas driving the Imperial over performance are both planned (outpatients and inpatients) and unplanned care (non-elective and critical care.). Due
the material impact of the Imperial performance, the CWHHE contract management team have been asked to attend today’s F&P committee and provide a
detailed update on M1-5 performance to enable us to agree next step mitigating actions.
The agreed CWHHE collaborative risk share arrangements were transacted in Month 3 with West London contributing £900k to Hammersmith & Fulham
CCG, however, the CCG has seen a significant improvement and thus no longer require this support.
The full year forecast risk on the QIPP delivery plan is c£1.3m and it is proposed that West London covers this exposure from slippage on spending on its
2015/16 investment pot.
The CCG's detailed 2015/16 investment plan is being reviewed and monitored by West London’s Investment Task force. West London CCG's 2015/16
investment pot - £506k recurrent and £9,604k Non recurrent is forecast to be £5.2m under spent in 2015/16. This significant figure is to be reviewed in
depth in M7 and is arising predominantly due to delays resulting:
1. from moving projects from the planning to delivery phase; and
2. in attributing transformation staffing expenditure to specific projects so the costs are being covered from reserves rather than being attributed to
individual project (c£1.5m).
The F&P are asked to note the reasons for this potential slippage and endorse West London CCG’s Investment taskforce on-going review for opportunities
for redeploying these “slipped” funds after covering emerging risks. We proposed that all redeployment opportunities are reviewed for prioritisation and
implementation feasibility by the F&P at the M7 committee meeting.
Following the on-going review of West London’s establishment in M6, the SMT has confirmed that that West London CCG’s running costs - both year to
date and the full year forecast spend – are still heading for break-even. However as this gives very little headroom, we recommend that the SMT and F&P
will need to monitor performance on this budget very closely over coming months – especially with the aim reducing spending on interim staffing solutions
by continuing in our efforts to bring more of the establishment onto permanent contracts.
Executive summary
2

On plan or better
Take note
Action required
Indicator Actual
Rating this
month
Financial position in month Break even/agreed surplus £1,978k £1,978k 0.0% variance from plan
Financial position year to date Break even/agreed surplus £11,867k £11,867k 0.0% variance from plan
Financial position forecast outturn Break even/agreed surplus £23,735k £23,735k 0.0% variance from plan
Running costs forecast outturn Break even/agreed surplus £5,159k £5,159k 0.0% variance from plan
QIPP year to date £2,635 £2,975 12.9% variance from plan
QIPP forecast outturn £8,276 £8,469 2.3% variance from plan
Investment plan £13,039k £12,750k £289k variance from plan
Risks and opportunities £0k £100k 1.0% (net risk) / opportunity outside reported position
Creditors - Better Payment Practice Code 95.0% 97.4% 2.5% of invoice value paid in 30 days
Capital forecast outturn £0k £0k 0.0% forecast variance from allocation
Cash £157,483k £157,877k 0.3% year to date variance from cash limit
high quality support to commissioners to improve health and wellbeing
Note
Risk and opportunities reflect total likely risk identified in month 6 of £10,392k and total opportunity of £10,492k.
Target
Key
CCG finance dashboard
3

Key message
Amount
Risks £k Probability Value £k Probability Value £k Probability Value £k
Other QIPP Achievement (1,284) 75% (963) 20% (257) 100% (1,284) Undelivery of QIPP on Imperial and ChelwestAcute over-performance (2,944) 50% (1,472) 0% 0 100% (2,944) M1-5 Acute run-rate worsening across CWHHE, assuming this represents higher
growth than assumed for 2015/16.Mental health/Community Cost and Volume (1,423) 25% (356) 0% 0 100% (1,423)
Further IR/NHSE (1,080) 50% (540) 0% 0 100% (1,080) Additional IR potential re transitional care and re stress testing etcContinuing care (750) 25% (188) 0% 0 100% (750) Upper range of high cost patient impact that can emerge beyond average budgets
RHN Pressure (450) 95% (428) 95% (428) 95% (428) Royal Hospital for Neuro-Disabilities are attempting to negotiate tariff change with all
London CCGsNHS Property Services and CHP (1,798) 90% (1,618) 90% (1,618) 100% (1,798) NHS Property service costs - Notified risk to WL of moving from current billing
arrangements to billing by usage - final value still being negotiatedOverseas visitors (200) 95% (190) 95% (190) 95% (190) In 2015/16 the allocation is flagged as being decreased by move the risk share from
50:50 to 75:25 for CCGsVAT on OOH Contracts (144) 95% (137) 95% (137) 95% (137) Consequence of final outcome of contract with Fed and GPsIMT Developments (97) 75% (73) 0% 0 100% (97) The potential 15/16 shortfall on GPIT project funding now allocations have been
notified
Homecare (472) 50% (236) 0% 0 100% (472)
CLCH Whole systems support costs (1,000) 80% (800) 50% (500) 100% (1,000) Budget identifed for funding new model not releaseableAdditional SAHF Contribution (52) 50% (26) 0% 0 100% (52)
Unforeseen risks (1,000) 50% (500) 0% 0 100% (1,000) Additional services Identified as not having been budgeted for originally in 2015/16
budgetLead Health Provider CIS management
contribution
(150) 90% (135) 0% 0 100% (150) Management fee for the LHP for CIS
Winter Pressures (2,000) 50% (1,000) 0% 0 100% (2,000)
Total (14,845) 58% (8,661) 21% (3,129) 100% (14,805)
Opportunities
Investment slippage 5,453 50% 2,727 100% 5,453 100% 5,453 Funding set aside to cover 2015/16 priority CCG Investments identified in the outline
Operating planning for work up and final costing and approval during the year. Delay
to Whole Systems (20%)Other budgets not required 1,300 50% 650 100% 1,300 25% 325 Reserve set aside to cover CLCH in-year contract variations and underlying
performance impact at Imperial and ChelwestBalance sheet gains 2,000 50% 1,000 100% 2,000 50% 1,000 Amount of accruals set aside by CCG in 2014/15 after the Agreement of Balances (and
other) exercises which are settled on average in West's favour and offer Non recurrent
benefitContingency not utilised 3,837 95% 3,645 100% 3,837 0% 0 NHSE mandate the retention of 1% contingency to cover emerging 2015/16 cost
pressuresOther reserves not utilised 2,220 50% 1,110 100% 2,220 25% 555 Acute non demo growthRTT backlog included in FOT 887 25% 222 100% 887 0% 0 RTT at risk of being initially reported by Trusts but recoup under CWHHE wide initiative
Quality premium 694 25% 174 100% 694 0% 0
ICP 875 71% 625 86% 750 63% 550 Return of ICP funding
Homecare Upside 472 20% 94 100% 472 0% 0
London Commissioning Programmes 512 33% 169 50% 256 0% 0
PRP 14-15 80 95% 76 100% 80 50% 40 PRP Accrual 14-15 not needed
Total 18,330 57% 10,492 171% 17,949 44% 7,923
Shared Risks / Opportunities
Acute over-performance (731) 100% (731) 100% (731) 100% (731) West London CCG's contribution to the CWHHE risk share where Imperial's costs in
H&F particularly are well above plan
Other SaHF Overspend (1,000) 100% (1,000) 0% 0 100% (1,000) West London CCG's contribution to the CWHHE risk share
(1,731) 100% (1,731) 42% (731) 237% (1,731)
Net (Risks) & Opportunities 1,755 100 14,089 (8,613)
high quality support to commissioners to improve health and wellbeing
As at month 6 the CCG has a net likely opportunity of £100k with local and shared risks considered fully mitigated by the opportunities identified including flexibility that could be realised through 2014/15 balance sheet gains.
This net position has not been reflected in the Month 6 position because the likelihood of materialisation of these risks still needs to assessed and reviewed on a monthly basis.
In order to manage / cover this risk if it materialises, West London CCG is retaining, as yet, uncommitted funds (which are drawn from the Reserves, balance sheet gains, RTT backlog adjustments and Acute under-
performance). The table below shows how these Reserves could be committed at £10.5m to cover the "Likely" risks whilst still leaving a net headroom of £0.100m after making a forecast contribution West London CCG's
contribution to the CWHHE risk share .
Looking at the worst case risks at M6 which amounts to (£16.5m) if they were to offset with the available opportunity of £7.9m, the CCG would be left with a pressure of (£8.6m).
The best case scenario shows risks amounting to (£3.1m) which would be mitigated by opportunities of £17.9m showing a net opportunity of £14.1m.
Likely Case Best Case Worst Case Description / Actions
Risks and opportunities
4

Issue Key drivers
Financial
impact £m Action Owner Timeline
ICHT (£3.0)
Actions underway
• Terms of reference for the stress testing audit submitted to the Trust (13/10) and auditors being sourced.
• Discussion on going regarding finding from the Critical Care audit(financial challenge pending senior level discussions)
• Finalisation of Q1 challenges (met Trust 12/10 to progress and awaiting final response from trust cop 16th Oct
• Review of activity by GP practise
• Review NEL & Day-case /Elective activity to try to determine whether the classification is correct.
• Review of referral data (actual and future order book)
David Hill
C&W (£0.3)
For all NWL CCGs, ChelWest reported an adverse unmitigated variance of £2.8m YTD and £1.3m post mitigations and a
favourable in month variance of £353k. The majority of the mitigated YTD adverse variance relates to CL CCG, H&F
CCG, Ealing CCG and WL CCG and the over performing PODs in these CCGs are mainly within Outpatients (£1.5m),
Critical Care (£544k), Non-Electives (£259k) and Electives & Day cases (£358k). Q1 has been closed apart from some
reinvestment decisions (escalated to PCE). CAPS wthin the contract essentially block the cardio/respiratory outpatient
service and open dialogue concerning referral activity and management in a number of other planned care settings
(ongoing). Fortnightly meetings are underway to understand the Trusts RTT position and how this is affecting activity
flows within the Trust.
Deepti
Gaddam
high quality support to commissioners to improve health and wellbeing
Acute
contracts
(over) / under-
performance
Main Acute Providers: Key issues and actions relating to financial position
5

Analysis of M6 Variance against M5
Initiative Month 6 Month 5 Movement Month 6 Month 5 Movement Further detail
Acute NHS SLA Services
(incl. CQUIN & Ambulance)580 12 568 828 (1,876) 2,704
Reported SLAM overperformance managed through release of reserves (£4.7m). Additionally
spend for RTT and Opthalmology follow up activity at Imperial has reduced by £515k to £887k full
year.
Other Acute Activity Services (370) (25) (346) (532) (59) (474)
Expected charges for Half penny walk in centre have now been included in the reported position
(£139k full year). Additional charges expected for the continuation of activity into 15/16 at CLCH
winter ward (£364k full year).
Community Services 415 (2) 416 1,121 1,013 109Total BCF CIS double count of £1,129k has now been has been released into the financial position
.
Mental Health Services 597 672 (75) 536 1,074 (537)In month movement mainly due to Mental Health Whole System funding to be transfered from
investment reserves in month 7(£319k full year).
Prescribing (208) (125) (82) (343) (175) (168) Practice prescribing forecast based on run rate.
Continuing Care (28) (254) 226 (125) (341) 216 Improvement in CHC forecast as reported on latest broadcare data.
Primary Care Service 229 (13) 242 647 1,599 (952) OOH underspend revised downwards by circa. £1m due to refined LES full year forecasting.
Other Non Acute Services (270) (176) (94) (552) (426) (125) Increase activity on S75 personal health budgets (£178k full year).
Commissioning & Non
Recurrent Reserves78 33 45 398 79 319
Funding released to offset overspend reported on MH Whole Systems. Funding to be transferred
from reserves in month 7.
Other-Other Commissioned
Services(1,023) (85) (938) (1,980) (888) (1,092) In month adverse movment is due to staffing costs leading on local projects.
Running Costs 0 0 0 0 0 0
Total (0) 38 (38) (0) 0 (0)
Source: Financial ledger
high quality support to commissioners to improve health and wellbeing
Year to Date Variance Forecast Variance
Movements of Variances including Running Costs
6

Key message
Allocated Ref Status Service Lead Manager
Total Budget
2015/16
Recurrent
Full Year Plan
2015/16 Non
Recurrent
Recurrent
16/17
Non
Recurrent
16/17
15/16 YTD
Plan
15/16 YTD
Actual YTD Variance
15/16
FOT
15/16FOT
Variance
Potential
Slippage at
M6
£000 £000 £000 £000 £000 £000 £000 £000 £000 £000 Commentary
20 July 15 F&P or
before
Whole Systems - Over 65's Jayne Liddle, Assistant
Director Strategic Delivery
0 3,970 0 4799 3,970 0 0 0 0 2,200 Due to difficulties in recruiting case managers significant
slippage is emerging, offset by c£500k additional /
transformational costs. In addition as across all CWHHE
there is a lack of transparency on the total quantum spend
of all the inter-related IT spends which the WS team is
working with CCS finance to improve with Farid's team. A
Finance delivery model being developed to quantify
potential 2015/16 slippage in more details for M7
11 July 15 F&P or
before
Primary Care Strategy –
CLS
Development/Workshop
s
Simon Hope, Deputy
Borough Director, West
London CCG
0 60 0 0 60 0 0 0 0 Workshops are planned and profiled to commit full spend
29 (NEW
from 15/08))
F&P 25/08/2015 Proactive Care Homes
pilot(1 year extension)
Mona Hayat 0 80 0 210 80 0 0 0 0 0 £150k needed for 15/16, but only £80k bid for as nett
change on bottom line in 2015/16 proposal to use the £70k
NR 15/16 receipt for ICP payback (leaving £6.4k
contingency). NB the previously identified project #16
attracting £70k funding for Technology homes slipped to
16/17 so nett increase in funding requested = £10k
33 (New) F&P 25/08/2015 Wheelchairs programme Mona Hayat 0 16 0 16 16 0 0 0 0 0 On track
30 (New) F&P 25/08/2015 Personal health Budgets Mona Hayat 0 41 0 41 41 0 0 0 0 0 Staff identified and in post
15 July 15 F&P or
before
Unplanned Care &
Whole systems –
Managerial & admin
support
Mona Hayat, Assistant
Director Strategic Delivery
218.5 218.5 218.5 0 0 0 0 0 Staff identified and in post
31 (new) F&P 25/08/2015 PA Consulting extension Simon Hope 0 17 0 0 17 0 0 0 0 0 Spent
FP3 July 15 F&P or
before
Funding voids 60 60 0 In year spend profiled by estates
34 Paddington Festival 20 19 Paddington Festival approved in January 15 for one year.
Taken from QIPP investments
12 July 15 F&P or
before
Primary Care Strategy –
Training and ODSimon Hope, Deputy
Borough Director, West
London CCG
0 120 0 0 120 0 0 0 0 0 Training and OD plans in place
20b July 15 F&P Mental Health Urgent
Care Pathway Redesign
Glen Monks 310 476 310 0 0 0 0 310 Staff identified and in post from the MH transformation
team roles - currently covered by reserves - 3 months
slippage
38 Sep-15 Half Penny Steps Katrina Mindel 5 0 5 0 0 0 0 0 £4.5K taken from Established SMT Controlled Budget (37)
32 (new) Sep-15 Winter Marketing and GP 7
day servicesLouise Proctor 68 System Resilience group. Encourgae use of flu jab. Self care
etc. money uesd from MH resilience ref 20a
36 Sep-15 Estates Whole Sysytem Kate Brady 100 0 100 0 0 0 0 £100k to be taken form QIPP Investment
37 Sep-15 Establish SMT controlled
budget96 96 Maximum project to be authorised by SMT without rertun
to F&P <+£10k. (£4.5 to fund Half Penny Steps
Total 219 4,962 219 5,602 5,033 0 0 0 0 2,529
29 TBC Perinatal Mental Health
Investment
Glen Monks 78.75 5 130 83.75 0 0 0 0 42 50% slippage at 30 September 2015
22 TBC Employment Support in
Primary Mental Health
Care
Glen Monks 51 102 51 0 0 0 0 38 75% behind schedule - planned start date 1 January
39a New TBC Cardiology & Respiratory Matthew Henry 278 278 0 0 0 0 £847k initial under funding of the Cardiology and
respiratory community service. Of this £568k to be funded
from Community Reserves
39b New TBC Ophthalmology Matthew Henry 53 53 0 0 0 0 £53k funded from QIPP
5 TBC Programme
management for urgent
care
Mona Hayat 65 22 65 0 0 0 0
Total presented at October F&P
for sign-off130 401 232 22 531 0 0 0 0 80
3 TBC PPE Investment –
Training and
Development
Kalwant Sahota 15 15 15 0 0 0 0 0 On track
6 TBC GP in room to support
NHS 111
Simon Hope, Deputy
Borough Director, West
London CCG
40 40 0 0 0 0 0 On track
31 TBC Mental Health Joint
Commissioning: key
pathway reviews
Glen Monks 80 80 0 0 0 0 80 Staff identified and in post from the MH transformation
team roles - currently covered by reserves - 9 months
slippage
20a TBC Whole Systems - Mental
Health
Glen Monks 332 400 332 0 0 0 0 277 Slipping to February 2016 - Slipping acknowledged at 16
September Investment Taskforce so £68k utilised to fund
the Winter Marketing project: Ref 32
4 TBC PPE Investment –
Community Health
Messages
Jayne Liddle, Assistant
Director Strategic Delivery
35 35 35 0 0 0 0 0 On track
1 TBC PPE Investment – Third
Sector Upskilling
Jayne Liddle, Assistant
Director Strategic Delivery
30 30 30 0 0 0 0 0 On track
5 TBC Programme
management for urgent
care
Mona Hayat 91 91 0 0 0 0 91 Staff costs currently covered by reserves so all slippage
19 TBC Estimated cost for the
Multi Systemic Therapy
MST Team (2 years)
Glen Monks 27 27 0 0 0 0 27 Slipping
7 TBC Redirection pilot at
Chelsea and
Westminster
Katie Thomas 10 10 0 0 0 0 0 On track
Total Committed in principle BC need
at next F&P for sign-off77 583 50 430 660 0 0 0 0 475 0
As at Month 6 it is anticipated that the CCG will fully spend its QIPP and Other Investment budgets. The details of the proposed Other Investments for 2015/16 and the status of the respective investment's Business cases through the CCG's governance / approval processes are set out below.
Other Scored and Prioritised
2015/16 Investments - Slated
against the Investment Reserve -
Committed in principle at SMT
/Investment committee, now
needing formal Business Case
presentation at this F&P for sign-
off
October F&P Business Case
presentations
Other Scored and Prioritised
2015/16 Investments - Slated
against the Investment Reserve -
Committed in principle at SMT
/Investment committee, now
needing formal Business Case
presentation at NEXT F&P for
sign-off
To be Moved into the agreed
2015/16 Budget - from
Investment Reserve
Plans to use the 2015/16 Investment pot on West London's Priority Investments and Health Parity Schemes
7

Key message
Allocated Ref Status Service Lead Manager
Total Budget
2015/16
Recurrent
Full Year Plan
2015/16 Non
Recurrent
Recurrent
16/17
Non
Recurrent
16/17
15/16 YTD
Plan
15/16 YTD
Actual
YTD
Variance 15/16 FOT
15/16 FOT
Variance
Potential
Slippage at
M6 Commentary
£000 £000 £000 £000 £000 £000 £000 £000 £000 £000
8 TBC Primary Care Strategy –
SystmOne development and
training
Katrina Mindel 90 0 90 0 0 0 0 45 50% slippage at 30 September 2015
10 TBC CCG Member practice co-
design engagement project
Simon Hope 100 0 100 0 0 0 0 50 50% slippage at 30 September 2015
28 TBC QIPP reserve Breac MacLeod 803 0 803 0 0 0 0 581 Reduced by £100k for Estates WS, £100k for established
SMT controlled budget, £278k for Cardiology and
Respiratory Community Service and £53k for
Ophthalmology
23 TBC IT - SystmOne phase 2 Farid Fouladinejad /
Katrina Mindel
1,200 0 1,200 0 0 0 0 900 75% behind schedule - Uncertainty around IT projects as
a whole
25 TBC IT - Patient call screens Farid Fouladinejad 304 0 304 0 0 0 0 152 50% behind schedule - Uncertainty around IT projects as
a whole
26 TBC IT - GP IT Hardware refresh Farid Fouladinejad 97 0 97 0 0 0 0 0 Almost certain spend - data needed
27 Oct-15 Coaching and development Louise Proctor 50 0 50 0 0 0 0 13 25% behind schedule
14 TBC Intermediate Care for the
Homeless
Rachel Krausz 240 0 240 0 0 0 0 120 50% slippage at 30 September 2015
17 TBC Social Marketing/Roadshows Kalwant Sahota 50 0 50 0 0 0 0 0 On track
13 TBC Additional Funding for Carers Mona Hayat 71.33 0 0 0 0 0 0 0 50% slippage at 30 September 2015
24 TBC IT - Diagnostic cloud (Primary
care)
Farid Fouladinejad /
Katrina Mindel
9 209 17 0 209 0 0 0 0 109 50% behind schedule - Uncertainty around IT projects as
a whole
18 TBC Intermediate Care -Charing
Cross Beds cost tbc
Adam Mackintosh 400 1000 400 0 0 0 0 400 Staff costs currently covered by reserves so all slippage
35 Oct-15 Drugs Sarah Watkins 10 0 10 0 0 0 0
25a Oct-15 IT - SMS Farid Fouladinejad 95 0 95 0 0 0 0
Total awaiting representation
to F&P for approval
80 3,648 17 1,000 3,648 0 0 0 0 2,370
Total Planned Other
investments
506 9,594 518 7,054 9,871 0 0 0 0 5,453 Risk of £5.5m slippage in 15/16
investments
0 0 0 0 0 0 0 0 0 0
0 0 0 0 0 0 0 0 0 0
0 0 0 0 0 0 0 0 0 0
0 0 0 0 0 0 0 0 0 0
Total cost pressure needing to
be covered by investments
0 0 0 0 0 0 0 0 0 0
Total 2015/16 Budget
available506 9,604
2015/16 Budget Amount yet
to be identified / committed
0 10
21 Postponed Additional capacity for
unplanned care
Jayne Liddle 0 75 0 0 0 0 0 0 0 0
32 (New) F&P
25/08/2015
Tri-borough review of
intermediate care beds
Mona Hayat 0 8 0 0 8 0 0 0 0 0
16 F&P
25/08/2015
Technology in Homes Mona Hayat, Interim
Assistant Director
Strategic Delivery
0 0 0 90 0 0 0 0 0 0
2 Postponed PPE Investment – St Charles
Integration
Jayne Liddle 0 30 0 0 0 0 0 0 0 0 Wrapped up in Whole System
30 Postponed Bilingual Pharmacy Labelling Jayne Liddle 0 75 0 0 0 0 0 0 0 0
BCF S256 0 5,584 0 0 0 0 0 0 0 0
BCF new investments 0 1,738 0 0 0 0 0 0 0 0
Total BCF 0 7,322 0 0 0 0 0 0 0 0
WL007 Sept 15 F&P NEL admissions - Community
Independence Service (BCF)
Mona Hayat 0 1,129 0 0 0 0 0 0 0 0
WL013 Sept 15 F&P Community cardiology and
respiratory
Mona Hayat 0 780 0 0 0 0 0 0 0 0
WL025 Sept 15 F&P Community Ophthalmology
Service
Mona Hayat 0 200 0 0 0 0 0 0 0 0
WL008a Sept 15 F&P UCC/A&E (other schemes) Mona Hayat 50 0
Total QIPP Investment 0 2,159 0 0 0 0 0 0 0 0
QIPP Investment
As at Month 6 it is anticipated that the CCG will fully spend its QIPP and Other Investment budgets. The details of the proposed Other Investments for 2015/16 and the status of the respective investment's Business cases through the CCG's governance /
approval processes are set out below.
Projects awaiting
mitigating actions prior
to representation to
SMT / Investment
Committee / F&P for
approval
Cost Pressures emerging at
M5 - Unforeseen Risks
Postponed
BCF Investment
Plans to use the 2015/16 Investment pot on West London's Priority Investments and Mental Health Parity Schemes
8

(A) Annual budget at M6 (B) Reported M06 (C) Adjust the 15/16 outturn for non rec and FYE to calculate the 15/16 outturn 'exit rate'
£'000sCCG 2015/16
Submitted Plan
Actioned In-year
changes
CCG 2015/16
Annual Budget at
M02
In-year over and
under
performance
2015/16
Forecast at M02
(agrees to ISFE)
Remove non rec
allocations - note
1
Remove non rec
spend - note 2
Add back non
rec QIPP
schemes /
benefits
Remove FYE of
QIPP
Add FYE of
investments(C) Other
2015/16 outturn
exit rate
(underlying
recurrent
position)
(+ / -) (+ / -) (-) (-) (+) (-) (+) (+ / -)
Resource
Programme allocation 378,548 (14,399) 364,149 364,149 (32,286) 331,863Running cost allocation 5,159 5,159 5,159 5,159
Programme resource 383,707 (14,399) 369,308 0 369,308 (32,286) 0 0 0 0 0 337,0220 0 0
Total resource 383,707 (14,399) 369,308 0 369,308 (32,286) 0 0 0 0 0 337,022
SpendProgramme (exc. Headroom) 344,195 (14,399) 329,796 329,796 (749) (17,757) 311,290
1.0% headroom 6,780 6,780 6,780 (6,780) 0Contingency 3,837 3,837 3,837 3,837
Admin 5,159 5,159 5,159 5,159
Total spend 359,972 (14,399) 345,573 0 345,573 (749) (24,538) 0 0 0 0 320,286
Surplus / -deficit 23,735 0 23,735 0 23,735 (31,537) 24,538 0 0 0 0 16,736
% 6.19% 6.43% 6.43% 4.97%
Notes and Supplementary Information
(1) Analysis of non recurrent allocations - please complete the table below
Resource NR Spend
£'000s £'000sBrought forward surplus and lodgements 31,537 0
GPIT 620 6201. Other (please state) 129 129
Total NR 32,286 749
(2) Analysis of spend against the 2% headroom and other non recurrent spend - please complete the table below
1.0% Headroom & Other Non
Recurrent Spend£'000s
Risk share contributionTransformational change initiatives 6,780Other (please state)
1% Subtotal 6,780
Other non rec (please state) 14,169
Other non rec (please state) 3,588
Other Non Rec Subtotal 17,757
Various per CCG planning model
In year changes
Key Messages
The underlying financial position of the CCG shows the recurrent revenue less the recurrent expenditure and excludes all non-recurrent or one off items i.e. return of previous year surplus and spend on one off projects or
investments.
Non recurrent allocations and matched spend
Other_Non_Rec_Detail
M6:Underlying Position
9

Month Six Risk Share Enactment - included within Forecast Out-Turn
Central London West LondonHammersmith
and FulhamHounslow Ealing CWHHE Total
Acute over performance above reserves 0 0 0 0 0 0
Support provided to balance FOT 0 0 0 0 0 0
Month Six CWHHE R&O Summary
Central London West LondonHammersmith
and FulhamHounslow Ealing CWHHE Total
£000s £000s £000s £000s £000s Value
Acute over-performance (1,762) (1,472) (1,100) (1,724) (3,693) (9,751)
Other CCG risks (5,161) (7,188) (4,275) (2,009) (3,792) (22,426)
Total CCG level risks (6,923) (8,661) (5,375) (3,733) (7,485) (32,177)
Total CCG level opportunities 1,902 10,492 4,954 10,274 9,796 37,418
Net CCG (risk)/ opportunity (5,021) 1,831 (421) 6,541 2,311 5,242
Adjustments:
Acute over-performance Risk Share 5,121 (731) 521 (3,141) (1,770) 0
Other SaHF Overspend 0 (1,000) 0 (2,000) (400) (3,400)
Options for additional investment 0 0 0 (1,300) 0 (1,300)
Shared opportunities 0 0 0 0 0 0
Overall net (risk)/ opportunity 100 100 100 100 141 542
Memo - acute over-performace in forecast out-turn (total)
£000 -7,292 296 -4,782 -801 -7,096 -19,674
Notes:
high quality support to commissioners to improve health and wellbeing
Key MessagesThe H&F CCG forecast outturn has improved in Month 6 such that support from the risk share mechanism is no longer required. This is largely due to a reduction in the Acute overperformance and a reduction to RTT and Ophthalmology
provisions.
Please note all of this is based on potential risks and opporunities and has not been included in the actual financial forecast.
CCGs have a total net opportunity of £5m, with all West London, Hounslow and Ealing CCGs having a large net opportunity; Central having a large net risk; H&F having low
net risk.
Further adjustments to the net position are:
1) Hounslow to identify an additional £1.3m of non-recurrent investments.
2) Enact further acute risk share transfers to support Central - this has left all CCGs with a small net opportunity which is managable.
3) Potential additional SaHF expenditure has been identified and funded by West, Hounslow and Ealing CCGs. Note this is only ear-marked as a possibility and could only be
enacted if signed off by F&Ps or GBs.
Finally, a memo is included here to show that a significant level of acute over-performance has been reported in the actual forecast out-turn, with all CCGs taking a prudent
approach at this early stage in the year.
CWHHE - Risk Share
10

Budget Actual Variance Budget Actual Variance Budget Outturn Variance
Allocation Resource limit 30,501 30,501 0 181,581 181,581 0 369,308 369,308 0 0 -
Acute NHS SLA Services (incl. CQUIN & Ambulance) 11,947 11,379 568 70,128 69,548 580 141,092 140,264 828 (1,876)
Other Acute Activity Services 638 983 (346) 3,827 4,197 (370) 7,653 8,186 (532) (59)
Total Acute Services 12,585 12,363 222 73,955 73,745 210 148,746 148,450 296 (1,934) Page 19
Community Services 3,716 3,300 416 22,000 21,586 415 46,211 45,089 1,121 1,013
Mental Health Services 5,806 5,881 (75) 34,658 34,061 597 70,263 69,727 536 1,074
Prescribing 2,024 2,106 (82) 11,664 11,871 (208) 23,594 23,936 (343) (175)
Continuing Care 1,004 777 226 6,905 6,933 (28) 12,927 13,052 (125) (341)
Primary Care Service 1,019 777 242 6,157 5,928 229 11,350 10,703 647 1,599
Total Non Acute Sub Total 13,568 12,841 727 81,384 80,379 1,005 164,345 162,507 1,837 3,170
Other Non Acute Services 401 495 (94) 2,405 2,674 (270) 4,810 5,361 (552) (426)
Commissioning & Non Recurrent Reserves (1,322) (1,367) 45 4,154 4,076 78 12,145 11,746 398 79 Page 14
Other-Other Commissioned Services 2,809 3,747 (938) 5,184 6,207 (1,023) 10,369 12,349 (1,980) (888)
Total Other 1,888 2,875 (987) 11,743 12,958 (1,215) 27,324 29,457 (2,133) (1,235)
TOTAL Commissioning spend 28,041 28,079 (38) 167,082 167,082 (0) 340,414 340,414 (0) 0
Running costs Corporate costs 482 444 38 2,632 2,632 0 5,159 5,159 0 0
Total expenditure 28,523 28,523 (0) 169,714 169,714 (0) 345,573 345,573 0 0
Surplus/deficit position 1,978 1,978 0 11,867 11,867 0 23,735 23,735 (0) (0)
high quality support to commissioners to improve health and wellbeing
A number of service functions are reporting forecast variances, primarily within acute, community, mental health and other commissioned services. Acute contracts are reporting a forecast overspend driven by Imperial (£3m), which is being
managed through the release of the acute contract reserves. The main in-month movements are detailed on page 6.
In-month (£k) Year to date (£k)
Commissioned
services
Full year (£k) Forecast
Variance at M5
Further
detail
Surplus/Deficit including running costs
11

Key message
Commissioning Spend Breakdown
Budget Actual Variance Budget Forecast Variance Variance at
M5
Resource Limit 2,632 2,632 0 5,159 5,159 0 0
CCG Pay 779 861 (82) 1,558 1,656 (99) (136)
CCG Non Pay 324 306 18 543 591 (48) (29)
CCG Direct Cost 1,103 1,167 (64) 2,100 2,247 (147) (165)
CSS Costs (Formerly CSU) 1,207 1,209 (2) 2,415 2,396 18 18
CWHHE Collaborative Recharge 249 256 (8) 498 497 0 0
CSS & CWHHE Recharges 1,456 1,465 (9) 2,913 2,894 19 18
Reserves 73 0 73 146 18 128 146
Total Running Costs 2,632 2,632 0 5,159 5,159 (0) (0)
Surplus/deficit for running costs 0 0 0 0 0 0 0
Source: Financial ledger
Allocation
Running
costs
Overall running costs experienced pressures, which were discussed, necessitating the release of £128k reserve. Work on programme and running costs will be
progressed and the CCG's Senior Management Team have strengthened its establishment management controls in Month 5 to seek to reduce the on-going utilisation of
agency/interim staff and improve the headroom available to the CCG to bring in staff ahead of the next contracting round.
Year to date (£k) Full year (£k)
Break down of running cost spend
12

Key Provider Critical
Care
NEL
Admission
QIPP
Details
etc etc etc etc
1 Chelsea and Westminster M7 M11
2 Imperial M6 M9 M11
3 Central and North West M7 M9
4 CLCH M8
5 UCLH
Source: M3 Contract Schedule
ContentsDeep Dive Presented to F&P
2015/16 Provider Contract: Deep-dive timetable and contents Under Development
13

Key message
Budget Actual Variance Budget Outturn Variance
0 0 0 0 0 0
39 0 39 79 0 79
0 0 0 0 0 0
898 898 0 3,837 3,837 0
(57) (57) 0 (245) (245) 0
0 (0) 0 0 0 0
0 0 0 0 0 0
3,131 3,093 38 7,863 7,543 319
TOTAL Reserves 4,011 3,933 78 11,534 11,135 398
Source: Financial ledger
high quality support to commissioners to improve health and wellbeing
The table below shows the position of reserves at M6. This position is dependant upon a number of factors including successful delivery of QIPP
schemes, delivery of investment schemes and risks and opportunities that will materialise during the year.
Year to date (£k) Full year (£k)
QIPP Reserves
Investments
Reserve for Financial Strategy
1% Drawdown
2% Headroom
Contingency
QIPP Unidentified
Other Reserve
Breakdown of reserves
14

high quality support to commissioners to improve health and wellbeing
Key Messages
The summary position for the half year point to September (Mth 6) shows that QIPP savings for West London CCG continue to be ahead of the year to date plan, the savings in the month
of September were also ahead of plan, mainly linked to improved perfromance at Imperial . Savings in non-elective care for BCF and CIS have been merged as they target the same
emergency admissions. The Referral Standardisation Scheme has produced savings for the first time this month. The year end forecast has improved, but this relies upon the continued
delivery of all schemes.
QIPP
Mth 6 Month: September
Sch
em
e C
od
e
Scheme name Plan
Saving
Plan
Invest
Plan
Net
Actual
Saving
Actual
Invest
Actual
Net
Var.
Saving
Var.
Invest
Var.
Net
Var %.
Net
Plan
Saving
Plan
Invest
Var.
Net
FY Est.
Saving
FY Est.
Invest
FY Est.
Net
FY Var.
Saving
FY Var.
Invest
FY Var.
Net
FY Var
%. Net
16/17
Est
WL030 Jointly Commissioned Services (BCF) 56 0 56 56 0 56 0 0 0 0% 254 0 254 277 0 277 23 0 23 9% 254
WL027 Estates void cost reduction 259 0 259 259 0 259 0 0 0 0% 664 0 664 528 0 528 -136 0 -136 -20% 236
WL028 Transforming Nursing and Care Home Contracting (BCF) 17 0 17 17 0 17 0 0 0 0% 79 0 79 86 0 86 7 0 7 9% 521
WL033 Out of area contracts efficiency (3%) 80 0 80 0 0 0 -80 0 -80 -100% 365 0 365 0 0 0 -365 0 -365 -100% 100
WL034 ICP decommissioning 152 0 152 152 0 152 0 0 0 0% 304 0 304 329 0 329 25 0 25 8% 0
565 0 565 484 0 484 -80 0 -80 -14% 1666 0 1666 1220 0 1220 -446 0 -446 -27% 1111 WL037+
7NEL admissions - Whole Systems Integrated Care/BCF 682 430 252 469 430 39 -213 0 -213 -31% 1959 1129 830 1746 1129 617 -213 0 -213 -26% 4800
WL008 A&E - Community Independence Service (BCF) 68 0 68 640 0 640 572 0 572 838% 179 0 179 1152 0 1152 973 0 973 543% 330
WL003 Excess bed days 80 0 80 112 0 112 32 0 32 41% 160 0 160 206 0 206 46 0 46 29% 0
WL008a UCC/A&E (other schemes) 124 12 112 228 12 215 104 0 104 84% 500 50 450 641 50 591 141 0 141 31% 0
955 443 512 1449 443 1007 495 0 495 52% 2798 1179 1619 3744 1179 2565 946 0 946 58% 5130
WL009 Referral Standardisation Scheme 423 0 423 67 0 67 -356 0 -356 -84% 1085 0 1085 200 0 200 -885 0 -885 -82% 0
WL031a Out of Hospital Services - acute ECG 45 0 45 57 0 57 12 0 12 27% 204 0 204 234 0 234 30 0 30 15% 58
WL031b Out of Hospital Services - acute diabetes 26 0 26 0 0 0 -26 0 -26 -100% 117 0 117 101 0 101 -15 0 -15 -13% 58
WL031c Out of Hospital Services - acute NPT 86 0 86 174 0 174 88 0 88 102% 393 0 393 516 0 516 123 0 123 31% 192
WL031d Out of Hospital Services - acute pessary 20 0 20 53 0 53 33 0 33 165% 90 0 90 131 0 131 41 0 41 45% 45
WL031e Out of Hospital Services - community savings 13 0 13 0 0 0 -13 0 -13 -100% 59 0 59 51 0 51 -8 0 -8 -14% 30
WL013 Community cardiology and respiratory 250 195 55 244 195 49 -6 0 -6 -2% 1000 780 220 1069 780 289 69 0 69 31% 220
WL014 Primary Care Children's Hubs 75 0 75 204 0 204 129 0 129 172% 150 0 150 292 0 292 142 0 142 95% 80
WL015 Primary Care Prescribing 200 0 200 200 0 200 0 0 0 0% 1000 0 1000 1000 0 1000 0 0 0 0% 1000
WL025 Community Ophthalmology Service 0 0 0 142 0 142 142 0 142 0% 404 220 184 546 220 326 142 0 142 77% 265
WL035 Specialist Housing Strategy for Older People 78 0 78 0 0 0 -78 0 -78 -100% 412 0 412 375 375 -37 0 -37 -9% 0
WL032 Decommissioning Enhanced Access LES 452 0 452 452 0 452 0 0 0 0% 903 0 903 978 0 978 75 0 75 8% 0
WL036 Decommissioning heart failure nursing 87 0 87 87 0 87 0 0 0 0% 174 0 174 189 0 189 15 0 15 8% 0
1754 195 1559 1679 195 1484 -74 0 -74 -4% 5991 1000 4991 5683 1000 4683 -308 0 -308 -6% 1948
2163
3273 638 2635 3613 638 2975 340 0 340 10% 10455 2179 8276 10648 2179 8469 193 0 193 2% 10352
Planned Care Total
Other 2106/17 Schemes
Grand Total
Year to Date Full Year Estimate
Productivity Total
Unscheduled Care Total
15

Key message
Invoice
Count
Invoice
Count
(Passed)
% Passed BPPC
Amount (£)
Invoice
Amount
(Passed) (£)
% Amount
Passed
NHS 1,907 1,799 94.3% 123,915,040 122,499,207 98.9%
Non NHS 5,347 5,019 93.9% 19,471,068 17,154,580 88.1%
Total 7,254 6,818 94.0% 143,386,108 139,653,787 97.4%
Maximum Cash Drawdown (MCD): £344,689k Drawn Down to Date: £157,877k (46%)
Planned YTD draw down at month five: £157,483k Over Drawn: £394k
Source: CCG analysis
high quality support to commissioners to improve health and wellbeing
•Capital
The capital allocation (subject to approval) is £289k relating to CCG IT refresh and GP IT.
Creditor
payments
•
The CCG has met the Better Payment Practice Code (BPPC) target for the invoice amount but not for the invoice count. We are
currently working with budget holders to ensure that invoices are coded and that outstanding queries are dealt with promptly in
order that invoices are paid within payment terms.
Cash
•
Capital, creditor payments and cash
0.75
0.8
0.85
0.9
0.95
1
M01 M02 M03 M04 M05 M06
NHS Number
NHS Amount
Non NHS Number
Non NHS Amount
16

high quality support to commissioners to improve health and wellbeing
Key MessagesThe national reporting requirement for BCF has not been finalised by NHS England. Quarter 2 reporting requirements are to be published by the end of October and this slide will be developed in line with the guidance
received.
Better Care Fund
17

Key message
Budget Actual Variance Budget Outturn Variance
• QIPP investments 510 510 0 2,179 2,179 0
• Other investments 2,621 2,583 38 5,684 5,364 319
TOTAL Investments Within Reserves 3,131 3,093 38 7,863 7,543 319
• Investments drawn down 2,588 2,588 0 5,176 5,206 (30)
TOTAL Investments 5,719 5,681 38 13,039 12,750 289
high quality support to commissioners to improve health and wellbeing
As at Month 6 it is anticipated that the CCG will fully spend its QIPP and Other Investment budgets. The details of the proposed Other Investments
for 2015/16 and the status of the respective investment's Business cases through the CCG's governance / approval processes are set out in pages
15 and 16.
Year to date (£k) Full year (£k)
Investments Outturn Summary
18

Provider SLAM M5 (£k) Auto claims &
mis-attributions
(£k)
Total after
adjustments
(£k)
Budget (£k) Actual (£k) Variance (£k) Budget (£k) Actual (£k) Variance (£k)
Chelsea And Westminster Hospital NHS Foundation Trust 19,030 0 19,030 22,471 23,046 (575) 45,923 46,177 (253)
London North West Healthcare NHS Foundation Trust 72 0 72 689 86 603 0 172 (172)
The Hillingdon Hospitals NHS Foundation Trust 64 0 64 70 77 (7) 141 154 (13)
Imperial College Healthcare NHS Trust 26,690 0 26,690 30,480 31,913 (1,433) 60,785 63,803 (3,018)
North West London Hospitals NHS Trust 395 0 395 0 474 (474) 1,389 954 435
Royal Brompton and Harefield NHS Foundation Trust 574 0 574 743 693 50 1,495 1,386 109
University College London Hospitals NHS Foundation Trust 1,492 0 1,492 1,729 1,799 (70) 3,458 3,573 (115)
West Middlesex University Hospital NHS Trust 37 0 37 104 45 59 209 88 121
Other Out of Area Providers 3,432 0 3,432 4,097 4,141 (45) 8,149 8,230 (81)
Acute SLA Contract Total 51,785 0 51,785 60,382 62,275 (1,893) 121,550 124,537 (2,987)
Acute Other 1,620 2,077 (457) 3,241 4,155 (914)
London Ambulance Service NHS Trust 4,077 4,077 (0) 8,154 8,154 0
NCAs and Out of Area treatment 1,804 1,804 (0) 3,607 3,607 (0)
Urgent Care Centre 1,108 1,114 (6) 2,216 2,384 (168)
Winter Resilience 915 1,279 (364) 1,830 2,194 (364)
Reserves 2,930 0 2,930 5,909 1,179 4,729
Acute QPP expenditure 1,120 1,120 0 2,239 2,239 0
Grand Total 0 51,785 73,955 73,745 210 148,746 148,450 296
high quality support to commissioners to improve health and wellbeing
Please refer to pages 20 and 21 for further breakdown by point of delivery (pod) for C&W and ICHT respectively.
M6 YTD Position Full Year Outturn Position
Key Messages
Acute Contracts: year to date performance Acute Contracts: year to date performance
19

Detailed POD Level Activity:
Annual Plan
Activity
YTD Plan
Activity
YTD Actual
Activity
YTD Variance
Activity
Annual Plan
Cost YTD Plan Cost
YTD Actual
Cost
YTD Variance
CostYTD Mitigations
YTD Mitigated
Variance
Full Year
Forecast
Mitigated
Variance
Accident and Emergency 38,398 15,990 17,296 (1,306) 3,875 1,594 1,721 (127) 13 (113) (229)
Critical Care 997 434 681 (247) 1,412 615 747 (132) 0 (132) (374)
Elective Inpatients (inc Day Case) 6,913 2,761 2,837 (76) 8,239 3,251 3,268 (17) 17 0 361
Non Elective Inpatients (inc Short Stay) 6,410 2,712 2,695 17 12,368 5,155 5,232 (77) 121 44 142
Other 6,613 2,262 3,500 (1,238) 1,094 559 726 (167) 422 254 1,035
Outpatient First Attendance 18,293 7,801 7,801 (0) 2,936 1,268 1,441 (173) 0 (173) (555)
Outpatient Follow Up Attendance 39,321 17,193 18,265 (1,072) 3,235 1,382 1,653 (272) 0 (272) (772)
Outpatient Procedures 7,112 2,960 3,457 (497) 1,621 647 772 (126) 0 (126) (250)
CQUINs
Direct Access 32,276 13,462 20,170 (6,708) 2,661 1,103 1,139 (36) 0 (36) (100)
Maternity 3,210 1,333 3,670 (2,337) 5,271 2,198 2,072 126 0 126 281
Community 0 0 0 0 638 266 265 1 0 1 4
Devices & High Cost Drugs 0 0 0 0 1,574 649 566 84 0 84 203
Balance to Contract Value
Clinical Transformation 0 0 0 0 1,000 0 0 0 0 0 0
Incentive Fund
Grand Total 159,543 66,906 80,372 (13,466) 45,923 18,687 19,602 (915) 573 (342) (253)
YTD Mitigations:
National/local penalities
Other
Forecast Reconciliation:
SLAM @ M5
Readmissions 0
Activity Cost (£ '000)
YTD Estimated Cost Actuals
(£'000)
Automated Claims 12
19,602
Outstanding Metrics 139
Maternity Transition 0
Specialised Commissioning 0
0
422
TOTAL Mitigations @ M5 573
Cost Actuals (£'000)
Full Year Forecast 46,177
YTD Mitigations 573
YTD Adjusted Position 19,030
Projected Ledger Position @ M6 23,046
high quality support to commissioners to improve health and wellbeing
N.B. 1. Automated Claims are based on a yield of 7% 2. National/Local penalties in line with contract terms. 3. Outstanding Metrics are being agreed through quarterly closedown processes. 4. The QIPP adjustment reflects the total planned value of QIPP to date less the amount phased to date.
Acute Provider Finance Performance - C&W
20

Detailed POD Level Activity:
Annual Plan
Activity
YTD Plan
Activity
YTD Actual
Activity
YTD Variance
Activity
Annual Plan
Cost YTD Plan Cost
YTD Actual
Cost
YTD Variance
Cost
YTD
Mitigations
YTD Mitigated
Variance
Full Year
Forecast
Mitigated
Variance
Accident and Emergency 36,238 15,430 15,117 313 3,866 1,643 1,861 (219) 116 (102) (329)
Critical Care 3,850 1,613 1,607 6 4,164 1,745 1,746 (1) 0 (1) (13)
Elective Inpatients (inc Day Case) 9,054 3,723 4,024 (301) 10,173 4,182 4,432 (250) 146 (104) (214)
Non Elective Inpatients (inc Short Stay) 9,025 3,820 4,034 (214) 15,941 6,779 7,369 (590) 220 (370) (1,160)
Other 9,996 4,158 10,860 (6,701) 2,142 883 1,128 (245) 59 (186) 71
Outpatient First Attendance 24,805 10,626 11,239 (613) 3,505 1,523 1,606 (83) 49 (34) (268)
Outpatient Follow Up Attendance 54,242 23,211 22,211 1,000 5,549 2,370 2,530 (160) 0 (160) (582)
Outpatient Procedures 9,928 4,223 5,819 (1,596) 2,385 1,010 1,311 (301) 97 (204) (556)
CQUINs
Direct Access 741,899 305,069 305,883 (814) 4,789 1,969 1,962 7 1 7 35
Maternity 4,574 1,889 1,959 (70) 5,309 2,203 2,278 (75) 25 (50) (118)
Community 3 1 2 (1) 686 286 302 (17) 0 (17) (38)
Devices & High Cost Drugs 0 0 0 0 1,817 757 876 (119) 0 (119) (306)
Balance to Contract Value
Clinical Transformation
Incentive Fund 0 0 191 (191) 459 0 191 (191) 191 0 459
Grand Total 903,615 373,763 382,946 (9,183) 60,785 25,350 27,594 (2,245) 905 (1,340) (3,018)
YTD Mitigations:
National/local penalities
Other
Forecast Reconciliation:
SLAM @ M5
Readmissions 60
Activity Cost (£ '000)
YTD Estimated Cost Actuals
(£'000)
Automated Claims 30
27,594
Outstanding Metrics 755
Maternity Transition 0
Specialised Commissioning 0
0
59
TOTAL Mitigations @ M5 905
Cost Actuals (£'000)
Full Year Forecast 63,803
YTD Mitigations 905
YTD Adjusted Position 26,690
Projected Ledger Position @ M6 31,913
high quality support to commissioners to improve health and wellbeing
N.B. 1. Automated Claims are based on a yield of 7% 2. National/Local penalties in line with contract terms. 3. Outstanding Metrics are being agreed through quarterly closedown processes. 4. The QIPP adjustment reflects the total planned value of QIPP to date less the amount phased to date.
Acute Provider Finance Performance - ICHT
21

Issue Commentary Date Owner
£000s £000s £000s £000s £000s £000s
NWL summary
overview YTD
For all NWL CCGs, ChelWest reported an adverse unmitigated variance of £2.7m YTD
and £1.7m post mitigations. The majority of the mitigated YTD adverse variance
relates to CL CCG, H&F CCG, Ealing CCG and WL CCG. The over performing PODs in
these CCGs are mainly within Outpatients (£1.7m), Critical Care (£575k), Non-
electives (£550k) and Electives & Day cases (£455k).
-£2,800 -£1,300 £47,800 £177 -£1,200 £115,000 £1,700 £117,000 Monthly Challenges have been sent to the Trust that are actively
managed and resolved on a timely basis. Q1 has been closed apart
from some reinvestment decisions (escalated to PCE). CAPS wthin
the contract essentially block the cardio/respiratory outpatient
service and open dialogue concerning referral activity and
management in a number of other planned care settings (ongoing).
Fortnightly meetings are underway to understand the Trusts RTT
position and how this is affecting activity flows within the Trust.
NWL M5 Variance The contract across the 8 CCGs has seen a favourable in-month mitigated movement
of £353k. CLCCG and H&F CCG contrbuite mainly to the favourable variance which
is partly off set by WLCCG. The main areas contrbuting the overall variance are NEL
(£281k), Outpatients (£315k) and A&E (£67k). This is partly offset by an
underperformance in NEL (£272k) and Day Cases (132k).
Deep dive of M5 performance against historical data with specific
focus on Outpatients and electives. The refferal activity shows that
GP referral is down when comparing Q1 14/15 with Q1 15/16.
Consultant referrals are marginally up for the same period.
Forecast The contract is forecast at £115m unmitigated and £112m post adjustments and is
based on working and calendar days plus adjustment for the forecasted QIPP
achievement and run rate adjustment. The YTD forecast variance is 2.9m.
M5 has shown a dip in activity because of staff leave & holidays. An
adjustment (difference between FOT based on M4 & FOT based on
M5) has been factored in to ensure that M5 dip in activity is not
forecasted to continue for the remaining year.
QIPP The YTD M5 Planned QIPP is £1m and Full Year Planned QIPP accounts to £4.2m.
The full year forecast QIPP adjustment is £1.2m.
Management of QIPP delivery and monitoring the QIPP progress is
an on-going process with the relevant QIPP leads.
West London CCG
position
West London CCG reported an adverse variance of £915k unmitigated at M4 YTD
and £342k post mitigations with an in month adverse variance of £157k. The
majority of the YTD over performance relates to Outpatients (£444k), Electives
(£217k), Critical Care (£131k) and A&E (£126k).
Challenges relating to the capped areas (cardio & respiratory) has
not reached an agreement yet. This is due to the CIS not signed by
Imperial yet. The CCG is currently maintaining the contract in
relation to the capped areas.
high quality support to commissioners to improve health and wellbeing
Previous
month YTD
mitigated
variance
Previous
month
Forecast FY
Actions
Current month Previous month
Current month Driver of unmitigated variance -
Unmitigated
variance
mitigated
variance Cost Volume
QIPP deducted
YTD
Forecast FY
variance
Ne
xt u
pd
ate
= N
ove
mb
er
20
15
Sim
on
Sh
elto
n
Key issues and actions - Chelsea and Westminster NHS FT (i)
22

Commentary Date Owner
£000s £000s £000s £000s £000s £000s
Summary Planned Planned care shows a mitigated adverse variance of £2m. The over-
riding issue within the over performing contracts remains in planned
care within Outpatients (£1.5m), Electives (£358k), RDA (£136k).
-£1,990 -£2,000 £19,400 £84 ECG charging - The Trust double counted ECG activity in M5 however in
Q1 closedown discussions (almost completed) with C&W all parties have
confirmed benefit of £40k to CCGs. The ECG activity of £161k is
challenged again in M5 for being charged in addition to the block.
Phototherapy - the Trust charges phototherapy within its RDA POD.
Despite the need clinically for a number of these patients to attend
regular and multiple monthly sessions for phototherapy, the Trust
appear to be the only Trust in the country to submit its data as RDA and
therefore, the activity attracts a local price - that happens to be nearly
double the national tariff and has been challenged in Q1 closedown. It
has been agreed that this will change in 16/17 and further the trust was
notified in the 16/17 notice letter.
Challenges related to Caps in the contract for T&O, Plastics &
Ophthalmology, have been removed in M5. This is because the
expectation is that the Trust will be able to provide the required
explanation for over performance, specified in the contract clause, in
order to receive payment. If the Trust is unable to provide the
explanation, this challenge will be reinstated.
Outpatients Outpatients show an adverse variance of £1.5m with an in month
movement of £315k. Over-performance within outpatients is the main
driver of adverse performance across the contracts. However, it should be
noted that the over performance is spread across a range of specialities
and a vast majority of specialties are in fact over performing but to a lesser
degree. Main drivers are within OPFU are Plastics, Rheumatology, Clinical
Haematology, Paediatrics and General Surgery. The majority of specialties
slightly over performing but at a rate of increase which reducing from
2014/15. Planned amounts are lower than the out turn last year. In OPFA
Paediatric Community and Gynae are over and in OP Procedures Tb and
Opthalmology are over.
Coding and Counting challenges exist on a small number of outpatient
areas, neurophysiology, well babies, ophthalmology and the expectation
based on initial discussion is a yield of approx. £100k (YTD) in these areas
- NB. This has not been factored into the position as yet. There is a
specific coding error in the OPPROC within Gynaecology. The
Gynaecology activity has been incorrectly coded in M1 and M2 and there
is a small financial impact which the trust agreed to correct at M5
Freeze.
Inpatients (DC/EL) There is an adverse mitigated variance of £358k with an in month
favourable movement of £94k. CL CCG, Ealing CCG & Hounslow CCG are
over performing within day cases. Ealing CCG, H&F CCG, & West London
CCG are over performing in EL General Surgery and Stroke.
DC/EL work is only marginally over plan trust-wide, but is a significant
driver of the over-performance for all CCGs in General Surgery and Stroke
Medicine.
Summary
Unplanned
Unplanned care shows a mitigated adverse variance of £1.1m and
contributes significantly to the overall over performance. WL, H&F and CL
CCGs (refer to respective slides for more detail) contribute mainly to the
adverse variance.
-£1,200 -£962 £17,000 £42
A & E (Incl. UCC) The Overall adverse variance is £179k unmitigated reduced to £146k YTD
after mitigations, £126k relates to WL CCG.
Non Elective Overall variance is £469k unmitigated and £271k mitigated. H&F CCG and
CL CCG contribute to the majority of the over performance. The main
speciality contributing to the over performance is Acute Internal medicine
and the remaining is spread across various specialities.
Critical Care Overall variance is reported at £543k YTD. Over performance mainly
relates to CL CCG and WL CCG. There is a favourable in month movement
of £32k at M5.
The CCG challenged the two 6 organ support patient in M4. The trust
performed an audit and reported post audit that the 4 organ support
patient was previously incorrectly coded to 6 organ support which has
been corrected in M5.
Maternity Favourable mitigated variance of £474k YTD. £474 £474 £5,800 £10 Next update
= November
2015
Simon
Shelton
Other There is an adverse variance of £128k YTD. -£128 £1,200 £5,600 £40 The adjustments in the other POD equate to £114k, this includes metrics
and other adjustments in the contract.
Drugs & Devices Drugs & Devices - Devices show favourable variance of £60k YTD. Drugs is
6k over plan.
Challenges have been raised, awaiting response from the Trust.
Direct Access Direct Access - there is an overall adverse variance of £83k YTD. The over
performance is seen in 'not treatment function' field within the POD.
Query to be resolved with BI/Trust if necessary.
high quality support to commissioners to improve health and wellbeing
Actions
Ne
xt u
pd
ate
= N
ove
mb
er
20
15
Sim
on
Sh
elt
on
Ne
xt u
pd
ate
= N
ove
mb
er
20
15
Sim
on
Sh
elt
on
Ne
xt u
pd
ate
= N
ove
mb
er
20
15
Sim
on
Sh
elt
on
Current month Previous month
Current month Driver of unmitigated
variance -
Unmitigated
variance
mitigated
variance Cost Volume
QIPP
deducted
YTD
Forecast FY
variance
Previous
month YTD
mitigated
variance
Previous
month
Forecast FY
Key issues and actions - Chelsea and Westminster NHS FT (ii)
23

Commentary Date Owner
October '15
£000s £000s £000s £000s £000s £000s
Summary
overview
For all NWL CCGs - Imperial YTD M5 reported variance of (£14.486m)
this has been reduced to (£9.416m) after applying risk adjusted
mitigations of £5.070m.
-£14,486 -£9,416 £1,833 -£16,319 -£2,734 -£18,882 -£9,226 -£19,884 Challenges sent to the Trust and will be actively
managed and resolved on a timely basis.
The majority of Q1 challenges have been closed down
Next Update
Nov 2015
David Hill
For WL CCG the reported M5 variance is (£2.245m) which reduces to
(£1.340m) after adjustments and mitigations.
-£2,245 -£1,340 -£1,622 -£623 -£405 -£3,018 -£1,364 -£3,479 Deep dive of Month 5 performance against historical
data with specific focus on Non elective
The forecast full year variance is based on M5 data and continues the trend
of notable pressures against the contract in M1-4. It should be noted that the
forecast year end position has marginally improved in M5, although this in the
context of M5 (August) typically having lower activity levels.
Critical Care audit -The trust commitment is that following a
full review of the clinical and technical implications of the
audit findings the October CQG and PCE meetings will
receive a full update.
The adverse variance is across all areas but is primarily driven by unplanned
care (non-elective) and unplanned care (outpatients), further details of these
are outlined below.
St Marys UCC local tariff discussions are now being
translated into the information requirements feeding into
discussions regarding a possible re-commissioning of the
service.Impact of RTT backlog activity within the Month 5 position:
The trust has provided a partially completed demand &
capacity analysis. As such for the £1.4m reserves held for
in year RTT & Opthalmology backlog £514k has been
released.
Summary
Planned
(All figures WL only) Planned care adverse variance against all types of
activity as detailed below.
-£794 -£502 -£466 -£329 -£177 -£1,621 -£563 -£2,172 As summary above Next Update
Nov 2015
David Hill
Outpatients Outpatient Procedures activity is (38%) above plan this is a (30%) adverse
cost variance, the overspend is attributable to higher than planned volumes
(£382k). A significant challenge at £97k relates to Outpatient Stress testing
procedures, this is an unresolved issue carried forward from 14/15.
Outpatient follow up – Outpatient follow-up attendance has an overspend of
(£161k) (7%) and an activity variance of 4% favourable.
Outpatient first attendance – Outpatient first attendance variance is mainly
driven by higher than planned activity.
-£544 -£398 -£177 -£368 -£177 -£1,406 -£443 -£1,849 As noted above a conservative release of funds held in
reserves for RTT and Ophthalmology back-logs has been
released.
With regards to the Stress testing challenge terms of
reference have been drawn up for an audit to be carried out
in order to conclude this issue. As soon as the trust has
confirmed agreement to these an auditor will be swiftly
appointed with the aim of finalising the audit by the end of
November.
Inpatients
(DC/EL)
Daycase and Elective activity is (6%) over plan, the overspend is attributable
to higher than planned volumes (£338k) and lower than planned average
price per activity £88k.
The overspend on elective inpatients is mitigated by Planned Procedures with
Threshold at £139k, this is a significant challenge for which a closedown
process was well embedded in 14/15 and this has been carried forward into
15/16.
-£250 -£104 £88 -£338 £0 -£214 -£120 -£323 Review of referral data (future 'order book') submitted by the
Trust.
Review of capacity changes in month and determine
whether any of the pressure relates to RTT / Ophthalmology
backlog for which funding sits outside the current contract.
high quality support to commissioners to improve health and wellbeing
Previous
month YTD
mitigated
variance
Previous
month
Forecast FY
Actions
Current month Previous month
Current month Driver of unmitigated
variance -
Unmitigated
variance
mitigated
variance Cost Volume
QIPP
deducted
YTD
Forecast FY
variance
Key issues and actions - ICHT (i)
24

Commentary Date Owner
October '15
£000s £000s £000s £000s £000s £000s
Summary
Unplanned
(All figures WL only) Activity volumes and case complexity are above
planned levels.
-£810 -£473 -£861 £51 -£228 -£1,501 -£492 -£1,928 As summary above Next
Update Nov
2015
David Hill
A & E (Incl. UCC) The A&E variance of (£203k) adverse is mainly driven by the case-mix
changes due to the implementation of the new system. This is being
challenged by the CCGs under the code of conduct process.
-£219 -£102 -£252 £33 -£46 -£329 -£49 -£295 Coding change challenge raised against the increased case-
mix based on the implementation of the 'FirstNet' Cerner
module.
Non Elective The Non Elective unmitigated overspend is (£590k) and an activity variance
of (8%) the overspend is attributable to higher than planned volumes. The
variance is adjusted to reflect CIS QIPP and the Non Elective Emergency
threshold credit.
-£590 -£370 -£211 -£380 -£182 -£1,160 -£376 -£1,422 Contract performance notice for A&E and work by the trust
to improve bed-flows remain under detailed scrutiny from
CCG and NHSE commissioners.
Critical Care The Critical Care variance went from an underspend at month 3 of £45k to an
overspend at month 4 of (£67k), part of this is due to one patient being
discharged costing £56k. The adverse variance is driven by volume variance
(£64k), with activity 5% above plan.
-£1 -£1 -£8 £7 £0 -£13 -£67 -£211 As summary above - Critical Care audit findings to be taken
to September contract meetings.
Maternity (All figures WL only) over performance driven by higher volumes of
outpatient activity.
-£75 -£50 £6 -£81 £0 -£118 -£41 -£102 The position will continue to be monitored, in particular to
monitor the impact of the Ealing Hospital maternity unit
closure.
Next
Update Nov
2015
David Hill
Outpatients Antenatal and Postnatal bookings are adverse to plan by (£77k) which is due
to higher than planned average price per activity (£46k) and higher volumes
(£31k). Activity on antenatal and postnatal is 3% above plan which is 30
bookings.
-£77 -£53 -£46 -£31 £0 -£118 -£59 -£168 Duplicate charges of the antenatal and postnatal pathways
across NWL providers are being challenged.
Deliveries Deliveries are over plan by 11 deliveries and there is a £3k underspend
against plan.
£3 £3 £28 -£25 £0 £1 £24 £67
Other As of M4 the maternity telephone clinic duplicates has been corrected and
only a small level of same day calls have been changed.
-£1 -£1 £0 -£1 £0 -£2 -£6 -£0 Credit received for duplicate charging of maternity telephone
clinics.
Other (All figures WL only) -£565 -£314 -£565 £0 £222 -£268 £723 Next
Update Nov
2015
David Hill
Drugs & Devices Drugs and Devices has an adverse variance of (£119k) of this (£31k) relates
to HCD and (£88k) Devices. The HCD overspend is driven by higher spend
on Anti-TNF drugs in Month 1 (which was due to a delay in invoicing received
by the trust) and the Month 3 increase has been queried with the trust this will
not be extrapolated in the FOT. The overspend on Devices is due to
receiving charges for Defibrillator's (£68k).
-£119 -£119 -£119 £0 -£306 -£65 -£195 Detailed challenges being raised in collaboration with the
medicines management team.
Direct Access Direct Access is favourable by £7k, this is favourable movement in-month. £7 £7 £7 £0 £35 -£25 -£57
Other -£453 -£202 -£453 £0 £493 -£178 £974
high quality support to commissioners to improve health and wellbeing
Previous
month YTD
mitigated
variance
Previous
month
Forecast FY
Actions
Current month Previous month
Current month Driver of unmitigated
variance -
Unmitigated
variance
mitigated
variance Cost Volume
QIPP
deducted
YTD
Forecast FY
variance
Key issues and actions - ICHT (ii)
25

Context
Priority Progress this month Further detail
Clinical
Transformation:
The 15/16 Local Incentive Scheme to incentivise clinical transformation has been agreed to be at
a value of £2m for CWHHE CCGs.
NB. Under the DTR tariff option Imperial are not eligible for CQUIN funding in 2015/16.
The 15/16 clinical transformation schemes focuss on Ambulatory and Emergency Care
pathway development and implementation of seven day standards.
Avoiding
unnecessary A&E
attendances
Delivery of the A&E 4 hour wait target continues to be scrutinised closely by CCG & NHSE
commissioners.
Reducing internally
generated demand
An Imperial specific IGD clinical policy was agreed in 14/15 for implementation in 15/16. The
information flows required to determine adherence to the policy were detailed in the contract
Data Quality Improvement Plan (DQIP), and for the first time the trust have agreed a credit for
inappropriate IGD in the Q1 close down process.
New to follow up
ratio
Follow-up ratios are monitored and rebates calculated on a monthly basis. These values are
signed off at the monthly FIG meetings.
high quality support to commissioners to improve health and wellbeing
The 2015/16 contract has now been signed and takes the form of a PbR contract at a value of £329.6m across the 8 north west London CCGs.
Reducing non-
elective admissions
A workplan to implement the AEC SDIP is underway. Imperial have developed
information flows that mean AEC activity is flagged within SLAM and SUS submissions
from M3. Findings from the AEC network visit to the trust have been incorporated into
the Local Incentive Scheme.
Readmissions and non-elective threshold adjustments are being monitored and jointly
agreed through the monthly FIG meeting.
The readmissions and non-elective threshold metrics continue to be applied in full.
Ambulatory and Emergency Care (AEC) pathway development is a key workstream within the
Service Development and Improvement Plan (SDIP) and Local Incentive Scheme in 2015/16.
Further developing the AEC units scope and activity volume should reduce the number of non-
elective admissions, improve bed-flow and reduce pressure on A&E.
Delivery of improved use of CIS and other CCG equivalent services by ICHNT has been
underwritten to the value of £1.75m across the trust in the 2015/16 contract.
Trust analysis underpinning its agreement to the Q1 credit for inappropriate IGD is
currently being examined by the contract analyst.
2015/16 ratios have been agreed with the exception of Ophthalmology where the follow-
up ratio is suspended whilst a backlog of outpatient work is delivered.
Performance has improved however concerns remain around the delivery of performance
above 95%.
Progress on strategic priorities - ICHT
26

Issue Commentary Owner
GSTT Guys and St Thomas
This month's information is driven from the M5 SLAM submission for GSTT. This Trust is DTR contract and therefore CQUIN does not apply. The current FOT is
showing a unfavourable variance of £6k, an adverse movement of £165k, for West London CCG.
This contract has been agreed, NWL have a seperate contract with GSTT, as LIS schemes were not agreed
The main areas of over performance are:
Outpatient Follow up: FOT £58K, an improvement from last month of £25k - over performance mainly on Obstetrics and opthamology. Obstetrics appears to be a
problemacross all CCG's, a deep dive has been requested.
High Cost Drugs and Devices: FOT adverse position of £122k, an adverse movement of £55k. The main driver this month are cardiology and gastroentrolology.
Challenges and Claims anticipated for M5 are £15,805
Risk: Critical Care FOT has been adjusted to reflect this level of expenditure is unlikely to continue to year-end. However the deep Dive should highlight the reason for
this high expenditure early in the year. The 14-15 M12 freeze position was £2,113,428.
M5 FOT methodology is aligned with the other NWL Trusts.
Diane Pearson -
Central London
Contracting Team
KCH Kings College Hospital
THIS IS A BLOCK CONTRACT IN 2015-16 . The detail of the plan has been recorded at POD level only.
The projected FOT variance is favourable £62k, a run rate adjustment has been applied to breakeven the contract
The main driver of the YTD favourable variance is: .
Elective (£44k) -
Non Elective Inpatients (all) £64k.
The over performance is reduced by the following:
Day Case £30k- Activity is 18 over plan, the main drivers are Cardiology, and clinical Haematology
Devices £37k - mainly driven by ICD Implantable Cadioverter-Defibrillator
The accepted Challenges and Claims up to for month 4 are : £1044
For reference the outturn position for 2014-2015 : £684,385
Diane Pearson -
Central London
Contracting Team
high quality support to commissioners to improve health and wellbeing
Actions
Key issues and actions - acute contracting (i) Key issues and actions - Out of Areas Trusts - M6
27

Key Message
276 4%
4,494 26%
744 2%
(2,796) -6%
437 2%
3,155 2%
Central London Community Healthcare NHS Trust Contract Performance
This performance reflects the
accuracy of IAP against that of
Actual YTD Activity:
1) Adult Services
2) Children Services
3) Intermediate Care
4) Specialist
5) Urgent Care
Under Performance
YTD
Variance
YTD%
Variance
As this is a block Contract, activity variations have no financial impact in year, but may impact on 2016-17 contracts. In terms of total patient contacts, West London CCG activity is under performing
by 2% year to date. 15-16 Activity reported against the 14-15 Pan, depending agreement on this years IAP.
West London CCG Month 6 2015/16 Year-To-Date Activity Community
CLCH
15-16 activity is against 14-15 plan. This is not a true reflection of performance at this
stage in the year. Systems changes and uncaptured data are two issues currently
unresolved. Until CLCH can confidently confirm all data is being capture, and any
changes in the counting methodology the performance is a guide only.
A series of IAP meetings have been held with CLCH, principles and processes were
agreed and IAP finalised. This is with commissioners for final sign off, and will be used
from M7 reporting onwards. Whilst this has been a slow process, it is now robust - using
capacility modelling by service line - and has built solid foundations for 16-17 plan.
Action
Comissioners to agree IAP
14.10.15
Leroy Cordle - Account
Director Community
Diane Pearson - Contract
Finance
Provider Commentary Contract Review Due Date Owner
28
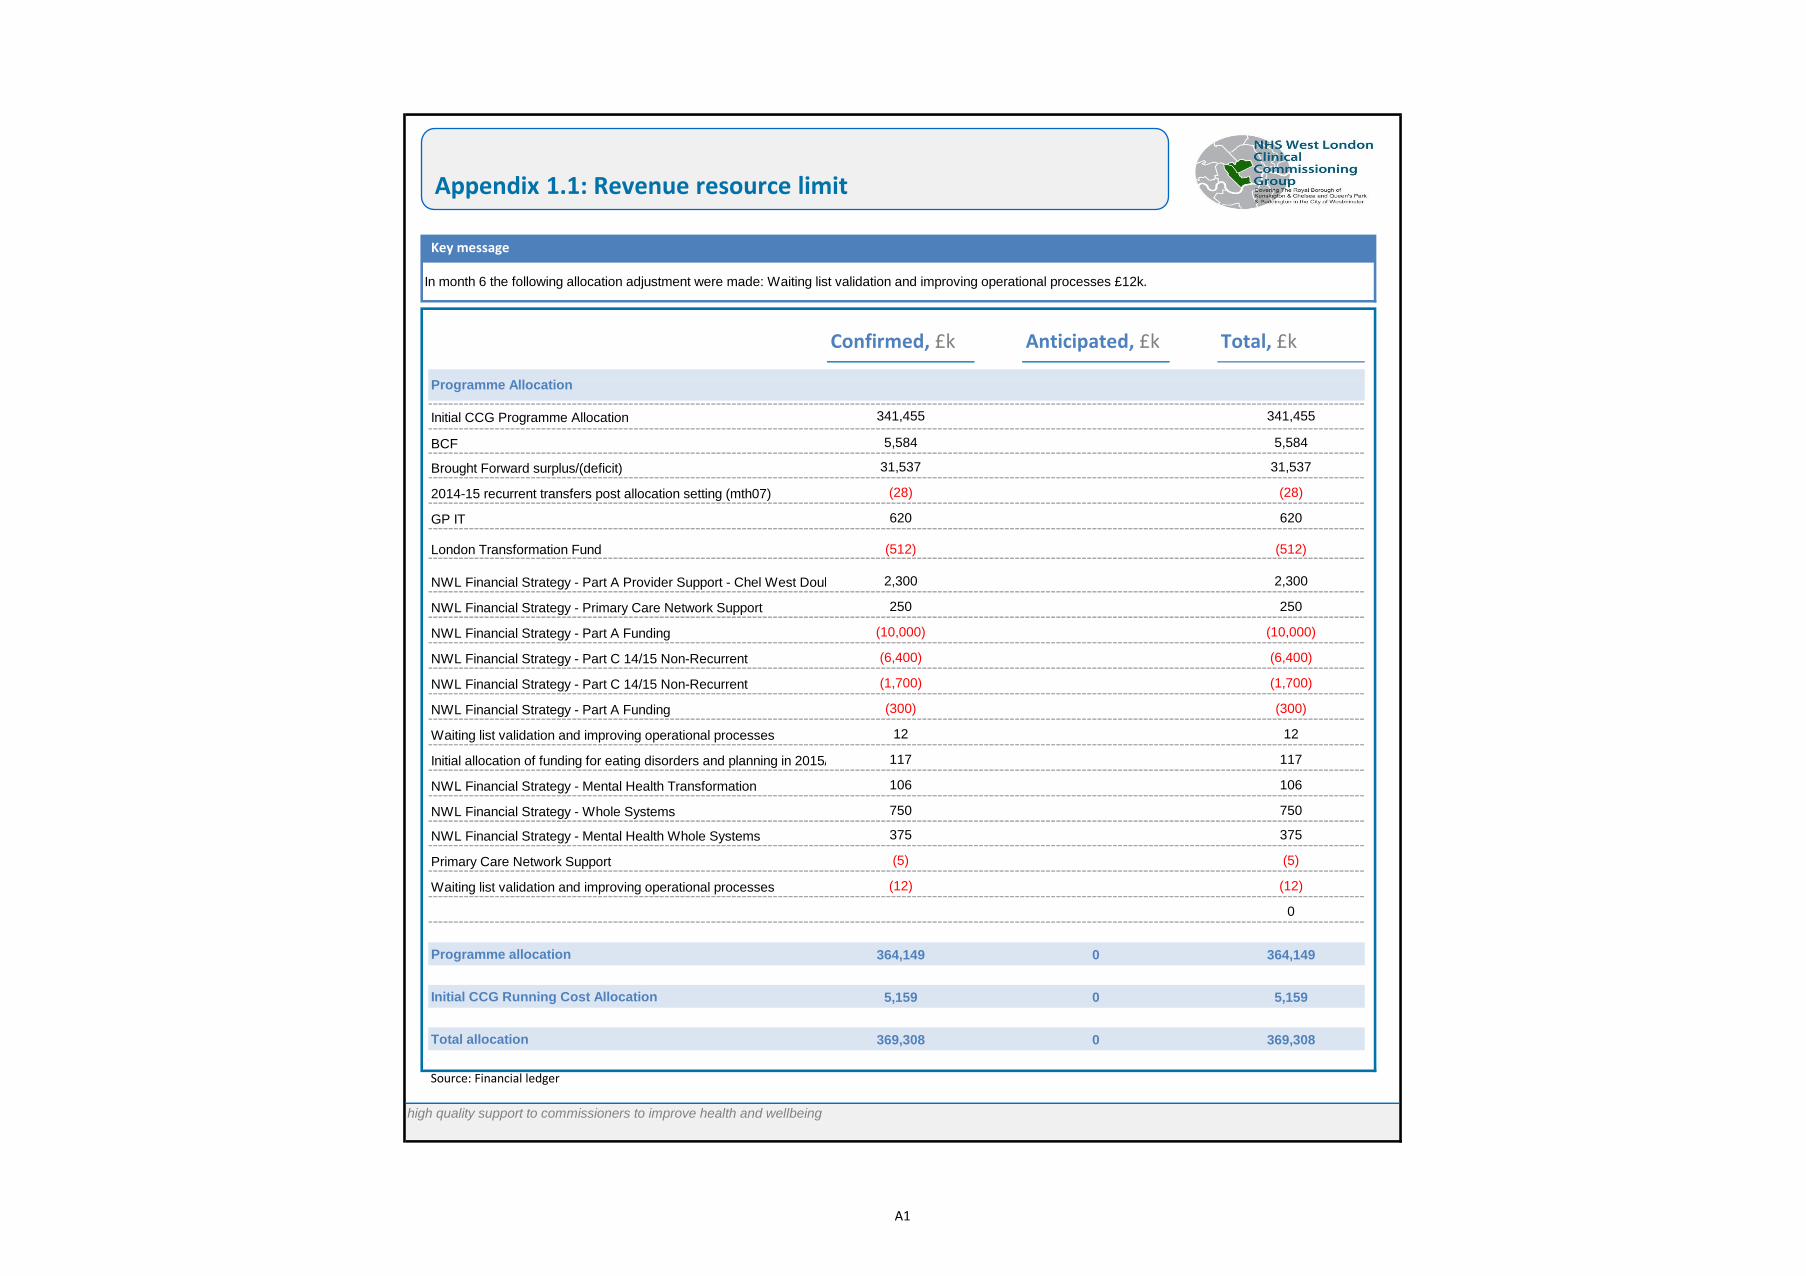
Key message
Confirmed, £k Anticipated, £k Total, £k
341,455 341,455
BCF 5,584 5,584
Brought Forward surplus/(deficit) 31,537 31,537
2014-15 recurrent transfers post allocation setting (mth07) (28) (28)
GP IT 620 620
London Transformation Fund (512) (512)
NWL Financial Strategy - Part A Provider Support - Chel West Double Running2,300 2,300
NWL Financial Strategy - Primary Care Network Support 250 250
NWL Financial Strategy - Part A Funding (10,000) (10,000)
NWL Financial Strategy - Part C 14/15 Non-Recurrent (6,400) (6,400)
NWL Financial Strategy - Part C 14/15 Non-Recurrent (1,700) (1,700)
NWL Financial Strategy - Part A Funding (300) (300)
Waiting list validation and improving operational processes 12 12
Initial allocation of funding for eating disorders and planning in 2015/16 117 117
NWL Financial Strategy - Mental Health Transformation 106 106
NWL Financial Strategy - Whole Systems 750 750
0 NWL Financial Strategy - Mental Health Whole Systems 375 375
Primary Care Network Support (5) (5)
Waiting list validation and improving operational processes (12) (12)
0
Programme allocation 364,149 0 364,149
Initial CCG Running Cost Allocation 5,159 0 5,159
Total allocation 369,308 0 369,308
Source: Financial ledger
high quality support to commissioners to improve health and wellbeing
Initial CCG Programme Allocation
In month 6 the following allocation adjustment were made: Waiting list validation and improving operational processes £12k.
Programme Allocation
Appendix 1.1: Revenue resource limit
A1

Source: TBD
high quality support to commissioners to improve health and wellbeing
The RAG rating definitions are as follows:
1. Financial position in month - Red is greater than or equal to 2%, Amber is less than 2% but greater than 0% and green is less than
or equal to 0%.
2. Financial position year to date - Red is greater than or equal to 1%, Amber is less than 1% but greater than 0% and green is less
than or equal to 0%.
3. Financial position forecast outturn - Red is greater than or equal to 0.5%, Amber is less than 0.5% but greater than 0% and green
is less than or equal to 0%.
4. Running costs forecast outturn - Red is greater than or equal to 0.5%, Amber is less than 0.5% but greater than 0% and green is
less than or equal to 0%.
5. QIPP year to date / QIPP forecast outturn / Investment plan - Red is greater than or equal to 10%, Amber is less than 10% but
greater than 0.5% and green is less than 0.5%.
6. Risks and opportunities - Red is greater than or equal to 0.5%, Amber is less than 0.5% but greater than 0% and green is less than
0%.
7. Creditors - Better Payment Practice Code - Red is less than or equal to 92.5%, Amber is less than 95% but greater than 92.5% and
green is greater than or equal to 95%.
8.Capital outturn -Red is greater than or equal to 10%, Amber is greater than 0.5% but less than 10% and green is less than 0.5%.
9. Cash drawn down to date - Red is less than or equal to 85%, Amber is less than 95% but greater than 85% and green is greater
than or equal to 95%.
Appendix 2.1: RAG Rating Definitions
A2

Key Message
Top 5 Under performing services Highest DNA Rate across all services
Community Childrens Nursing: There has been a reduction in referrals for the whole service during this period which has impacted on the activity for the service. Also the service is currently struggling
with a few vancancies and covering 2 maternity leaves within the service which has led to a reduction in activity across the whole service for this period. Obtaining agency cover for this very specialised
service is challenging so it difficult to obtain cover for maternity or vacancies. We are working to ensure we recruit and cover vacant posts ASAP.
Speech and Language Therapy: The SLT service has a significant number of contracts with schools. Schools are offered a menu of options for service delivery. Some of these options include activity for
individual children other options are for training and staff skilling and would not include activity recorded on RIO. On first v follow up ratios - follow ups are only offered to children with very high
complex needs – these would be long term needs e.g. Autistic spectrum disorders , Specific language impairment , deafness etc.
On wait times - there are variable targets within this headline figure depending on the client group. There is a shorter timescale of 42 days for preschool complex needs but for school aged children the
target is 12 weeks. Hence waiting times are within target.
Podiatry: The previous action plan remains in place. There is currently an extensive review of the service looking at how to strengthen the clinical leadership and operational management, making
better use of current resources and staff support. Service is undergoing a full capacity exercise to address how it can meet the high demand.
Community Rehab: It has been identified that 2 Locums were not recording contacts in Sysytem1 for Alexandra bedded unit. This has now been corrected and improvements should show in the
following month.
Respiratory: CLCH have reviewed the activity 12-13 to 14-15 and note that a change in recording for 13-14 and 14-15 is the cause of the underperformance. This is being explored at FIG.
DNA: A fixed threshold of 4% was agreed for all services.
MSK: The longer term work to improve the DNA rate and waiting times has been stopped as the service are now focussed on providing a safe mobilisation of the service to the new provider from
November and the work involved within this process.
Diabetes Service: For WL, this relates to 48 patients and 10 were discharged as a consequence of a 3rd DNA. Unlike CL, the majority of DNAs are against one clinician so this has been reported back to
the team lead for possible training around the DNA protocol for the service.
Podiatry: Service following up on multiple DNAing by patients. Letters to GPs/Referrers are issued if service discharges a patient due to multiple DNAing asking them to highlight this with patient if
they request to be re-referred.
Continence: Reviewing protocol with new staff members, and idenfying if the DNA relates to an particular clinician.
West London CCG Month 5 2015/16Community - CLCH
Contract
The top 5 under performing services for West London CCG are highlighted within this slide. A further deep dive analysis has been conducted to establish if there are certain factors which may indicate to the reasons
behind the under performance
A3

Key Message
Any lines without variance (%) figures are activity of a type that was not seen in 2014-15 for this CCG and therefore there is no outturn figure from which to calculate variance.Month 5 (August) Traditional MH Currencies Outturn Report
14/15 Outturn Month Plan Month ActualIn Month
Variance
In Month
Variance (%)YTD Plan YTD Actual YTD Variance
YTD Variance
(%)FOT
FOT Variance
(%)
Block 105,700 8,633 7,163 1,470 17% 43,906 41,095 2,811 6% 98,628 6.7%
Adult 79,062 6,450 4,950 1,500 23% 32,832 28,895 3,937 12% 69,348 12.3%
Community 40,677 3,228 1,988 1,240 38% 16,787 13,665 3,122 19% 32,796 19.4%
Community First Appointment - Adults2,207 175.2 120 55.2 31% 910.8 738 172.8 19% 1,771 19.7%
Community First Appointment - Adults LD4 0.3 4 -3.7 -1160% 1.7 7 -5.3 -324% 17 -320.0%
Community Fup Appointment - Adults36,731 2,915.2 1,677 1,238.2 42% 15,158.8 12,077 3,081.8 20% 28,985 21.1%
Community Fup Appointment - Adults LD3 0.2 2 -1.8 -740% 1.2 2 -0.8 -62% 5 -60.0%
Specialist Teams - A&E Liaison 1,732 137.5 185 -47.5 -35% 714.8 841 -126.2 -18% 2,018 -16.5%
Day Case 1,794 152.3 68 84.3 55% 751.8 550 201.8 27% 1,320 26.4%
Inpatient 29,621 2,515.8 2,456 59.8 2% 12,416.5 11,871 545.5 4% 28,490 3.8%
Inpatients - Acute 21,174 1,798.3 1,956 -157.7 -9% 8,875.6 9,207 -331.4 -4% 22,097 -4.4%
Inpatients - PICU (Female) 999 84.8 70 14.8 17% 418.7 341 77.7 19% 818 18.1%
Inpatients - PICU (Male) 3,700 314.3 245 69.3 22% 1,551.1 1,308 243.1 16% 3,139 15.2%
Inpatients - Rehab 3,748 318.3 185 133.3 42% 1,571.1 1,015 556.1 35% 2,436 35.0%
Outpatient 6,970 553.2 438 115.2 21% 2,876.5 2,809 67.5 2% 6,742 3.3%
Outpatient First Appointment - Adults1,459 115.8 70 45.8 40% 602.1 444 158.1 26% 1,066 27.0%
Outpatient Fup Appointment - Adults5,226 414.8 358 56.8 14% 2,156.8 2,296 -139.2 -6% 5,510 -5.4%
Outpatient Fup Appointment - Adults LD3 0.2 0 0.2 100% 1.2 1 0.2 19% 2 20.0%
Specialist Teams - A&E Liaison 282 22.4 10 12.4 55% 116.4 68 48.4 42% 163 42.1%
CAMHS 6,567 521.2 335 186.2 36% 2,710.2 2,751 -40.8 -2% 6,602 -0.5%
Community 5,489 435.6 285 150.6 35% 2,265.3 2,267 -1.7 0% 5,441 0.9%
Community First Appointment - CAMHS607 48.2 46 2.2 5% 250.5 271 -20.5 -8% 650 -7.1%
Community Fup Appointment - CAMHS4,882 387.5 239 148.5 38% 2,014.8 1,996 18.8 1% 4,790 1.9%
Outpatient 1,078 85.6 50 35.6 42% 444.9 484 -39.1 -9% 1,162 -7.8%
Outpatient First Appointment - CAMHS224 17.8 14 3.8 21% 92.4 117 -24.6 -27% 281 -25.4%
Outpatient Fup Appointment - CAMHS854 67.8 36 31.8 47% 352.4 367 -14.6 -4% 881 -3.1%
Older Adult 20,071 1,662.0 1,878 -216.0 -13% 8,363.8 9,449 -1,085.2 -13% 22,678 -13.0%
Community 7,637 606.1 634 -27.9 -5% 3,151.8 3,450 -298.2 -9% 8,280 -8.4%Community First Appointment - Elderly1,003 79.6 74 5.6 7% 413.9 426 -12.1 -3% 1,022 -1.9%
Community Fup Appointment - Elderly5,433 431.2 417 14.2 3% 2,242.2 2,320 -77.8 -3% 5,568 -2.5%
Memory Service First - Elderly 516 41.0 49 -8.0 -20% 213.0 261 -48.0 -23% 626 -21.4%
Memory Service Fup - Elderly 685 54.4 94 -39.6 -73% 282.7 443 -160.3 -57% 1,063 -55.2%
Day Case 1 0.1 0 0.1 100% 0.4 0 0.4 100% 0 100.0%
Inpatient 12,400 1,053.2 1,242 -188.8 -18% 5,198.0 5,987 -789.0 -15% 14,369 -15.9%
Inpatients - Elderly 12,400 1,053.2 1,242 -188.8 -18% 5,198.0 5,987 -789.0 -15% 14,369 -15.9%
Outpatient 33 2.6 2 0.6 24% 13.6 12 1.6 12% 29 12.7%
Memory Service First - Elderly 31 2.5 2 0.5 19% 12.8 11 1.8 14% 26 14.8%
Memory Service Fup - Elderly 2 0.2 0 0.2 100% 0.8 1 -0.2 -21% 2 -20.0%
Cost and Volume 6,000 509.6 480 29.6 6% 2,515.2 2,061 454.2 18% 4,946 17.6%
Adult 6,000 509.6 480 29.6 6% 2,515.2 2,061 454.2 18% 4,946 17.6%
Inpatient 6,000 509.6 480 29.6 6% 2,515.2 2,061 454.2 18% 4,946 17.6%
Inpatients - Haven 6,000 509.6 480 29.6 6% 2,515.2 2,061 454.2 18% 4,946 17.6%
Cost Per Case 2,110 178.7 155 23.7 13% 882.0 852 30.0 3% 2,045 3.1%
Adult 2,110 178.7 155 23.7 13% 882.0 852 30.0 3% 2,045 3.1%
Inpatient 2,110 178.7 155 23.7 13% 882.0 852 30.0 3% 2,045 3.1%
Inpatients - Kenton 251 21.3 31 -9.7 -46% 104.9 153 -48.1 -46% 367 -46.3%
Inpatients - Villas 1,859 157.5 124 33.5 21% 777.1 699 78.1 10% 1,678 9.8%
Grand Total 113,810 9,321.1 7,798 1,523.1 16% 47,303.4 44,008 3,295.4 7% 105,619 7.2%
high quality support to commissioners to improve health and wellbeing
The "plan" and variance figures in this slide must be interpreted with a great deal of caution. The activity "plan" is an informal one which has not been agreed with the Provider. There is ongoing
discussion regarding the best methodology for calculating the
Minus signs in variance columns indicate greater than expected levels of activity.
Any lines without variance (%) figures are activity of a type that was not seen in 2014-15 for this CCG and therefore there is no outturn figure from which to calculate variance.
Appendix 4.1: Mental Health, CNWL
A4

WL CCG supercluster % of caseload v All CNWL - Jul '15
Data Source:
Data from the MHLDDS (the green bar chart in the top right hand corner) suggests that the caseload on psychosis clusters has increased by approximately 4% (about 60 patients) since the end of March 2015. The cause of this increase has not been established.
It is not known whether this increase is real or whether it is an artefact of the complex processes involved in putting together the MHLDDS. It is understood that cluster caseload figures from MHLDDS are not always accurate.
Data Note:
CNWL have previously suggested that according to the data from their clinical system, the caseload on psychosis and non-psychosis clusters combined declined in 2014-15 approximately in line with the achievement of Shifting Settings of Care (138 patients
were discharged via SSoC during 2014-15). A similar decline is seen in the adult caseload data submitted by CNWL in the Monthly Information Return, although a decline in cluster caseloads is not seen in the MHLDDS data.
0
200
400
600
800
1,000
1,200
1,400
1,600
1,800
Aug
'14
Sep
'14
Oct
'14
Nov
'14
Dec
'14
Jan
'15
Feb
'15
Mar
'15
Apr
'15
May
'15
Jun
'15
Jul '
15
Non-psychosis supercluster caseload - 12 month trend
01
02
03
04
05
06
07
08
Cluster
0
200
400
600
800
1,000
1,200
1,400
1,600
1,800
Aug
'14
Sep
'14
Oct
'14
Nov
'14
Dec
'14
Jan
'15
Feb
'15
Mar
'15
Apr
'15
May
'15
Jun
'15
Jul '
15
Dementia supercluster caseload - 12 month trend
18
19
20
21
Cluster
0
200
400
600
800
1,000
1,200
1,400
1,600
1,800
Aug
'14
Sep
'14
Oct
'14
Nov
'14
Dec
'14
Jan
'15
Feb
'15
Mar
'15
Apr
'15
May
'15
Jun
'15
Jul '
15
Psychosis supercluster caseload - 12 month trend
10
11
12
13
14
15
16
17
Cluster
0%
10%
20%
30%
40%
50%
60%
WL
CCG
All
CNW
L
WL
CCG
All
CNW
L
WL
CCG
All
CNW
L
WL CCG supercluster % of caseload v All CNWL - Jul '15
Non psychosis Psychosis Dementia
Mental Health and Learning Disabilities Dataset (MHLDDS) Month 4
A5

Budget Actual Variance Budget Outturn Variance Budget Actual Variance Budget Outturn Variance
CEO Team 21 36 (15) 43 74 (31) 45 75 (30) 89 152 (63)
Collaborative Finance 33 39 (6) 66 89 (23) 70 82 (12) 139 187 (48)
Safety & Quality 151 132 19 302 287 15 316 276 40 632 602 31
Governance & Compliance 0 0 0 0 0 0 0 0 0 0 0 0
Safeguarding 105 112 (6) 211 219 (8) 376 374 2 751 745 7
Office Services 0 0 0 0 0 0 0 0 0 0 0 0
Additional Collaborative Charges 0 0 0 0 0 0 0 2 (2) 0 17 (17)
CSS - Direct 20 17 3 40 39 2 1,039 796 244 2,079 1,871 207
CSS - Indirect 682 637 45 1,363 1,346 17 2,021 2,054 (33) 4,041 4,169 (128)
CSS Reserve 0 0 0 0 0 0 0 0 0 0 0 0
Programme Total 1,013 972 41 2,025 2,054 (29) 3,866 3,657 209 7,732 7,743 (11)
CEO Team 100 85 15 200 181 19 544 442 103 1,089 947 142
Collaborative Finance 62 68 (6) 124 126 (2) 337 370 (33) 674 684 (10)
Safety & Quality 21 21 0 41 41 1 113 112 0 226 222 3
Governance & Compliance 46 62 (16) 92 104 (12) 249 336 (87) 499 566 (68)
Safeguarding 0 0 0 0 0 0 0 0 0 0 0 0
Office Services 21 21 (1) 41 43 (1) 73 75 (2) 146 149 (3)
Additional Collaborative Charges 0 0 0 0 3 (3) 0 0 0 0 16 (16)
CSS - Direct 258 415 (157) 517 705 (188) 3,112 3,391 (278) 6,225 6,463 (238)
CSS - Indirect 909 748 161 1,817 1,610 207 3,245 2,947 298 6,491 6,153 338
CSS Reserve 41 41 0 81 81 0 221 221 0 441 441 0
Admin Total 1,456 1,460 (4) 2,913 2,893 19 7,895 7,894 0 15,790 15,641 148
CEO Team 121 121 0 242 255 (13) 589 516 73 1,178 1,099 79
Collaborative Finance 95 107 (12) 190 215 (25) 407 452 (45) 813 871 (58)
Safety & Quality 172 152 19 343 328 15 429 388 41 858 824 34
Governance & Compliance 46 62 (16) 92 104 (12) 249 336 (87) 499 566 (68)
Safeguarding 105 112 (6) 211 219 (8) 376 374 2 751 745 7
Office Services 21 21 (1) 41 43 (1) 73 75 (2) 146 149 (3)
Additional Collaborative Charges 0 0 0 0 3 (3) 0 2 (2) 0 33 (33)
CSS - Direct 279 432 (154) 557 744 (187) 4,152 4,187 (35) 8,304 8,334 (30)
CSS - Indirect 1,590 1,384 206 3,180 2,956 224 5,266 5,001 265 10,532 10,322 210
CSS Reserve 41 41 0 81 81 0 221 221 0 441 441 0
Grand Total 2,469 2,432 37 4,938 4,947 (10) 11,761 11,552 209 23,522 23,385 137
Programme
Admin
Total
Key Message
West London CCG Element CWHHE Collaboration Total
Year to date (£k) Full year forecast (£k) Year to date (£k) Full year forecast (£k)
CEO Team - Overall underspend due to delay in communications support, forecast to start in M7. Change in admin/prog split for CO and Programme Manager based on workload + Breaking The Cycle training split based on CWHHE
workforce gives movement of expenditure from admin to prog.
Collaborative Finance - YTD overspend relates to interim cover of CFO role (now filled). Additional costs for maternity cover from M7 offset by vacant QIPP post.
Governance & Compliance - £69k forecast overspend on legal/professional fees. M1-6 includes interim cover, permanent recruitment is being staggered to break-even on pay.
Additional Collaborative Charges Admin - Boardpad contract to start in Nov. Recurrent yearly cost from 16/17 onwards will be £8k per CCG.
CSS - Direct Admin - Contract Management overspend as a result of interim cover for long term sickness & vacant Deputy Director post (since M3).
CSS Reserve - Assumed to be fully utilised. To review & release any available budget in M7.
Collaborative Management Infrastructure
A6