monthly averages of weekly wine prices - choisir une...
TRANSCRIPT


back to DashboardPrevious
PageNext
2
April 2018 Wine Market Update
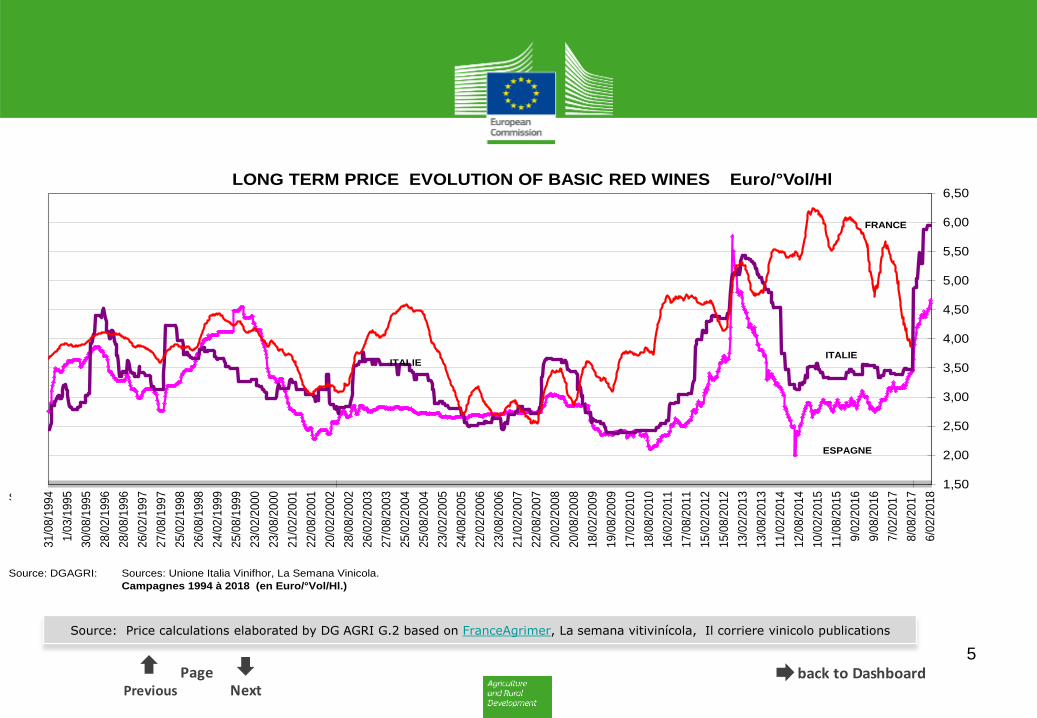
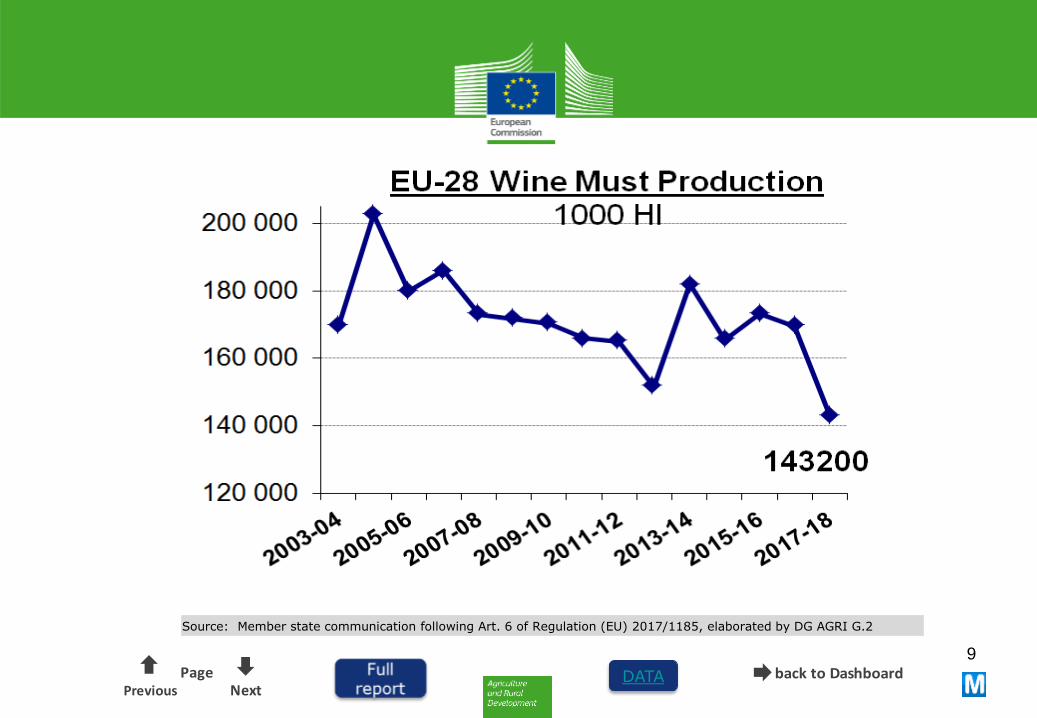
Production: Official declarations on 2017 wine production received add up to a volume of 133 Mio hectolitres (15% below the 5-year average), confirming previous extreme low forecast figures. The current situation with high price levels (Basic red wines in Italy +75% compared to 2017) despite the existence of important stocks remains difficult to analyse, taken in account geopolitical instability on main export markets and shrinking local consumption.

back to DashboardPrevious
PageNext
3
Source: Price calculations elaborated by DG AGRI G.2 based on FranceAgrimer, La semana vitivinícola, Il corriere vinicolo publications
1 Yearevolution
LONG TERMevolution
€/°VoL/HL March 2018
France 5,96€ 5,78€ 3,1% 5,27€ 12,9% 5,66€ 5,2%
Italy 5,95€ 5,94€ 0,0% 3,39€ 75,4% 3,40€ 74,8%
Spain 4,63€ 4,61€ 0,4% 3,14€ 47,4% 2,84€ 62,8%
févr-18 March 2017 3 year avg

back to DashboardPrevious
PageNext
4
Source: Price calculations elaborated by DG AGRI G.2 based on FranceAgrimer, La semana vitivinícola, Il corriere vinicolo publications
Monthly averages of weekly wine prices
- - - - = moyennes campagne précédente
Italy
Spain
for basic bulk wines without PDO/PGI in EUROS / %Vol. / HlFrance
Sources:DG AGRI based on Unione Italiana Vini – FranceAgriMer - Semana Viticola
1,00
2,00
3,00
4,00
5,00
6,00
7,00
Aug Sep Oct Nov Dec Jan Feb Mar Apr May June July
1,00
2,00
3,00
4,00
5,00
6,00
7,00
Aug Sep Oct Nov Dec Jan Feb Mar Apr May June July
1,00
2,00
3,00
4,00
5,00
6,00
7,00
Aug Sep Oct Nov Dec Jan Feb Mar Apr May June July
—— = this wine year
- - - - = previous wine year
back to DashboardPrevious
PageNext
5
Source: Price calculations elaborated by DG AGRI G.2 based on FranceAgrimer, La semana vitivinícola, Il corriere vinicolo publications
Source: DGAGRI: Sources: Unione Italia Vinifhor, La Semana Vinicola.
Campagnes 1996 à 2012 (en Euro/°Vol/Hl.)
Source: DGAGRI: Sources: Unione Italia Vinifhor, La Semana Vinicola.
Campagnes 1994 à 2018 (en Euro/°Vol/Hl.)
1,50
2,00
2,50
3,00
3,50
4,00
4,50
5,00
5,50
6,00
6,50
31/0
8/1
99
4
1/0
3/1
99
5
30/0
8/1
99
5
28/0
2/1
99
6
28/0
8/1
99
6
26/0
2/1
99
7
27/0
8/1
99
7
25/0
2/1
99
8
26/0
8/1
99
8
24/0
2/1
99
9
25/0
8/1
99
9
23/0
2/2
00
0
23/0
8/2
00
0
21/0
2/2
00
1
22/0
8/2
00
1
20/0
2/2
00
2
28/0
8/2
00
2
26/0
2/2
00
3
27/0
8/2
00
3
25/0
2/2
00
4
25/0
8/2
00
4
23/0
2/2
00
5
24/0
8/2
00
5
22/0
2/2
00
6
23/0
8/2
00
6
21/0
2/2
00
7
22/0
8/2
00
7
20/0
2/2
00
8
20/0
8/2
00
8
18/0
2/2
00
9
19/0
8/2
00
9
17/0
2/2
01
0
18/0
8/2
01
0
16/0
2/2
01
1
17/0
8/2
01
1
15/0
2/2
01
2
15/0
8/2
01
2
13/0
2/2
01
3
13/0
8/2
01
3
11/0
2/2
01
4
12/0
8/2
01
4
10/0
2/2
01
5
11/0
8/2
01
5
9/0
2/2
01
6
9/0
8/2
01
6
7/0
2/2
01
7
8/0
8/2
01
7
6/0
2/2
01
8
LONG TERM PRICE EVOLUTION OF BASIC RED WINES Euro/°Vol/Hl
ESPAGNE
ITALIE
FRANCE
ITALIE

back to DashboardPrevious
PageNext
6
Source: Franceagrimer communication following Art. 19 §3 of Regulation (EU) 2009/436, elaborated by DG AGRI G.2

back to DashboardPrevious
PageNext
7
Source: MiPAAF communication following Art. 19 §3 of Regulation (EU) 2009/436, elaborated by DG AGRI G.2

back to DashboardPrevious
PageNext
8
Source: Magrama communication following Art. 19 §3 of Regulation (EU) 2009/436, elaborated by DG AGRI G.2
back to DashboardPrevious
PageNext
9
DATA
Source: Member state communication following Art. 6 of Regulation (EU) 2017/1185, elaborated by DG AGRI G.2
back to Dashboard10
Graph Vinified production
Source: Member state communication following Art. 6 of Regulation (EU) 2017/1185, elaborated by DG AGRI G2
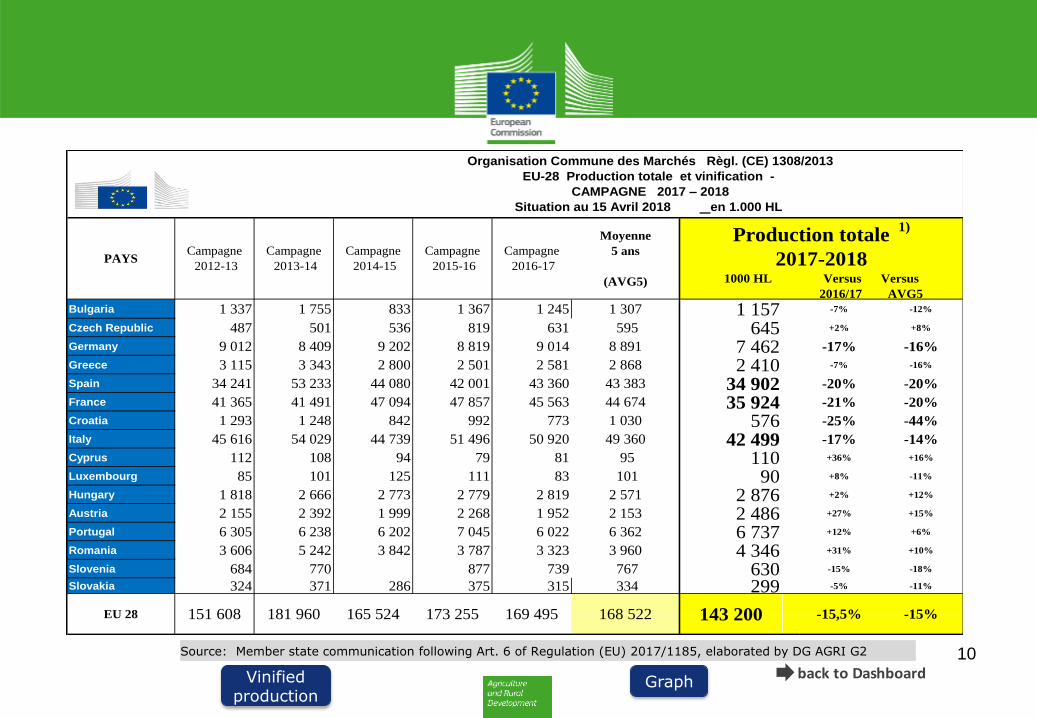
Bulgaria 1 337 1 755 833 1 367 1 245 1 307 1 157 -7% -12%
Czech Republic 487 501 536 819 631 595 645 +2% +8%
Germany 9 012 8 409 9 202 8 819 9 014 8 891 7 462 -17% -16%
Greece 3 115 3 343 2 800 2 501 2 581 2 868 2 410 -7% -16%
Spain 34 241 53 233 44 080 42 001 43 360 43 383 34 902 -20% -20%
France 41 365 41 491 47 094 47 857 45 563 44 674 35 924 -21% -20%
Croatia 1 293 1 248 842 992 773 1 030 576 -25% -44%
Italy 45 616 54 029 44 739 51 496 50 920 49 360 42 499 -17% -14%
Cyprus 112 108 94 79 81 95 110 +36% +16%
Luxembourg 85 101 125 111 83 101 90 +8% -11%
Hungary 1 818 2 666 2 773 2 779 2 819 2 571 2 876 +2% +12%
Austria 2 155 2 392 1 999 2 268 1 952 2 153 2 486 +27% +15%
Portugal 6 305 6 238 6 202 7 045 6 022 6 362 6 737 +12% +6%
Romania 3 606 5 242 3 842 3 787 3 323 3 960 4 346 +31% +10%
Slovenia 684 770 877 739 767 630 -15% -18%
Slovakia 324 371 286 375 315 334 299 -5% -11%
168 522 143 200 -15,5% -15%EU 28 151 608 181 960 165 524 173 255 169 495
Production totale 1)
2017-20181000 HL Versus Versus
2016/17 AVG5
Organisation Commune des Marchés Règl. (CE) 1308/2013
EU-28 Production totale et vinification -
CAMPAGNE 2017 – 2018
Situation au 15 Avril 2018 en 1.000 HL
PAYSCampagne
2012-13
Campagne
2013-14
Campagne
2014-15
Campagne
2015-16
Campagne
2016-17
Moyenne
5 ans
(AVG5)

back to Dashboard11
Graph Total production
Source: Member state communication following Art. 19 §1a,b of Regulation (EU) 2009/436, elaborated by DG AGRI C2
Bulgaria 1 307 1 157 -7% -12% 77 7 375 184 513 1 080
Czech Republic 595 645 +2% +8% 645
Germany 8 891 7 462 -17% -16% 399 6 921 120 13 9 7 063
Greece 2 868 2 410 -7% -16% 17 237 457 112 1 587 2 393
Spain 43 383 34 902 -20% -20% 2 749 13 005 3 559 6 251 9 338 32 153
France 44 674 35 924 -21% -20% 17 525 10 235 468 7 696 35 924
Croatia 1 030 576 -25% -44% 470 30 76 576
Italy 49 360 42 499 -17% -14% 6 296 18 155 8 975 361 8 712 36 203
Cyprus 95 110 +36% +16% 5 39 16 51 110
Luxembourg 101 90 +8% -11% 90
Hungary 2 571 2 876 +2% +12% 328 1 469 1 008 65 6 2 548
Austria 2 153 2 486 +27% +15% 2 329 48 2 106 2 485
Portugal 6 362 6 737 +12% +6% 362 3 407 1 863 58 1 048 6 375
Romania 3 960 4 346 +31% +10% 29 820 263 159 3 076 4 317
Slovenia 767 630 -15% -18% 430 116 32 53 630
Slovakia 334 299 -5% -11% 266 10 22 298
65 046 27 056
31% -15% -17,8%
32 300 132 94192 100
Versus 2016-17: -14,1% -28,7%
168 522 143 200 -15,5% -15% 10 259 7 800EU 28
Production totale 1)
2017-20181000 HL Versus Versus
2016/17 AVG5
Jus de raisins
Evaporation
MC
ESTIMATIONS Production Vinifiée
Vins avec
A.O.P.
Vins avec
I.G.P.
Vins de
cépage sans
AOP/IGP
Autres Vins
et moûts
Prod
vinifiée
Organisation Commune des Marchés Règl. (CE) 1308/2013
EU-28 Production totale et vinification -
CAMPAGNE 2017 – 2018
Situation au 15 Avril 2018 en 1.000 HL
COMMISSION EUROPÉENNE
DIRECTION GÉNÉRALE DE L'AGRICULTURE
ET DU DÉVELOPPEMENT RURAL
G.2. Vin, spiritueux, produits horticoles, cultures spécialisées
PAYS
Moyenne
5 ans
(AVG5)

back to DashboardPrevious
PageNext
12 DATA
Source: Member state communication following Art. 19 §1a,b of Regulation (EU) 2009/436, elaborated by DG AGRI G2
back to DashboardPrevious
PageNext
13 DATA
Source: Member state communication following Art. 19 §1a,b of Regulation (EU) 2009/436, elaborated by DG AGRI G.2
20 000
40 000
60 000
80 000
100 000
120 000
140 000
160 000
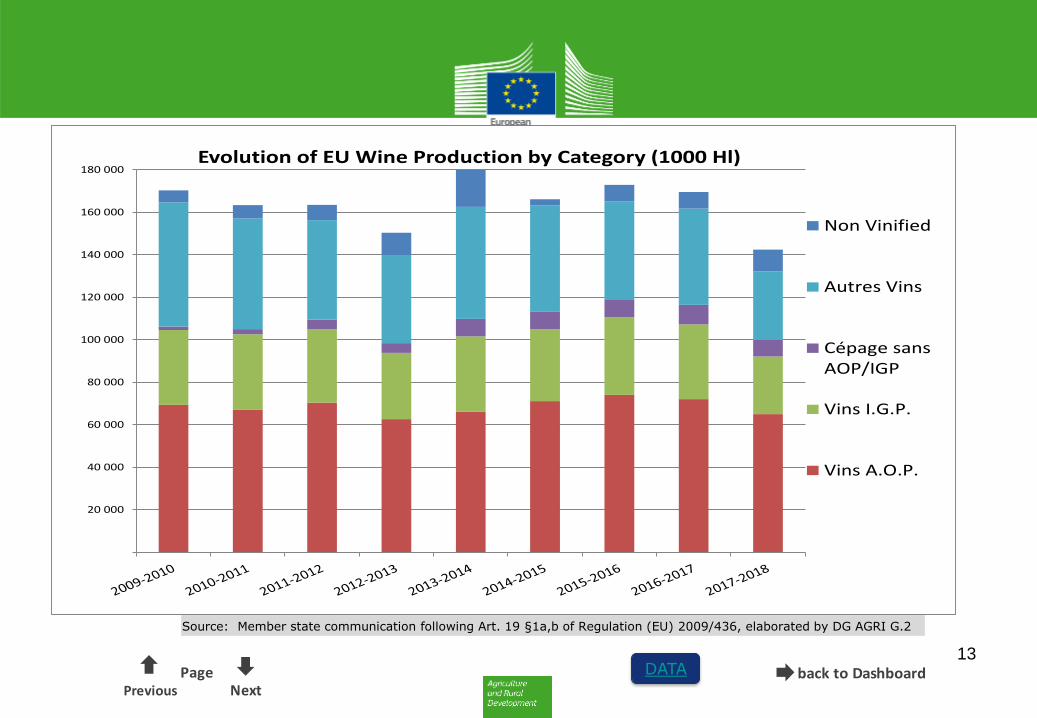
180 000Evolution of EU Wine Production by Category (1000 Hl)
Non Vinified
Autres Vins
Cépage sansAOP/IGP
Vins I.G.P.
Vins A.O.P.

back to Dashboard14
Graph
Source: Member state communication following Art. 19 §1b of Regulation (EU) 2009/436, elaborated by DG AGRI G.2
PreviousPage
Next
2009-2010 5 657 69 381 35 244 1 623 58 432 164 681 170 338
2010-2011 6 300 67 000 35 600 2 468 52 000 157 300 163 600
2011-2012 7 200 70 393 34 552 4 638 46 729 156 312 163 512
2012-2013 10 482 62 661 31 158 4 600 41 500 139 800 150 282
2013-2014 17 859 66 051 35 521 8 300 52 700 162 600 180 459
2014-2015 2 824 71 126 33 909 8 100 50 200 163 300 166 124
2015-2016 7 652 74 063 36 480 8 200 46 500 165 200 172 852
2016-2017 7 829 72 061 35 178 9 200 45 300 161 700 171 959
2017-2018 10 259 65 046 27 056 7 800 32 300 132 941 143 200
Total must
ProdNon Vinified
Campagne
1000 Hl
Prod
vinifiéeVins A.O.P. Vins I.G.P.
Cépage sans
AOP/IGPAutres Vins
10 000
20 000
30 000
40 000
50 000
60 000
70 000
80 000
2009-2010 2010-2011 2011-2012 2012-2013 2013-2014 2014-2015 2015-2016 2016-2017 2017-2018
Evolution of EU Wine Production by Category (1000 Hl)
Vins A.O.P.
Autres Vins
Vins I.G.P.
Non Vinified
Cépage sans AOP/IGP

back to DashboardPrevious
PageNext
15
OIV report on 2017 World Vitiviiniculture
OIV 2018 Global state of conditions report

back to DashboardPrevious
Page16
Source: Member state communication following Art. 19 §1a,b of Regulation (EU) 2009/436, elaborated by DG AGRI G.2
Next
back to DashboardPrevious
PageNext
17
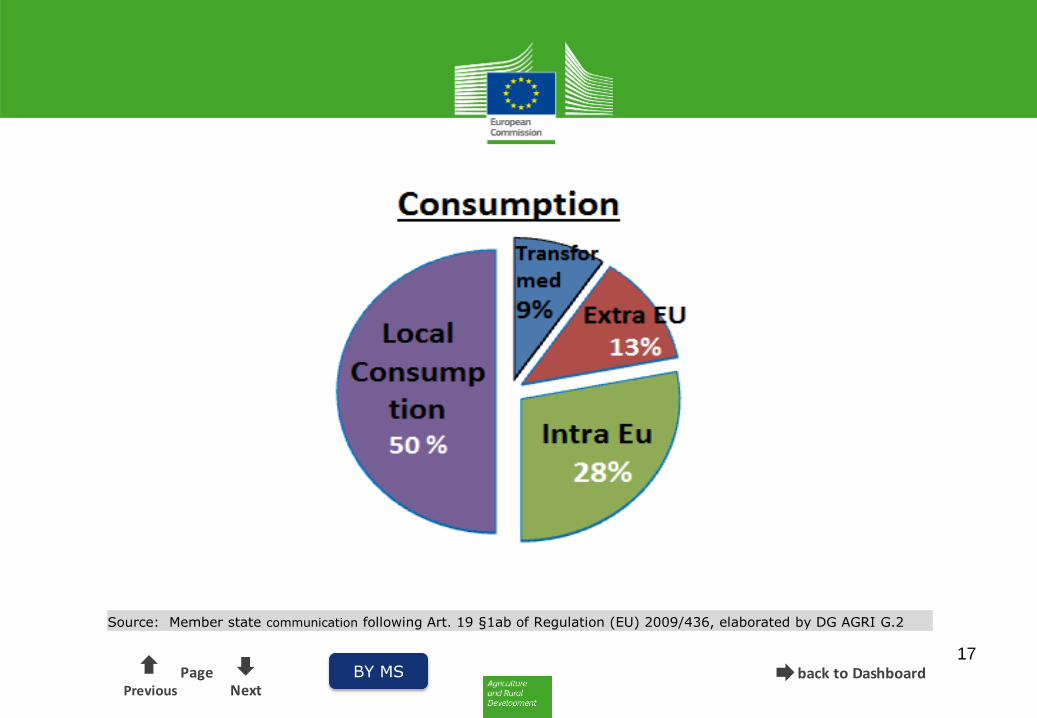
Source: Member state communication following Art. 19 §1ab of Regulation (EU) 2009/436, elaborated by DG AGRI G.2
BY MS
back to DashboardPrevious
PageNext
18 DATA
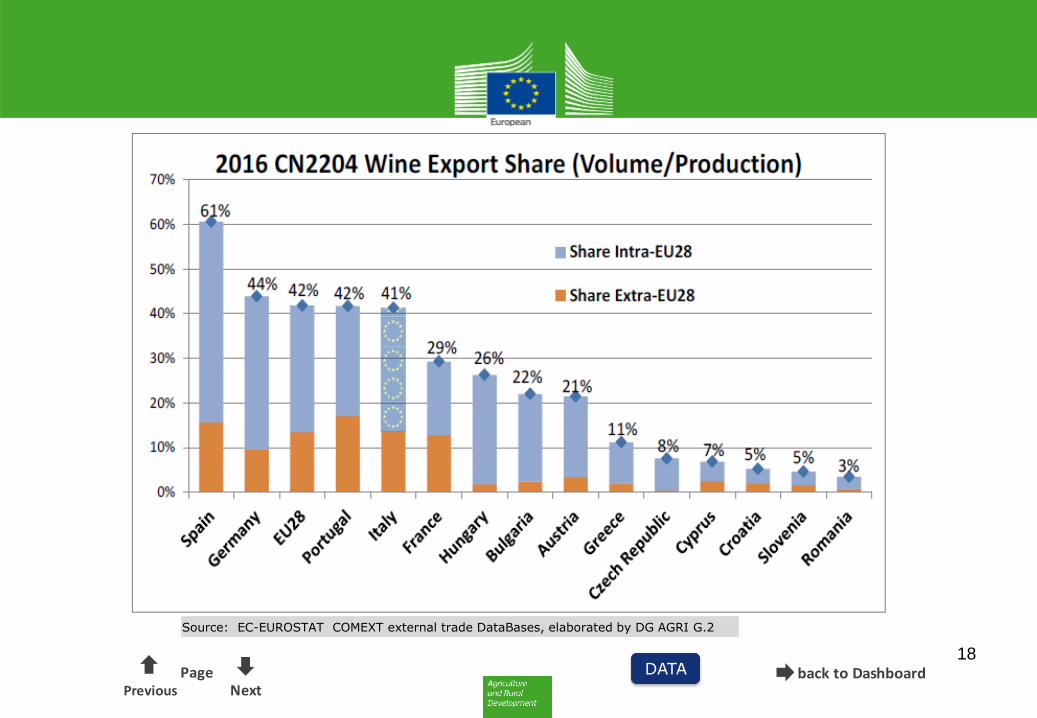
Source: EC-EUROSTAT COMEXT external trade DataBases, elaborated by DG AGRI G.2

back to DashboardPrevious
PageNext
19
DATA
Source: Member state communication following Art. 19 §1b of Regulation (EU) 2009/436, elaborated by DG AGRI G.2

back to Dashboard20
Graph
Source: Member state communication following Art. 19 §1b of Regulation (EU) 2009/436, elaborated by DG AGRI G.2
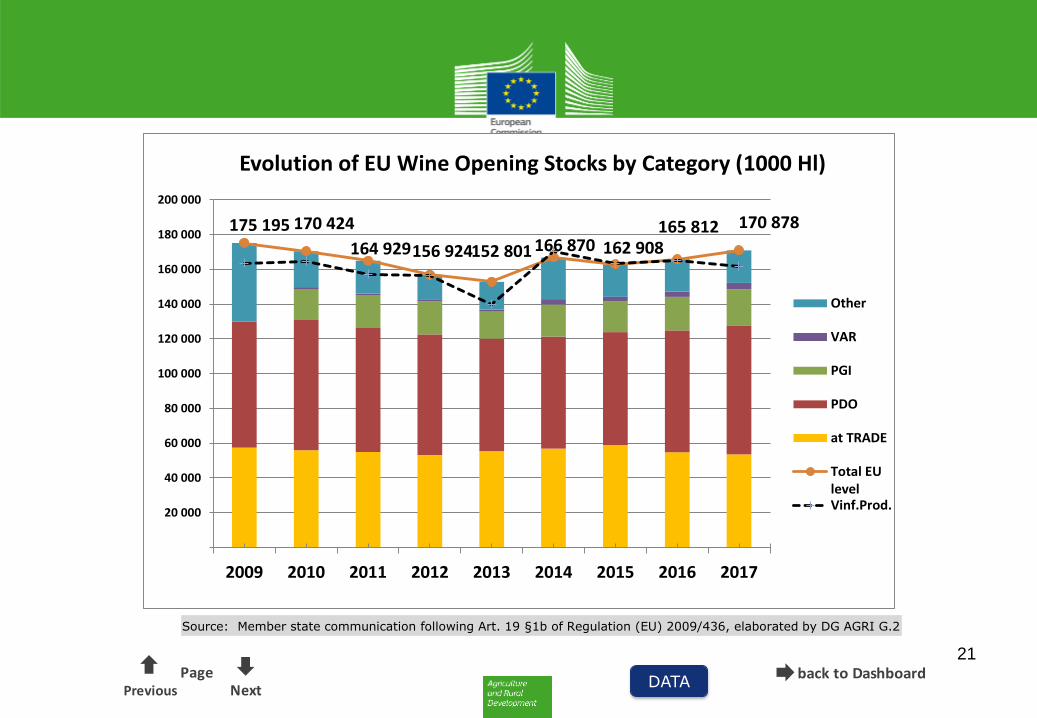
Evolution of EU Wine Opening Stocks by Category (1000 Hl)
in 1000 Hl 2009 2010 2011 2012 2013 2014 2015 2016 2017 Var
at PRODUCTION 117 777 114 561 110 040 103 725 97 339 110 007 104 044 111 050 117 330 5,66%
PDO 72 606 75 052 71 416 69 348 64 649 64 461 65 081 70 145 74 256 5,86%
PGI 17 738 18 942 19 208 15 582 18 550 17 594 19 297 20 727 7,41%
VAR 1 128 848 1 094 1 185 3 055 2 639 3 059 3 698 20,91%
Other 45 172 20 643 18 834 14 076 15 923 23 942 18 730 18 549 18 649 0,54%
at TRADE 57 417 55 863 54 889 53 198 55 462 56 863 58 864 54 762 53 548 -2,22%
Total EU level 175 195 170 424 164 929 156 924 152 801 166 870 162 908 165 812 170 878 3,06%
back to DashboardPrevious
PageNext
21
DATA
Source: Member state communication following Art. 19 §1b of Regulation (EU) 2009/436, elaborated by DG AGRI G.2
175 195 170 424
164 929156 924152 801 166 870 162 908165 812 170 878
20 000
40 000
60 000
80 000
100 000
120 000
140 000
160 000
180 000
200 000
2009 2010 2011 2012 2013 2014 2015 2016 2017
Evolution of EU Wine Opening Stocks by Category (1000 Hl)
Other
VAR
PGI
PDO
at TRADE
Total EUlevelVinf.Prod.
back to Dashboard22
Graph
Source: Member state communication following Art. 19 §1b of Regulation (EU) 2009/436, elaborated by DG AGRI G.2
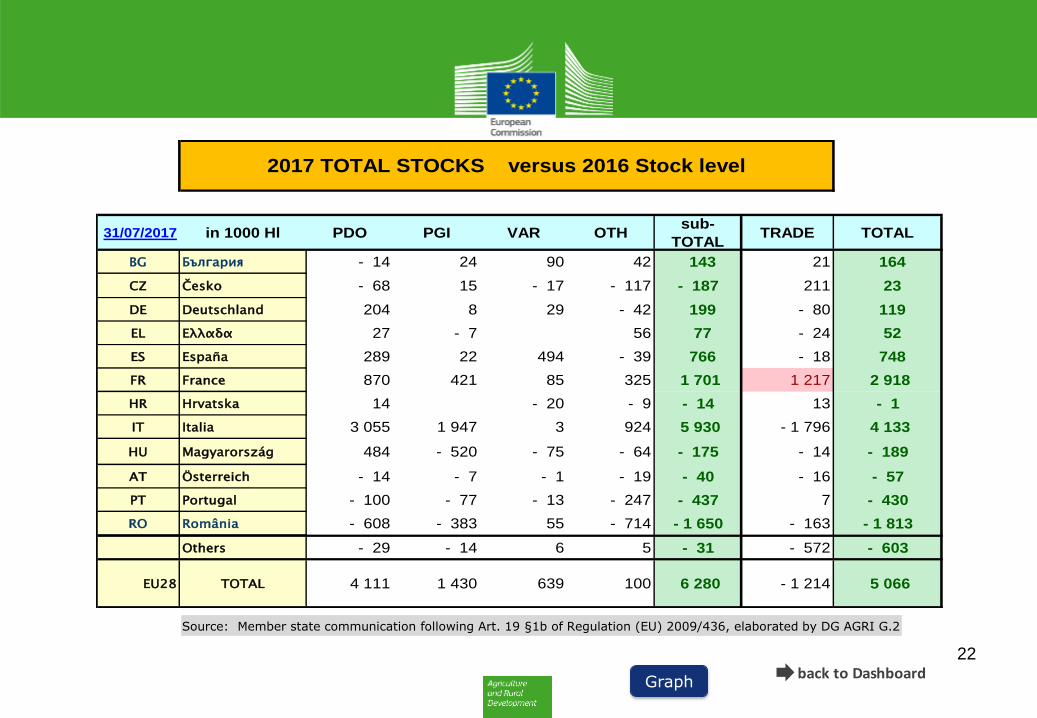
31/07/2017 in 1000 Hl PDO PGI VAR OTHsub-
TOTALTRADE TOTAL
BG България - 14 24 90 42 143 21 164
CZ Česko - 68 15 - 17 - 117 - 187 211 23
DE Deutschland 204 8 29 - 42 199 - 80 119
EL Eλλαδα 27 - 7 56 77 - 24 52
ES España 289 22 494 - 39 766 - 18 748
FR France 870 421 85 325 1 701 1 217 2 918
HR Hrvatska 14 - 20 - 9 - 14 13 - 1
IT Italia 3 055 1 947 3 924 5 930 - 1 796 4 133
HU Magyarország 484 - 520 - 75 - 64 - 175 - 14 - 189
AT Österreich - 14 - 7 - 1 - 19 - 40 - 16 - 57
PT Portugal - 100 - 77 - 13 - 247 - 437 7 - 430
RO România - 608 - 383 55 - 714 - 1 650 - 163 - 1 813SI Slovenija - 14 24 90 42 143 21 164
Others - 29 - 14 6 5 - 31 - 572 - 603
EU28 TOTAL 4 111 1 430 639 100 6 280 - 1 214 5 066
2017 TOTAL STOCKS versus 2016 Stock level

back to DashboardPrevious
PageNext
23
Source: Member state communication following Art. 19 §1ab of Regulation (EU) 2009/436, elaborated by DG AGRI G.2

back to DashboardPrevious
PageNext
24 DATA
Source: EC-EUROSTAT COMEXT external trade DataBases, elaborated by DG AGRI C2
BY MS

back to Dashboard25
Graph
Source: EC-EUROSTAT COMEXT external trade DataBases, elaborated by DG AGRI G.2
Full 2015 report
CN2204 WINE EXPORT Evolution
Full 2016 report
in MIO Hectolitre 2008 2009 2010 2011 2012 2013 2014 2015 2016 2017 %
Extra-EU28 17, 32 16, 14 20, 21 22, 67 22, 48 20, 46 21, 30 21, 97 22, 37 24, 89 100%
U..S.A. 4, 51 4, 13 4, 61 5, 23 5, 43 5, 30 5, 28 5, 62 5, 92 6, 30 25%
China 0, 52 0, 72 1, 60 2, 37 2, 58 1, 97 2, 20 2, 85 3, 25 4, 21 17%
Russia 3, 12 2, 66 3, 87 3, 98 2, 79 2, 36 2, 79 2, 40 2, 52 2, 66 11%
Canada 1, 51 1, 47 1, 67 1, 82 1, 89 1, 75 1, 71 1, 77 1, 76 1, 97 8%
Switzerland 1, 57 1, 68 1, 73 1, 71 1, 72 1, 59 1, 68 1, 71 1, 68 1, 71 7%
Japan 1, 13 1, 15 1, 22 1, 31 1, 63 1, 55 1, 50 1, 49 1, 39 1, 43 6%
Norway 0, 49 0, 49 0, 55 0, 61 0, 63 0, 63 0, 67 0, 68 0, 69 0, 70 3%
Brazil 0, 23 0, 19 0, 29 0, 32 0, 29 0, 29 0, 29 0, 28 0, 31 0, 49 2%
Mexico 0, 19 0, 14 0, 20 0, 25 0, 25 0, 25 0, 30 0, 32 0, 37 0, 42 2%
Ivory Coast 0, 19 0, 22 0, 25 0, 27 0, 27 0, 24 0, 31 0, 39 0, 47 0, 40 2%
Australia 0, 16 0, 12 0, 17 0, 19 0, 24 0, 26 0, 28 0, 30 0, 30 0, 34 1%
Angola 0, 85 0, 70 0, 85 0, 89 0, 97 0, 93 0, 87 0, 73 0, 26 0, 31 1%
Hong Kong 0, 12 0, 16 0, 24 0, 30 0, 29 0, 26 0, 27 0, 27 0, 26 0, 28 1%
Nigeria 0, 38 0, 10 0, 17 0, 25 0, 32 0, 33 0, 28 0, 23 0, 16 0, 21 1%
Singapore 0, 12 0, 10 0, 12 0, 16 0, 16 0, 17 0, 18 0, 19 0, 18 0, 20 1%
Others 2, 23 2, 11 2, 68 3, 0 3, 02 2, 57 2, 68 2, 74 2, 85 3, 27 13%

back to DashboardPrevious
PageNext
26 DATA
Source: EC-EUROSTAT COMEXT external trade DataBases, elaborated by DG AGRI G.2
BY MS
2 000 000
4 000 000
6 000 000
8 000 000
10 000 000
12 000 000
14 000 000
Fr G
erm
any
Extr
a
I
ntra
Utd
. Kin
gdom
Ext
ra
I
ntra
Fran
ce E
xtra
Int
ra
Belg
ium
Ext
ra
I
ntra
Net
herl
ands
Ext
ra
I
ntra
Port
ugal
Ext
ra
I
ntra
Ital
y Ex
tra
Int
ra
Swed
en E
xtra
Int
ra
Czec
h Re
publ
ic E
xtra
Int
ra
Den
mar
k Ex
tra
Int
ra
Pola
nd E
xtra
Int
ra
Lith
uani
a Ex
tra
Int
ra
Slov
akia
Ext
ra
I
ntra
Aus
tria
Ext
ra
I
ntra
Irel
and
Extr
a
I
ntra
Latv
ia E
xtra
Int
ra
Finl
and
Extr
a
I
ntra
Rom
ania
Ext
ra
I
ntra
Spai
n Ex
tra
Int
ra
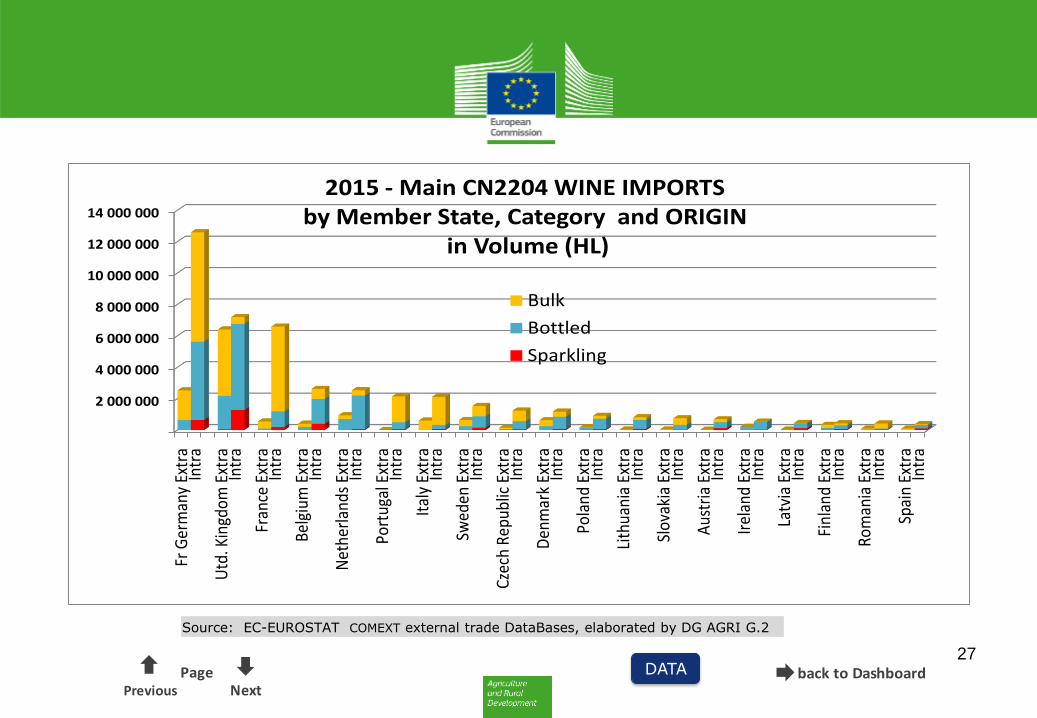
2015 - Main CN2204 WINE IMPORTS by Member State, Category and ORIGIN
in Volume (HL)
Bulk
Bottled
Sparkling
back to DashboardPrevious
PageNext
27 DATA
Source: EC-EUROSTAT COMEXT external trade DataBases, elaborated by DG AGRI G.2
back to Dashboard28
Graph
Source: EC-EUROSTAT COMEXT external trade DataBases, elaborated by DG AGRI G.2
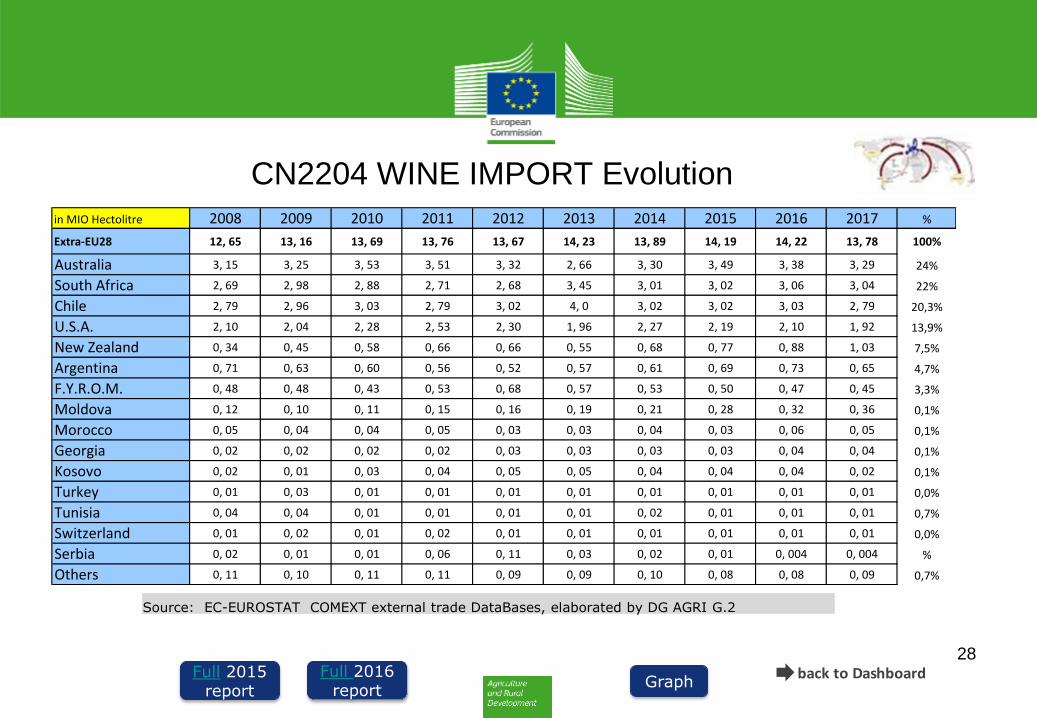
CN2204 WINE IMPORT Evolution
Full 2015 report
Full 2016 report
in MIO Hectolitre 2008 2009 2010 2011 2012 2013 2014 2015 2016 2017 %
Extra-EU28 12, 65 13, 16 13, 69 13, 76 13, 67 14, 23 13, 89 14, 19 14, 22 13, 78 100%
Australia 3, 15 3, 25 3, 53 3, 51 3, 32 2, 66 3, 30 3, 49 3, 38 3, 29 24%
South Africa 2, 69 2, 98 2, 88 2, 71 2, 68 3, 45 3, 01 3, 02 3, 06 3, 04 22%
Chile 2, 79 2, 96 3, 03 2, 79 3, 02 4, 0 3, 02 3, 02 3, 03 2, 79 20,3%
U.S.A. 2, 10 2, 04 2, 28 2, 53 2, 30 1, 96 2, 27 2, 19 2, 10 1, 92 13,9%
New Zealand 0, 34 0, 45 0, 58 0, 66 0, 66 0, 55 0, 68 0, 77 0, 88 1, 03 7,5%
Argentina 0, 71 0, 63 0, 60 0, 56 0, 52 0, 57 0, 61 0, 69 0, 73 0, 65 4,7%
F.Y.R.O.M. 0, 48 0, 48 0, 43 0, 53 0, 68 0, 57 0, 53 0, 50 0, 47 0, 45 3,3%
Moldova 0, 12 0, 10 0, 11 0, 15 0, 16 0, 19 0, 21 0, 28 0, 32 0, 36 0,1%
Morocco 0, 05 0, 04 0, 04 0, 05 0, 03 0, 03 0, 04 0, 03 0, 06 0, 05 0,1%
Georgia 0, 02 0, 02 0, 02 0, 02 0, 03 0, 03 0, 03 0, 03 0, 04 0, 04 0,1%
Kosovo 0, 02 0, 01 0, 03 0, 04 0, 05 0, 05 0, 04 0, 04 0, 04 0, 02 0,1%
Turkey 0, 01 0, 03 0, 01 0, 01 0, 01 0, 01 0, 01 0, 01 0, 01 0, 01 0,0%
Tunisia 0, 04 0, 04 0, 01 0, 01 0, 01 0, 01 0, 02 0, 01 0, 01 0, 01 0,7%
Switzerland 0, 01 0, 02 0, 01 0, 02 0, 01 0, 01 0, 01 0, 01 0, 01 0, 01 0,0%
Serbia 0, 02 0, 01 0, 01 0, 06 0, 11 0, 03 0, 02 0, 01 0, 004 0, 004 %
Others 0, 11 0, 10 0, 11 0, 11 0, 09 0, 09 0, 10 0, 08 0, 08 0, 09 0,7%

back to DashboardPrevious
Page
Next
29 DATA
Source: EC-EUROSTAT COMEXT external trade DataBases, elaborated by DG AGRI G.2
1 000
2 000
3 000
4 000
2007 2009 2011 2013 2015 2017
CN2204 Wine EU28 exportsMio Eur United States
Other Dest
China + HK
Switzerland
Canada
Japan
Russian fed.
back to Dashboard30
Graph
Source: EC-EUROSTAT COMEXT external trade DataBases, elaborated by DG AGRI G.2
Full 2015 report
Full 2016 report
in MIO Euro 2008 2009 2010 2011 2012 2013 2014 2015 2016 2017 %
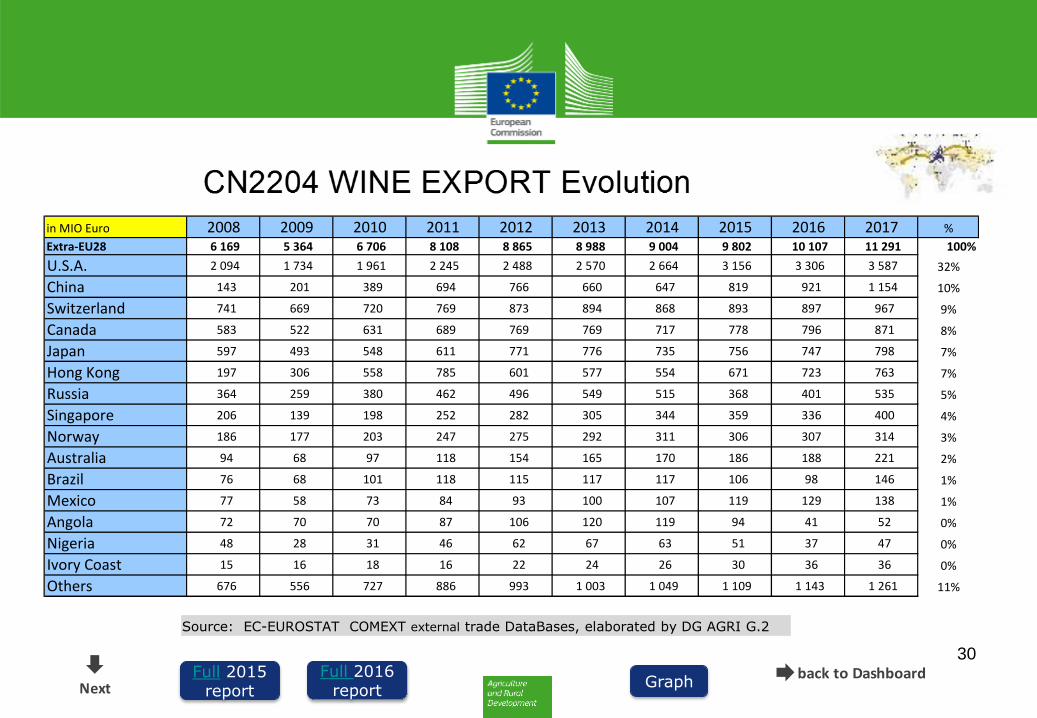
Extra-EU28 6 169 5 364 6 706 8 108 8 865 8 988 9 004 9 802 10 107 11 291 100%
U.S.A. 2 094 1 734 1 961 2 245 2 488 2 570 2 664 3 156 3 306 3 587 32%
China 143 201 389 694 766 660 647 819 921 1 154 10%
Switzerland 741 669 720 769 873 894 868 893 897 967 9%
Canada 583 522 631 689 769 769 717 778 796 871 8%
Japan 597 493 548 611 771 776 735 756 747 798 7%
Hong Kong 197 306 558 785 601 577 554 671 723 763 7%
Russia 364 259 380 462 496 549 515 368 401 535 5%
Singapore 206 139 198 252 282 305 344 359 336 400 4%
Norway 186 177 203 247 275 292 311 306 307 314 3%
Australia 94 68 97 118 154 165 170 186 188 221 2%
Brazil 76 68 101 118 115 117 117 106 98 146 1%
Mexico 77 58 73 84 93 100 107 119 129 138 1%
Angola 72 70 70 87 106 120 119 94 41 52 0%
Nigeria 48 28 31 46 62 67 63 51 37 47 0%
Ivory Coast 15 16 18 16 22 24 26 30 36 36 0%
Others 676 556 727 886 993 1 003 1 049 1 109 1 143 1 261 11%
Next

back to DashboardPrevious
PageNext
31 DATA
Source: EC-EUROSTAT COMEXT external trade DataBases, elaborated by DG AGRI G.2

back to Dashboard32
Graph
Source: EC-EUROSTAT COMEXT external trade DataBases, elaborated by DG AGRI G.2
CN2204 WINE IMPORT Evolution EU-28
Full 2015 report
Full 2016 report
in MIO Euro 2008 2009 2010 2011 2012 2013 2014 2015 2016 2017 %
Extra-EU28 2 501 2 359 2 378 2 406 2 495 2 453 2 453 2 764 2 641 2 623 100%
Australia 531 566 571 568 596 634 606 653 618 585 22%
South Africa 783 647 571 549 548 443 428 474 447 446 17%
Chile 321 282 309 364 383 366 397 499 450 432 16,5%
U.S.A. 167 166 219 238 275 260 313 367 367 391 14,9%
New Zealand 423 446 429 390 388 423 386 395 370 377 14,4%
Argentina 137 131 139 138 142 153 165 203 209 202 7,7%
F.Y.R.O.M. 45 31 52 61 59 64 40 52 47 48 1,8%
Moldova 15 14 14 16 17 21 23 28 34 39 0,2%
Morocco 26 27 23 25 32 32 31 30 28 26 0,2%
Georgia 5 5 5 6 7 8 9 11 12 13 0,2%
Kosovo 1 1 3 3 5 3 5 2 5 0,1%
Turkey 7 6 5 6 4 4 6 4 6 5 0,1%
Tunisia 2 4 3 3 3 3 4 3 5 4 1,9%
Switzerland 2 2 6 2 2 1 1 2 3 3 0,0%
Serbia 1 1 1 2 2 1 2 2 2 2 %
Others 35 30 34 34 32 36 40 40 43 51 1,9%
Next

back to DashboardPrevious
Page33
Source: EC-EUROSTAT COMEXT external trade DataBases, elaborated by DG AGRI G.2
back to DashboardNext

back to Dashboard34
back to Dashboard
E.U. Agricultural Wine dashboard - Metadata Information
Slide number 1
Slide name Intro – Overview
Data Source Member state info, multiple publications
Concept and Definition This slide aims to give an overview of the Market situation in the wine sector of the European Union
Unit of Measurement 1000 Hectoliters, Mio euros, hectogrades, hectare
Coverage 1980 – February 2018
Contact point [email protected]
External links http://ec.europa.eu/agriculture/wine/statistics_en
Additional note
Update Frequency 6 times / year
PreviousPage
Next

back to Dashboard35
E.U. Agricultural Wine dashboard - Metadata Information
Slide number 9 to 13
Slide name EU-28 Wine Must Production (1000 Hl)
Data Source Reg. (EU) 2009/436, Art. 19 §1a,b Reg. (EU) 2017/1185, Art. 6
Concept and Definition This slide aims to show the evolution of the total wine must produced in the European Union during 1 wine year (Aug-July)
Unit of Measurement 1000 Hectoliters
Coverage 2003-04 to present
Contact point [email protected]
External links http://ec.europa.eu/agriculture/wine/statistics_en
Additional note ISAMM Forms 58 (forecast) & 78 (Prod declarations)
Update Frequency 2 times/year: Provisional forecast data at the start of the wine year, final production data during the year.
PreviousPage
Next

back to Dashboard
36
E.U. Agricultural Wine dashboard - Metadata Information
Slide number 24 - 33
Slide name EU-28 Trade Data (in Volume and in Value)
Data Source Eurostat- Comext EU since 19999 CN Dataset, Information on extra-EU trade is collected by the Member States from the statistical copy of the customs declaration (SAD). Information on intra-EU trade is collected by the Member States using the various media placed at the disposal of the information providers. These may be paper or electronic declarations provided for at national level.
Concept and Definition This slide aims to show the evolution of the total wine imports and exports in the European Union during 1 calendar year (January - December)
Unit of Measurement Hectoliters and Euro
Coverage 2008 to 2017
Contact point [email protected]
External links http://ec.europa.eu/agriculture/wine/statistics_en
Update Frequency 1 times/year (March/April)
Previous Next

back to DashboardPrevious
37
March 2018 Wine Market Update
• Prices for basic wines remain at high level in Italy and Spain compared to 2017: Italy +74%, Spain +45%
• 2017 Trade figures:
2017 Exports reached 24,9 Mio Hectolitres (+11% vs 2016)
2017 Imports remained stable 13,8 Mio Hl (-3% vs 2016)
Trade Balance increased by from €7,5 Billion to €8,7 Billion (+16%)