monthly bulletin december 2014 - european central bank · monthly bulletin december 2014 edii...
TRANSCRIPT
MONTHLY BULLET INDEcEMBEr
011201402120140312014041201405120140612014071201408120140912014101201411120141212014
The December 2014 issue of the ECB’s Monthly Bulletin will be the last. It will be replaced by a new Economic Bulletin, which will be published, in view of the announced shift in January 2015 to a six-weekly interval between Governing Council monetary policy meetings, two weeks after each meeting.
monthly bullet inDecember 2014
In 2014 all ECB publications feature
a motif taken from the €20 banknote.
© European Central Bank, 2014
Postal address 60640 Frankfurt am Main Germany
Telephone +49 69 1344 0
Website http://www.ecb.europa.eu
This Bulletin was produced under the responsibility of the Executive Board of the ECB. Translations are prepared and published by the national central banks.
All rights reserved. Reproduction for educational and non-commercial purposes is permitted provided that the source is acknowledged.
The cut-off date for the statistics included in this issue was 3 December 2014.
ISSN 1725-2822 (epub)ISSN 1725-2822 (online)EU catalogue number QB-AG-14-012-EN-E (epub)EU catalogue number QB-AG-14-012-EN-N (online)

3ECB
Monthly BulletinDecember 2014
contentseDitorial 5
economic anD monetary Developments
1 The external environment of the euro area 9
2 Monetary and financial developments 20
Box 1 Recentdevelopmentsinthefinancialaccountoftheeuroarea balance of payments 26
Box 2 Liquidity conditions and monetary policy operations in the period from 13 August to 11 November 2014 33
3 Prices and costs 52
Box 3 Indirecteffectsofoilpricedevelopmentsoneuroareainflation 54
4 Output, demand and the labour market 62
Box 4 The current weakness in euro area investment compared with past crisis episodes 65
5 Fiscal developments 76
Box 5 Newstatisticalindicatorsongovernmentdebtsecuritiesandtheiruseinfiscal analysis and surveillance 77
Box 6 The review of draft budgetary plans for 2015 82
article
December 2014 Eurosystem staff macroeconomic projections for the euro area 85
euro area statistics s1
anneXes
Chronology of monetary policy measures of the Eurosystem i
The TARGET (Trans-European Automated Real-time Gross settlement Express Transfer)system v
Publications produced by the European Central Bank v i i
Glossary iX
4ECBMonthly BulletinDecember 2014
abbreviationscountriesBE Belgium LU LuxembourgBG Bulgaria HU HungaryCZ Czech Republic MT MaltaDK Denmark NL NetherlandsDE Germany AT AustriaEE Estonia PL PolandIE Ireland PT PortugalGR Greece RO RomaniaES Spain SI SloveniaFR France SK SlovakiaHR Croatia FI FinlandIT Italy SE SwedenCY Cyprus UK United KingdomLV Latvia JP JapanLT Lithuania US United States
othersBIS Bank for International Settlementsb.o.p. balance of paymentsBPM5 IMF Balance of Payments Manual (5th edition)CD certificate of depositc.i.f. cost, insurance and freight at the importer’s borderCPI Consumer Price IndexECB European Central BankEER effective exchange rateEMI European Monetary InstituteEMU Economic and Monetary UnionESA 95 European System of Accounts 1995ESCB European System of Central BanksEU European UnionEUR eurof.o.b. free on board at the exporter’s borderGDP gross domestic productHICP Harmonised Index of Consumer PricesHWWI Hamburg Institute of International EconomicsILO International Labour OrganizationIMF International Monetary FundMFI monetary financial institutionNACE statistical classification of economic activities in the European UnionNCB national central bankOECD Organisation for Economic Co-operation and DevelopmentPPI Producer Price IndexSITC Rev. 4 Standard International Trade Classification (revision 4)ULCM unit labour costs in manufacturingULCT unit labour costs in the total economy
In accordance with EU practice, the EU countries are listed in this Bulletin using the alphabetical order of the country names in the national languages.
5ECB
Monthly BulletinDecember 2014
eDitorialBased on the regular economic and monetary analyses, and in line with its forward guidance, the Governing Council decided at its meeting on 4 December 2014 to keep the key ECB interest rates unchanged. As regards the non-standard monetary policy measures, the Eurosystem has started purchasing covered bonds and asset-backed securities. These purchase programmes will last for at least two years. The second targeted longer-term refinancing operation will be conducted shortly and will be followed by six further operations until June 2016. Taken together, the measures will have a sizeable impact on the Eurosystem’s balance sheet, which is intended to move towards the dimensions it had at the beginning of 2012.
In the coming months, the measures will further ease the monetary policy stance more broadly, support the Governing Council’s forward guidance on the key ECB interest rates and reinforce the fact that there are significant and increasing differences in the monetary policy cycle between major advanced economies. However, the latest euro area macroeconomic projections indicate lower inflation, accompanied by weaker real GDP growth and subdued monetary dynamics.
In this context, early next year the Governing Council will reassess the monetary stimulus achieved, the expansion of the balance sheet and the outlook for price developments. It will also evaluate the broader impact of recent oil price developments on medium-term inflation trends in the euro area. Should it become necessary to further address risks of too prolonged a period of low inflation, the Governing Council remains unanimous in its commitment to using additional unconventional instruments within its mandate. This would imply altering early next year the size, pace and composition of the measures. In response to the request of the Governing Council, ECB staff and the relevant Eurosystem committees have stepped up the technical preparations for further measures, which could, if needed, be implemented in a timely manner. All of the monetary policy measures are geared towards underpinning the firm anchoring of medium to long-term inflation expectations, in line with the Governing Council’s aim of achieving inflation rates below, but close to, 2%, and contribute to a return of inflation rates towards that level.
Regarding the economic analysis, real GDP in the euro area rose by 0.2%, quarter on quarter, in the third quarter of this year. This was in line with earlier indications of a weakening in the euro area’s growth momentum, leading to a downward revision of the outlook for euro area real GDP growth in the most recent forecasts. The latest data and survey evidence up to November confirm this picture of a weaker growth profile in the period ahead. At the same time, the outlook for a modest economic recovery remains in place. On the one hand, domestic demand should be supported by the monetary policy measures, the ongoing improvements in financial conditions, the progress made in fiscal consolidation and structural reforms, and significantly lower energy prices supporting real disposable income. Furthermore, demand for exports should benefit from the global recovery. On the other hand, the recovery is likely to continue to be dampened by high unemployment, sizeable unutilised capacity, and the necessary balance sheet adjustments in the public and private sectors.
These elements are reflected in the December 2014 Eurosystem staff macroeconomic projections for the euro area, which foresee annual real GDP increasing by 0.8% in 2014, 1.0% in 2015 and 1.5% in 2016. Compared with the September 2014 ECB staff macroeconomic projections, the projections for real GDP growth have been revised substantially downwards. Downward revisions were made to the projections for both domestic demand and net exports.
6ECBMonthly BulletinDecember 2014
The risks surrounding the economic outlook for the euro area are on the downside. In particular, the weak euro area growth momentum, alongside high geopolitical risks, has the potential to dampen confidence and especially private investment. In addition, insufficient progress in structural reforms in euro area countries constitutes a key downward risk to the economic outlook.
According to Eurostat’s flash estimate, euro area annual HICP inflation was 0.3% in November 2014, after 0.4% in October. Compared with the previous month, this mainly reflects a stronger fall in energy price inflation and a somewhat lower annual increase in services prices. Taking into account the current environment of very low rates of inflation, it will be important to assess the broader impact of recent oil price developments on medium-term inflation trends and to avoid spillovers to inflation expectations and wage formation.
Against the background of recent oil price developments, it is crucial to recall that forecasts and projections are based on technical assumptions, especially for oil prices and exchange rates. On the basis of information available in mid-November, at the time the December 2014 Eurosystem staff macroeconomic projections for the euro area were finalised, annual HICP inflation was foreseen to reach 0.5% in 2014, 0.7% in 2015 and 1.3% in 2016. In comparison with the September 2014 ECB staff macroeconomic projections, they have been revised significantly downwards. These revisions reflect mainly lower oil prices in euro terms and the impact of the downwardly revised outlook for growth, but they do not yet incorporate the fall in oil prices over the past few weeks following the cut-off date for the projections. Over the coming months, annual HICP inflation rates could experience renewed downward movements, given the recent further decline in oil prices.
The Governing Council will continue to closely monitor the risks to the outlook for price developments over the medium term. In this context, it will focus in particular on the possible repercussions of dampened growth dynamics, geopolitical developments, exchange rate and energy price developments, and the pass-through of the monetary policy measures. The Governing Council will be particularly vigilant as regards the broader impact of recent oil price developments on medium-term inflation trends in the euro area.
Turning to the monetary analysis, data for October 2014 support the assessment of subdued underlying growth in broad money (M3), with the annual growth rate standing at 2.5% in October, unchanged from September. Annual growth in M3 continues to be supported by its most liquid components, with the narrow monetary aggregate M1 growing at an annual rate of 6.2% in October.
The annual rate of change of loans to non-financial corporations (adjusted for loan sales and securitisation) was -1.6% in October, after -1.8% in September, showing a gradual recovery from a trough of -3.2% in February. On average over recent months, net redemptions have moderated from the historically high levels recorded a year ago. Lending to non-financial corporations continues to reflect the lagged relationship with the business cycle, credit risk, credit supply factors and the ongoing adjustment of financial and non-financial sector balance sheets. The annual growth rate of loans to households (adjusted for loan sales and securitisation) was 0.6% in October, after 0.5% in September. The monetary policy measures in place and the completion of the ECB’s comprehensive assessment should support a further stabilisation of credit flows.
To sum up, a cross-check of the outcome of the economic analysis with the signals coming from the monetary analysis confirms the need to closely monitor the risks to the outlook for price developments over the medium term and to be prepared to provide further monetary policy accommodation, if needed.

7ECB
Monthly BulletinDecember 2014
Editorial
Monetary policy is focused on maintaining price stability over the medium term and its accommodative stance contributes to supporting economic activity. However, in order to strengthen investment activity, boost job creation and raise productivity growth, other policy areas need to contribute decisively. In particular, the determined implementation of product and labour market reforms as well as actions to improve the business environment for firms need to gain momentum in several countries. It is crucial that structural reforms be implemented credibly and effectively as this will raise expectations of higher incomes and encourage firms to increase investment today and bring forward the economic recovery. Fiscal policies should support the economic recovery, while ensuring debt sustainability in compliance with the Stability and Growth Pact, which remains the anchor for confidence. All countries should use the available scope for a more growth-friendly composition of fiscal policies. The Investment Plan for Europe which the European Commission announced on 26 November 2014 will also support the recovery.
This issue of the Monthly Bulletin contains one article, entitled “December 2014 Eurosystem staff macroeconomic projections for the euro area”.

9ECB
Monthly BulletinDecember 2014
The external environment
of the euro area
Economic and monEtary dEvElopmEntseconomic anD monetary
Developments
1 the eXternal environment of the euro area
The world economy is continuing gradually along its path to recovery. Following rather subdued growth at the start of the year, momentum in some advanced economies has been firming up, supported by diminishing headwinds and accommodative policies. However, the divergence in economic prospects across and within regions has been widening, increasingly reflecting structural rather than cyclical factors, which have an influence on confidence, financial market developments and economic policies. The latest survey indicators point to some softening in growth momentum in the fourth quarter. Geopolitical risks in Ukraine/Russia and the Middle East remain elevated, although so far with limited repercussions on global activity and energy prices. Global trade remained weak in view of sluggish investment in many countries, but recovered in the third quarter, albeit from low levels. Global inflation has declined in recent months, largely on the back of sharply falling oil prices. Inflationary pressures are expected to remain low in an environment of overcapacity and declining commodity prices.
1.1 Global economic activity anD traDe
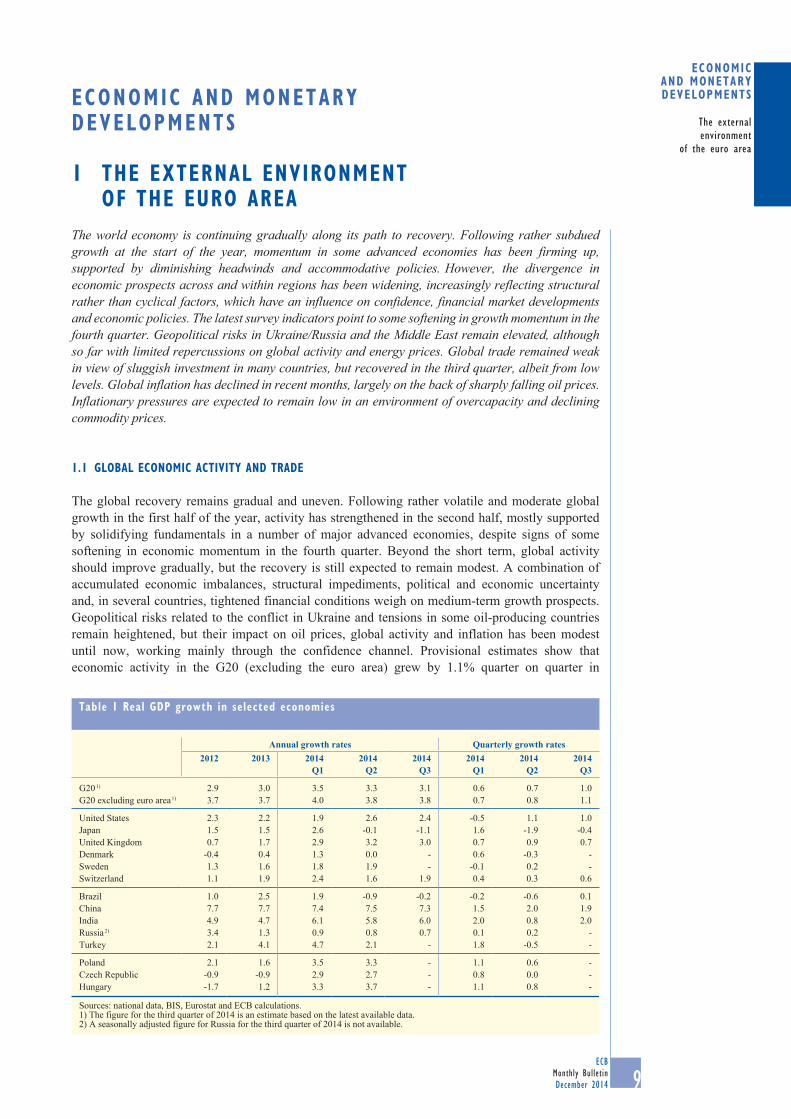
The global recovery remains gradual and uneven. Following rather volatile and moderate global growth in the first half of the year, activity has strengthened in the second half, mostly supported by solidifying fundamentals in a number of major advanced economies, despite signs of some softening in economic momentum in the fourth quarter. Beyond the short term, global activity should improve gradually, but the recovery is still expected to remain modest. A combination of accumulated economic imbalances, structural impediments, political and economic uncertainty and, in several countries, tightened financial conditions weigh on medium-term growth prospects. Geopolitical risks related to the conflict in Ukraine and tensions in some oil-producing countries remain heightened, but their impact on oil prices, global activity and inflation has been modest until now, working mainly through the confidence channel. Provisional estimates show that economic activity in the G20 (excluding the euro area) grew by 1.1% quarter on quarter in
table 1 real GDp growth in selected economies
Annual growth rates Quarterly growth rates2012 2013 2014
Q12014
Q22014
Q32014
Q12014
Q22014
Q3
G20 1) 2.9 3.0 3.5 3.3 3.1 0.6 0.7 1.0G20 excluding euro area 1) 3.7 3.7 4.0 3.8 3.8 0.7 0.8 1.1
United States 2.3 2.2 1.9 2.6 2.4 -0.5 1.1 1.0Japan 1.5 1.5 2.6 -0.1 -1.1 1.6 -1.9 -0.4United Kingdom 0.7 1.7 2.9 3.2 3.0 0.7 0.9 0.7Denmark -0.4 0.4 1.3 0.0 - 0.6 -0.3 -Sweden 1.3 1.6 1.8 1.9 - -0.1 0.2 -Switzerland 1.1 1.9 2.4 1.6 1.9 0.4 0.3 0.6
Brazil 1.0 2.5 1.9 -0.9 -0.2 -0.2 -0.6 0.1China 7.7 7.7 7.4 7.5 7.3 1.5 2.0 1.9India 4.9 4.7 6.1 5.8 6.0 2.0 0.8 2.0Russia 2) 3.4 1.3 0.9 0.8 0.7 0.1 0.2 -Turkey 2.1 4.1 4.7 2.1 - 1.8 -0.5 -
Poland 2.1 1.6 3.5 3.3 - 1.1 0.6 -Czech Republic -0.9 -0.9 2.9 2.7 - 0.8 0.0 -Hungary -1.7 1.2 3.3 3.7 - 1.1 0.8 -
Sources: national data, BIS, Eurostat and ECB calculations.1) The figure for the third quarter of 2014 is an estimate based on the latest available data.2) A seasonally adjusted figure for Russia for the third quarter of 2014 is not available.

10ECBMonthly BulletinDecember 2014
the third quarter of 2014, amid continued strong variability across countries (see Table 1). Growth strengthened in the United States and remained robust in the United Kingdom, supported by solid domestic demand. By contrast, GDP contracted in Japan for the second consecutive quarter, triggering additional quantitative easing measures by the Bank of Japan. In China, activity has moderated somewhat, mainly as a result of weakening investment. With regard to other emerging market economies, in recent quarters Brazil has experienced low growth and high inflation, while Russian growth has been hampered partly owing to tightening financial conditions and international sanctions. By contrast, India’s economy has been picking up.
The most recent global sentiment indicators point to positive, but somewhat weaker momentum in the fourth quarter. The composite output Purchasing Managers’ Index (PMI) excluding the euro area remained broadly unchanged in November at a level slightly below both its long-term average and its third-quarter reading, owing to a rather sizeable drop in the manufacturing sector (see Chart 1). The developments were mixed across countries, with significant improvements in the composite PMIs for the United Kingdom, Japan and India, but declines in the United States, China and Russia. Looking ahead the new orders component of the global composite PMI slowed slightly, suggesting a more gradual recovery in world activity in November. At the same time, the OECD’s composite leading indicators, which are designed to anticipate turning points in economic activity relative to trend, pointed to a mixed outlook across major economies in September, characterised by weakening growth in Japan, stable growth in the United States, Brazil and China, some easing in the pace of growth in the United Kingdom, albeit from high levels, and improving growth momentum in India (see Chart 2). Meanwhile, the Ifo World Economic Climate index for the fourth quarter of 2014 fell significantly, reaching its lowest level since the third quarter of 2013.
chart 1 Global pmi (excluding the euro area)
(seasonally adjusted monthly data)
25
30
35
40
45
50
55
60
65
25
30
35
40
45
50
55
60
65
2004 2005 2006 2007 2008 2009 2010 2011 2012 2013 2014
PMI output: all-industryPMI output: manufacturingPMI output: services
Source: Markit.
chart 2 composite leading indicator and industrial production
(left-hand scale: normalised index average=100; right-hand scale: three month-on-three month percentage changes)
-7
-6
-5
-4
-3
-2
-1
0
1
2
3
4
93
94
95
96
97
98
99
100
101
102
103
104
2004 2005 2006 2007 2008 2009 2010 2011 2012 2013 2014
industrial production (right-hand scale)composite leading indicator (left-hand scale)
Sources: OECD and ECB calculations.Notes: The composite leading indicator refers to the OECD countries plus Brazil, China, India, Indonesia, Russia and South Africa. The horizontal line at 100 represents the trend of economic activity. Industrial production refers to the same sample excluding Indonesia.

11ECB
Monthly BulletinDecember 2014
The external environment
of the euro area
Economic and monEtary dEvElopmEnts
Global trade is gradually recovering from low levels, although it remains rather weak. After rising at the beginning of 2014, world trade momentum lost some vigour in the second quarter of the year, which was rather strongly recouped in the third quarter. According to the CPB Netherlands Bureau for Economic Policy Analysis, the volume of world imports of goods increased by 2.1% in the third quarter. The recovery was broad-based across advanced and emerging market economies, with the main exception being the United States, where merchandise trade significantly weakened. Elsewhere, marked improvements were recorded in Japan, emerging Asia and Latin America. However, the PMI for new manufacturing export orders decreased slightly in November, pointing to some moderation in global trade momentum towards the end of the year.
Overall, the sources of the underlying weakness in global trade have shifted gradually from advanced countries to emerging market economies (see Chart 3). The shift in trade growth was prompted by a notable slowdown in emerging Asia, Latin America, Russia and central and eastern Europe owing to country-specific headwinds.
Taking a longer-term perspective, the weak response of global trade to the gradual global recovery is striking. Global trade elasticity, measured as the average growth rate of imports divided by the average growth rate of GDP has declined from 1.7 prior to the global financial crisis (between 1990 and 2007) to just 1.0 since 2011. This can be explained in part by unusually subdued investment growth, which is typically a highly trade-intensive demand component, in a number of key global economies.
Overall, the December 2014 Eurosystem staff macroeconomic projections (see the article in this issue of the Monthly Bulletin) predict only a modest strengthening in global economic growth. While some key advanced economies are benefiting from diminishing headwinds and accommodative policies, increasing structural challenges and tightening financial conditions restrain the growth outlook for emerging market economies. The recovery in global trade growth is also expected to be very gradual, with the elasticity of trade to activity remaining below its long-term average in the medium term.
The balance of risks to the global outlook remains tilted to the downside. High geopolitical risks, as well as developments in global financial markets and emerging market economies, may have the potential to negatively affect economic conditions.
1.2 Global price Developments
Global inflation has moderated since June, following a slight increase earlier in the year, with headline consumer price inflation in the OECD area stabilising at 1.7% year on year in October.
chart 3 import growth
(quarter-on-quarter percentage changes; quarterly data)
-1.0
-0.5
0.0
0.5
1.0
1.5
2.0
2.5
3.0
3.5
-1.0
-0.5
0.0
0.5
1.0
1.5
2.0
2.5
3.0
3.5
Mar. Sep. Mar. Sep. Mar. Sep. Mar.2011 2012 2013 2014
world economyadvanced economiesemerging markets
Source: ECB calculations.
12ECBMonthly BulletinDecember 2014
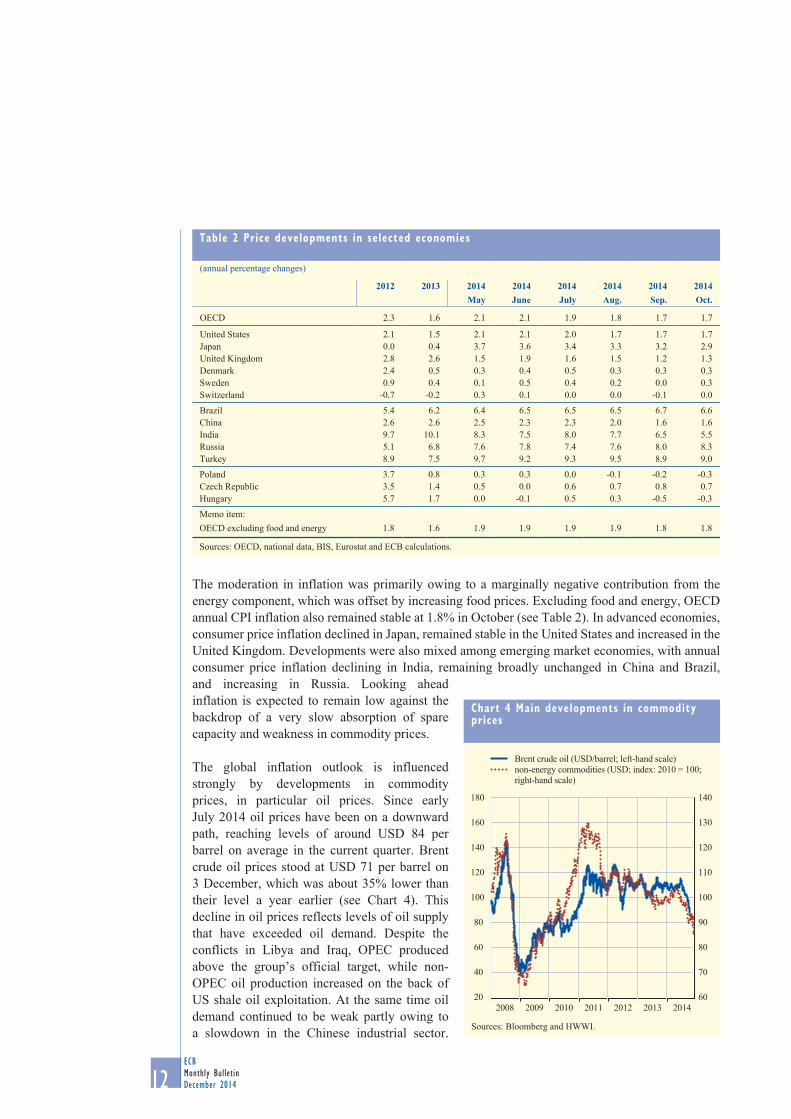
The moderation in inflation was primarily owing to a marginally negative contribution from the energy component, which was offset by increasing food prices. Excluding food and energy, OECD annual CPI inflation also remained stable at 1.8% in October (see Table 2). In advanced economies, consumer price inflation declined in Japan, remained stable in the United States and increased in the United Kingdom. Developments were also mixed among emerging market economies, with annual consumer price inflation declining in India, remaining broadly unchanged in China and Brazil, and increasing in Russia. Looking ahead inflation is expected to remain low against the backdrop of a very slow absorption of spare capacity and weakness in commodity prices.
The global inflation outlook is influenced strongly by developments in commodity prices, in particular oil prices. Since early July 2014 oil prices have been on a downward path, reaching levels of around USD 84 per barrel on average in the current quarter. Brent crude oil prices stood at USD 71 per barrel on 3 December, which was about 35% lower than their level a year earlier (see Chart 4). This decline in oil prices reflects levels of oil supply that have exceeded oil demand. Despite the conflicts in Libya and Iraq, OPEC produced above the group’s official target, while non-OPEC oil production increased on the back of US shale oil exploitation. At the same time oil demand continued to be weak partly owing to a slowdown in the Chinese industrial sector.
chart 4 main developments in commodity prices
60
70
80
90
100
110
120
130
140
20
40
60
80
100
120
140
160
180
2008 2009 2010 2011 2012 2013 2014
Brent crude oil (USD/barrel; left-hand scale)non-energy commodities (USD; index: 2010 = 100; right-hand scale)
Sources: Bloomberg and HWWI.
table 2 price developments in selected economies
(annual percentage changes)
2012 2013 2014 2014 2014 2014 2014 2014May June July Aug. Sep. Oct.
OECD 2.3 1.6 2.1 2.1 1.9 1.8 1.7 1.7
United States 2.1 1.5 2.1 2.1 2.0 1.7 1.7 1.7Japan 0.0 0.4 3.7 3.6 3.4 3.3 3.2 2.9United Kingdom 2.8 2.6 1.5 1.9 1.6 1.5 1.2 1.3Denmark 2.4 0.5 0.3 0.4 0.5 0.3 0.3 0.3Sweden 0.9 0.4 0.1 0.5 0.4 0.2 0.0 0.3Switzerland -0.7 -0.2 0.3 0.1 0.0 0.0 -0.1 0.0
Brazil 5.4 6.2 6.4 6.5 6.5 6.5 6.7 6.6China 2.6 2.6 2.5 2.3 2.3 2.0 1.6 1.6India 9.7 10.1 8.3 7.5 8.0 7.7 6.5 5.5Russia 5.1 6.8 7.6 7.8 7.4 7.6 8.0 8.3Turkey 8.9 7.5 9.7 9.2 9.3 9.5 8.9 9.0
Poland 3.7 0.8 0.3 0.3 0.0 -0.1 -0.2 -0.3Czech Republic 3.5 1.4 0.5 0.0 0.6 0.7 0.8 0.7Hungary 5.7 1.7 0.0 -0.1 0.5 0.3 -0.5 -0.3
Memo item:OECD excluding food and energy 1.8 1.6 1.9 1.9 1.9 1.9 1.8 1.8
Sources: OECD, national data, BIS, Eurostat and ECB calculations.
13ECB
Monthly BulletinDecember 2014
The external environment
of the euro area
Economic and monEtary dEvElopmEnts
Looking ahead the oil futures market expects slightly higher oil prices over the medium term, with December 2015 Brent futures contracts trading at USD 76 per barrel.
Non-energy commodity price developments have been on a slightly upward trend since the beginning of the fourth quarter, following a decline in September. Since early October non-energy prices have inched up by 2%, reflecting a 8% rise in grain prices and a 2% rise in metal prices. Unusually cold weather in the United States, as well as the ongoing conflict between two major grain suppliers, Ukraine and Russia, which is affecting both planting and trading activities, have pushed up grain prices recently. Compared with a year ago, the non-energy commodity price index in aggregate terms (denominated in USD) is currently about 8% lower, mainly owing to reduced grain prices driven by a record US harvest.
1.3 Developments in selecteD economies
uniteD statesIn the United States, economic activity gained momentum in recent quarters, after significant data volatility at the beginning of the year. Following the strong rebound in economic growth in the second quarter, solid growth was maintained in the third quarter of 2014. According to the second estimate by the Bureau of Economic Analysis, real GDP increased at an annualised rate of 3.9% (1.0% quarter on quarter), supported by both domestic and external demand. Net trade made a strong positive contribution to growth, amid a strong rise in exports and a decline in imports. Meanwhile, personal consumption expenditure and private fixed investment also contributed positively to growth, confirming the robust economic fundamentals.
Available high-frequency indicators suggest that the US economy is likely to maintain a positive growth momentum in the final quarter of 2014, although real GDP growth may slow down somewhat compared with the previous two quarters. Private consumption is supported by positive wealth effects, continued improvements in labour market conditions that lead to higher growth in disposable income, high levels of consumer sentiment and, since last summer, the significant decline in gasoline prices. The near-term outlook for business activity also remains favourable, in view of the high levels of business sentiment. As regards the housing market, recent data are consistent with a continued moderate recovery, as indicated by an increase in home sales, housing starts and building permits over the past few months. House prices, meanwhile, are maintaining their upward momentum, although lately the growth rate has been slowing somewhat, while the ratio of house prices to rent has returned to levels close to historical averages. Turning to trade, the expected strengthening in domestic demand, in particular in import-intensive expenditure components such as investment, should also lead to a pick-up in imports in the final quarter of 2014. The momentum in export growth, by contrast, is expected to be held back by the recent appreciation of the US dollar.
Looking further ahead the US economic recovery is expected to continue, with growth being above trend, supported by continued improvements in the labour and housing markets, accommodative financial conditions, and fading headwinds from household balance sheet repair and fiscal policy.
Inflation has moderated from its recent peak in May and has stabilised over the past three months. Annual headline CPI inflation stood at 1.7% in October, a decline of 0.5 percentage point since May. This reflects predominantly the unwinding of temporary factors, including a sharp decline in energy costs (from 3.4% year on year in May to -1.6% year on year in October), as well as

14ECBMonthly BulletinDecember 2014
a stabilisation in services price inflation. By contrast, inflation in the price of food and shelter increased slightly over the past five months. Annual CPI inflation excluding food and energy was broadly stable in recent months, standing at 1.8% in October. Looking ahead, inflation is expected to increase gradually, supported by slowly diminishing slack in the labour market, although the recent appreciation of the US dollar and declines in oil prices will have a dampening impact on inflation in the near term.
In the context of generally improving economic prospects, at its meeting on 28-29 October 2014, the Federal Open Market Committee (FOMC) announced the decision to conclude its asset purchase programme at the end of October. The FOMC reaffirmed that, in determining how long to maintain the 0% to ¼% target range for the federal funds rate, it “will take into account a wide range of information, including measures of labour market conditions, indicators of inflation pressures and inflation expectations, and readings on financial developments.”
Japan In Japan, economic activity was lower than expected in the third quarter, following a sharp contraction in the second quarter. According to the Cabinet Office’s first preliminary estimate, real GDP contracted unexpectedly by 0.4% in the third quarter, following a 1.9% decline in the second quarter associated with the rebalancing of activity after the consumption tax increase on 1 April 2014. The contraction in third-quarter output was mainly driven by inventories, as well as a decline in both residential and non-residential investment. Private consumption returned to growth during the third quarter, but remained subdued, while exports rebounded, following the weakness that had prevailed since the second half of 2013. As imports also increased, net trade provided only a minor contribution to growth.
Looking ahead growth is expected to resume during the fourth quarter. Latest hard data on housing starts suggest that residential investment has started to gain momentum, recovering part of its third quarter decline. Industrial production expanded by 0.2% month on month in October according to preliminary data and the manufacturing output PMI increased to 52.7.
In terms of price developments, CPI inflation has been on a downward trend since May 2014, reaching 2.9% year on year in October, as the impact from the previous depreciation of the yen dissipated and energy prices continued to fall. While the fall in energy prices should boost disposable income in the medium term, in the short run it may dampen the upward trend in prices and inflation expectations that Japan has experienced since the launch of Abenomics. Finally, the CPI excluding the direct effects of the consumption tax hike is now estimated to be at around 1% according to the Bank of Japan’s latest figures.
At its latest policy meeting on 19 November 2014 the Bank of Japan opted to leave its main policy guidelines unchanged. This followed on from its decision to expand its Quantitative and Qualitative Easing Programme in October by accelerating the annual pace of increase in the monetary base to about JPY 80 trillion (from about JPY 60-70 trillion previously). The decision was taken to pre-empt downward risks to prices stemming from the weakness in demand following the consumption tax increase and the substantial decline in oil prices.
uniteD KinGDomIn the United Kingdom, the pace of economic activity remained robust in the first three quarters of 2014. Growth was driven by strong domestic demand, in particular private consumption and housing investment, in turn supported by the decline in macroeconomic uncertainty and relatively
15ECB
Monthly BulletinDecember 2014
The external environment
of the euro area
Economic and monEtary dEvElopmEnts
loose credit conditions. The labour market continued to strengthen, and the unemployment rate declined to a five-year low of 6.0% in the three months to September, compared with more than 7% a year earlier. Looking ahead high frequency data and surveys of expectations suggest that economic growth will stay robust in the near term, even though the pace of the expansion is likely to moderate somewhat compared with the first three quarters of 2014. In the medium term the need for private and public sector balance sheet adjustments will continue to weigh on economic activity.
Inflation has remained below the Bank of England’s target of 2% in the course of 2014. Annual CPI inflation marginally increased to 1.3% in October, mainly on account of positive base effects from transport prices. Consumer price inflation excluding food and energy stayed at around 1.5% in October. Overall, inflationary pressures are expected to remain subdued, and the inflation rate is expected to decline further in the near term, reflecting falls in energy and import prices.
At its meeting on 4 December 2014 the Bank of England’s Monetary Policy Committee maintained the policy rate at 0.5% and the size of the Asset Purchase Programme at GBP 375 billion.
other european economies In Sweden, real GDP increased by 0.3% quarter on quarter in the third quarter of 2014, following 0.5% in the previous quarter. In Denmark, economic activity accelerated from 0.1% quarter on quarter in the second quarter of 2014 to 0.5% in the third quarter. In both countries, economic activity was mainly supported by domestic demand. Looking ahead real GDP growth is likely to gain strength in both countries. Turning to price developments, HICP inflation has remained broadly subdued over the past few months and stood at 0.3% in both Denmark and Sweden in October. In Switzerland, activity has lost some of its momentum since the beginning of 2014, owing to weaker domestic demand and subdued exports, while inflation has remained at around zero. Looking ahead GDP is expected to grow only modestly on the back of softening private consumption, gradually increasing investment and weak external demand conditions. However, rising disposable income, low interest rates and immigration are expected to continue to support the outlook for growth in the medium term.
In the largest central and eastern European (CEE) EU Member States, economic activity continued to expand at a varying pace in the third quarter of 2014, following robust growth overall in the first half of the year. Growth in the third quarter was particularly strong in Romania, where real GDP expanded at a quarterly rate of 1.9%, after contracting by 0.3% in the second quarter. Economic activity also remained vigorous in Poland, where the quarterly rate of change in real GDP accelerated to 0.9% in the third quarter from 0.7% in the second quarter. Czech real GDP growth also accelerated to a quarterly rate of 0.4% in the third quarter, after 0.2% in the second. In Hungary, meanwhile, real GDP growth continued to decelerate, slowing to 0.5% in the third quarter after standing at 0.8% in the previous quarter. Looking forward, economic activity in central and eastern Europe is expected to remain relatively robust, supported by gradually strengthening domestic demand. By contrast, export activity is expected to weaken, reflecting lower demand from the region’s main trading partners and trade disruptions owing to the geopolitical tensions between Russia and Ukraine. Annual HICP inflation in the CEE region generally remains subdued. Although over recent months it accelerated somewhat in the Czech Republic and Romania, it stands close to historical lows – at around zero – in Poland and Hungary. These developments are a reflection of falling food and energy prices mirroring mostly global developments and of relatively subdued domestic cost pressures.
16ECBMonthly BulletinDecember 2014
In Turkey, following a robust increase over the past year, economic activity contracted by 0.5% in quarterly terms in the second quarter of 2014, driven by broad-based weakness across components. For the remainder of the year, high frequency and leading indicators point towards a subdued pace of growth. On the positive side, the momentum in industrial production and retail sales has improved recently as the loosening of the monetary policy stance since May feeds into the economy. On the negative side, the external financial conditions have deteriorated, while foreign demand has weakened, reflecting subdued growth in the EU, escalating tensions in Iraq and softer demand from Russia. Furthermore, inflation has remained elevated, thus eroding household purchasing power.
In Russia, economic growth remained anaemic in 2014. Real GDP grew by only 0.2% quarter on quarter in the second quarter of 2014, driven by a noticeable decline in private consumption. The escalation of the conflict with Ukraine, which led to tightening financial conditions, funding and trade restrictions, accelerating inflationary pressure and heightened uncertainty, hampered growth in the second half of the year. The recent fall in oil prices is adding pressure to the economy, which is already constrained by substantial structural rigidities, with potentially negative implications for investment in energy-related projects. Consumer price inflation has continued to climb and reached 8.3% year on year in October, which is considerably above the central bank’s target of 4% (with a tolerance interval of ±1.5 percentage points). These developments mainly reflected the rouble’s sharp depreciation and rising food prices, triggering the central bank to further tighten its monetary policy stance through a series of increases in its main interest rate during the year, up to 9.5% in November in 2014 (+400 basis points since the start of the year).
emerGinG asiaThe gradual decline in GDP growth in China recorded since late 2013 continued in the third quarter. Consumption and trade were the main growth drivers, while the contribution from investment weakened, mainly reflecting a slowdown in housing investment and a moderation in credit growth. China’s housing market, although still deteriorating, is showing signs of a tentative stabilisation. The pace of decline in both housing activity and prices abated at the start of the fourth quarter following the enactment of a number of accommodating measures by central and local authorities over recent months, such as a lowering of deposit requirements and purchasing restrictions. Moreover, ongoing urbanisation and strong income growth continue to provide support.
Economy-wide price pressures are on a downward path and hovering near two-and-a-half-year lows, reflecting tepid demand and overcapacity in heavy industry. In particular, PPI inflation has been in negative territory for 32 months, which is the longest period since 1997. In line with low inflation, the People’s Bank of China lowered its benchmark lending and deposit rates on 21 November 2014 for the first time since July 2012. In keeping with the authorities’ goal to limit the rise in economy-wide leverage, credit flows have continued to moderate, in particular owing to stricter supervision over shadow banking activity. Possibly reflecting this build-up of debt, non-performing loans have been steadily rising since 2012 and soared in the third quarter of this year. However, at about 1% of outstanding loans, they are still extremely low from a historical perspective.
Turning to other emerging Asian economies, the economic recovery remains gradual, following a period of subdued growth, as the slowdown of the Chinese economy over recent months particularly affected many export-oriented countries in the region.
In India, confidence since the election of the new government remains high and stock markets continue to surge. The favourable economic sentiment is in line with the growth in GDP of 6% year on year (at market prices) in the third quarter of 2014. As a big net commodity importer, India

17ECB
Monthly BulletinDecember 2014
The external environment
of the euro area
Economic and monEtary dEvElopmEnts
benefits from falling commodity prices, while its service-driven exports are less affected by the current weakness in global demand for manufactured goods. Inflation has also been coming down sharply over the course of the year as a result of falling food and energy prices, and tight fiscal and monetary policy.
In Indonesia, the improvement in economic sentiment related to the election of the new president has not yet translated into improved economic performance, and GDP growth remained weak in the third quarter of 2014 at 1.2% quarter on quarter, mainly owing to sluggish external demand conditions. After a sharp decrease in the first eight months of the year, inflation accelerated against the backdrop of the recent cut in fuel subsidies by the new government. In response to the rise in fuel prices, Indonesia’s central bank decided to increase its policy rate by 25 basis points to 7.75%. In Korea, GDP growth improved slightly in the third quarter of 2014 (0.9% quarter on quarter), as consumption benefited from monetary and fiscal stimulus measures. However, subdued demand from China along with a weak Japanese yen has had an impact on Korea’s exports, which contracted in the third quarter, creating uncertainty with respect to Korea’s export-driven recovery. As consumer price inflation remains low, the Bank of Korea decided to further cut interest rates by 25 basis points in October.
latin americaThe slowdown in growth in Latin America continued into the second half of the year, while the divergent trends in the region have become more pronounced. Developments mainly reflect substantial domestic weaknesses, which are partially associated with lower commodities prices and higher production costs, but also with substantial imbalances in some important economies.
Brazil faces an environment of low growth and high inflation. After two quarters of negative growth, real GDP expanded only by 0.1% quarter on quarter in the third quarter of 2014, supported by government consumption and investment, whereas private consumption continued to worsen. The substantial tightening of the monetary policy stance, softer external demand, weak confidence and policy uncertainties have weighed on growth. At the same time, inflationary pressures have intensified in recent months, exceeding the 6.5% upper-bound of the inflation target, driven to a significant extent by the depreciation of the exchange rate. Together with high inflation expectations, this prompted the central bank to further increase the monetary policy interest rate to 11.25% in October (+25 basis points).
Argentina is currently in a recessionary phase. According to the monthly economic activity indicator, real output declined by -0.2% year on year in September 2014. Elevated domestic imbalances, high inflation and a weak fiscal position are hampering growth. Lower demand from Brazil, one of the Argentina’s key trading partners, and increased uncertainty after it technically defaulted on its foreign bonds at the end of October have both placed an additional burden on the economy.
By contrast, in Mexico, activity is recovering from a sharp slowdown in 2013, while benefitting from strengthened US demand, expansionary fiscal policy and low interest rates. Real GDP growth stood at 0.5% quarter on quarter in the third quarter, down from 1% in the previous quarter. The loss of momentum was mostly associated with weaknesses in both the industry and services sectors, whereas agricultural output improved. Nonetheless, the government is intensifying its efforts to implement the substantial package of structural reforms introduced since 2013 that are aimed at boosting growth in the years ahead. Annual consumer price inflation picked up in recent months, reaching 4.3% in October 2014, driven mainly by agricultural and energy prices.
18ECBMonthly BulletinDecember 2014
1.4 eXchanGe rates
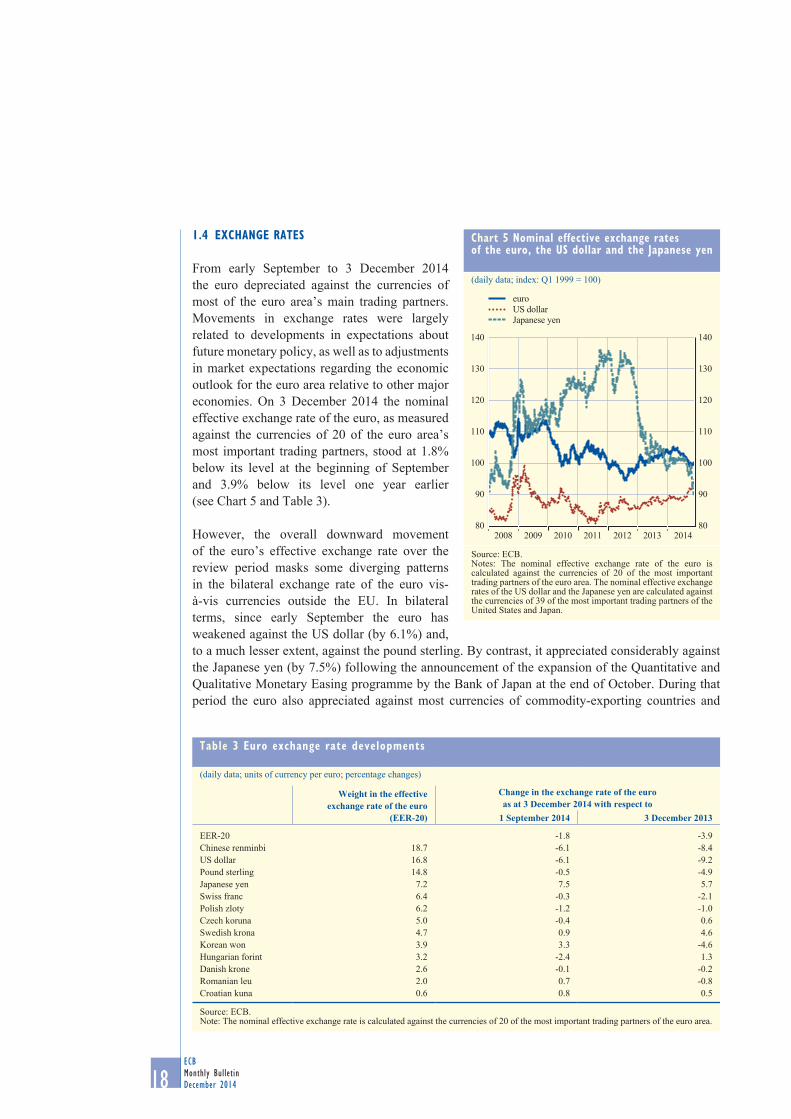
From early September to 3 December 2014 the euro depreciated against the currencies of most of the euro area’s main trading partners. Movements in exchange rates were largely related to developments in expectations about future monetary policy, as well as to adjustments in market expectations regarding the economic outlook for the euro area relative to other major economies. On 3 December 2014 the nominal effective exchange rate of the euro, as measured against the currencies of 20 of the euro area’s most important trading partners, stood at 1.8% below its level at the beginning of September and 3.9% below its level one year earlier (see Chart 5 and Table 3).
However, the overall downward movement of the euro’s effective exchange rate over the review period masks some diverging patterns in the bilateral exchange rate of the euro vis-à-vis currencies outside the EU. In bilateral terms, since early September the euro has weakened against the US dollar (by 6.1%) and, to a much lesser extent, against the pound sterling. By contrast, it appreciated considerably against the Japanese yen (by 7.5%) following the announcement of the expansion of the Quantitative and Qualitative Monetary Easing programme by the Bank of Japan at the end of October. During that period the euro also appreciated against most currencies of commodity-exporting countries and
chart 5 nominal effective exchange rates of the euro, the us dollar and the Japanese yen
(daily data; index: Q1 1999 = 100)
80
90
100
110
120
130
140
80
90
100
110
120
130
140
2008 2009 2010 2011 2012 2013 2014
euroUS dollarJapanese yen
Source: ECB.Notes: The nominal effective exchange rate of the euro is calculated against the currencies of 20 of the most important trading partners of the euro area. The nominal effective exchange rates of the US dollar and the Japanese yen are calculated against the currencies of 39 of the most important trading partners of the United States and Japan.
table 3 euro exchange rate developments
(daily data; units of currency per euro; percentage changes)
Weight in the effective exchange rate of the euro
(EER-20)
Change in the exchange rate of the euroas at 3 December 2014 with respect to
1 September 2014 3 December 2013
EER-20 -1.8 -3.9Chinese renminbi 18.7 -6.1 -8.4US dollar 16.8 -6.1 -9.2Pound sterling 14.8 -0.5 -4.9Japanese yen 7.2 7.5 5.7Swiss franc 6.4 -0.3 -2.1Polish zloty 6.2 -1.2 -1.0Czech koruna 5.0 -0.4 0.6Swedish krona 4.7 0.9 4.6Korean won 3.9 3.3 -4.6Hungarian forint 3.2 -2.4 1.3Danish krone 2.6 -0.1 -0.2Romanian leu 2.0 0.7 -0.8Croatian kuna 0.6 0.8 0.5
Source: ECB.Note: The nominal effective exchange rate is calculated against the currencies of 20 of the most important trading partners of the euro area.

19ECB
Monthly BulletinDecember 2014
The external environment
of the euro area
Economic and monEtary dEvElopmEnts
a number of currencies of emerging market economies in Asia, with the notable exception of the Chinese renminbi, against which it weakened by 6.1%. Meanwhile, since early September, the euro strengthened by 33.5% vis-à-vis the Russian rouble.
As far as the currencies of other EU Member States are concerned, the exchange rate of the euro has strengthened over the past three months against the Swedish krona (by 0.9%), the Croatian kuna (by 0.8%) and the Romanian leu (by 0.7%), but weakened against the Hungarian forint (by 2.4%) and the Polish zloty (by 1.2%). The Lithuanian litas and the Danish krone, which are participating in ERM II, have remained broadly stable against the euro, trading at, or close to, their respective central rates.
With regard to indicators of the international price and cost competitiveness of the euro area, in November 2014 the real effective exchange rate of the euro based on consumer prices was 4.0% below its level one year earlier (see Chart 6). This decline reflects both the depreciation of the nominal effective exchange rate, as well as slightly lower consumer price inflation in the euro area relative to its main trading partners.
chart 6 real effective exchange rates of the euro
(monthly/quarterly data; index: Q1 1999 = 100)
80
85
90
95
100
105
110
115
80
85
90
95
100
105
110
115
1999 2001 2003 2005 2007 2009 2011 2013
CPI-deflatedULCT-deflatedGDP-deflatedPPI-deflated
Source: ECB.Notes: the real effective exchange rates of the euro are calculated against the currencies of 20 of the most important trading partners of the euro area. The series are deflated by the Consumer Price Index (CPI), unit labour costs in the total economy (ULCT), the GDP deflator (GDP) and the Producer Price Index (PPI), respectively.

20ECBMonthly BulletinDecember 2014
2 monetary anD financial Developments2.1 money anD mfi creDit
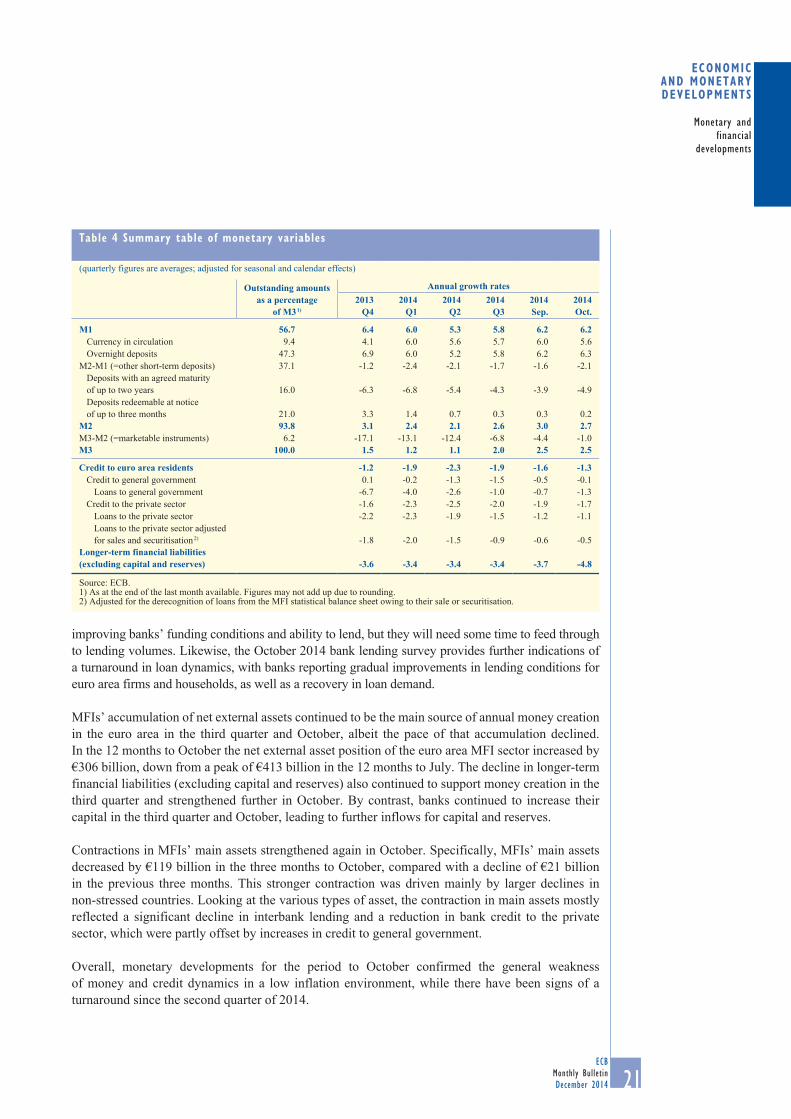
Information available for the third quarter and October 2014 provides confirmation of the continued subdued growth of underlying money and credit dynamics in a low inflation environment. At the same time, M3 growth has recovered somewhat following the trough observed in April. In addition, signs of a turning point in loan dynamics in the second quarter (particularly as regards loans to non-financial corporations) have been confirmed. In this context, the decline in uncertainty following the completion of the ECB’s comprehensive assessment and the most recent monetary policy measures are expected to support banks’ incentives to provide loans, as well as the pass-through of favourable bank funding conditions to lending conditions. As regards other counterparts of M3, money creation in the euro area was supported in the third quarter and October by a further decline in longer-term financial liabilities and a reduction in the dampening impact of contractions in credit. MFIs’ accumulation of net external assets continued to be the main source of money creation in the euro area in annual terms, albeit the pace of that accumulation declined. Contractions in MFIs’ main assets strengthened again in October, driven mainly by stronger contractions in non-stressed countries.
The annual growth rate of M3 continued to recover, standing at 2.5% in October, up from 2.0% in the third quarter and 1.1% in the second quarter (see Chart 7 and Table 4). Developments in annual M3 growth reflected money-holders’ continued preference for monetary liquidity in the presence of very low interest rates. The very low levels of remuneration for monetary assets meant that money-holders continued to prefer overnight deposits to other deposits contained in M3, supporting the robust annual growth observed for M1. At the same time, risk-return considerations may have led investors searching for yield to shift some of their monetary assets into less liquid instruments outside M3 with higher levels of remuneration, such as investment funds.
Loans to general government declined further in the third quarter, but at a slower rate. Similarly, loans to the non-financial private sector continued to display subdued dynamics in both the third quarter and October, but their rate of contraction declined further. This gives further support to the assessment that loan dynamics reached a turning point in the second quarter, particularly for loans to non-financial corporations. Such a turnaround would be consistent with the historical lead-lag relationship between sectoral MFI loans and the business cycle. In addition, lending to the private sector is expected to benefit from the reduction of uncertainty following the completion of the ECB’s recent comprehensive assessment, as well as the implementation of the non-standard monetary policy measures announced in June and September. The latter comprise, in particular, targeted longer-term refinancing operations (TLTROs), the asset-backed securities purchase programme and the third covered bond purchase programme. Those measures are aimed at
chart 7 m3 growth
(percentage changes; adjusted for seasonal and calendar effects)
-2
0
2
4
6
8
10
12
14
-21999 2001 2003 2005 2007 2009 2011 2013
M3 (annual growth rate)
M3 (six-month annualised growth rate)
M3 (three-month centred moving average of the annual growth rate)
0
2
4
6
8
10
12
14
Source: ECB.
21ECB
Monthly BulletinDecember 2014
Monetary and financial
developments
Economic and monEtary dEvElopmEnts
improving banks’ funding conditions and ability to lend, but they will need some time to feed through to lending volumes. Likewise, the October 2014 bank lending survey provides further indications of a turnaround in loan dynamics, with banks reporting gradual improvements in lending conditions for euro area firms and households, as well as a recovery in loan demand.
MFIs’ accumulation of net external assets continued to be the main source of annual money creation in the euro area in the third quarter and October, albeit the pace of that accumulation declined. In the 12 months to October the net external asset position of the euro area MFI sector increased by €306 billion, down from a peak of €413 billion in the 12 months to July. The decline in longer-term financial liabilities (excluding capital and reserves) also continued to support money creation in the third quarter and strengthened further in October. By contrast, banks continued to increase their capital in the third quarter and October, leading to further inflows for capital and reserves.
Contractions in MFIs’ main assets strengthened again in October. Specifically, MFIs’ main assets decreased by €119 billion in the three months to October, compared with a decline of €21 billion in the previous three months. This stronger contraction was driven mainly by larger declines in non-stressed countries. Looking at the various types of asset, the contraction in main assets mostly reflected a significant decline in interbank lending and a reduction in bank credit to the private sector, which were partly offset by increases in credit to general government.
Overall, monetary developments for the period to October confirmed the general weakness of money and credit dynamics in a low inflation environment, while there have been signs of a turnaround since the second quarter of 2014.
table 4 summary table of monetary variables
(quarterly figures are averages; adjusted for seasonal and calendar effects)
Outstanding amounts as a percentage
of M3 1)
Annual growth rates2013
Q42014
Q12014
Q22014
Q32014Sep.
2014Oct.
M1 56.7 6.4 6.0 5.3 5.8 6.2 6.2Currency in circulation 9.4 4.1 6.0 5.6 5.7 6.0 5.6Overnight deposits 47.3 6.9 6.0 5.2 5.8 6.2 6.3
M2-M1 (=other short-term deposits) 37.1 -1.2 -2.4 -2.1 -1.7 -1.6 -2.1Deposits with an agreed maturity of up to two years 16.0 -6.3 -6.8 -5.4 -4.3 -3.9 -4.9Deposits redeemable at notice of up to three months 21.0 3.3 1.4 0.7 0.3 0.3 0.2
M2 93.8 3.1 2.4 2.1 2.6 3.0 2.7M3-M2 (=marketable instruments) 6.2 -17.1 -13.1 -12.4 -6.8 -4.4 -1.0M3 100.0 1.5 1.2 1.1 2.0 2.5 2.5
Credit to euro area residents -1.2 -1.9 -2.3 -1.9 -1.6 -1.3Credit to general government 0.1 -0.2 -1.3 -1.5 -0.5 -0.1
Loans to general government -6.7 -4.0 -2.6 -1.0 -0.7 -1.3Credit to the private sector -1.6 -2.3 -2.5 -2.0 -1.9 -1.7
Loans to the private sector -2.2 -2.3 -1.9 -1.5 -1.2 -1.1Loans to the private sector adjusted for sales and securitisation 2) -1.8 -2.0 -1.5 -0.9 -0.6 -0.5
Longer-term financial liabilities (excluding capital and reserves) -3.6 -3.4 -3.4 -3.4 -3.7 -4.8
Source: ECB.1) As at the end of the last month available. Figures may not add up due to rounding.2) Adjusted for the derecognition of loans from the MFI statistical balance sheet owing to their sale or securitisation.
22ECBMonthly BulletinDecember 2014
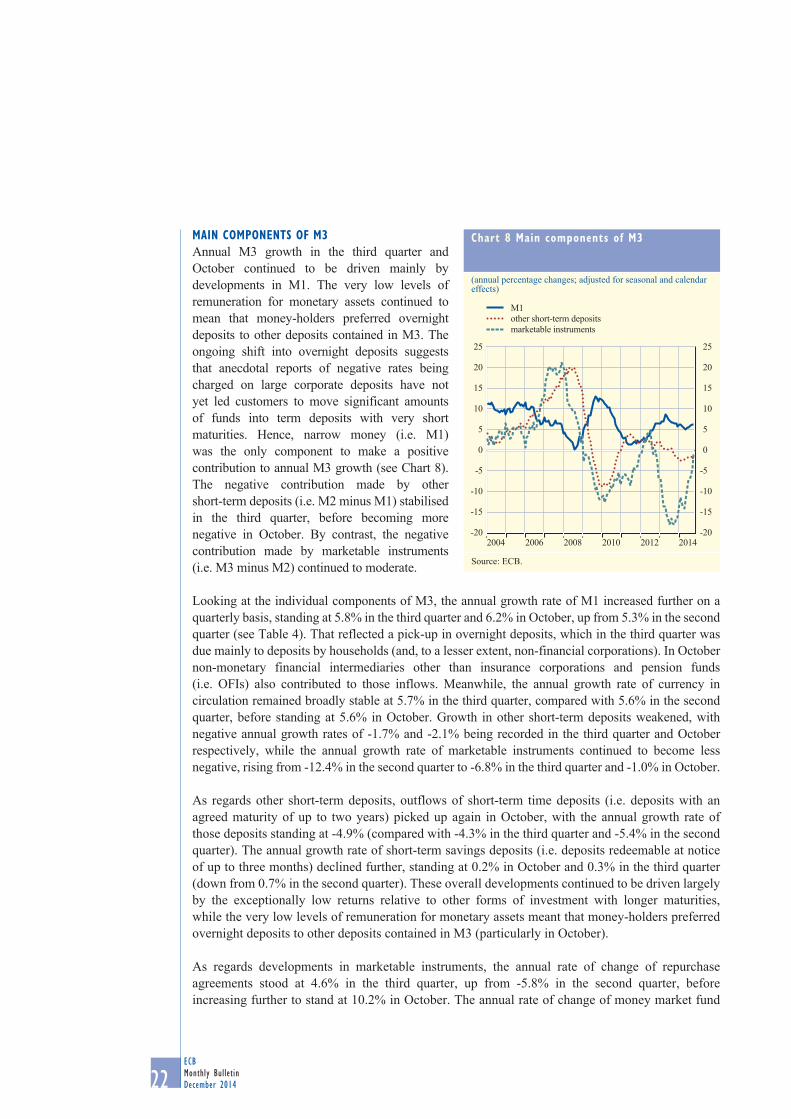
main components of m3Annual M3 growth in the third quarter and October continued to be driven mainly by developments in M1. The very low levels of remuneration for monetary assets continued to mean that money-holders preferred overnight deposits to other deposits contained in M3. The ongoing shift into overnight deposits suggests that anecdotal reports of negative rates being charged on large corporate deposits have not yet led customers to move significant amounts of funds into term deposits with very short maturities. Hence, narrow money (i.e. M1) was the only component to make a positive contribution to annual M3 growth (see Chart 8). The negative contribution made by other short-term deposits (i.e. M2 minus M1) stabilised in the third quarter, before becoming more negative in October. By contrast, the negative contribution made by marketable instruments (i.e. M3 minus M2) continued to moderate.
Looking at the individual components of M3, the annual growth rate of M1 increased further on a quarterly basis, standing at 5.8% in the third quarter and 6.2% in October, up from 5.3% in the second quarter (see Table 4). That reflected a pick-up in overnight deposits, which in the third quarter was due mainly to deposits by households (and, to a lesser extent, non-financial corporations). In October non-monetary financial intermediaries other than insurance corporations and pension funds (i.e. OFIs) also contributed to those inflows. Meanwhile, the annual growth rate of currency in circulation remained broadly stable at 5.7% in the third quarter, compared with 5.6% in the second quarter, before standing at 5.6% in October. Growth in other short-term deposits weakened, with negative annual growth rates of -1.7% and -2.1% being recorded in the third quarter and October respectively, while the annual growth rate of marketable instruments continued to become less negative, rising from -12.4% in the second quarter to -6.8% in the third quarter and -1.0% in October.
As regards other short-term deposits, outflows of short-term time deposits (i.e. deposits with an agreed maturity of up to two years) picked up again in October, with the annual growth rate of those deposits standing at -4.9% (compared with -4.3% in the third quarter and -5.4% in the second quarter). The annual growth rate of short-term savings deposits (i.e. deposits redeemable at notice of up to three months) declined further, standing at 0.2% in October and 0.3% in the third quarter (down from 0.7% in the second quarter). These overall developments continued to be driven largely by the exceptionally low returns relative to other forms of investment with longer maturities, while the very low levels of remuneration for monetary assets meant that money-holders preferred overnight deposits to other deposits contained in M3 (particularly in October).
As regards developments in marketable instruments, the annual rate of change of repurchase agreements stood at 4.6% in the third quarter, up from -5.8% in the second quarter, before increasing further to stand at 10.2% in October. The annual rate of change of money market fund
chart 8 main components of m3
(annual percentage changes; adjusted for seasonal and calendar effects)
-20
-15
-10
-5
0
5
10
15
20
25
-20
-15
-10
-5
0
5
10
15
20
25
2004 2006 2008 2010 2012 2014
M1other short-term depositsmarketable instruments
Source: ECB.
23ECB
Monthly BulletinDecember 2014
Monetary and financial
developments
Economic and monEtary dEvElopmEnts
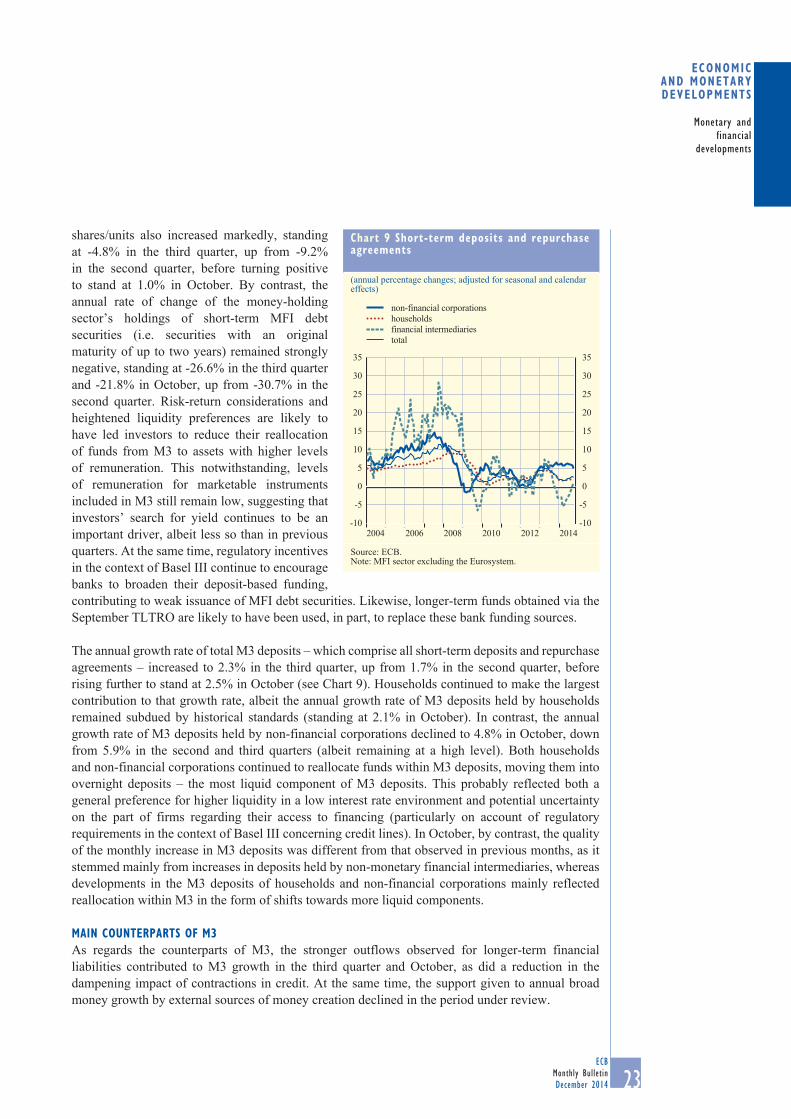
shares/units also increased markedly, standing at -4.8% in the third quarter, up from -9.2% in the second quarter, before turning positive to stand at 1.0% in October. By contrast, the annual rate of change of the money-holding sector’s holdings of short-term MFI debt securities (i.e. securities with an original maturity of up to two years) remained strongly negative, standing at -26.6% in the third quarter and -21.8% in October, up from -30.7% in the second quarter. Risk-return considerations and heightened liquidity preferences are likely to have led investors to reduce their reallocation of funds from M3 to assets with higher levels of remuneration. This notwithstanding, levels of remuneration for marketable instruments included in M3 still remain low, suggesting that investors’ search for yield continues to be an important driver, albeit less so than in previous quarters. At the same time, regulatory incentives in the context of Basel III continue to encourage banks to broaden their deposit-based funding, contributing to weak issuance of MFI debt securities. Likewise, longer-term funds obtained via the September TLTRO are likely to have been used, in part, to replace these bank funding sources.
The annual growth rate of total M3 deposits – which comprise all short-term deposits and repurchase agreements – increased to 2.3% in the third quarter, up from 1.7% in the second quarter, before rising further to stand at 2.5% in October (see Chart 9). Households continued to make the largest contribution to that growth rate, albeit the annual growth rate of M3 deposits held by households remained subdued by historical standards (standing at 2.1% in October). In contrast, the annual growth rate of M3 deposits held by non-financial corporations declined to 4.8% in October, down from 5.9% in the second and third quarters (albeit remaining at a high level). Both households and non-financial corporations continued to reallocate funds within M3 deposits, moving them into overnight deposits – the most liquid component of M3 deposits. This probably reflected both a general preference for higher liquidity in a low interest rate environment and potential uncertainty on the part of firms regarding their access to financing (particularly on account of regulatory requirements in the context of Basel III concerning credit lines). In October, by contrast, the quality of the monthly increase in M3 deposits was different from that observed in previous months, as it stemmed mainly from increases in deposits held by non-monetary financial intermediaries, whereas developments in the M3 deposits of households and non-financial corporations mainly reflected reallocation within M3 in the form of shifts towards more liquid components.
main counterparts of m3As regards the counterparts of M3, the stronger outflows observed for longer-term financial liabilities contributed to M3 growth in the third quarter and October, as did a reduction in the dampening impact of contractions in credit. At the same time, the support given to annual broad money growth by external sources of money creation declined in the period under review.
chart 9 short-term deposits and repurchase agreements
(annual percentage changes; adjusted for seasonal and calendar effects)
-10
-5
0
5
10
15
20
25
30
35
-10
-5
0
5
10
15
20
25
30
35
2004 2006 2008 2010 2012 2014
non-financial corporationshouseholdsfinancial intermediariestotal
Source: ECB.Note: MFI sector excluding the Eurosystem.

24ECBMonthly BulletinDecember 2014
The annual rate of change of MFI credit to general government declined further in the third quarter (standing at -1.5%, down from -1.3% in the second quarter), but then recovered to stand at -0.1% in October (see Table 4).
Meanwhile, the annual growth rate of MFI credit to the private sector continued its gradual recovery, standing at -1.7% in October, up from -2.0% in the third quarter and -2.5% in the second quarter. Looking at its components, the annual rate of change of securities other than shares remained strongly negative, standing at -8.0% in October, compared with -7.8% in the third quarter and -8.1% in the second quarter. The annual growth rate of shares and other equity increased to 2.5% in October, up from 2.1% in the third quarter and 0.1% in the second quarter. When adjusted for loan sales and securitisation, the annual rate of change of loans to the private sector increased to -0.5% in October, up from -0.9% in the third quarter and -1.5% in the second quarter. From a sectoral perspective, the annual growth rate of loans to households increased slightly further in the third quarter and October, thereby remaining modestly positive, whereas the annual growth rates of loans to non-financial corporations and loans to non-monetary financial intermediaries remained in negative territory (albeit they also increased). Developments in all three sectors were broadly based across euro area countries.
The annual growth rate of MFI loans to households (adjusted for loan sales and securitisation) has remained broadly stable in recent quarters (albeit increasing marginally), standing at 0.6% in October, compared with 0.5% in the third quarter and 0.4% in the second. The sum of the flows for consumer credit and other lending to households remained broadly unchanged in the third quarter and October. By contrast, lending for house purchase made a positive contribution in the third quarter and October. This is consistent with indications from the bank lending survey and house price developments suggesting a gradual strengthening in the housing loan market.
The annual rate of change of MFI loans to non-financial corporations (adjusted for loan sales and securitisation) recovered further (albeit remaining in negative territory), standing at -1.6% in October, up from -2.1% in the third quarter and -2.7% in the second. This reflected a further increase in the contribution made by loans with short maturities. From a longer-term perspective, the developments observed for loans to non-financial corporations in October are consistent with the assessment that there was a turning point in the annual dynamics of such loans in the second quarter of 2014, while at the same time showing a stabilisation of monthly flows at small but negative values (particularly for stressed countries).
More generally, both supply and demand factors continue to weigh on euro area bank lending, albeit with considerable cross-country heterogeneity. Fragmentation of financial markets along national lines continues to contribute to the elevated borrowing costs suffered by the non-financial sectors of some countries, thereby dampening private sector spending and capital expenditure. In addition, deleveraging needs in the private sector may also be weakening demand for credit in several countries. Finally, against the backdrop of limited access to bank financing in some countries, firms have increasingly resorted to alternative sources of funding – such as internal funds and, for larger non-financial corporations, direct access to capital markets (see Section 2.6).
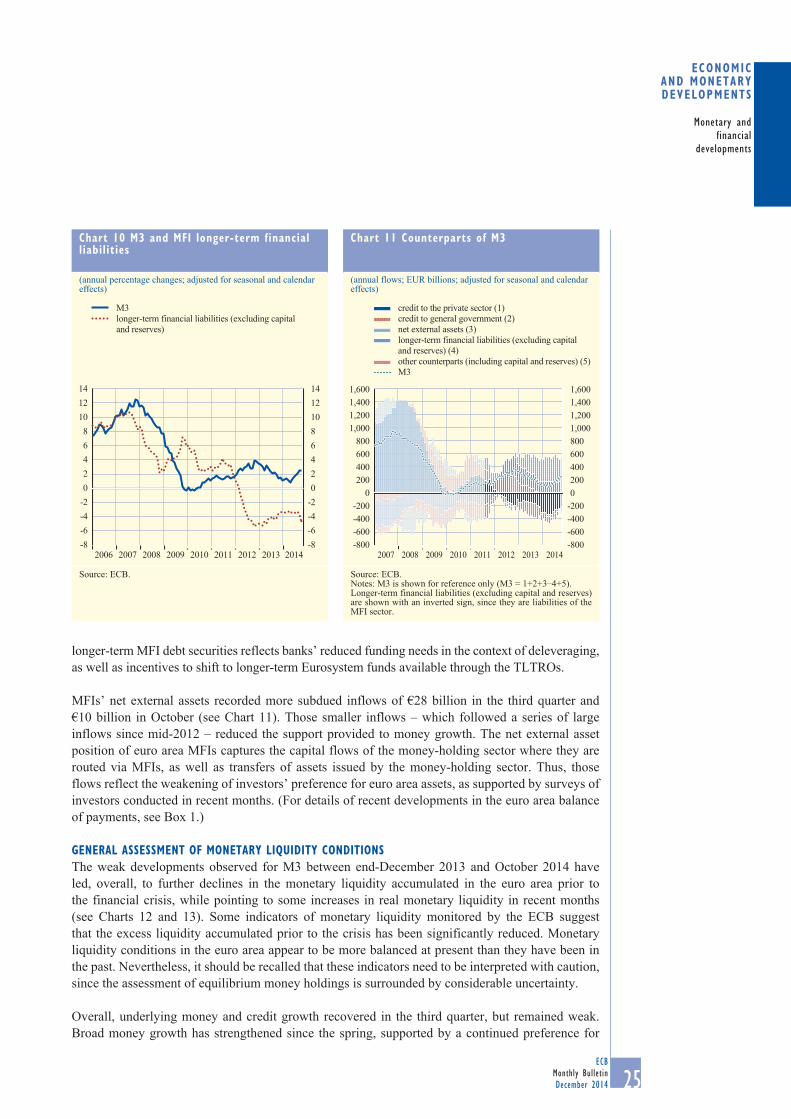
Turning to the other counterparts of M3, the annual rate of change of MFIs’ longer-term financial liabilities (excluding capital and reserves) declined further to stand at -4.8% in October, down from -3.4% in both the second and third quarters (see Chart 10). That ongoing contraction in MFIs’ longer-term financial liabilities provides additional support for M3 growth, particularly as regards shifts from longer-term deposits to overnight deposits. At the same time, that reduction in
25ECB
Monthly BulletinDecember 2014
Monetary and financial
developments
Economic and monEtary dEvElopmEnts
longer-term MFI debt securities reflects banks’ reduced funding needs in the context of deleveraging, as well as incentives to shift to longer-term Eurosystem funds available through the TLTROs.
MFIs’ net external assets recorded more subdued inflows of €28 billion in the third quarter and €10 billion in October (see Chart 11). Those smaller inflows – which followed a series of large inflows since mid-2012 – reduced the support provided to money growth. The net external asset position of euro area MFIs captures the capital flows of the money-holding sector where they are routed via MFIs, as well as transfers of assets issued by the money-holding sector. Thus, those flows reflect the weakening of investors’ preference for euro area assets, as supported by surveys of investors conducted in recent months. (For details of recent developments in the euro area balance of payments, see Box 1.)
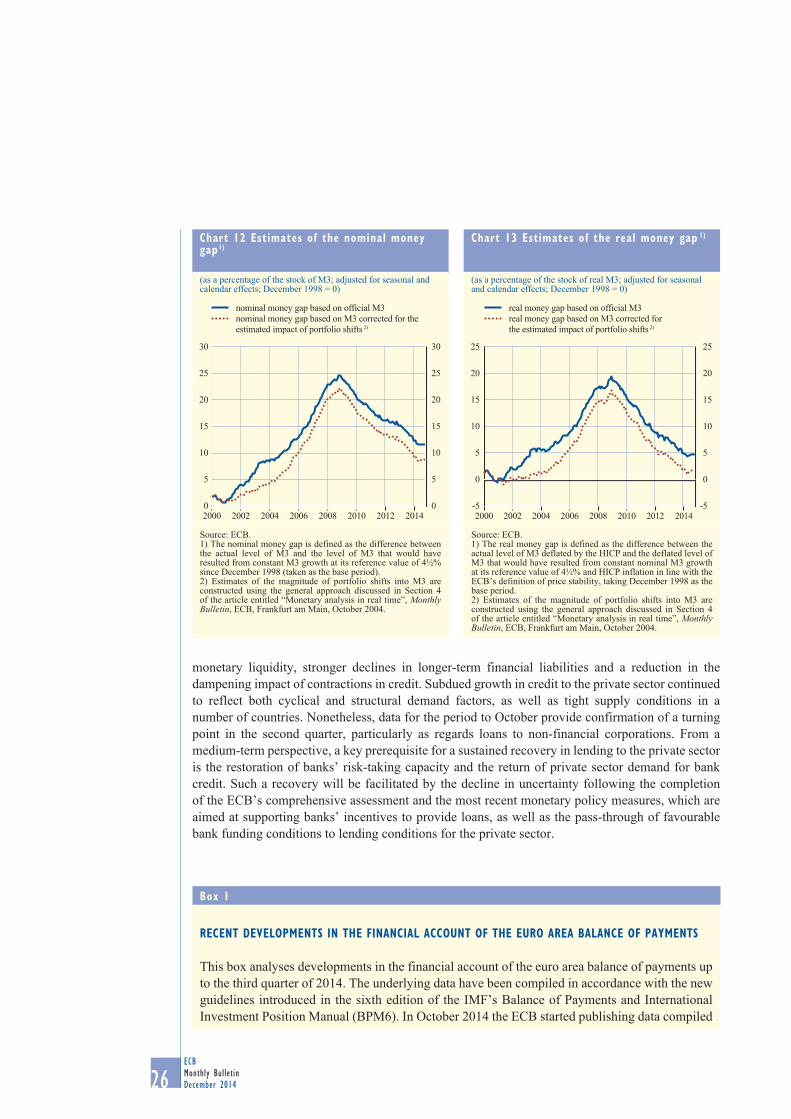
General assessment of monetary liquiDity conDitions The weak developments observed for M3 between end-December 2013 and October 2014 have led, overall, to further declines in the monetary liquidity accumulated in the euro area prior to the financial crisis, while pointing to some increases in real monetary liquidity in recent months (see Charts 12 and 13). Some indicators of monetary liquidity monitored by the ECB suggest that the excess liquidity accumulated prior to the crisis has been significantly reduced. Monetary liquidity conditions in the euro area appear to be more balanced at present than they have been in the past. Nevertheless, it should be recalled that these indicators need to be interpreted with caution, since the assessment of equilibrium money holdings is surrounded by considerable uncertainty.
Overall, underlying money and credit growth recovered in the third quarter, but remained weak. Broad money growth has strengthened since the spring, supported by a continued preference for
chart 10 m3 and mfi longer-term financial liabilities
(annual percentage changes; adjusted for seasonal and calendar effects)
-8-6-4-202468101214
-8-6-4-202468
101214
2006 2008 2010 20122007 2009 2011 2013 2014
M3longer-term financial liabilities (excluding capital and reserves)
Source: ECB.
chart 11 counterparts of m3
(annual flows; EUR billions; adjusted for seasonal and calendar effects)
-800-600-400-20002004006008001,0001,2001,4001,600
-800-600-400-200
0200400600800
1,0001,2001,4001,600
2007 2008 2009 2010 2011 2012 2013 2014
credit to the private sector (1)credit to general government (2)net external assets (3)longer-term financial liabilities (excluding capital and reserves) (4)other counterparts (including capital and reserves) (5)M3
Source: ECB. Notes: M3 is shown for reference only (M3 = 1+2+3–4+5).Longer-term financial liabilities (excluding capital and reserves) are shown with an inverted sign, since they are liabilities of the MFI sector.
26ECBMonthly BulletinDecember 2014
monetary liquidity, stronger declines in longer-term financial liabilities and a reduction in the dampening impact of contractions in credit. Subdued growth in credit to the private sector continued to reflect both cyclical and structural demand factors, as well as tight supply conditions in a number of countries. Nonetheless, data for the period to October provide confirmation of a turning point in the second quarter, particularly as regards loans to non-financial corporations. From a medium-term perspective, a key prerequisite for a sustained recovery in lending to the private sector is the restoration of banks’ risk-taking capacity and the return of private sector demand for bank credit. Such a recovery will be facilitated by the decline in uncertainty following the completion of the ECB’s comprehensive assessment and the most recent monetary policy measures, which are aimed at supporting banks’ incentives to provide loans, as well as the pass-through of favourable bank funding conditions to lending conditions for the private sector.
chart 12 estimates of the nominal money gap1)
(as a percentage of the stock of M3; adjusted for seasonal and calendar effects; December 1998 = 0)
0
5
10
15
20
25
30
0
5
10
15
20
25
30
2000 2002 2004 2006 2008 2010 2012 2014
nominal money gap based on official M3nominal money gap based on M3 corrected for the estimated impact of portfolio shifts 2)
Source: ECB.1) The nominal money gap is defined as the difference between the actual level of M3 and the level of M3 that would have resulted from constant M3 growth at its reference value of 4½% since December 1998 (taken as the base period).2) Estimates of the magnitude of portfolio shifts into M3 are constructed using the general approach discussed in Section 4 of the article entitled “Monetary analysis in real time”, Monthly Bulletin, ECB, Frankfurt am Main, October 2004.
chart 13 estimates of the real money gap 1)
(as a percentage of the stock of real M3; adjusted for seasonal and calendar effects; December 1998 = 0)
-5
0
5
10
15
20
25
-5
0
5
10
15
20
25
2000 2002 2004 2006 2008 2010 2012 2014
real money gap based on official M3real money gap based on M3 corrected for the estimated impact of portfolio shifts 2)
Source: ECB.1) The real money gap is defined as the difference between the actual level of M3 deflated by the HICP and the deflated level of M3 that would have resulted from constant nominal M3 growth at its reference value of 4½% and HICP inflation in line with the ECB’s definition of price stability, taking December 1998 as the base period.2) Estimates of the magnitude of portfolio shifts into M3 are constructed using the general approach discussed in Section 4 of the article entitled “Monetary analysis in real time”, Monthly Bulletin, ECB, Frankfurt am Main, October 2004.
box 1
recent Developments in the financial account of the euro area balance of payments
This box analyses developments in the financial account of the euro area balance of payments up to the third quarter of 2014. The underlying data have been compiled in accordance with the new guidelines introduced in the sixth edition of the IMF’s Balance of Payments and International Investment Position Manual (BPM6). In October 2014 the ECB started publishing data compiled
27ECB
Monthly BulletinDecember 2014
Monetary and financial
developments
Economic and monEtary dEvElopmEnts
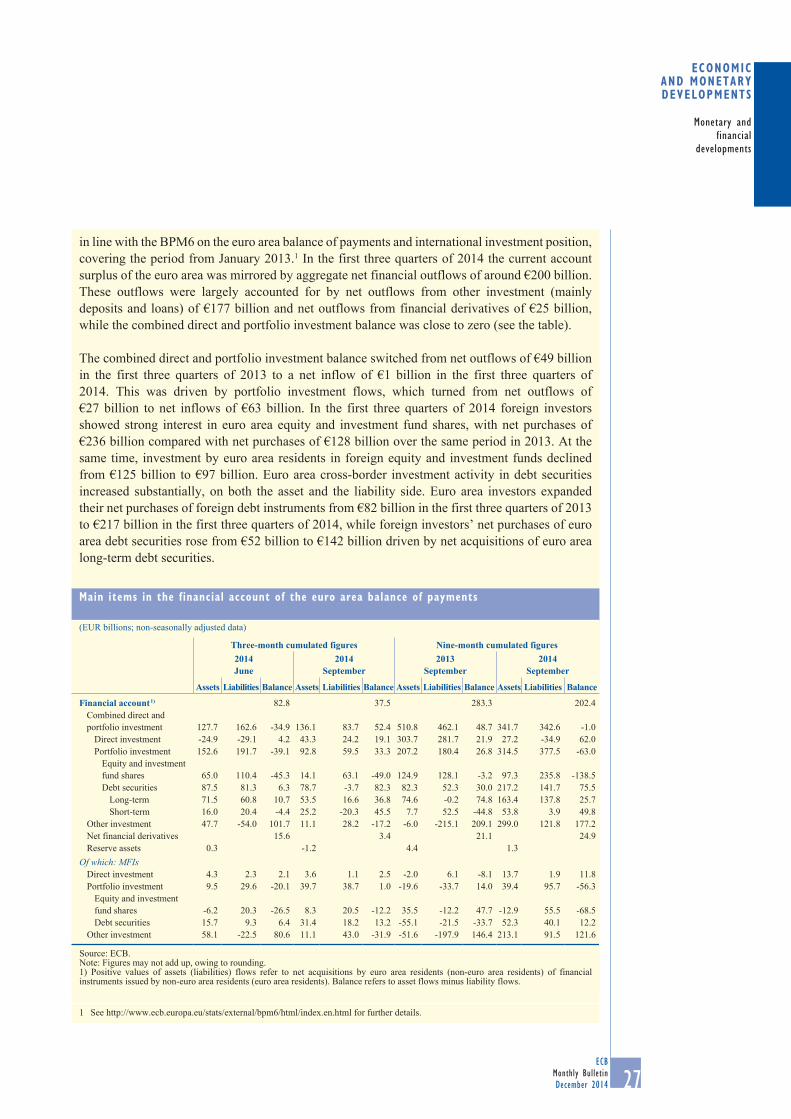
in line with the BPM6 on the euro area balance of payments and international investment position, covering the period from January 2013.1 In the first three quarters of 2014 the current account surplus of the euro area was mirrored by aggregate net financial outflows of around €200 billion. These outflows were largely accounted for by net outflows from other investment (mainly deposits and loans) of €177 billion and net outflows from financial derivatives of €25 billion, while the combined direct and portfolio investment balance was close to zero (see the table).
The combined direct and portfolio investment balance switched from net outflows of €49 billion in the first three quarters of 2013 to a net inflow of €1 billion in the first three quarters of 2014. This was driven by portfolio investment flows, which turned from net outflows of €27 billion to net inflows of €63 billion. In the first three quarters of 2014 foreign investors showed strong interest in euro area equity and investment fund shares, with net purchases of €236 billion compared with net purchases of €128 billion over the same period in 2013. At the same time, investment by euro area residents in foreign equity and investment funds declined from €125 billion to €97 billion. Euro area cross-border investment activity in debt securities increased substantially, on both the asset and the liability side. Euro area investors expanded their net purchases of foreign debt instruments from €82 billion in the first three quarters of 2013 to €217 billion in the first three quarters of 2014, while foreign investors’ net purchases of euro area debt securities rose from €52 billion to €142 billion driven by net acquisitions of euro area long-term debt securities.
1 See http://www.ecb.europa.eu/stats/external/bpm6/html/index.en.html for further details.
main items in the financial account of the euro area balance of payments
(EUR billions; non-seasonally adjusted data)
Three-month cumulated figures Nine-month cumulated figures2014June
2014September
2013September
2014September
Assets Liabilities Balance Assets Liabilities Balance Assets Liabilities Balance Assets Liabilities Balance
Financial account 1) 82.8 37.5 283.3 202.4 Combined direct and portfolio investment 127.7 162.6 -34.9 136.1 83.7 52.4 510.8 462.1 48.7 341.7 342.6 -1.0
Direct investment -24.9 -29.1 4.2 43.3 24.2 19.1 303.7 281.7 21.9 27.2 -34.9 62.0 Portfolio investment 152.6 191.7 -39.1 92.8 59.5 33.3 207.2 180.4 26.8 314.5 377.5 -63.0
Equity and investment fund shares 65.0 110.4 -45.3 14.1 63.1 -49.0 124.9 128.1 -3.2 97.3 235.8 -138.5 Debt securities 87.5 81.3 6.3 78.7 -3.7 82.3 82.3 52.3 30.0 217.2 141.7 75.5
Long-term 71.5 60.8 10.7 53.5 16.6 36.8 74.6 -0.2 74.8 163.4 137.8 25.7 Short-term 16.0 20.4 -4.4 25.2 -20.3 45.5 7.7 52.5 -44.8 53.8 3.9 49.8
Other investment 47.7 -54.0 101.7 11.1 28.2 -17.2 -6.0 -215.1 209.1 299.0 121.8 177.2 Net financial derivatives 15.6 3.4 21.1 24.9 Reserve assets 0.3 -1.2 4.4 1.3
Of which: MFIsDirect investment 4.3 2.3 2.1 3.6 1.1 2.5 -2.0 6.1 -8.1 13.7 1.9 11.8 Portfolio investment 9.5 29.6 -20.1 39.7 38.7 1.0 -19.6 -33.7 14.0 39.4 95.7 -56.3
Equity and investment fund shares -6.2 20.3 -26.5 8.3 20.5 -12.2 35.5 -12.2 47.7 -12.9 55.5 -68.5 Debt securities 15.7 9.3 6.4 31.4 18.2 13.2 -55.1 -21.5 -33.7 52.3 40.1 12.2
Other investment 58.1 -22.5 80.6 11.1 43.0 -31.9 -51.6 -197.9 146.4 213.1 91.5 121.6
Source: ECB.Note: Figures may not add up, owing to rounding.1) Positive values of assets (liabilities) flows refer to net acquisitions by euro area residents (non-euro area residents) of financial instruments issued by non-euro area residents (euro area residents). Balance refers to asset flows minus liability flows.
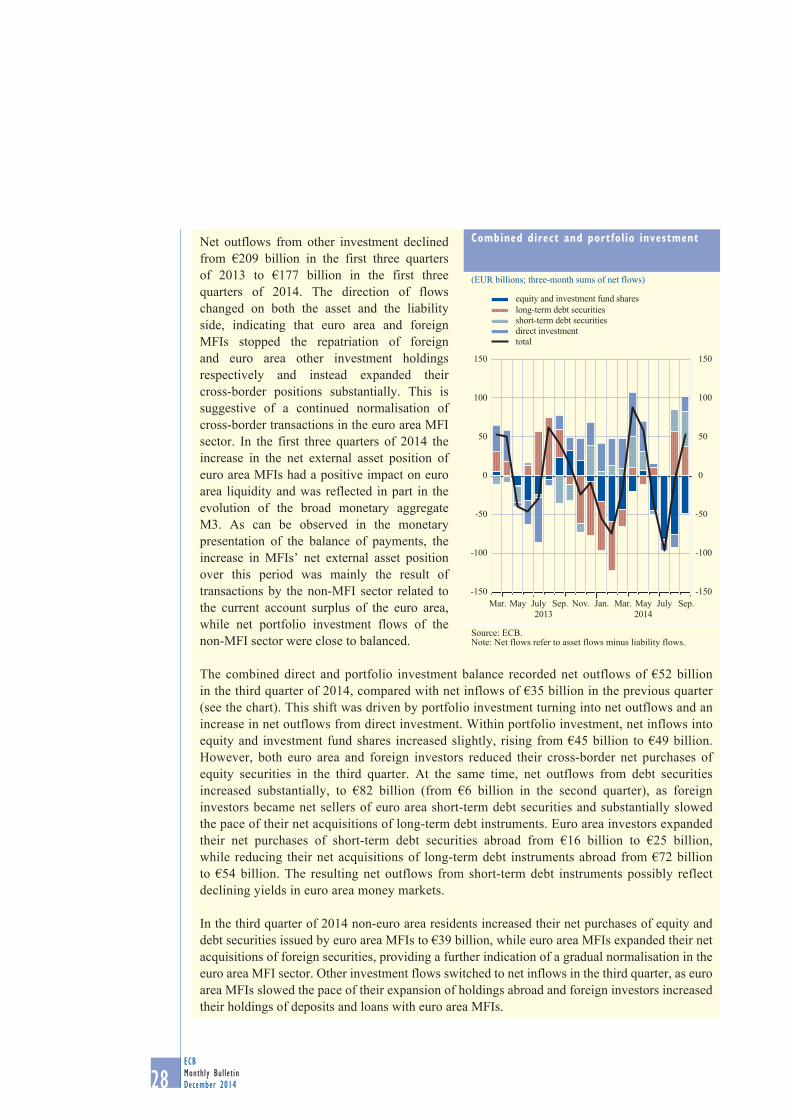
28ECBMonthly BulletinDecember 2014
Net outflows from other investment declined from €209 billion in the first three quarters of 2013 to €177 billion in the first three quarters of 2014. The direction of flows changed on both the asset and the liability side, indicating that euro area and foreign MFIs stopped the repatriation of foreign and euro area other investment holdings respectively and instead expanded their cross-border positions substantially. This is suggestive of a continued normalisation of cross-border transactions in the euro area MFI sector. In the first three quarters of 2014 the increase in the net external asset position of euro area MFIs had a positive impact on euro area liquidity and was reflected in part in the evolution of the broad monetary aggregate M3. As can be observed in the monetary presentation of the balance of payments, the increase in MFIs’ net external asset position over this period was mainly the result of transactions by the non-MFI sector related to the current account surplus of the euro area, while net portfolio investment flows of the non-MFI sector were close to balanced.
The combined direct and portfolio investment balance recorded net outflows of €52 billion in the third quarter of 2014, compared with net inflows of €35 billion in the previous quarter (see the chart). This shift was driven by portfolio investment turning into net outflows and an increase in net outflows from direct investment. Within portfolio investment, net inflows into equity and investment fund shares increased slightly, rising from €45 billion to €49 billion. However, both euro area and foreign investors reduced their cross-border net purchases of equity securities in the third quarter. At the same time, net outflows from debt securities increased substantially, to €82 billion (from €6 billion in the second quarter), as foreign investors became net sellers of euro area short-term debt securities and substantially slowed the pace of their net acquisitions of long-term debt instruments. Euro area investors expanded their net purchases of short-term debt securities abroad from €16 billion to €25 billion, while reducing their net acquisitions of long-term debt instruments abroad from €72 billion to €54 billion. The resulting net outflows from short-term debt instruments possibly reflect declining yields in euro area money markets.
In the third quarter of 2014 non-euro area residents increased their net purchases of equity and debt securities issued by euro area MFIs to €39 billion, while euro area MFIs expanded their net acquisitions of foreign securities, providing a further indication of a gradual normalisation in the euro area MFI sector. Other investment flows switched to net inflows in the third quarter, as euro area MFIs slowed the pace of their expansion of holdings abroad and foreign investors increased their holdings of deposits and loans with euro area MFIs.
combined direct and portfolio investment
(EUR billions; three-month sums of net flows)
-150
-100
-50
0
50
100
150
-150
-100
-50
0
50
100
150
equity and investment fund shareslong-term debt securitiesshort-term debt securitiesdirect investmenttotal
Mar. May July Sep. Mar. May July Sep.Nov. Jan.2013 2014
Source: ECB.Note: Net flows refer to asset flows minus liability flows.

29ECB
Monthly BulletinDecember 2014
Monetary and financial
developments
Economic and monEtary dEvElopmEnts
2.2 financial investment of the non-financial sectors anD institutional investors
The annual growth rate of financial investment by the non-financial sectors increased slightly in the second quarter of 2014. Weak economic conditions and subdued developments in disposable income partly explain the weak growth in financial investment. The annual growth rate of financial investment by insurance corporations and pension funds rose in the second quarter of 2014. In the third quarter, investment funds continued to register significant inflows, particularly in the bond market.
non-financial sectorsIn the second quarter of 2014 (the most recent quarter for which integrated euro area accounts data are available) the annual growth rate of total financial investment by the non-financial sectors increased slightly to stand at 1.6%, up from 1.5% in the first quarter of the year (see Table 5). Weak economic conditions and subdued developments in disposable income partly explain the weak growth in financial investment. A breakdown by financial instrument shows that the annual growth rate of investment in debt securities (excluding financial derivatives) declined somewhat in the second quarter.
A breakdown by sector (see Chart 14) reveals that the annual growth rate of investment in financial assets by households and non-financial corporations weakened in the second quarter, while the annual growth rate of financial investment by the general government sector increased further. Detailed information on developments in the financial flows and balance sheets of the non-financial private sector is provided in Sections 2.6 and 2.7.
table 5 financial investment of the euro area non-financial sectors
Outstanding amount as a percentage of financial assets 1)
Annual growth rates2011
Q42012
Q12012
Q22012
Q32012
Q42013
Q12013
Q22013
Q32013
Q42014
Q12014
Q2
Financial investment 100 2.4 2.4 2.3 2.4 2.3 2.3 2.0 1.9 1.5 1.5 1.6Currency and deposits 24 3.1 4.1 3.5 3.6 3.5 2.6 2.9 2.9 2.4 2.7 2.8Debt securities, excluding financial derivatives 5 2.8 1.1 0.9 -0.4 -5.4 -7.8 -10.0 -10.8 -10.0 -8.0 -8.5
of which: short-term 0 14.6 13.6 15.5 15.0 -7.4 -15.6 -20.8 -25.2 -17.7 -8.3 -6.0of which: long-term 4 1.5 -0.3 -0.8 -2.1 -5.2 -6.8 -8.5 -8.9 -9.1 -7.9 -8.7
Shares and other equity, excluding mutual fund shares 30 3.4 3.5 3.0 2.8 2.1 2.3 1.6 1.5 0.8 0.3 0.4
of which: quoted shares 6 2.1 2.8 3.4 0.9 0.5 0.3 2.0 2.1 1.8 1.2 -0.9of which: unquoted shares and other equity 25 3.8 3.7 3.0 3.2 2.4 2.7 1.5 1.4 0.6 0.1 0.7
Mutual fund shares 4 -9.0 -6.6 -5.6 -3.1 0.3 1.8 3.4 3.6 2.7 1.9 3.5Insurance technical reserves 16 2.1 1.8 1.9 2.0 2.4 2.6 2.7 2.8 2.8 2.8 2.9Other 2) 21 2.8 1.5 2.2 2.4 3.5 4.2 3.9 3.3 2.9 2.8 3.0
M3 3) 1.6 2.8 3.0 2.8 3.5 2.5 2.4 2.0 1.0 1.0 1.6
Source: ECB.1) As at the end of the last quarter available. Figures may not add up due to rounding.2) Other financial assets comprise loans and other accounts receivable, which in turn include trade credit granted by non-financial corporations.3) End of quarter. The monetary aggregate M3 includes monetary instruments held by euro area non-MFIs (i.e. the non-financial sectors and non-monetary financial intermediaries) with euro area MFIs and central government.
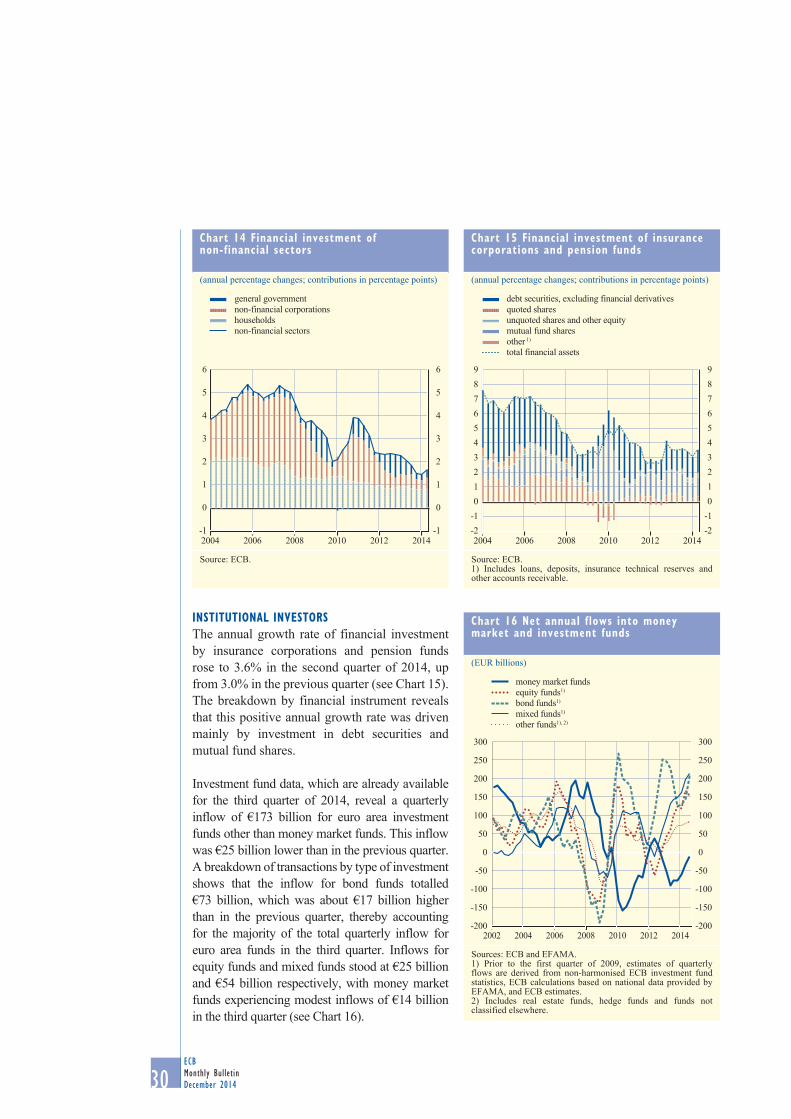
30ECBMonthly BulletinDecember 2014
institutional investorsThe annual growth rate of financial investment by insurance corporations and pension funds rose to 3.6% in the second quarter of 2014, up from 3.0% in the previous quarter (see Chart 15). The breakdown by financial instrument reveals that this positive annual growth rate was driven mainly by investment in debt securities and mutual fund shares.
Investment fund data, which are already available for the third quarter of 2014, reveal a quarterly inflow of €173 billion for euro area investment funds other than money market funds. This inflow was €25 billion lower than in the previous quarter. A breakdown of transactions by type of investment shows that the inflow for bond funds totalled €73 billion, which was about €17 billion higher than in the previous quarter, thereby accounting for the majority of the total quarterly inflow for euro area funds in the third quarter. Inflows for equity funds and mixed funds stood at €25 billion and €54 billion respectively, with money market funds experiencing modest inflows of €14 billion in the third quarter (see Chart 16).
chart 14 financial investment of non-financial sectors
(annual percentage changes; contributions in percentage points)
-1
0
1
2
3
4
5
6
-1
0
1
2
3
4
5
6
2004 2006 2008 2010 2012 2014
general governmentnon-financial corporationshouseholdsnon-financial sectors
Source: ECB.
chart 15 financial investment of insurance corporations and pension funds
(annual percentage changes; contributions in percentage points)
-2-10123456789
-2-10123456789
2004 2006 2008 2010 2012 2014
debt securities, excluding financial derivativesquoted sharesunquoted shares and other equitymutual fund sharesother 1)
total financial assets
Source: ECB.1) Includes loans, deposits, insurance technical reserves and other accounts receivable.
chart 16 net annual flows into money market and investment funds
(EUR billions)
-200
-150
-100
-50
0
50
100
150
200
250
300
-200
-150
-100
-50
0
50
100
150
200
250
300
2002 2004 2006 2008 2010 2012 2014
money market fundsequity funds1)
bond funds1)
mixed funds1)
other funds1), 2)
Sources: ECB and EFAMA.1) Prior to the first quarter of 2009, estimates of quarterly flows are derived from non-harmonised ECB investment fund statistics, ECB calculations based on national data provided by EFAMA, and ECB estimates.2) Includes real estate funds, hedge funds and funds not classified elsewhere.
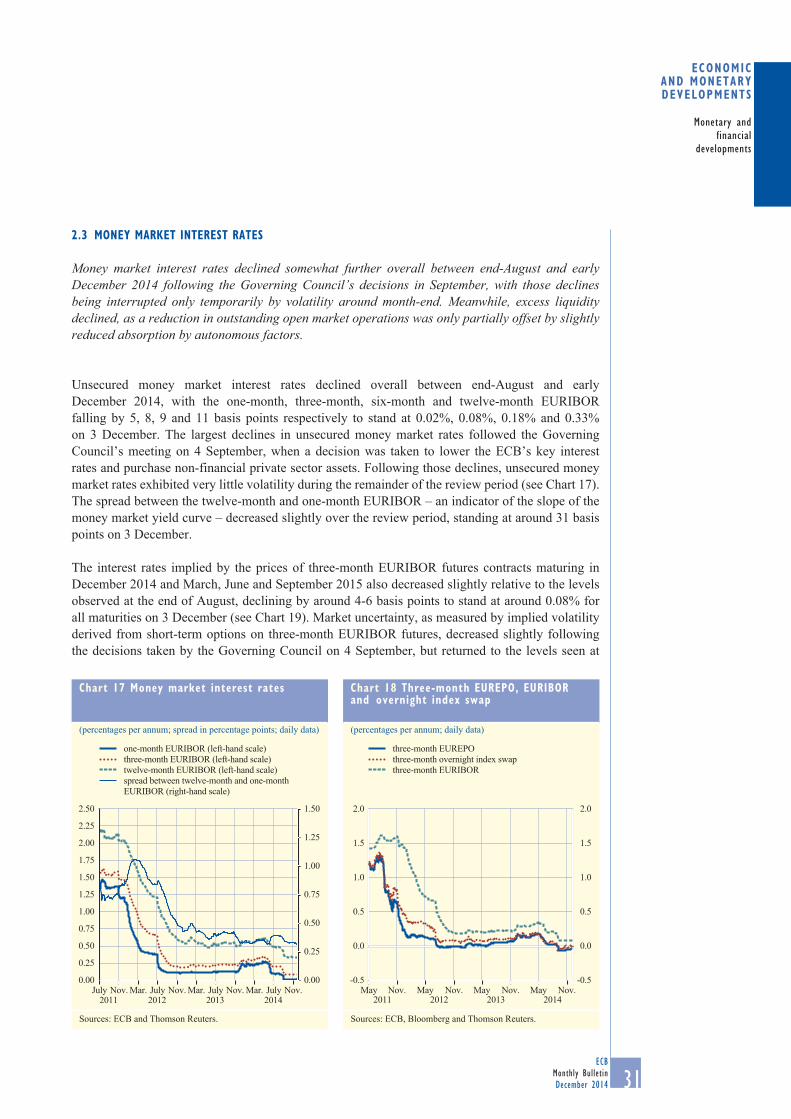
31ECB
Monthly BulletinDecember 2014
Monetary and financial
developments
Economic and monEtary dEvElopmEnts
2.3 money marKet interest rates
Money market interest rates declined somewhat further overall between end-August and early December 2014 following the Governing Council’s decisions in September, with those declines being interrupted only temporarily by volatility around month-end. Meanwhile, excess liquidity declined, as a reduction in outstanding open market operations was only partially offset by slightly reduced absorption by autonomous factors.
Unsecured money market interest rates declined overall between end-August and early December 2014, with the one-month, three-month, six-month and twelve-month EURIBOR falling by 5, 8, 9 and 11 basis points respectively to stand at 0.02%, 0.08%, 0.18% and 0.33% on 3 December. The largest declines in unsecured money market rates followed the Governing Council’s meeting on 4 September, when a decision was taken to lower the ECB’s key interest rates and purchase non-financial private sector assets. Following those declines, unsecured money market rates exhibited very little volatility during the remainder of the review period (see Chart 17). The spread between the twelve-month and one-month EURIBOR – an indicator of the slope of the money market yield curve – decreased slightly over the review period, standing at around 31 basis points on 3 December.
The interest rates implied by the prices of three-month EURIBOR futures contracts maturing in December 2014 and March, June and September 2015 also decreased slightly relative to the levels observed at the end of August, declining by around 4-6 basis points to stand at around 0.08% for all maturities on 3 December (see Chart 19). Market uncertainty, as measured by implied volatility derived from short-term options on three-month EURIBOR futures, decreased slightly following the decisions taken by the Governing Council on 4 September, but returned to the levels seen at
chart 17 money market interest rates
(percentages per annum; spread in percentage points; daily data)
0.00
0.25
0.50
0.75
1.00
1.25
1.50
0.00
0.25
0.50
0.75
1.00
1.25
1.50
1.75
2.00
2.25
2.50
July Nov. Mar. July Nov. Mar. July Nov. Nov.Mar. July
one-month EURIBOR (left-hand scale)three-month EURIBOR (left-hand scale)twelve-month EURIBOR (left-hand scale)spread between twelve-month and one-month EURIBOR (right-hand scale)
2011 2012 2013 2014
Sources: ECB and Thomson Reuters.
chart 18 three-month eurepo, euribor and overnight index swap
(percentages per annum; daily data)
-0.5
0.0
0.5
1.0
1.5
2.0
-0.5
0.0
0.5
1.0
1.5
2.0
three-month EUREPOthree-month overnight index swapthree-month EURIBOR
May Nov. May Nov. May Nov. May Nov.2011 2012 2013 2014
Sources: ECB, Bloomberg and Thomson Reuters.
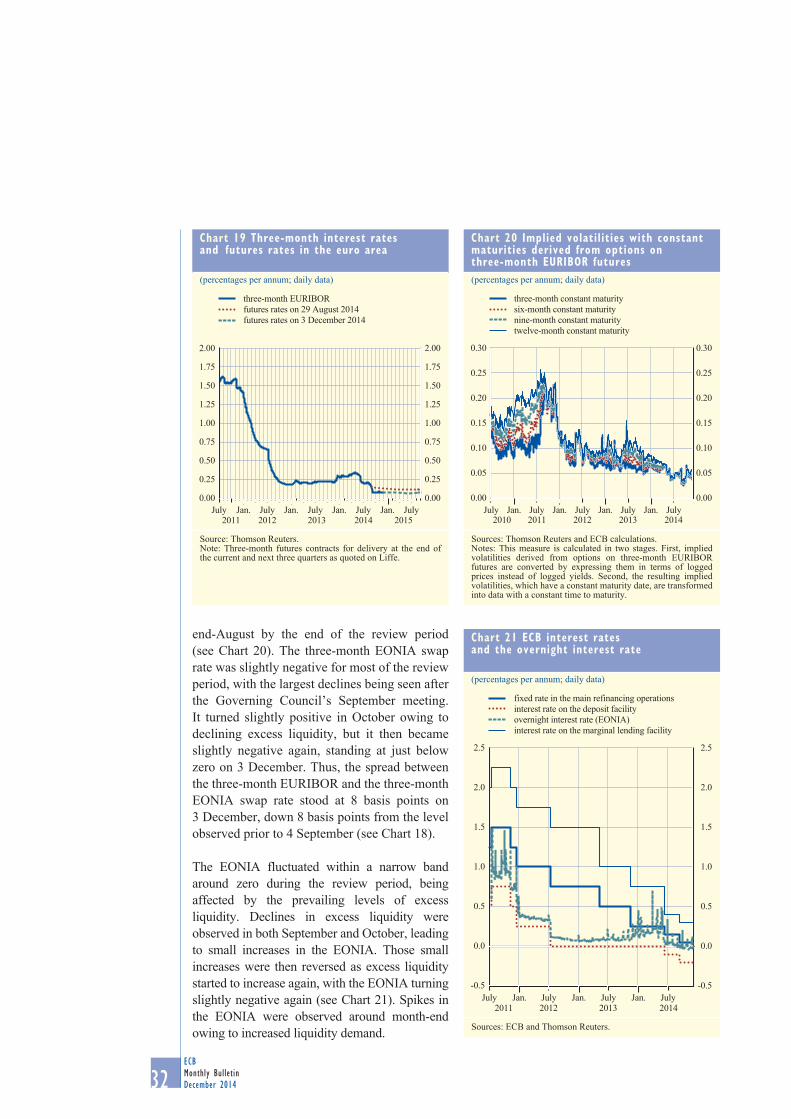
32ECBMonthly BulletinDecember 2014
end-August by the end of the review period (see Chart 20). The three-month EONIA swap rate was slightly negative for most of the review period, with the largest declines being seen after the Governing Council’s September meeting. It turned slightly positive in October owing to declining excess liquidity, but it then became slightly negative again, standing at just below zero on 3 December. Thus, the spread between the three-month EURIBOR and the three-month EONIA swap rate stood at 8 basis points on 3 December, down 8 basis points from the level observed prior to 4 September (see Chart 18).
The EONIA fluctuated within a narrow band around zero during the review period, being affected by the prevailing levels of excess liquidity. Declines in excess liquidity were observed in both September and October, leading to small increases in the EONIA. Those small increases were then reversed as excess liquidity started to increase again, with the EONIA turning slightly negative again (see Chart 21). Spikes in the EONIA were observed around month-end owing to increased liquidity demand.
chart 19 three-month interest rates and futures rates in the euro area
(percentages per annum; daily data)
0.00
0.25
0.50
0.75
1.00
1.25
1.50
1.75
2.00
0.00
0.25
0.50
0.75
1.00
1.25
1.50
1.75
2.00
July2011 2012 2013 2014 2015
three-month EURIBORfutures rates on 29 August 2014futures rates on 3 December 2014
Jan. July Jan. July Jan. July Jan. July
Source: Thomson Reuters.Note: Three-month futures contracts for delivery at the end of the current and next three quarters as quoted on Liffe.
chart 20 implied volatilities with constant maturities derived from options on three-month euribor futures(percentages per annum; daily data)
0.00
0.05
0.10
0.15
0.20
0.25
0.30
0.00
0.05
0.10
0.15
0.20
0.25
0.30
2010 2011 2012 2013 2014July Jan. July Jan. July Jan. July Jan. July
three-month constant maturitysix-month constant maturitynine-month constant maturitytwelve-month constant maturity
Sources: Thomson Reuters and ECB calculations.Notes: This measure is calculated in two stages. First, implied volatilities derived from options on three-month EURIBOR futures are converted by expressing them in terms of logged prices instead of logged yields. Second, the resulting implied volatilities, which have a constant maturity date, are transformed into data with a constant time to maturity.
chart 21 ecb interest rates and the overnight interest rate
(percentages per annum; daily data)
-0.5
0.0
0.5
1.0
1.5
2.0
2.5
-0.5
0.0
0.5
1.0
1.5
2.0
2.5
fixed rate in the main refinancing operationsinterest rate on the deposit facilityovernight interest rate (EONIA)interest rate on the marginal lending facility
July2011 2012 2013 2014
Jan. July Jan. July Jan. July
Sources: ECB and Thomson Reuters.
33ECB
Monthly BulletinDecember 2014
Monetary and financial
developments
Economic and monEtary dEvElopmEnts
The ECB continued to provide liquidity through refinancing operations with maturities of one week and three months. All of these operations were conducted as fixed rate tender procedures with full allotment. Moreover, on 18 September the ECB conducted its first targeted longer-term refinancing operation (TLTRO), in which €82.6 billion was allotted (see also Box 2).
The period between the beginning of the ninth maintenance period of the year (i.e. 10 September) and 3 December was characterised by a decline in excess liquidity, mostly owing to a reduction in outstanding open market operations. The decline in outstanding open market operations stemmed mostly from continuing early repayment of the three-year longer-term refinancing operations (LTROs) and was only partially offset by the first TLTRO and slightly reduced absorption by autonomous factors. Excess liquidity fluctuated between €70.9 billion and €159.1 billion, averaging €111.3 billion in the period under review (down from €130.9 billion in the previous three maintenance periods). On 3 December excess liquidity stood at €115.7 billion. Daily recourse to the deposit facility averaged €27.7 billion, while current account holdings in excess of reserve requirements averaged €83.8 billion and recourse to the marginal lending facility averaged €0.2 billion. Thus far, counterparties have voluntarily repaid €719.8 billion of the €1,018.7 billion obtained in the two three-year LTROs.
box 2
liquiDity conDitions anD monetary policy operations in the perioD from 13 auGust to 11 november 2014
This box describes the ECB’s monetary policy operations during the reserve maintenance periods ending on 9 September, 7 October and 11 November 2014, i.e. the eighth, ninth and tenth maintenance periods of the year.
On 4 September 2014 the ECB lowered the interest rate on the main refinancing operations (MROs) by 10 basis points, to 0.05%, with effect from the operation to be settled at the start of the ninth maintenance period, i.e. on 10 September. At the same time, the interest rates on the marginal lending facility and the deposit facility were lowered by 10 basis points, to 0.30% and -0.20% respectively. In addition, on 4 September the Governing Council introduced the new covered bond purchase programme (CBPP3) and the asset-backed securities purchase programme (ABSPP). On 2 October 2014 the ECB decided on the key operational details of the programmes, with purchases of covered bonds to commence in the second half of October and purchases of asset-backed securities to commence in the fourth quarter of 2014.
During the period under review the MROs continued to be conducted as fixed rate tender procedures with full allotment. The same procedure remained in use for the three-month longer-term refinancing operations (LTROs). The interest rate in each LTRO operation was fixed at the average of the rates on the MROs over the respective LTRO’s lifetime. On 18 September the first of a series of targeted longer-term refinancing operations (TLTROs) was conducted. These operations are conducted as fixed rate tender procedures with full allotment and the rate is fixed over the life of the operation at the MRO rate prevailing at the time of take-up, plus a fixed spread of 10 basis points.

34ECBMonthly BulletinDecember 2014
Liquidity needs
In the period under review the aggregate daily liquidity needs of the banking system, defined as the sum of autonomous factors and reserve requirements, averaged €579.6 billion, which was €33.3 billion less than the daily average in the previous review period (i.e. the period from 14 May
eurosystem liquidity situation
13 Aug. to 11 Nov.
14 May to 12 Aug.
Tenth maintenance
period
Ninth maintenance
period
Eighth maintenance
period
Liabilities – liquidity needs (averages; EUR billions)
Autonomous liquidity factors 1,561.4 (+3.2) 1,558.2 1,577.2 (+17.1) 1,560.1 (+17.2) 1,542.9 (-17.3) Banknotes in circulation 972.3 (+12.7) 959.6 973.6 (+2.3) 971.3 (-0.5) 971.8 (+4.1) Government deposits 73.8 (-29.9) 103.7 76.1 (-2.3) 78.4 (+12.2) 66.2 (-26.2) Other autonomous factors 515.3 (+20.4) 494.9 527.5 (+17.2) 510.4 (+5.5) 504.9 (+4.8) Monetary policy instrumentsCurrent accounts 196.3 (-9.6) 205.9 188.3 (-4.4) 192.6 (-17.5) 210.1 (-0.1) Minimum reserve requirements 105.4 (+0.9) 104.5 105.7 (+0.4) 105.3 (+0.1) 105.2 (+1.5) Deposit facility 27.1 (+1.6) 25.5 31.0 (+6.7) 24.3 (-1.0) 25.2 (+0.6) Liquidity-absorbing fine-tuning operations 0.0 (-47.1) 47.1 0.0 (+0.0) 0.0 (+0.0) 0.0 (+0.0)
Assets – liquidity supply (averages; EUR billions)
Autonomous liquidity factors 1,087.5 (+37.4) 1,050.2 1,095.4 (+10.1) 1,085.3 (+5.4) 1,079.9 (+8.3)Net foreign assets 554.6 (+12.7) 541.9 562.0 (+9.9) 552.1 (+4.3) 547.8 (+0.2)Net assets denominated in euro 532.9 (+24.7) 508.2 533.5 (+0.3) 533.2 (+1.2) 532.0 (+8.1)Monetary policy instrumentsOpen market operations 697.4 (-42.2) 739.6 701.1 (+9.3) 691.8 (-6.6) 698.4 (-25.1)
Tender operations provided 502.7 (-28.4) 531.1 507.7 (+10.5) 497.1 (-4.9) 502.1 (-19.2) MROs 102.3 (-18.6) 121.0 95.2 (-3.7) 98.9 (-15.8) 114.7 (+8.1) Special-term refinancing operations 0.0 (-13.0) 13.0 0.0 (+0.0) 0.0 (+0.0) 0.0 (+0.0) Three-month LTROs 25.8 (-7.6) 33.4 26.3 (+1.6) 24.7 (-1.7) 26.4 (-5.7) Three-year LTROs 330.1 (-80.8) 410.8 303.6 (-28.6) 332.2 (-28.8) 361.0 (-21.6) Targeted LTROs 44.5 (+44.5) 0.0 82.6 (+41.3) 41.3 (+41.3) 0.0 (+0.0)
Outright portfolios 194.7 (-13.8) 208.5 193.4 (-1.3) 194.7 (-1.7) 196.3 (-5.8) First covered bond purchase programme 31.9 (-3.1) 35.0 30.9 (-1.3) 32.2 (-0.7) 32.9 (-0.5) Second covered bond purchase programme 13.6 (-0.5) 14.1 13.4 (-0.3) 13.6 (-0.2) 13.8 (-0.1) Third covered bond purchase programme 1.1 (+1.1) 0.0 2.8 (+2.8) 0.0 (+0.0) 0.0 (+0.0) Securities Markets Programme 148.1 (-11.3) 159.4 146.3 (-2.5) 148.8 (-0.8) 149.6 (-5.2) Asset-backed securities purchase programme 0.0 (+0.0) 0.0 0.0 (+0.0) 0.0 (+0.0) 0.0 (+0.0)
Marginal lending facility 0.2 (+0.0) 0.2 0.3 (+0.1) 0.2 (+0.0) 0.2 (-0.1)
Other liquidity-based information (averages; EUR billions)
Aggregate liquidity needs 579.6 (-33.3) 612.9 587.7 (+7.2) 580.5 (+12.0) 568.5 (-25.4) Autonomous factors 474.1 (-34.3) 508.3 482.0 (+6.9) 475.1 (+11.9) 463.2 (-25.7) Excess liquidity 117.8 (-9.0) 126.8 113.3 (+1.9) 111.4 (-18.6) 130.0 (+0.4) Repayment of three-year LTROs1) 75.2 (-10.0) 85.2 23.5 (-16.4) 39.9 (+28.0) 11.9 (-23.6)
Interest rate developments (percentages)
MROs 0.08 (-0.10) 0.18 0.05 (+0.00) 0.05 (-0.10) 0.15 (+0.00) Marginal lending facility 0.33 (-0.18) 0.51 0.30 (+0.00) 0.30 (-0.10) 0.40 (+0.00) Deposit facility -0.17 (-0.10) -0.07 -0.20 (+0.00) -0.20 (-0.10) -0.10 (+0.00) EONIA average 0.002 (-0.099) 0.101 -0.003 (+0.002) -0.005 (-0.021) 0.016 (-0.022)
Source: ECB.Note: Since all figures in the table are rounded, in some cases the figure indicated as the change relative to the previous period does not represent the difference between the rounded figures provided for the two periods (differing by €0.1 billion).1) For the repayments of the three-year LTROs the sum in EUR billions is used instead of the average.

35ECB
Monthly BulletinDecember 2014
Monetary and financial
developments
Economic and monEtary dEvElopmEnts
to 12 August 2014).1 Autonomous factors declined significantly, falling by €34.3 billion to stand at an average of €474.1 billion, while reserve requirements increased marginally, by €0.9 billion, to stand at an average of €105.4 billion (see the table).
The change in average autonomous factors resulted from the combined effect of changes in several individual components. Among the liquidity-providing factors, net assets denominated in euro increased by €24.7 billion to stand at an average of €532.9 billion, having increased by €30.3 billion in the previous period. This reflected, among other things, a reduction in foreign official institutions’ euro-denominated deposits with the Eurosystem. The introduction of a negative deposit facility rate and the further rate cut in September has led some foreign official institutions to further reduce their cash holdings with Eurosystem central banks.
Among the liquidity-absorbing factors, banknotes in circulation increased by €12.7 billion to an average of €972.3 billion. The pace of the increase slowed compared with the previous review period, partly as a result of lower seasonal demand for banknotes after the tourism activities over the summer period. Government deposits declined, falling by €29.9 billion to stand at an average of €73.8 billion. As the introduction of a negative deposit facility rate also affected government deposits held with the Eurosystem, national treasuries tried increasingly to invest their excess liquidity at positive interest rates in the market, but were not always able to achieve this goal.
The volatility of autonomous factors declined slightly, albeit from relatively high levels. The weekly estimates, which are published together with the announcement of the MROs, ranged between €451.7 billion and €500.9 billion, compared with a range between €451.7 billion and €532.1 billion in the previous period. This volatility was due primarily to fluctuations in other autonomous factors and government deposits. The traditional volatility of government deposits owing to tax cycles was compounded by the aforementioned attempts by treasuries and customers of Eurosystem reserve management services to invest more of their holdings in the market.
Weekly forecasts of autonomous factors showed an average absolute error of €4.8 billion, which constitutes a decline from the average absolute error of €6.7 billion in the previous review period. While the average forecast error declined, the range of the weekly forecast errors increased, ranging between -€6.6 billion and €16.2 billion. Both the decline in the average absolute error and the increase in the range can be attributed mainly to the forecasts of government deposits, which exhibited an average absolute error of €4.9 billion. While the precision of forecasts of government deposits increased on average, it remained difficult to anticipate the investment activities of treasuries in an environment in which short-term money market rates were often negative, particularly after the ECB cut interest rates further in September. Other autonomous factors also contributed, recording an average absolute error of €3.0 billion.2
Liquidity provision
The average amount of liquidity provided through open market operations declined by €42.2 billion, to €697.4 billion, in the period under review. This decline was a result of the combined effect of the repayments of the three-year LTROs and a decline in the average take-up
1 All comparisons are relative to the previous period, unless otherwise indicated.2 Average forecast errors for individual components of autonomous factors will not add up to the average forecast error for total
autonomous factors, as some autonomous factors will be netted out, e.g. changes to components related to the quarter-end revaluation of the balance sheet.

36ECBMonthly BulletinDecember 2014
in the MROs, which was partially offset by an increase in liquidity provision through the first TLTRO. Liquidity provided through tender operations averaged €502.7 billion, which constituted a decline of €28.4 billion in comparison with the previous review period.
The average amount of liquidity provided through the weekly MROs declined by €18.6 billion, to €102.3 billion, as some counterparties switched part of their borrowing from the MROs to the TLTRO. The weekly amount allotted remained volatile, fluctuating between a high of €131.8 billion on 26 August and a low of €82.5 billion on 14 October, as banks adjusted their demand in line with developments in liquidity and money market conditions.
The repayments of the three-year LTROs continued at an average pace of €5.8 billion per week, which was slightly slower than in the previous period (€6.3 billion). By the end of the period under review total repayments had reached €697.0 billion, corresponding to 70% of the total amount borrowed and to 133% of the initial net injection of liquidity. Weekly repayments continued to fluctuate, with a peak settlement of €19.9 billion on 24 September, as some counterparties switched to obtaining funding under the first TLTRO.
Outright portfolios declined on average by €13.8 billion, mainly as a result of the maturing of government bonds in the Securities Markets Programme portfolio. Purchases of covered bonds under the CBPP3 started on 20 October – i.e. only towards the end of the review period. On average over the review period, covered bond purchases released liquidity amounting to €1.1 billion and the amount settled under the CBPP3 at the end of the review period stood at €7.4 billion.
Excess liquidity
Excess liquidity declined by €9 billion, averaging €117.8 billion in the period under review, compared with €126.8 billion in the previous review period. Daily current account holdings in excess of reserve requirements declined by €10.5 billion, to an average of €90.9 billion, while the use of the deposit facility increased by €1.6 billion, to €27.1 billion, on average. After declining steadily since the beginning of 2013, excess liquidity has fluctuated around a level of approximately €120 billion since March 2014. In the ninth maintenance period of 2014 excess liquidity fell slightly lower to an average of €111.4 billion – the lowest level recorded since the settlement of the first three-year LTRO at the end of 2011. Excess liquidity fluctuated significantly, in particular in the ninth maintenance period, driven mainly by volatility in autonomous factors and the fluctuations in the amounts allotted in the MROs. In the ninth maintenance period the low recorded in government deposits coincided with a high take-up in the MRO, which was related to the quarter-end, leading to a peak in excess liquidity at €159 billion. At times excess liquidity temporarily fell below €100 billion, with a low of €77 billion recorded on 23 September.
Regarding the disposition of excess liquidity, on average over the review period counterparties held 23% of their excess liquidity in the deposit facility and 77% was held in the form of excess reserves. As excess reserves (i.e. average current account holdings in excess of minimum reserve requirements) have also been charged the negative rate on the deposit facility since June, counterparties should be indifferent to the form in which excess liquidity is held. However, for some counterparties technical and operational aspects may make current accounts more

37ECB
Monthly BulletinDecember 2014
Monetary and financial
developments
Economic and monEtary dEvElopmEnts
2.4 bonD marKets
Between end-August and early December 2014, long-term AAA-rated euro area government bond yields declined, following some weak economic data for the euro area and general market uncertainty over the outlook for global growth. Long-term government bond yields in the United States and Japan declined less, amid some volatility. Long-term government bond yields in stressed euro area countries increased around the middle of October, reflecting both uncertainty about the outlook for global growth and country specific news, but the increases were later reversed in most of the countries. Investor uncertainty about near-term developments in the bond market exhibited large fluctuations over the review period, leading to a slight decline in the euro area and an increase in the United States and Japan.
Between the end of August and 3 December 2014, AAA-rated ten-year euro area government bond yields declined by around 16 basis points, to 0.9% (see Chart 22). Over the same period, ten-year government bond yields in the United States and Japan declined less, standing at around 2.3% and 0.4% respectively on 3 December. Shorter-term AAA-rated euro area government bond yields remained broadly unchanged at slightly negative levels, with the result that the slope of the term structure, as measured by the gap between the ten-year and the two-year yield, decreased by around 15 basis points over the review period.
AAA-rated long-term bond yields in the euro area increased slightly in the first part of September. This increase was immediately reversed following some weak economic data for the euro area, and for the rest of the period the AAA-rated long-term bond yields exhibited a slightly declining trend. The largest declines in these bond yields occurred around the middle of October, following further weak economic data for the euro area and some country-specific news, as well as general market concerns about global growth. By contrast, long-term bond yields in stressed euro area countries increased following these events but the increases had been reversed in most affected countries by the end of the review period.
convenient, while for other counterparties operational and regulatory aspects favour the use of the deposit facility. During the course of the review period the share of excess liquidity held in the deposit facility increased from 19% to 27%, owing to both higher average use of the deposit facility and a decline in current account holdings.
Interest rate developments
The EONIA rate averaged 1.6 basis points in the eighth maintenance period, prior to the cut in ECB interest rates which took effect on 10 September, compared with 10.1 basis points in the three preceding maintenance periods. It fluctuated between a high of 10.1 basis points on 13 August and a low of -0.4 basis point on 28 August, reflecting fluctuations in excess liquidity. Following the cut in the interest rates on the MROs, the deposit facility and the marginal lending facility, the EONIA rate recorded a negative average value for the first time in the ninth maintenance period (-0.5 basis point) and the tenth maintenance period (-0.3 basis point), and reached a new low of -4.5 basis points on 3 October. Volatility was very limited: except for end-of-month spikes, the EONIA remained within a relatively narrow range, fluctuating between 2.2 basis points on 24 September and -4.5 basis points on 3 October.
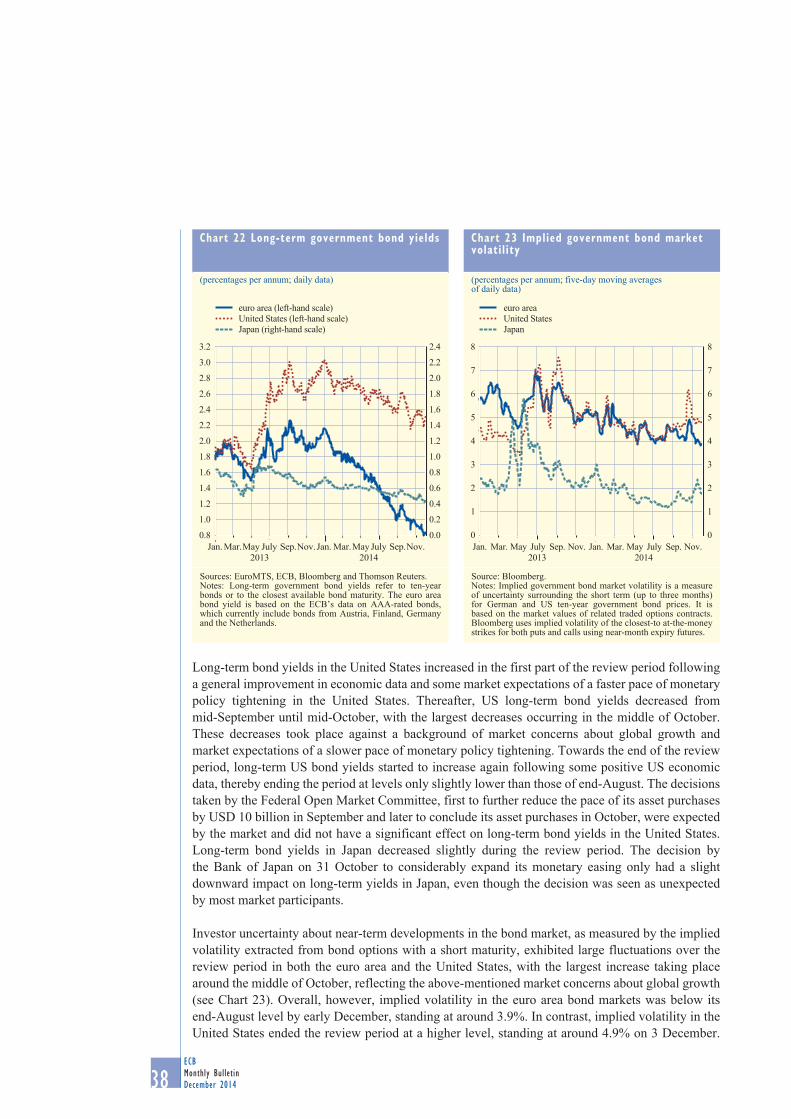
38ECBMonthly BulletinDecember 2014
Long-term bond yields in the United States increased in the first part of the review period following a general improvement in economic data and some market expectations of a faster pace of monetary policy tightening in the United States. Thereafter, US long-term bond yields decreased from mid-September until mid-October, with the largest decreases occurring in the middle of October. These decreases took place against a background of market concerns about global growth and market expectations of a slower pace of monetary policy tightening. Towards the end of the review period, long-term US bond yields started to increase again following some positive US economic data, thereby ending the period at levels only slightly lower than those of end-August. The decisions taken by the Federal Open Market Committee, first to further reduce the pace of its asset purchases by USD 10 billion in September and later to conclude its asset purchases in October, were expected by the market and did not have a significant effect on long-term bond yields in the United States. Long-term bond yields in Japan decreased slightly during the review period. The decision by the Bank of Japan on 31 October to considerably expand its monetary easing only had a slight downward impact on long-term yields in Japan, even though the decision was seen as unexpected by most market participants.
Investor uncertainty about near-term developments in the bond market, as measured by the implied volatility extracted from bond options with a short maturity, exhibited large fluctuations over the review period in both the euro area and the United States, with the largest increase taking place around the middle of October, reflecting the above-mentioned market concerns about global growth (see Chart 23). Overall, however, implied volatility in the euro area bond markets was below its end-August level by early December, standing at around 3.9%. In contrast, implied volatility in the United States ended the review period at a higher level, standing at around 4.9% on 3 December.
chart 22 long-term government bond yields
(percentages per annum; daily data)
0.0
0.2
0.4
0.6
0.8
1.0
1.2
1.4
1.6
1.8
2.0
2.2
2.4
0.8
1.0
1.2
1.4
1.6
1.8
2.0
2.2
2.4
2.6
2.8
3.0
3.2
Jan. Mar.May July Sep.Nov.Jan. Mar.May July Sep.Nov.2013 2014
euro area (left-hand scale)United States (left-hand scale)Japan (right-hand scale)
Sources: EuroMTS, ECB, Bloomberg and Thomson Reuters.Notes: Long-term government bond yields refer to ten-year bonds or to the closest available bond maturity. The euro area bond yield is based on the ECB’s data on AAA-rated bonds, which currently include bonds from Austria, Finland, Germany and the Netherlands.
chart 23 implied government bond market volatility
(percentages per annum; five-day moving averages of daily data)
0
1
2
3
4
5
6
7
8
0
1
2
3
4
5
6
7
8
Jan. Mar. May July Sep. Nov. Jan. Mar. May July Sep. Nov.
euro areaUnited StatesJapan
2013 2014
Source: Bloomberg.Notes: Implied government bond market volatility is a measure of uncertainty surrounding the short term (up to three months) for German and US ten-year government bond prices. It is based on the market values of related traded options contracts. Bloomberg uses implied volatility of the closest-to at-the-money strikes for both puts and calls using near-month expiry futures.
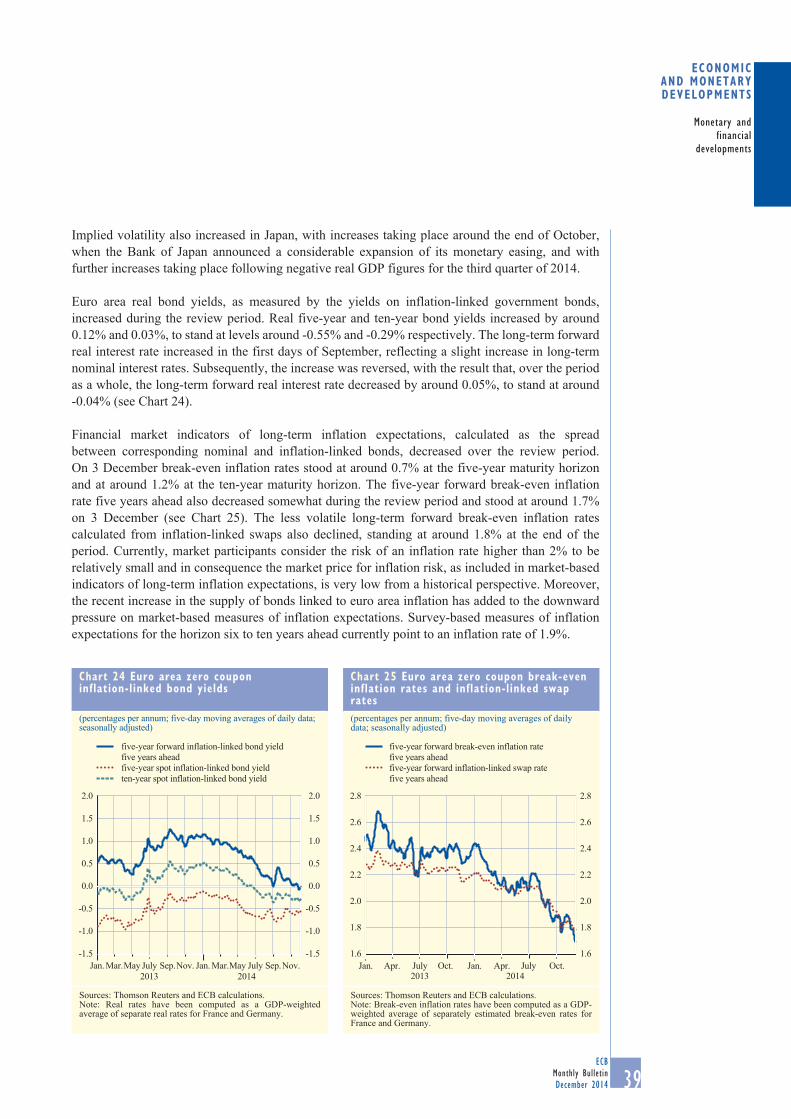
39ECB
Monthly BulletinDecember 2014
Monetary and financial
developments
Economic and monEtary dEvElopmEnts
Implied volatility also increased in Japan, with increases taking place around the end of October, when the Bank of Japan announced a considerable expansion of its monetary easing, and with further increases taking place following negative real GDP figures for the third quarter of 2014.
Euro area real bond yields, as measured by the yields on inflation-linked government bonds, increased during the review period. Real five-year and ten-year bond yields increased by around 0.12% and 0.03%, to stand at levels around -0.55% and -0.29% respectively. The long-term forward real interest rate increased in the first days of September, reflecting a slight increase in long-term nominal interest rates. Subsequently, the increase was reversed, with the result that, over the period as a whole, the long-term forward real interest rate decreased by around 0.05%, to stand at around -0.04% (see Chart 24).
Financial market indicators of long-term inflation expectations, calculated as the spread between corresponding nominal and inflation-linked bonds, decreased over the review period. On 3 December break-even inflation rates stood at around 0.7% at the five-year maturity horizon and at around 1.2% at the ten-year maturity horizon. The five-year forward break-even inflation rate five years ahead also decreased somewhat during the review period and stood at around 1.7% on 3 December (see Chart 25). The less volatile long-term forward break-even inflation rates calculated from inflation-linked swaps also declined, standing at around 1.8% at the end of the period. Currently, market participants consider the risk of an inflation rate higher than 2% to be relatively small and in consequence the market price for inflation risk, as included in market-based indicators of long-term inflation expectations, is very low from a historical perspective. Moreover, the recent increase in the supply of bonds linked to euro area inflation has added to the downward pressure on market-based measures of inflation expectations. Survey-based measures of inflation expectations for the horizon six to ten years ahead currently point to an inflation rate of 1.9%.
chart 24 euro area zero coupon inflation-linked bond yields
(percentages per annum; five-day moving averages of daily data; seasonally adjusted)
-1.5
-1.0
-0.5
0.0
0.5
1.0
1.5
2.0
-1.5
-1.0
-0.5
0.0
0.5
1.0
1.5
2.0
five-year forward inflation-linked bond yield five years aheadfive-year spot inflation-linked bond yieldten-year spot inflation-linked bond yield
Jan. Mar.May July Sep.Nov. Jan. Mar.May July Sep.Nov.2013 2014
Sources: Thomson Reuters and ECB calculations.Note: Real rates have been computed as a GDP-weighted average of separate real rates for France and Germany.
chart 25 euro area zero coupon break-even inflation rates and inflation-linked swap rates(percentages per annum; five-day moving averages of daily data; seasonally adjusted)
1.6
1.8
2.0
2.2
2.4
2.6
2.8
1.6
1.8
2.0
2.2
2.4
2.6
2.8
Jan. Apr. July Oct. Jan. Apr. July Oct.
five-year forward break-even inflation rate five years aheadfive-year forward inflation-linked swap rate five years ahead
2013 2014
Sources: Thomson Reuters and ECB calculations.Note: Break-even inflation rates have been computed as a GDP-weighted average of separately estimated break-even rates for France and Germany.
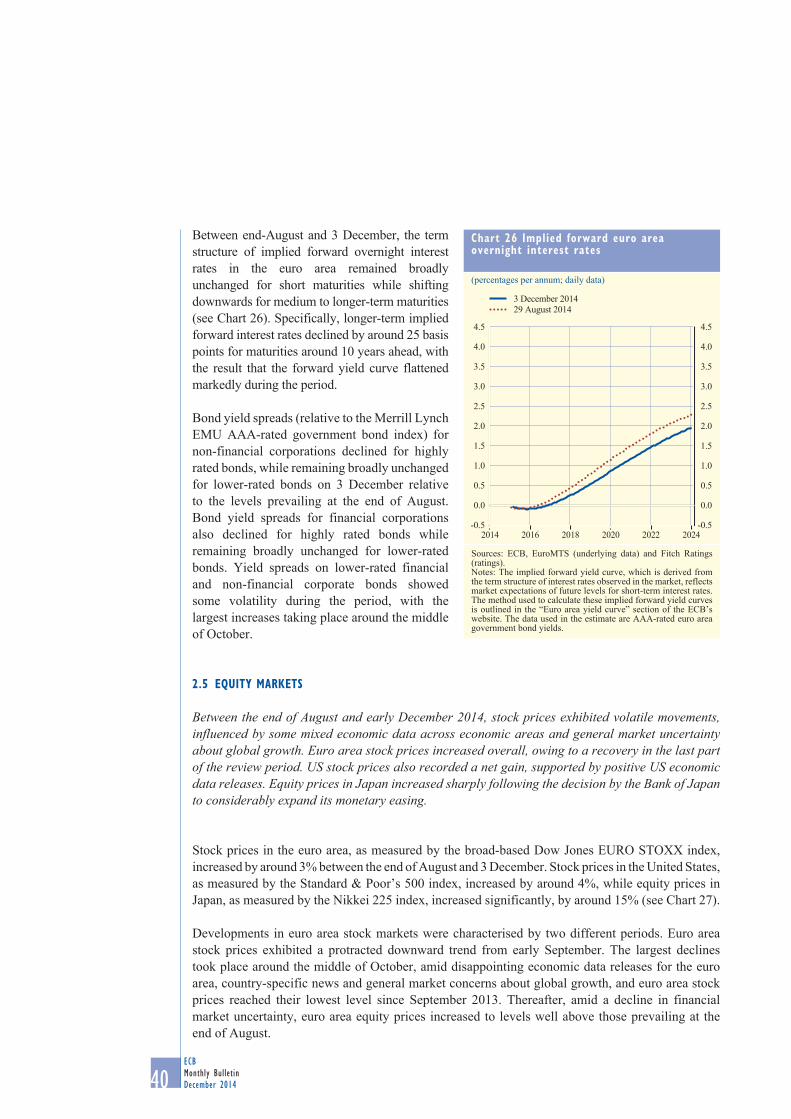
40ECBMonthly BulletinDecember 2014
Between end-August and 3 December, the term structure of implied forward overnight interest rates in the euro area remained broadly unchanged for short maturities while shifting downwards for medium to longer-term maturities (see Chart 26). Specifically, longer-term implied forward interest rates declined by around 25 basis points for maturities around 10 years ahead, with the result that the forward yield curve flattened markedly during the period.
Bond yield spreads (relative to the Merrill Lynch EMU AAA-rated government bond index) for non-financial corporations declined for highly rated bonds, while remaining broadly unchanged for lower-rated bonds on 3 December relative to the levels prevailing at the end of August. Bond yield spreads for financial corporations also declined for highly rated bonds while remaining broadly unchanged for lower-rated bonds. Yield spreads on lower-rated financial and non-financial corporate bonds showed some volatility during the period, with the largest increases taking place around the middle of October.
2.5 equity marKets
Between the end of August and early December 2014, stock prices exhibited volatile movements, influenced by some mixed economic data across economic areas and general market uncertainty about global growth. Euro area stock prices increased overall, owing to a recovery in the last part of the review period. US stock prices also recorded a net gain, supported by positive US economic data releases. Equity prices in Japan increased sharply following the decision by the Bank of Japan to considerably expand its monetary easing.
Stock prices in the euro area, as measured by the broad-based Dow Jones EURO STOXX index, increased by around 3% between the end of August and 3 December. Stock prices in the United States, as measured by the Standard & Poor’s 500 index, increased by around 4%, while equity prices in Japan, as measured by the Nikkei 225 index, increased significantly, by around 15% (see Chart 27).
Developments in euro area stock markets were characterised by two different periods. Euro area stock prices exhibited a protracted downward trend from early September. The largest declines took place around the middle of October, amid disappointing economic data releases for the euro area, country-specific news and general market concerns about global growth, and euro area stock prices reached their lowest level since September 2013. Thereafter, amid a decline in financial market uncertainty, euro area equity prices increased to levels well above those prevailing at the end of August.
chart 26 implied forward euro area overnight interest rates
(percentages per annum; daily data)
-0.5
0.0
0.5
1.0
1.5
2.0
2.5
3.0
3.5
4.0
4.5
2014 2016 2018 2020 2022 2024-0.5
0.0
0.5
1.0
1.5
2.0
2.5
3.0
3.5
4.0
4.5
3 December 201429 August 2014
Sources: ECB, EuroMTS (underlying data) and Fitch Ratings (ratings).Notes: The implied forward yield curve, which is derived from the term structure of interest rates observed in the market, reflects market expectations of future levels for short-term interest rates. The method used to calculate these implied forward yield curves is outlined in the “Euro area yield curve” section of the ECB’s website. The data used in the estimate are AAA-rated euro area government bond yields.

41ECB
Monthly BulletinDecember 2014
Monetary and financial
developments
Economic and monEtary dEvElopmEnts
The performance of stock prices in the different euro area economic sectors was mixed during the review period (see Table 6), with the telecommunications and consumer goods sectors exhibiting the largest increases. In contrast, the oil and gas sector and the healthcare sector experienced the largest declines. Upon the announcement by the ECB of the results of the comprehensive assessment on 26 October, financial sector stock prices in the euro area initially declined, with large declines seen at company level. In the days following the announcement most of these declines were reversed, but overall financial sector stock prices decreased slightly over the review period.
Stock prices in the United States declined during the first part of the review period. As in the euro area, the largest declines took place around the middle of October following some mixed economic data and general market concerns about global growth. In the last part of the review period, stock prices in the United States recovered markedly, and ended the period well above the levels prevailing at the end of August. This increase followed a general improvement in economic data, for example positive US data for real GDP growth and labour market conditions. The sectoral performance of stock prices in the United States was positive in most sectors, with the largest increases seen in the healthcare sector and the utility sector. The largest declines were in the oil and gas sector and in the telecommunications sector.
Equity prices in Japan recorded the largest advances of the three economic areas over the review period, gaining by around 15%. In line with the developments in the euro area and the United States, stock prices in Japan decreased during October owing to concerns about global growth. They then recovered markedly following the decision by the Bank of Japan on 31 October to expand its
chart 27 stock price indices
(index: 1 January 2013 = 100; daily data)
60
80
100
120
140
160
180
200
90
100
110
120
130
140
150
Jan. Mar.May July Sep.Nov. Jan. Mar.May July Sep.Nov.
euro areaUnited StatesJapan (right-hand scale)
2013 2014
Source: Thomson Reuters.Note: The indices used are the Dow Jones EURO STOXX broad index for the euro area, the Standard & Poor’s 500 index for the United States and the Nikkei 225 index for Japan.
table 6 price changes in the Dow Jones euro stoXX economic sector indices
(percentages of end-of-period prices)
EURO STOXX
Basic materials
Consumer services
Consumer goods
Oil and gas
Financial Health-care
Industrial Tech-nology
Tele-communi-
cations
Utility
Share of sector in market capitalisation (end-of-period data)100.0 9.7 6.9 16.9 5.8 23.9 5.5 14.9 5.2 4.9 6.3
Price changes (end-of-period data)Q3 2013 10.1 4.7 8.2 6.5 7.3 18.9 -4.5 12.0 14.4 16.8 9.6Q4 2013 7.3 9.5 7.1 3.4 0.9 12.5 6.0 7.5 7.2 6.8 4.3Q1 2014 10.4 8.2 9.4 5.3 6.1 18.1 4.5 9.5 6.3 10.0 18.2Q2 2014 0.9 3.6 -2.0 2.6 9.1 -3.6 2.8 -0.9 -1.5 6.7 4.6Q3 2014 -1.3 -3.4 -3.3 -5.6 -5.0 2.3 12.0 -4.7 4.8 -2.5 -0.3Oct. 2014 -3.1 -1.0 -5.4 -2.2 -5.8 -5.2 4.0 -7.4 -0.3 5.1 1.2Nov. 2014 0.8 1.7 3.9 4.2 -15.4 -1.7 6.9 -3.2 9.3 10.1 5.929 Aug.14 – 03 Dec.14 2.7 4.1 5.7 6.8 -12.2 1.7 -0.2 1.9 3.2 13.3 2.4
Sources: Thomson Reuters and ECB calculations.

42ECBMonthly BulletinDecember 2014
monetary easing. Towards the end of the review period the Japanese stock prices experienced a temporary decline following the release of negative real GDP growth figures for the third quarter of 2014 and the announcement of new general elections, but they quickly recovered, ending the review period markedly higher than the levels prevailing at the end of August.
Stock market uncertainty, as measured by implied volatility, increased in the euro area, the United States and Japan. In the euro area and the United States stock market uncertainty spiked around the middle of October following the sharp declines in stock prices on both sides of the Atlantic, and reflecting the increased market uncertainty about global growth. Subsequently, to some extent this increase was reversed, but, despite this reversal, stock market uncertainty in the euro area and the United States increased over the review period as a whole, standing at around 16% and 11% respectively on 3 December (see Chart 28). Stock market uncertainty in Japan also spiked around the middle of October, but, contrary to developments in the other two economic areas, continued to increase, ending the review period at a markedly higher level of 22%.
Available data on the corporate earnings of the financial and non-financial euro area corporations included in the Dow Jones EURO STOXX index show that actual earnings, which are computed over the previous 12 months, shifted from a decline of around 3% at end-August to an increase of around 2% by end-November 2014. In November market participants expected companies’ earnings per share to grow by 16% over the next 12 months. Market participants forecasted long-term (five-year) growth in earnings per share to be around 12% per annum (see Chart 29).
chart 28 implied stock market volatility
(percentages per annum; five-day moving averages of daily data)
5
10
15
20
25
30
35
40
45
5
10
15
20
25
30
35
40
45
euro areaUnited StatesJapan
Jan. Mar. May July Sep. Nov. Jan. Mar. May July Sep. Nov.2013 2014
Source: Bloomberg.Notes: The implied volatility series reflects the expected standard deviation of percentage changes in stock prices over a period of up to three months, as implied in the prices of options on stock price indices. The equity indices to which the implied volatilities refer are the Dow Jones EURO STOXX 50 for the euro area, the Standard & Poor’s 500 for the United States and the Nikkei 225 for Japan.
chart 29 expected growth in corporate earnings per share in the united states and the euro area(percentages per annum; monthly data)
-6
0
6
12
18
24
30
36
2005 2006 2007 2008 2009 2010 2011 2012 2013 2014-6
0
6
12
18
24
30
36
euro area short-term 1)
euro area long-term 2)
United States short-term 1)
United States long-term 2)
Sources: Thomson Reuters and ECB calculations.Notes: Expected earnings growth of corporations on the Dow Jones EURO STOXX index for the euro area and on theStandard & Poor’s 500 index for the United States.1) “Short-term” refers to analysts’ earnings expectations 12 months ahead (annual growth rates).2) “Long-term” refers to analysts’ earnings expectations three to five years ahead (annual growth rates).
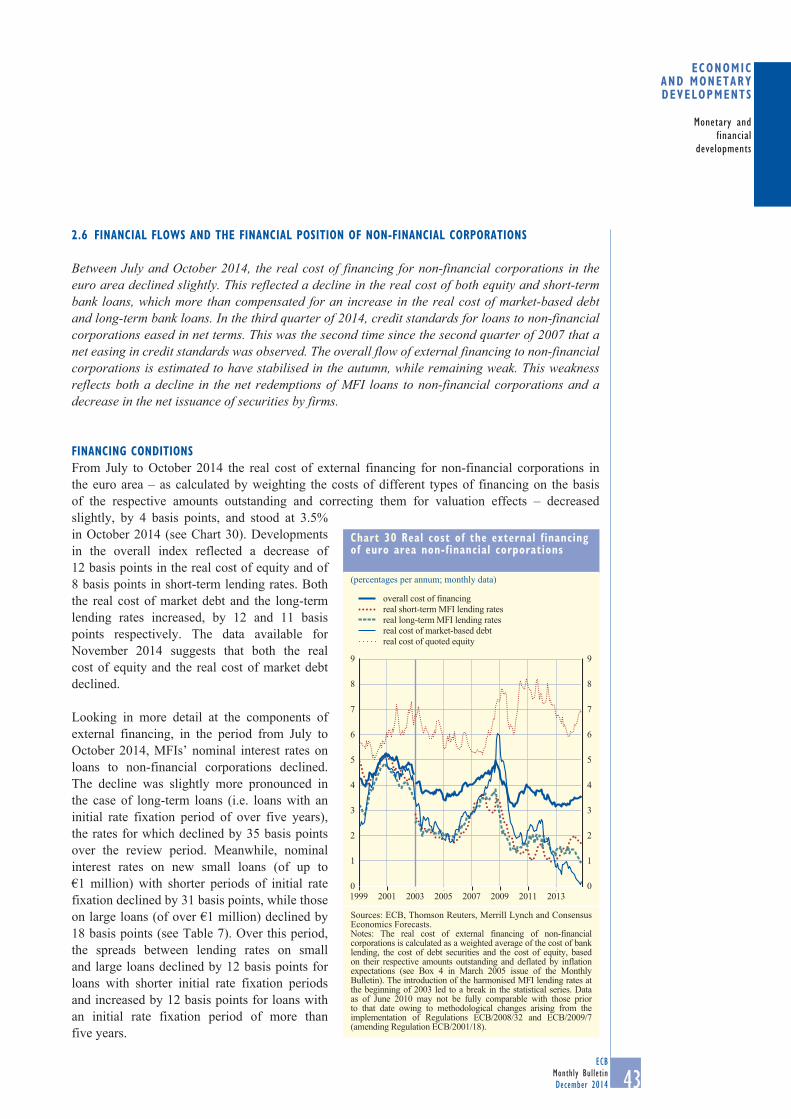
43ECB
Monthly BulletinDecember 2014
Monetary and financial
developments
Economic and monEtary dEvElopmEnts
2.6 financial flows anD the financial position of non-financial corporations
Between July and October 2014, the real cost of financing for non-financial corporations in the euro area declined slightly. This reflected a decline in the real cost of both equity and short-term bank loans, which more than compensated for an increase in the real cost of market-based debt and long-term bank loans. In the third quarter of 2014, credit standards for loans to non-financial corporations eased in net terms. This was the second time since the second quarter of 2007 that a net easing in credit standards was observed. The overall flow of external financing to non-financial corporations is estimated to have stabilised in the autumn, while remaining weak. This weakness reflects both a decline in the net redemptions of MFI loans to non-financial corporations and a decrease in the net issuance of securities by firms.
financinG conDitionsFrom July to October 2014 the real cost of external financing for non-financial corporations in the euro area – as calculated by weighting the costs of different types of financing on the basis of the respective amounts outstanding and correcting them for valuation effects – decreased slightly, by 4 basis points, and stood at 3.5% in October 2014 (see Chart 30). Developments in the overall index reflected a decrease of 12 basis points in the real cost of equity and of 8 basis points in short-term lending rates. Both the real cost of market debt and the long-term lending rates increased, by 12 and 11 basis points respectively. The data available for November 2014 suggests that both the real cost of equity and the real cost of market debt declined.
Looking in more detail at the components of external financing, in the period from July to October 2014, MFIs’ nominal interest rates on loans to non-financial corporations declined. The decline was slightly more pronounced in the case of long-term loans (i.e. loans with an initial rate fixation period of over five years), the rates for which declined by 35 basis points over the review period. Meanwhile, nominal interest rates on new small loans (of up to €1 million) with shorter periods of initial rate fixation declined by 31 basis points, while those on large loans (of over €1 million) declined by 18 basis points (see Table 7). Over this period, the spreads between lending rates on small and large loans declined by 12 basis points for loans with shorter initial rate fixation periods and increased by 12 basis points for loans with an initial rate fixation period of more than five years.
chart 30 real cost of the external financing of euro area non-financial corporations
(percentages per annum; monthly data)
0
1
2
3
4
5
6
7
8
9
0
1
2
3
4
5
6
7
8
9
1999 2001 2003 2005 2007 2009 2011 2013
overall cost of financingreal short-term MFI lending ratesreal long-term MFI lending ratesreal cost of market-based debtreal cost of quoted equity
Sources: ECB, Thomson Reuters, Merrill Lynch and Consensus Economics Forecasts.Notes: The real cost of external financing of non-financial corporations is calculated as a weighted average of the cost of bank lending, the cost of debt securities and the cost of equity, based on their respective amounts outstanding and deflated by inflation expectations (see Box 4 in March 2005 issue of the Monthly Bulletin). The introduction of the harmonised MFI lending rates at the beginning of 2003 led to a break in the statistical series. Data as of June 2010 may not be fully comparable with those prior to that date owing to methodological changes arising from the implementation of Regulations ECB/2008/32 and ECB/2009/7 (amending Regulation ECB/2001/18).
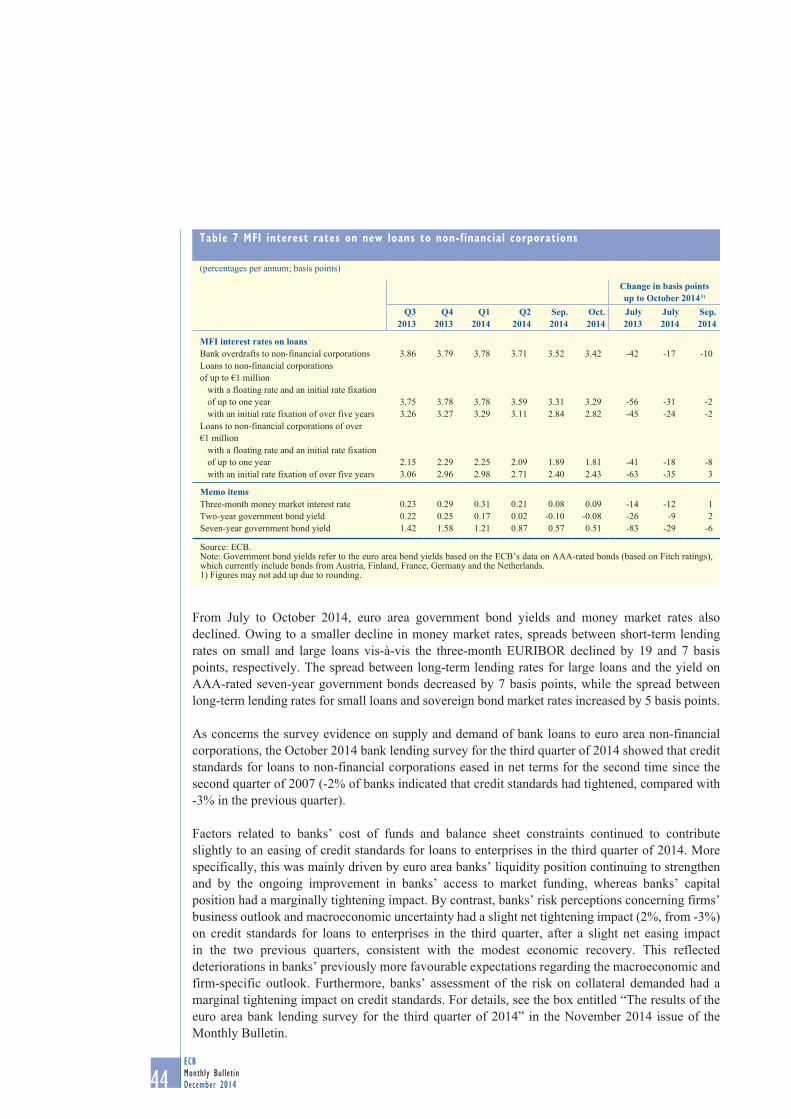
44ECBMonthly BulletinDecember 2014
From July to October 2014, euro area government bond yields and money market rates also declined. Owing to a smaller decline in money market rates, spreads between short-term lending rates on small and large loans vis-à-vis the three-month EURIBOR declined by 19 and 7 basis points, respectively. The spread between long-term lending rates for large loans and the yield on AAA-rated seven-year government bonds decreased by 7 basis points, while the spread between long-term lending rates for small loans and sovereign bond market rates increased by 5 basis points.
As concerns the survey evidence on supply and demand of bank loans to euro area non-financial corporations, the October 2014 bank lending survey for the third quarter of 2014 showed that credit standards for loans to non-financial corporations eased in net terms for the second time since the second quarter of 2007 (-2% of banks indicated that credit standards had tightened, compared with -3% in the previous quarter).
Factors related to banks’ cost of funds and balance sheet constraints continued to contribute slightly to an easing of credit standards for loans to enterprises in the third quarter of 2014. More specifically, this was mainly driven by euro area banks’ liquidity position continuing to strengthen and by the ongoing improvement in banks’ access to market funding, whereas banks’ capital position had a marginally tightening impact. By contrast, banks’ risk perceptions concerning firms’ business outlook and macroeconomic uncertainty had a slight net tightening impact (2%, from -3%) on credit standards for loans to enterprises in the third quarter, after a slight net easing impact in the two previous quarters, consistent with the modest economic recovery. This reflected deteriorations in banks’ previously more favourable expectations regarding the macroeconomic and firm-specific outlook. Furthermore, banks’ assessment of the risk on collateral demanded had a marginal tightening impact on credit standards. For details, see the box entitled “The results of the euro area bank lending survey for the third quarter of 2014” in the November 2014 issue of the Monthly Bulletin.
table 7 mfi interest rates on new loans to non-financial corporations
(percentages per annum; basis points)
Change in basis points up to October 2014 1)
Q3 2013
Q4 2013
Q1 2014
Q2 2014
Sep.2014
Oct.2014
July 2013
July 2014
Sep.2014
MFI interest rates on loansBank overdrafts to non-financial corporations 3.86 3.79 3.78 3.71 3.52 3.42 -42 -17 -10Loans to non-financial corporations of up to €1 million
with a floating rate and an initial rate fixation of up to one year 3.75 3.78 3.78 3.59 3.31 3.29 -56 -31 -2with an initial rate fixation of over five years 3.26 3.27 3.29 3.11 2.84 2.82 -45 -24 -2
Loans to non-financial corporations of over €1 million
with a floating rate and an initial rate fixation of up to one year 2.15 2.29 2.25 2.09 1.89 1.81 -41 -18 -8with an initial rate fixation of over five years 3.06 2.96 2.98 2.71 2.40 2.43 -63 -35 3
Memo itemsThree-month money market interest rate 0.23 0.29 0.31 0.21 0.08 0.09 -14 -12 1Two-year government bond yield 0.22 0.25 0.17 0.02 -0.10 -0.08 -26 -9 2Seven-year government bond yield 1.42 1.58 1.21 0.87 0.57 0.51 -83 -29 -6
Source: ECB.Note: Government bond yields refer to the euro area bond yields based on the ECB’s data on AAA-rated bonds (based on Fitch ratings), which currently include bonds from Austria, Finland, France, Germany and the Netherlands.1) Figures may not add up due to rounding.

45ECB
Monthly BulletinDecember 2014
Monetary and financial
developments
Economic and monEtary dEvElopmEnts
Turning to market funding conditions, from July to October 2014 the evolution of non-financial corporations’ cost of market debt varied across corporate bond rating categories. Spreads between bonds with higher ratings, such as A- and AA-rated corporate bonds and AAA-rated government bond yields, marginally narrowed, while spreads on bonds with lower ratings (“high yields”) widened by 38 basis points (see Chart 31). More recent data on market-based financing indicates that spreads on bonds with lower ratings narrowed in November 2014.
financial flowsThe annual rate of change in earnings per share of euro area non-financial corporations increased from July to October 2014. Specifically, the annual rate of change in the earnings per share of listed euro area companies was -0.7% in October 2014, up from -4.8% in July 2014 (see Chart 32). Looking ahead, based on indicators from market providers, market participants expect the rate of change in earnings per share to return to positive territory in the fourth quarter of this year.
The overall flow of external financing to non-financial corporations stabilised in the autumn, following a period of contraction. This improvement reflects a decline in the net redemptions of MFI loans to non-financial corporations and a decline in the net issuance of securities by firms (see Chart 33). However, the level of non-financial corporations’ external financing remains weak, mirroring the weakness in the economy, the continued deleveraging needs of firms in a number of countries, record-high cash holdings, and some persistent financing supply constraints, notably in the case of small and medium-sized enterprises (SMEs).
Adjusted for loan sales and securitisation, the annual growth rate of MFI loans to non-financial corporations stood at -2.1% in the third quarter of 2014, up from -2.7% in the previous quarter. In October 2014, the annual growth rate increased further, to -1.6%. The annual growth rate of debt securities issued declined to 6.7% in the third quarter of 2014,
chart 31 corporate bond spreads of non-financial corporations
(basis points; monthly averages)
0
400
800
1,200
1,600
2,000
2,400
0
100
200
300
400
500
600
1999 2001 2003 2005 2007 2009 2011 2013
euro-denominated non-financial AA-rated bonds (left-hand scale)euro-denominated non-financial A-rated bonds (left-hand scale)euro-denominated non-financial BBB-rated bonds (left-hand scale)euro-denominated high-yield bonds (right-hand scale)
Sources: Thomson Reuters and ECB calculations.Note: Bond spreads are calculated vis-à-vis AAA-rated government bond yields.
chart 32 earnings per share of listed non-financial corporations in the euro area
(annual percentage changes; monthly data)
-50
-40
-30
-20
-10
0
10
20
30
40
50
-50
-40
-30
-20
-10
0
10
20
30
40
50
2006 2007 2008 2009 2010 2011 2012 2013 2014 2015
realisedexpected
Sources: Thomson Reuters and ECB calculations.
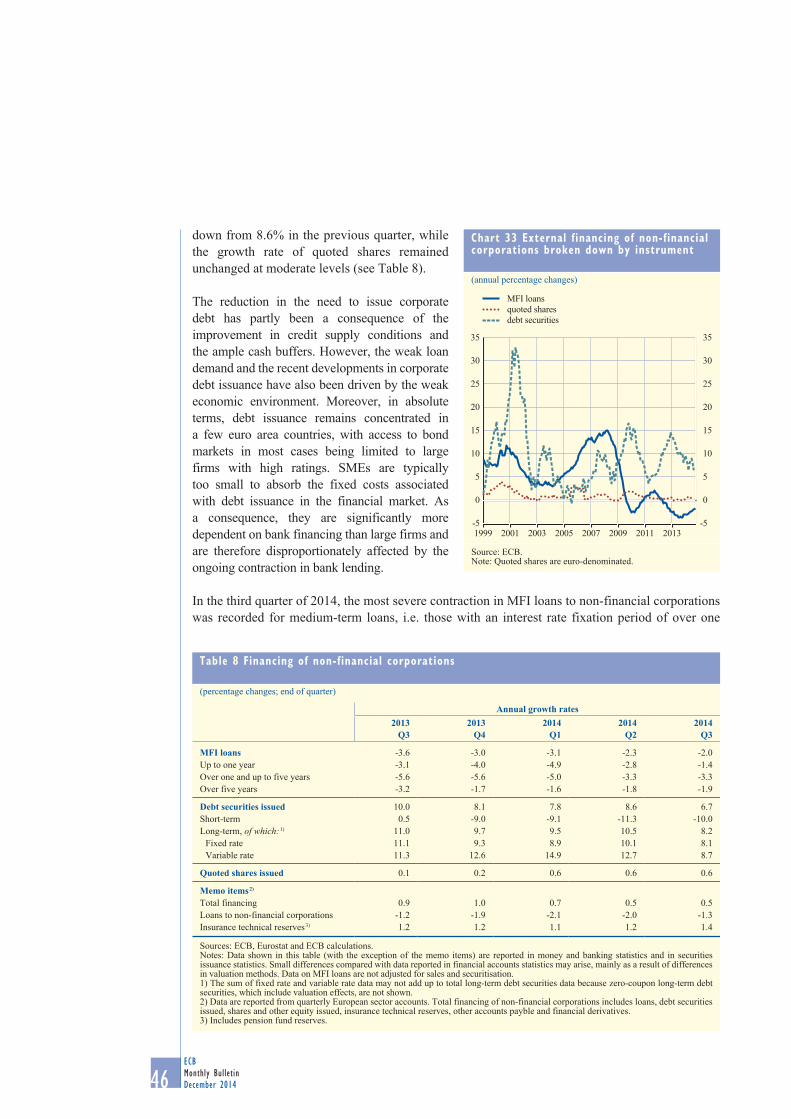
46ECBMonthly BulletinDecember 2014
down from 8.6% in the previous quarter, while the growth rate of quoted shares remained unchanged at moderate levels (see Table 8).
The reduction in the need to issue corporate debt has partly been a consequence of the improvement in credit supply conditions and the ample cash buffers. However, the weak loan demand and the recent developments in corporate debt issuance have also been driven by the weak economic environment. Moreover, in absolute terms, debt issuance remains concentrated in a few euro area countries, with access to bond markets in most cases being limited to large firms with high ratings. SMEs are typically too small to absorb the fixed costs associated with debt issuance in the financial market. As a consequence, they are significantly more dependent on bank financing than large firms and are therefore disproportionately affected by the ongoing contraction in bank lending.
In the third quarter of 2014, the most severe contraction in MFI loans to non-financial corporations was recorded for medium-term loans, i.e. those with an interest rate fixation period of over one
table 8 financing of non-financial corporations
(percentage changes; end of quarter)
Annual growth rates2013
Q32013
Q42014
Q12014
Q22014
Q3
MFI loans -3.6 -3.0 -3.1 -2.3 -2.0Up to one year -3.1 -4.0 -4.9 -2.8 -1.4Over one and up to five years -5.6 -5.6 -5.0 -3.3 -3.3Over five years -3.2 -1.7 -1.6 -1.8 -1.9
Debt securities issued 10.0 8.1 7.8 8.6 6.7Short-term 0.5 -9.0 -9.1 -11.3 -10.0Long-term, of which: 1) 11.0 9.7 9.5 10.5 8.2
Fixed rate 11.1 9.3 8.9 10.1 8.1Variable rate 11.3 12.6 14.9 12.7 8.7
Quoted shares issued 0.1 0.2 0.6 0.6 0.6
Memo items 2)
Total financing 0.9 1.0 0.7 0.5 0.5Loans to non-financial corporations -1.2 -1.9 -2.1 -2.0 -1.3Insurance technical reserves 3) 1.2 1.2 1.1 1.2 1.4
Sources: ECB, Eurostat and ECB calculations.Notes: Data shown in this table (with the exception of the memo items) are reported in money and banking statistics and in securities issuance statistics. Small differences compared with data reported in financial accounts statistics may arise, mainly as a result of differences in valuation methods. Data on MFI loans are not adjusted for sales and securitisation.1) The sum of fixed rate and variable rate data may not add up to total long-term debt securities data because zero-coupon long-term debt securities, which include valuation effects, are not shown.2) Data are reported from quarterly European sector accounts. Total financing of non-financial corporations includes loans, debt securities issued, shares and other equity issued, insurance technical reserves, other accounts payble and financial derivatives.3) Includes pension fund reserves.
chart 33 external financing of non-financial corporations broken down by instrument
(annual percentage changes)
-5
0
5
10
15
20
25
30
35
-5
0
5
10
15
20
25
30
35
1999 2001 2003 2005 2007 2009 2011 2013
MFI loansquoted sharesdebt securities
Source: ECB.Note: Quoted shares are euro-denominated.
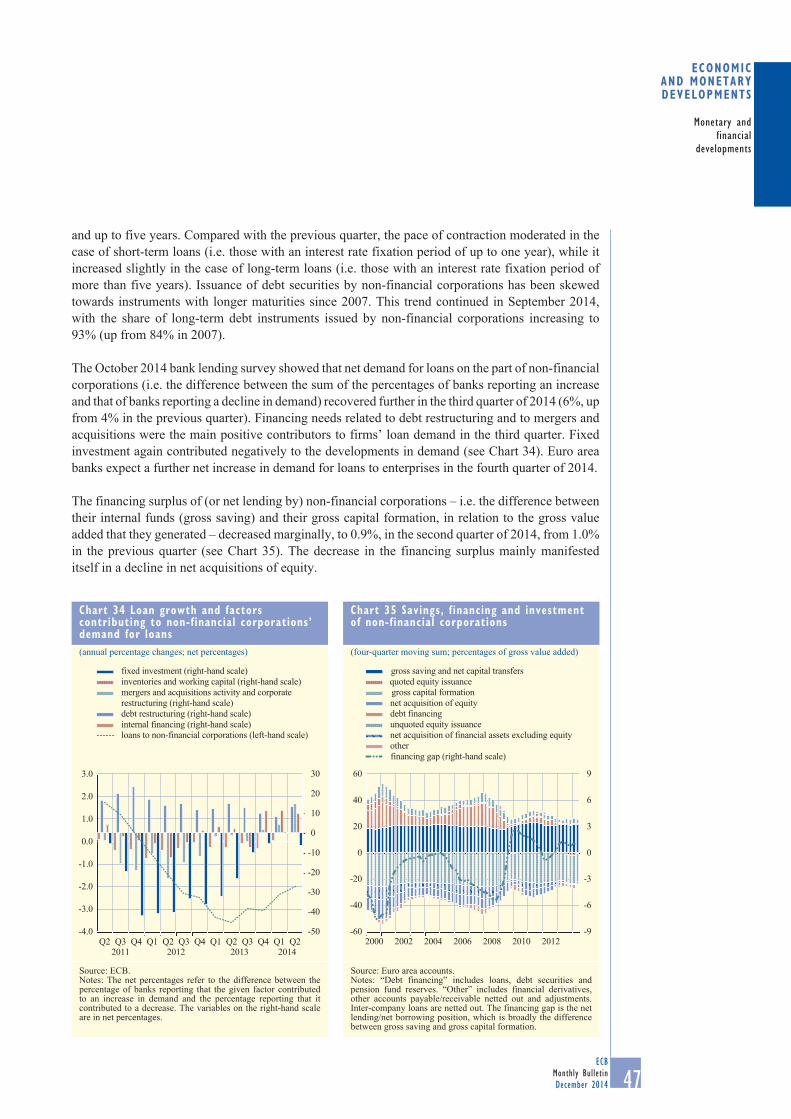
47ECB
Monthly BulletinDecember 2014
Monetary and financial
developments
Economic and monEtary dEvElopmEnts
and up to five years. Compared with the previous quarter, the pace of contraction moderated in the case of short-term loans (i.e. those with an interest rate fixation period of up to one year), while it increased slightly in the case of long-term loans (i.e. those with an interest rate fixation period of more than five years). Issuance of debt securities by non-financial corporations has been skewed towards instruments with longer maturities since 2007. This trend continued in September 2014, with the share of long-term debt instruments issued by non-financial corporations increasing to 93% (up from 84% in 2007).
The October 2014 bank lending survey showed that net demand for loans on the part of non-financial corporations (i.e. the difference between the sum of the percentages of banks reporting an increase and that of banks reporting a decline in demand) recovered further in the third quarter of 2014 (6%, up from 4% in the previous quarter). Financing needs related to debt restructuring and to mergers and acquisitions were the main positive contributors to firms’ loan demand in the third quarter. Fixed investment again contributed negatively to the developments in demand (see Chart 34). Euro area banks expect a further net increase in demand for loans to enterprises in the fourth quarter of 2014.
The financing surplus of (or net lending by) non-financial corporations – i.e. the difference between their internal funds (gross saving) and their gross capital formation, in relation to the gross value added that they generated – decreased marginally, to 0.9%, in the second quarter of 2014, from 1.0% in the previous quarter (see Chart 35). The decrease in the financing surplus mainly manifested itself in a decline in net acquisitions of equity.
chart 34 loan growth and factors contributing to non-financial corporations’ demand for loans(annual percentage changes; net percentages)
-4.0
-3.0
-2.0
-1.0
0.0
1.0
2.0
3.0
-50
-40
-30
-20
-10
0
10
20
30
Q22014
Q1Q4Q3Q22013
Q1Q4Q3Q22012
Q1Q4Q3Q22011
fixed investment (right-hand scale)inventories and working capital (right-hand scale)mergers and acquisitions activity and corporate restructuring (right-hand scale)debt restructuring (right-hand scale)internal financing (right-hand scale)loans to non-financial corporations (left-hand scale)
Source: ECB.Notes: The net percentages refer to the difference between the percentage of banks reporting that the given factor contributed to an increase in demand and the percentage reporting that it contributed to a decrease. The variables on the right-hand scale are in net percentages.
chart 35 savings, financing and investment of non-financial corporations
(four-quarter moving sum; percentages of gross value added)
-9
-6
-3
0
3
6
9
-60
-40
-20
0
20
40
60
2000 2002 2004 2006 2008 2010 2012
other
net acquisition of equity
net acquisition of financial assets excluding equity
gross capital formation
unquoted equity issuance
quoted equity issuance
debt financing
gross saving and net capital transfers
financing gap (right-hand scale)
Source: Euro area accounts.Notes: “Debt financing” includes loans, debt securities and pension fund reserves. “Other” includes financial derivatives, other accounts payable/receivable netted out and adjustments. Inter-company loans are netted out. The financing gap is the net lending/net borrowing position, which is broadly the difference between gross saving and gross capital formation.
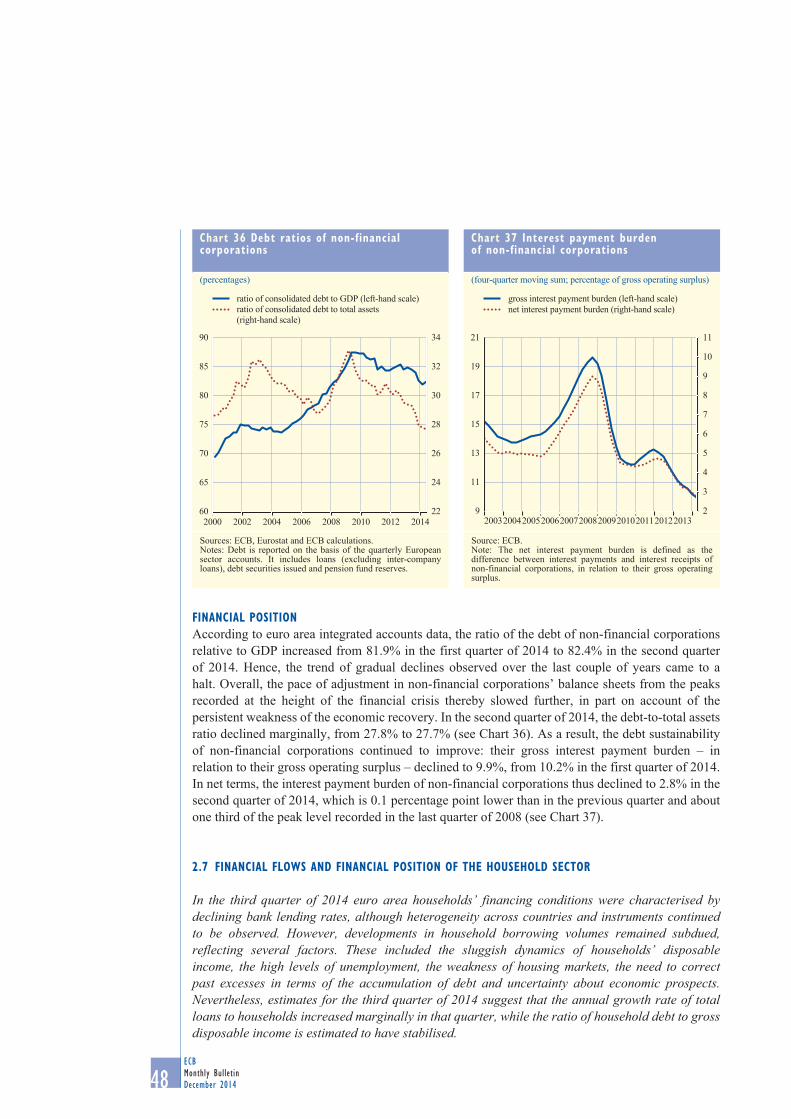
48ECBMonthly BulletinDecember 2014
financial positionAccording to euro area integrated accounts data, the ratio of the debt of non-financial corporations relative to GDP increased from 81.9% in the first quarter of 2014 to 82.4% in the second quarter of 2014. Hence, the trend of gradual declines observed over the last couple of years came to a halt. Overall, the pace of adjustment in non-financial corporations’ balance sheets from the peaks recorded at the height of the financial crisis thereby slowed further, in part on account of the persistent weakness of the economic recovery. In the second quarter of 2014, the debt-to-total assets ratio declined marginally, from 27.8% to 27.7% (see Chart 36). As a result, the debt sustainability of non-financial corporations continued to improve: their gross interest payment burden – in relation to their gross operating surplus – declined to 9.9%, from 10.2% in the first quarter of 2014. In net terms, the interest payment burden of non-financial corporations thus declined to 2.8% in the second quarter of 2014, which is 0.1 percentage point lower than in the previous quarter and about one third of the peak level recorded in the last quarter of 2008 (see Chart 37).
2.7 financial flows anD financial position of the householD sector
In the third quarter of 2014 euro area households’ financing conditions were characterised by declining bank lending rates, although heterogeneity across countries and instruments continued to be observed. However, developments in household borrowing volumes remained subdued, reflecting several factors. These included the sluggish dynamics of households’ disposable income, the high levels of unemployment, the weakness of housing markets, the need to correct past excesses in terms of the accumulation of debt and uncertainty about economic prospects. Nevertheless, estimates for the third quarter of 2014 suggest that the annual growth rate of total loans to households increased marginally in that quarter, while the ratio of household debt to gross disposable income is estimated to have stabilised.
chart 36 Debt ratios of non-financial corporations
(percentages)
22
24
26
28
30
32
34
60
65
70
75
80
85
90
2000 2002 2004 2006 2008 2010 2012 2014
ratio of consolidated debt to GDP (left-hand scale)ratio of consolidated debt to total assets (right-hand scale)
Sources: ECB, Eurostat and ECB calculations.Notes: Debt is reported on the basis of the quarterly European sector accounts. It includes loans (excluding inter-company loans), debt securities issued and pension fund reserves.
chart 37 interest payment burden of non-financial corporations
(four-quarter moving sum; percentage of gross operating surplus)
2
3
4
5
6
7
8
9
10
11
9
11
13
15
17
19
21
20032004200520062007200820092010201120122013
gross interest payment burden (left-hand scale)net interest payment burden (right-hand scale)
Source: ECB.Note: The net interest payment burden is defined as the difference between interest payments and interest receipts of non-financial corporations, in relation to their gross operating surplus.
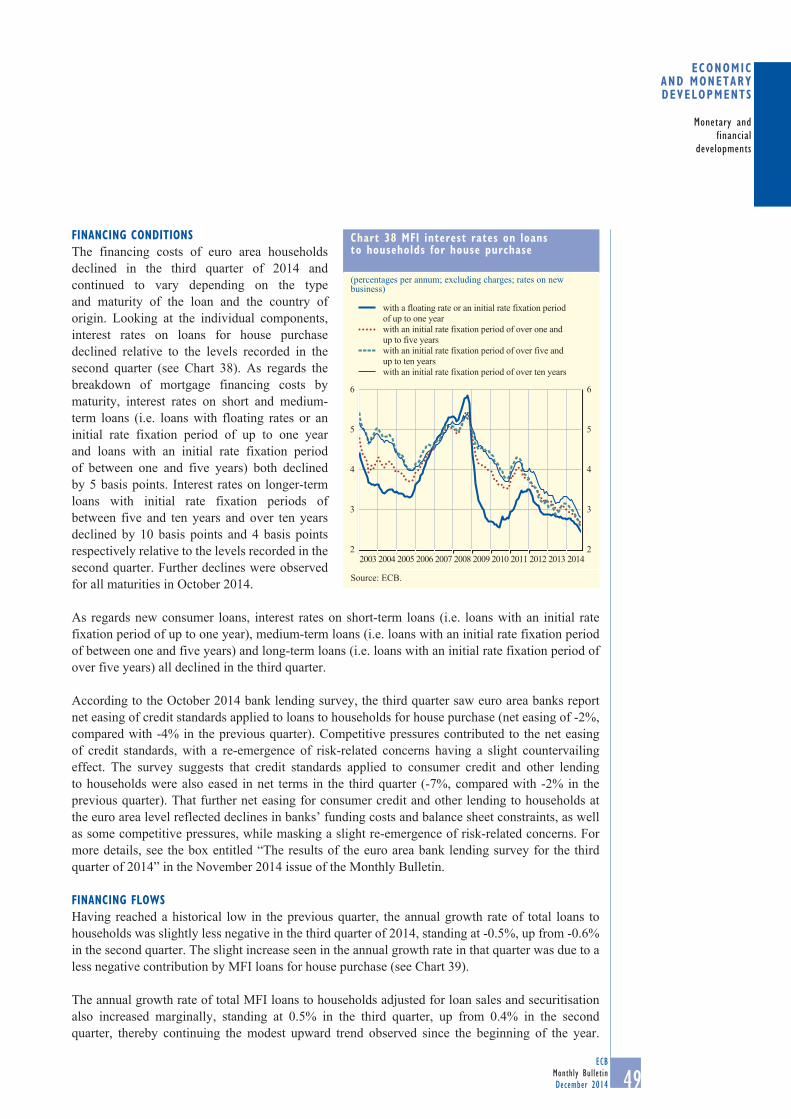
49ECB
Monthly BulletinDecember 2014
Monetary and financial
developments
Economic and monEtary dEvElopmEnts
financinG conDitionsThe financing costs of euro area households declined in the third quarter of 2014 and continued to vary depending on the type and maturity of the loan and the country of origin. Looking at the individual components, interest rates on loans for house purchase declined relative to the levels recorded in the second quarter (see Chart 38). As regards the breakdown of mortgage financing costs by maturity, interest rates on short and medium-term loans (i.e. loans with floating rates or an initial rate fixation period of up to one year and loans with an initial rate fixation period of between one and five years) both declined by 5 basis points. Interest rates on longer-term loans with initial rate fixation periods of between five and ten years and over ten years declined by 10 basis points and 4 basis points respectively relative to the levels recorded in the second quarter. Further declines were observed for all maturities in October 2014.
As regards new consumer loans, interest rates on short-term loans (i.e. loans with an initial rate fixation period of up to one year), medium-term loans (i.e. loans with an initial rate fixation period of between one and five years) and long-term loans (i.e. loans with an initial rate fixation period of over five years) all declined in the third quarter.
According to the October 2014 bank lending survey, the third quarter saw euro area banks report net easing of credit standards applied to loans to households for house purchase (net easing of -2%, compared with -4% in the previous quarter). Competitive pressures contributed to the net easing of credit standards, with a re-emergence of risk-related concerns having a slight countervailing effect. The survey suggests that credit standards applied to consumer credit and other lending to households were also eased in net terms in the third quarter (-7%, compared with -2% in the previous quarter). That further net easing for consumer credit and other lending to households at the euro area level reflected declines in banks’ funding costs and balance sheet constraints, as well as some competitive pressures, while masking a slight re-emergence of risk-related concerns. For more details, see the box entitled “The results of the euro area bank lending survey for the third quarter of 2014” in the November 2014 issue of the Monthly Bulletin.
financinG flowsHaving reached a historical low in the previous quarter, the annual growth rate of total loans to households was slightly less negative in the third quarter of 2014, standing at -0.5%, up from -0.6% in the second quarter. The slight increase seen in the annual growth rate in that quarter was due to a less negative contribution by MFI loans for house purchase (see Chart 39).
The annual growth rate of total MFI loans to households adjusted for loan sales and securitisation also increased marginally, standing at 0.5% in the third quarter, up from 0.4% in the second quarter, thereby continuing the modest upward trend observed since the beginning of the year.
chart 38 mfi interest rates on loans to households for house purchase
(percentages per annum; excluding charges; rates on new business)
2
3
4
5
6
2
3
4
5
6
2003 2004 2005 2006 2007 2008 2009 2010 2011 2012 2013 2014
with a floating rate or an initial rate fixation period of up to one yearwith an initial rate fixation period of over one andup to five yearswith an initial rate fixation period of over five and up to ten yearswith an initial rate fixation period of over ten years
Source: ECB.
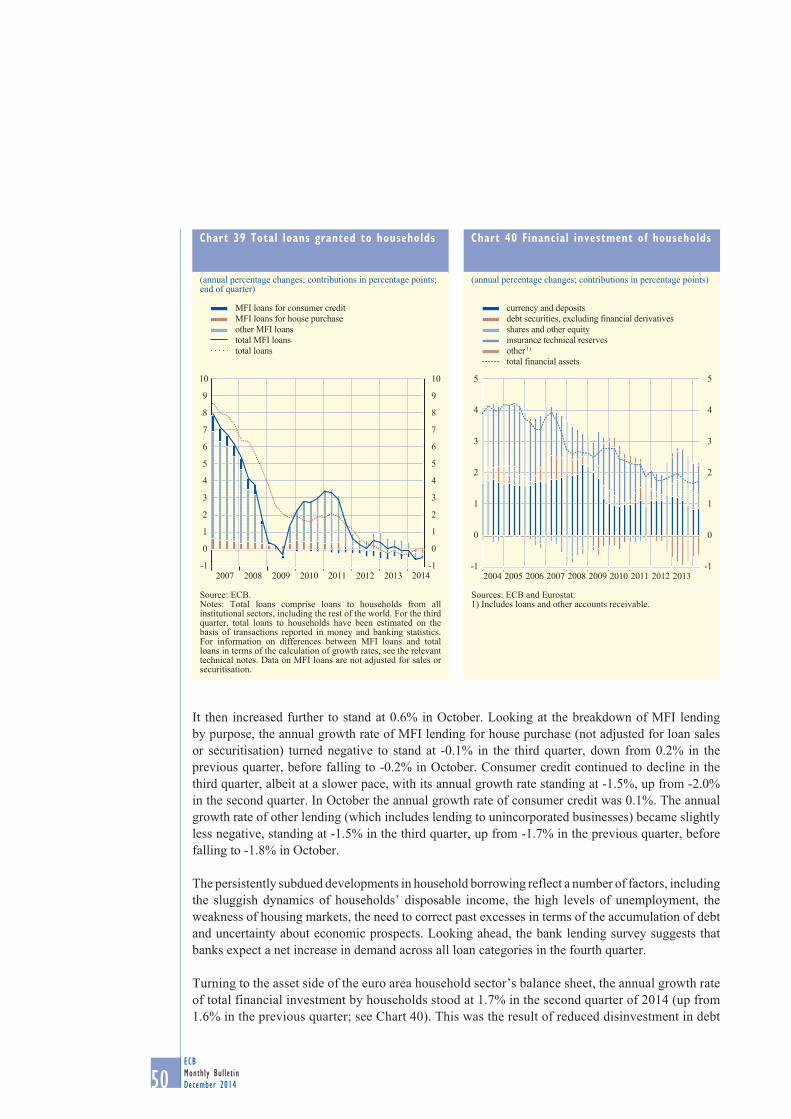
50ECBMonthly BulletinDecember 2014
It then increased further to stand at 0.6% in October. Looking at the breakdown of MFI lending by purpose, the annual growth rate of MFI lending for house purchase (not adjusted for loan sales or securitisation) turned negative to stand at -0.1% in the third quarter, down from 0.2% in the previous quarter, before falling to -0.2% in October. Consumer credit continued to decline in the third quarter, albeit at a slower pace, with its annual growth rate standing at -1.5%, up from -2.0% in the second quarter. In October the annual growth rate of consumer credit was 0.1%. The annual growth rate of other lending (which includes lending to unincorporated businesses) became slightly less negative, standing at -1.5% in the third quarter, up from -1.7% in the previous quarter, before falling to -1.8% in October.
The persistently subdued developments in household borrowing reflect a number of factors, including the sluggish dynamics of households’ disposable income, the high levels of unemployment, the weakness of housing markets, the need to correct past excesses in terms of the accumulation of debt and uncertainty about economic prospects. Looking ahead, the bank lending survey suggests that banks expect a net increase in demand across all loan categories in the fourth quarter.
Turning to the asset side of the euro area household sector’s balance sheet, the annual growth rate of total financial investment by households stood at 1.7% in the second quarter of 2014 (up from 1.6% in the previous quarter; see Chart 40). This was the result of reduced disinvestment in debt
chart 39 total loans granted to households
(annual percentage changes; contributions in percentage points; end of quarter)
-1
0
1
2
3
4
5
6
7
8
9
10
-1
0
1
2
3
4
5
6
7
8
9
10
2007 2008 2009 2010 2011 2012 2013 2014
MFI loans for consumer creditMFI loans for house purchaseother MFI loanstotal MFI loanstotal loans
Source: ECB.Notes: Total loans comprise loans to households from all institutional sectors, including the rest of the world. For the third quarter, total loans to households have been estimated on the basis of transactions reported in money and banking statistics. For information on differences between MFI loans and total loans in terms of the calculation of growth rates, see the relevant technical notes. Data on MFI loans are not adjusted for sales or securitisation.
chart 40 financial investment of households
(annual percentage changes; contributions in percentage points)
-1
0
1
2
3
4
5
-1
0
1
2
3
4
5
2004 2005 2006 2007 2008 2009 2010 2011 2012 2013
currency and depositsdebt securities, excluding financial derivativesshares and other equityinsurance technical reservesother 1)
total financial assets
Sources: ECB and Eurostat.1) Includes loans and other accounts receivable.
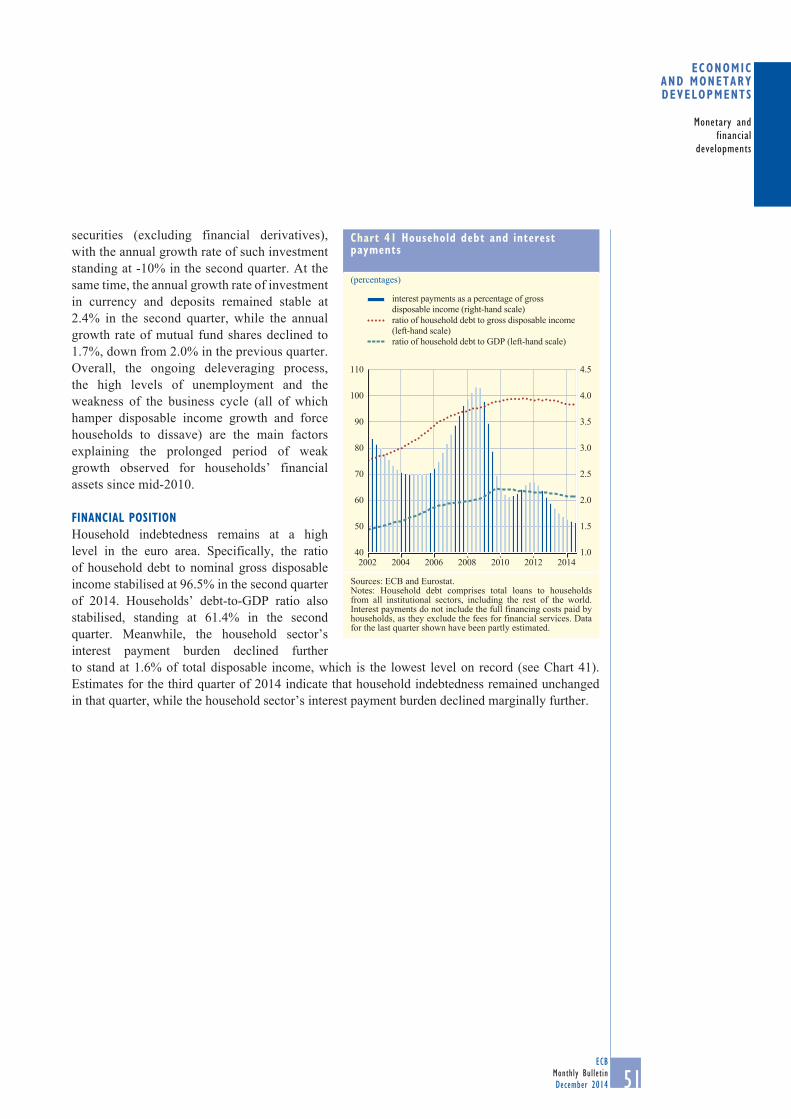
51ECB
Monthly BulletinDecember 2014
Monetary and financial
developments
Economic and monEtary dEvElopmEnts
securities (excluding financial derivatives), with the annual growth rate of such investment standing at -10% in the second quarter. At the same time, the annual growth rate of investment in currency and deposits remained stable at 2.4% in the second quarter, while the annual growth rate of mutual fund shares declined to 1.7%, down from 2.0% in the previous quarter. Overall, the ongoing deleveraging process, the high levels of unemployment and the weakness of the business cycle (all of which hamper disposable income growth and force households to dissave) are the main factors explaining the prolonged period of weak growth observed for households’ financial assets since mid-2010.
financial positionHousehold indebtedness remains at a high level in the euro area. Specifically, the ratio of household debt to nominal gross disposable income stabilised at 96.5% in the second quarter of 2014. Households’ debt-to-GDP ratio also stabilised, standing at 61.4% in the second quarter. Meanwhile, the household sector’s interest payment burden declined further to stand at 1.6% of total disposable income, which is the lowest level on record (see Chart 41). Estimates for the third quarter of 2014 indicate that household indebtedness remained unchanged in that quarter, while the household sector’s interest payment burden declined marginally further.
chart 41 household debt and interest payments
(percentages)
1.0
1.5
2.0
2.5
3.0
3.5
4.0
4.5
40
50
60
70
80
90
100
110
2002 2004 2006 2008 2010 2012 2014
interest payments as a percentage of gross disposable income (right-hand scale)ratio of household debt to gross disposable income (left-hand scale)ratio of household debt to GDP (left-hand scale)
Sources: ECB and Eurostat.Notes: Household debt comprises total loans to households from all institutional sectors, including the rest of the world. Interest payments do not include the full financing costs paid by households, as they exclude the fees for financial services. Data for the last quarter shown have been partly estimated.
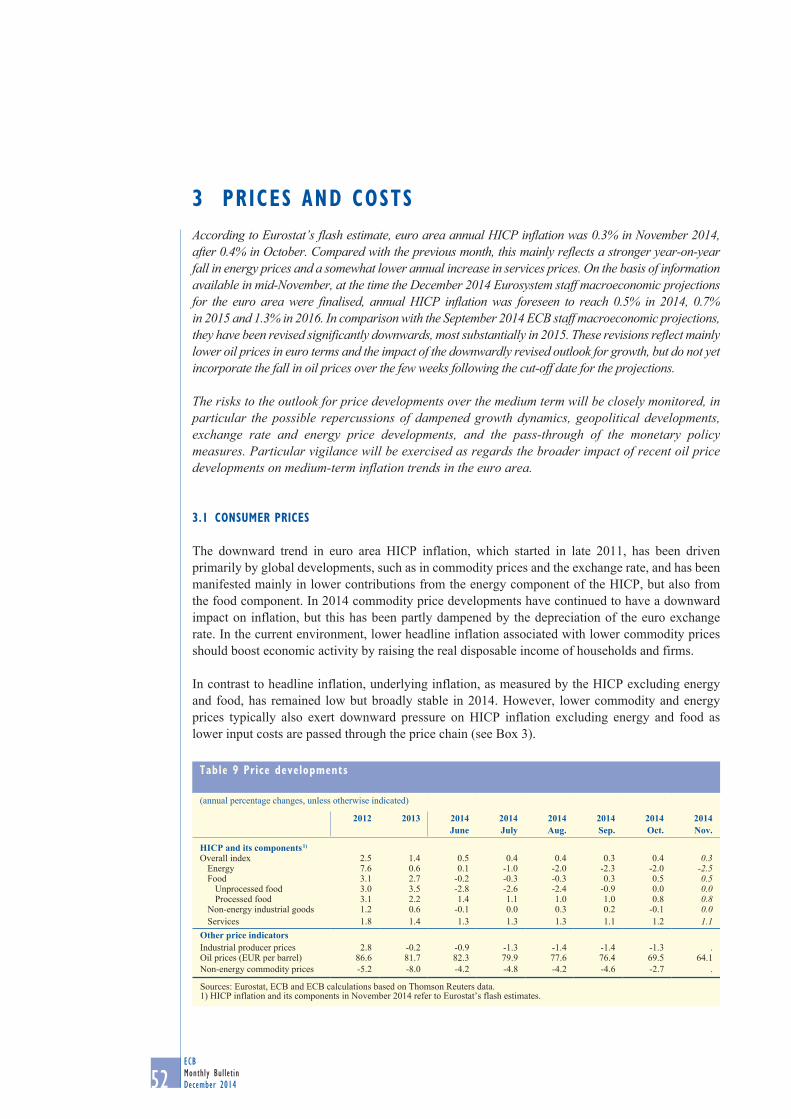
52ECBMonthly BulletinDecember 2014
3 prices and costsAccording to Eurostat’s flash estimate, euro area annual HICP inflation was 0.3% in November 2014, after 0.4% in October. Compared with the previous month, this mainly reflects a stronger year-on-year fall in energy prices and a somewhat lower annual increase in services prices. On the basis of information available in mid-November, at the time the December 2014 Eurosystem staff macroeconomic projections for the euro area were finalised, annual HICP inflation was foreseen to reach 0.5% in 2014, 0.7% in 2015 and 1.3% in 2016. In comparison with the September 2014 ECB staff macroeconomic projections, they have been revised significantly downwards, most substantially in 2015. These revisions reflect mainly lower oil prices in euro terms and the impact of the downwardly revised outlook for growth, but do not yet incorporate the fall in oil prices over the few weeks following the cut-off date for the projections.
The risks to the outlook for price developments over the medium term will be closely monitored, in particular the possible repercussions of dampened growth dynamics, geopolitical developments, exchange rate and energy price developments, and the pass-through of the monetary policy measures. Particular vigilance will be exercised as regards the broader impact of recent oil price developments on medium-term inflation trends in the euro area.
3.1 consumer prices
The downward trend in euro area HICP inflation, which started in late 2011, has been driven primarily by global developments, such as in commodity prices and the exchange rate, and has been manifested mainly in lower contributions from the energy component of the HICP, but also from the food component. In 2014 commodity price developments have continued to have a downward impact on inflation, but this has been partly dampened by the depreciation of the euro exchange rate. In the current environment, lower headline inflation associated with lower commodity prices should boost economic activity by raising the real disposable income of households and firms.
In contrast to headline inflation, underlying inflation, as measured by the HICP excluding energy and food, has remained low but broadly stable in 2014. However, lower commodity and energy prices typically also exert downward pressure on HICP inflation excluding energy and food as lower input costs are passed through the price chain (see Box 3).
table 9 price developments
(annual percentage changes, unless otherwise indicated)
2012 2013 2014June
2014July
2014Aug.
2014Sep.
2014Oct.
2014Nov.
HICP and its components 1) Overall index 2.5 1.4 0.5 0.4 0.4 0.3 0.4 0.3
Energy 7.6 0.6 0.1 -1.0 -2.0 -2.3 -2.0 -2.5Food 3.1 2.7 -0.2 -0.3 -0.3 0.3 0.5 0.5
Unprocessed food 3.0 3.5 -2.8 -2.6 -2.4 -0.9 0.0 0.0Processed food 3.1 2.2 1.4 1.1 1.0 1.0 0.8 0.8
Non-energy industrial goods 1.2 0.6 -0.1 0.0 0.3 0.2 -0.1 0.0Services 1.8 1.4 1.3 1.3 1.3 1.1 1.2 1.1
Other price indicatorsIndustrial producer prices 2.8 -0.2 -0.9 -1.3 -1.4 -1.4 -1.3 .Oil prices (EUR per barrel) 86.6 81.7 82.3 79.9 77.6 76.4 69.5 64.1Non-energy commodity prices -5.2 -8.0 -4.2 -4.8 -4.2 -4.6 -2.7 .
Sources: Eurostat, ECB and ECB calculations based on Thomson Reuters data.1) HICP inflation and its components in November 2014 refer to Eurostat’s flash estimates.
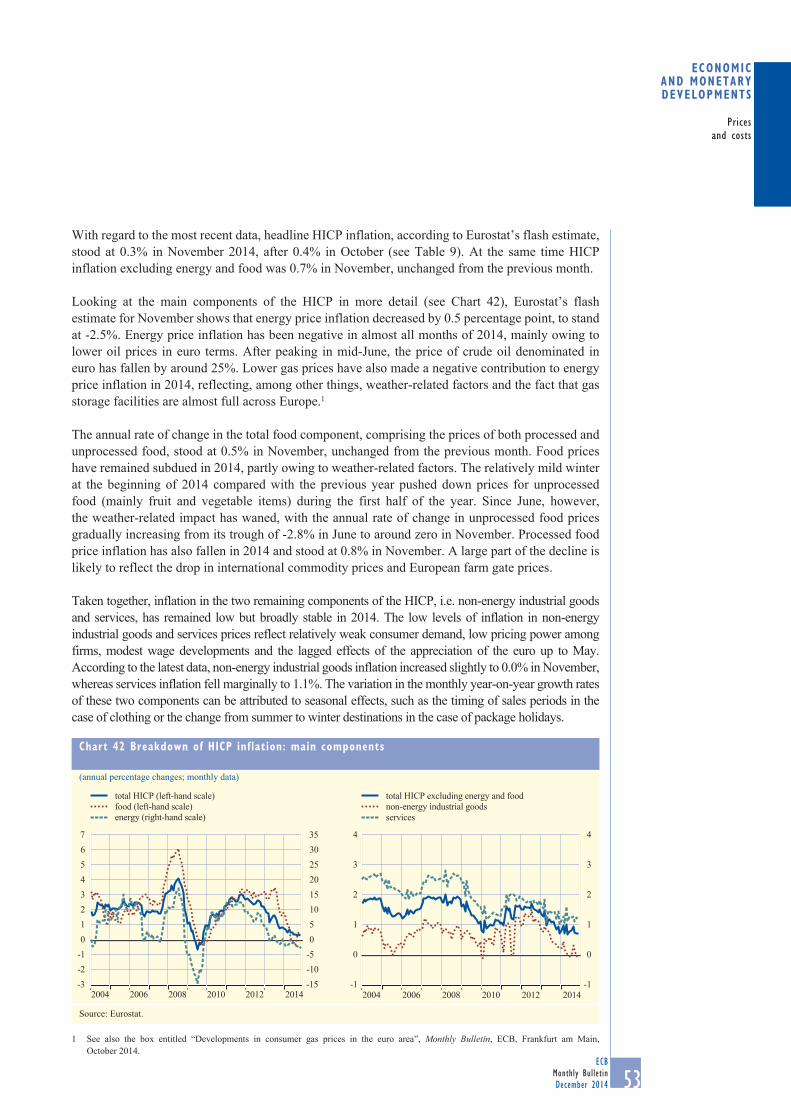
53ECB
Monthly BulletinDecember 2014
Pricesand costs
Economic and monEtary dEvElopmEnts
With regard to the most recent data, headline HICP inflation, according to Eurostat’s flash estimate, stood at 0.3% in November 2014, after 0.4% in October (see Table 9). At the same time HICP inflation excluding energy and food was 0.7% in November, unchanged from the previous month.
Looking at the main components of the HICP in more detail (see Chart 42), Eurostat’s flash estimate for November shows that energy price inflation decreased by 0.5 percentage point, to stand at -2.5%. Energy price inflation has been negative in almost all months of 2014, mainly owing to lower oil prices in euro terms. After peaking in mid-June, the price of crude oil denominated in euro has fallen by around 25%. Lower gas prices have also made a negative contribution to energy price inflation in 2014, reflecting, among other things, weather-related factors and the fact that gas storage facilities are almost full across Europe.1
The annual rate of change in the total food component, comprising the prices of both processed and unprocessed food, stood at 0.5% in November, unchanged from the previous month. Food prices have remained subdued in 2014, partly owing to weather-related factors. The relatively mild winter at the beginning of 2014 compared with the previous year pushed down prices for unprocessed food (mainly fruit and vegetable items) during the first half of the year. Since June, however, the weather-related impact has waned, with the annual rate of change in unprocessed food prices gradually increasing from its trough of -2.8% in June to around zero in November. Processed food price inflation has also fallen in 2014 and stood at 0.8% in November. A large part of the decline is likely to reflect the drop in international commodity prices and European farm gate prices.
Taken together, inflation in the two remaining components of the HICP, i.e. non-energy industrial goods and services, has remained low but broadly stable in 2014. The low levels of inflation in non-energy industrial goods and services prices reflect relatively weak consumer demand, low pricing power among firms, modest wage developments and the lagged effects of the appreciation of the euro up to May. According to the latest data, non-energy industrial goods inflation increased slightly to 0.0% in November, whereas services inflation fell marginally to 1.1%. The variation in the monthly year-on-year growth rates of these two components can be attributed to seasonal effects, such as the timing of sales periods in the case of clothing or the change from summer to winter destinations in the case of package holidays.
1 See also the box entitled “Developments in consumer gas prices in the euro area”, Monthly Bulletin, ECB, Frankfurt am Main, October 2014.
chart 42 breakdown of hicp inflation: main components
(annual percentage changes; monthly data)
-3-2-101234567
-15-10-505101520253035
2014
total HICP (left-hand scale)food (left-hand scale)energy (right-hand scale)
2004 2006 2008 2010 2012-1
0
1
2
3
4
-1
0
1
2
3
4
2014
total HICP excluding energy and foodnon-energy industrial goodsservices
2004 2006 2008 2010 2012
Source: Eurostat.
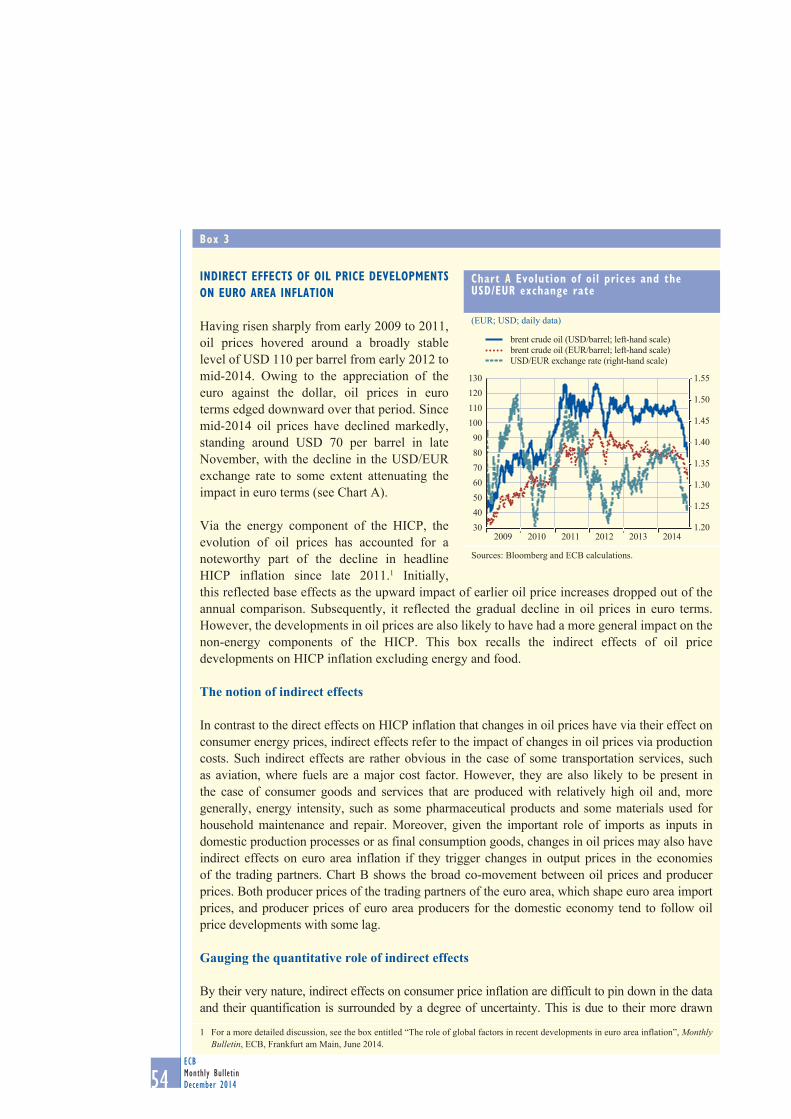
54ECBMonthly BulletinDecember 2014
box 3
inDirect effects of oil price Developments on euro area inflation
Having risen sharply from early 2009 to 2011, oil prices hovered around a broadly stable level of USD 110 per barrel from early 2012 to mid-2014. Owing to the appreciation of the euro against the dollar, oil prices in euro terms edged downward over that period. Since mid-2014 oil prices have declined markedly, standing around USD 70 per barrel in late November, with the decline in the USD/EUR exchange rate to some extent attenuating the impact in euro terms (see Chart A).
Via the energy component of the HICP, the evolution of oil prices has accounted for a noteworthy part of the decline in headline HICP inflation since late 2011.1 Initially, this reflected base effects as the upward impact of earlier oil price increases dropped out of the annual comparison. Subsequently, it reflected the gradual decline in oil prices in euro terms. However, the developments in oil prices are also likely to have had a more general impact on the non-energy components of the HICP. This box recalls the indirect effects of oil price developments on HICP inflation excluding energy and food.
The notion of indirect effects
In contrast to the direct effects on HICP inflation that changes in oil prices have via their effect on consumer energy prices, indirect effects refer to the impact of changes in oil prices via production costs. Such indirect effects are rather obvious in the case of some transportation services, such as aviation, where fuels are a major cost factor. However, they are also likely to be present in the case of consumer goods and services that are produced with relatively high oil and, more generally, energy intensity, such as some pharmaceutical products and some materials used for household maintenance and repair. Moreover, given the important role of imports as inputs in domestic production processes or as final consumption goods, changes in oil prices may also have indirect effects on euro area inflation if they trigger changes in output prices in the economies of the trading partners. Chart B shows the broad co-movement between oil prices and producer prices. Both producer prices of the trading partners of the euro area, which shape euro area import prices, and producer prices of euro area producers for the domestic economy tend to follow oil price developments with some lag.
Gauging the quantitative role of indirect effects
By their very nature, indirect effects on consumer price inflation are difficult to pin down in the data and their quantification is surrounded by a degree of uncertainty. This is due to their more drawn
1 For a more detailed discussion, see the box entitled “The role of global factors in recent developments in euro area inflation”, Monthly Bulletin, ECB, Frankfurt am Main, June 2014.
chart a evolution of oil prices and the usD/eur exchange rate
(EUR; USD; daily data)
1.20
1.25
1.30
1.35
1.40
1.45
1.50
1.55
30 40 50 60 70 80 90
100 110 120 130
2009 2010 2011 2012 2013 2014
brent crude oil (USD/barrel; left-hand scale) brent crude oil (EUR/barrel; left-hand scale) USD/EUR exchange rate (right-hand scale)
Sources: Bloomberg and ECB calculations.
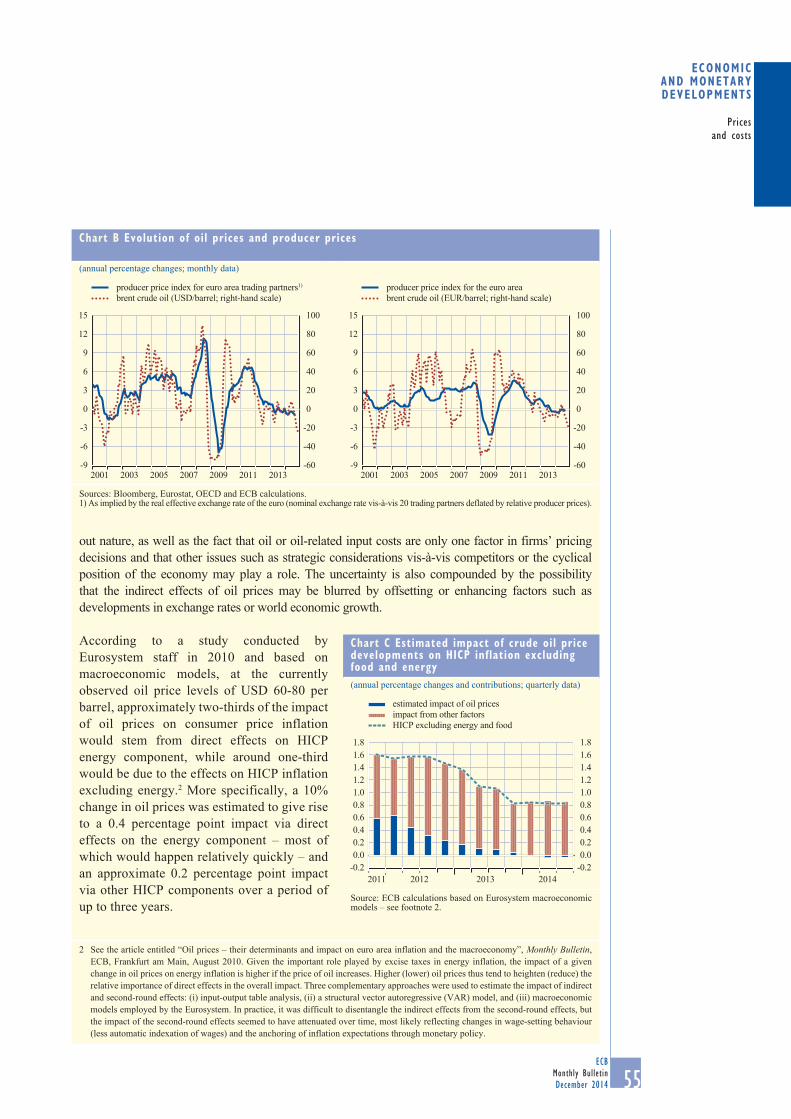
55ECB
Monthly BulletinDecember 2014
Pricesand costs
Economic and monEtary dEvElopmEnts
out nature, as well as the fact that oil or oil-related input costs are only one factor in firms’ pricing decisions and that other issues such as strategic considerations vis-à-vis competitors or the cyclical position of the economy may play a role. The uncertainty is also compounded by the possibility that the indirect effects of oil prices may be blurred by offsetting or enhancing factors such as developments in exchange rates or world economic growth.
According to a study conducted by Eurosystem staff in 2010 and based on macroeconomic models, at the currently observed oil price levels of USD 60-80 per barrel, approximately two-thirds of the impact of oil prices on consumer price inflation would stem from direct effects on HICP energy component, while around one-third would be due to the effects on HICP inflation excluding energy.2 More specifically, a 10% change in oil prices was estimated to give rise to a 0.4 percentage point impact via direct effects on the energy component – most of which would happen relatively quickly – and an approximate 0.2 percentage point impact via other HICP components over a period of up to three years.
2 See the article entitled “Oil prices – their determinants and impact on euro area inflation and the macroeconomy”, Monthly Bulletin, ECB, Frankfurt am Main, August 2010. Given the important role played by excise taxes in energy inflation, the impact of a given change in oil prices on energy inflation is higher if the price of oil increases. Higher (lower) oil prices thus tend to heighten (reduce) the relative importance of direct effects in the overall impact. Three complementary approaches were used to estimate the impact of indirect and second-round effects: (i) input-output table analysis, (ii) a structural vector autoregressive (VAR) model, and (iii) macroeconomic models employed by the Eurosystem. In practice, it was difficult to disentangle the indirect effects from the second-round effects, but the impact of the second-round effects seemed to have attenuated over time, most likely reflecting changes in wage-setting behaviour (less automatic indexation of wages) and the anchoring of inflation expectations through monetary policy.
chart c estimated impact of crude oil price developments on hicp inflation excluding food and energy(annual percentage changes and contributions; quarterly data)
-0.20.00.20.40.60.81.01.21.41.61.8
-0.20.00.20.40.60.81.01.21.41.61.8
2011 2012 2013 2014
impact from other factorsestimated impact of oil prices
HICP excluding energy and food
Source: ECB calculations based on Eurosystem macroeconomic models – see footnote 2.
chart b evolution of oil prices and producer prices
(annual percentage changes; monthly data)
-60
-40
-20
0
20
40
60
80
100
-9
-6
-3
0
3
6
9
12
15
2001 2003 2005 2007 2009 2011 2013
producer price index for euro area trading partners1)
brent crude oil (USD/barrel; right-hand scale)
-60
-40
-20
0
20
40
60
80
100
-9
-6
-3
0
3
6
9
12
15
producer price index for the euro areabrent crude oil (EUR/barrel; right-hand scale)
2001 2003 2005 2007 2009 2011 2013
Sources: Bloomberg, Eurostat, OECD and ECB calculations.1) As implied by the real effective exchange rate of the euro (nominal exchange rate vis-à-vis 20 trading partners deflated by relative producer prices).
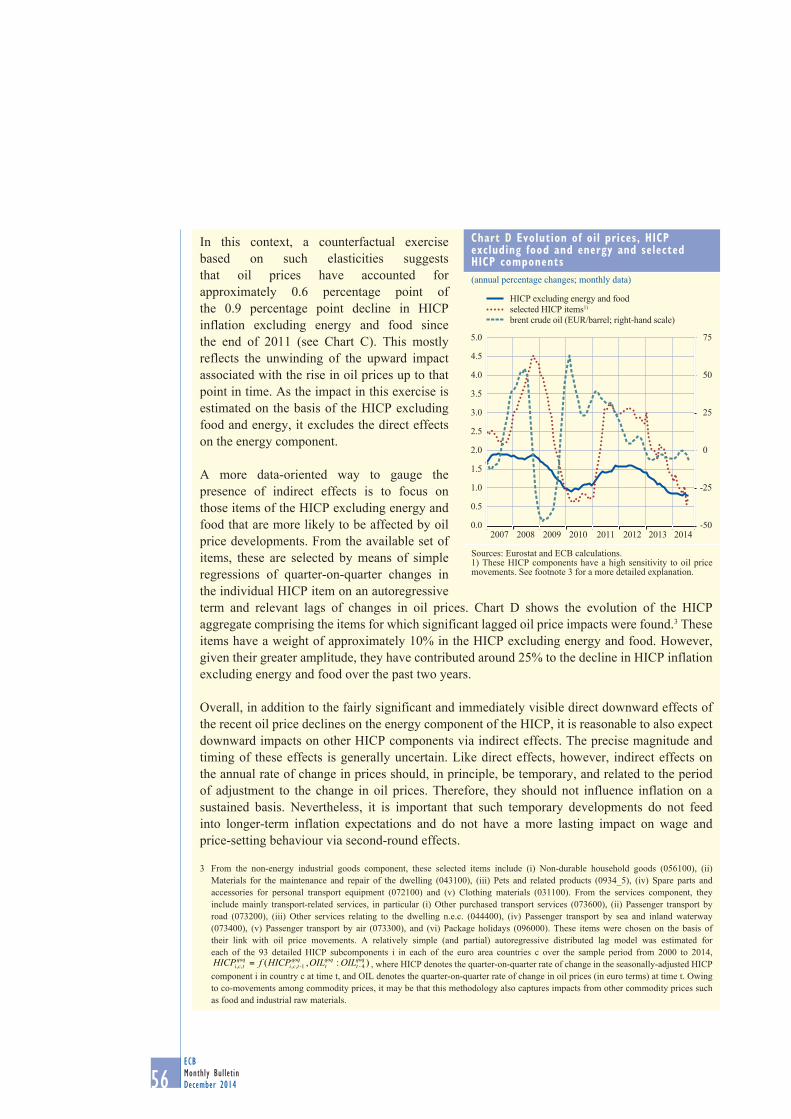
56ECBMonthly BulletinDecember 2014
In this context, a counterfactual exercise based on such elasticities suggests that oil prices have accounted for approximately 0.6 percentage point of the 0.9 percentage point decline in HICP inflation excluding energy and food since the end of 2011 (see Chart C). This mostly reflects the unwinding of the upward impact associated with the rise in oil prices up to that point in time. As the impact in this exercise is estimated on the basis of the HICP excluding food and energy, it excludes the direct effects on the energy component.
A more data-oriented way to gauge the presence of indirect effects is to focus on those items of the HICP excluding energy and food that are more likely to be affected by oil price developments. From the available set of items, these are selected by means of simple regressions of quarter-on-quarter changes in the individual HICP item on an autoregressive term and relevant lags of changes in oil prices. Chart D shows the evolution of the HICP aggregate comprising the items for which significant lagged oil price impacts were found.3 These items have a weight of approximately 10% in the HICP excluding energy and food. However, given their greater amplitude, they have contributed around 25% to the decline in HICP inflation excluding energy and food over the past two years.
Overall, in addition to the fairly significant and immediately visible direct downward effects of the recent oil price declines on the energy component of the HICP, it is reasonable to also expect downward impacts on other HICP components via indirect effects. The precise magnitude and timing of these effects is generally uncertain. Like direct effects, however, indirect effects on the annual rate of change in prices should, in principle, be temporary, and related to the period of adjustment to the change in oil prices. Therefore, they should not influence inflation on a sustained basis. Nevertheless, it is important that such temporary developments do not feed into longer-term inflation expectations and do not have a more lasting impact on wage and price-setting behaviour via second-round effects.
3 From the non-energy industrial goods component, these selected items include (i) Non-durable household goods (056100), (ii) Materials for the maintenance and repair of the dwelling (043100), (iii) Pets and related products (0934_5), (iv) Spare parts and accessories for personal transport equipment (072100) and (v) Clothing materials (031100). From the services component, they include mainly transport-related services, in particular (i) Other purchased transport services (073600), (ii) Passenger transport by road (073200), (iii) Other services relating to the dwelling n.e.c. (044400), (iv) Passenger transport by sea and inland waterway (073400), (v) Passenger transport by air (073300), and (vi) Package holidays (096000). These items were chosen on the basis of their link with oil price movements. A relatively simple (and partial) autoregressive distributed lag model was estimated for each of the 93 detailed HICP subcomponents i in each of the euro area countries c over the sample period from 2000 to 2014,
):,( 41,,,,qoqt
qoqt
qoqtci
qoqtci OILOILHICPfHICP --= , where HICP denotes the quarter-on-quarter rate of change in the seasonally-adjusted HICP
component i in country c at time t, and OIL denotes the quarter-on-quarter rate of change in oil prices (in euro terms) at time t. Owing to co-movements among commodity prices, it may be that this methodology also captures impacts from other commodity prices such as food and industrial raw materials.
chart D evolution of oil prices, hicp excluding food and energy and selected hicp components(annual percentage changes; monthly data)
-50
-25
0
25
50
75
0.0
0.5
1.0
1.5
2.0
2.5
3.0
3.5
4.0
4.5
5.0
2007 2008 2009 2010 2011 2012 2013 2014
HICP excluding energy and foodselected HICP items1)
brent crude oil (EUR/barrel; right-hand scale)
Sources: Eurostat and ECB calculations.1) These HICP components have a high sensitivity to oil price movements. See footnote 3 for a more detailed explanation.
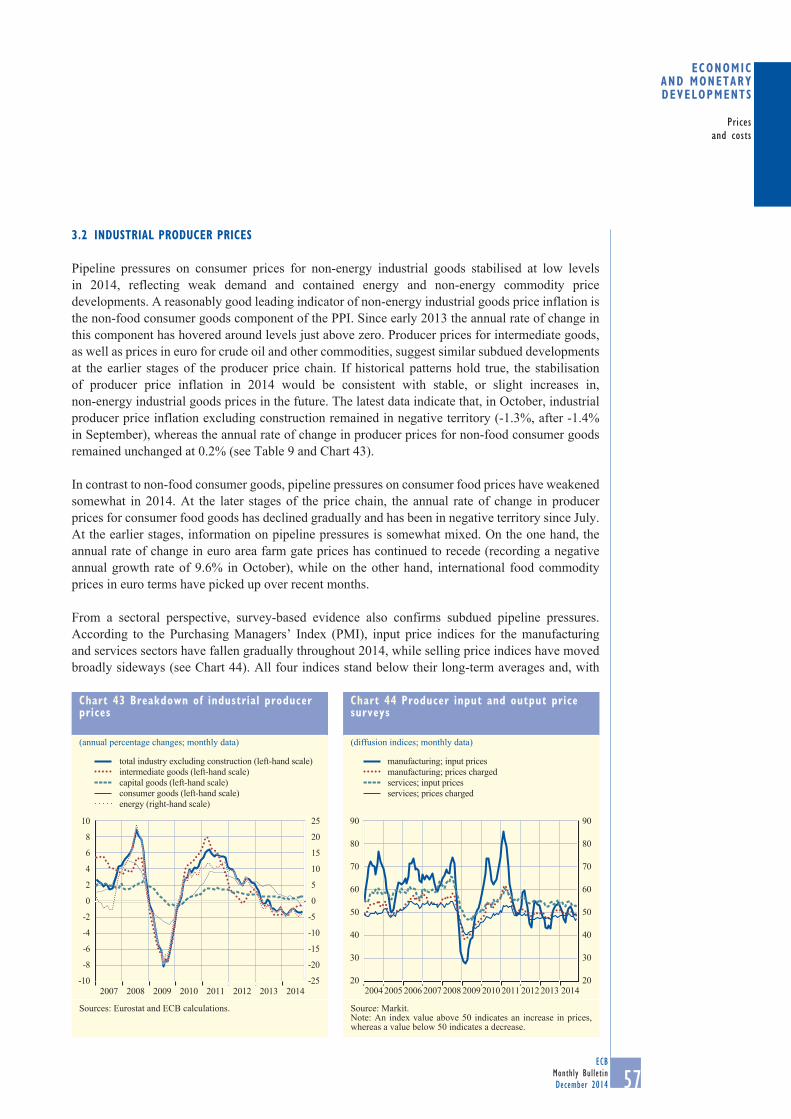
57ECB
Monthly BulletinDecember 2014
Pricesand costs
Economic and monEtary dEvElopmEnts
3.2 inDustrial proDucer prices
Pipeline pressures on consumer prices for non-energy industrial goods stabilised at low levels in 2014, reflecting weak demand and contained energy and non-energy commodity price developments. A reasonably good leading indicator of non-energy industrial goods price inflation is the non-food consumer goods component of the PPI. Since early 2013 the annual rate of change in this component has hovered around levels just above zero. Producer prices for intermediate goods, as well as prices in euro for crude oil and other commodities, suggest similar subdued developments at the earlier stages of the producer price chain. If historical patterns hold true, the stabilisation of producer price inflation in 2014 would be consistent with stable, or slight increases in, non-energy industrial goods prices in the future. The latest data indicate that, in October, industrial producer price inflation excluding construction remained in negative territory (-1.3%, after -1.4% in September), whereas the annual rate of change in producer prices for non-food consumer goods remained unchanged at 0.2% (see Table 9 and Chart 43).
In contrast to non-food consumer goods, pipeline pressures on consumer food prices have weakened somewhat in 2014. At the later stages of the price chain, the annual rate of change in producer prices for consumer food goods has declined gradually and has been in negative territory since July. At the earlier stages, information on pipeline pressures is somewhat mixed. On the one hand, the annual rate of change in euro area farm gate prices has continued to recede (recording a negative annual growth rate of 9.6% in October), while on the other hand, international food commodity prices in euro terms have picked up over recent months.
From a sectoral perspective, survey-based evidence also confirms subdued pipeline pressures. According to the Purchasing Managers’ Index (PMI), input price indices for the manufacturing and services sectors have fallen gradually throughout 2014, while selling price indices have moved broadly sideways (see Chart 44). All four indices stand below their long-term averages and, with
chart 43 breakdown of industrial producer prices
(annual percentage changes; monthly data)
-10
-8
-6
-4
-2
0
2
4
6
8
10
-25
-20
-15
-10
-5
0
5
10
15
20
25
2014
total industry excluding construction (left-hand scale)intermediate goods (left-hand scale)capital goods (left-hand scale)consumer goods (left-hand scale)energy (right-hand scale)
2007 2008 2009 2010 2011 2012 2013
Sources: Eurostat and ECB calculations.
chart 44 producer input and output price surveys
(diffusion indices; monthly data)
20
30
40
50
60
70
80
90
20
30
40
50
60
70
80
90
2004 2005 2006 2007 2008 2009 2010 2011 2012 2013 2014
manufacturing; input pricesmanufacturing; prices chargedservices; input pricesservices; prices charged
Source: Markit.Note: An index value above 50 indicates an increase in prices, whereas a value below 50 indicates a decrease.
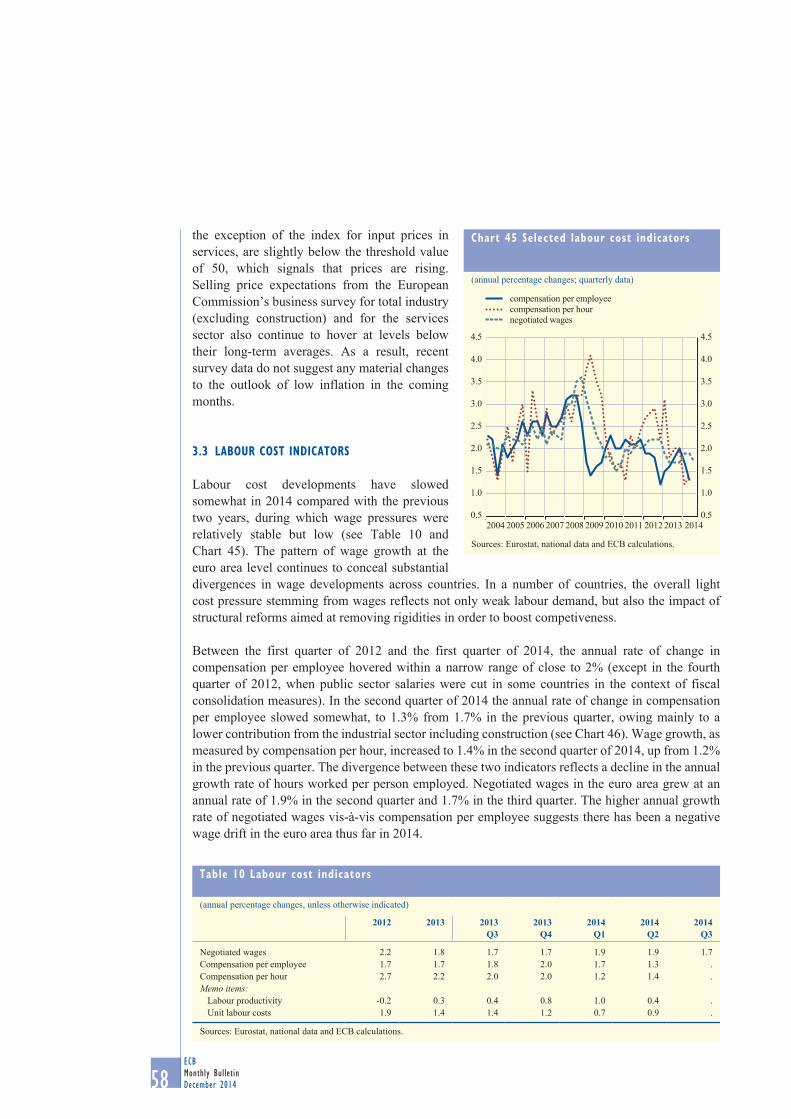
58ECBMonthly BulletinDecember 2014
the exception of the index for input prices in services, are slightly below the threshold value of 50, which signals that prices are rising. Selling price expectations from the European Commission’s business survey for total industry (excluding construction) and for the services sector also continue to hover at levels below their long-term averages. As a result, recent survey data do not suggest any material changes to the outlook of low inflation in the coming months.
3.3 labour cost inDicators
Labour cost developments have slowed somewhat in 2014 compared with the previous two years, during which wage pressures were relatively stable but low (see Table 10 and Chart 45). The pattern of wage growth at the euro area level continues to conceal substantial divergences in wage developments across countries. In a number of countries, the overall light cost pressure stemming from wages reflects not only weak labour demand, but also the impact of structural reforms aimed at removing rigidities in order to boost competiveness.
Between the first quarter of 2012 and the first quarter of 2014, the annual rate of change in compensation per employee hovered within a narrow range of close to 2% (except in the fourth quarter of 2012, when public sector salaries were cut in some countries in the context of fiscal consolidation measures). In the second quarter of 2014 the annual rate of change in compensation per employee slowed somewhat, to 1.3% from 1.7% in the previous quarter, owing mainly to a lower contribution from the industrial sector including construction (see Chart 46). Wage growth, as measured by compensation per hour, increased to 1.4% in the second quarter of 2014, up from 1.2% in the previous quarter. The divergence between these two indicators reflects a decline in the annual growth rate of hours worked per person employed. Negotiated wages in the euro area grew at an annual rate of 1.9% in the second quarter and 1.7% in the third quarter. The higher annual growth rate of negotiated wages vis-à-vis compensation per employee suggests there has been a negative wage drift in the euro area thus far in 2014.
chart 45 selected labour cost indicators
(annual percentage changes; quarterly data)
0.5
1.0
1.5
2.0
2.5
3.0
3.5
4.0
4.5
0.5
1.0
1.5
2.0
2.5
3.0
3.5
4.0
4.5
2014
compensation per employeecompensation per hournegotiated wages
2004 20062005 20082007 2009 2010 2011 2012 2013
Sources: Eurostat, national data and ECB calculations.
table 10 labour cost indicators
(annual percentage changes, unless otherwise indicated)
2012 2013 2013Q3
2013Q4
2014Q1
2014Q2
2014Q3
Negotiated wages 2.2 1.8 1.7 1.7 1.9 1.9 1.7Compensation per employee 1.7 1.7 1.8 2.0 1.7 1.3 .Compensation per hour 2.7 2.2 2.0 2.0 1.2 1.4 .Memo items:
Labour productivity -0.2 0.3 0.4 0.8 1.0 0.4 .Unit labour costs 1.9 1.4 1.4 1.2 0.7 0.9 .
Sources: Eurostat, national data and ECB calculations.
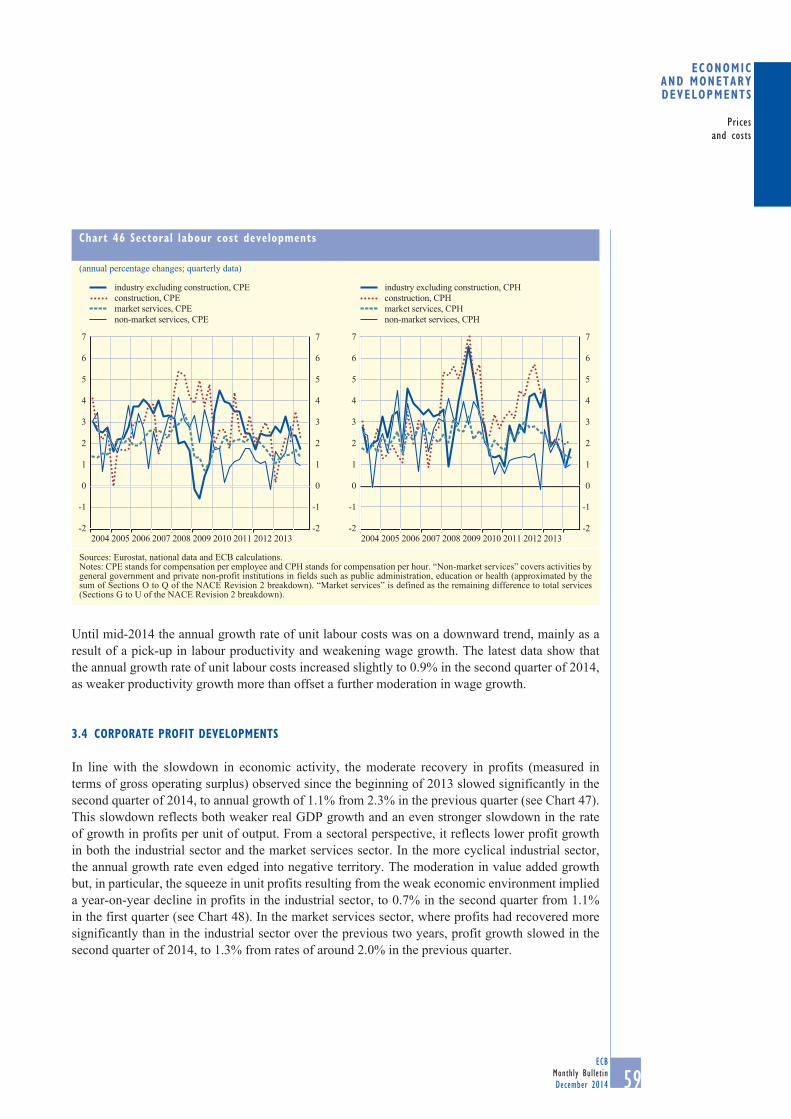
59ECB
Monthly BulletinDecember 2014
Pricesand costs
Economic and monEtary dEvElopmEnts
Until mid-2014 the annual growth rate of unit labour costs was on a downward trend, mainly as a result of a pick-up in labour productivity and weakening wage growth. The latest data show that the annual growth rate of unit labour costs increased slightly to 0.9% in the second quarter of 2014, as weaker productivity growth more than offset a further moderation in wage growth.
3.4 corporate profit Developments
In line with the slowdown in economic activity, the moderate recovery in profits (measured in terms of gross operating surplus) observed since the beginning of 2013 slowed significantly in the second quarter of 2014, to annual growth of 1.1% from 2.3% in the previous quarter (see Chart 47). This slowdown reflects both weaker real GDP growth and an even stronger slowdown in the rate of growth in profits per unit of output. From a sectoral perspective, it reflects lower profit growth in both the industrial sector and the market services sector. In the more cyclical industrial sector, the annual growth rate even edged into negative territory. The moderation in value added growth but, in particular, the squeeze in unit profits resulting from the weak economic environment implied a year-on-year decline in profits in the industrial sector, to 0.7% in the second quarter from 1.1% in the first quarter (see Chart 48). In the market services sector, where profits had recovered more significantly than in the industrial sector over the previous two years, profit growth slowed in the second quarter of 2014, to 1.3% from rates of around 2.0% in the previous quarter.
chart 46 sectoral labour cost developments
(annual percentage changes; quarterly data)
-2
-1
0
1
2
3
4
5
6
7
-2
-1
0
1
2
3
4
5
6
7
industry excluding construction, CPEconstruction, CPEmarket services, CPEnon-market services, CPE
2004 2006 20072005 2008 2009 2010 2011 2012 2013-2
-1
0
1
2
3
4
5
6
7
-2
-1
0
1
2
3
4
5
6
7
industry excluding construction, CPHconstruction, CPHmarket services, CPHnon-market services, CPH
2004 2006 20072005 2008 2009 2010 2011 2012 2013
Sources: Eurostat, national data and ECB calculations.Notes: CPE stands for compensation per employee and CPH stands for compensation per hour. “Non-market services” covers activities by general government and private non-profit institutions in fields such as public administration, education or health (approximated by the sum of Sections O to Q of the NACE Revision 2 breakdown). “Market services” is defined as the remaining difference to total services (Sections G to U of the NACE Revision 2 breakdown).
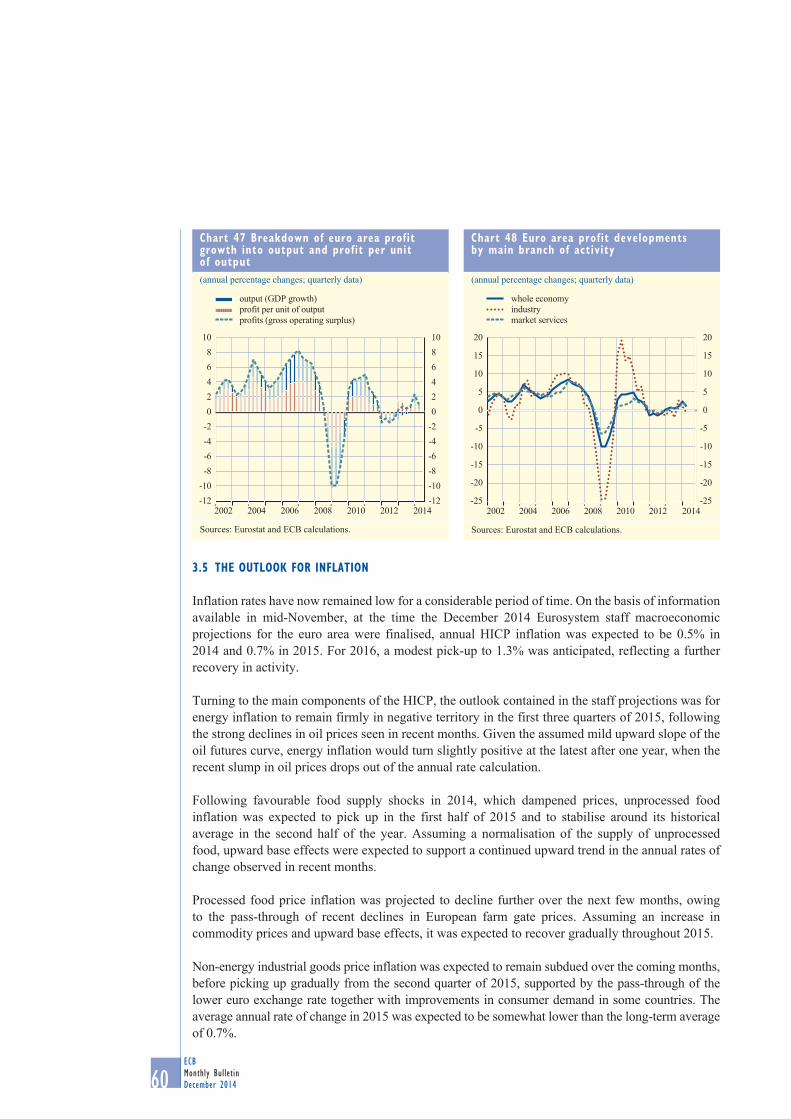
60ECBMonthly BulletinDecember 2014
3.5 the outlooK for inflation
Inflation rates have now remained low for a considerable period of time. On the basis of information available in mid-November, at the time the December 2014 Eurosystem staff macroeconomic projections for the euro area were finalised, annual HICP inflation was expected to be 0.5% in 2014 and 0.7% in 2015. For 2016, a modest pick-up to 1.3% was anticipated, reflecting a further recovery in activity.
Turning to the main components of the HICP, the outlook contained in the staff projections was for energy inflation to remain firmly in negative territory in the first three quarters of 2015, following the strong declines in oil prices seen in recent months. Given the assumed mild upward slope of the oil futures curve, energy inflation would turn slightly positive at the latest after one year, when the recent slump in oil prices drops out of the annual rate calculation.
Following favourable food supply shocks in 2014, which dampened prices, unprocessed food inflation was expected to pick up in the first half of 2015 and to stabilise around its historical average in the second half of the year. Assuming a normalisation of the supply of unprocessed food, upward base effects were expected to support a continued upward trend in the annual rates of change observed in recent months.
Processed food price inflation was projected to decline further over the next few months, owing to the pass-through of recent declines in European farm gate prices. Assuming an increase in commodity prices and upward base effects, it was expected to recover gradually throughout 2015.
Non-energy industrial goods price inflation was expected to remain subdued over the coming months, before picking up gradually from the second quarter of 2015, supported by the pass-through of the lower euro exchange rate together with improvements in consumer demand in some countries. The average annual rate of change in 2015 was expected to be somewhat lower than the long-term average of 0.7%.
chart 47 breakdown of euro area profit growth into output and profit per unit of output(annual percentage changes; quarterly data)
-12-10-8-6-4-202468
10
-12-10-8-6-4-20246810
2002 2004 2006 2008 2010 2012 2014
output (GDP growth)profit per unit of outputprofits (gross operating surplus)
Sources: Eurostat and ECB calculations.
chart 48 euro area profit developments by main branch of activity
(annual percentage changes; quarterly data)
-25
-20
-15
-10
-5
0
5
10
15
20
-25
-20
-15
-10
-5
0
5
10
15
20
2002 2004 2006 2008 2010 2012 2014
whole economyindustrymarket services
Sources: Eurostat and ECB calculations.
61ECB
Monthly BulletinDecember 2014
Pricesand costs
Economic and monEtary dEvElopmEnts
Services price inflation was projected to remain at subdued levels, before rising towards the end of 2015. The anticipated pick-up in services price inflation reflected expected increases in wage growth together with a gradual recovery in economic activity.
The risks to the outlook for price developments over the medium term will be closely monitored, in particular the possible repercussions of dampened growth dynamics, geopolitical developments, exchange rate and energy price developments, and the pass-through of the monetary policy measures. In view of the further declines in oil prices in recent weeks, annual HICP inflation rates could experience renewed downward movements over the coming weeks. Particular vigilance will be exercised as regards the broader impact of recent oil price developments on medium-term inflation trends in the euro area.

62ECBMonthly BulletinDecember 2014
Real GDP in the euro area rose by 0.2%, quarter on quarter, in the third quarter of this year. This was in line with earlier indications of a weakening in the euro area’s growth momentum, leading to a downward revision of the outlook for euro area real GDP growth in the most recent forecasts. The latest data and survey evidence up to November confirm this picture of a weaker growth profile in the period ahead. At the same time, the outlook for a modest economic recovery remains in place. On the one hand, domestic demand should be supported by the monetary policy measures, the ongoing improvements in financial conditions, the progress made in fiscal consolidation and structural reforms, and significantly lower energy prices supporting real disposable income. Furthermore, demand for exports should benefit from the global recovery. On the other hand, the recovery is likely to continue to be dampened by high unemployment, sizeable unutilised capacity, and the necessary balance sheet adjustments in the public and private sectors.
These elements are reflected in the December 2014 Eurosystem staff macroeconomic projections for the euro area, which foresee annual real GDP increasing by 0.8% in 2014, 1.0% in 2015 and 1.5% in 2016. Compared with the September 2014 ECB staff macroeconomic projections, the projections for real GDP growth have been revised substantially downwards. Downward revisions were made to the projections for both domestic demand and net exports. The risks surrounding the economic outlook for the euro area are on the downside.
4.1 real GDp anD DemanD components
According to Eurostat’s flash estimate, real GDP rose by 0.2%, quarter on quarter, in the third quarter of 2014 (see Chart 49), the sixth consecutive quarter of positive, albeit moderate, output growth. Output rose in the third quarter in most of the largest euro area countries. Although no expenditure breakdown was available at the time of this Monthly Bulletin’s cut-off date, available country data and short-term indicators suggest that private consumption strengthened further and contributed positively to growth, while investment fell and thus contributed negatively. Net trade provided a broadly neutral contribution to growth, as exports may have benefited from the rebound in world trade alongside the depreciation of the euro exchange rate. In terms of value added, it appears that a positive contribution from the services sector was partly offset by a negative contribution from the industrial sector including construction.
Output growth in the third quarter increased compared with the previous quarter, but to some extent reflected temporary and technical
4 output, DemanD anD the labour marKet
chart 49 real GDp growth and contributions, composite output pmi and economic sentiment(quarter-on-quarter growth rate, quarterly percentage point contributions, indices; seasonally adjusted)
-0.4
-0.2
0.0
0.2
0.4
0.6
46
48
50
52
54
56
Q3 Q4 Q1 Q2 Q3 Q42013 2014
domestic demand excluding inventories(left-hand scale)changes in inventories (left-hand scale)net exports (left-hand scale)total GDP growth (left-hand scale)composite output PMI (right-hand scale)Economic Sentiment Indicator (ESI)1) (right-hand scale)
Sources: Eurostat, Markit, European Commission Business and Consumer Surveys and ECB calculations.Note: The latest observation for total GDP growth refers to Eurostat’s flash estimate.1) Economic Sentiment Indicator; the ESI is normalised with the mean and standard deviation of the PMI over the period shown in the chart.
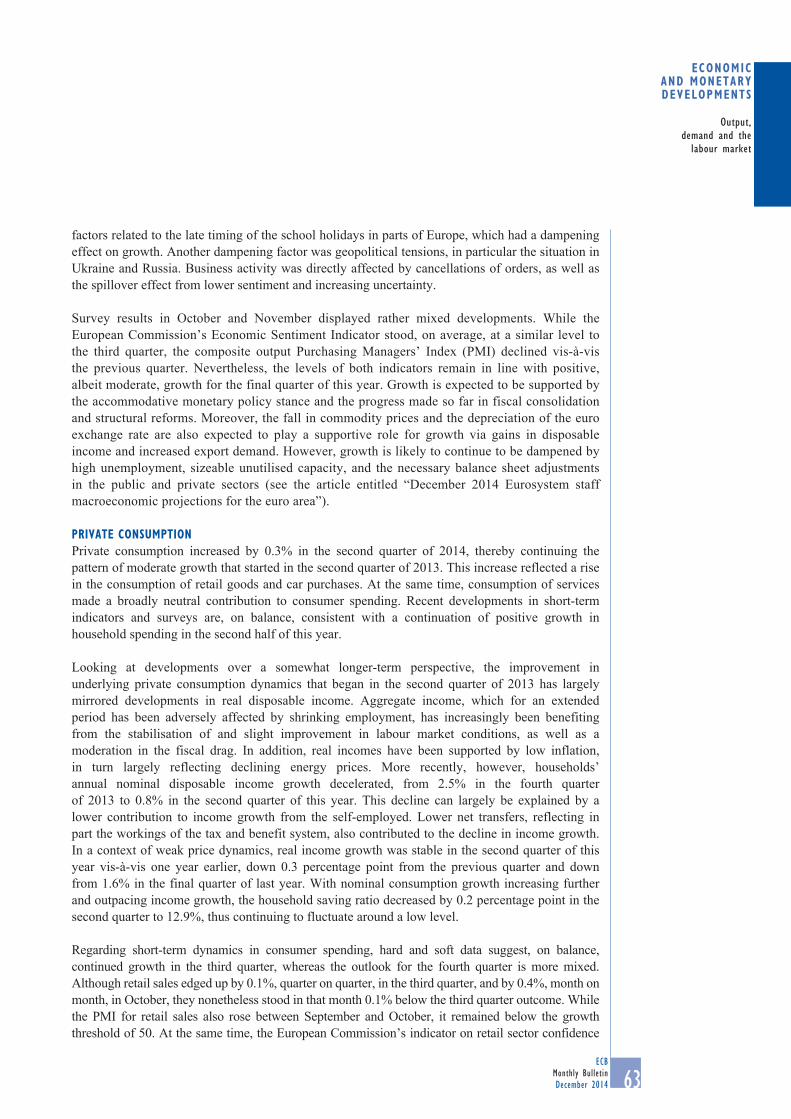
63ECB
Monthly BulletinDecember 2014
Output,demand and the
labour market
Economic and monEtary dEvElopmEnts
factors related to the late timing of the school holidays in parts of Europe, which had a dampening effect on growth. Another dampening factor was geopolitical tensions, in particular the situation in Ukraine and Russia. Business activity was directly affected by cancellations of orders, as well as the spillover effect from lower sentiment and increasing uncertainty.
Survey results in October and November displayed rather mixed developments. While the European Commission’s Economic Sentiment Indicator stood, on average, at a similar level to the third quarter, the composite output Purchasing Managers’ Index (PMI) declined vis-à-vis the previous quarter. Nevertheless, the levels of both indicators remain in line with positive, albeit moderate, growth for the final quarter of this year. Growth is expected to be supported by the accommodative monetary policy stance and the progress made so far in fiscal consolidation and structural reforms. Moreover, the fall in commodity prices and the depreciation of the euro exchange rate are also expected to play a supportive role for growth via gains in disposable income and increased export demand. However, growth is likely to continue to be dampened by high unemployment, sizeable unutilised capacity, and the necessary balance sheet adjustments in the public and private sectors (see the article entitled “December 2014 Eurosystem staff macroeconomic projections for the euro area”).
PRIVATE CONSUMPTIONPrivate consumption increased by 0.3% in the second quarter of 2014, thereby continuing the pattern of moderate growth that started in the second quarter of 2013. This increase reflected a rise in the consumption of retail goods and car purchases. At the same time, consumption of services made a broadly neutral contribution to consumer spending. Recent developments in short-term indicators and surveys are, on balance, consistent with a continuation of positive growth in household spending in the second half of this year.
Looking at developments over a somewhat longer-term perspective, the improvement in underlying private consumption dynamics that began in the second quarter of 2013 has largely mirrored developments in real disposable income. Aggregate income, which for an extended period has been adversely affected by shrinking employment, has increasingly been benefiting from the stabilisation of and slight improvement in labour market conditions, as well as a moderation in the fiscal drag. In addition, real incomes have been supported by low inflation, in turn largely reflecting declining energy prices. More recently, however, households’ annual nominal disposable income growth decelerated, from 2.5% in the fourth quarter of 2013 to 0.8% in the second quarter of this year. This decline can largely be explained by a lower contribution to income growth from the self-employed. Lower net transfers, reflecting in part the workings of the tax and benefit system, also contributed to the decline in income growth. In a context of weak price dynamics, real income growth was stable in the second quarter of this year vis-à-vis one year earlier, down 0.3 percentage point from the previous quarter and down from 1.6% in the final quarter of last year. With nominal consumption growth increasing further and outpacing income growth, the household saving ratio decreased by 0.2 percentage point in the second quarter to 12.9%, thus continuing to fluctuate around a low level.
Regarding short-term dynamics in consumer spending, hard and soft data suggest, on balance, continued growth in the third quarter, whereas the outlook for the fourth quarter is more mixed. Although retail sales edged up by 0.1%, quarter on quarter, in the third quarter, and by 0.4%, month on month, in October, they nonetheless stood in that month 0.1% below the third quarter outcome. While the PMI for retail sales also rose between September and October, it remained below the growth threshold of 50. At the same time, the European Commission’s indicator on retail sector confidence
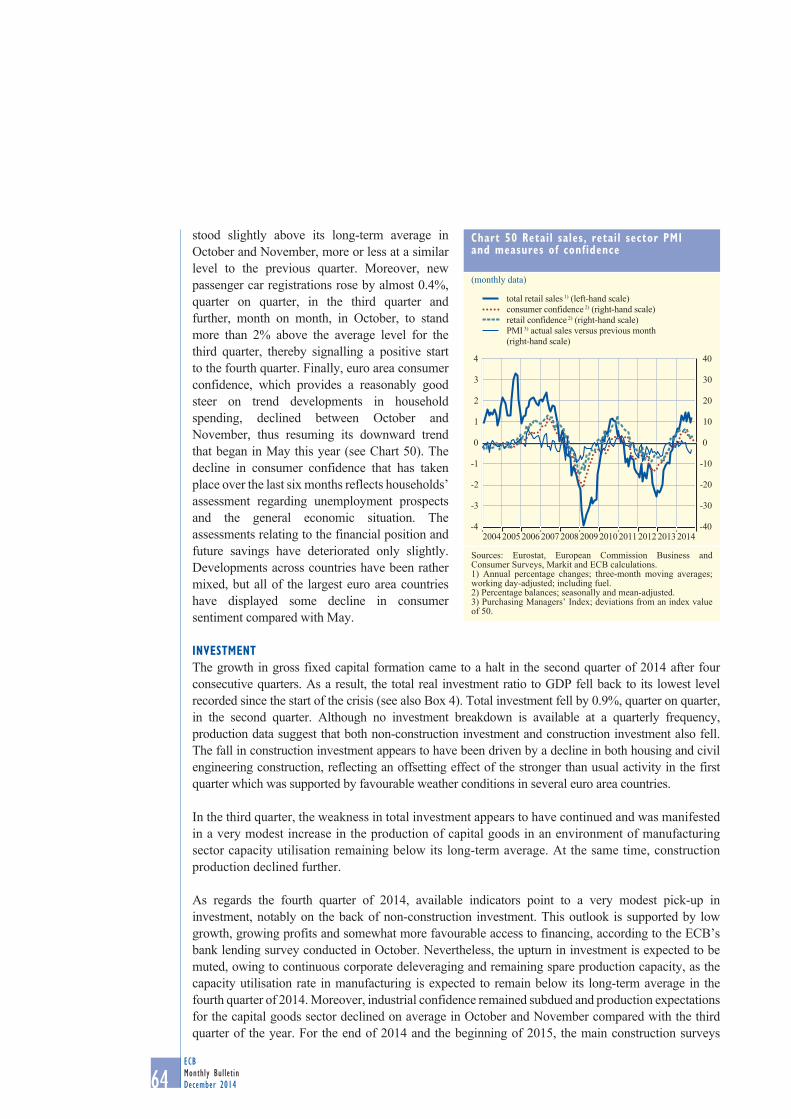
64ECBMonthly BulletinDecember 2014
stood slightly above its long-term average in October and November, more or less at a similar level to the previous quarter. Moreover, new passenger car registrations rose by almost 0.4%, quarter on quarter, in the third quarter and further, month on month, in October, to stand more than 2% above the average level for the third quarter, thereby signalling a positive start to the fourth quarter. Finally, euro area consumer confidence, which provides a reasonably good steer on trend developments in household spending, declined between October and November, thus resuming its downward trend that began in May this year (see Chart 50). The decline in consumer confidence that has taken place over the last six months reflects households’ assessment regarding unemployment prospects and the general economic situation. The assessments relating to the financial position and future savings have deteriorated only slightly. Developments across countries have been rather mixed, but all of the largest euro area countries have displayed some decline in consumer sentiment compared with May.
investmentThe growth in gross fixed capital formation came to a halt in the second quarter of 2014 after four consecutive quarters. As a result, the total real investment ratio to GDP fell back to its lowest level recorded since the start of the crisis (see also Box 4). Total investment fell by 0.9%, quarter on quarter, in the second quarter. Although no investment breakdown is available at a quarterly frequency, production data suggest that both non-construction investment and construction investment also fell. The fall in construction investment appears to have been driven by a decline in both housing and civil engineering construction, reflecting an offsetting effect of the stronger than usual activity in the first quarter which was supported by favourable weather conditions in several euro area countries.
In the third quarter, the weakness in total investment appears to have continued and was manifested in a very modest increase in the production of capital goods in an environment of manufacturing sector capacity utilisation remaining below its long-term average. At the same time, construction production declined further.
As regards the fourth quarter of 2014, available indicators point to a very modest pick-up in investment, notably on the back of non-construction investment. This outlook is supported by low growth, growing profits and somewhat more favourable access to financing, according to the ECB’s bank lending survey conducted in October. Nevertheless, the upturn in investment is expected to be muted, owing to continuous corporate deleveraging and remaining spare production capacity, as the capacity utilisation rate in manufacturing is expected to remain below its long-term average in the fourth quarter of 2014. Moreover, industrial confidence remained subdued and production expectations for the capital goods sector declined on average in October and November compared with the third quarter of the year. For the end of 2014 and the beginning of 2015, the main construction surveys
chart 50 retail sales, retail sector pmi and measures of confidence
(monthly data)
-4
-3
-2
-1
0
1
2
3
4
-40
-30
-20
-10
0
10
20
30
40
total retail sales 1) (left-hand scale)consumer confidence 2) (right-hand scale)retail confidence 2) (right-hand scale)PMI 3) actual sales versus previous month (right-hand scale)
2004 2005 2006 2007 2008 2009 2010 2011 2012 2013 2014
Sources: Eurostat, European Commission Business and Consumer Surveys, Markit and ECB calculations.1) Annual percentage changes; three-month moving averages; working day-adjusted; including fuel.2) Percentage balances; seasonally and mean-adjusted.3) Purchasing Managers’ Index; deviations from an index value of 50.
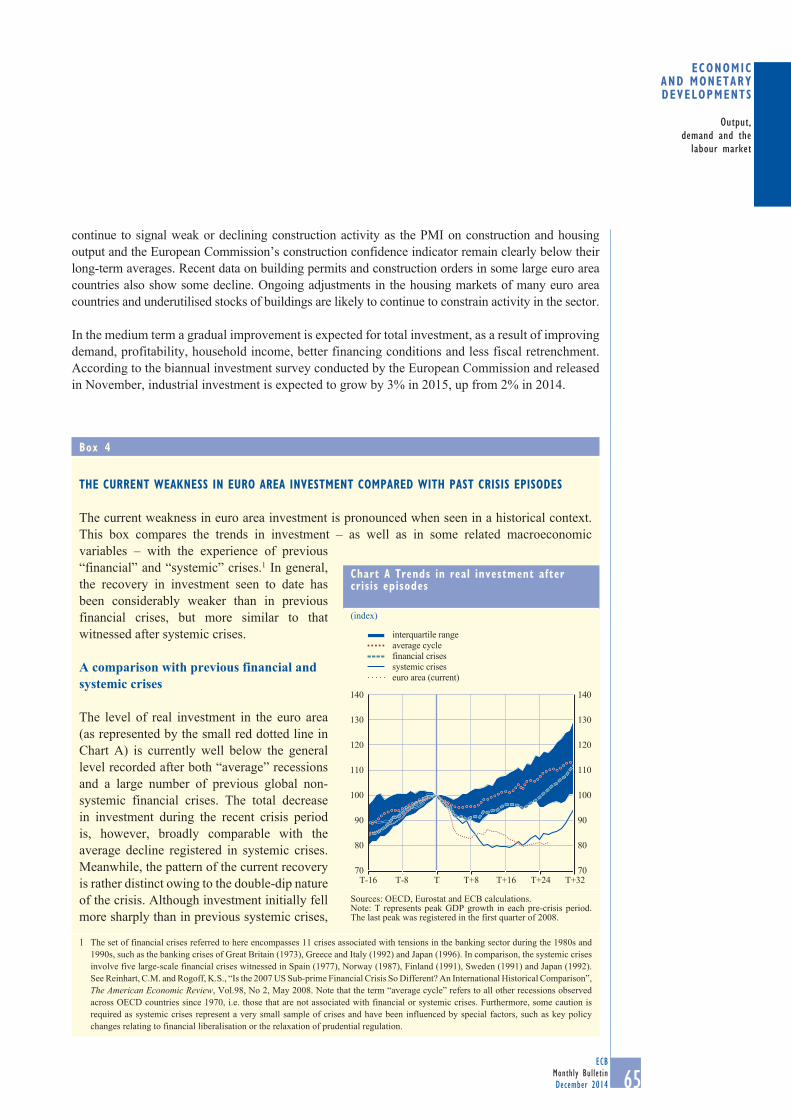
65ECB
Monthly BulletinDecember 2014
Output,demand and the
labour market
Economic and monEtary dEvElopmEnts
continue to signal weak or declining construction activity as the PMI on construction and housing output and the European Commission’s construction confidence indicator remain clearly below their long-term averages. Recent data on building permits and construction orders in some large euro area countries also show some decline. Ongoing adjustments in the housing markets of many euro area countries and underutilised stocks of buildings are likely to continue to constrain activity in the sector.
In the medium term a gradual improvement is expected for total investment, as a result of improving demand, profitability, household income, better financing conditions and less fiscal retrenchment. According to the biannual investment survey conducted by the European Commission and released in November, industrial investment is expected to grow by 3% in 2015, up from 2% in 2014.
box 4
the current weaKness in euro area investment compareD with past crisis episoDes
The current weakness in euro area investment is pronounced when seen in a historical context. This box compares the trends in investment – as well as in some related macroeconomic variables – with the experience of previous “financial” and “systemic” crises.1 In general, the recovery in investment seen to date has been considerably weaker than in previous financial crises, but more similar to that witnessed after systemic crises.
A comparison with previous financial and systemic crises
The level of real investment in the euro area (as represented by the small red dotted line in Chart A) is currently well below the general level recorded after both “average” recessions and a large number of previous global non-systemic financial crises. The total decrease in investment during the recent crisis period is, however, broadly comparable with the average decline registered in systemic crises. Meanwhile, the pattern of the current recovery is rather distinct owing to the double-dip nature of the crisis. Although investment initially fell more sharply than in previous systemic crises,
1 The set of financial crises referred to here encompasses 11 crises associated with tensions in the banking sector during the 1980s and 1990s, such as the banking crises of Great Britain (1973), Greece and Italy (1992) and Japan (1996). In comparison, the systemic crises involve five large-scale financial crises witnessed in Spain (1977), Norway (1987), Finland (1991), Sweden (1991) and Japan (1992). See Reinhart, C.M. and Rogoff, K.S., “Is the 2007 US Sub-prime Financial Crisis So Different? An International Historical Comparison”, The American Economic Review, Vol.98, No 2, May 2008. Note that the term “average cycle” refers to all other recessions observed across OECD countries since 1970, i.e. those that are not associated with financial or systemic crises. Furthermore, some caution is required as systemic crises represent a very small sample of crises and have been influenced by special factors, such as key policy changes relating to financial liberalisation or the relaxation of prudential regulation.
chart a trends in real investment after crisis episodes
(index)
70
80
90
100
110
120
130
140
70
80
90
100
110
120
130
140
T-16 T-8 T T+8 T+16 T+24 T+32
interquartile range
systemic crises
average cycle
euro area (current)
financial crises
Sources: OECD, Eurostat and ECB calculations. Note: T represents peak GDP growth in each pre-crisis period. The last peak was registered in the first quarter of 2008.

66ECBMonthly BulletinDecember 2014
the first trough was less deep than in a typical systemic crisis. Furthermore, following the trough of 2010, investment started to recover at a pace similar to that observed after normal recessions. But less than two years of progress came to a halt with the onset of the sovereign debt crisis, when the level of investment contracted further. Since then, there has been little evidence of a recovery (Chart A). As a consequence, the level of investment presently stands at nearly 20% below its 2008 level.
Factors coinciding with the current weakness in investment
In comparison with previous financial and systemic crises, the slow recovery in investment observed during the most recent crisis has coincided with a number of unique economic conditions.
First, public investment spending – including investment in infrastructure – has been subdued owing to fiscal consolidation and the need for public debt deleveraging. After the emergence of the Great Recession, the ratio of government debt to GDP was at levels above 90% in the euro area, which is much higher than what was seen on average before previous crises (Chart B). This limited the already small fiscal space to stimulate investment, and rather induced governments to consolidate public finances relatively early on.
Second, in line with previous systemic crises, housing investment has contracted significantly, but there is still virtually no sign of a recovery (Chart C). It should be noted that the initial level taken as a benchmark, i.e. the peak in GDP growth in the first quarter of 2008, reflects
chart b Government debt after crisis episodes
(percentage of GDP)
interquartile range
systemic crises
average cyclefinancial crises
euro area (current)
T-8 T T+8 T+16 T+24 T+3220
30
40
50
60
70
80
90
100
110
20
30
40
50
60
70
80
90
100
110
Sources: OECD and ECB calculations.Note: T represents peak GDP growth in each pre-crisis period. The last peak was registered in the first quarter of 2008.
chart c level of real housing investment after crisis episodes
(index)
60
70
80
90
100
110
120
130
140
60
70
80
90
100
110
120
130
140
T-16 T-8 T T+8 T+16 T+24 T+32
interquartile range
systemic crises
average cycle
euro area (current)
financial crises
Sources: OECD, Eurostat and ECB calculations.Notes: T represents peak GDP growth in each pre-crisis period. The last peak was registered in the first quarter of 2008. For past crises, housing investment data are taken from the OECD database. For the most recent crisis episode, euro area housing investment data from Eurostat are used.
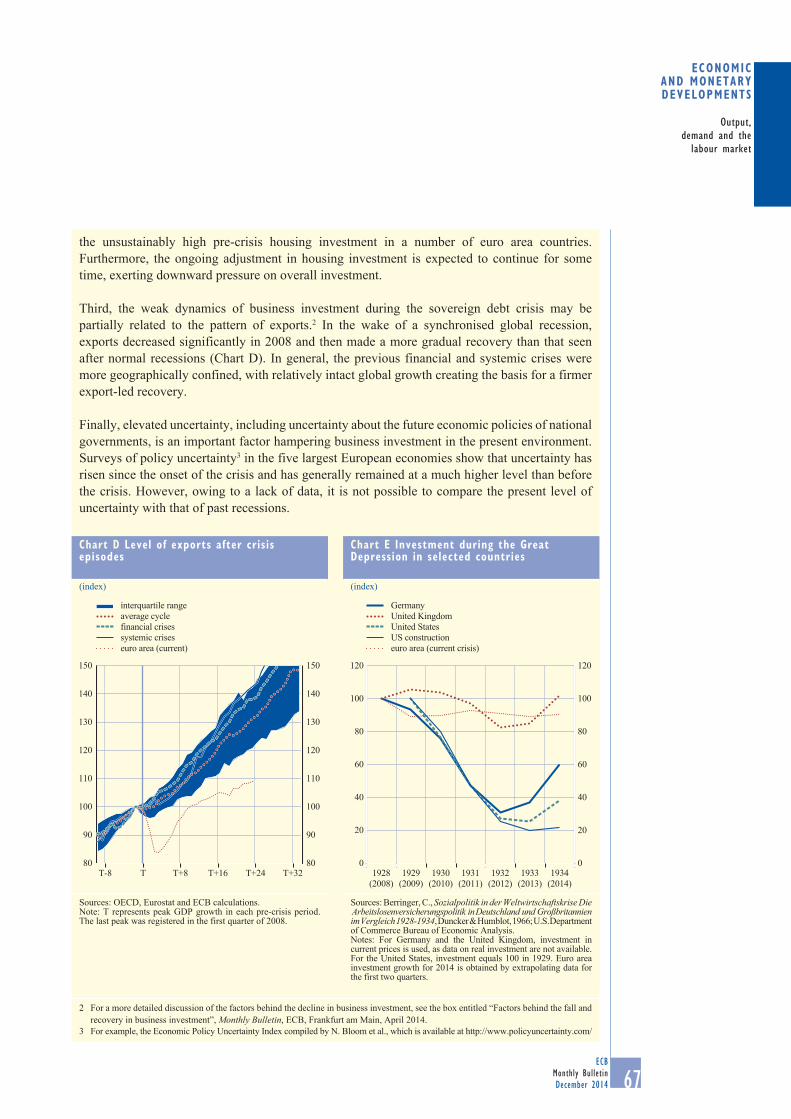
67ECB
Monthly BulletinDecember 2014
Output,demand and the
labour market
Economic and monEtary dEvElopmEnts
the unsustainably high pre-crisis housing investment in a number of euro area countries. Furthermore, the ongoing adjustment in housing investment is expected to continue for some time, exerting downward pressure on overall investment.
Third, the weak dynamics of business investment during the sovereign debt crisis may be partially related to the pattern of exports.2 In the wake of a synchronised global recession, exports decreased significantly in 2008 and then made a more gradual recovery than that seen after normal recessions (Chart D). In general, the previous financial and systemic crises were more geographically confined, with relatively intact global growth creating the basis for a firmer export-led recovery.
Finally, elevated uncertainty, including uncertainty about the future economic policies of national governments, is an important factor hampering business investment in the present environment. Surveys of policy uncertainty3 in the five largest European economies show that uncertainty has risen since the onset of the crisis and has generally remained at a much higher level than before the crisis. However, owing to a lack of data, it is not possible to compare the present level of uncertainty with that of past recessions.
2 For a more detailed discussion of the factors behind the decline in business investment, see the box entitled “Factors behind the fall and recovery in business investment”, Monthly Bulletin, ECB, Frankfurt am Main, April 2014.
3 For example, the Economic Policy Uncertainty Index compiled by N. Bloom et al., which is available at http://www.policyuncertainty.com/
chart D level of exports after crisis episodes
(index)
80
90
100
110
120
130
140
150
80
90
100
110
120
130
140
150
T-8 T T+8 T+16 T+24 T+32
interquartile range
systemic crises
average cycle
euro area (current)
financial crises
Sources: OECD, Eurostat and ECB calculations.Note: T represents peak GDP growth in each pre-crisis period. The last peak was registered in the first quarter of 2008.
chart e investment during the Great Depression in selected countries
(index)
0
20
40
60
80
100
120
0
20
40
60
80
100
120
1928(2008)
1929(2009)
1930(2010)
1931(2011)
1932(2012)
1933(2013)
1934(2014)
GermanyUnited Kingdom
US constructionUnited States
euro area (current crisis)
Sources: Berringer, C., Sozialpolitik in der Weltwirtschaftskrise Die Arbeitslosenversicherungspolitik in Deutschland und Großbritannien im Vergleich 1928-1934, Duncker & Humblot, 1966; U.S. Departmentof Commerce Bureau of Economic Analysis.Notes: For Germany and the United Kingdom, investment in current prices is used, as data on real investment are not available. For the United States, investment equals 100 in 1929. Euro area investment growth for 2014 is obtained by extrapolating data for the first two quarters.
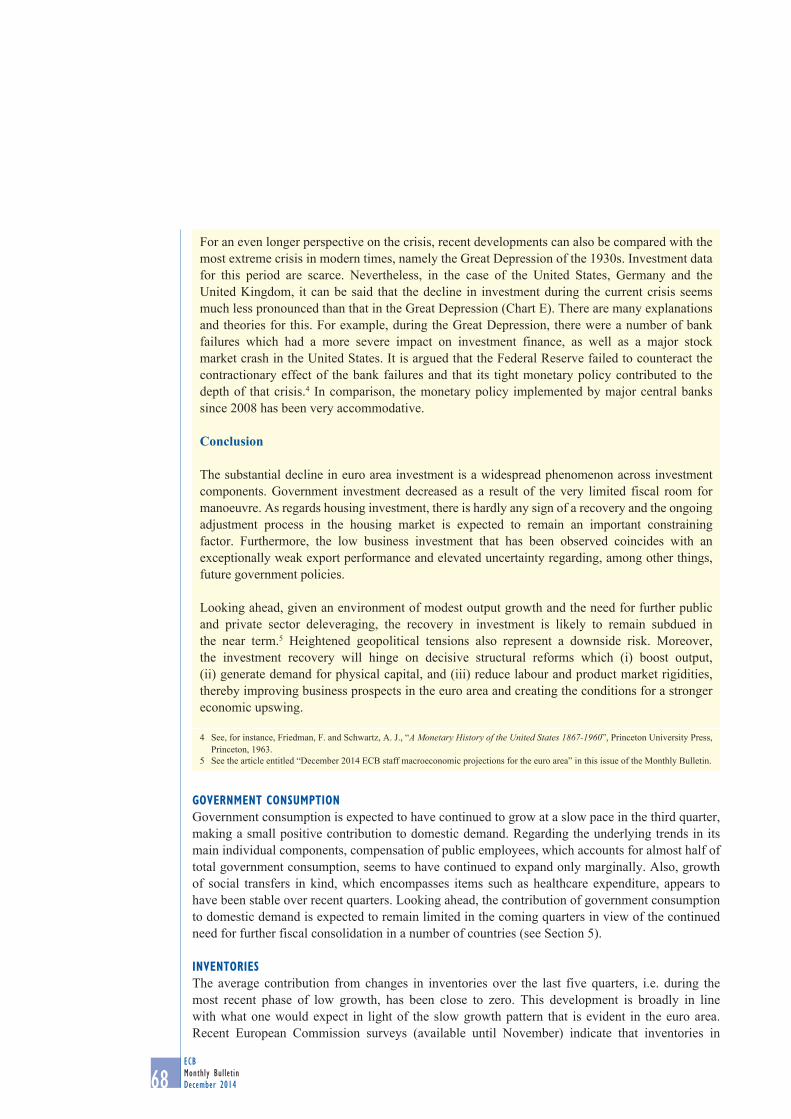
68ECBMonthly BulletinDecember 2014
Government consumptionGovernment consumption is expected to have continued to grow at a slow pace in the third quarter, making a small positive contribution to domestic demand. Regarding the underlying trends in its main individual components, compensation of public employees, which accounts for almost half of total government consumption, seems to have continued to expand only marginally. Also, growth of social transfers in kind, which encompasses items such as healthcare expenditure, appears to have been stable over recent quarters. Looking ahead, the contribution of government consumption to domestic demand is expected to remain limited in the coming quarters in view of the continued need for further fiscal consolidation in a number of countries (see Section 5).
inventoriesThe average contribution from changes in inventories over the last five quarters, i.e. during the most recent phase of low growth, has been close to zero. This development is broadly in line with what one would expect in light of the slow growth pattern that is evident in the euro area. Recent European Commission surveys (available until November) indicate that inventories in
For an even longer perspective on the crisis, recent developments can also be compared with the most extreme crisis in modern times, namely the Great Depression of the 1930s. Investment data for this period are scarce. Nevertheless, in the case of the United States, Germany and the United Kingdom, it can be said that the decline in investment during the current crisis seems much less pronounced than that in the Great Depression (Chart E). There are many explanations and theories for this. For example, during the Great Depression, there were a number of bank failures which had a more severe impact on investment finance, as well as a major stock market crash in the United States. It is argued that the Federal Reserve failed to counteract the contractionary effect of the bank failures and that its tight monetary policy contributed to the depth of that crisis.4 In comparison, the monetary policy implemented by major central banks since 2008 has been very accommodative.
Conclusion
The substantial decline in euro area investment is a widespread phenomenon across investment components. Government investment decreased as a result of the very limited fiscal room for manoeuvre. As regards housing investment, there is hardly any sign of a recovery and the ongoing adjustment process in the housing market is expected to remain an important constraining factor. Furthermore, the low business investment that has been observed coincides with an exceptionally weak export performance and elevated uncertainty regarding, among other things, future government policies.
Looking ahead, given an environment of modest output growth and the need for further public and private sector deleveraging, the recovery in investment is likely to remain subdued in the near term.5 Heightened geopolitical tensions also represent a downside risk. Moreover, the investment recovery will hinge on decisive structural reforms which (i) boost output, (ii) generate demand for physical capital, and (iii) reduce labour and product market rigidities, thereby improving business prospects in the euro area and creating the conditions for a stronger economic upswing.
4 See, for instance, Friedman, F. and Schwartz, A. J., “A Monetary History of the United States 1867-1960”, Princeton University Press, Princeton, 1963.
5 See the article entitled “December 2014 ECB staff macroeconomic projections for the euro area” in this issue of the Monthly Bulletin.
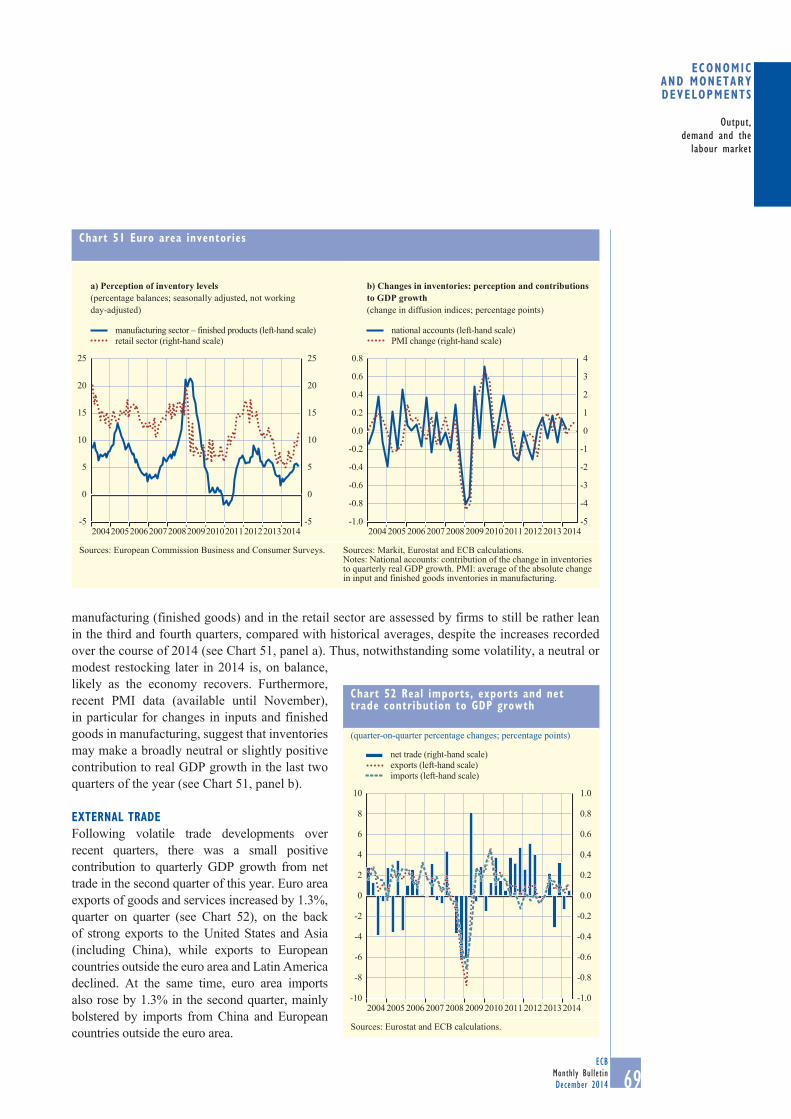
69ECB
Monthly BulletinDecember 2014
Output,demand and the
labour market
Economic and monEtary dEvElopmEnts
manufacturing (finished goods) and in the retail sector are assessed by firms to still be rather lean in the third and fourth quarters, compared with historical averages, despite the increases recorded over the course of 2014 (see Chart 51, panel a). Thus, notwithstanding some volatility, a neutral or modest restocking later in 2014 is, on balance, likely as the economy recovers. Furthermore, recent PMI data (available until November), in particular for changes in inputs and finished goods in manufacturing, suggest that inventories may make a broadly neutral or slightly positive contribution to real GDP growth in the last two quarters of the year (see Chart 51, panel b).
eXternal traDeFollowing volatile trade developments over recent quarters, there was a small positive contribution to quarterly GDP growth from net trade in the second quarter of this year. Euro area exports of goods and services increased by 1.3%, quarter on quarter (see Chart 52), on the back of strong exports to the United States and Asia (including China), while exports to European countries outside the euro area and Latin America declined. At the same time, euro area imports also rose by 1.3% in the second quarter, mainly bolstered by imports from China and European countries outside the euro area.
chart 51 euro area inventories
a) Perception of inventory levels(percentage balances; seasonally adjusted, not working day-adjusted)
b) Changes in inventories: perception and contributions to GDP growth(change in diffusion indices; percentage points)
-5
0
5
10
15
20
25
-5
0
5
10
15
20
25
20042005200620072008200920102011201220132014
manufacturing sector – finished products (left-hand scale) retail sector (right-hand scale)
-5
-4
-3
-2
-1
0
1
2
3
4
-1.0
-0.8
-0.6
-0.4
-0.2
0.0
0.2
0.4
0.6
0.8
2004 2005 2006 2007 2008 2009 2010 2011 2012 2013 2014
national accounts (left-hand scale) PMI change (right-hand scale)
Sources: European Commission Business and Consumer Surveys. Sources: Markit, Eurostat and ECB calculations.Notes: National accounts: contribution of the change in inventories to quarterly real GDP growth. PMI: average of the absolute change in input and finished goods inventories in manufacturing.
chart 52 real imports, exports and net trade contribution to GDp growth
(quarter-on-quarter percentage changes; percentage points)
-1.0
-0.8
-0.6
-0.4
-0.2
0.0
0.2
0.4
0.6
0.8
1.0
-10
-8
-6
-4
-2
0
2
4
6
8
10
net trade (right-hand scale)exports (left-hand scale)imports (left-hand scale)
2004 2005 2006 2007 2008 2009 2010 2011 2012 20132014
Sources: Eurostat and ECB calculations.
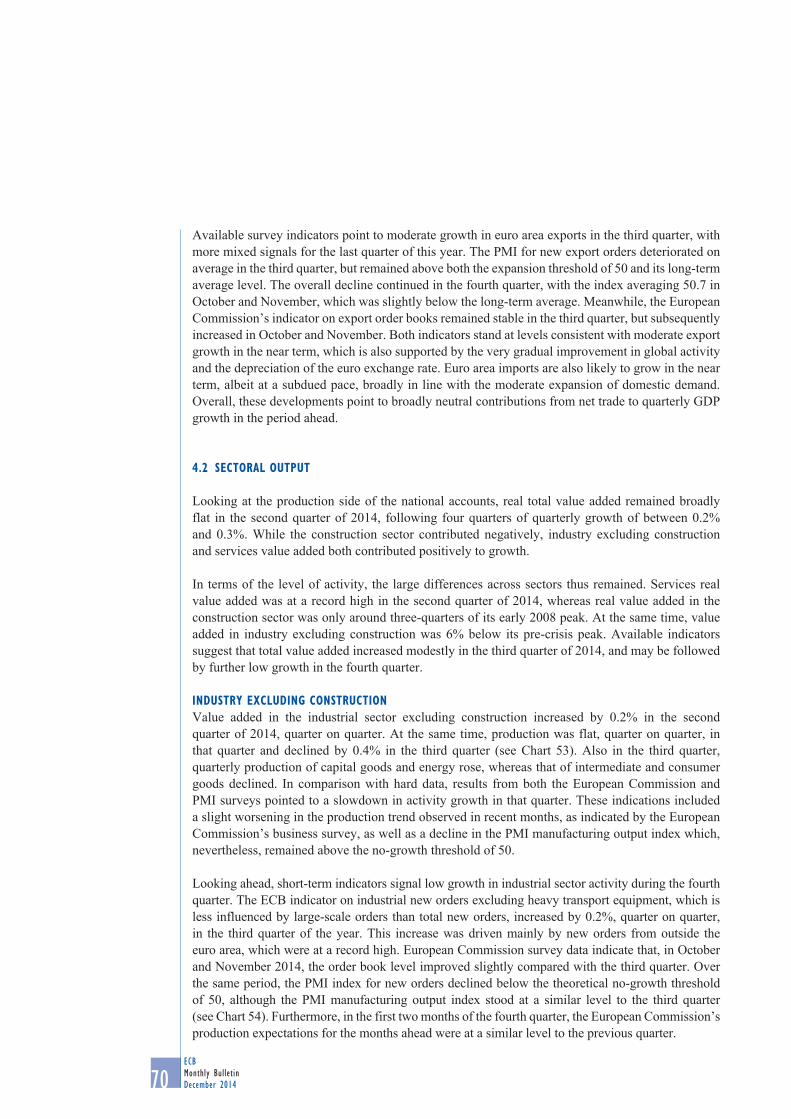
70ECBMonthly BulletinDecember 2014
Available survey indicators point to moderate growth in euro area exports in the third quarter, with more mixed signals for the last quarter of this year. The PMI for new export orders deteriorated on average in the third quarter, but remained above both the expansion threshold of 50 and its long-term average level. The overall decline continued in the fourth quarter, with the index averaging 50.7 in October and November, which was slightly below the long-term average. Meanwhile, the European Commission’s indicator on export order books remained stable in the third quarter, but subsequently increased in October and November. Both indicators stand at levels consistent with moderate export growth in the near term, which is also supported by the very gradual improvement in global activity and the depreciation of the euro exchange rate. Euro area imports are also likely to grow in the near term, albeit at a subdued pace, broadly in line with the moderate expansion of domestic demand. Overall, these developments point to broadly neutral contributions from net trade to quarterly GDP growth in the period ahead.
4.2 sectoral output
Looking at the production side of the national accounts, real total value added remained broadly flat in the second quarter of 2014, following four quarters of quarterly growth of between 0.2% and 0.3%. While the construction sector contributed negatively, industry excluding construction and services value added both contributed positively to growth.
In terms of the level of activity, the large differences across sectors thus remained. Services real value added was at a record high in the second quarter of 2014, whereas real value added in the construction sector was only around three-quarters of its early 2008 peak. At the same time, value added in industry excluding construction was 6% below its pre-crisis peak. Available indicators suggest that total value added increased modestly in the third quarter of 2014, and may be followed by further low growth in the fourth quarter.
inDustry eXcluDinG constructionValue added in the industrial sector excluding construction increased by 0.2% in the second quarter of 2014, quarter on quarter. At the same time, production was flat, quarter on quarter, in that quarter and declined by 0.4% in the third quarter (see Chart 53). Also in the third quarter, quarterly production of capital goods and energy rose, whereas that of intermediate and consumer goods declined. In comparison with hard data, results from both the European Commission and PMI surveys pointed to a slowdown in activity growth in that quarter. These indications included a slight worsening in the production trend observed in recent months, as indicated by the European Commission’s business survey, as well as a decline in the PMI manufacturing output index which, nevertheless, remained above the no-growth threshold of 50.
Looking ahead, short-term indicators signal low growth in industrial sector activity during the fourth quarter. The ECB indicator on industrial new orders excluding heavy transport equipment, which is less influenced by large-scale orders than total new orders, increased by 0.2%, quarter on quarter, in the third quarter of the year. This increase was driven mainly by new orders from outside the euro area, which were at a record high. European Commission survey data indicate that, in October and November 2014, the order book level improved slightly compared with the third quarter. Over the same period, the PMI index for new orders declined below the theoretical no-growth threshold of 50, although the PMI manufacturing output index stood at a similar level to the third quarter (see Chart 54). Furthermore, in the first two months of the fourth quarter, the European Commission’s production expectations for the months ahead were at a similar level to the previous quarter.
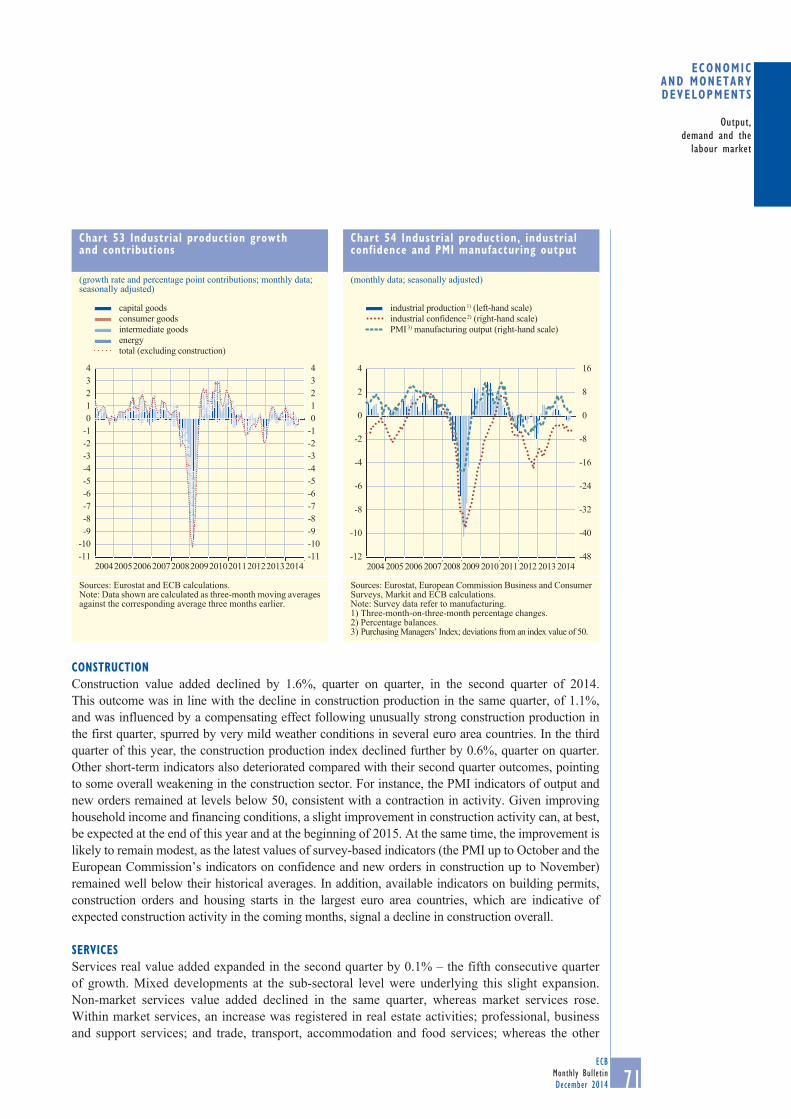
71ECB
Monthly BulletinDecember 2014
Output,demand and the
labour market
Economic and monEtary dEvElopmEnts
constructionConstruction value added declined by 1.6%, quarter on quarter, in the second quarter of 2014. This outcome was in line with the decline in construction production in the same quarter, of 1.1%, and was influenced by a compensating effect following unusually strong construction production in the first quarter, spurred by very mild weather conditions in several euro area countries. In the third quarter of this year, the construction production index declined further by 0.6%, quarter on quarter. Other short-term indicators also deteriorated compared with their second quarter outcomes, pointing to some overall weakening in the construction sector. For instance, the PMI indicators of output and new orders remained at levels below 50, consistent with a contraction in activity. Given improving household income and financing conditions, a slight improvement in construction activity can, at best, be expected at the end of this year and at the beginning of 2015. At the same time, the improvement is likely to remain modest, as the latest values of survey-based indicators (the PMI up to October and the European Commission’s indicators on confidence and new orders in construction up to November) remained well below their historical averages. In addition, available indicators on building permits, construction orders and housing starts in the largest euro area countries, which are indicative of expected construction activity in the coming months, signal a decline in construction overall.
servicesServices real value added expanded in the second quarter by 0.1% – the fifth consecutive quarter of growth. Mixed developments at the sub-sectoral level were underlying this slight expansion. Non-market services value added declined in the same quarter, whereas market services rose. Within market services, an increase was registered in real estate activities; professional, business and support services; and trade, transport, accommodation and food services; whereas the other
chart 53 industrial production growthand contributions
(growth rate and percentage point contributions; monthly data; seasonally adjusted)
-11-10-9-8-7-6-5-4-3-2-101234
-11-10-9-8-7-6-5-4-3-2-101234
20042005200620072008200920102011201220132014
capital goodsconsumer goodsintermediate goodsenergytotal (excluding construction)
Sources: Eurostat and ECB calculations.Note: Data shown are calculated as three-month moving averagesagainst the corresponding average three months earlier.
chart 54 industrial production, industrial confidence and pmi manufacturing output
(monthly data; seasonally adjusted)
-12
-10
-8
-6
-4
-2
0
2
4
-48
-40
-32
-24
-16
-8
0
8
16
industrial production 1) (left-hand scale)industrial confidence 2) (right-hand scale)PMI 3) manufacturing output (right-hand scale)
2004 20062005 2007 2010 20112008 2009 2012 2013 2014
Sources: Eurostat, European Commission Business and Consumer Surveys, Markit and ECB calculations.Note: Survey data refer to manufacturing.1) Three-month-on-three-month percentage changes.2) Percentage balances.3) Purchasing Managers’ Index; deviations from an index value of 50.
72ECBMonthly BulletinDecember 2014
market services declined. The level of activity, as measured by real value added, stood slightly above previous peak levels recorded in the third quarter of 2011 and the first quarter of 2008. Surveys point to a further expansion in services value added in the third quarter of this year. The PMI services business activity index stood at a similar level in the third quarter to the previous quarter. Similarly, the European Commission’s services confidence indicator also changed little, remaining at the same levels as at the beginning of the year.
Looking further ahead, the expansion in the services sector is expected to continue in the fourth quarter. In the three-month period up to October, the proportion of services firms for which insufficient demand was limiting for their business increased slightly, but at the same time the capacity utilisation rate for the services sector rose to its highest level since the end of 2011. Reported financial constraints increased marginally, but remained close to their long-term average. In addition, on the basis of survey data available for the first two months of the fourth quarter, services value added is expected to grow further, albeit most likely at a slower pace. The PMI services business activity index declined in the first two months of the fourth quarter compared with the previous quarter, but its average level of 51.7 indicates a continuation of the expansion in services business activity. At the same time, the European Commission’s services confidence indicator improved in the first two months of the fourth quarter compared with the third quarter, but remained below its long-term average and the levels recorded in early 2011. Confidence was comparatively high and stood well above its long-term average for warehousing and support activities for transportation. The financial services confidence indicator, which is not included in the services confidence indicator, deteriorated over the same period. Expected demand in the months ahead improved slightly in the first two months of the fourth quarter, compared with the previous quarter, according to the European Commission services survey, but remained below its long-term average and the levels seen at the end of 2010 and in the first half of 2011. The PMI index for future business activity (in 12 months’ time) decreased further in the first two months of the fourth quarter, thus remaining below its long-term average. These developments are in line with further growth ahead, but at a slow pace.
4.3 labour marKet
The euro area labour market has been improving since the spring of 2013. Against the background of the low economic growth seen since the second quarter of 2013, this suggests there has been some improvement in the responsiveness of labour markets to cyclical developments. Unemployment has shown successive, albeit modest, quarter-on-quarter declines since mid-2013 and, by the end of that year, quarterly employment growth had returned to positive levels. While cross-country developments remain diverse, there is a general tendency towards improvement.
Euro area headcount employment, i.e. the number of persons employed, grew by 0.2%, quarter on quarter, in the second quarter of 2014, which follows stable developments in the first quarter (see Table 11). The second quarter rise represents the largest quarterly increase since the first quarter of 2008, broadly reflecting the reversal of the stalling in employment growth that occurred in the first quarter of 2014. In addition, it is also likely to represent an increased sensitivity of employment to economic developments as labour market flexibility increases, for example, via increased use of temporary, part-time or self-employment contracts. Hours worked also increased, by 0.2% quarter on quarter, in the second quarter, after remaining stable in the first quarter of the year.
Behind the modest euro area aggregate employment growth, marked cross-country differences remain, albeit to a lesser extent than during 2013, with most euro area economies now showing
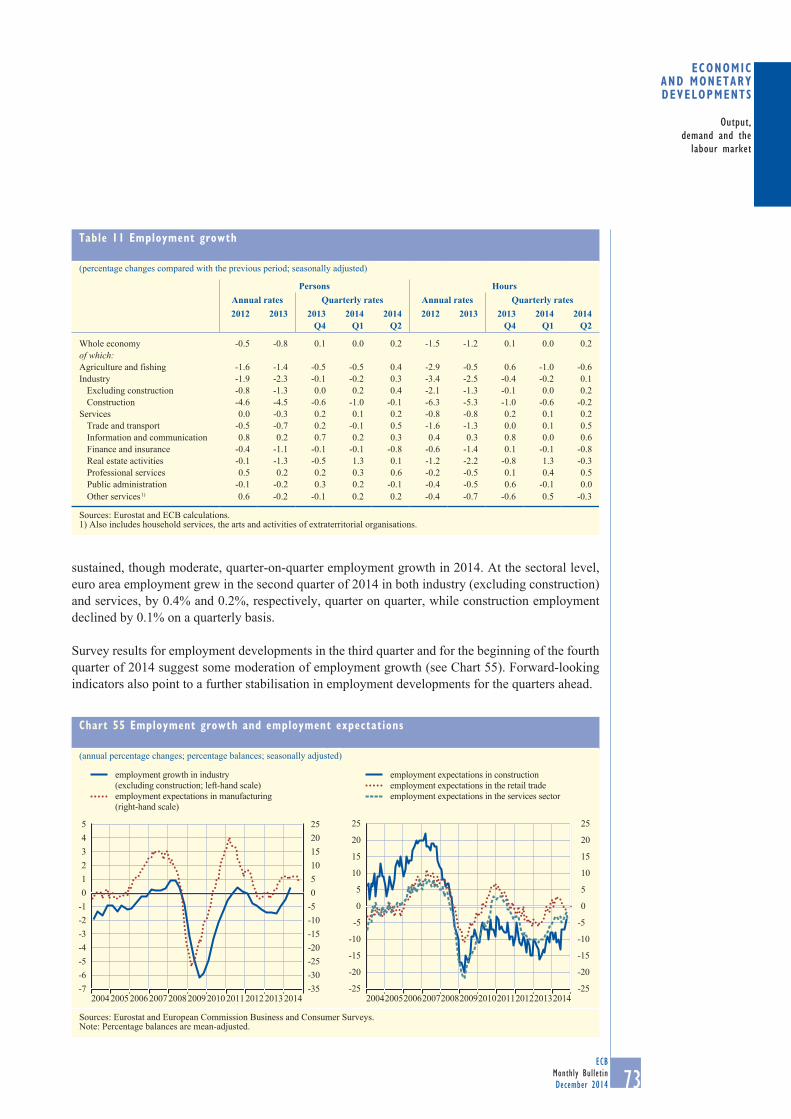
73ECB
Monthly BulletinDecember 2014
Output,demand and the
labour market
Economic and monEtary dEvElopmEnts
sustained, though moderate, quarter-on-quarter employment growth in 2014. At the sectoral level, euro area employment grew in the second quarter of 2014 in both industry (excluding construction) and services, by 0.4% and 0.2%, respectively, quarter on quarter, while construction employment declined by 0.1% on a quarterly basis.
Survey results for employment developments in the third quarter and for the beginning of the fourth quarter of 2014 suggest some moderation of employment growth (see Chart 55). Forward-looking indicators also point to a further stabilisation in employment developments for the quarters ahead.
table 11 employment growth
(percentage changes compared with the previous period; seasonally adjusted)
Persons HoursAnnual rates Quarterly rates Annual rates Quarterly rates2012 2013 2013
Q42014
Q12014
Q22012 2013 2013
Q42014
Q12014
Q2
Whole economy -0.5 -0.8 0.1 0.0 0.2 -1.5 -1.2 0.1 0.0 0.2 of which:Agriculture and fishing -1.6 -1.4 -0.5 -0.5 0.4 -2.9 -0.5 0.6 -1.0 -0.6Industry -1.9 -2.3 -0.1 -0.2 0.3 -3.4 -2.5 -0.4 -0.2 0.1
Excluding construction -0.8 -1.3 0.0 0.2 0.4 -2.1 -1.3 -0.1 0.0 0.2Construction -4.6 -4.5 -0.6 -1.0 -0.1 -6.3 -5.3 -1.0 -0.6 -0.2
Services 0.0 -0.3 0.2 0.1 0.2 -0.8 -0.8 0.2 0.1 0.2Trade and transport -0.5 -0.7 0.2 -0.1 0.5 -1.6 -1.3 0.0 0.1 0.5Information and communication 0.8 0.2 0.7 0.2 0.3 0.4 0.3 0.8 0.0 0.6Finance and insurance -0.4 -1.1 -0.1 -0.1 -0.8 -0.6 -1.4 0.1 -0.1 -0.8Real estate activities -0.1 -1.3 -0.5 1.3 0.1 -1.2 -2.2 -0.8 1.3 -0.3Professional services 0.5 0.2 0.2 0.3 0.6 -0.2 -0.5 0.1 0.4 0.5Public administration -0.1 -0.2 0.3 0.2 -0.1 -0.4 -0.5 0.6 -0.1 0.0Other services 1) 0.6 -0.2 -0.1 0.2 0.2 -0.4 -0.7 -0.6 0.5 -0.3
Sources: Eurostat and ECB calculations.1) Also includes household services, the arts and activities of extraterritorial organisations.
chart 55 employment growth and employment expectations
(annual percentage changes; percentage balances; seasonally adjusted)
2004 2006 2008 2010 20122005 2007 2009 2011 20132014-7-6-5-4-3-2-1012345
-35-30-25-20-15-10-50510152025
employment growth in industry (excluding construction; left-hand scale)employment expectations in manufacturing (right-hand scale)
-25
-20
-15
-10
-5
0
5
10
15
20
25
-25
-20
-15
-10
-5
0
5
10
15
20
25
2004 2006 2008 2010 20122005 2007 2009 2011 20132014
employment expectations in constructionemployment expectations in the retail tradeemployment expectations in the services sector
Sources: Eurostat and European Commission Business and Consumer Surveys.Note: Percentage balances are mean-adjusted.
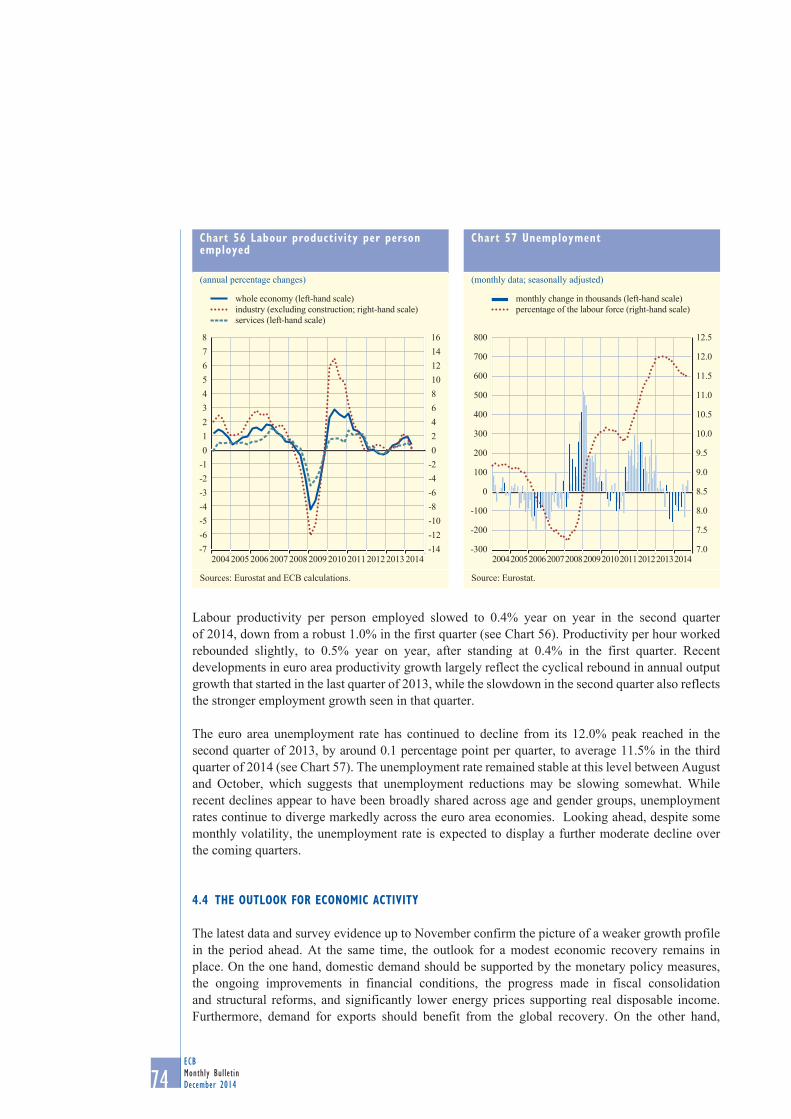
74ECBMonthly BulletinDecember 2014
Labour productivity per person employed slowed to 0.4% year on year in the second quarter of 2014, down from a robust 1.0% in the first quarter (see Chart 56). Productivity per hour worked rebounded slightly, to 0.5% year on year, after standing at 0.4% in the first quarter. Recent developments in euro area productivity growth largely reflect the cyclical rebound in annual output growth that started in the last quarter of 2013, while the slowdown in the second quarter also reflects the stronger employment growth seen in that quarter.
The euro area unemployment rate has continued to decline from its 12.0% peak reached in the second quarter of 2013, by around 0.1 percentage point per quarter, to average 11.5% in the third quarter of 2014 (see Chart 57). The unemployment rate remained stable at this level between August and October, which suggests that unemployment reductions may be slowing somewhat. While recent declines appear to have been broadly shared across age and gender groups, unemployment rates continue to diverge markedly across the euro area economies. Looking ahead, despite some monthly volatility, the unemployment rate is expected to display a further moderate decline over the coming quarters.
4.4 the outlooK for economic activity
The latest data and survey evidence up to November confirm the picture of a weaker growth profile in the period ahead. At the same time, the outlook for a modest economic recovery remains in place. On the one hand, domestic demand should be supported by the monetary policy measures, the ongoing improvements in financial conditions, the progress made in fiscal consolidation and structural reforms, and significantly lower energy prices supporting real disposable income. Furthermore, demand for exports should benefit from the global recovery. On the other hand,
chart 56 labour productivity per person employed
(annual percentage changes)
-7-6-5-4-3-2-1012345678
-14-12-10-8-6-4-20246810121416
2014
whole economy (left-hand scale)industry (excluding construction; right-hand scale)services (left-hand scale)
2004 20062005 2007 2009 2011 20132008 2010 2012
Sources: Eurostat and ECB calculations.
chart 57 unemployment
(monthly data; seasonally adjusted)
-300
-200
-100
0
100
200
300
400
500
600
700
800
7.0
7.5
8.0
8.5
9.0
9.5
10.0
10.5
11.0
11.5
12.0
12.5
20142013
monthly change in thousands (left-hand scale)percentage of the labour force (right-hand scale)
2004 200620072005 200820092010 20122011
Source: Eurostat.

75ECB
Monthly BulletinDecember 2014
Output,demand and the
labour market
Economic and monEtary dEvElopmEnts
the recovery is likely to continue to be dampened by high unemployment, sizeable unutilised capacity, and the necessary balance sheet adjustments in the public and private sectors.
These elements are reflected in the December 2014 Eurosystem staff macroeconomic projections for the euro area, which foresee annual real GDP increasing by 0.8% in 2014, 1.0% in 2015 and 1.5% in 2016. Compared with the September 2014 ECB staff macroeconomic projections, the projections for real GDP growth have been revised substantially downwards. Downward revisions were made to the projections for both domestic demand and net exports (see the article entitled “December 2014 Eurosystem staff macroeconomic projections for the euro area”).
The risks surrounding the economic outlook for the euro area are on the downside. In particular, the weak euro area growth momentum, alongside high geopolitical risks, has the potential to dampen confidence and especially private investment. In addition, insufficient progress in structural reforms in euro area countries constitutes a key downward risk to the economic outlook.
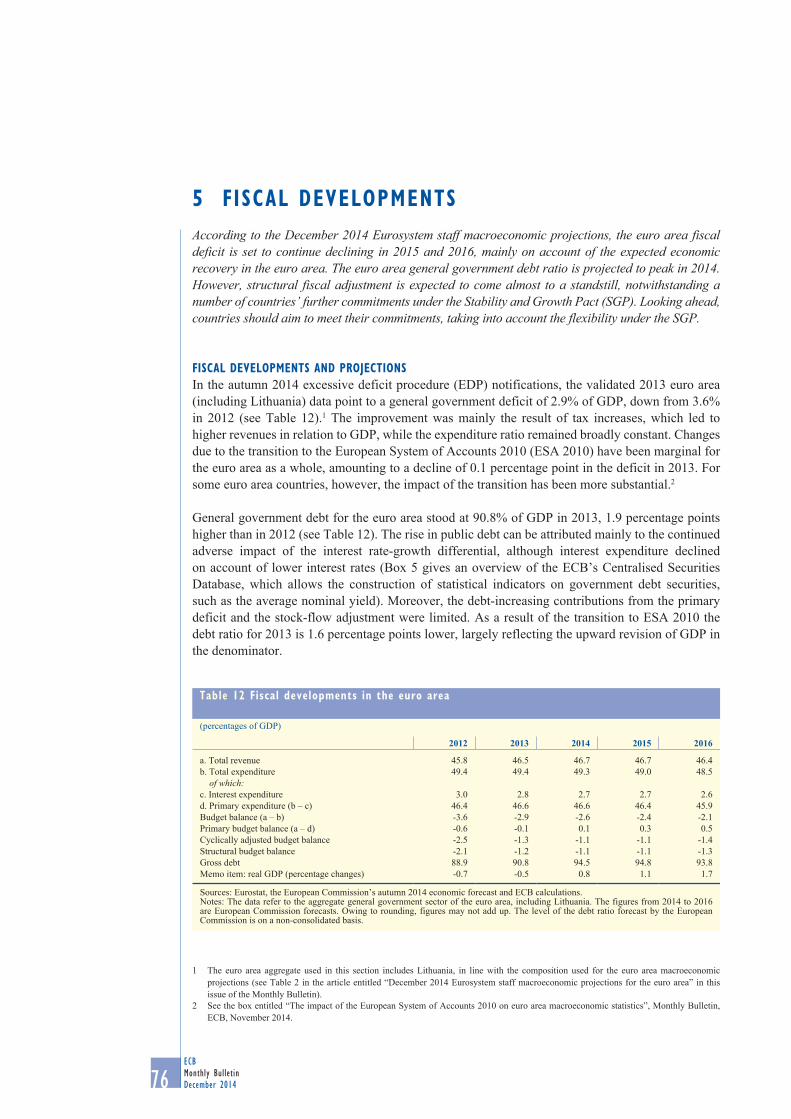
76ECBMonthly BulletinDecember 2014
5 fiscal DevelopmentsAccording to the December 2014 Eurosystem staff macroeconomic projections, the euro area fiscal deficit is set to continue declining in 2015 and 2016, mainly on account of the expected economic recovery in the euro area. The euro area general government debt ratio is projected to peak in 2014. However, structural fiscal adjustment is expected to come almost to a standstill, notwithstanding a number of countries’ further commitments under the Stability and Growth Pact (SGP). Looking ahead, countries should aim to meet their commitments, taking into account the flexibility under the SGP.
fiscal Developments anD proJectionsIn the autumn 2014 excessive deficit procedure (EDP) notifications, the validated 2013 euro area (including Lithuania) data point to a general government deficit of 2.9% of GDP, down from 3.6% in 2012 (see Table 12).1 The improvement was mainly the result of tax increases, which led to higher revenues in relation to GDP, while the expenditure ratio remained broadly constant. Changes due to the transition to the European System of Accounts 2010 (ESA 2010) have been marginal for the euro area as a whole, amounting to a decline of 0.1 percentage point in the deficit in 2013. For some euro area countries, however, the impact of the transition has been more substantial.2
General government debt for the euro area stood at 90.8% of GDP in 2013, 1.9 percentage points higher than in 2012 (see Table 12). The rise in public debt can be attributed mainly to the continued adverse impact of the interest rate-growth differential, although interest expenditure declined on account of lower interest rates (Box 5 gives an overview of the ECB’s Centralised Securities Database, which allows the construction of statistical indicators on government debt securities, such as the average nominal yield). Moreover, the debt-increasing contributions from the primary deficit and the stock-flow adjustment were limited. As a result of the transition to ESA 2010 the debt ratio for 2013 is 1.6 percentage points lower, largely reflecting the upward revision of GDP in the denominator.
1 The euro area aggregate used in this section includes Lithuania, in line with the composition used for the euro area macroeconomic projections (see Table 2 in the article entitled “December 2014 Eurosystem staff macroeconomic projections for the euro area” in this issue of the Monthly Bulletin).
2 See the box entitled “The impact of the European System of Accounts 2010 on euro area macroeconomic statistics”, Monthly Bulletin, ECB, November 2014.
table 12 fiscal developments in the euro area
(percentages of GDP)
2012 2013 2014 2015 2016
a. Total revenue 45.8 46.5 46.7 46.7 46.4b. Total expenditure 49.4 49.4 49.3 49.0 48.5
of which:c. Interest expenditure 3.0 2.8 2.7 2.7 2.6d. Primary expenditure (b – c) 46.4 46.6 46.6 46.4 45.9Budget balance (a – b) -3.6 -2.9 -2.6 -2.4 -2.1Primary budget balance (a – d) -0.6 -0.1 0.1 0.3 0.5Cyclically adjusted budget balance -2.5 -1.3 -1.1 -1.1 -1.4Structural budget balance -2.1 -1.2 -1.1 -1.1 -1.3Gross debt 88.9 90.8 94.5 94.8 93.8Memo item: real GDP (percentage changes) -0.7 -0.5 0.8 1.1 1.7
Sources: Eurostat, the European Commission’s autumn 2014 economic forecast and ECB calculations.Notes: The data refer to the aggregate general government sector of the euro area, including Lithuania. The figures from 2014 to 2016 are European Commission forecasts. Owing to rounding, figures may not add up. The level of the debt ratio forecast by the European Commission is on a non-consolidated basis.
77ECB
Monthly BulletinDecember 2014
Fiscal developments
Economic and monEtary dEvElopmEnts
Looking ahead, the Eurosystem staff macroeconomic projections point to a decline in the euro area general government fiscal deficit over the next two years mainly on account of the expected gradual cyclical improvement, while the pace of structural fiscal adjustment is expected to come almost to a standstill.3 The deficit-to-GDP ratio is seen declining to 2.6% of GDP in 2014, and slightly further to 2.5% in 2015 and 2.2% in 2016. This profile is broadly in line with the European Commission’s autumn 2014 economic forecast (see Table 12). The Commission expects the reduction of the fiscal deficit to be fully expenditure-driven. Over the full projection horizon, the expenditure-to-GDP ratio is forecast to decline by 0.9 percentage point compared with 2013, reaching 48.5% in 2016, while revenues are expected to develop broadly in line with GDP.
The Eurosystem staff macroeconomic projections foresee general government debt in the euro area peaking in 2014. According to the European Commission’s autumn 2014 economic forecast, the debt-to-GDP ratio is expected to increase to 94.5% in 2014 and further to 94.8% in 2015 on account of the debt-increasing impact of the stock-flow adjustment and still high interest expenditure, and to decline gradually in 2016 to 93.8%.4 The fall in the debt ratio is explained mainly by the expected rise in the primary surplus and the debt-declining impact of the interest rate-growth differential.
3 See the article entitled “December 2014 Eurosystem staff macroeconomic projections for the euro area” in this issue of the Monthly Bulletin.4 The level of the debt ratio is higher in the European Commission forecasts than in the Eurosystem staff macroeconomic projections.
While the former publishes debt data on a non-consolidated basis, the Eurosystem projections correct the euro area aggregate for intergovernmental loans, in line with the practice followed by Eurostat.
box 5
new statistical inDicators on Government Debt securities anD their use in fiscal analysis anD surveillance
This box provides a short overview of the potential uses of new statistical indicators on government debt securities developed on the basis of the information contained in the ECB’s Centralised Securities Database (CSDB). These indicators include securities outstanding, issuance, redemptions, debt service together with associated interest rate (nominal yield), broken down by original and residual maturity, currency and type of coupon rate for the euro area and individual countries. The indicators were published for the first time in the “Euro area statistics” section of the Monthly Bulletin (Tables 6.4 and 6.5) in November 2014 and are available in the ECB’s Statistical Data Warehouse in dedicated data reports.1
The Centralised Securities Database
The CSDB was created in 2009 as a multi-purpose system; it was developed by the ECB and is jointly operated by the members of the European System of Central Banks (ESCB). The system obtains data from commercial data providers and other sources (via ESCB members) and is accessible to users in the ESCB. It makes use of expertise within the ESCB to enhance data quality.2
1 See “Debt securities issuance and service by EU governments” in the “Reports” section of the Statistical Data Warehouse (http://sdw.ecb.europa.eu).
2 In accordance with the Guideline of the European Central Bank of 26 September 2012 on the data quality management framework for the Centralised Securities Database (ECB/2012/21).
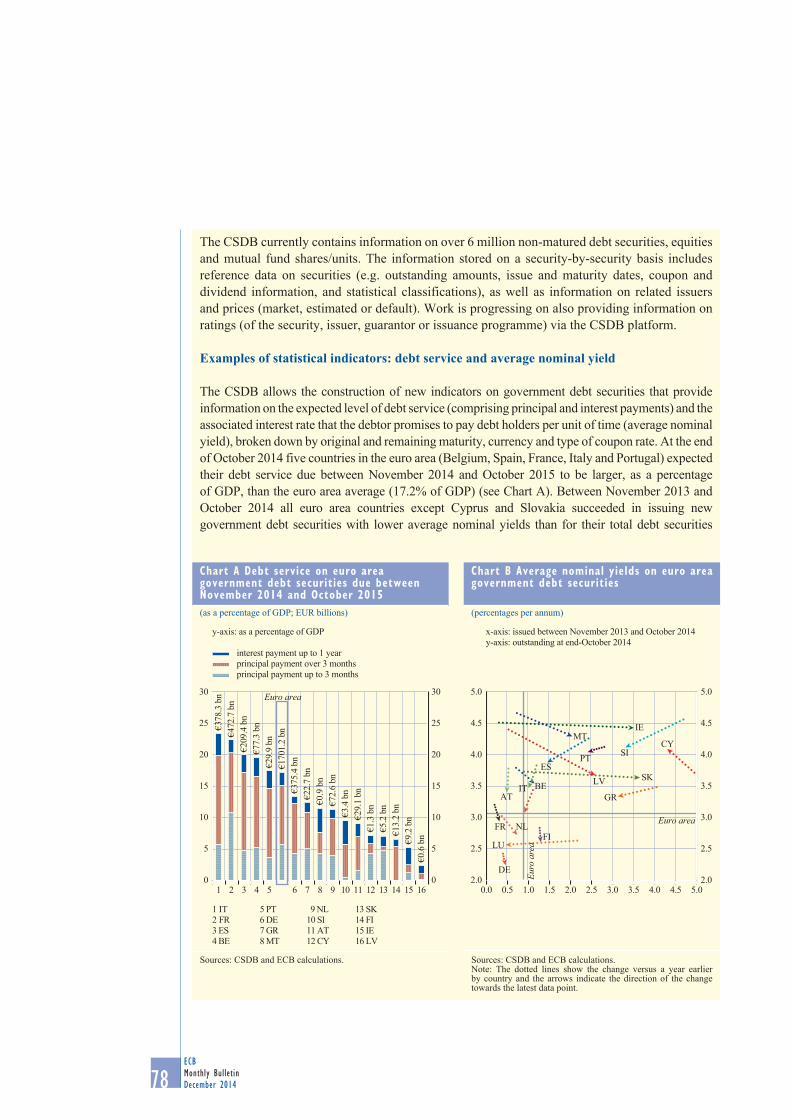
78ECBMonthly BulletinDecember 2014
The CSDB currently contains information on over 6 million non-matured debt securities, equities and mutual fund shares/units. The information stored on a security-by-security basis includes reference data on securities (e.g. outstanding amounts, issue and maturity dates, coupon and dividend information, and statistical classifications), as well as information on related issuers and prices (market, estimated or default). Work is progressing on also providing information on ratings (of the security, issuer, guarantor or issuance programme) via the CSDB platform.
Examples of statistical indicators: debt service and average nominal yield
The CSDB allows the construction of new indicators on government debt securities that provide information on the expected level of debt service (comprising principal and interest payments) and the associated interest rate that the debtor promises to pay debt holders per unit of time (average nominal yield), broken down by original and remaining maturity, currency and type of coupon rate. At the end of October 2014 five countries in the euro area (Belgium, Spain, France, Italy and Portugal) expected their debt service due between November 2014 and October 2015 to be larger, as a percentage of GDP, than the euro area average (17.2% of GDP) (see Chart A). Between November 2013 and October 2014 all euro area countries except Cyprus and Slovakia succeeded in issuing new government debt securities with lower average nominal yields than for their total debt securities
chart a Debt service on euro area government debt securities due between november 2014 and october 2015(as a percentage of GDP; EUR billions)
€378
.3 b
n€4
72.7
bn
€209
.4 b
n€7
7.3
bn€2
9.9
bn€1
701.
2 bn
€375
.4 b
n€2
2.7
bn€0
.9 b
n€7
2.6
bn€3
.4 b
n€2
9.1
bn€1
.3 b
n€5
.2 b
n€1
3.2
bn€9
.2 b
n€0
.6 b
n
0
5
10
15
20
25
30
0
5
10
15
20
25
30Euro area
y-axis: as a percentage of GDP
interest payment up to 1 yearprincipal payment over 3 monthsprincipal payment up to 3 months
13 SK14 FI15 IE16 LV
1 IT2 FR3 ES4 BE
5 PT6 DE7 GR8 MT
9 NL10 SI11 AT12 CY
1 2 3 4 5 6 7 8 9 10 11 12 13 14 15 16
Sources: CSDB and ECB calculations.
chart b average nominal yields on euro area government debt securities
(percentages per annum)
BE
DE
IE
GR
ES
FR
IT
CY
LU
MT
NL
AT
PT SI
SK
FI
Euro area
LV
2.0
2.5
3.0
3.5
4.0
4.5
5.0
2.0
2.5
3.0
3.5
4.0
4.5
5.0
Euro
are
a
0.0 0.5 1.0 1.5 2.0 2.5 3.0 3.5 4.0 4.5 5.0
y-axis: outstanding at end-October 2014x-axis: issued between November 2013 and October 2014
Sources: CSDB and ECB calculations.Note: The dotted lines show the change versus a year earlier by country and the arrows indicate the direction of the change towards the latest data point.
79ECB
Monthly BulletinDecember 2014
Fiscal developments
Economic and monEtary dEvElopmEnts
buDGetary Developments anD plans in selecteD countriesRecent budgetary developments and plans for the four largest euro area countries and for selected countries that are currently subject to, or have recently exited, an EU-IMF adjustment programme are described below.
In Germany, the draft budgetary plan leaves the government’s targets of the 2014 stability programme update broadly unchanged. It foresees a balanced budget in nominal terms and a structural surplus of 0.5% of GDP in 2015. However, the draft budgetary plan does not take into account the latest government projections with downwardly revised GDP growth, or the latest official tax revenue forecast, which foresees revenue shortfalls of 0.25% of GDP in 2015 (compared with the previous forecast from May 2014). Nonetheless, Germany is expected to outperform its medium-term budgetary objective (MTO), i.e. a structural deficit of 0.5% of GDP in 2015. The government foresees a substantial reduction in the debt ratio over the next few years, going beyond the requirements of the national “debt brake” and the debt reduction benchmark in the SGP.
outstanding. This has contributed to bringing average nominal yields for total debt securities outstanding below their level a year ago for all euro area governments except Cyprus (see Chart B).3
Analytical use
The CSDB has been used extensively by the ECB during the crises as a source of detailed information on financing needs for the countries under the EU/IMF Economic Adjustment Programme. Moreover, the database is an indispensable source of information for the ECB’s Financial Stability Review 4, as well as for the fiscal forecast in the context of ECB staff macroeconomic projections for the euro area. Apart from the availability of very detailed data, the timeliness of the CSDB information enables the rapid analysis of developments and trends in the financial markets.5
Given that debt securities account for around 80% of government debt in the euro area, the CSDB can help to refine the prediction of sovereign financing needs, both in the short run (to signal sovereign liquidity risks) and the medium run (to identify potential peaks in sovereign bond redemptions). Liquidity and sovereign debt sustainability risks are important not only in fiscal surveillance but also in the monitoring of financial stability. Large financing needs of the sovereign can crowd out agents in other sectors, both financial institutions and corporations. At the same time, large-scale exposures of financial institutions to sovereigns with significant sustainability risks can point to vulnerabilities of these institutions. Therefore, detailed information on the risks associated with sovereigns could feed into vulnerability matrices for other sectors, in particular the financial sector.
3 The nominal yield (expressed as a percentage per annum) comprises the coupon rate (i.e. the interest rate stated on a bond when issued) and any difference between the stated redemption price at maturity and the issue price (i.e. a discount or premium). The average nominal yield weighted by the outstanding amounts of each individual debt security can be calculated for the debt securities issued during the previous 12 months, which is useful to compare with the average nominal yield for total debt securities outstanding to determine whether new issuance has become more or less expensive. The average nominal yield for total debt securities is affected by a) the average nominal yield on new government debt securities, b) the foregoing average nominal yields on maturing government debt securities, and c) changes to interest rates on current government debt securities outstanding (e.g. variable coupon rates). The average nominal yield on new government debt securities issued during the previous 12 months may be affected not only by various market forces (e.g. issuance demand, issuer risk of default, and current and expected market interest rates) but also by choices made by the issuer, such as maturity selection (typically longer maturities have higher nominal yields) and issuance volumes.
4 See the most recent issue of the Financial Stability Review, ECB, Frankfurt am Main, November 2014. (All vintages are available on the ECB’s website at http://www.ecb.europa.eu/pub/fsr/html/index.en.html.)
5 The system processes information on a daily basis and provides end-of-month data with a delay of approximately one to two weeks, which means that users have access to the data far more quickly than to other aggregated statistics.

80ECBMonthly BulletinDecember 2014
In France, the government’s new headline deficit targets set in the draft budget plan have been relaxed substantially compared with those in the stability programme update (4.4% of GDP, instead of 3.6%, in 2014 and 4.3% of GDP, instead of 2.8%, in 2015). The draft budgetary plan foresees a correction of the excessive deficit only by 2017, in contrast to the 2015 EDP deadline. This implies large consolidation shortfalls over the 2013-15 EDP period. Not only will the planned nominal deficit in 2015 substantially exceed the EDP target (by 1.5 percentage points), but also the structural consolidation gap will be very large (1.5 percentage points over the 2013-15 EDP period). On 27 October, France announced additional consolidation measures for 2015 (amounting to an additional structural effort of around 0.2% of GDP according to the government). However, these additional efforts are not sufficient to fully address the consolidation gap, so that France is running the risk of non-compliance with the SGP requirements.
In Italy, the draft budgetary plan foresees a deficit target of 2.6% of GDP in 2015, more relaxed than the 1.8% of GDP target set in the 2014 stability programme update. The draft budget foresees, inter alia, a reduction of social security contributions for newly hired workers, a cut in the local business tax (IRAP) and the now permanent transfer, in the form of a tax bonus, to low income earners, which was initially introduced on a temporary basis in April 2014. These expansionary measures will partly be compensated for by a reduction in government spending, particularly at the subnational government level. Overall, the draft budget would imply an increase in the 2015 net borrowing requirements of 0.4% of GDP. Moreover, government plans point to a postponement of the MTO deadline to 2017 (i.e. two years later than recommended by the ECOFIN Council in its Opinion published in July 2014) and a deviation from the debt rule. Looking ahead, it is important to ensure full compliance with the SGP requirements and the debt rule in order not to endanger fiscal sustainability and to maintain market confidence.
In Spain, the aggregate deficit of the central government, regional government and social security sectors (excluding support to financial institutions) over the period January-September 2014 was 4.1% of annual GDP, down from 4.6% over the same period in 2013. Based on outturn data so far, it seems likely that the deficit-to-GDP ratio for this year will be close to the target of 5.5% set in the stability programme update and confirmed in the draft budgetary plan of October. According to the latter, the deficit ratio should fall to 4.2% in 2015 and to 2.8% in 2016, in line with Spain’s EDP commitments. However, the budgetary plan forecast is built on the assumption of a relatively strong rebound in receipts and continued expenditure reform.
In Cyprus, cash fiscal data for the first nine months of 2014 show strong year-on-year growth in VAT receipts and corporate income tax revenues and continued prudent budget execution. These data are consistent with the European Commission’s autumn 2014 forecast, which projects that Cyprus will achieve a small primary surplus in 2014 and is on track to correct its excessive deficit (bringing it below the 3% reference value) two years ahead of the 2016 EDP deadline.
In Ireland, the draft budgetary plan points to a deficit of 3.7% of GDP in 2014, which is 1.1% of GDP below the target set in the stability programme update. Despite the adoption of expansionary measures of €1 billion (0.5% of GDP), the draft budgetary plan targets a reduction of the deficit to 2.7% of GDP in 2015, thanks to continued supportive economic conditions and lower interest spending, in part due to the early repayment of the IMF loan. The target is consistent with exiting the EDP by the 2015 deadline. In the medium term, the draft budgetary plan foresees a gradual improvement of the deficit consistent with reaching the MTO by 2018, on the back of continued growth and a flat profile of primary spending. Additional measures, however, will be needed to

81ECB
Monthly BulletinDecember 2014
Fiscal developments
Economic and monEtary dEvElopmEnts
make the targeted spending profile realistic. In its autumn 2014 forecast, the European Commission projects a deficit of 2.9% of GDP in 2015 and a slight worsening to 3.0% of GDP in 2016.
In Portugal, the government’s new headline deficit target for 2014, as set in the draft budgetary plan, is substantially above that of the stability programme update (4.8% of GDP instead of 4.0%) mainly due to higher one-off expenditures. For 2015, the target set in the draft budgetary plan is also slightly above the stability programme update and the EDP target (2.7% of GDP instead of 2.5%). The draft budgetary plan contains a variety of discretionary consolidation measures amounting to 0.7% of GDP, some of which are one-off or might be subject to implementation risks. Moreover, the government projections are based on optimistic assumptions regarding the budgetary impact of macroeconomic developments and the fight against fraud and tax evasion. In its autumn 2014 forecast, the European Commission projects a fiscal deficit of 3.3% of GDP in 2015.
fiscal policy challenGes The pace of fiscal consolidation, as measured by the change in the structural budget balance, has slowed substantially since 2013, which implies for a number of countries the risk of non-compliance with commitments under the SGP. The expected shortfall is hardly related to the slower than expected economic recovery but reflects insufficient structural efforts in a number of countries. This is also evident in the draft budgetary plans, which countries had to submit in mid-October 2014. Some countries have announced additional measures after the European Commission asked them for additional information and specification details. In its opinion published on 28 November, the European Commission did not assess any of the draft budgetary plans to be in particularly serious breach of SGP requirements, in which case it would have asked for a revised draft budgetary plan.5 However, the Commission assesses the draft budgets of seven countries to pose a “risk of non-compliance” with the SGP (see Box 6).
While additional fiscal efforts are indispensable in some countries if they are to meet requirements, fiscal policy may, within the framework of the SGP, be utilised to support the fragile economic recovery in the euro area. However, the fiscal space to support growth is fairly limited and restricted to only a few countries. Moreover, the positive spill-over effects to other countries of potentially more expansionary fiscal policy in some countries within the margin of the SGP framework are uncertain and likely to be small.
To boost economic growth in Europe, the European Commission presented on 26 November an “investment plan for Europe”, which aims to mobilise investment projects in the amount of €315 billion over a period of three years. In this context, a new European Fund for Strategic Investments will be created to cover the main risks of new investment projects. According to the Commission, the new fund should trigger a multiplier effect of around 15 by attracting private investors. The fund will be guaranteed with public money from the EU budget and the European Investment Bank for a total of €21 billion. It will primarily finance growth-enhancing investment projects in the area of energy, transport and broadband networks, while one quarter of the available funds should be channelled to SMEs. While the initiative could improve the growth outlook in Europe, it is essential that efforts to boost public investment are based on the careful identification of core projects with a growth-enhancing impact following a sound cost-benefit analysis.
5 See the European Commission’s opinions published on 28 November 2014 (http://ec.europa.eu/economy_finance/economic_governance/sgp/budgetary_plans/index_en.htm).

82ECBMonthly BulletinDecember 2014
Efforts to boost structural reforms need to be intensified and fiscal consolidation should be conducted in a growth-friendly manner. In countries where fiscal adjustment requires further cuts in government spending, a reprioritisation of public spending towards items mainly supporting potential growth, such as public investment, should be fostered. Reform efforts on the revenue side should focus on addressing the distortionary impact of taxation and on tax evasion. With respect to tax wedge reductions, the Eurogroup announced in a statement its intension to agree on a set of common principles which should guide future tax reforms.6
A mandatory review of the EU governance framework (i.e. the “six-pack” and “two-pack” regulations) is required by the end of 2014. On 28 November, the European Commission published a short review, in which it assessed the reformed governance framework as effective in strengthening budgetary surveillance.7 It also announced a discussion on possible areas of improvement in 2015. While a strengthened governance framework is welcomed in order to increase budgetary discipline, the framework has become increasingly more complex. This makes it more difficult to implement the regulations consistently. There is also room for improvement in interlinking the various elements of the regulations, especially the preventive and the corrective arms of the SGP with respect to the medium-term objective and the debt benchmark. In addition, for the credibility of the SGP, it is indispensable to increase transparency regarding the application of the framework and to ensure its full implementation. This also implies that all data underlying decisions under the SGP should be published.
6 See the Eurogroup’s statement published on 8 July 2014 (http://www.eurozone.europa.eu/media/539623/20140707-eurogroup-statement-on-reducing-tax-wedge-on-labour.pdf).
7 See the European commission’s review published on 28 November (http://ec.europa.eu/economy_finance/economic_governance/documents/com(2014)905_en.pdf).
box 6
the review of Draft buDGetary plans for 2015
On 28 November the European Commission released its opinions on euro area non-programme countries’ draft budgetary plans for 2015. The opinions entail an assessment of the extent to which governments’ plans, as outlined in the draft budgetary plans, meet the requirements of the Stability and Growth Pact (SGP) and follow up on the guidance the European Council provided in its country-specific recommendations that were adopted on 8 July.1
In its opinions on the draft budgetary plans, of the 16 countries that participated in the review exercise the Commission assesses the plans of five countries to be “compliant” with the provisions of the SGP (i.e. those of Germany, Ireland, Luxembourg, the Netherlands and Slovakia). By contrast, it regards four countries’ draft budgets as only “broadly compliant” (i.e. Estonia, Latvia, Slovenia and Finland), while the budget plans of seven countries run, in the opinion of the Commission, a “risk of non-compliance” with the SGP. The latter group comprises Spain, France, Malta and Portugal, which are still subject to excessive deficit procedures, as well as Italy, Belgium and Austria, which exited excessive deficit procedures in 2012 (Italy) and 2013
1 See also the box entitled “Country-specific recommendations for fiscal policies under the 2014 European Semester” in the September 2014 issue of the Monthly Bulletin. The country-specific recommendations for fiscal policies under the 2014 European Semester call on nine of the 16 euro area countries to reinforce their budgetary strategies in 2014. Specifically, these countries have been requested to take additional measures to address the risk of non-compliance with the SGP.

83ECB
Monthly BulletinDecember 2014
Fiscal developments
Economic and monEtary dEvElopmEnts
(Belgium and Austria). The Commission calls on those 11 countries whose plans are not fully compliant to take the necessary measures to ensure that their budgets will comply with the SGP.
The Commission’s opinions thus reflect the expectation that the structural effort in 2015 is likely to fall short of commitments under the SGP in many euro area countries. On the one hand, this stems from a lack of progress towards countries’ medium-term budgetary objectives under the preventive arm of the Pact. On the other hand, it relates to insufficient structural efforts under its corrective arm, the excessive deficit procedure. Notably, based on the Commission’s 2014 autumn forecast, under the preventive arm countries will only slightly tighten, by 0.2 percentage point of GDP,2 their fiscal stance in progressing towards their medium-term objectives, while countries subject to an excessive deficit procedure do not, on average, make any progress with structural consolidation, despite the relatively stronger effort needed to achieve sustainable fiscal positions. Finally, countries in full compliance with the SGP that partly over-achieve their fiscal targets are planning to loosen on average slightly, by 0.1 percentage point of GDP, their fiscal stance in 2015.
In the cases of France, which the Commission assesses not to have taken effective action under its excessive deficit procedure in 2014 and which no longer plans to comply with its 2015 excessive deficit procedure deadline according to its draft budgetary plan, and of Italy and Belgium, whose draft budgetary plans indicate non-compliance with the debt rule, the Commission will examine its position regarding obligations under the SGP in early March 2015,
2 For two countries subject to the preventive arm (Belgium and Italy) the debt rule is currently the binding constraint. For both countries the Commission will decide in spring 2015 on the need to open a debt-based excessive deficit procedure.
2015 draft budgetary plans
Commission opinion on compliance of 2015 draft budgetary plans with SGP (SGP commitment)
Actual structural effort 2015 (EC 2014 autumn forecast)
2015 structural effort commitment under SGP (in percentage points)
“Compliant”
Germany (preventive arm) -0.1 0.0 (at MTO)Luxemburg (preventive arm) -0.7 0.0 (at MTO) Netherlands (preventive arm) -0.3 0.0 (at MTO) Slovakia (preventive arm) 0.8 0.6Ireland (EDP deadline 2015) 0.4 1.9
“Broadly compliant”
Estonia (preventive arm) 0.1 0.5Latvia (preventive arm) -0.2 -0.4 1)
Slovenia (EDP deadline 2015) 0.3 0.5Finland (preventive arm) 0.0 0.1
“Risk of non-compliance”
Belgium (preventive arm) 0.4 0.7 (debt rule)Italy (preventive arm) 0.1 2.5 (debt rule)Malta (EDP deadline 2014) -0.2 0.6Austria (preventive arm) 0.1 0.6Spain (EDP deadline 2016) -0.2 0.8France (EDP deadline 2015) 0.1 0.8Portugal (EDP deadline 2015) -0.3 0.5
Sources: Draft budgetary plans for 2015 (http://ec.europa.eu/economy_finance/economic_governance/sgp/budgetary_plans/index_en.htm) and the European Commission’s 2014 autumn forecast.1) Reduction of adjustment requirement based on pension reform and investment clause.
84ECBMonthly BulletinDecember 2014
in the light of the finalisation of budget laws and the expected specification of structural reform programmes announced by the countries’ governments. For France, if the Council confirms its current assessment of non-compliance with the Pact, it could eventually lead to a stepping up of the country’s excessive deficit procedure, including possible sanctions. For Belgium and Italy, if the Commission confirms its assessment of a breach of the debt rule, it would subsequently have to prepare a report under Article 126(3) of the Treaty that could lead to a debt-based excessive deficit procedure, unless mitigating factors are found for non-compliance with the debt benchmark.
Furthermore, the Commission assesses the composition of public finances at the country level as inappropriate. It stresses that, while recent moves to reduce the tax burden on labour go in the right direction towards the needed, more growth-friendly composition of public finances, there has been little, if any, progress in making the composition of expenditure more growth-friendly.
While structural reforms are currently of vital importance to enhance economies’ growth potential, if such reforms were to be accounted for in the assessment of SGP compliance, it would need to be in full compliance with existing Pact provisions. Under the preventive arm, measureable fiscal costs of structural reforms with a positive effect on long-term sustainability can be taken into account. Under the corrective arm, structural reforms can play a role as a so-called relevant factor when deciding on a deadline extension, but the latter are only possible if the two pre-conditions of effective action and adverse macroeconomic developments are both fulfilled.
The Eurogroup invited, on 8 December, Member States whose draft budgetary plans are broadly compliant with the provisions of the SGP to ensure compliance with these provisions within the national budgetary process and welcomed their commitment to take compensatory measures as appropriate. Furthermore, the Eurogroup called on those Member States whose plans run the risk of non-compliance with the rules of the preventive arm to take, in a timely manner, additional measures to address the risks regarding an appropriate convergence towards their medium-term budgetary objectives and to respect the debt rule. In turn, countries under the corrective arm of the SGP should ensure a timely correction of their excessive deficits and appropriate convergence towards their medium-term objectives afterwards, and respect the debt rule. To this end, Malta, Austria, Belgium, Italy, France, Portugal and Spain committed to take the measures needed to close the gaps identified by the Commission, thereby ensuring compliance with the SGP.
It is important that the review of draft budgetary plans is followed up in a structured manner, which requires the full and consistant implementation of the euro area’s existing fiscal and macroeconomic governance framework.
85ECB
Monthly BulletinDecember 2014
art icle
December 2014 eurosystem staff macroeconomic proJections for the euro area1
Activity has turned out weaker than was expected at the beginning of the year, mostly driven by unexpectedly subdued growth in investment and exports. The current phase of modest growth is projected to extend into 2015. However, a number of supportive external and domestic factors, among them the very accommodative monetary policy stance in the euro area – strengthened by the standard and non-standard measures taken in June and September 2014 – should come to the fore during the course of 2015, with real GDP growth subsequently expected to shift into a somewhat higher gear. Real GDP is projected to increase by 0.8% in 2014, 1.0% in 2015 and 1.5% in 2016. As these rates increasingly exceed estimated potential growth, the output gap will close slowly over the horizon but remain negative in 2016. Substantial downward revisions were made to the real GDP growth outlook vis-à-vis the projection published in the September 2014 issue of the Monthly Bulletin.
Euro area HICP inflation is projected to remain low in the near term and to rise only gradually over the projection horizon. It is projected to average 0.5% in 2014, 0.7% in 2015 and 1.3% in 2016. The recent fall in oil prices has significantly dampened the short-term inflation outlook. However, the gradual narrowing of the negative output gap and rising external price pressures, reinforced by the lower exchange rate of the euro, are expected to support an increase in HICP inflation over the projection horizon. Nevertheless, the remaining slack in the economy will prevent a strong pick-up in inflation. Compared with the projection published in the September 2014 issue of the Monthly Bulletin, the outlook for HICP inflation has been revised significantly downwards.
This article summarises the macroeconomic projections for the euro area for the period 2014-16. Projections for a period over such a long horizon are subject to very high uncertainty.2 This should be borne in mind when interpreting them. It should also be stressed that the recent non-standard monetary policy measures were taken into account in this projection exercise only to the extent that they have already affected financial variables, whereas further transmission channels have not been incorporated. This implies that the baseline most likely underestimates the impact of the monetary policy packages.
the international environmentThe global recovery is projected to continue gaining strength, albeit gradually. World real GDP growth (excluding the euro area) is projected to pick up over the projection horizon, rising from 3.6% in 2014 to 4.2% in 2016. The recovery is, however, expected to remain uneven across regions. Following rather subdued activity at the start of 2014, growth momentum in some advanced economies outside the euro area has been broadly firming. By contrast, growth momentum in emerging markets has remained subdued overall, with some divergence across regions. Beyond the short term, global activity should strengthen gradually, but the recovery is still expected to remain modest. While some key advanced economies are benefiting from diminishing headwinds, increasing structural challenges and the tightening of financial conditions make it unlikely that emerging economies will return to the growth rates recorded before the crisis.
Global trade momentum remained weak in the first half of the year. However, global trade growth is expected to have reached a trough in the second quarter and is projected to pick up over the projection horizon, from 2.7% in 2014 to 5.2% in 2016 (world excluding the euro area). Its elasticity
1 Eurosystem staff macroeconomic projections are an input into the Governing Council’s assessment of economic developments and the risks to price stability. Information on the procedures and techniques used is given in A guide to Eurosystem staff macroeconomic projection exercises, ECB, June 2001, which is available on the ECB’s website. The cut-off date for including the latest information in this exercise was 20 November 2014.
2 See the article entitled “An assessment of Eurosystem staff macroeconomic projections” in the May 2013 issue of the Monthly Bulletin.

86ECBMonthly BulletinDecember 2014
to global activity at the end of the projection horizon is expected to remain below that recorded before the global crisis. With import demand from the euro area’s main trading partners expected to expand at a slower pace than that from the rest of the world, euro area foreign demand growth is projected to be slightly weaker than global trade growth (see Table 1).
Compared with the macroeconomic projections published in the September 2014 issue of the Monthly Bulletin, the global growth outlook has been revised slightly downwards, while the outlook for euro area foreign demand has been revised down more significantly. The revisions to the outlook for euro area foreign demand reflect lower data outturns and a downward revision to the path of the increase in the elasticity of global trade to activity towards its long-term level, in order to account for past forecast errors.
table 1 the international environment
(annual percentage changes)
December 2014 September 2014Revisions since September 2014
2013 2014 2015 2016 2014 2015 2016 2014 2015 2016
World (excluding euro area) real GDP 3.7 3.6 4.0 4.2 3.7 4.2 4.3 -0.1 -0.1 -0.1Global (excluding euro area) trade 1) 3.4 2.7 3.9 5.2 3.9 5.5 5.9 -1.2 -1.6 -0.7Euro area foreign demand 2) 2.9 2.3 3.4 4.9 3.5 5.0 5.6 -1.2 -1.6 -0.6
Note: Revisions are calculated from unrounded data.1) Calculated as a weighted average of imports.2) Calculated as a weighted average of imports of euro area trade partners.
box 1
technical assumptions about interest rates, eXchanGe rates, commoDity prices anD fiscal policies
The technical assumptions about interest rates and commodity prices are based on market expectations, with a cut-off date of 13 November 2014. Short-term rates refer to the three-month EURIBOR, with market expectations derived from futures rates. The methodology gives an average level for these short-term interest rates of 0.2% for 2014 and 0.1% for 2015 and 2016. The market expectations for euro area ten-year nominal government bond yields imply an average level of 2.0% in 2014, 1.8% in 2015 and 2.1% in 2016.1 Reflecting the path of forward market interest rates and the gradual pass-through of changes in market rates to lending rates, composite bank lending rates on loans to the euro area non-financial private sector are expected to decline somewhat in 2014 and 2015, before rising modestly in the course of 2016.
As regards commodity prices, on the basis of the path implied by futures markets in the two-week period ending on the cut-off date of 13 November, the price of a barrel of Brent crude oil is assumed to fall from USD 102.6 in the third quarter of 2014 to USD 85.6 in 2015, before
1 The assumption for euro area ten-year nominal government bond yields is based on the weighted average of countries’ ten-year benchmark bond yields, weighted by annual GDP figures and extended by the forward path derived from the ECB’s euro area all-bonds ten-year par yield, with the initial discrepancy between the two series kept constant over the projection horizon. The spreads between country-specific government bond yields and the corresponding euro area average are assumed to be constant over the projection horizon.
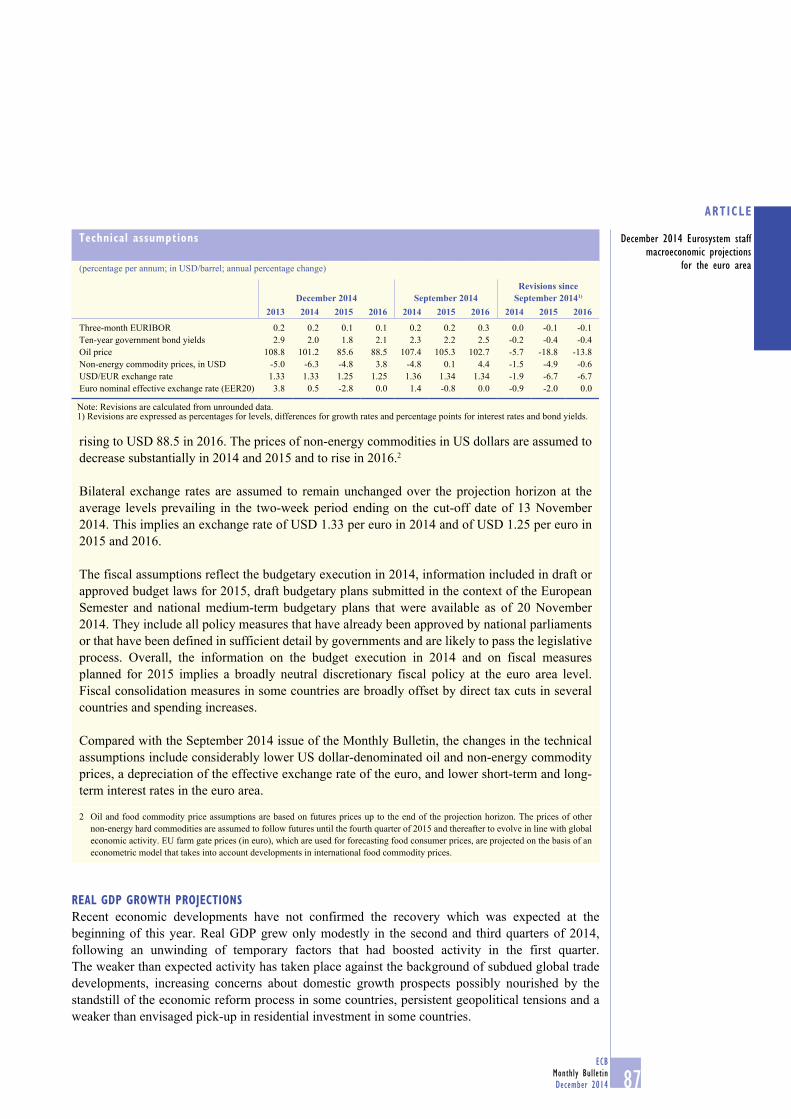
87ECB
Monthly BulletinDecember 2014
December 2014 Eurosystem staff macroeconomic projections
for the euro area
ARTICLE
REAL GDP GROWTH PROJECTIONSRecent economic developments have not confirmed the recovery which was expected at the beginning of this year. Real GDP grew only modestly in the second and third quarters of 2014, following an unwinding of temporary factors that had boosted activity in the first quarter. The weaker than expected activity has taken place against the background of subdued global trade developments, increasing concerns about domestic growth prospects possibly nourished by the standstill of the economic reform process in some countries, persistent geopolitical tensions and a weaker than envisaged pick-up in residential investment in some countries.
rising to USD 88.5 in 2016. The prices of non-energy commodities in US dollars are assumed to decrease substantially in 2014 and 2015 and to rise in 2016.2
Bilateral exchange rates are assumed to remain unchanged over the projection horizon at the average levels prevailing in the two-week period ending on the cut-off date of 13 November 2014. This implies an exchange rate of USD 1.33 per euro in 2014 and of USD 1.25 per euro in 2015 and 2016.
The fiscal assumptions reflect the budgetary execution in 2014, information included in draft or approved budget laws for 2015, draft budgetary plans submitted in the context of the European Semester and national medium-term budgetary plans that were available as of 20 November 2014. They include all policy measures that have already been approved by national parliaments or that have been defined in sufficient detail by governments and are likely to pass the legislative process. Overall, the information on the budget execution in 2014 and on fiscal measures planned for 2015 implies a broadly neutral discretionary fiscal policy at the euro area level. Fiscal consolidation measures in some countries are broadly offset by direct tax cuts in several countries and spending increases.
Compared with the September 2014 issue of the Monthly Bulletin, the changes in the technical assumptions include considerably lower US dollar-denominated oil and non-energy commodity prices, a depreciation of the effective exchange rate of the euro, and lower short-term and long-term interest rates in the euro area.
2 Oil and food commodity price assumptions are based on futures prices up to the end of the projection horizon. The prices of other non-energy hard commodities are assumed to follow futures until the fourth quarter of 2015 and thereafter to evolve in line with global economic activity. EU farm gate prices (in euro), which are used for forecasting food consumer prices, are projected on the basis of an econometric model that takes into account developments in international food commodity prices.
Technical assumptions
(percentage per annum; in USD/barrel; annual percentage change)
December 2014 September 2014Revisions since
September 20141)
2013 2014 2015 2016 2014 2015 2016 2014 2015 2016
Three-month EURIBOR 0.2 0.2 0.1 0.1 0.2 0.2 0.3 0.0 -0.1 -0.1Ten-year government bond yields 2.9 2.0 1.8 2.1 2.3 2.2 2.5 -0.2 -0.4 -0.4Oil price 108.8 101.2 85.6 88.5 107.4 105.3 102.7 -5.7 -18.8 -13.8Non-energy commodity prices, in USD -5.0 -6.3 -4.8 3.8 -4.8 0.1 4.4 -1.5 -4.9 -0.6USD/EUR exchange rate 1.33 1.33 1.25 1.25 1.36 1.34 1.34 -1.9 -6.7 -6.7Euro nominal effective exchange rate (EER20) 3.8 0.5 -2.8 0.0 1.4 -0.8 0.0 -0.9 -2.0 0.0
Note: Revisions are calculated from unrounded data.1) Revisions are expressed as percentages for levels, differences for growth rates and percentage points for interest rates and bond yields.

88ECBMonthly BulletinDecember 2014
Real GDP growth is projected to stay muted in the near term. The impact of the adverse factors that hindered growth earlier in the year will still weigh on growth in the next few quarters. This is indicated by business and consumer confidence indicators, which have weakened since the spring, with their levels now indicating continued but only modest activity in the near term. In particular, private investment activity is expected to remain subdued into early 2015.
Nevertheless, several fundamentals remain positive and support the expected pick-up in 2015 and beyond. Domestic demand should benefit from the accommodative monetary policy stance and an improved functioning of the monetary policy transmission process – further strengthened by the standard and non-standard measures recently taken by the ECB – a broadly neutral fiscal stance following years of substantial fiscal tightening, and some improvement in credit supply conditions. In addition, private consumption should benefit from a pick-up in real disposable income stemming in particular from the favourable impact of falling commodity prices, but also from rising, albeit modest, wage and employment growth and, in the context of improving profit growth, rising other personal income (including distributed profits). In addition, overall activity will be increasingly supported over the projection horizon by the favourable impact on exports of an assumed gradual strengthening of external demand, further bolstered by the impact of the depreciation of the euro.
However, the recovery is projected to remain subdued by historical standards as a number of factors continue to dampen growth in the medium term. The remaining need for the adjustment of private and public sector balance sheets is expected to diminish only gradually over the projection horizon. Moreover, the drag on private consumption from high unemployment rates in some countries is expected to abate only gradually, while ample spare capacity in some countries will continue to hold back investment spending. In terms of annual averages, real GDP growth is projected to be 0.8% in 2014, 1.0% in 2015 and 1.5% in 2016.
Looking at the components of demand in more detail, private consumption expenditure maintains its moderate momentum over the horizon, owing to a pick-up in real disposable income. Following several years of pronounced weakness, real disposable income will accelerate thanks to stronger labour income (reflecting rising employment and slightly higher wage growth), a rising contribution from other personal (mainly profit-related) income, and low commodity prices. Increasing household net worth and low financing costs will also support private consumption.
The saving ratio is expected to be flat, remaining at historically low levels. This reflects opposing effects. On the one hand, the very low interest rates and gradually declining unemployment will have a downward impact. On the other hand, there are upward effects as rising disposable income in some countries decreases the need to use savings for consumption. The observed weakening in consumer confidence might strengthen the precautionary savings motive. Furthermore, in some countries, household deleveraging pressures remain elevated, which is having further upward effects on the saving ratio.
The outlook for residential investment remains subdued. Residential investment should gain some momentum in the course of 2015, as activity recovers in an environment of low mortgage rates and improved credit supply conditions, and as housing market adjustment needs gradually fade. However, in some countries, the adjustment in housing markets and/or the still weak growth of real disposable income continue to dampen residential construction. Moreover, in some countries, the favourable impact of historically low mortgages rates appears to be weaker than previously expected.

89ECB
Monthly BulletinDecember 2014
December 2014 Eurosystem staff macroeconomic projections
for the euro area
article
A number of factors should support business investment, namely the projected gradual strengthening in domestic and external demand, the very low level of interest rates, the need to modernise the capital stock after several years of subdued investment, an improvement in credit supply conditions, and some strengthening of profit mark-ups as activity recovers. In addition, headwinds from corporate sector deleveraging needs are expected to gradually ease following a decline in the debt-to-GDP ratio in recent years. Nevertheless, debt levels remain elevated, so deleveraging needs might continue to dampen growth.
Business investment growth is estimated to remain fairly low in the near term. Despite the above-mentioned supportive factors, business confidence has declined lately. The impact of some adverse factors appears to weigh strongly on business investment, notably still unfavourable although improving financing conditions in some countries, concerns about the slow pace of structural reforms in certain countries, and the persistence of geopolitical tensions. In addition, uncertainty about the demand outlook weighs on business investment.
Euro area foreign demand is projected to pick up moderately as global activity recovers. Extra-euro area exports will increase moderately in the second half of 2014, broadly in line with foreign demand. Exports are projected to gain momentum in the course of 2015, reflecting the gradual strengthening of foreign demand and the favourable impact of the recent depreciation of the euro. Export market shares are expected to remain broadly unchanged over the projection horizon. Extra-euro area imports will pick up only moderately over the projection horizon, reflecting the subdued growth of demand in the euro area and the lower exchange rate of the euro. Net exports are projected to contribute positively, albeit modestly, to real GDP growth towards the end of the projection horizon. The current account surplus will increase over the horizon, reaching 2.4% of GDP in 2016.
Employment growth has recently witnessed a comparatively fast and strong pick-up. Employment started to recover already from mid-2013 onwards, initially in terms of hours worked, but then also in terms of persons. In the second quarter of 2014, headcount employment was up 0.4% in year-on-year terms, compared with real GDP growth of 0.8%. This relatively fast recovery appears to reflect the upward impact of past wage moderation and probably the positive impact of recent labour market reforms. These reforms – for example, via increased decentralisation of wage bargaining, reduced employment protection and more flexible working arrangements – appear to have led to a comparatively faster and stronger response of employment to output developments than seen historically, though with some notable cross-country differences.
Euro area labour market conditions are expected to improve modestly over the projection horizon. Headcount employment is estimated to continue its modest recovery in the second half of 2014, and is projected to broadly maintain this momentum over the projection horizon. The recovery in employment reflects the continued pattern of a comparatively fast and strong response to the pick-up in activity. The labour force is expected to increase moderately, owing to immigration and as the gradually improving labour market situation stimulates participation of certain segments of the population. The unemployment rate is expected to decline over the projection horizon, albeit remaining far higher than before the crisis.
Compared with the macroeconomic projections published in the September 2014 issue of the Monthly Bulletin, the real GDP growth projection for 2014-16 has been revised downwards by 1.0 percentage point. The revision is due to a weaker outlook for exports, as the outlook for euro area foreign demand has been revised down significantly, reflecting lower data outturns and
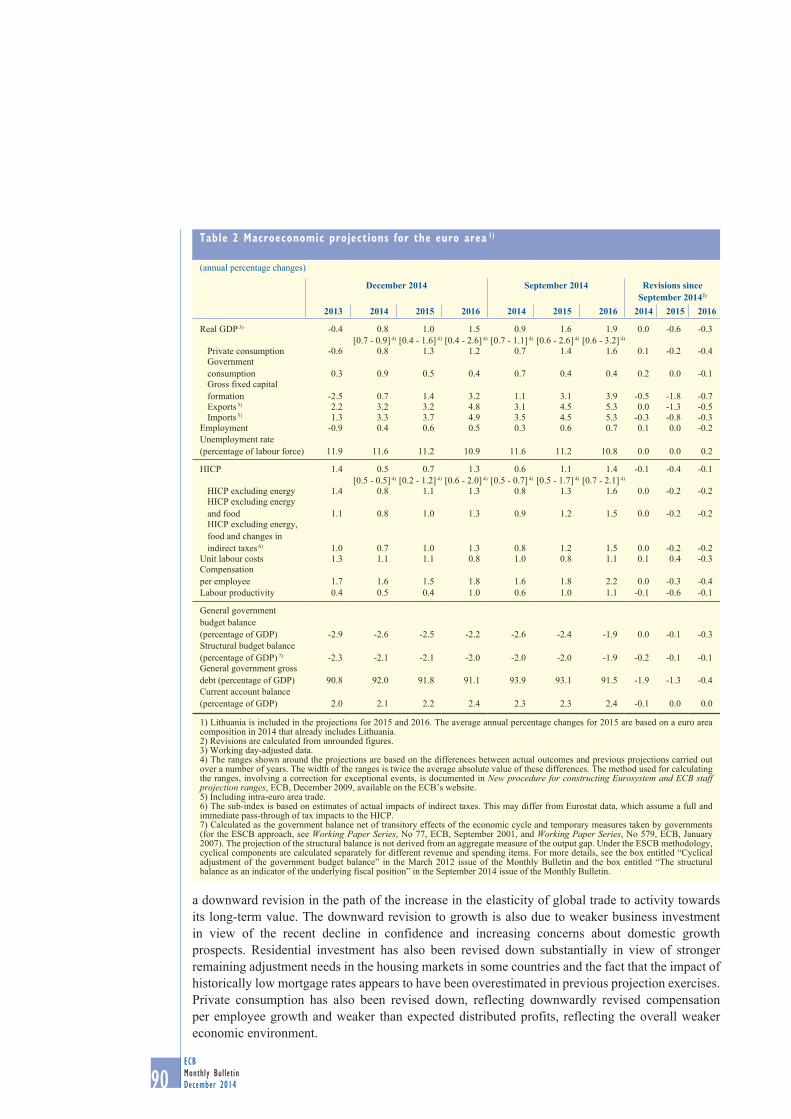
90ECBMonthly BulletinDecember 2014
a downward revision in the path of the increase in the elasticity of global trade to activity towards its long-term value. The downward revision to growth is also due to weaker business investment in view of the recent decline in confidence and increasing concerns about domestic growth prospects. Residential investment has also been revised down substantially in view of stronger remaining adjustment needs in the housing markets in some countries and the fact that the impact of historically low mortgage rates appears to have been overestimated in previous projection exercises. Private consumption has also been revised down, reflecting downwardly revised compensation per employee growth and weaker than expected distributed profits, reflecting the overall weaker economic environment.
table 2 macroeconomic projections for the euro area 1)
(annual percentage changes)
December 2014 September 2014 Revisions since September 20142)
2013 2014 2015 2016 2014 2015 2016 2014 2015 2016
Real GDP 3) -0.4 0.8 1.0 1.5 0.9 1.6 1.9 0.0 -0.6 -0.3[0.7 - 0.9] 4) [0.4 - 1.6] 4) [0.4 - 2.6] 4) [0.7 - 1.1] 4) [0.6 - 2.6] 4) [0.6 - 3.2] 4)
Private consumption -0.6 0.8 1.3 1.2 0.7 1.4 1.6 0.1 -0.2 -0.4Government consumption 0.3 0.9 0.5 0.4 0.7 0.4 0.4 0.2 0.0 -0.1Gross fixed capital formation -2.5 0.7 1.4 3.2 1.1 3.1 3.9 -0.5 -1.8 -0.7Exports 5) 2.2 3.2 3.2 4.8 3.1 4.5 5.3 0.0 -1.3 -0.5Imports 5) 1.3 3.3 3.7 4.9 3.5 4.5 5.3 -0.3 -0.8 -0.3
Employment -0.9 0.4 0.6 0.5 0.3 0.6 0.7 0.1 0.0 -0.2Unemployment rate (percentage of labour force) 11.9 11.6 11.2 10.9 11.6 11.2 10.8 0.0 0.0 0.2
HICP 1.4 0.5 0.7 1.3 0.6 1.1 1.4 -0.1 -0.4 -0.1[0.5 - 0.5] 4) [0.2 - 1.2] 4) [0.6 - 2.0] 4) [0.5 - 0.7] 4) [0.5 - 1.7] 4) [0.7 - 2.1] 4)
HICP excluding energy 1.4 0.8 1.1 1.3 0.8 1.3 1.6 0.0 -0.2 -0.2HICP excluding energy and food 1.1 0.8 1.0 1.3 0.9 1.2 1.5 0.0 -0.2 -0.2HICP excluding energy, food and changes in indirect taxes 6) 1.0 0.7 1.0 1.3 0.8 1.2 1.5 0.0 -0.2 -0.2
Unit labour costs 1.3 1.1 1.1 0.8 1.0 0.8 1.1 0.1 0.4 -0.3Compensationper employee 1.7 1.6 1.5 1.8 1.6 1.8 2.2 0.0 -0.3 -0.4Labour productivity 0.4 0.5 0.4 1.0 0.6 1.0 1.1 -0.1 -0.6 -0.1
General government budget balance (percentage of GDP) -2.9 -2.6 -2.5 -2.2 -2.6 -2.4 -1.9 0.0 -0.1 -0.3Structural budget balance (percentage of GDP) 7) -2.3 -2.1 -2.1 -2.0 -2.0 -2.0 -1.9 -0.2 -0.1 -0.1General government gross debt (percentage of GDP) 90.8 92.0 91.8 91.1 93.9 93.1 91.5 -1.9 -1.3 -0.4Current account balance (percentage of GDP) 2.0 2.1 2.2 2.4 2.3 2.3 2.4 -0.1 0.0 0.0
1) Lithuania is included in the projections for 2015 and 2016. The average annual percentage changes for 2015 are based on a euro area composition in 2014 that already includes Lithuania.2) Revisions are calculated from unrounded figures.3) Working day-adjusted data.4) The ranges shown around the projections are based on the differences between actual outcomes and previous projections carried out over a number of years. The width of the ranges is twice the average absolute value of these differences. The method used for calculating the ranges, involving a correction for exceptional events, is documented in New procedure for constructing Eurosystem and ECB staff projection ranges, ECB, December 2009, available on the ECB’s website.5) Including intra-euro area trade.6) The sub-index is based on estimates of actual impacts of indirect taxes. This may differ from Eurostat data, which assume a full and immediate pass-through of tax impacts to the HICP.7) Calculated as the government balance net of transitory effects of the economic cycle and temporary measures taken by governments (for the ESCB approach, see Working Paper Series, No 77, ECB, September 2001, and Working Paper Series, No 579, ECB, January 2007). The projection of the structural balance is not derived from an aggregate measure of the output gap. Under the ESCB methodology, cyclical components are calculated separately for different revenue and spending items. For more details, see the box entitled “Cyclical adjustment of the government budget balance” in the March 2012 issue of the Monthly Bulletin and the box entitled “The structural balance as an indicator of the underlying fiscal position” in the September 2014 issue of the Monthly Bulletin.
91ECB
Monthly BulletinDecember 2014
December 2014 Eurosystem staff macroeconomic projections
for the euro area
article
The recent non-standard monetary policy measures are included in the baseline only through their impact on already observed data and via their impact on the market-based technical financial assumptions, namely via market interest rates and equity prices, and also via the exchange rate. Thus, the baseline may underestimate the favourable impact of the recent non-standard monetary policy measures as additional channels are not included (see Box 2).
price anD cost proJectionsAccording to Eurostat’s flash estimate, overall HICP inflation stood at 0.3% in November 2014. The low current rate of inflation reflects subdued energy prices related to the recent falls in crude oil prices, low food price inflation as well as modest trends in non-energy industrial goods and services prices.
HICP inflation is projected to remain low in the near term. Thereafter, it is expected to increase only gradually until the end of the projection horizon, reaching a rate of 1.4% in the fourth quarter of 2016. The increase in HICP inflation over the projection horizon is expected to be brought about by the gradual narrowing of the negative output gap and by rising external price pressures. The latter reflect in particular a swing from downward to upward pressures stemming from commodity prices and from the pass-through of the past weakening of the exchange rate of the euro.
box 2
the inclusion of the recent non-stanDarD monetary policy measures in the proJections
The credit-easing monetary policy packages announced on 5 June and 4 September 2014 comprised a range of non-standard monetary policy measures, implemented through credit operations, namely targeted longer-term refinancing operations, and outright operations, namely an asset-backed securities purchase programme and a covered bond purchase programme.
The impact of these measures on the outlook for growth and inflation is reflected in the baseline only to the extent that they have already affected financial variables, notably interest rates, equity prices and the exchange rate of the euro. As a result of this technical approach, certain additional potential channels are not captured in the baseline. These include, for example, the direct pass-through channel, associated with the funding cost relief for euro area banks stemming from these measures. A second channel not included in the baseline is the portfolio rebalancing channel, reflecting the fact that the large injections of liquidity associated with each of the three policy measures could strengthen the incentive for investors to reduce their excess holdings of cash by buying and thus bidding up the price – and hence lowering the yield – of alternative financial instruments, other than those purchased by the central bank.
Overall, the baseline is thus likely to underestimate the impact of the monetary policy packages, which represents an upside risk to the baseline projections for growth and inflation.

92ECBMonthly BulletinDecember 2014
The remaining slack in the euro area, together with the assumed moderate developments in commodity prices, will prevent a more substantial pick-up in euro area inflation. The negative output gap is projected to shrink only partially until 2016, implying modest wage and profit margin increases. Overall, HICP inflation is expected to remain very subdued, averaging 0.5% in 2014, 0.7% in 2015 and 1.3% in 2016. HICP inflation excluding energy and food is expected to average 0.8% in 2014, 1.0% in 2015 and 1.3% in 2016.
External price pressures dampen the inflation outlook at present but are expected to rise over the projection horizon, reflecting the projected strengthening in global demand, the lower exchange rate of the euro and, in 2016, an expected increase in commodity prices. External price developments have added to the downward price pressures in the euro area over the recent past. Sluggish global growth, declines in oil and non-oil commodity prices and the past appreciation of the euro have led to declines in euro area import prices in 2013 and 2014. Looking ahead, as these effects gradually fade, the extra-euro area import deflator is expected to rise in 2016.
Improvements in the labour market and declining economic slack are expected to trigger moderate increases in domestic price pressures over the projection horizon. Compensation per employee growth is projected to rise slightly over the horizon but to remain low, given ongoing adjustment processes and wage moderation in several euro area countries. The low inflation environment also contributes to the modest wage outlook. Unit labour cost growth is projected to decline gently over the projection horizon. This reflects the fact that the small pick-up in compensation per employee growth is more than offset by stronger productivity growth. The modest unit labour cost developments are one of the main sources of the expected low domestic cost pressures until the end of the projection horizon.
chart 1 macroeconomic projections1)
(quarterly data)
Euro area HICP(year-on-year percentage changes)
Euro area real GDP 2)
(quarter-on-quarter percentage changes)
-0.5
0.0
0.5
1.0
1.5
2.0
2.5
3.0
3.5
4.0
4.5
-0.5
-0.1 -0.1
0.0
0.5
1.0
1.5
2.0
2.5
3.0
3.5
4.0
4.5
2007 2008 2009 2010 2011 2012 2013 2014 2015 2016-3.5
-3.0
-2.5
-2.0
-1.5
-1.0
-0.5
0.0
0.5
1.0
1.5
-3.5
-3.0
-2.5
-2.0
-1.5
-1.0
-0.5
0.0
0.5
1.0
1.5
2007 2008 2009 2010 2011 2012 2013 2014 2015 2016
1) The ranges shown around the central projections are based on the differences between actual outcomes and previous projections carried out over a number of years. The width of the ranges is twice the average absolute value of these differences. The method used for calculating the ranges, involving a correction for exceptional events, is documented in New procedure for constructing Eurosystem and ECB staff projection ranges, ECB, December 2009, available on the ECB’s website.2) Working day-adjusted data.
93ECB
Monthly BulletinDecember 2014
December 2014 Eurosystem staff macroeconomic projections
for the euro area
article
Profit margins (as measured by the difference between the GDP deflator at factor cost and unit labour cost growth) are expected to decline in 2014, stabilise in 2015 and rebound in 2016 as a result of the strengthening of economic activity and, in particular, a moderation of unit labour cost developments.
Compared with the macroeconomic projections published in the September 2014 issue of the Monthly Bulletin, the projection for headline inflation has been revised down by 0.1 percentage point for 2014, by 0.4 percentage point for 2015 and by 0.1 percentage point for 2016. This reflects mainly lower oil prices in euro, some downward surprises regarding recent outcomes for the non-energy components, and the impact of the downwardly revised growth outlook. For 2016, the latter is partly compensated for by a stronger upward impact from HICP energy inflation, driven by a weaker exchange rate and an upward change in oil price futures as compared with the September projection. HICP inflation excluding food and energy has also been revised down, reflecting the weaker wage and profit margin dynamics as well as the indirect pass-through of the recent exchange rate depreciation.
fiscal outlooKThe orientation of fiscal policy will be broadly neutral over the projection horizon. The fiscal stance, measured as a change in the cyclically adjusted primary balance, is expected to be slightly expansionary in 2014-15 and neutral in 2016, in contrast with the significant tightening observed in previous years.
The government deficit ratio is projected to gradually decrease over the projection horizon. This decline will be supported by the improvement of the cyclical position of the euro area economy. The structural budget balance is projected to improve only slightly over the projection horizon, reflecting broadly neutral fiscal policy. The government debt ratio will start declining from 2015 onwards, owing to the recent improvements in the primary balance and a more favourable interest/growth differential.
Compared with the fiscal projection published in the September 2014 issue of the Monthly Bulletin, the deficit outlook and debt dynamics have somewhat deteriorated as a result of a less favourable macroeconomic outlook and a slight relaxation in discretionary fiscal policies. The downward revision of the debt-to-GDP ratio is mainly a result of the implementation of the new statistical standard ESA 2010.
box 3
sensitivity analyses
Projections rely heavily on technical assumptions regarding the evolution of certain key variables. Given that some of these variables can have a large impact on the projections for the euro area, the sensitivity of the latter with respect to alternative paths of these underlying assumptions can help in the analysis of risks around the projections. This box discusses the uncertainty around three key underlying assumptions and the sensitivity of the projections with respect to these assumptions.1
1 All simulations have been conducted under the assumption of no policy change and no change to any other variable concerning the technical assumptions and the international environment of the euro area.
94ECBMonthly BulletinDecember 2014
1) An alternative oil price path
The assumptions for oil prices in the current Eurosystem staff projections are taken from market expectations as measured by oil futures prices. At the cut-off date of 13 November, taking the oil price path implied by futures markets in the preceding two-week period, it had been predicted that a barrel of Brent crude oil would fall from USD 102.6 in the third quarter of 2014 to USD 85.6 in 2015, before rising to USD 88.5 in 2016. After the cut-off date, however, oil prices and oil price futures fell further in an environment of ample oil supply and weak oil demand, in particular after OPEC decided on 27 November 2014 to maintain current production levels. On 2 December 2014, oil price futures implied that the price of Brent crude oil would fall to USD 73.2 in 2015 and rise to USD 78.1 in 2016, i.e. to levels 14.5% and 11.7% lower than those entailed in the baseline projection.
On the basis of Eurosystem staff macroeconomic models, it has been estimated that the alternative oil price path would cause euro area HICP inflation to be about 0.4 percentage point below the baseline projection for 2015 and 0.1 percentage point below the baseline projection for 2016. At the same time, the alternative oil price path would support real GDP growth by about 0.1 percentage point in both 2015 and 2016.
2) An alternative exchange rate path
The baseline assumes an unchanged effective exchange rate of the euro until the end of the horizon. However, a weakening of the euro could result from deteriorating growth prospects in the euro area as compared with the US economy, and from expectations of diverging monetary policy stances in the two economies, implying market expectations of a prolonged period of low interest rates in the euro area and a faster normalisation in the United States. An alternative path of the euro, implying a stronger depreciation, has been derived from the 25th percentile of the distribution provided by the option-implied risk-neutral densities for the EUR/USD exchange rate on 13 November 2014. This path implies a gradual depreciation of the euro vis-à-vis the US dollar to an exchange rate of 1.17 in 2016, which is 6.1% below the baseline assumption. The corresponding assumptions for the nominal effective exchange rate of the euro reflect historical regularities, whereby changes in the EUR/USD exchange rate reflect changes in the effective exchange rate with an elasticity of around 52%. This results in a gradual divergence of the effective exchange rate of the euro from the baseline, reaching a level 3.2% below the baseline in 2016. In this scenario, the results from various Eurosystem staff macroeconomic models point to higher real GDP growth, by 0.1-0.3 percentage point, and higher HICP inflation, by 0.1-0.4 percentage point, in 2015 and 2016.
3) Additional fiscal consolidation
As stated in Box 1, the fiscal policy assumptions include all policy measures that have already been approved by national parliaments or that have been specified in sufficient detail by governments and are likely to pass the legislative process. For most countries, the measures included in the baseline projection fall short of the fiscal consolidation requirements under the corrective and preventive arms of the Stability and Growth Pact. The commitment to comply with these requirements is broadly reflected in the 2014 stability programmes and in EU-IMF programme documents. However, the underlying measures to achieve these targets are often either missing or not sufficiently well specified. Accordingly, they are not taken into account
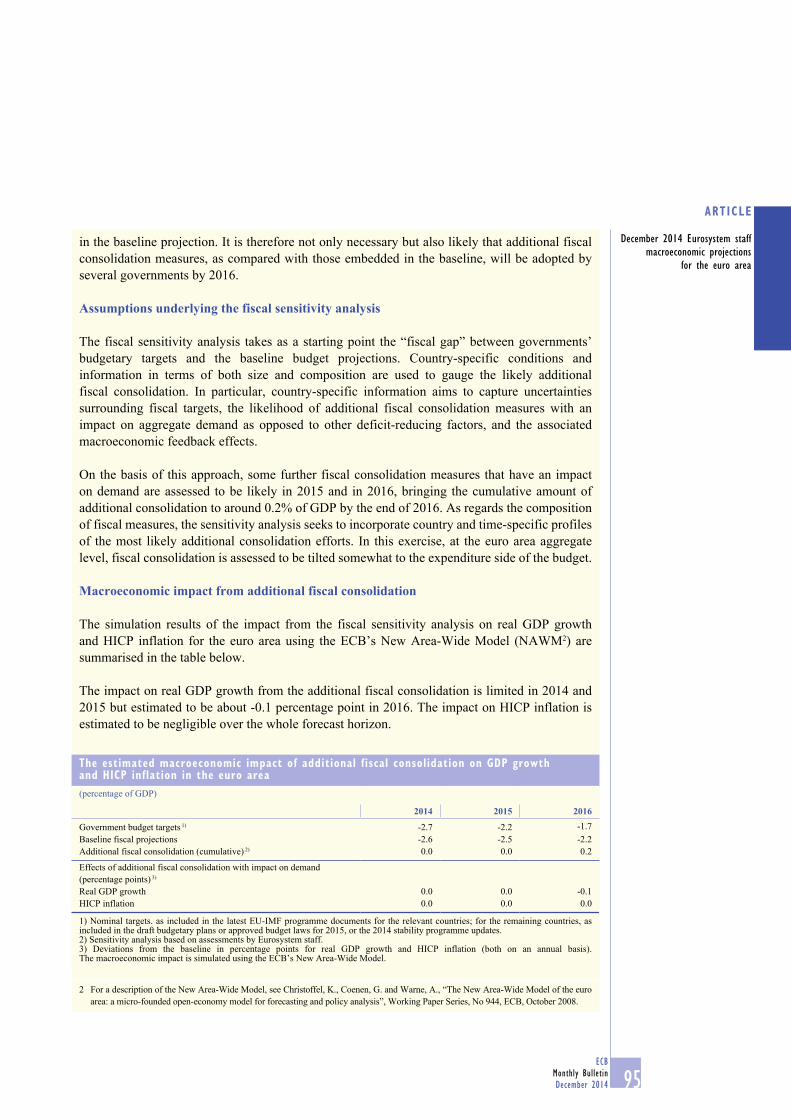
95ECB
Monthly BulletinDecember 2014
December 2014 Eurosystem staff macroeconomic projections
for the euro area
ARTICLE
in the baseline projection. It is therefore not only necessary but also likely that additional fiscal consolidation measures, as compared with those embedded in the baseline, will be adopted by several governments by 2016.
Assumptions underlying the fiscal sensitivity analysis
The fiscal sensitivity analysis takes as a starting point the “fiscal gap” between governments’ budgetary targets and the baseline budget projections. Country-specific conditions and information in terms of both size and composition are used to gauge the likely additional fiscal consolidation. In particular, country-specific information aims to capture uncertainties surrounding fiscal targets, the likelihood of additional fiscal consolidation measures with an impact on aggregate demand as opposed to other deficit-reducing factors, and the associated macroeconomic feedback effects.
On the basis of this approach, some further fiscal consolidation measures that have an impact on demand are assessed to be likely in 2015 and in 2016, bringing the cumulative amount of additional consolidation to around 0.2% of GDP by the end of 2016. As regards the composition of fiscal measures, the sensitivity analysis seeks to incorporate country and time-specific profiles of the most likely additional consolidation efforts. In this exercise, at the euro area aggregate level, fiscal consolidation is assessed to be tilted somewhat to the expenditure side of the budget.
Macroeconomic impact from additional fiscal consolidation
The simulation results of the impact from the fiscal sensitivity analysis on real GDP growth and HICP inflation for the euro area using the ECB’s New Area-Wide Model (NAWM2) are summarised in the table below.
The impact on real GDP growth from the additional fiscal consolidation is limited in 2014 and 2015 but estimated to be about -0.1 percentage point in 2016. The impact on HICP inflation is estimated to be negligible over the whole forecast horizon.
2 For a description of the New Area-Wide Model, see Christoffel, K., Coenen, G. and Warne, A., “The New Area-Wide Model of the euro area: a micro-founded open-economy model for forecasting and policy analysis”, Working Paper Series, No 944, ECB, October 2008.
The estimated macroeconomic impact of additional fiscal consolidation on GDP growth and HICP inflation in the euro area(percentage of GDP)
2014 2015 2016
Government budget targets 1) -2.7 -2.2 -1.7Baseline fiscal projections -2.6 -2.5 -2.2Additional fiscal consolidation (cumulative) 2) 0.0 0.0 0.2
Effects of additional fiscal consolidation with impact on demand (percentage points) 3)
Real GDP growth 0.0 0.0 -0.1HICP inflation 0.0 0.0 0.0
1) Nominal targets. as included in the latest EU-IMF programme documents for the relevant countries; for the remaining countries, as included in the draft budgetary plans or approved budget laws for 2015, or the 2014 stability programme updates.2) Sensitivity analysis based on assessments by Eurosystem staff.3) Deviations from the baseline in percentage points for real GDP growth and HICP inflation (both on an annual basis). The macroeconomic impact is simulated using the ECB’s New Area-Wide Model.
96ECBMonthly BulletinDecember 2014
The current analysis therefore points to modest downside risks to the baseline projection for real GDP growth in 2016, given that not all of the intended fiscal consolidation measures have been included in the baseline. At the same time, there are negligible risks to the inflation projection.
It should be stressed that this fiscal sensitivity analysis focuses only on the potential short-term effects of likely additional fiscal consolidation. While even well-designed fiscal consolidation measures often have negative short-term effects on real GDP growth, there are positive longer-term effects on activity that are not evident over the horizon of this analysis.3 Therefore, the results of this analysis should not be interpreted as calling into question the need for additional fiscal consolidation efforts over the projection horizon. Indeed, further consolidation efforts are necessary to restore sound public finances in the euro area. Without such consolidation, there is a risk that the pricing of sovereign debt could be adversely affected. Furthermore, effects on confidence may be negative, hindering the economic recovery.
3 For a more detailed analysis of the macroeconomic effects of fiscal consolidation, see the article entitled “Fiscal multipliers and the timing of consolidation”, Monthly Bulletin, ECB, April 2014.
box 4
forecasts by other institutions
A number of forecasts for the euro area are available from both international organisations and private sector institutions. However, these forecasts are not strictly comparable with one another or with the Eurosystem staff macroeconomic projections, as they were finalised at different points in time. Additionally, they use different (partly unspecified) methods to derive assumptions for fiscal, financial and external variables, including oil and other commodity prices. Finally, there are differences in working day adjustment methods across different forecasts (see the table below).
In the forecasts currently available from other institutions, euro area real GDP growth in 2014 is projected to be the same as that entailed in the Eurosystem staff projections. Projections for real GDP growth in 2015 and 2016 are similar to or slightly higher than the Eurosystem staff
comparison of forecasts for euro area real GDp growth and hicp inflation
(annual percentage changes)
Date of release GDP growth HICP inflation2014 2015 2016 2014 2015 2016
Eurosystem staff projections December 2014 0.8 1.0 1.5 0.5 0.7 1.3[0.7-0.9] [0.4-1.6] [0.4-2.6] [0.5-0.5] [0.2-1.2] [0.6-2.0]
European Commission November 2014 0.8 1.1 1.7 0.5 0.8 1.5OECD November 2014 0.8 1.1 1.7 0.5 0.6 1.0Euro Zone Barometer November 2014 0.8 1.2 1.6 0.5 0.9 1.3Consensus Economics Forecasts November 2014 0.8 1.1 1.5 0.5 0.9 1.3Survey of Professional Forecasters November 2014 0.8 1.2 1.5 0.5 1.0 1.4IMF October 2014 0.8 1.3 1.7 0.5 0.9 1.2
Sources: European Commission’s European Economic Forecast, Autumn 2014; IMF World Economic Outlook, October 2014; OECD Economic Outlook, November 2014; Consensus Economics Forecasts; MJEconomics; and the ECB’s Survey of Professional Forecasters.Notes: The ECB staff macroeconomic projections and the OECD forecasts both report working day-adjusted annual growth rates, whereas the European Commission and the IMF report annual growth rates that are not adjusted for the number of working days per annum. Other forecasts do not specify whether they report working day-adjusted or non-working day-adjusted data.
97ECB
Monthly BulletinDecember 2014
December 2014 Eurosystem staff macroeconomic projections
for the euro area
article
projections. Average annual HICP inflation in 2014 is projected to be the same as that entailed in the Eurosystem staff projections. The projections of most other institutions for HICP inflation in 2015 are slightly higher than the Eurosystem staff projections. HICP inflation in 2016 is expected to average between 1.0% and 1.5% according to the other available projections, compared with 1.3% in the Eurosystem staff projection. At present, all available forecasts for 2015 and 2016 are within the ranges of the Eurosystem projections, which are indicated in the table.


S 1ECB
Monthly BulletinDecember 2014
euro area statistics

ECBMonthly BulletinDecember 2014 S 3
contents1
euro area overviewSummary of economic indicators for the euro area s5
1 monetary policy statistics1.1 ConsolidatedfinancialstatementoftheEurosystem s61.2 Key ECB interest rates s71.3 Eurosystem monetary policy operations allotted through tender procedures s81.4 Minimum reserve and liquidity statistics s9
2 money, banKinG anD other financial corporations2.1 Aggregated balance sheet of euro area MFIs s102.2 Consolidated balance sheet of euro area MFIs s112.3 Monetary statistics s122.4 MFI loans: breakdown s152.5 Deposits held with MFIs: breakdown s172.6 MFI holdings of securities: breakdown s202.7 Currency breakdown of selected MFI balance sheet items s212.8 Aggregated balance sheet of euro area investment funds s222.9 Securities held by investment funds broken down by issuer of securities s232.10 Aggregatedbalancesheetofeuroareafinancialvehiclecorporations s242.11 Aggregated balance sheet of euro area insurance corporations and pension funds s25
3 euro area accounts3.1 Integratedeconomicandfinancialaccountsbyinstitutionalsector s263.2 Households s303.3 Non-financialcorporations s313.4 Financial corporations s323.5 Householdsandnon-financialcorporations,summaryindicators s33
4 financial marKets4.1 Securities other than shares by original maturity, residency of the issuer and currency s344.2 Securities other than shares issued by euro area residents, by sector of the issuer and instrument type s354.3 Growth rates of securities other than shares issued by euro area residents s374.4 Quoted shares issued by euro area residents s394.5 MFI interest rates on euro-denominated deposits from and loans to euro area residents s414.6 Money market interest rates s434.7 Euro area yield curves s444.8 Stock market indices s45
5 prices, output, DemanD anD labour marKets5.1 HICP, other prices and costs s465.2 Output and demand s495.3 Labour markets s53
6 Government finance6.1 Revenue,expenditureanddeficit/surplus s556.2 Debt s566.3 Deficit-debtadjustment,mainfinancialassetsandgovernmentdebtatmarketvalue s576.4 Government debt securities s586.5 Fiscal developments in euro area countries s59
1 For further information, please contact us at: [email protected]. See the ECB’s Statistical Data Warehouse in the “Statistics” section of the ECB’s website (http://sdw.ecb.europa.eu) for longer runs and more detailed data.
ECBMonthly BulletinDecember 2014S 4
Conventions used in the tables
“-” data do not exist/data are not applicable“.” data are not yet available“…” nil or negligible“billion” 109
(p) provisionals.a. seasonally adjustedn.s.a. non-seasonally adjusted
7 eXternal transactions anD positions7.1 Summary balance of payments s607.2 Current and capital accounts s617.3 Financial account s637.4 Monetary presentation of the balance of payments s697.5 Trade in goods s70
8 eXchanGe rates8.1 Effective exchange rates s728.2 Bilateral exchange rates s73
9 Developments outsiDe the euro area9.1 EconomicandfinancialdevelopmentsotherEUMemberStates s749.2 EconomicandfinancialdevelopmentsintheUnitedStatesandJapan s75
list of charts s76
technical notes s77
General notes s85
Since the beginning of September 2014 European statistics have been undergoing a changeover to updated statistical standards, i.e. the European System of Accounts (ESA) 2010 and the sixth edition of the IMF’s Balance of Payments and International Investment Position Manual (BPM6). This will have an impact on many of the most crucial macroeconomic indicators,suchasGDP,thecurrentaccount,governmentdeficitsandsector-specificdebtindicators.Thechangeoverwillaffect Chapter 3, as well as Chapters 5 to 9 of this statistical annex. For more detailed information on the new standards and their implementation in the different statistical domains please refer to the article entitled “New international standards in statistics – enhancements to methodology and data availability” in the August 2014 issue of the Monthly Bulletin. Further explanations and related documents can be found on the ECB’s website at http://www.ecb.europa.eu/stats/acc/ESA2010/html/index.en.html for the ESA 2010 and http://www.ecb.europa.eu/stats/external/bpm6/html/index.en.html for the BPM6. For the ESA 2010, see also the information provided on Eurostat’s website http://epp.eurostat.ec.europa.eu/portal/page/portal/esa_2010/introduction.

EURO AREA OVERVIEW
Summary of economic indicators for the euro area (annual percentage changes, unless otherwise indicated)
S 5ECB
Monthly BulletinDecember 2014
1. Monetary developments and interest rates 1)
M1 2) M2 2) M3 2), 3) M3 2), 3) MFI loans to Securities other 3-month 10-year3-month euro area than shares issued interest rate spot rate
moving average residents in euro by non-MFI (EURIBOR; (% per annum;(centred) excluding MFIs corporations 2) % per annum; end of
and general period period) 4)
government 2) averages)
1 2 3 4 5 6 7 82012 4.0 3.1 2.9 - -0.2 0.7 0.57 1.722013 7.0 4.0 2.4 - -1.5 0.9 0.22 2.24
2013 Q4 6.4 3.1 1.5 - -2.2 1.3 0.24 2.242014 Q1 6.0 2.4 1.2 - -2.3 -1.3 0.30 1.82 Q2 5.3 2.1 1.1 - -1.9 -1.8 0.30 1.44 Q3 5.8 2.6 2.0 - -1.5 -0.8 0.16 1.06
2014 June 5.4 2.4 1.6 1.5 -1.8 -1.3 0.24 1.44 July 5.6 2.5 1.8 1.8 -1.6 -0.3 0.21 1.34 Aug. 5.9 2.7 2.0 2.1 -1.5 -0.8 0.19 1.03 Sep. 6.2 3.0 2.5 2.3 -1.2 -1.3 0.10 1.06 Oct. 6.2 2.7 2.5 . -1.1 . 0.08 0.96 Nov. . . . . . . 0.08 0.80
2. Prices, output, demand and labour markets
HICP 1) Industrial Hourly Real GDP Industrial Capacity Employment Unemploymentproducer labour (s.a.) production utilisation in (s.a.) (% of labour
prices costs excluding manufacturing force; s.a.)construction (%)
1 2 3 4 5 6 7 82012 2.5 2.8 2.0 -0.7 -2.5 78.6 -0.5 11.32013 1.4 -0.2 1.4 -0.5 -0.7 78.3 -0.8 12.0
2014 Q1 0.7 -1.6 0.6 1.0 1.3 79.8 0.0 11.8 Q2 0.6 -1.1 1.2 0.8 1.0 79.7 0.4 11.6 Q3 0.4 -1.4 . 0.8 0.6 80.0 . 11.5
2014 June 0.5 -0.9 - - 0.3 - - 11.6 July 0.4 -1.3 - - 1.6 79.9 - 11.6 Aug. 0.4 -1.4 - - -0.5 - - 11.5 Sep. 0.3 -1.4 - - 0.6 - - 11.5 Oct. 0.4 -1.3 - - . 80.0 - 11.5 Nov. 0.3 . - - . - - .
3. External statistics(EUR billions, unless otherwise indicated)
Balance of payments (net transactions) Reserve assets Net Gross Effective exchange rate of USD/EUR
(end-of-period international external debt the euro: EER-20 5) exchange rateCurrent and Combined positions) investment (as a % of GDP) (index: 1999 Q1 = 100)
capital Goods direct and positionaccounts portfolio (as a % of GDP) Nominal Real (CPI)
investment1 2 3 4 5 6 7 8 9
2012 . 132.3 . 689.4 . . 97.9 95.6 1.28482013 218.4 206.4 39.2 542.1 -13.5 114.2 101.7 98.9 1.3281
2013 Q4 89.4 57.2 -9.5 542.1 -13.5 114.2 103.1 100.0 1.36102014 Q1 40.8 43.4 -18.5 570.6 -12.5 116.0 103.9 100.7 1.3696 Q2 48.7 60.4 -34.9 583.1 -10.7 116.8 103.8 100.1 1.3711 Q3 83.7 53.9 52.4 597.0 . . 101.6 97.9 1.3256
2014 June 22.8 21.1 -2.9 583.1 - - 103.0 99.3 1.3592 July 33.5 23.6 -12.0 585.1 - - 102.6 98.8 1.3539 Aug. 18.6 9.8 7.1 594.1 - - 101.9 98.2 1.3316 Sep. 31.7 20.5 57.3 597.0 - - 100.4 96.7 1.2901 Oct. . . . 585.9 - - 99.6 95.7 1.2673 Nov. . . . . - - 99.5 95.6 1.2472
Sources: ECB, European Commission (Eurostat and Economic and Financial Affairs DG) and Thomson Reuters.Note: For more information on the data, see the relevant tables later in this section.1) Data refer to the changing composition of the euro area. For further information, see the General Notes.2) Annual percentage changes for monthly data refer to the end of the month, whereas those for quarterly and yearly data refer to the annual change in the period average.
See the Technical Notes for details.3) M3 and its components exclude holdings by non-euro area residents of money market fund shares/units and debt securities with a maturity of up to two years.4) Based on AAA-rated euro area central government bond yield curves. For further information, see Section 4.7.5) For a definition of the trading partner groups and other information, please refer to the General Notes.
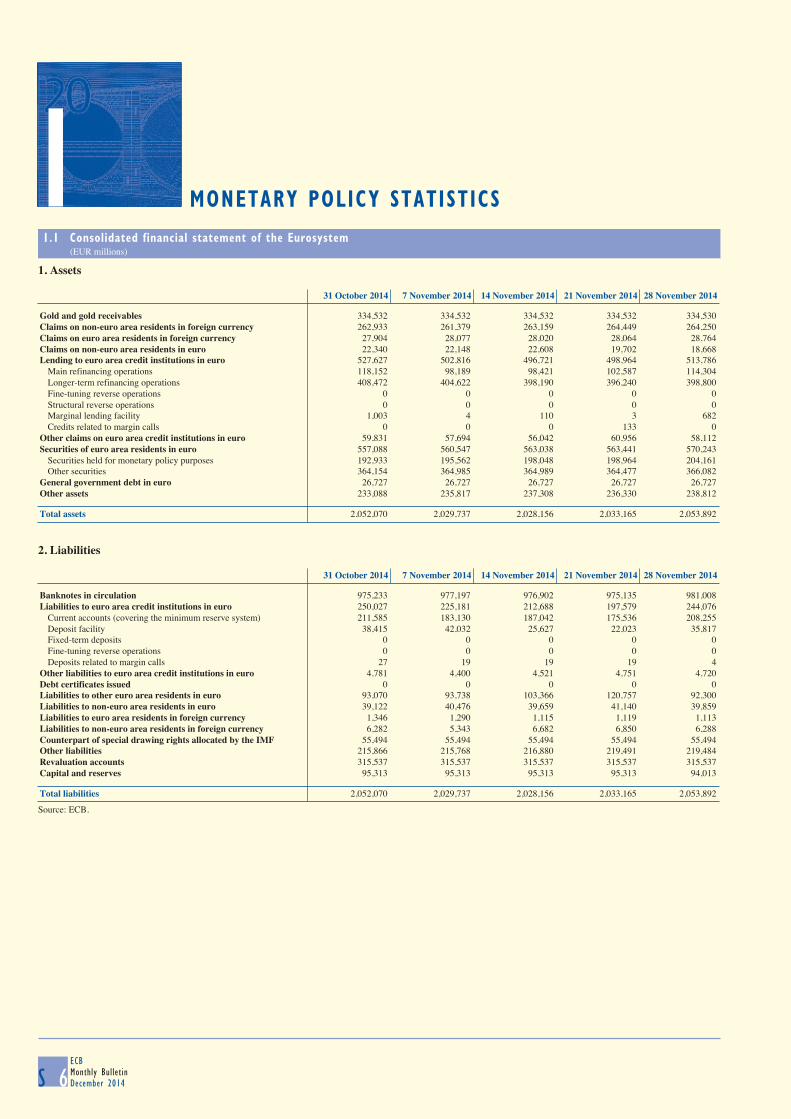
1 MONETARY POLICY STATISTICS
1.1 Consolidated financial statement of the Eurosystem (EUR millions)
S 6ECBMonthly BulletinDecember 2014
1. Assets
31 October 2014 7 November 2014 14 November 2014 21 November 2014 28 November 2014
Gold and gold receivables 334,532 334,532 334,532 334,532 334,530 Claims on non-euro area residents in foreign currency 262,933 261,379 263,159 264,449 264,250 Claims on euro area residents in foreign currency 27,904 28,077 28,020 28,064 28,764 Claims on non-euro area residents in euro 22,340 22,148 22,608 19,702 18,668 Lending to euro area credit institutions in euro 527,627 502,816 496,721 498,964 513,786 Main refinancing operations 118,152 98,189 98,421 102,587 114,304 Longer-term refinancing operations 408,472 404,622 398,190 396,240 398,800 Fine-tuning reverse operations 0 0 0 0 0 Structural reverse operations 0 0 0 0 0 Marginal lending facility 1,003 4 110 3 682 Credits related to margin calls 0 0 0 133 0 Other claims on euro area credit institutions in euro 59,831 57,694 56,042 60,956 58,112 Securities of euro area residents in euro 557,088 560,547 563,038 563,441 570,243 Securities held for monetary policy purposes 192,933 195,562 198,048 198,964 204,161 Other securities 364,154 364,985 364,989 364,477 366,082 General government debt in euro 26,727 26,727 26,727 26,727 26,727 Other assets 233,088 235,817 237,308 236,330 238,812
Total assets 2,052,070 2,029,737 2,028,156 2,033,165 2,053,892
2. Liabilities
31 October 2014 7 November 2014 14 November 2014 21 November 2014 28 November 2014
Banknotes in circulation 975,233 977,197 976,902 975,135 981,008 Liabilities to euro area credit institutions in euro 250,027 225,181 212,688 197,579 244,076 Current accounts (covering the minimum reserve system) 211,585 183,130 187,042 175,536 208,255 Deposit facility 38,415 42,032 25,627 22,023 35,817 Fixed-term deposits 0 0 0 0 0 Fine-tuning reverse operations 0 0 0 0 0 Deposits related to margin calls 27 19 19 19 4 Other liabilities to euro area credit institutions in euro 4,781 4,400 4,521 4,751 4,720 Debt certificates issued 0 0 0 0 0 Liabilities to other euro area residents in euro 93,070 93,738 103,366 120,757 92,300 Liabilities to non-euro area residents in euro 39,122 40,476 39,659 41,140 39,859 Liabilities to euro area residents in foreign currency 1,346 1,290 1,115 1,119 1,113 Liabilities to non-euro area residents in foreign currency 6,282 5,343 6,682 6,850 6,288 Counterpart of special drawing rights allocated by the IMF 55,494 55,494 55,494 55,494 55,494 Other liabilities 215,866 215,768 216,880 219,491 219,484 Revaluation accounts 315,537 315,537 315,537 315,537 315,537 Capital and reserves 95,313 95,313 95,313 95,313 94,013
Total liabilities 2,052,070 2,029,737 2,028,156 2,033,165 2,053,892
Source: ECB.
1
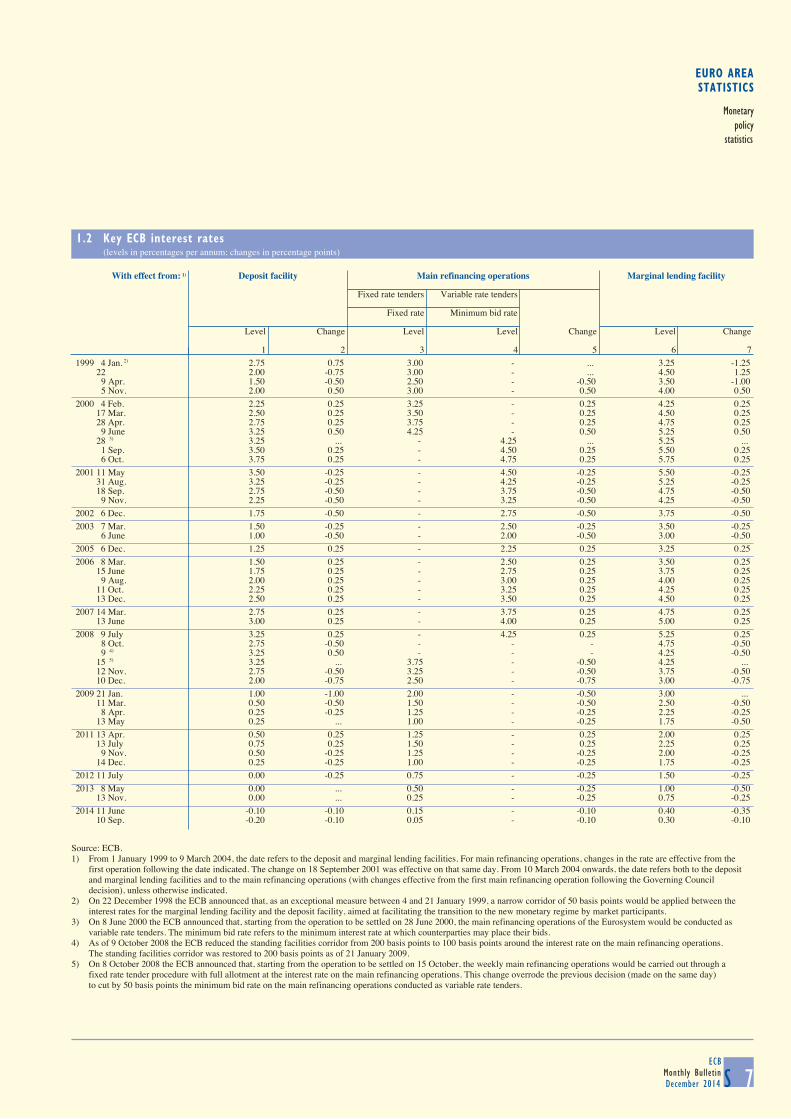
1 MONETARY POLICY STATISTICS
1.1 Consolidated financial statement of the Eurosystem (EUR millions)
S 6ECBMonthly BulletinDecember 2014
1. Assets
31 October 2014 7 November 2014 14 November 2014 21 November 2014 28 November 2014
Gold and gold receivables 334,532 334,532 334,532 334,532 334,530 Claims on non-euro area residents in foreign currency 262,933 261,379 263,159 264,449 264,250 Claims on euro area residents in foreign currency 27,904 28,077 28,020 28,064 28,764 Claims on non-euro area residents in euro 22,340 22,148 22,608 19,702 18,668 Lending to euro area credit institutions in euro 527,627 502,816 496,721 498,964 513,786 Main refinancing operations 118,152 98,189 98,421 102,587 114,304 Longer-term refinancing operations 408,472 404,622 398,190 396,240 398,800 Fine-tuning reverse operations 0 0 0 0 0 Structural reverse operations 0 0 0 0 0 Marginal lending facility 1,003 4 110 3 682 Credits related to margin calls 0 0 0 133 0 Other claims on euro area credit institutions in euro 59,831 57,694 56,042 60,956 58,112 Securities of euro area residents in euro 557,088 560,547 563,038 563,441 570,243 Securities held for monetary policy purposes 192,933 195,562 198,048 198,964 204,161 Other securities 364,154 364,985 364,989 364,477 366,082 General government debt in euro 26,727 26,727 26,727 26,727 26,727 Other assets 233,088 235,817 237,308 236,330 238,812
Total assets 2,052,070 2,029,737 2,028,156 2,033,165 2,053,892
2. Liabilities
31 October 2014 7 November 2014 14 November 2014 21 November 2014 28 November 2014
Banknotes in circulation 975,233 977,197 976,902 975,135 981,008 Liabilities to euro area credit institutions in euro 250,027 225,181 212,688 197,579 244,076 Current accounts (covering the minimum reserve system) 211,585 183,130 187,042 175,536 208,255 Deposit facility 38,415 42,032 25,627 22,023 35,817 Fixed-term deposits 0 0 0 0 0 Fine-tuning reverse operations 0 0 0 0 0 Deposits related to margin calls 27 19 19 19 4 Other liabilities to euro area credit institutions in euro 4,781 4,400 4,521 4,751 4,720 Debt certificates issued 0 0 0 0 0 Liabilities to other euro area residents in euro 93,070 93,738 103,366 120,757 92,300 Liabilities to non-euro area residents in euro 39,122 40,476 39,659 41,140 39,859 Liabilities to euro area residents in foreign currency 1,346 1,290 1,115 1,119 1,113 Liabilities to non-euro area residents in foreign currency 6,282 5,343 6,682 6,850 6,288 Counterpart of special drawing rights allocated by the IMF 55,494 55,494 55,494 55,494 55,494 Other liabilities 215,866 215,768 216,880 219,491 219,484 Revaluation accounts 315,537 315,537 315,537 315,537 315,537 Capital and reserves 95,313 95,313 95,313 95,313 94,013
Total liabilities 2,052,070 2,029,737 2,028,156 2,033,165 2,053,892
Source: ECB.
EURO AREASTATISTICS
Monetarypolicy
statistics
1.2 Key ECB interest rates (levels in percentages per annum; changes in percentage points)
S 7ECB
Monthly BulletinDecember 2014
With effect from: 1) Deposit facility Main refinancing operations Marginal lending facility
Fixed rate tenders Variable rate tenders Fixed rate Minimum bid rate
Level Change Level Level Change Level Change
1 2 3 4 5 6 71999 4 Jan. 2) 2.75 0.75 3.00 - ... 3.25 -1.25
22 2.00 -0.75 3.00 - ... 4.50 1.259 Apr. 1.50 -0.50 2.50 - -0.50 3.50 -1.005 Nov. 2.00 0.50 3.00 - 0.50 4.00 0.50
2000 4 Feb. 2.25 0.25 3.25 - 0.25 4.25 0.2517 Mar. 2.50 0.25 3.50 - 0.25 4.50 0.2528 Apr. 2.75 0.25 3.75 - 0.25 4.75 0.25
9 June 3.25 0.50 4.25 - 0.50 5.25 0.5028 3) 3.25 ... - 4.25 ... 5.25 ...
1 Sep. 3.50 0.25 - 4.50 0.25 5.50 0.256 Oct. 3.75 0.25 - 4.75 0.25 5.75 0.25
2001 11 May 3.50 -0.25 - 4.50 -0.25 5.50 -0.2531 Aug. 3.25 -0.25 - 4.25 -0.25 5.25 -0.2518 Sep. 2.75 -0.50 - 3.75 -0.50 4.75 -0.50
9 Nov. 2.25 -0.50 - 3.25 -0.50 4.25 -0.502002 6 Dec. 1.75 -0.50 - 2.75 -0.50 3.75 -0.502003 7 Mar. 1.50 -0.25 - 2.50 -0.25 3.50 -0.25
6 June 1.00 -0.50 - 2.00 -0.50 3.00 -0.502005 6 Dec. 1.25 0.25 - 2.25 0.25 3.25 0.252006 8 Mar. 1.50 0.25 - 2.50 0.25 3.50 0.25
15 June 1.75 0.25 - 2.75 0.25 3.75 0.259 Aug. 2.00 0.25 - 3.00 0.25 4.00 0.25
11 Oct. 2.25 0.25 - 3.25 0.25 4.25 0.2513 Dec. 2.50 0.25 - 3.50 0.25 4.50 0.25
2007 14 Mar. 2.75 0.25 - 3.75 0.25 4.75 0.2513 June 3.00 0.25 - 4.00 0.25 5.00 0.25
2008 9 July 3.25 0.25 - 4.25 0.25 5.25 0.258 Oct. 2.75 -0.50 - - - 4.75 -0.509 4) 3.25 0.50 - - - 4.25 -0.50
15 5) 3.25 ... 3.75 - -0.50 4.25 ... 12 Nov. 2.75 -0.50 3.25 - -0.50 3.75 -0.5010 Dec. 2.00 -0.75 2.50 - -0.75 3.00 -0.75
2009 21 Jan. 1.00 -1.00 2.00 - -0.50 3.00 ... 11 Mar. 0.50 -0.50 1.50 - -0.50 2.50 -0.50
8 Apr. 0.25 -0.25 1.25 - -0.25 2.25 -0.2513 May 0.25 ... 1.00 - -0.25 1.75 -0.50
2011 13 Apr. 0.50 0.25 1.25 - 0.25 2.00 0.2513 July 0.75 0.25 1.50 - 0.25 2.25 0.25
9 Nov. 0.50 -0.25 1.25 - -0.25 2.00 -0.2514 Dec. 0.25 -0.25 1.00 - -0.25 1.75 -0.25
2012 11 July 0.00 -0.25 0.75 - -0.25 1.50 -0.252013 8 May 0.00 ... 0.50 - -0.25 1.00 -0.50
13 Nov. 0.00 ... 0.25 - -0.25 0.75 -0.252014 11 June -0.10 -0.10 0.15 - -0.10 0.40 -0.35
10 Sep. -0.20 -0.10 0.05 - -0.10 0.30 -0.10
Source: ECB.1) From 1 January 1999 to 9 March 2004, the date refers to the deposit and marginal lending facilities. For main refinancing operations, changes in the rate are effective from the
first operation following the date indicated. The change on 18 September 2001 was effective on that same day. From 10 March 2004 onwards, the date refers both to the depositand marginal lending facilities and to the main refinancing operations (with changes effective from the first main refinancing operation following the Governing Councildecision), unless otherwise indicated.
2) On 22 December 1998 the ECB announced that, as an exceptional measure between 4 and 21 January 1999, a narrow corridor of 50 basis points would be applied between theinterest rates for the marginal lending facility and the deposit facility, aimed at facilitating the transition to the new monetary regime by market participants.
3) On 8 June 2000 the ECB announced that, starting from the operation to be settled on 28 June 2000, the main refinancing operations of the Eurosystem would be conducted asvariable rate tenders. The minimum bid rate refers to the minimum interest rate at which counterparties may place their bids.
4) As of 9 October 2008 the ECB reduced the standing facilities corridor from 200 basis points to 100 basis points around the interest rate on the main refinancing operations.The standing facilities corridor was restored to 200 basis points as of 21 January 2009.
5) On 8 October 2008 the ECB announced that, starting from the operation to be settled on 15 October, the weekly main refinancing operations would be carried out through afixed rate tender procedure with full allotment at the interest rate on the main refinancing operations. This change overrode the previous decision (made on the same day)to cut by 50 basis points the minimum bid rate on the main refinancing operations conducted as variable rate tenders.
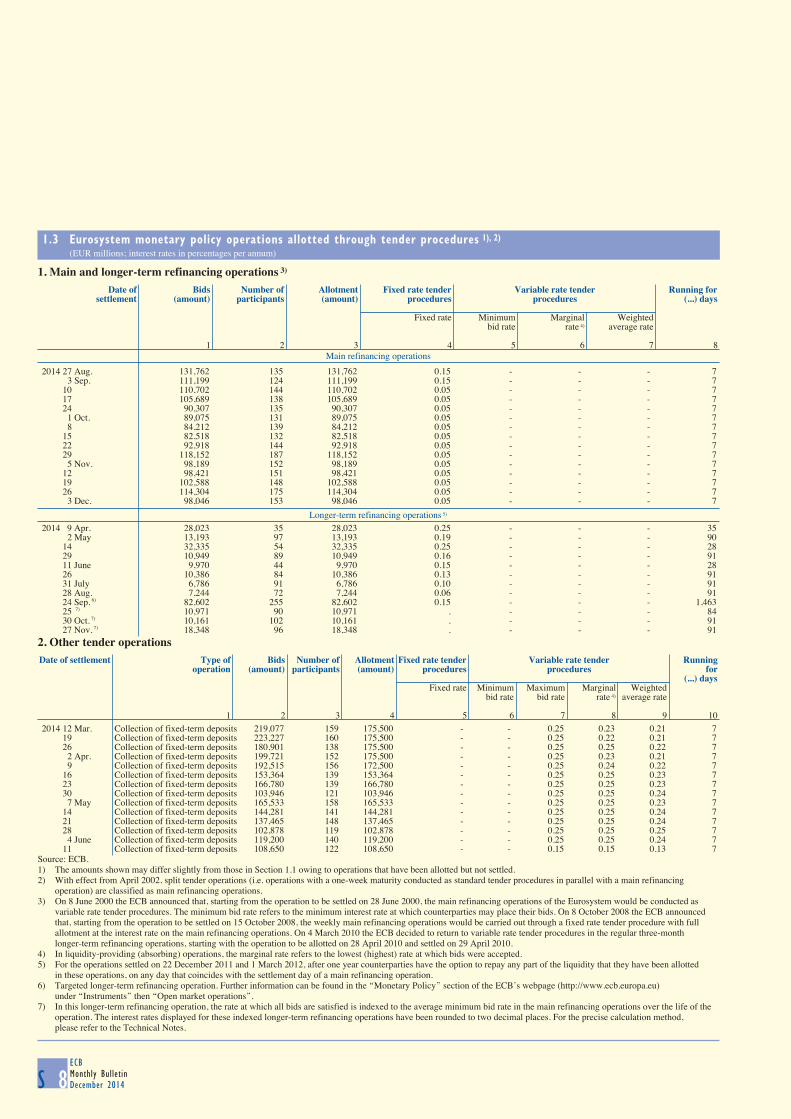
1.3 Eurosystem monetary policy operations allotted through tender procedures 1), 2) (EUR millions; interest rates in percentages per annum)
S 8ECBMonthly BulletinDecember 2014
1. Main and longer-term refinancing operations 3)
Main refinancing operations
Date of Bids Number of Allotment Fixed rate tender Variable rate tender Running for
settlement (amount) participants (amount) procedures procedures (...) days
Fixed rate Minimum Marginal Weightedbid rate rate 4) average rate
1 2 3 4 5 6 7 8
2014 27 Aug. 131,762 135 131,762 0.15 - - - 73 Sep. 111,199 124 111,199 0.15 - - - 7
10 110,702 144 110,702 0.05 - - - 717 105,689 138 105,689 0.05 - - - 724 90,307 135 90,307 0.05 - - - 7
1 Oct. 89,075 131 89,075 0.05 - - - 78 84,212 139 84,212 0.05 - - - 7
15 82,518 132 82,518 0.05 - - - 722 92,918 144 92,918 0.05 - - - 729 118,152 187 118,152 0.05 - - - 7
5 Nov. 98,189 152 98,189 0.05 - - - 712 98,421 151 98,421 0.05 - - - 719 102,588 148 102,588 0.05 - - - 726 114,304 175 114,304 0.05 - - - 7
3 Dec. 98,046 153 98,046 0.05 - - - 7
Longer-term refinancing operations 5)
2014 9 Apr. 28,023 35 28,023 0.25 - - - 352 May 13,193 97 13,193 0.19 - - - 90
14 32,335 54 32,335 0.25 - - - 2829 10,949 89 10,949 0.16 - - - 9111 June 9,970 44 9,970 0.15 - - - 2826 10,386 84 10,386 0.13 - - - 9131 July 6,786 91 6,786 0.10 - - - 9128 Aug. 7,244 72 7,244 0.06 - - - 9124 Sep. 6) 82,602 255 82,602 0.15 - - - 1,46325 7) 10,971 90 10,971 . - - - 8430 Oct. 7) 10,161 102 10,161 . - - - 9127 Nov. 7) 18,348 96 18,348 . - - - 91
2. Other tender operations
Date of settlement Type of Bids Number of Allotment Fixed rate tender Variable rate tender Running
operation (amount) participants (amount) procedures procedures for(...) days
Fixed rate Minimum Maximum Marginal Weightedbid rate bid rate rate 4) average rate
1 2 3 4 5 6 7 8 9 102014 12 Mar. Collection of fixed-term deposits 219,077 159 175,500 - - 0.25 0.23 0.21 7
19 Collection of fixed-term deposits 223,227 160 175,500 - - 0.25 0.22 0.21 726 Collection of fixed-term deposits 180,901 138 175,500 - - 0.25 0.25 0.22 7
2 Apr. Collection of fixed-term deposits 199,721 152 175,500 - - 0.25 0.23 0.21 79 Collection of fixed-term deposits 192,515 156 172,500 - - 0.25 0.24 0.22 7
16 Collection of fixed-term deposits 153,364 139 153,364 - - 0.25 0.25 0.23 723 Collection of fixed-term deposits 166,780 139 166,780 - - 0.25 0.25 0.23 730 Collection of fixed-term deposits 103,946 121 103,946 - - 0.25 0.25 0.24 7
7 May Collection of fixed-term deposits 165,533 158 165,533 - - 0.25 0.25 0.23 714 Collection of fixed-term deposits 144,281 141 144,281 - - 0.25 0.25 0.24 721 Collection of fixed-term deposits 137,465 148 137,465 - - 0.25 0.25 0.24 728 Collection of fixed-term deposits 102,878 119 102,878 - - 0.25 0.25 0.25 7
4 June Collection of fixed-term deposits 119,200 140 119,200 - - 0.25 0.25 0.24 711 Collection of fixed-term deposits 108,650 122 108,650 - - 0.15 0.15 0.13 7
Source: ECB.1) The amounts shown may differ slightly from those in Section 1.1 owing to operations that have been allotted but not settled.2) With effect from April 2002, split tender operations (i.e. operations with a one-week maturity conducted as standard tender procedures in parallel with a main refinancing
operation) are classified as main refinancing operations.3) On 8 June 2000 the ECB announced that, starting from the operation to be settled on 28 June 2000, the main refinancing operations of the Eurosystem would be conducted as
variable rate tender procedures. The minimum bid rate refers to the minimum interest rate at which counterparties may place their bids. On 8 October 2008 the ECB announcedthat, starting from the operation to be settled on 15 October 2008, the weekly main refinancing operations would be carried out through a fixed rate tender procedure with fullallotment at the interest rate on the main refinancing operations. On 4 March 2010 the ECB decided to return to variable rate tender procedures in the regular three-monthlonger-term refinancing operations, starting with the operation to be allotted on 28 April 2010 and settled on 29 April 2010.
4) In liquidity-providing (absorbing) operations, the marginal rate refers to the lowest (highest) rate at which bids were accepted.5) For the operations settled on 22 December 2011 and 1 March 2012, after one year counterparties have the option to repay any part of the liquidity that they have been allotted
in these operations, on any day that coincides with the settlement day of a main refinancing operation.6) Targeted longer-term refinancing operation. Further information can be found in the ‘‘Monetary Policy’’ section of the ECB’s webpage (http://www.ecb.europa.eu)
under ‘‘Instruments’’ then ‘‘Open market operations’’.7) In this longer-term refinancing operation, the rate at which all bids are satisfied is indexed to the average minimum bid rate in the main refinancing operations over the life of the
operation. The interest rates displayed for these indexed longer-term refinancing operations have been rounded to two decimal places. For the precise calculation method,please refer to the Technical Notes.
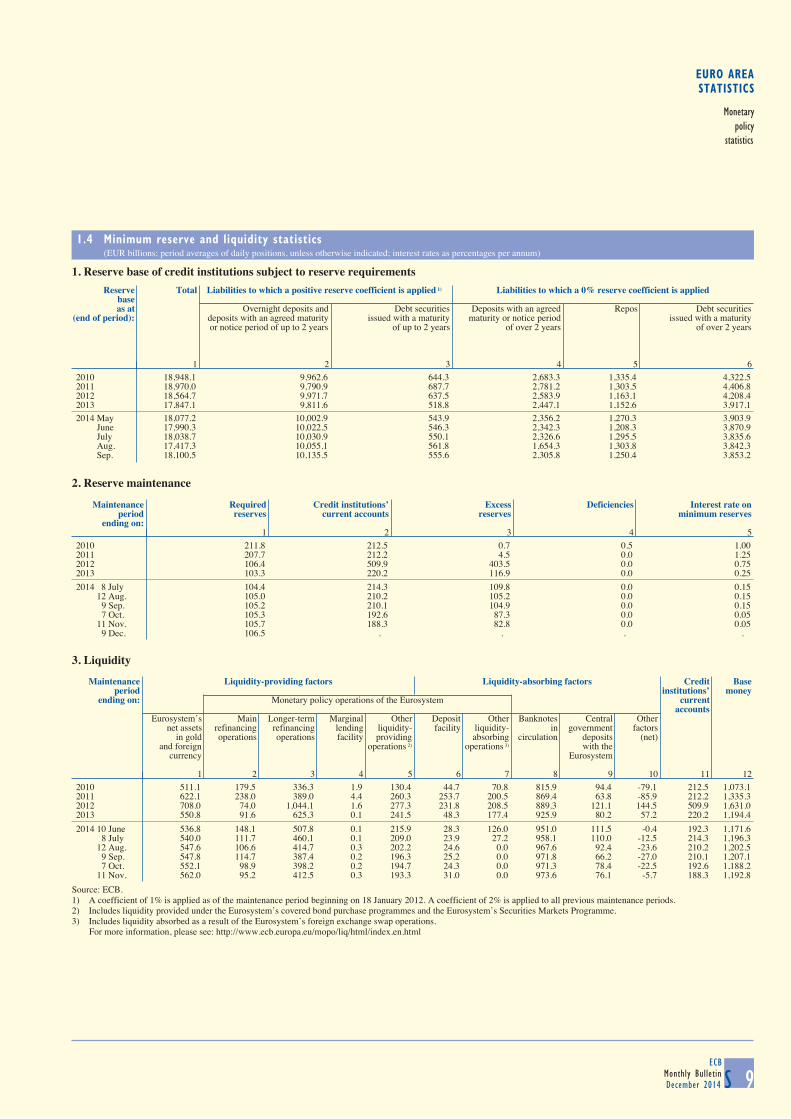
EURO AREASTATISTICS
Monetarypolicy
statistics
1.4 Minimum reserve and liquidity statistics (EUR billions; period averages of daily positions, unless otherwise indicated; interest rates as percentages per annum)
S 9ECB
Monthly BulletinDecember 2014
1. Reserve base of credit institutions subject to reserve requirements
Reserve Total Liabilities to which a positive reserve coefficient is applied 1) Liabilities to which a 0% reserve coefficient is applied
baseas at Overnight deposits and Debt securities Deposits with an agreed Repos Debt securities
(end of period): deposits with an agreed maturity issued with a maturity maturity or notice period issued with a maturityor notice period of up to 2 years of up to 2 years of over 2 years of over 2 years
1 2 3 4 5 62010 18,948.1 9,962.6 644.3 2,683.3 1,335.4 4,322.52011 18,970.0 9,790.9 687.7 2,781.2 1,303.5 4,406.82012 18,564.7 9,971.7 637.5 2,583.9 1,163.1 4,208.42013 17,847.1 9,811.6 518.8 2,447.1 1,152.6 3,917.12014 May 18,077.2 10,002.9 543.9 2,356.2 1,270.3 3,903.9 June 17,990.3 10,022.5 546.3 2,342.3 1,208.3 3,870.9 July 18,038.7 10,030.9 550.1 2,326.6 1,295.5 3,835.6 Aug. 17,417.3 10,055.1 561.8 1,654.3 1,303.8 3,842.3 Sep. 18,100.5 10,135.5 555.6 2,305.8 1,250.4 3,853.2
2. Reserve maintenance
Maintenance Required Credit institutions’ Excess Deficiencies Interest rate onperiod reserves current accounts reserves minimum reserves
ending on:1 2 3 4 5
2010 211.8 212.5 0.7 0.5 1.002011 207.7 212.2 4.5 0.0 1.252012 106.4 509.9 403.5 0.0 0.752013 103.3 220.2 116.9 0.0 0.25
2014 8 July 104.4 214.3 109.8 0.0 0.1512 Aug. 105.0 210.2 105.2 0.0 0.15
9 Sep. 105.2 210.1 104.9 0.0 0.157 Oct. 105.3 192.6 87.3 0.0 0.05
11 Nov. 105.7 188.3 82.8 0.0 0.059 Dec. 106.5 . . . .
3. Liquidity
Maintenance Liquidity-providing factors Liquidity-absorbing factors Credit Base
period institutions’ moneyending on: Monetary policy operations of the Eurosystem current
accountsEurosystem’s Main Longer-term Marginal Other Deposit Other Banknotes Central Other
net assets refinancing refinancing lending liquidity- facility liquidity- in government factorsin gold operations operations facility providing absorbing circulation deposits (net)
and foreign operations 2) operations 3) with thecurrency Eurosystem
1 2 3 4 5 6 7 8 9 10 11 122010 511.1 179.5 336.3 1.9 130.4 44.7 70.8 815.9 94.4 -79.1 212.5 1,073.12011 622.1 238.0 389.0 4.4 260.3 253.7 200.5 869.4 63.8 -85.9 212.2 1,335.32012 708.0 74.0 1,044.1 1.6 277.3 231.8 208.5 889.3 121.1 144.5 509.9 1,631.02013 550.8 91.6 625.3 0.1 241.5 48.3 177.4 925.9 80.2 57.2 220.2 1,194.4
2014 10 June 536.8 148.1 507.8 0.1 215.9 28.3 126.0 951.0 111.5 -0.4 192.3 1,171.68 July 540.0 111.7 460.1 0.1 209.0 23.9 27.2 958.1 110.0 -12.5 214.3 1,196.3
12 Aug. 547.6 106.6 414.7 0.3 202.2 24.6 0.0 967.6 92.4 -23.6 210.2 1,202.59 Sep. 547.8 114.7 387.4 0.2 196.3 25.2 0.0 971.8 66.2 -27.0 210.1 1,207.17 Oct. 552.1 98.9 398.2 0.2 194.7 24.3 0.0 971.3 78.4 -22.5 192.6 1,188.2
11 Nov. 562.0 95.2 412.5 0.3 193.3 31.0 0.0 973.6 76.1 -5.7 188.3 1,192.8Source: ECB.1) A coefficient of 1% is applied as of the maintenance period beginning on 18 January 2012. A coefficient of 2% is applied to all previous maintenance periods.2) Includes liquidity provided under the Eurosystem’s covered bond purchase programmes and the Eurosystem’s Securities Markets Programme.3) Includes liquidity absorbed as a result of the Eurosystem’s foreign exchange swap operations.
For more information, please see: http://www.ecb.europa.eu/mopo/liq/html/index.en.html
1.3 Eurosystem monetary policy operations allotted through tender procedures 1), 2) (EUR millions; interest rates in percentages per annum)
S 8ECBMonthly BulletinDecember 2014
1. Main and longer-term refinancing operations 3)
Main refinancing operations
Date of Bids Number of Allotment Fixed rate tender Variable rate tender Running for
settlement (amount) participants (amount) procedures procedures (...) days
Fixed rate Minimum Marginal Weightedbid rate rate 4) average rate
1 2 3 4 5 6 7 8
2014 27 Aug. 131,762 135 131,762 0.15 - - - 73 Sep. 111,199 124 111,199 0.15 - - - 7
10 110,702 144 110,702 0.05 - - - 717 105,689 138 105,689 0.05 - - - 724 90,307 135 90,307 0.05 - - - 7
1 Oct. 89,075 131 89,075 0.05 - - - 78 84,212 139 84,212 0.05 - - - 7
15 82,518 132 82,518 0.05 - - - 722 92,918 144 92,918 0.05 - - - 729 118,152 187 118,152 0.05 - - - 7
5 Nov. 98,189 152 98,189 0.05 - - - 712 98,421 151 98,421 0.05 - - - 719 102,588 148 102,588 0.05 - - - 726 114,304 175 114,304 0.05 - - - 7
3 Dec. 98,046 153 98,046 0.05 - - - 7
Longer-term refinancing operations 5)
2014 9 Apr. 28,023 35 28,023 0.25 - - - 352 May 13,193 97 13,193 0.19 - - - 90
14 32,335 54 32,335 0.25 - - - 2829 10,949 89 10,949 0.16 - - - 9111 June 9,970 44 9,970 0.15 - - - 2826 10,386 84 10,386 0.13 - - - 9131 July 6,786 91 6,786 0.10 - - - 9128 Aug. 7,244 72 7,244 0.06 - - - 9124 Sep. 6) 82,602 255 82,602 0.15 - - - 1,46325 7) 10,971 90 10,971 . - - - 8430 Oct. 7) 10,161 102 10,161 . - - - 9127 Nov. 7) 18,348 96 18,348 . - - - 91
2. Other tender operations
Date of settlement Type of Bids Number of Allotment Fixed rate tender Variable rate tender Running
operation (amount) participants (amount) procedures procedures for(...) days
Fixed rate Minimum Maximum Marginal Weightedbid rate bid rate rate 4) average rate
1 2 3 4 5 6 7 8 9 102014 12 Mar. Collection of fixed-term deposits 219,077 159 175,500 - - 0.25 0.23 0.21 7
19 Collection of fixed-term deposits 223,227 160 175,500 - - 0.25 0.22 0.21 726 Collection of fixed-term deposits 180,901 138 175,500 - - 0.25 0.25 0.22 7
2 Apr. Collection of fixed-term deposits 199,721 152 175,500 - - 0.25 0.23 0.21 79 Collection of fixed-term deposits 192,515 156 172,500 - - 0.25 0.24 0.22 7
16 Collection of fixed-term deposits 153,364 139 153,364 - - 0.25 0.25 0.23 723 Collection of fixed-term deposits 166,780 139 166,780 - - 0.25 0.25 0.23 730 Collection of fixed-term deposits 103,946 121 103,946 - - 0.25 0.25 0.24 7
7 May Collection of fixed-term deposits 165,533 158 165,533 - - 0.25 0.25 0.23 714 Collection of fixed-term deposits 144,281 141 144,281 - - 0.25 0.25 0.24 721 Collection of fixed-term deposits 137,465 148 137,465 - - 0.25 0.25 0.24 728 Collection of fixed-term deposits 102,878 119 102,878 - - 0.25 0.25 0.25 7
4 June Collection of fixed-term deposits 119,200 140 119,200 - - 0.25 0.25 0.24 711 Collection of fixed-term deposits 108,650 122 108,650 - - 0.15 0.15 0.13 7
Source: ECB.1) The amounts shown may differ slightly from those in Section 1.1 owing to operations that have been allotted but not settled.2) With effect from April 2002, split tender operations (i.e. operations with a one-week maturity conducted as standard tender procedures in parallel with a main refinancing
operation) are classified as main refinancing operations.3) On 8 June 2000 the ECB announced that, starting from the operation to be settled on 28 June 2000, the main refinancing operations of the Eurosystem would be conducted as
variable rate tender procedures. The minimum bid rate refers to the minimum interest rate at which counterparties may place their bids. On 8 October 2008 the ECB announcedthat, starting from the operation to be settled on 15 October 2008, the weekly main refinancing operations would be carried out through a fixed rate tender procedure with fullallotment at the interest rate on the main refinancing operations. On 4 March 2010 the ECB decided to return to variable rate tender procedures in the regular three-monthlonger-term refinancing operations, starting with the operation to be allotted on 28 April 2010 and settled on 29 April 2010.
4) In liquidity-providing (absorbing) operations, the marginal rate refers to the lowest (highest) rate at which bids were accepted.5) For the operations settled on 22 December 2011 and 1 March 2012, after one year counterparties have the option to repay any part of the liquidity that they have been allotted
in these operations, on any day that coincides with the settlement day of a main refinancing operation.6) Targeted longer-term refinancing operation. Further information can be found in the ‘‘Monetary Policy’’ section of the ECB’s webpage (http://www.ecb.europa.eu)
under ‘‘Instruments’’ then ‘‘Open market operations’’.7) In this longer-term refinancing operation, the rate at which all bids are satisfied is indexed to the average minimum bid rate in the main refinancing operations over the life of the
operation. The interest rates displayed for these indexed longer-term refinancing operations have been rounded to two decimal places. For the precise calculation method,please refer to the Technical Notes.
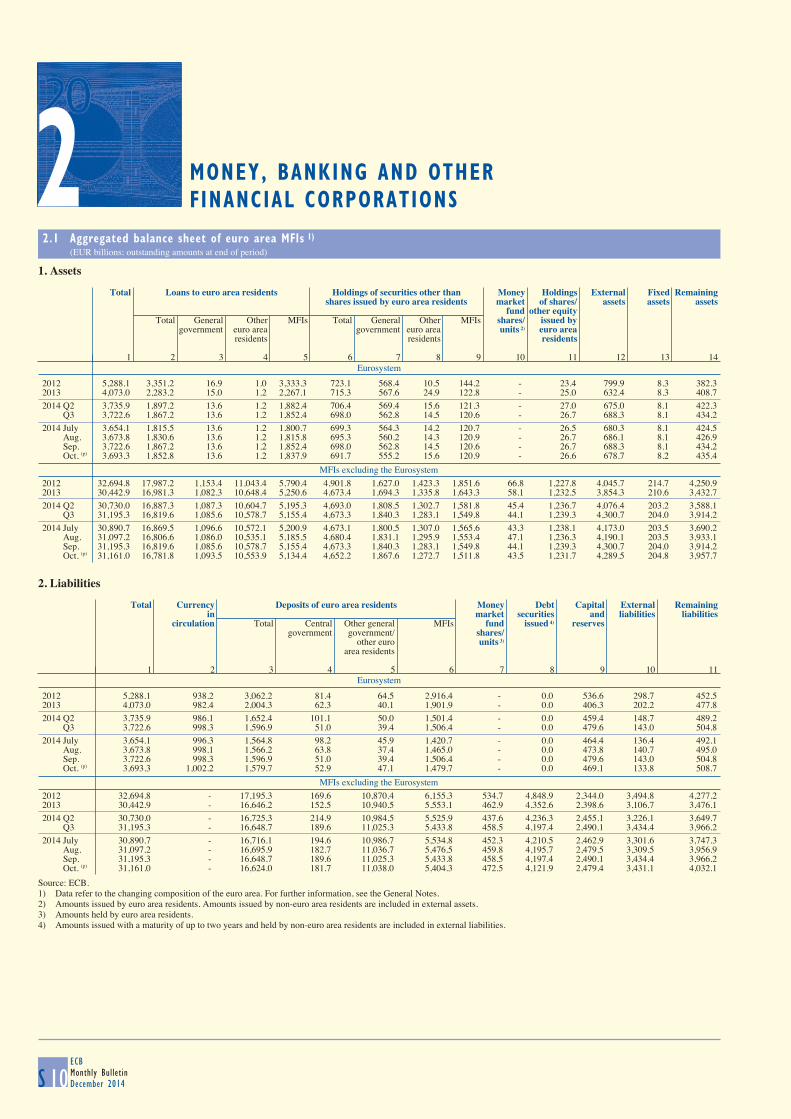
FINANCIAL CORPORATIONS2 MONEY, BANKING AND OTHER
2.1 Aggregated balance sheet of euro area MFIs 1) (EUR billions; outstanding amounts at end of period)
S 10ECBMonthly BulletinDecember 2014
1. Assets
Eurosystem
Total Loans to euro area residents Holdings of securities other than Money Holdings External Fixed Remaining
shares issued by euro area residents market of shares/ assets assets assetsfund other equity
Total General Other MFIs Total General Other MFIs shares/ issued bygovernment euro area government euro area units 2) euro area
residents residents residents
1 2 3 4 5 6 7 8 9 10 11 12 13 14
2012 5,288.1 3,351.2 16.9 1.0 3,333.3 723.1 568.4 10.5 144.2 - 23.4 799.9 8.3 382.32013 4,073.0 2,283.2 15.0 1.2 2,267.1 715.3 567.6 24.9 122.8 - 25.0 632.4 8.3 408.72014 Q2 3,735.9 1,897.2 13.6 1.2 1,882.4 706.4 569.4 15.6 121.3 - 27.0 675.0 8.1 422.3 Q3 3,722.6 1,867.2 13.6 1.2 1,852.4 698.0 562.8 14.5 120.6 - 26.7 688.3 8.1 434.22014 July 3,654.1 1,815.5 13.6 1.2 1,800.7 699.3 564.3 14.2 120.7 - 26.5 680.3 8.1 424.5 Aug. 3,673.8 1,830.6 13.6 1.2 1,815.8 695.3 560.2 14.3 120.9 - 26.7 686.1 8.1 426.9 Sep. 3,722.6 1,867.2 13.6 1.2 1,852.4 698.0 562.8 14.5 120.6 - 26.7 688.3 8.1 434.2 Oct. (p) 3,693.3 1,852.8 13.6 1.2 1,837.9 691.7 555.2 15.6 120.9 - 26.6 678.7 8.2 435.4
MFIs excluding the Eurosystem
2012 32,694.8 17,987.2 1,153.4 11,043.4 5,790.4 4,901.8 1,627.0 1,423.3 1,851.6 66.8 1,227.8 4,045.7 214.7 4,250.92013 30,442.9 16,981.3 1,082.3 10,648.4 5,250.6 4,673.4 1,694.3 1,335.8 1,643.3 58.1 1,232.5 3,854.3 210.6 3,432.72014 Q2 30,730.0 16,887.3 1,087.3 10,604.7 5,195.3 4,693.0 1,808.5 1,302.7 1,581.8 45.4 1,236.7 4,076.4 203.2 3,588.1 Q3 31,195.3 16,819.6 1,085.6 10,578.7 5,155.4 4,673.3 1,840.3 1,283.1 1,549.8 44.1 1,239.3 4,300.7 204.0 3,914.22014 July 30,890.7 16,869.5 1,096.6 10,572.1 5,200.9 4,673.1 1,800.5 1,307.0 1,565.6 43.3 1,238.1 4,173.0 203.5 3,690.2 Aug. 31,097.2 16,806.6 1,086.0 10,535.1 5,185.5 4,680.4 1,831.1 1,295.9 1,553.4 47.1 1,236.3 4,190.1 203.5 3,933.1 Sep. 31,195.3 16,819.6 1,085.6 10,578.7 5,155.4 4,673.3 1,840.3 1,283.1 1,549.8 44.1 1,239.3 4,300.7 204.0 3,914.2 Oct. (p) 31,161.0 16,781.8 1,093.5 10,553.9 5,134.4 4,652.2 1,867.6 1,272.7 1,511.8 43.5 1,231.7 4,289.5 204.8 3,957.7
2. Liabilities
Eurosystem
Total Currency Deposits of euro area residents Money Debt Capital External Remaining
in market securities and liabilities liabilitiescirculation Total Central Other general MFIs fund issued 4) reserves
government government/ shares/other euro units 3)
area residents
1 2 3 4 5 6 7 8 9 10 11
2012 5,288.1 938.2 3,062.2 81.4 64.5 2,916.4 - 0.0 536.6 298.7 452.52013 4,073.0 982.4 2,004.3 62.3 40.1 1,901.9 - 0.0 406.3 202.2 477.82014 Q2 3,735.9 986.1 1,652.4 101.1 50.0 1,501.4 - 0.0 459.4 148.7 489.2 Q3 3,722.6 998.3 1,596.9 51.0 39.4 1,506.4 - 0.0 479.6 143.0 504.82014 July 3,654.1 996.3 1,564.8 98.2 45.9 1,420.7 - 0.0 464.4 136.4 492.1 Aug. 3,673.8 998.1 1,566.2 63.8 37.4 1,465.0 - 0.0 473.8 140.7 495.0 Sep. 3,722.6 998.3 1,596.9 51.0 39.4 1,506.4 - 0.0 479.6 143.0 504.8 Oct. (p) 3,693.3 1,002.2 1,579.7 52.9 47.1 1,479.7 - 0.0 469.1 133.8 508.7
MFIs excluding the Eurosystem
2012 32,694.8 - 17,195.3 169.6 10,870.4 6,155.3 534.7 4,848.9 2,344.0 3,494.8 4,277.22013 30,442.9 - 16,646.2 152.5 10,940.5 5,553.1 462.9 4,352.6 2,398.6 3,106.7 3,476.12014 Q2 30,730.0 - 16,725.3 214.9 10,984.5 5,525.9 437.6 4,236.3 2,455.1 3,226.1 3,649.7 Q3 31,195.3 - 16,648.7 189.6 11,025.3 5,433.8 458.5 4,197.4 2,490.1 3,434.4 3,966.22014 July 30,890.7 - 16,716.1 194.6 10,986.7 5,534.8 452.3 4,210.5 2,462.9 3,301.6 3,747.3 Aug. 31,097.2 - 16,695.9 182.7 11,036.7 5,476.5 459.8 4,195.7 2,479.5 3,309.5 3,956.9 Sep. 31,195.3 - 16,648.7 189.6 11,025.3 5,433.8 458.5 4,197.4 2,490.1 3,434.4 3,966.2 Oct. (p) 31,161.0 - 16,624.0 181.7 11,038.0 5,404.3 472.5 4,121.9 2,479.4 3,431.1 4,032.1
Source: ECB.1) Data refer to the changing composition of the euro area. For further information, see the General Notes.2) Amounts issued by euro area residents. Amounts issued by non-euro area residents are included in external assets.3) Amounts held by euro area residents.4) Amounts issued with a maturity of up to two years and held by non-euro area residents are included in external liabilities.
2
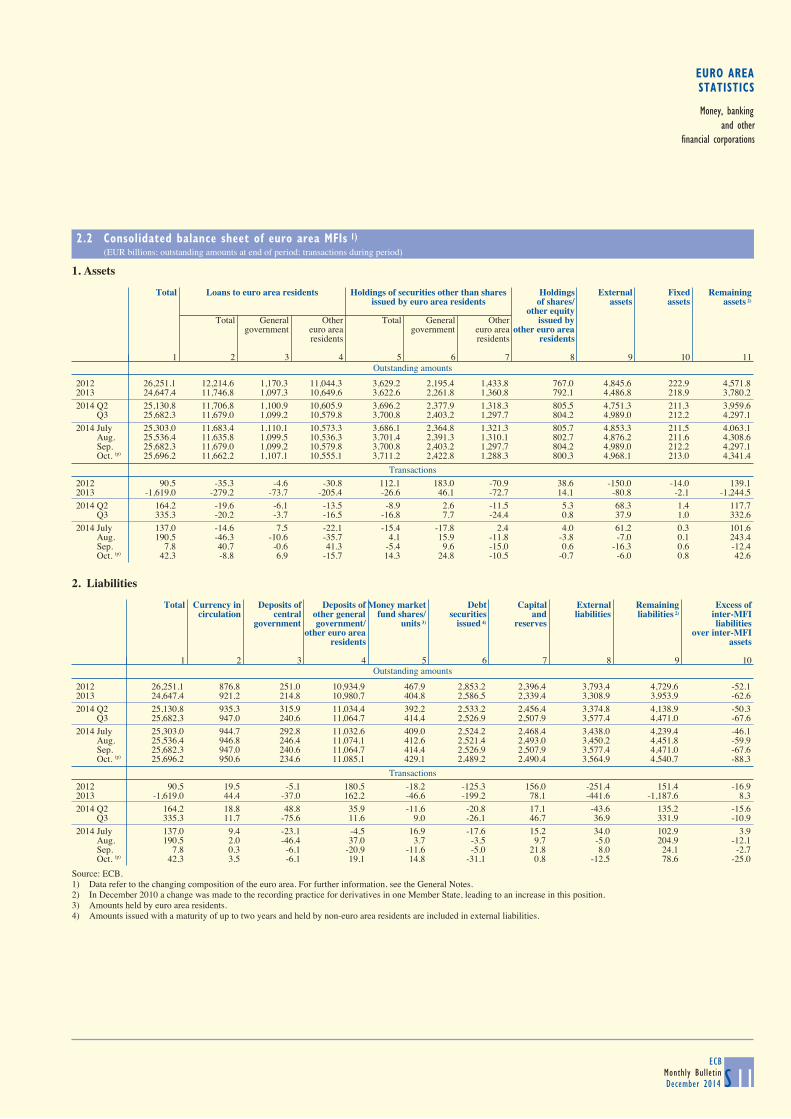
EURO AREASTATISTICS
Money, bankingand other
financial corporations
2.2 Consolidated balance sheet of euro area MFIs 1) (EUR billions; outstanding amounts at end of period; transactions during period)
S 11ECB
Monthly BulletinDecember 2014
1. Assets
Outstanding amounts
Total Loans to euro area residents Holdings of securities other than shares Holdings External Fixed Remaining
issued by euro area residents of shares/ assets assets assets 2)
other equityTotal General Other Total General Other issued by
government euro area government euro area other euro arearesidents residents residents
1 2 3 4 5 6 7 8 9 10 11
2012 26,251.1 12,214.6 1,170.3 11,044.3 3,629.2 2,195.4 1,433.8 767.0 4,845.6 222.9 4,571.82013 24,647.4 11,746.8 1,097.3 10,649.6 3,622.6 2,261.8 1,360.8 792.1 4,486.8 218.9 3,780.22014 Q2 25,130.8 11,706.8 1,100.9 10,605.9 3,696.2 2,377.9 1,318.3 805.5 4,751.3 211.3 3,959.6 Q3 25,682.3 11,679.0 1,099.2 10,579.8 3,700.8 2,403.2 1,297.7 804.2 4,989.0 212.2 4,297.12014 July 25,303.0 11,683.4 1,110.1 10,573.3 3,686.1 2,364.8 1,321.3 805.7 4,853.3 211.5 4,063.1 Aug. 25,536.4 11,635.8 1,099.5 10,536.3 3,701.4 2,391.3 1,310.1 802.7 4,876.2 211.6 4,308.6 Sep. 25,682.3 11,679.0 1,099.2 10,579.8 3,700.8 2,403.2 1,297.7 804.2 4,989.0 212.2 4,297.1 Oct. (p) 25,696.2 11,662.2 1,107.1 10,555.1 3,711.2 2,422.8 1,288.3 800.3 4,968.1 213.0 4,341.4
Transactions
2012 90.5 -35.3 -4.6 -30.8 112.1 183.0 -70.9 38.6 -150.0 -14.0 139.12013 -1,619.0 -279.2 -73.7 -205.4 -26.6 46.1 -72.7 14.1 -80.8 -2.1 -1,244.52014 Q2 164.2 -19.6 -6.1 -13.5 -8.9 2.6 -11.5 5.3 68.3 1.4 117.7 Q3 335.3 -20.2 -3.7 -16.5 -16.8 7.7 -24.4 0.8 37.9 1.0 332.62014 July 137.0 -14.6 7.5 -22.1 -15.4 -17.8 2.4 4.0 61.2 0.3 101.6 Aug. 190.5 -46.3 -10.6 -35.7 4.1 15.9 -11.8 -3.8 -7.0 0.1 243.4 Sep. 7.8 40.7 -0.6 41.3 -5.4 9.6 -15.0 0.6 -16.3 0.6 -12.4 Oct. (p) 42.3 -8.8 6.9 -15.7 14.3 24.8 -10.5 -0.7 -6.0 0.8 42.6
2. Liabilities
Outstanding amounts
Total Currency in Deposits of Deposits of Money market Debt Capital External Remaining Excess ofcirculation central other general fund shares/ securities and liabilities liabilities 2) inter-MFI
government government/ units 3) issued 4) reserves liabilitiesother euro area over inter-MFI
residents assets
1 2 3 4 5 6 7 8 9 10
2012 26,251.1 876.8 251.0 10,934.9 467.9 2,853.2 2,396.4 3,793.4 4,729.6 -52.12013 24,647.4 921.2 214.8 10,980.7 404.8 2,586.5 2,339.4 3,308.9 3,953.9 -62.62014 Q2 25,130.8 935.3 315.9 11,034.4 392.2 2,533.2 2,456.4 3,374.8 4,138.9 -50.3 Q3 25,682.3 947.0 240.6 11,064.7 414.4 2,526.9 2,507.9 3,577.4 4,471.0 -67.62014 July 25,303.0 944.7 292.8 11,032.6 409.0 2,524.2 2,468.4 3,438.0 4,239.4 -46.1 Aug. 25,536.4 946.8 246.4 11,074.1 412.6 2,521.4 2,493.0 3,450.2 4,451.8 -59.9 Sep. 25,682.3 947.0 240.6 11,064.7 414.4 2,526.9 2,507.9 3,577.4 4,471.0 -67.6 Oct. (p) 25,696.2 950.6 234.6 11,085.1 429.1 2,489.2 2,490.4 3,564.9 4,540.7 -88.3
Transactions
2012 90.5 19.5 -5.1 180.5 -18.2 -125.3 156.0 -251.4 151.4 -16.92013 -1,619.0 44.4 -37.0 162.2 -46.6 -199.2 78.1 -441.6 -1,187.6 8.32014 Q2 164.2 18.8 48.8 35.9 -11.6 -20.8 17.1 -43.6 135.2 -15.6 Q3 335.3 11.7 -75.6 11.6 9.0 -26.1 46.7 36.9 331.9 -10.92014 July 137.0 9.4 -23.1 -4.5 16.9 -17.6 15.2 34.0 102.9 3.9 Aug. 190.5 2.0 -46.4 37.0 3.7 -3.5 9.7 -5.0 204.9 -12.1 Sep. 7.8 0.3 -6.1 -20.9 -11.6 -5.0 21.8 8.0 24.1 -2.7 Oct. (p) 42.3 3.5 -6.1 19.1 14.8 -31.1 0.8 -12.5 78.6 -25.0
Source: ECB.1) Data refer to the changing composition of the euro area. For further information, see the General Notes.2) In December 2010 a change was made to the recording practice for derivatives in one Member State, leading to an increase in this position.3) Amounts held by euro area residents.4) Amounts issued with a maturity of up to two years and held by non-euro area residents are included in external liabilities.
FINANCIAL CORPORATIONS2 MONEY, BANKING AND OTHER
2.1 Aggregated balance sheet of euro area MFIs 1) (EUR billions; outstanding amounts at end of period)
S 10ECBMonthly BulletinDecember 2014
1. Assets
Eurosystem
Total Loans to euro area residents Holdings of securities other than Money Holdings External Fixed Remaining
shares issued by euro area residents market of shares/ assets assets assetsfund other equity
Total General Other MFIs Total General Other MFIs shares/ issued bygovernment euro area government euro area units 2) euro area
residents residents residents
1 2 3 4 5 6 7 8 9 10 11 12 13 14
2012 5,288.1 3,351.2 16.9 1.0 3,333.3 723.1 568.4 10.5 144.2 - 23.4 799.9 8.3 382.32013 4,073.0 2,283.2 15.0 1.2 2,267.1 715.3 567.6 24.9 122.8 - 25.0 632.4 8.3 408.72014 Q2 3,735.9 1,897.2 13.6 1.2 1,882.4 706.4 569.4 15.6 121.3 - 27.0 675.0 8.1 422.3 Q3 3,722.6 1,867.2 13.6 1.2 1,852.4 698.0 562.8 14.5 120.6 - 26.7 688.3 8.1 434.22014 July 3,654.1 1,815.5 13.6 1.2 1,800.7 699.3 564.3 14.2 120.7 - 26.5 680.3 8.1 424.5 Aug. 3,673.8 1,830.6 13.6 1.2 1,815.8 695.3 560.2 14.3 120.9 - 26.7 686.1 8.1 426.9 Sep. 3,722.6 1,867.2 13.6 1.2 1,852.4 698.0 562.8 14.5 120.6 - 26.7 688.3 8.1 434.2 Oct. (p) 3,693.3 1,852.8 13.6 1.2 1,837.9 691.7 555.2 15.6 120.9 - 26.6 678.7 8.2 435.4
MFIs excluding the Eurosystem
2012 32,694.8 17,987.2 1,153.4 11,043.4 5,790.4 4,901.8 1,627.0 1,423.3 1,851.6 66.8 1,227.8 4,045.7 214.7 4,250.92013 30,442.9 16,981.3 1,082.3 10,648.4 5,250.6 4,673.4 1,694.3 1,335.8 1,643.3 58.1 1,232.5 3,854.3 210.6 3,432.72014 Q2 30,730.0 16,887.3 1,087.3 10,604.7 5,195.3 4,693.0 1,808.5 1,302.7 1,581.8 45.4 1,236.7 4,076.4 203.2 3,588.1 Q3 31,195.3 16,819.6 1,085.6 10,578.7 5,155.4 4,673.3 1,840.3 1,283.1 1,549.8 44.1 1,239.3 4,300.7 204.0 3,914.22014 July 30,890.7 16,869.5 1,096.6 10,572.1 5,200.9 4,673.1 1,800.5 1,307.0 1,565.6 43.3 1,238.1 4,173.0 203.5 3,690.2 Aug. 31,097.2 16,806.6 1,086.0 10,535.1 5,185.5 4,680.4 1,831.1 1,295.9 1,553.4 47.1 1,236.3 4,190.1 203.5 3,933.1 Sep. 31,195.3 16,819.6 1,085.6 10,578.7 5,155.4 4,673.3 1,840.3 1,283.1 1,549.8 44.1 1,239.3 4,300.7 204.0 3,914.2 Oct. (p) 31,161.0 16,781.8 1,093.5 10,553.9 5,134.4 4,652.2 1,867.6 1,272.7 1,511.8 43.5 1,231.7 4,289.5 204.8 3,957.7
2. Liabilities
Eurosystem
Total Currency Deposits of euro area residents Money Debt Capital External Remaining
in market securities and liabilities liabilitiescirculation Total Central Other general MFIs fund issued 4) reserves
government government/ shares/other euro units 3)
area residents
1 2 3 4 5 6 7 8 9 10 11
2012 5,288.1 938.2 3,062.2 81.4 64.5 2,916.4 - 0.0 536.6 298.7 452.52013 4,073.0 982.4 2,004.3 62.3 40.1 1,901.9 - 0.0 406.3 202.2 477.82014 Q2 3,735.9 986.1 1,652.4 101.1 50.0 1,501.4 - 0.0 459.4 148.7 489.2 Q3 3,722.6 998.3 1,596.9 51.0 39.4 1,506.4 - 0.0 479.6 143.0 504.82014 July 3,654.1 996.3 1,564.8 98.2 45.9 1,420.7 - 0.0 464.4 136.4 492.1 Aug. 3,673.8 998.1 1,566.2 63.8 37.4 1,465.0 - 0.0 473.8 140.7 495.0 Sep. 3,722.6 998.3 1,596.9 51.0 39.4 1,506.4 - 0.0 479.6 143.0 504.8 Oct. (p) 3,693.3 1,002.2 1,579.7 52.9 47.1 1,479.7 - 0.0 469.1 133.8 508.7
MFIs excluding the Eurosystem
2012 32,694.8 - 17,195.3 169.6 10,870.4 6,155.3 534.7 4,848.9 2,344.0 3,494.8 4,277.22013 30,442.9 - 16,646.2 152.5 10,940.5 5,553.1 462.9 4,352.6 2,398.6 3,106.7 3,476.12014 Q2 30,730.0 - 16,725.3 214.9 10,984.5 5,525.9 437.6 4,236.3 2,455.1 3,226.1 3,649.7 Q3 31,195.3 - 16,648.7 189.6 11,025.3 5,433.8 458.5 4,197.4 2,490.1 3,434.4 3,966.22014 July 30,890.7 - 16,716.1 194.6 10,986.7 5,534.8 452.3 4,210.5 2,462.9 3,301.6 3,747.3 Aug. 31,097.2 - 16,695.9 182.7 11,036.7 5,476.5 459.8 4,195.7 2,479.5 3,309.5 3,956.9 Sep. 31,195.3 - 16,648.7 189.6 11,025.3 5,433.8 458.5 4,197.4 2,490.1 3,434.4 3,966.2 Oct. (p) 31,161.0 - 16,624.0 181.7 11,038.0 5,404.3 472.5 4,121.9 2,479.4 3,431.1 4,032.1
Source: ECB.1) Data refer to the changing composition of the euro area. For further information, see the General Notes.2) Amounts issued by euro area residents. Amounts issued by non-euro area residents are included in external assets.3) Amounts held by euro area residents.4) Amounts issued with a maturity of up to two years and held by non-euro area residents are included in external liabilities.
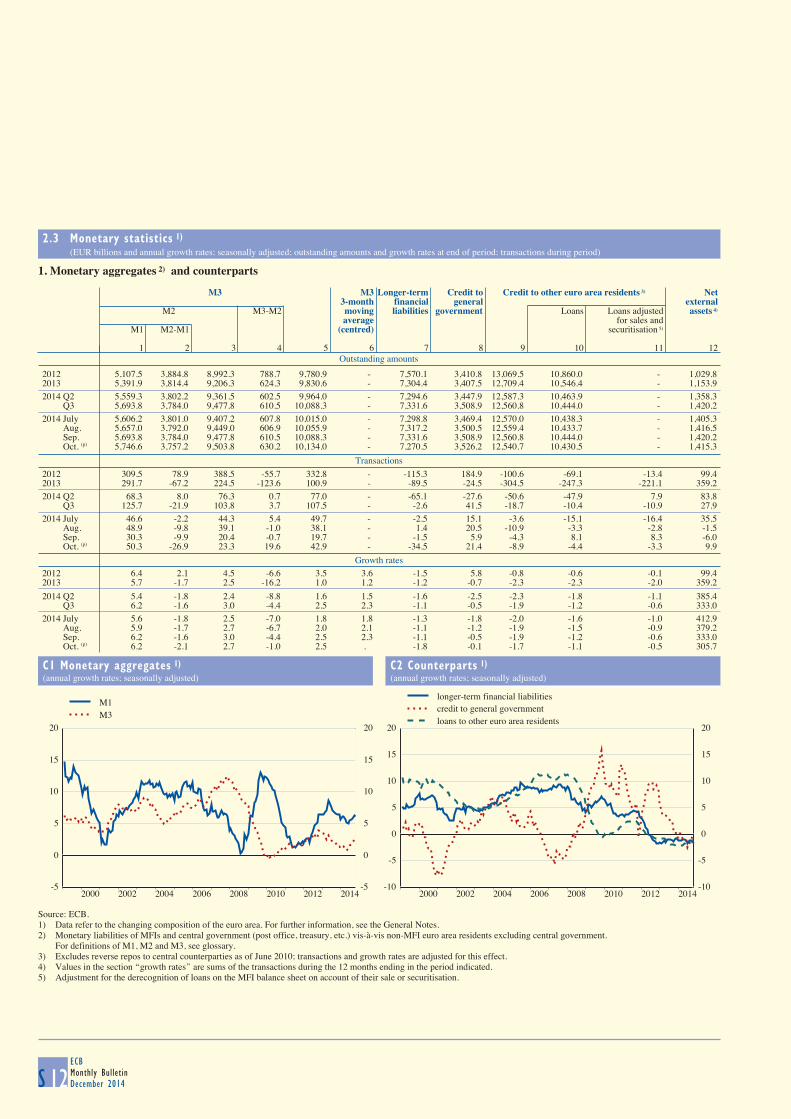
2.3 Monetary statistics 1) (EUR billions and annual growth rates; seasonally adjusted; outstanding amounts and growth rates at end of period; transactions during period)
S 12ECBMonthly BulletinDecember 2014
1. Monetary aggregates 2) and counterparts
Outstanding amounts
M3 M3 Longer-term Credit to Credit to other euro area residents 3) Net
3-month financial general external M2 M3-M2 moving liabilities government Loans Loans adjusted assets 4)
average for sales andM1 M2-M1 (centred) securitisation 5)
1 2 3 4 5 6 7 8 9 10 11 12
2012 5,107.5 3,884.8 8,992.3 788.7 9,780.9 - 7,570.1 3,410.8 13,069.5 10,860.0 - 1,029.82013 5,391.9 3,814.4 9,206.3 624.3 9,830.6 - 7,304.4 3,407.5 12,709.4 10,546.4 - 1,153.92014 Q2 5,559.3 3,802.2 9,361.5 602.5 9,964.0 - 7,294.6 3,447.9 12,587.3 10,463.9 - 1,358.3 Q3 5,693.8 3,784.0 9,477.8 610.5 10,088.3 - 7,331.6 3,508.9 12,560.8 10,444.0 - 1,420.22014 July 5,606.2 3,801.0 9,407.2 607.8 10,015.0 - 7,298.8 3,469.4 12,570.0 10,438.3 - 1,405.3 Aug. 5,657.0 3,792.0 9,449.0 606.9 10,055.9 - 7,317.2 3,500.5 12,559.4 10,433.7 - 1,416.5 Sep. 5,693.8 3,784.0 9,477.8 610.5 10,088.3 - 7,331.6 3,508.9 12,560.8 10,444.0 - 1,420.2 Oct. (p) 5,746.6 3,757.2 9,503.8 630.2 10,134.0 - 7,270.5 3,526.2 12,540.7 10,430.5 - 1,415.3
Transactions
2012 309.5 78.9 388.5 -55.7 332.8 - -115.3 184.9 -100.6 -69.1 -13.4 99.42013 291.7 -67.2 224.5 -123.6 100.9 - -89.5 -24.5 -304.5 -247.3 -221.1 359.22014 Q2 68.3 8.0 76.3 0.7 77.0 - -65.1 -27.6 -50.6 -47.9 7.9 83.8 Q3 125.7 -21.9 103.8 3.7 107.5 - -2.6 41.5 -18.7 -10.4 -10.9 27.92014 July 46.6 -2.2 44.3 5.4 49.7 - -2.5 15.1 -3.6 -15.1 -16.4 35.5 Aug. 48.9 -9.8 39.1 -1.0 38.1 - 1.4 20.5 -10.9 -3.3 -2.8 -1.5 Sep. 30.3 -9.9 20.4 -0.7 19.7 - -1.5 5.9 -4.3 8.1 8.3 -6.0 Oct. (p) 50.3 -26.9 23.3 19.6 42.9 - -34.5 21.4 -8.9 -4.4 -3.3 9.9
Growth rates
2012 6.4 2.1 4.5 -6.6 3.5 3.6 -1.5 5.8 -0.8 -0.6 -0.1 99.42013 5.7 -1.7 2.5 -16.2 1.0 1.2 -1.2 -0.7 -2.3 -2.3 -2.0 359.2
2014 Q2 5.4 -1.8 2.4 -8.8 1.6 1.5 -1.6 -2.5 -2.3 -1.8 -1.1 385.4 Q3 6.2 -1.6 3.0 -4.4 2.5 2.3 -1.1 -0.5 -1.9 -1.2 -0.6 333.0
2014 July 5.6 -1.8 2.5 -7.0 1.8 1.8 -1.3 -1.8 -2.0 -1.6 -1.0 412.9 Aug. 5.9 -1.7 2.7 -6.7 2.0 2.1 -1.1 -1.2 -1.9 -1.5 -0.9 379.2 Sep. 6.2 -1.6 3.0 -4.4 2.5 2.3 -1.1 -0.5 -1.9 -1.2 -0.6 333.0 Oct. (p) 6.2 -2.1 2.7 -1.0 2.5 . -1.8 -0.1 -1.7 -1.1 -0.5 305.7
C1 Monetary aggregates 1)
(annual growth rates; seasonally adjusted)
C2 Counterparts 1)
(annual growth rates; seasonally adjusted)
-5
0
5
10
15
20
2000 2002 2004 2006 2008 2010 2012 2014-5
0
5
10
15
20
M1M3
-10
-5
0
5
10
15
20
2000 2002 2004 2006 2008 2010 2012 2014-10
-5
0
5
10
15
20
longer-term financial liabilitiescredit to general governmentloans to other euro area residents
Source: ECB.1) Data refer to the changing composition of the euro area. For further information, see the General Notes.2) Monetary liabilities of MFIs and central government (post office, treasury, etc.) vis-à-vis non-MFI euro area residents excluding central government.
For definitions of M1, M2 and M3, see glossary.3) Excludes reverse repos to central counterparties as of June 2010; transactions and growth rates are adjusted for this effect.4) Values in the section ‘‘growth rates’’ are sums of the transactions during the 12 months ending in the period indicated.5) Adjustment for the derecognition of loans on the MFI balance sheet on account of their sale or securitisation.
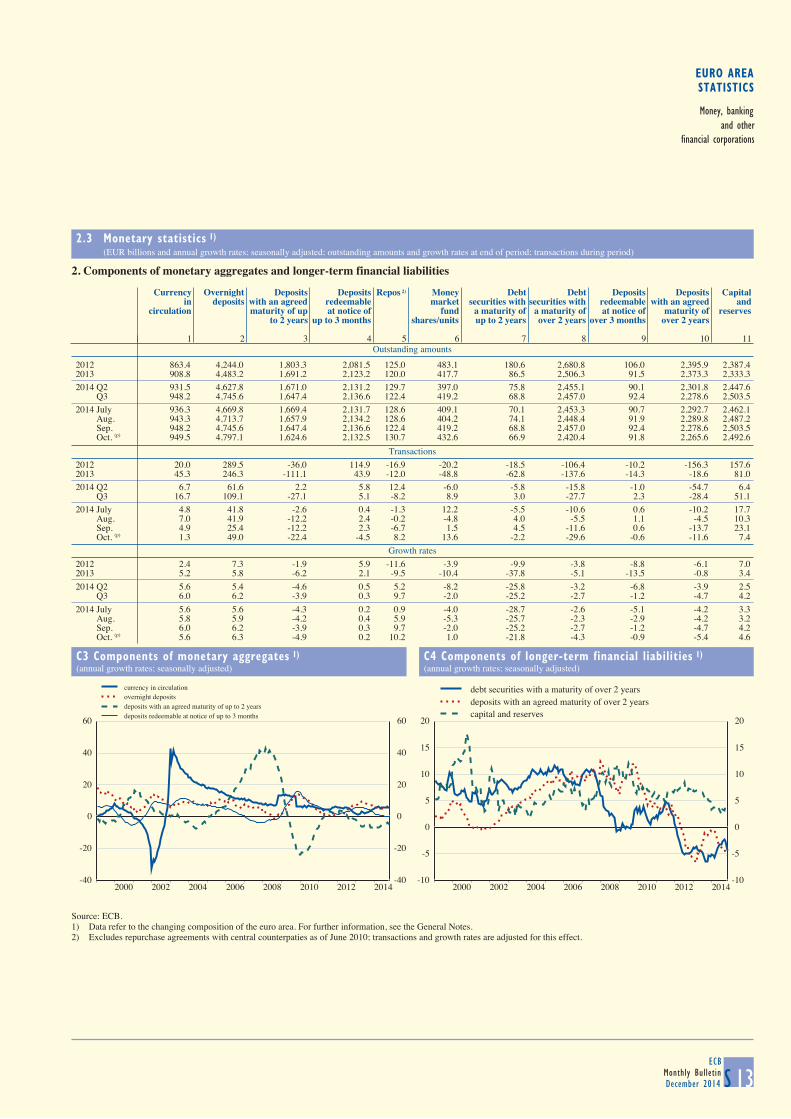
EURO AREASTATISTICS
Money, bankingand other
financial corporations
2.3 Monetary statistics 1) (EUR billions and annual growth rates; seasonally adjusted; outstanding amounts and growth rates at end of period; transactions during period)
S 13ECB
Monthly BulletinDecember 2014
2. Components of monetary aggregates and longer-term financial liabilities
Outstanding amounts
Currency Overnight Deposits Deposits Repos 2) Money Debt Debt Deposits Deposits Capitalin deposits with an agreed redeemable market securities with securities with redeemable with an agreed and
circulation maturity of up at notice of fund a maturity of a maturity of at notice of maturity of reservesto 2 years up to 3 months shares/units up to 2 years over 2 years over 3 months over 2 years
1 2 3 4 5 6 7 8 9 10 11
2012 863.4 4,244.0 1,803.3 2,081.5 125.0 483.1 180.6 2,680.8 106.0 2,395.9 2,387.42013 908.8 4,483.2 1,691.2 2,123.2 120.0 417.7 86.5 2,506.3 91.5 2,373.3 2,333.32014 Q2 931.5 4,627.8 1,671.0 2,131.2 129.7 397.0 75.8 2,455.1 90.1 2,301.8 2,447.6 Q3 948.2 4,745.6 1,647.4 2,136.6 122.4 419.2 68.8 2,457.0 92.4 2,278.6 2,503.52014 July 936.3 4,669.8 1,669.4 2,131.7 128.6 409.1 70.1 2,453.3 90.7 2,292.7 2,462.1 Aug. 943.3 4,713.7 1,657.9 2,134.2 128.6 404.2 74.1 2,448.4 91.9 2,289.8 2,487.2 Sep. 948.2 4,745.6 1,647.4 2,136.6 122.4 419.2 68.8 2,457.0 92.4 2,278.6 2,503.5 Oct. (p) 949.5 4,797.1 1,624.6 2,132.5 130.7 432.6 66.9 2,420.4 91.8 2,265.6 2,492.6
Transactions
2012 20.0 289.5 -36.0 114.9 -16.9 -20.2 -18.5 -106.4 -10.2 -156.3 157.62013 45.3 246.3 -111.1 43.9 -12.0 -48.8 -62.8 -137.6 -14.3 -18.6 81.02014 Q2 6.7 61.6 2.2 5.8 12.4 -6.0 -5.8 -15.8 -1.0 -54.7 6.4 Q3 16.7 109.1 -27.1 5.1 -8.2 8.9 3.0 -27.7 2.3 -28.4 51.12014 July 4.8 41.8 -2.6 0.4 -1.3 12.2 -5.5 -10.6 0.6 -10.2 17.7 Aug. 7.0 41.9 -12.2 2.4 -0.2 -4.8 4.0 -5.5 1.1 -4.5 10.3 Sep. 4.9 25.4 -12.2 2.3 -6.7 1.5 4.5 -11.6 0.6 -13.7 23.1 Oct. (p) 1.3 49.0 -22.4 -4.5 8.2 13.6 -2.2 -29.6 -0.6 -11.6 7.4
Growth rates
2012 2.4 7.3 -1.9 5.9 -11.6 -3.9 -9.9 -3.8 -8.8 -6.1 7.02013 5.2 5.8 -6.2 2.1 -9.5 -10.4 -37.8 -5.1 -13.5 -0.8 3.4
2014 Q2 5.6 5.4 -4.6 0.5 5.2 -8.2 -25.8 -3.2 -6.8 -3.9 2.5 Q3 6.0 6.2 -3.9 0.3 9.7 -2.0 -25.2 -2.7 -1.2 -4.7 4.2
2014 July 5.6 5.6 -4.3 0.2 0.9 -4.0 -28.7 -2.6 -5.1 -4.2 3.3 Aug. 5.8 5.9 -4.2 0.4 5.9 -5.3 -25.7 -2.3 -2.9 -4.2 3.2 Sep. 6.0 6.2 -3.9 0.3 9.7 -2.0 -25.2 -2.7 -1.2 -4.7 4.2 Oct. (p) 5.6 6.3 -4.9 0.2 10.2 1.0 -21.8 -4.3 -0.9 -5.4 4.6
C3 Components of monetary aggregates 1)
(annual growth rates; seasonally adjusted)
C4 Components of longer-term financial liabilities 1)
(annual growth rates; seasonally adjusted)
-40
-20
0
20
40
60
2000 2002 2004 2006 2008 2010 2012 2014-40
-20
0
20
40
60
currency in circulationovernight depositsdeposits with an agreed maturity of up to 2 yearsdeposits redeemable at notice of up to 3 months
-10
-5
0
5
10
15
20
2000 2002 2004 2006 2008 2010 2012 2014-10
-5
0
5
10
15
20
debt securities with a maturity of over 2 yearsdeposits with an agreed maturity of over 2 yearscapital and reserves
Source: ECB.1) Data refer to the changing composition of the euro area. For further information, see the General Notes.2) Excludes repurchase agreements with central counterpaties as of June 2010; transactions and growth rates are adjusted for this effect.
2.3 Monetary statistics 1) (EUR billions and annual growth rates; seasonally adjusted; outstanding amounts and growth rates at end of period; transactions during period)
S 12ECBMonthly BulletinDecember 2014
1. Monetary aggregates 2) and counterparts
Outstanding amounts
M3 M3 Longer-term Credit to Credit to other euro area residents 3) Net
3-month financial general external M2 M3-M2 moving liabilities government Loans Loans adjusted assets 4)
average for sales andM1 M2-M1 (centred) securitisation 5)
1 2 3 4 5 6 7 8 9 10 11 12
2012 5,107.5 3,884.8 8,992.3 788.7 9,780.9 - 7,570.1 3,410.8 13,069.5 10,860.0 - 1,029.82013 5,391.9 3,814.4 9,206.3 624.3 9,830.6 - 7,304.4 3,407.5 12,709.4 10,546.4 - 1,153.92014 Q2 5,559.3 3,802.2 9,361.5 602.5 9,964.0 - 7,294.6 3,447.9 12,587.3 10,463.9 - 1,358.3 Q3 5,693.8 3,784.0 9,477.8 610.5 10,088.3 - 7,331.6 3,508.9 12,560.8 10,444.0 - 1,420.22014 July 5,606.2 3,801.0 9,407.2 607.8 10,015.0 - 7,298.8 3,469.4 12,570.0 10,438.3 - 1,405.3 Aug. 5,657.0 3,792.0 9,449.0 606.9 10,055.9 - 7,317.2 3,500.5 12,559.4 10,433.7 - 1,416.5 Sep. 5,693.8 3,784.0 9,477.8 610.5 10,088.3 - 7,331.6 3,508.9 12,560.8 10,444.0 - 1,420.2 Oct. (p) 5,746.6 3,757.2 9,503.8 630.2 10,134.0 - 7,270.5 3,526.2 12,540.7 10,430.5 - 1,415.3
Transactions
2012 309.5 78.9 388.5 -55.7 332.8 - -115.3 184.9 -100.6 -69.1 -13.4 99.42013 291.7 -67.2 224.5 -123.6 100.9 - -89.5 -24.5 -304.5 -247.3 -221.1 359.22014 Q2 68.3 8.0 76.3 0.7 77.0 - -65.1 -27.6 -50.6 -47.9 7.9 83.8 Q3 125.7 -21.9 103.8 3.7 107.5 - -2.6 41.5 -18.7 -10.4 -10.9 27.92014 July 46.6 -2.2 44.3 5.4 49.7 - -2.5 15.1 -3.6 -15.1 -16.4 35.5 Aug. 48.9 -9.8 39.1 -1.0 38.1 - 1.4 20.5 -10.9 -3.3 -2.8 -1.5 Sep. 30.3 -9.9 20.4 -0.7 19.7 - -1.5 5.9 -4.3 8.1 8.3 -6.0 Oct. (p) 50.3 -26.9 23.3 19.6 42.9 - -34.5 21.4 -8.9 -4.4 -3.3 9.9
Growth rates
2012 6.4 2.1 4.5 -6.6 3.5 3.6 -1.5 5.8 -0.8 -0.6 -0.1 99.42013 5.7 -1.7 2.5 -16.2 1.0 1.2 -1.2 -0.7 -2.3 -2.3 -2.0 359.2
2014 Q2 5.4 -1.8 2.4 -8.8 1.6 1.5 -1.6 -2.5 -2.3 -1.8 -1.1 385.4 Q3 6.2 -1.6 3.0 -4.4 2.5 2.3 -1.1 -0.5 -1.9 -1.2 -0.6 333.0
2014 July 5.6 -1.8 2.5 -7.0 1.8 1.8 -1.3 -1.8 -2.0 -1.6 -1.0 412.9 Aug. 5.9 -1.7 2.7 -6.7 2.0 2.1 -1.1 -1.2 -1.9 -1.5 -0.9 379.2 Sep. 6.2 -1.6 3.0 -4.4 2.5 2.3 -1.1 -0.5 -1.9 -1.2 -0.6 333.0 Oct. (p) 6.2 -2.1 2.7 -1.0 2.5 . -1.8 -0.1 -1.7 -1.1 -0.5 305.7
C1 Monetary aggregates 1)
(annual growth rates; seasonally adjusted)
C2 Counterparts 1)
(annual growth rates; seasonally adjusted)
-5
0
5
10
15
20
2000 2002 2004 2006 2008 2010 2012 2014-5
0
5
10
15
20
M1M3
-10
-5
0
5
10
15
20
2000 2002 2004 2006 2008 2010 2012 2014-10
-5
0
5
10
15
20
longer-term financial liabilitiescredit to general governmentloans to other euro area residents
Source: ECB.1) Data refer to the changing composition of the euro area. For further information, see the General Notes.2) Monetary liabilities of MFIs and central government (post office, treasury, etc.) vis-à-vis non-MFI euro area residents excluding central government.
For definitions of M1, M2 and M3, see glossary.3) Excludes reverse repos to central counterparties as of June 2010; transactions and growth rates are adjusted for this effect.4) Values in the section ‘‘growth rates’’ are sums of the transactions during the 12 months ending in the period indicated.5) Adjustment for the derecognition of loans on the MFI balance sheet on account of their sale or securitisation.
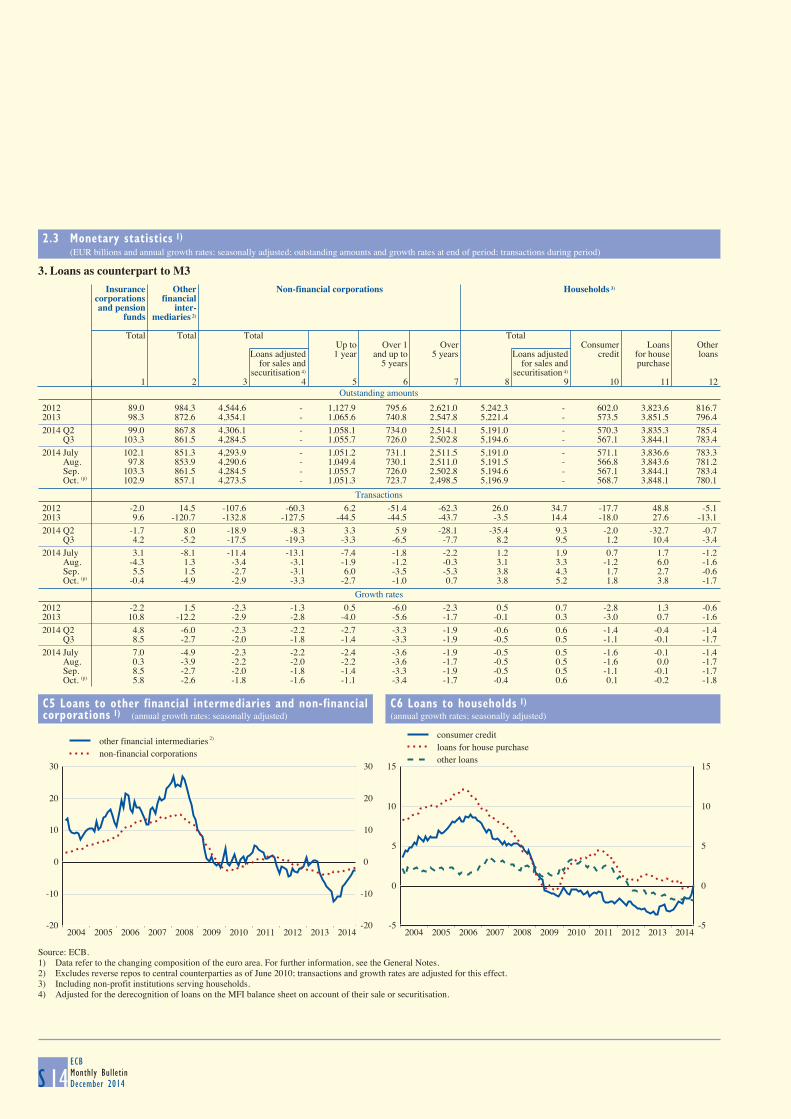
2.3 Monetary statistics 1) (EUR billions and annual growth rates; seasonally adjusted; outstanding amounts and growth rates at end of period; transactions during period)
S 14ECBMonthly BulletinDecember 2014
3. Loans as counterpart to M3
Outstanding amounts
Insurance Other Non-financial corporations Households 3)
corporations financial and pension inter-
funds mediaries 2)
Total Total Total TotalUp to Over 1 Over Consumer Loans Other
Loans adjusted 1 year and up to 5 years Loans adjusted credit for house loansfor sales and 5 years for sales and purchase
securitisation 4) securitisation 4)
1 2 3 4 5 6 7 8 9 10 11 12
2012 89.0 984.3 4,544.6 - 1,127.9 795.6 2,621.0 5,242.3 - 602.0 3,823.6 816.72013 98.3 872.6 4,354.1 - 1,065.6 740.8 2,547.8 5,221.4 - 573.5 3,851.5 796.42014 Q2 99.0 867.8 4,306.1 - 1,058.1 734.0 2,514.1 5,191.0 - 570.3 3,835.3 785.4 Q3 103.3 861.5 4,284.5 - 1,055.7 726.0 2,502.8 5,194.6 - 567.1 3,844.1 783.42014 July 102.1 851.3 4,293.9 - 1,051.2 731.1 2,511.5 5,191.0 - 571.1 3,836.6 783.3 Aug. 97.8 853.9 4,290.6 - 1,049.4 730.1 2,511.0 5,191.5 - 566.8 3,843.6 781.2 Sep. 103.3 861.5 4,284.5 - 1,055.7 726.0 2,502.8 5,194.6 - 567.1 3,844.1 783.4 Oct. (p) 102.9 857.1 4,273.5 - 1,051.3 723.7 2,498.5 5,196.9 - 568.7 3,848.1 780.1
Transactions
2012 -2.0 14.5 -107.6 -60.3 6.2 -51.4 -62.3 26.0 34.7 -17.7 48.8 -5.12013 9.6 -120.7 -132.8 -127.5 -44.5 -44.5 -43.7 -3.5 14.4 -18.0 27.6 -13.12014 Q2 -1.7 8.0 -18.9 -8.3 3.3 5.9 -28.1 -35.4 9.3 -2.0 -32.7 -0.7 Q3 4.2 -5.2 -17.5 -19.3 -3.3 -6.5 -7.7 8.2 9.5 1.2 10.4 -3.42014 July 3.1 -8.1 -11.4 -13.1 -7.4 -1.8 -2.2 1.2 1.9 0.7 1.7 -1.2 Aug. -4.3 1.3 -3.4 -3.1 -1.9 -1.2 -0.3 3.1 3.3 -1.2 6.0 -1.6 Sep. 5.5 1.5 -2.7 -3.1 6.0 -3.5 -5.3 3.8 4.3 1.7 2.7 -0.6 Oct. (p) -0.4 -4.9 -2.9 -3.3 -2.7 -1.0 0.7 3.8 5.2 1.8 3.8 -1.7
Growth rates
2012 -2.2 1.5 -2.3 -1.3 0.5 -6.0 -2.3 0.5 0.7 -2.8 1.3 -0.62013 10.8 -12.2 -2.9 -2.8 -4.0 -5.6 -1.7 -0.1 0.3 -3.0 0.7 -1.62014 Q2 4.8 -6.0 -2.3 -2.2 -2.7 -3.3 -1.9 -0.6 0.6 -1.4 -0.4 -1.4 Q3 8.5 -2.7 -2.0 -1.8 -1.4 -3.3 -1.9 -0.5 0.5 -1.1 -0.1 -1.72014 July 7.0 -4.9 -2.3 -2.2 -2.4 -3.6 -1.9 -0.5 0.5 -1.6 -0.1 -1.4 Aug. 0.3 -3.9 -2.2 -2.0 -2.2 -3.6 -1.7 -0.5 0.5 -1.6 0.0 -1.7 Sep. 8.5 -2.7 -2.0 -1.8 -1.4 -3.3 -1.9 -0.5 0.5 -1.1 -0.1 -1.7 Oct. (p) 5.8 -2.6 -1.8 -1.6 -1.1 -3.4 -1.7 -0.4 0.6 0.1 -0.2 -1.8
C5 Loans to other financial intermediaries and non-financial
corporations 1) (annual growth rates; seasonally adjusted)
C6 Loans to households 1)
(annual growth rates; seasonally adjusted)
-20
-10
0
10
20
30
2004 2005 2006 2007 2008 2009 2010 2011 2012 2013 2014-20
-10
0
10
20
30
other financial intermediariesnon-financial corporations
-5
0
5
10
15
2004 2005 2006 2007 2008 2009 2010 2011 2012 2013 2014-5
0
5
10
15
consumer creditloans for house purchaseother loans
Source: ECB.1) Data refer to the changing composition of the euro area. For further information, see the General Notes.2) Excludes reverse repos to central counterparties as of June 2010; transactions and growth rates are adjusted for this effect.3) Including non-profit institutions serving households.4) Adjusted for the derecognition of loans on the MFI balance sheet on account of their sale or securitisation.
2)
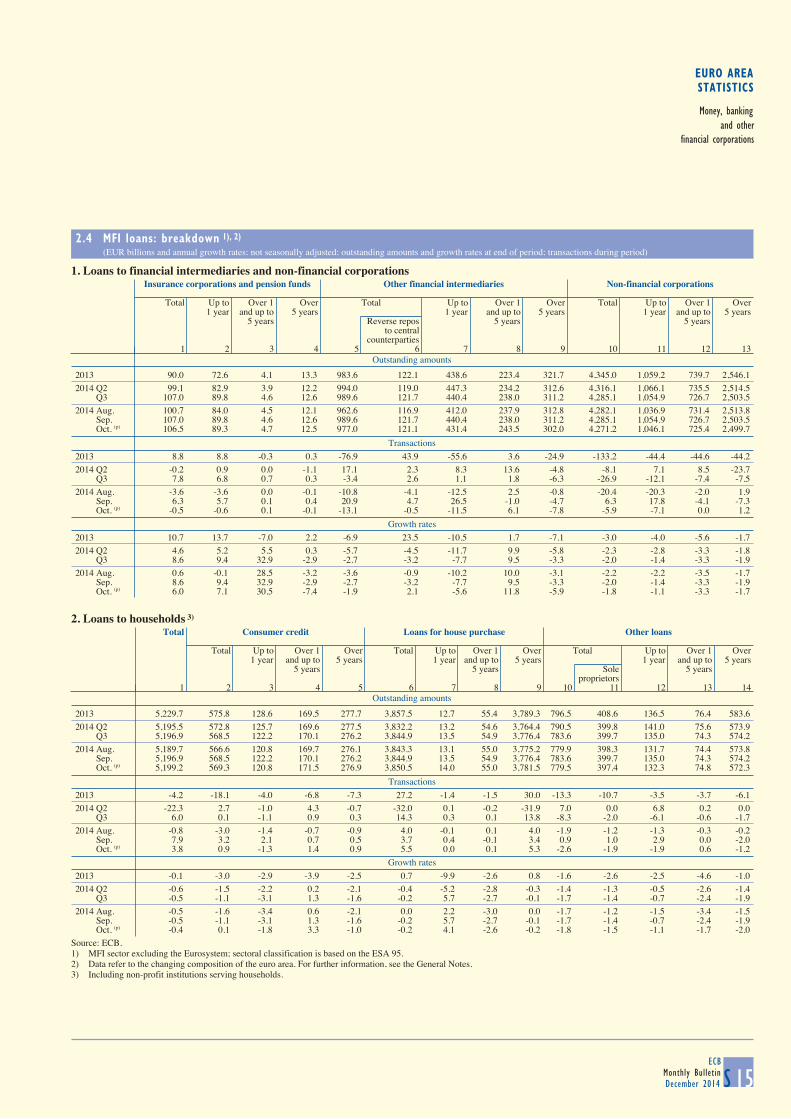
EURO AREASTATISTICS
Money, bankingand other
financial corporations
2.4 MFI loans: breakdown 1), 2) (EUR billions and annual growth rates; not seasonally adjusted; outstanding amounts and growth rates at end of period; transactions during period)
S 15ECB
Monthly BulletinDecember 2014
1. Loans to financial intermediaries and non-financial corporations
Outstanding amounts
Insurance corporations and pension funds Other financial intermediaries Non-financial corporations
Total Up to Over 1 Over Total Up to Over 1 Over Total Up to Over 1 Over
1 year and up to 5 years 1 year and up to 5 years 1 year and up to 5 years5 years Reverse repos 5 years 5 years
to centralcounterparties
1 2 3 4 5 6 7 8 9 10 11 12 13
2013 90.0 72.6 4.1 13.3 983.6 122.1 438.6 223.4 321.7 4,345.0 1,059.2 739.7 2,546.12014 Q2 99.1 82.9 3.9 12.2 994.0 119.0 447.3 234.2 312.6 4,316.1 1,066.1 735.5 2,514.5 Q3 107.0 89.8 4.6 12.6 989.6 121.7 440.4 238.0 311.2 4,285.1 1,054.9 726.7 2,503.52014 Aug. 100.7 84.0 4.5 12.1 962.6 116.9 412.0 237.9 312.8 4,282.1 1,036.9 731.4 2,513.8 Sep. 107.0 89.8 4.6 12.6 989.6 121.7 440.4 238.0 311.2 4,285.1 1,054.9 726.7 2,503.5 Oct. (p) 106.5 89.3 4.7 12.5 977.0 121.1 431.4 243.5 302.0 4,271.2 1,046.1 725.4 2,499.7
Transactions
2013 8.8 8.8 -0.3 0.3 -76.9 43.9 -55.6 3.6 -24.9 -133.2 -44.4 -44.6 -44.22014 Q2 -0.2 0.9 0.0 -1.1 17.1 2.3 8.3 13.6 -4.8 -8.1 7.1 8.5 -23.7 Q3 7.8 6.8 0.7 0.3 -3.4 2.6 1.1 1.8 -6.3 -26.9 -12.1 -7.4 -7.52014 Aug. -3.6 -3.6 0.0 -0.1 -10.8 -4.1 -12.5 2.5 -0.8 -20.4 -20.3 -2.0 1.9 Sep. 6.3 5.7 0.1 0.4 20.9 4.7 26.5 -1.0 -4.7 6.3 17.8 -4.1 -7.3 Oct. (p) -0.5 -0.6 0.1 -0.1 -13.1 -0.5 -11.5 6.1 -7.8 -5.9 -7.1 0.0 1.2
Growth rates
2013 10.7 13.7 -7.0 2.2 -6.9 23.5 -10.5 1.7 -7.1 -3.0 -4.0 -5.6 -1.72014 Q2 4.6 5.2 5.5 0.3 -5.7 -4.5 -11.7 9.9 -5.8 -2.3 -2.8 -3.3 -1.8 Q3 8.6 9.4 32.9 -2.9 -2.7 -3.2 -7.7 9.5 -3.3 -2.0 -1.4 -3.3 -1.92014 Aug. 0.6 -0.1 28.5 -3.2 -3.6 -0.9 -10.2 10.0 -3.1 -2.2 -2.2 -3.5 -1.7 Sep. 8.6 9.4 32.9 -2.9 -2.7 -3.2 -7.7 9.5 -3.3 -2.0 -1.4 -3.3 -1.9 Oct. (p) 6.0 7.1 30.5 -7.4 -1.9 2.1 -5.6 11.8 -5.9 -1.8 -1.1 -3.3 -1.7
2. Loans to households 3)
Outstanding amounts
Total Consumer credit Loans for house purchase Other loans
Total Up to Over 1 Over Total Up to Over 1 Over Total Up to Over 1 Over
1 year and up to 5 years 1 year and up to 5 years 1 year and up to 5 years5 years 5 years Sole 5 years
proprietors1 2 3 4 5 6 7 8 9 10 11 12 13 14
2013 5,229.7 575.8 128.6 169.5 277.7 3,857.5 12.7 55.4 3,789.3 796.5 408.6 136.5 76.4 583.62014 Q2 5,195.5 572.8 125.7 169.6 277.5 3,832.2 13.2 54.6 3,764.4 790.5 399.8 141.0 75.6 573.9 Q3 5,196.9 568.5 122.2 170.1 276.2 3,844.9 13.5 54.9 3,776.4 783.6 399.7 135.0 74.3 574.22014 Aug. 5,189.7 566.6 120.8 169.7 276.1 3,843.3 13.1 55.0 3,775.2 779.9 398.3 131.7 74.4 573.8 Sep. 5,196.9 568.5 122.2 170.1 276.2 3,844.9 13.5 54.9 3,776.4 783.6 399.7 135.0 74.3 574.2 Oct. (p) 5,199.2 569.3 120.8 171.5 276.9 3,850.5 14.0 55.0 3,781.5 779.5 397.4 132.3 74.8 572.3
Transactions
2013 -4.2 -18.1 -4.0 -6.8 -7.3 27.2 -1.4 -1.5 30.0 -13.3 -10.7 -3.5 -3.7 -6.12014 Q2 -22.3 2.7 -1.0 4.3 -0.7 -32.0 0.1 -0.2 -31.9 7.0 0.0 6.8 0.2 0.0 Q3 6.0 0.1 -1.1 0.9 0.3 14.3 0.3 0.1 13.8 -8.3 -2.0 -6.1 -0.6 -1.72014 Aug. -0.8 -3.0 -1.4 -0.7 -0.9 4.0 -0.1 0.1 4.0 -1.9 -1.2 -1.3 -0.3 -0.2 Sep. 7.9 3.2 2.1 0.7 0.5 3.7 0.4 -0.1 3.4 0.9 1.0 2.9 0.0 -2.0 Oct. (p) 3.8 0.9 -1.3 1.4 0.9 5.5 0.0 0.1 5.3 -2.6 -1.9 -1.9 0.6 -1.2
Growth rates
2013 -0.1 -3.0 -2.9 -3.9 -2.5 0.7 -9.9 -2.6 0.8 -1.6 -2.6 -2.5 -4.6 -1.02014 Q2 -0.6 -1.5 -2.2 0.2 -2.1 -0.4 -5.2 -2.8 -0.3 -1.4 -1.3 -0.5 -2.6 -1.4 Q3 -0.5 -1.1 -3.1 1.3 -1.6 -0.2 5.7 -2.7 -0.1 -1.7 -1.4 -0.7 -2.4 -1.92014 Aug. -0.5 -1.6 -3.4 0.6 -2.1 0.0 2.2 -3.0 0.0 -1.7 -1.2 -1.5 -3.4 -1.5 Sep. -0.5 -1.1 -3.1 1.3 -1.6 -0.2 5.7 -2.7 -0.1 -1.7 -1.4 -0.7 -2.4 -1.9 Oct. (p) -0.4 0.1 -1.8 3.3 -1.0 -0.2 4.1 -2.6 -0.2 -1.8 -1.5 -1.1 -1.7 -2.0
Source: ECB.1) MFI sector excluding the Eurosystem; sectoral classification is based on the ESA 95.2) Data refer to the changing composition of the euro area. For further information, see the General Notes.3) Including non-profit institutions serving households.
2.3 Monetary statistics 1) (EUR billions and annual growth rates; seasonally adjusted; outstanding amounts and growth rates at end of period; transactions during period)
S 14ECBMonthly BulletinDecember 2014
3. Loans as counterpart to M3
Outstanding amounts
Insurance Other Non-financial corporations Households 3)
corporations financial and pension inter-
funds mediaries 2)
Total Total Total TotalUp to Over 1 Over Consumer Loans Other
Loans adjusted 1 year and up to 5 years Loans adjusted credit for house loansfor sales and 5 years for sales and purchase
securitisation 4) securitisation 4)
1 2 3 4 5 6 7 8 9 10 11 12
2012 89.0 984.3 4,544.6 - 1,127.9 795.6 2,621.0 5,242.3 - 602.0 3,823.6 816.72013 98.3 872.6 4,354.1 - 1,065.6 740.8 2,547.8 5,221.4 - 573.5 3,851.5 796.42014 Q2 99.0 867.8 4,306.1 - 1,058.1 734.0 2,514.1 5,191.0 - 570.3 3,835.3 785.4 Q3 103.3 861.5 4,284.5 - 1,055.7 726.0 2,502.8 5,194.6 - 567.1 3,844.1 783.42014 July 102.1 851.3 4,293.9 - 1,051.2 731.1 2,511.5 5,191.0 - 571.1 3,836.6 783.3 Aug. 97.8 853.9 4,290.6 - 1,049.4 730.1 2,511.0 5,191.5 - 566.8 3,843.6 781.2 Sep. 103.3 861.5 4,284.5 - 1,055.7 726.0 2,502.8 5,194.6 - 567.1 3,844.1 783.4 Oct. (p) 102.9 857.1 4,273.5 - 1,051.3 723.7 2,498.5 5,196.9 - 568.7 3,848.1 780.1
Transactions
2012 -2.0 14.5 -107.6 -60.3 6.2 -51.4 -62.3 26.0 34.7 -17.7 48.8 -5.12013 9.6 -120.7 -132.8 -127.5 -44.5 -44.5 -43.7 -3.5 14.4 -18.0 27.6 -13.12014 Q2 -1.7 8.0 -18.9 -8.3 3.3 5.9 -28.1 -35.4 9.3 -2.0 -32.7 -0.7 Q3 4.2 -5.2 -17.5 -19.3 -3.3 -6.5 -7.7 8.2 9.5 1.2 10.4 -3.42014 July 3.1 -8.1 -11.4 -13.1 -7.4 -1.8 -2.2 1.2 1.9 0.7 1.7 -1.2 Aug. -4.3 1.3 -3.4 -3.1 -1.9 -1.2 -0.3 3.1 3.3 -1.2 6.0 -1.6 Sep. 5.5 1.5 -2.7 -3.1 6.0 -3.5 -5.3 3.8 4.3 1.7 2.7 -0.6 Oct. (p) -0.4 -4.9 -2.9 -3.3 -2.7 -1.0 0.7 3.8 5.2 1.8 3.8 -1.7
Growth rates
2012 -2.2 1.5 -2.3 -1.3 0.5 -6.0 -2.3 0.5 0.7 -2.8 1.3 -0.62013 10.8 -12.2 -2.9 -2.8 -4.0 -5.6 -1.7 -0.1 0.3 -3.0 0.7 -1.62014 Q2 4.8 -6.0 -2.3 -2.2 -2.7 -3.3 -1.9 -0.6 0.6 -1.4 -0.4 -1.4 Q3 8.5 -2.7 -2.0 -1.8 -1.4 -3.3 -1.9 -0.5 0.5 -1.1 -0.1 -1.72014 July 7.0 -4.9 -2.3 -2.2 -2.4 -3.6 -1.9 -0.5 0.5 -1.6 -0.1 -1.4 Aug. 0.3 -3.9 -2.2 -2.0 -2.2 -3.6 -1.7 -0.5 0.5 -1.6 0.0 -1.7 Sep. 8.5 -2.7 -2.0 -1.8 -1.4 -3.3 -1.9 -0.5 0.5 -1.1 -0.1 -1.7 Oct. (p) 5.8 -2.6 -1.8 -1.6 -1.1 -3.4 -1.7 -0.4 0.6 0.1 -0.2 -1.8
C5 Loans to other financial intermediaries and non-financial
corporations 1) (annual growth rates; seasonally adjusted)
C6 Loans to households 1)
(annual growth rates; seasonally adjusted)
-20
-10
0
10
20
30
2004 2005 2006 2007 2008 2009 2010 2011 2012 2013 2014-20
-10
0
10
20
30
other financial intermediariesnon-financial corporations
-5
0
5
10
15
2004 2005 2006 2007 2008 2009 2010 2011 2012 2013 2014-5
0
5
10
15
consumer creditloans for house purchaseother loans
Source: ECB.1) Data refer to the changing composition of the euro area. For further information, see the General Notes.2) Excludes reverse repos to central counterparties as of June 2010; transactions and growth rates are adjusted for this effect.3) Including non-profit institutions serving households.4) Adjusted for the derecognition of loans on the MFI balance sheet on account of their sale or securitisation.
2)
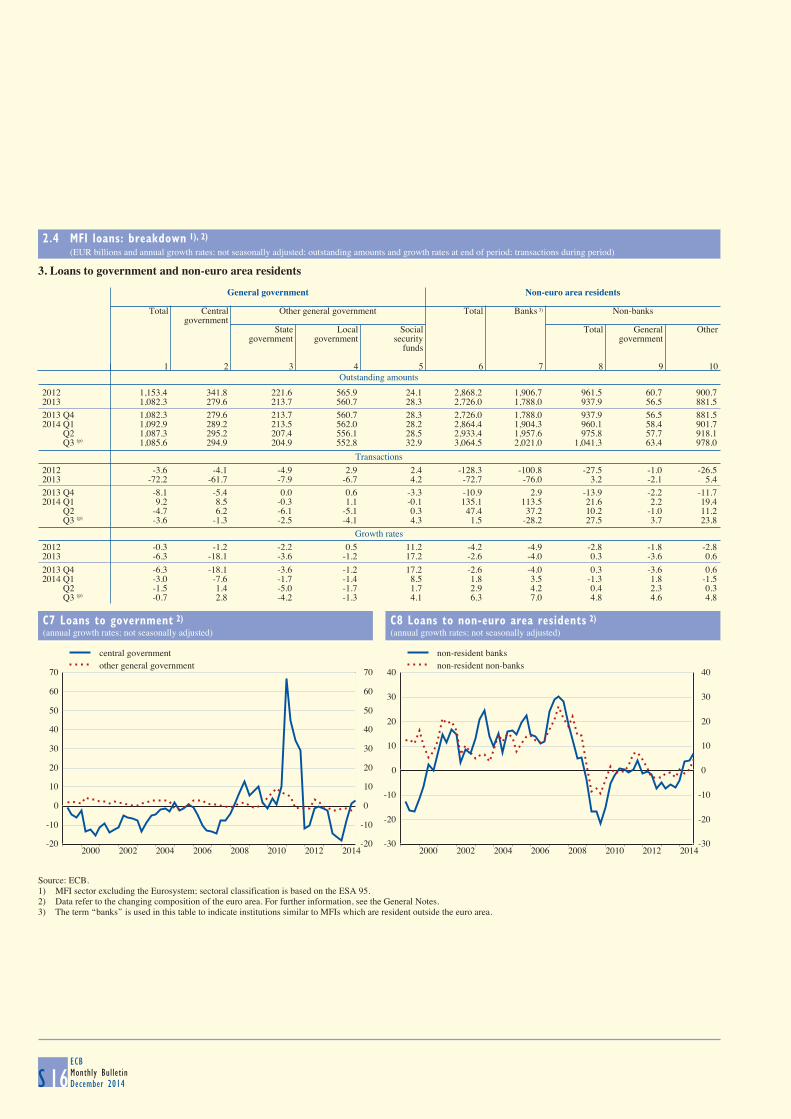
2.4 MFI loans: breakdown 1), 2) (EUR billions and annual growth rates; not seasonally adjusted; outstanding amounts and growth rates at end of period; transactions during period)
S 16ECBMonthly BulletinDecember 2014
3. Loans to government and non-euro area residents
Outstanding amounts
General government Non-euro area residents
Total Central Other general government Total Banks 3) Non-banks
governmentState Local Social Total General Other
government government security governmentfunds
1 2 3 4 5 6 7 8 9 10
2012 1,153.4 341.8 221.6 565.9 24.1 2,868.2 1,906.7 961.5 60.7 900.72013 1,082.3 279.6 213.7 560.7 28.3 2,726.0 1,788.0 937.9 56.5 881.52013 Q4 1,082.3 279.6 213.7 560.7 28.3 2,726.0 1,788.0 937.9 56.5 881.52014 Q1 1,092.9 289.2 213.5 562.0 28.2 2,864.4 1,904.3 960.1 58.4 901.7 Q2 1,087.3 295.2 207.4 556.1 28.5 2,933.4 1,957.6 975.8 57.7 918.1 Q3 (p) 1,085.6 294.9 204.9 552.8 32.9 3,064.5 2,021.0 1,041.3 63.4 978.0
Transactions
2012 -3.6 -4.1 -4.9 2.9 2.4 -128.3 -100.8 -27.5 -1.0 -26.52013 -72.2 -61.7 -7.9 -6.7 4.2 -72.7 -76.0 3.2 -2.1 5.42013 Q4 -8.1 -5.4 0.0 0.6 -3.3 -10.9 2.9 -13.9 -2.2 -11.72014 Q1 9.2 8.5 -0.3 1.1 -0.1 135.1 113.5 21.6 2.2 19.4 Q2 -4.7 6.2 -6.1 -5.1 0.3 47.4 37.2 10.2 -1.0 11.2 Q3 (p) -3.6 -1.3 -2.5 -4.1 4.3 1.5 -28.2 27.5 3.7 23.8
Growth rates
2012 -0.3 -1.2 -2.2 0.5 11.2 -4.2 -4.9 -2.8 -1.8 -2.82013 -6.3 -18.1 -3.6 -1.2 17.2 -2.6 -4.0 0.3 -3.6 0.6
2013 Q4 -6.3 -18.1 -3.6 -1.2 17.2 -2.6 -4.0 0.3 -3.6 0.62014 Q1 -3.0 -7.6 -1.7 -1.4 8.5 1.8 3.5 -1.3 1.8 -1.5 Q2 -1.5 1.4 -5.0 -1.7 1.7 2.9 4.2 0.4 2.3 0.3 Q3 (p) -0.7 2.8 -4.2 -1.3 4.1 6.3 7.0 4.8 4.6 4.8
C7 Loans to government 2)
(annual growth rates; not seasonally adjusted)
C8 Loans to non-euro area residents 2)
(annual growth rates; not seasonally adjusted)
-20
-10
0
10
20
30
40
50
60
70
2000 2002 2004 2006 2008 2010 2012 2014-20
-10
0
10
20
30
40
50
60
70
central governmentother general government
-30
-20
-10
0
10
20
30
40
2000 2002 2004 2006 2008 2010 2012 2014-30
-20
-10
0
10
20
30
40
non-resident banksnon-resident non-banks
Source: ECB.1) MFI sector excluding the Eurosystem; sectoral classification is based on the ESA 95.2) Data refer to the changing composition of the euro area. For further information, see the General Notes.3) The term ‘‘banks’’ is used in this table to indicate institutions similar to MFIs which are resident outside the euro area.
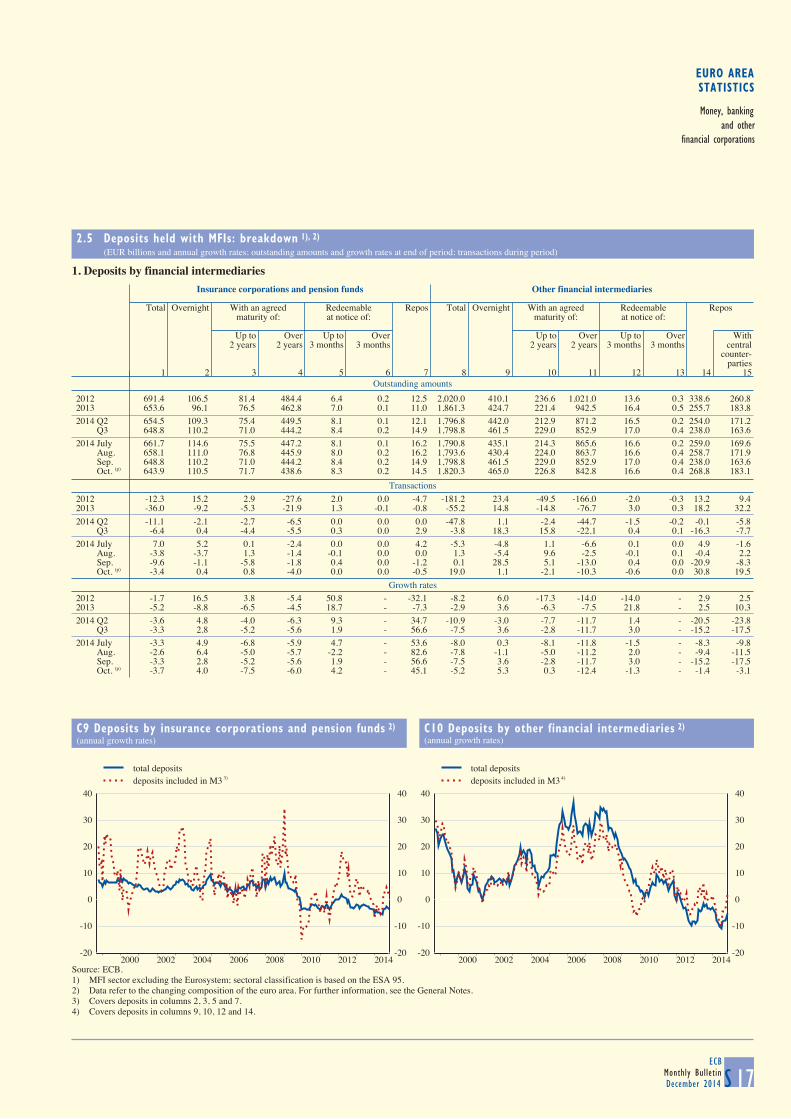
EURO AREASTATISTICS
Money, bankingand other
financial corporations
2.5 Deposits held with MFIs: breakdown 1), 2) (EUR billions and annual growth rates; outstanding amounts and growth rates at end of period; transactions during period)
S 17ECB
Monthly BulletinDecember 2014
1. Deposits by financial intermediaries
Outstanding amounts
Insurance corporations and pension funds Other financial intermediaries
Total Overnight With an agreed Redeemable Repos Total Overnight With an agreed Redeemable Repos
maturity of: at notice of: maturity of: at notice of:
Up to Over Up to Over Up to Over Up to Over With2 years 2 years 3 months 3 months 2 years 2 years 3 months 3 months central
counter-parties
1 2 3 4 5 6 7 8 9 10 11 12 13 14 15
2012 691.4 106.5 81.4 484.4 6.4 0.2 12.5 2,020.0 410.1 236.6 1,021.0 13.6 0.3 338.6 260.82013 653.6 96.1 76.5 462.8 7.0 0.1 11.0 1,861.3 424.7 221.4 942.5 16.4 0.5 255.7 183.82014 Q2 654.5 109.3 75.4 449.5 8.1 0.1 12.1 1,796.8 442.0 212.9 871.2 16.5 0.2 254.0 171.2 Q3 648.8 110.2 71.0 444.2 8.4 0.2 14.9 1,798.8 461.5 229.0 852.9 17.0 0.4 238.0 163.62014 July 661.7 114.6 75.5 447.2 8.1 0.1 16.2 1,790.8 435.1 214.3 865.6 16.6 0.2 259.0 169.6 Aug. 658.1 111.0 76.8 445.9 8.0 0.2 16.2 1,793.6 430.4 224.0 863.7 16.6 0.4 258.7 171.9 Sep. 648.8 110.2 71.0 444.2 8.4 0.2 14.9 1,798.8 461.5 229.0 852.9 17.0 0.4 238.0 163.6 Oct. (p) 643.9 110.5 71.7 438.6 8.3 0.2 14.5 1,820.3 465.0 226.8 842.8 16.6 0.4 268.8 183.1
Transactions
2012 -12.3 15.2 2.9 -27.6 2.0 0.0 -4.7 -181.2 23.4 -49.5 -166.0 -2.0 -0.3 13.2 9.42013 -36.0 -9.2 -5.3 -21.9 1.3 -0.1 -0.8 -55.2 14.8 -14.8 -76.7 3.0 0.3 18.2 32.2
2014 Q2 -11.1 -2.1 -2.7 -6.5 0.0 0.0 0.0 -47.8 1.1 -2.4 -44.7 -1.5 -0.2 -0.1 -5.8 Q3 -6.4 0.4 -4.4 -5.5 0.3 0.0 2.9 -3.8 18.3 15.8 -22.1 0.4 0.1 -16.3 -7.72014 July 7.0 5.2 0.1 -2.4 0.0 0.0 4.2 -5.3 -4.8 1.1 -6.6 0.1 0.0 4.9 -1.6 Aug. -3.8 -3.7 1.3 -1.4 -0.1 0.0 0.0 1.3 -5.4 9.6 -2.5 -0.1 0.1 -0.4 2.2 Sep. -9.6 -1.1 -5.8 -1.8 0.4 0.0 -1.2 0.1 28.5 5.1 -13.0 0.4 0.0 -20.9 -8.3 Oct. (p) -3.4 0.4 0.8 -4.0 0.0 0.0 -0.5 19.0 1.1 -2.1 -10.3 -0.6 0.0 30.8 19.5
Growth rates
2012 -1.7 16.5 3.8 -5.4 50.8 - -32.1 -8.2 6.0 -17.3 -14.0 -14.0 - 2.9 2.52013 -5.2 -8.8 -6.5 -4.5 18.7 - -7.3 -2.9 3.6 -6.3 -7.5 21.8 - 2.5 10.32014 Q2 -3.6 4.8 -4.0 -6.3 9.3 - 34.7 -10.9 -3.0 -7.7 -11.7 1.4 - -20.5 -23.8 Q3 -3.3 2.8 -5.2 -5.6 1.9 - 56.6 -7.5 3.6 -2.8 -11.7 3.0 - -15.2 -17.52014 July -3.3 4.9 -6.8 -5.9 4.7 - 53.6 -8.0 0.3 -8.1 -11.8 -1.5 - -8.3 -9.8 Aug. -2.6 6.4 -5.0 -5.7 -2.2 - 82.6 -7.8 -1.1 -5.0 -11.2 2.0 - -9.4 -11.5 Sep. -3.3 2.8 -5.2 -5.6 1.9 - 56.6 -7.5 3.6 -2.8 -11.7 3.0 - -15.2 -17.5 Oct. (p) -3.7 4.0 -7.5 -6.0 4.2 - 45.1 -5.2 5.3 0.3 -12.4 -1.3 - -1.4 -3.1
C9 Deposits by insurance corporations and pension funds 2)
(annual growth rates)
C10 Deposits by other financial intermediaries 2)
(annual growth rates)
-20
-10
0
10
20
30
40
2000 2002 2004 2006 2008 2010 2012 2014-20
-10
0
10
20
30
40
total depositsdeposits included in M3
-20
-10
0
10
20
30
40
2000 2002 2004 2006 2008 2010 2012 2014-20
-10
0
10
20
30
40
total depositsdeposits included in M3
Source: ECB.1) MFI sector excluding the Eurosystem; sectoral classification is based on the ESA 95.2) Data refer to the changing composition of the euro area. For further information, see the General Notes.3) Covers deposits in columns 2, 3, 5 and 7.4) Covers deposits in columns 9, 10, 12 and 14.
3) 4)
2.4 MFI loans: breakdown 1), 2) (EUR billions and annual growth rates; not seasonally adjusted; outstanding amounts and growth rates at end of period; transactions during period)
S 16ECBMonthly BulletinDecember 2014
3. Loans to government and non-euro area residents
Outstanding amounts
General government Non-euro area residents
Total Central Other general government Total Banks 3) Non-banks
governmentState Local Social Total General Other
government government security governmentfunds
1 2 3 4 5 6 7 8 9 10
2012 1,153.4 341.8 221.6 565.9 24.1 2,868.2 1,906.7 961.5 60.7 900.72013 1,082.3 279.6 213.7 560.7 28.3 2,726.0 1,788.0 937.9 56.5 881.52013 Q4 1,082.3 279.6 213.7 560.7 28.3 2,726.0 1,788.0 937.9 56.5 881.52014 Q1 1,092.9 289.2 213.5 562.0 28.2 2,864.4 1,904.3 960.1 58.4 901.7 Q2 1,087.3 295.2 207.4 556.1 28.5 2,933.4 1,957.6 975.8 57.7 918.1 Q3 (p) 1,085.6 294.9 204.9 552.8 32.9 3,064.5 2,021.0 1,041.3 63.4 978.0
Transactions
2012 -3.6 -4.1 -4.9 2.9 2.4 -128.3 -100.8 -27.5 -1.0 -26.52013 -72.2 -61.7 -7.9 -6.7 4.2 -72.7 -76.0 3.2 -2.1 5.42013 Q4 -8.1 -5.4 0.0 0.6 -3.3 -10.9 2.9 -13.9 -2.2 -11.72014 Q1 9.2 8.5 -0.3 1.1 -0.1 135.1 113.5 21.6 2.2 19.4 Q2 -4.7 6.2 -6.1 -5.1 0.3 47.4 37.2 10.2 -1.0 11.2 Q3 (p) -3.6 -1.3 -2.5 -4.1 4.3 1.5 -28.2 27.5 3.7 23.8
Growth rates
2012 -0.3 -1.2 -2.2 0.5 11.2 -4.2 -4.9 -2.8 -1.8 -2.82013 -6.3 -18.1 -3.6 -1.2 17.2 -2.6 -4.0 0.3 -3.6 0.6
2013 Q4 -6.3 -18.1 -3.6 -1.2 17.2 -2.6 -4.0 0.3 -3.6 0.62014 Q1 -3.0 -7.6 -1.7 -1.4 8.5 1.8 3.5 -1.3 1.8 -1.5 Q2 -1.5 1.4 -5.0 -1.7 1.7 2.9 4.2 0.4 2.3 0.3 Q3 (p) -0.7 2.8 -4.2 -1.3 4.1 6.3 7.0 4.8 4.6 4.8
C7 Loans to government 2)
(annual growth rates; not seasonally adjusted)
C8 Loans to non-euro area residents 2)
(annual growth rates; not seasonally adjusted)
-20
-10
0
10
20
30
40
50
60
70
2000 2002 2004 2006 2008 2010 2012 2014-20
-10
0
10
20
30
40
50
60
70
central governmentother general government
-30
-20
-10
0
10
20
30
40
2000 2002 2004 2006 2008 2010 2012 2014-30
-20
-10
0
10
20
30
40
non-resident banksnon-resident non-banks
Source: ECB.1) MFI sector excluding the Eurosystem; sectoral classification is based on the ESA 95.2) Data refer to the changing composition of the euro area. For further information, see the General Notes.3) The term ‘‘banks’’ is used in this table to indicate institutions similar to MFIs which are resident outside the euro area.
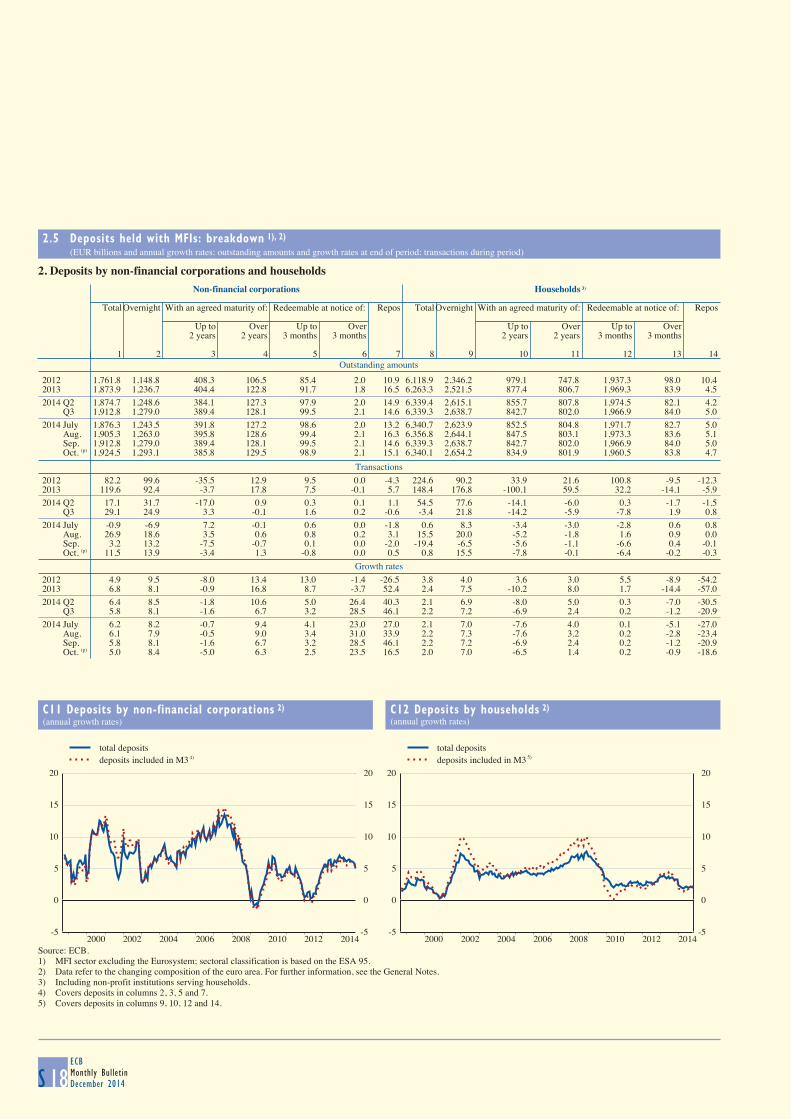
2.5 Deposits held with MFIs: breakdown 1), 2) (EUR billions and annual growth rates; outstanding amounts and growth rates at end of period; transactions during period)
S 18ECBMonthly BulletinDecember 2014
2. Deposits by non-financial corporations and households
Outstanding amounts
Non-financial corporations Households 3)
TotalOvernight With an agreed maturity of: Redeemable at notice of: Repos TotalOvernight With an agreed maturity of: Redeemable at notice of: Repos
Up to Over Up to Over Up to Over Up to Over2 years 2 years 3 months 3 months 2 years 2 years 3 months 3 months
1 2 3 4 5 6 7 8 9 10 11 12 13 14
2012 1,761.8 1,148.8 408.3 106.5 85.4 2.0 10.9 6,118.9 2,346.2 979.1 747.8 1,937.3 98.0 10.42013 1,873.9 1,236.7 404.4 122.8 91.7 1.8 16.5 6,263.3 2,521.5 877.4 806.7 1,969.3 83.9 4.52014 Q2 1,874.7 1,248.6 384.1 127.3 97.9 2.0 14.9 6,339.4 2,615.1 855.7 807.8 1,974.5 82.1 4.2 Q3 1,912.8 1,279.0 389.4 128.1 99.5 2.1 14.6 6,339.3 2,638.7 842.7 802.0 1,966.9 84.0 5.02014 July 1,876.3 1,243.5 391.8 127.2 98.6 2.0 13.2 6,340.7 2,623.9 852.5 804.8 1,971.7 82.7 5.0 Aug. 1,905.3 1,263.0 395.8 128.6 99.4 2.1 16.3 6,356.8 2,644.1 847.5 803.1 1,973.3 83.6 5.1 Sep. 1,912.8 1,279.0 389.4 128.1 99.5 2.1 14.6 6,339.3 2,638.7 842.7 802.0 1,966.9 84.0 5.0 Oct. (p) 1,924.5 1,293.1 385.8 129.5 98.9 2.1 15.1 6,340.1 2,654.2 834.9 801.9 1,960.5 83.8 4.7
Transactions
2012 82.2 99.6 -35.5 12.9 9.5 0.0 -4.3 224.6 90.2 33.9 21.6 100.8 -9.5 -12.32013 119.6 92.4 -3.7 17.8 7.5 -0.1 5.7 148.4 176.8 -100.1 59.5 32.2 -14.1 -5.92014 Q2 17.1 31.7 -17.0 0.9 0.3 0.1 1.1 54.5 77.6 -14.1 -6.0 0.3 -1.7 -1.5 Q3 29.1 24.9 3.3 -0.1 1.6 0.2 -0.6 -3.4 21.8 -14.2 -5.9 -7.8 1.9 0.82014 July -0.9 -6.9 7.2 -0.1 0.6 0.0 -1.8 0.6 8.3 -3.4 -3.0 -2.8 0.6 0.8 Aug. 26.9 18.6 3.5 0.6 0.8 0.2 3.1 15.5 20.0 -5.2 -1.8 1.6 0.9 0.0 Sep. 3.2 13.2 -7.5 -0.7 0.1 0.0 -2.0 -19.4 -6.5 -5.6 -1.1 -6.6 0.4 -0.1 Oct. (p) 11.5 13.9 -3.4 1.3 -0.8 0.0 0.5 0.8 15.5 -7.8 -0.1 -6.4 -0.2 -0.3
Growth rates
2012 4.9 9.5 -8.0 13.4 13.0 -1.4 -26.5 3.8 4.0 3.6 3.0 5.5 -8.9 -54.22013 6.8 8.1 -0.9 16.8 8.7 -3.7 52.4 2.4 7.5 -10.2 8.0 1.7 -14.4 -57.02014 Q2 6.4 8.5 -1.8 10.6 5.0 26.4 40.3 2.1 6.9 -8.0 5.0 0.3 -7.0 -30.5 Q3 5.8 8.1 -1.6 6.7 3.2 28.5 46.1 2.2 7.2 -6.9 2.4 0.2 -1.2 -20.92014 July 6.2 8.2 -0.7 9.4 4.1 23.0 27.0 2.1 7.0 -7.6 4.0 0.1 -5.1 -27.0 Aug. 6.1 7.9 -0.5 9.0 3.4 31.0 33.9 2.2 7.3 -7.6 3.2 0.2 -2.8 -23.4 Sep. 5.8 8.1 -1.6 6.7 3.2 28.5 46.1 2.2 7.2 -6.9 2.4 0.2 -1.2 -20.9 Oct. (p) 5.0 8.4 -5.0 6.3 2.5 23.5 16.5 2.0 7.0 -6.5 1.4 0.2 -0.9 -18.6
C11 Deposits by non-financial corporations 2)
(annual growth rates)
C12 Deposits by households 2)
(annual growth rates)
-5
0
5
10
15
20
2000 2002 2004 2006 2008 2010 2012 2014-5
0
5
10
15
20
total depositsdeposits included in M3
-5
0
5
10
15
20
2000 2002 2004 2006 2008 2010 2012 2014-5
0
5
10
15
20
total depositsdeposits included in M3
Source: ECB.1) MFI sector excluding the Eurosystem; sectoral classification is based on the ESA 95.2) Data refer to the changing composition of the euro area. For further information, see the General Notes.3) Including non-profit institutions serving households.4) Covers deposits in columns 2, 3, 5 and 7.5) Covers deposits in columns 9, 10, 12 and 14.
4) 5)
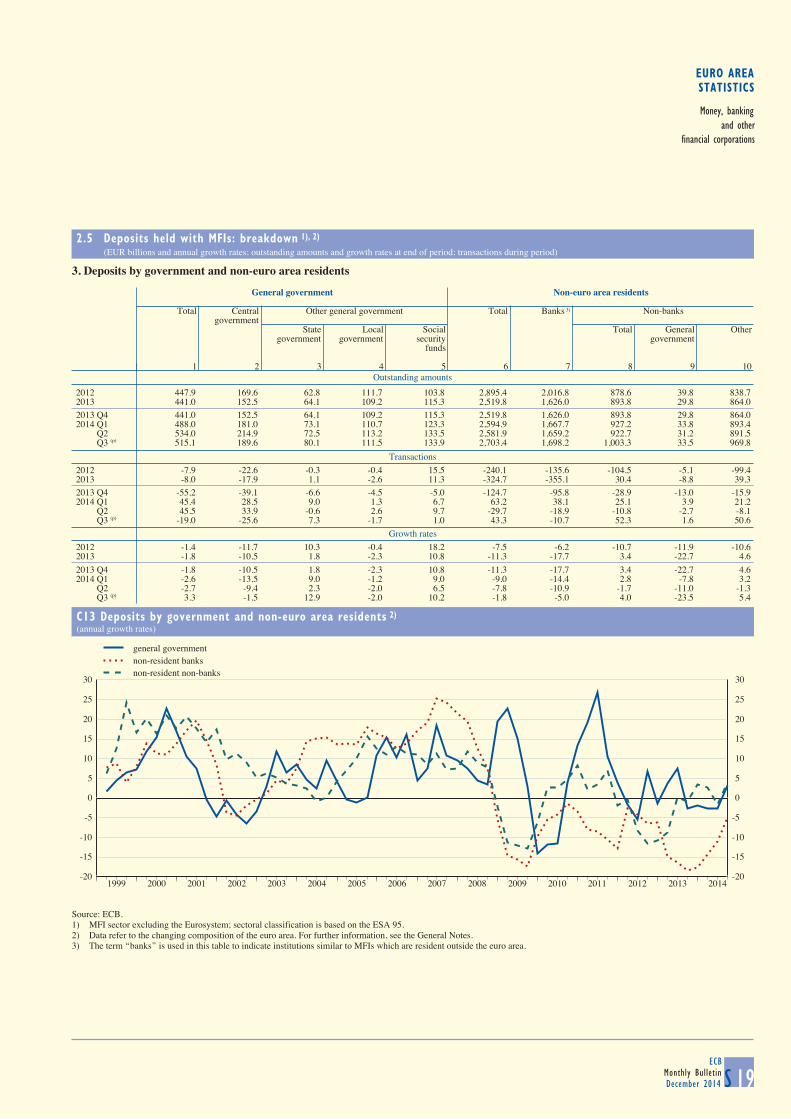
EURO AREASTATISTICS
Money, bankingand other
financial corporations
2.5 Deposits held with MFIs: breakdown 1), 2) (EUR billions and annual growth rates; outstanding amounts and growth rates at end of period; transactions during period)
S 19ECB
Monthly BulletinDecember 2014
3. Deposits by government and non-euro area residents
Outstanding amounts
General government Non-euro area residents
Total Central Other general government Total Banks 3) Non-banks
governmentState Local Social Total General Other
government government security governmentfunds
1 2 3 4 5 6 7 8 9 10
2012 447.9 169.6 62.8 111.7 103.8 2,895.4 2,016.8 878.6 39.8 838.72013 441.0 152.5 64.1 109.2 115.3 2,519.8 1,626.0 893.8 29.8 864.02013 Q4 441.0 152.5 64.1 109.2 115.3 2,519.8 1,626.0 893.8 29.8 864.02014 Q1 488.0 181.0 73.1 110.7 123.3 2,594.9 1,667.7 927.2 33.8 893.4 Q2 534.0 214.9 72.5 113.2 133.5 2,581.9 1,659.2 922.7 31.2 891.5 Q3 (p) 515.1 189.6 80.1 111.5 133.9 2,703.4 1,698.2 1,003.3 33.5 969.8
Transactions
2012 -7.9 -22.6 -0.3 -0.4 15.5 -240.1 -135.6 -104.5 -5.1 -99.42013 -8.0 -17.9 1.1 -2.6 11.3 -324.7 -355.1 30.4 -8.8 39.32013 Q4 -55.2 -39.1 -6.6 -4.5 -5.0 -124.7 -95.8 -28.9 -13.0 -15.92014 Q1 45.4 28.5 9.0 1.3 6.7 63.2 38.1 25.1 3.9 21.2 Q2 45.5 33.9 -0.6 2.6 9.7 -29.7 -18.9 -10.8 -2.7 -8.1 Q3 (p) -19.0 -25.6 7.3 -1.7 1.0 43.3 -10.7 52.3 1.6 50.6
Growth rates
2012 -1.4 -11.7 10.3 -0.4 18.2 -7.5 -6.2 -10.7 -11.9 -10.62013 -1.8 -10.5 1.8 -2.3 10.8 -11.3 -17.7 3.4 -22.7 4.6
2013 Q4 -1.8 -10.5 1.8 -2.3 10.8 -11.3 -17.7 3.4 -22.7 4.62014 Q1 -2.6 -13.5 9.0 -1.2 9.0 -9.0 -14.4 2.8 -7.8 3.2 Q2 -2.7 -9.4 2.3 -2.0 6.5 -7.8 -10.9 -1.7 -11.0 -1.3 Q3 (p) 3.3 -1.5 12.9 -2.0 10.2 -1.8 -5.0 4.0 -23.5 5.4
C13 Deposits by government and non-euro area residents 2)
(annual growth rates)
-20
-15
-10
-5
0
5
10
15
20
25
30
1999 2000 2001 2002 2003 2004 2005 2006 2007 2008 2009 2010 2011 2012 2013 2014-20
-15
-10
-5
0
5
10
15
20
25
30
general governmentnon-resident banksnon-resident non-banks
Source: ECB.1) MFI sector excluding the Eurosystem; sectoral classification is based on the ESA 95.2) Data refer to the changing composition of the euro area. For further information, see the General Notes.3) The term ‘‘banks’’ is used in this table to indicate institutions similar to MFIs which are resident outside the euro area.
2.5 Deposits held with MFIs: breakdown 1), 2) (EUR billions and annual growth rates; outstanding amounts and growth rates at end of period; transactions during period)
S 18ECBMonthly BulletinDecember 2014
2. Deposits by non-financial corporations and households
Outstanding amounts
Non-financial corporations Households 3)
TotalOvernight With an agreed maturity of: Redeemable at notice of: Repos TotalOvernight With an agreed maturity of: Redeemable at notice of: Repos
Up to Over Up to Over Up to Over Up to Over2 years 2 years 3 months 3 months 2 years 2 years 3 months 3 months
1 2 3 4 5 6 7 8 9 10 11 12 13 14
2012 1,761.8 1,148.8 408.3 106.5 85.4 2.0 10.9 6,118.9 2,346.2 979.1 747.8 1,937.3 98.0 10.42013 1,873.9 1,236.7 404.4 122.8 91.7 1.8 16.5 6,263.3 2,521.5 877.4 806.7 1,969.3 83.9 4.52014 Q2 1,874.7 1,248.6 384.1 127.3 97.9 2.0 14.9 6,339.4 2,615.1 855.7 807.8 1,974.5 82.1 4.2 Q3 1,912.8 1,279.0 389.4 128.1 99.5 2.1 14.6 6,339.3 2,638.7 842.7 802.0 1,966.9 84.0 5.02014 July 1,876.3 1,243.5 391.8 127.2 98.6 2.0 13.2 6,340.7 2,623.9 852.5 804.8 1,971.7 82.7 5.0 Aug. 1,905.3 1,263.0 395.8 128.6 99.4 2.1 16.3 6,356.8 2,644.1 847.5 803.1 1,973.3 83.6 5.1 Sep. 1,912.8 1,279.0 389.4 128.1 99.5 2.1 14.6 6,339.3 2,638.7 842.7 802.0 1,966.9 84.0 5.0 Oct. (p) 1,924.5 1,293.1 385.8 129.5 98.9 2.1 15.1 6,340.1 2,654.2 834.9 801.9 1,960.5 83.8 4.7
Transactions
2012 82.2 99.6 -35.5 12.9 9.5 0.0 -4.3 224.6 90.2 33.9 21.6 100.8 -9.5 -12.32013 119.6 92.4 -3.7 17.8 7.5 -0.1 5.7 148.4 176.8 -100.1 59.5 32.2 -14.1 -5.92014 Q2 17.1 31.7 -17.0 0.9 0.3 0.1 1.1 54.5 77.6 -14.1 -6.0 0.3 -1.7 -1.5 Q3 29.1 24.9 3.3 -0.1 1.6 0.2 -0.6 -3.4 21.8 -14.2 -5.9 -7.8 1.9 0.82014 July -0.9 -6.9 7.2 -0.1 0.6 0.0 -1.8 0.6 8.3 -3.4 -3.0 -2.8 0.6 0.8 Aug. 26.9 18.6 3.5 0.6 0.8 0.2 3.1 15.5 20.0 -5.2 -1.8 1.6 0.9 0.0 Sep. 3.2 13.2 -7.5 -0.7 0.1 0.0 -2.0 -19.4 -6.5 -5.6 -1.1 -6.6 0.4 -0.1 Oct. (p) 11.5 13.9 -3.4 1.3 -0.8 0.0 0.5 0.8 15.5 -7.8 -0.1 -6.4 -0.2 -0.3
Growth rates
2012 4.9 9.5 -8.0 13.4 13.0 -1.4 -26.5 3.8 4.0 3.6 3.0 5.5 -8.9 -54.22013 6.8 8.1 -0.9 16.8 8.7 -3.7 52.4 2.4 7.5 -10.2 8.0 1.7 -14.4 -57.02014 Q2 6.4 8.5 -1.8 10.6 5.0 26.4 40.3 2.1 6.9 -8.0 5.0 0.3 -7.0 -30.5 Q3 5.8 8.1 -1.6 6.7 3.2 28.5 46.1 2.2 7.2 -6.9 2.4 0.2 -1.2 -20.92014 July 6.2 8.2 -0.7 9.4 4.1 23.0 27.0 2.1 7.0 -7.6 4.0 0.1 -5.1 -27.0 Aug. 6.1 7.9 -0.5 9.0 3.4 31.0 33.9 2.2 7.3 -7.6 3.2 0.2 -2.8 -23.4 Sep. 5.8 8.1 -1.6 6.7 3.2 28.5 46.1 2.2 7.2 -6.9 2.4 0.2 -1.2 -20.9 Oct. (p) 5.0 8.4 -5.0 6.3 2.5 23.5 16.5 2.0 7.0 -6.5 1.4 0.2 -0.9 -18.6
C11 Deposits by non-financial corporations 2)
(annual growth rates)
C12 Deposits by households 2)
(annual growth rates)
-5
0
5
10
15
20
2000 2002 2004 2006 2008 2010 2012 2014-5
0
5
10
15
20
total depositsdeposits included in M3
-5
0
5
10
15
20
2000 2002 2004 2006 2008 2010 2012 2014-5
0
5
10
15
20
total depositsdeposits included in M3
Source: ECB.1) MFI sector excluding the Eurosystem; sectoral classification is based on the ESA 95.2) Data refer to the changing composition of the euro area. For further information, see the General Notes.3) Including non-profit institutions serving households.4) Covers deposits in columns 2, 3, 5 and 7.5) Covers deposits in columns 9, 10, 12 and 14.
4) 5)
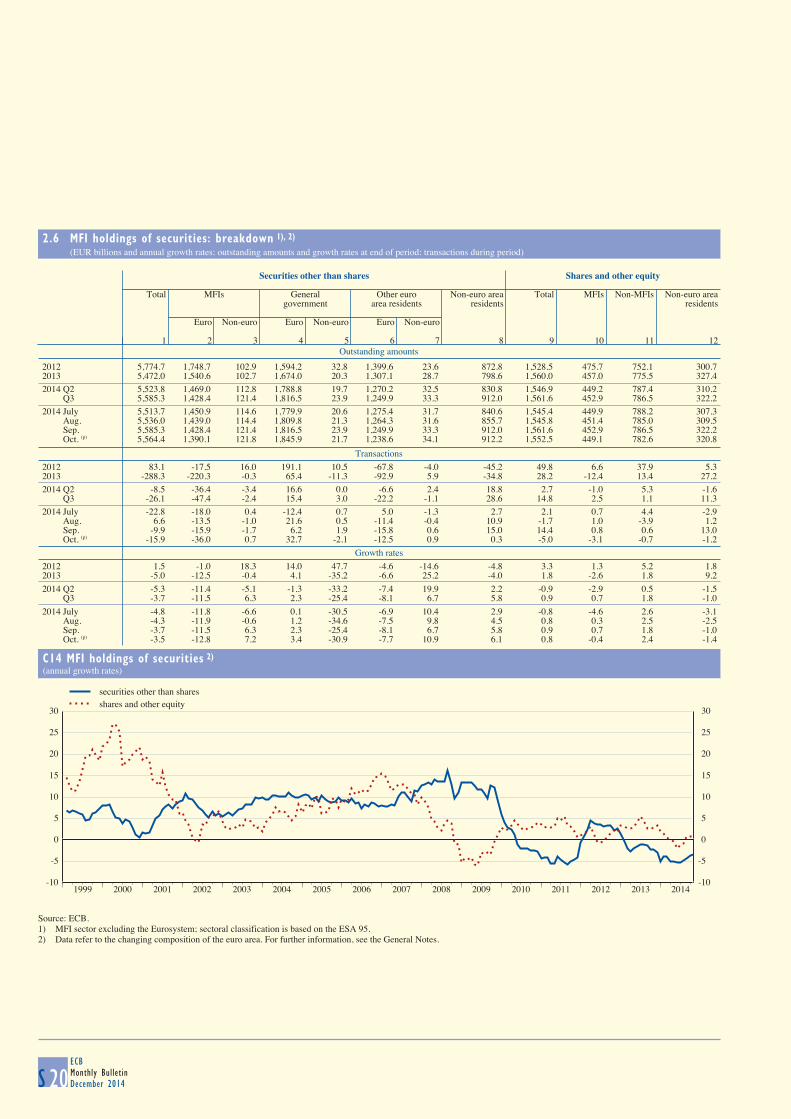
2.6 MFI holdings of securities: breakdown 1), 2) (EUR billions and annual growth rates; outstanding amounts and growth rates at end of period; transactions during period)
S 20ECBMonthly BulletinDecember 2014
Outstanding amounts
Securities other than shares Shares and other equity
Total MFIs General Other euro Non-euro area Total MFIs Non-MFIs Non-euro area
government area residents residents residents
Euro Non-euro Euro Non-euro Euro Non-euro
1 2 3 4 5 6 7 8 9 10 11 12
2012 5,774.7 1,748.7 102.9 1,594.2 32.8 1,399.6 23.6 872.8 1,528.5 475.7 752.1 300.72013 5,472.0 1,540.6 102.7 1,674.0 20.3 1,307.1 28.7 798.6 1,560.0 457.0 775.5 327.42014 Q2 5,523.8 1,469.0 112.8 1,788.8 19.7 1,270.2 32.5 830.8 1,546.9 449.2 787.4 310.2 Q3 5,585.3 1,428.4 121.4 1,816.5 23.9 1,249.9 33.3 912.0 1,561.6 452.9 786.5 322.22014 July 5,513.7 1,450.9 114.6 1,779.9 20.6 1,275.4 31.7 840.6 1,545.4 449.9 788.2 307.3 Aug. 5,536.0 1,439.0 114.4 1,809.8 21.3 1,264.3 31.6 855.7 1,545.8 451.4 785.0 309.5 Sep. 5,585.3 1,428.4 121.4 1,816.5 23.9 1,249.9 33.3 912.0 1,561.6 452.9 786.5 322.2 Oct. (p) 5,564.4 1,390.1 121.8 1,845.9 21.7 1,238.6 34.1 912.2 1,552.5 449.1 782.6 320.8
Transactions
2012 83.1 -17.5 16.0 191.1 10.5 -67.8 -4.0 -45.2 49.8 6.6 37.9 5.32013 -288.3 -220.3 -0.3 65.4 -11.3 -92.9 5.9 -34.8 28.2 -12.4 13.4 27.22014 Q2 -8.5 -36.4 -3.4 16.6 0.0 -6.6 2.4 18.8 2.7 -1.0 5.3 -1.6 Q3 -26.1 -47.4 -2.4 15.4 3.0 -22.2 -1.1 28.6 14.8 2.5 1.1 11.32014 July -22.8 -18.0 0.4 -12.4 0.7 5.0 -1.3 2.7 2.1 0.7 4.4 -2.9 Aug. 6.6 -13.5 -1.0 21.6 0.5 -11.4 -0.4 10.9 -1.7 1.0 -3.9 1.2 Sep. -9.9 -15.9 -1.7 6.2 1.9 -15.8 0.6 15.0 14.4 0.8 0.6 13.0 Oct. (p) -15.9 -36.0 0.7 32.7 -2.1 -12.5 0.9 0.3 -5.0 -3.1 -0.7 -1.2
Growth rates
2012 1.5 -1.0 18.3 14.0 47.7 -4.6 -14.6 -4.8 3.3 1.3 5.2 1.82013 -5.0 -12.5 -0.4 4.1 -35.2 -6.6 25.2 -4.0 1.8 -2.6 1.8 9.2
2014 Q2 -5.3 -11.4 -5.1 -1.3 -33.2 -7.4 19.9 2.2 -0.9 -2.9 0.5 -1.5 Q3 -3.7 -11.5 6.3 2.3 -25.4 -8.1 6.7 5.8 0.9 0.7 1.8 -1.0
2014 July -4.8 -11.8 -6.6 0.1 -30.5 -6.9 10.4 2.9 -0.8 -4.6 2.6 -3.1 Aug. -4.3 -11.9 -0.6 1.2 -34.6 -7.5 9.8 4.5 0.8 0.3 2.5 -2.5 Sep. -3.7 -11.5 6.3 2.3 -25.4 -8.1 6.7 5.8 0.9 0.7 1.8 -1.0 Oct. (p) -3.5 -12.8 7.2 3.4 -30.9 -7.7 10.9 6.1 0.8 -0.4 2.4 -1.4
C14 MFI holdings of securities 2)
(annual growth rates)
-10
-5
0
5
10
15
20
25
30
1999 2000 2001 2002 2003 2004 2005 2006 2007 2008 2009 2010 2011 2012 2013 2014-10
-5
0
5
10
15
20
25
30
securities other than sharesshares and other equity
Source: ECB.1) MFI sector excluding the Eurosystem; sectoral classification is based on the ESA 95.2) Data refer to the changing composition of the euro area. For further information, see the General Notes.

EURO AREASTATISTICS
Money, bankingand other
financial corporations
2.7 Currency breakdown of selected MFI balance sheet items 1), 2) (percentages of total; outstanding amounts in EUR billions; end of period)
S 21ECB
Monthly BulletinDecember 2014
1. Loans, holdings of securities other than shares, and deposits
Loans
MFIs 3) Non-MFIs
All Euro 4) Non-euro currencies All Euro 4) Non-euro currencies
currencies currencies (outstanding Total (outstanding Total
amount) amount)USD JPY CHF GBP USD JPY CHF GBP
1 2 3 4 5 6 7 8 9 10 11 12 13 14
To euro area residents
2012 5,790.4 - - - - - - 12,196.7 96.4 3.6 1.7 0.2 0.9 0.52013 5,250.6 - - - - - - 11,730.7 96.8 3.2 1.7 0.1 0.9 0.42014 Q2 5,195.3 - - - - - - 11,692.0 96.7 3.3 1.8 0.1 0.9 0.4 Q3 (p) 5,155.4 - - - - - - 11,664.2 96.6 3.4 1.9 0.1 0.8 0.3
To non-euro area residents
2012 1,906.7 47.3 52.7 31.9 1.9 3.5 10.1 961.5 40.1 59.9 38.2 2.0 2.9 9.92013 1,788.0 41.0 59.0 38.7 1.8 3.4 9.5 937.9 40.2 59.8 38.1 3.0 2.7 9.32014 Q2 1,957.6 38.5 61.5 40.1 2.7 3.9 9.3 975.8 39.8 60.2 37.3 3.6 2.5 9.7 Q3 (p) 2,021.0 37.1 62.9 42.0 3.0 3.3 9.3 1,041.3 37.9 62.1 37.8 5.3 2.5 9.8
Holdings of securities other than shares
Issued by euro area residents
2012 1,851.6 94.4 5.6 2.7 0.1 0.4 2.0 3,050.3 98.1 1.9 1.2 0.1 0.1 0.42013 1,643.3 93.7 6.3 2.6 0.1 0.3 2.8 3,030.1 98.4 1.6 0.8 0.2 0.1 0.52014 Q2 1,581.8 92.9 7.1 2.8 0.1 0.3 3.4 3,111.2 98.3 1.7 0.9 0.1 0.1 0.5 Q3 (p) 1,549.8 92.2 7.8 3.2 0.1 0.3 3.7 3,123.5 98.2 1.8 1.0 0.1 0.1 0.5
Issued by non-euro area residents
2012 434.0 54.9 45.1 19.8 0.3 0.3 19.1 438.8 34.1 65.9 39.1 5.4 0.9 11.82013 421.9 52.4 47.6 20.2 0.2 0.5 20.0 376.7 38.2 61.8 37.5 4.1 1.0 10.72014 Q2 432.5 52.6 47.4 21.2 0.3 0.5 20.0 398.3 37.7 62.3 38.3 4.8 0.8 10.0 Q3 (p) 487.1 50.9 49.1 23.2 0.2 0.4 20.6 424.9 35.5 64.5 40.5 4.6 0.7 10.7
Deposits
By euro area residents
2012 6,155.3 93.8 6.2 3.9 0.2 1.1 0.6 11,040.0 97.0 3.0 2.0 0.1 0.1 0.42013 5,553.1 93.4 6.6 4.2 0.2 1.0 0.7 11,093.0 96.8 3.2 2.2 0.1 0.1 0.42014 Q2 5,525.9 92.8 7.2 4.6 0.2 1.0 0.8 11,199.4 96.7 3.3 2.2 0.1 0.1 0.4 Q3 (p) 5,433.8 92.2 7.8 5.0 0.2 1.0 0.9 11,214.9 96.6 3.4 2.3 0.1 0.1 0.4
By non-euro area residents
2012 2,016.8 58.3 41.7 27.7 1.6 1.0 7.3 878.6 52.4 47.6 31.3 1.9 1.1 6.32013 1,626.0 51.3 48.7 33.1 1.7 1.5 7.8 893.8 53.9 46.1 29.7 2.1 1.2 6.42014 Q2 1,659.2 49.5 50.5 35.4 2.0 1.6 7.4 922.7 52.0 48.0 30.3 2.6 1.1 7.3 Q3 (p) 1,698.2 47.8 52.2 36.2 2.5 1.6 7.6 1,003.3 50.6 49.4 31.2 3.6 1.0 7.3
2. Debt securities issued by euro area MFIs
All Euro 4) Non-euro currencies
currencies (outstanding Total
amount)USD JPY CHF GBP
1 2 3 4 5 6 72012 5,068.0 81.8 18.2 9.6 1.6 1.9 2.52013 4,582.7 81.0 19.0 10.7 1.3 1.8 2.72014 Q2 4,493.7 79.6 20.4 11.6 1.2 1.8 3.0 Q3 (p) 4,465.2 78.2 21.8 12.6 1.3 1.8 3.1
Source: ECB.1) MFI sector excluding the Eurosystem; sectoral classification is based on the ESA 95.2) Data refer to the changing composition of the euro area. For further information, see the General Notes.3) For non-euro area residents, the term ‘‘MFIs’’ refers to institutions similar to euro area MFIs.4) Including items expressed in the national denominations of the euro.
2.6 MFI holdings of securities: breakdown 1), 2) (EUR billions and annual growth rates; outstanding amounts and growth rates at end of period; transactions during period)
S 20ECBMonthly BulletinDecember 2014
Outstanding amounts
Securities other than shares Shares and other equity
Total MFIs General Other euro Non-euro area Total MFIs Non-MFIs Non-euro area
government area residents residents residents
Euro Non-euro Euro Non-euro Euro Non-euro
1 2 3 4 5 6 7 8 9 10 11 12
2012 5,774.7 1,748.7 102.9 1,594.2 32.8 1,399.6 23.6 872.8 1,528.5 475.7 752.1 300.72013 5,472.0 1,540.6 102.7 1,674.0 20.3 1,307.1 28.7 798.6 1,560.0 457.0 775.5 327.42014 Q2 5,523.8 1,469.0 112.8 1,788.8 19.7 1,270.2 32.5 830.8 1,546.9 449.2 787.4 310.2 Q3 5,585.3 1,428.4 121.4 1,816.5 23.9 1,249.9 33.3 912.0 1,561.6 452.9 786.5 322.22014 July 5,513.7 1,450.9 114.6 1,779.9 20.6 1,275.4 31.7 840.6 1,545.4 449.9 788.2 307.3 Aug. 5,536.0 1,439.0 114.4 1,809.8 21.3 1,264.3 31.6 855.7 1,545.8 451.4 785.0 309.5 Sep. 5,585.3 1,428.4 121.4 1,816.5 23.9 1,249.9 33.3 912.0 1,561.6 452.9 786.5 322.2 Oct. (p) 5,564.4 1,390.1 121.8 1,845.9 21.7 1,238.6 34.1 912.2 1,552.5 449.1 782.6 320.8
Transactions
2012 83.1 -17.5 16.0 191.1 10.5 -67.8 -4.0 -45.2 49.8 6.6 37.9 5.32013 -288.3 -220.3 -0.3 65.4 -11.3 -92.9 5.9 -34.8 28.2 -12.4 13.4 27.22014 Q2 -8.5 -36.4 -3.4 16.6 0.0 -6.6 2.4 18.8 2.7 -1.0 5.3 -1.6 Q3 -26.1 -47.4 -2.4 15.4 3.0 -22.2 -1.1 28.6 14.8 2.5 1.1 11.32014 July -22.8 -18.0 0.4 -12.4 0.7 5.0 -1.3 2.7 2.1 0.7 4.4 -2.9 Aug. 6.6 -13.5 -1.0 21.6 0.5 -11.4 -0.4 10.9 -1.7 1.0 -3.9 1.2 Sep. -9.9 -15.9 -1.7 6.2 1.9 -15.8 0.6 15.0 14.4 0.8 0.6 13.0 Oct. (p) -15.9 -36.0 0.7 32.7 -2.1 -12.5 0.9 0.3 -5.0 -3.1 -0.7 -1.2
Growth rates
2012 1.5 -1.0 18.3 14.0 47.7 -4.6 -14.6 -4.8 3.3 1.3 5.2 1.82013 -5.0 -12.5 -0.4 4.1 -35.2 -6.6 25.2 -4.0 1.8 -2.6 1.8 9.2
2014 Q2 -5.3 -11.4 -5.1 -1.3 -33.2 -7.4 19.9 2.2 -0.9 -2.9 0.5 -1.5 Q3 -3.7 -11.5 6.3 2.3 -25.4 -8.1 6.7 5.8 0.9 0.7 1.8 -1.0
2014 July -4.8 -11.8 -6.6 0.1 -30.5 -6.9 10.4 2.9 -0.8 -4.6 2.6 -3.1 Aug. -4.3 -11.9 -0.6 1.2 -34.6 -7.5 9.8 4.5 0.8 0.3 2.5 -2.5 Sep. -3.7 -11.5 6.3 2.3 -25.4 -8.1 6.7 5.8 0.9 0.7 1.8 -1.0 Oct. (p) -3.5 -12.8 7.2 3.4 -30.9 -7.7 10.9 6.1 0.8 -0.4 2.4 -1.4
C14 MFI holdings of securities 2)
(annual growth rates)
-10
-5
0
5
10
15
20
25
30
1999 2000 2001 2002 2003 2004 2005 2006 2007 2008 2009 2010 2011 2012 2013 2014-10
-5
0
5
10
15
20
25
30
securities other than sharesshares and other equity
Source: ECB.1) MFI sector excluding the Eurosystem; sectoral classification is based on the ESA 95.2) Data refer to the changing composition of the euro area. For further information, see the General Notes.
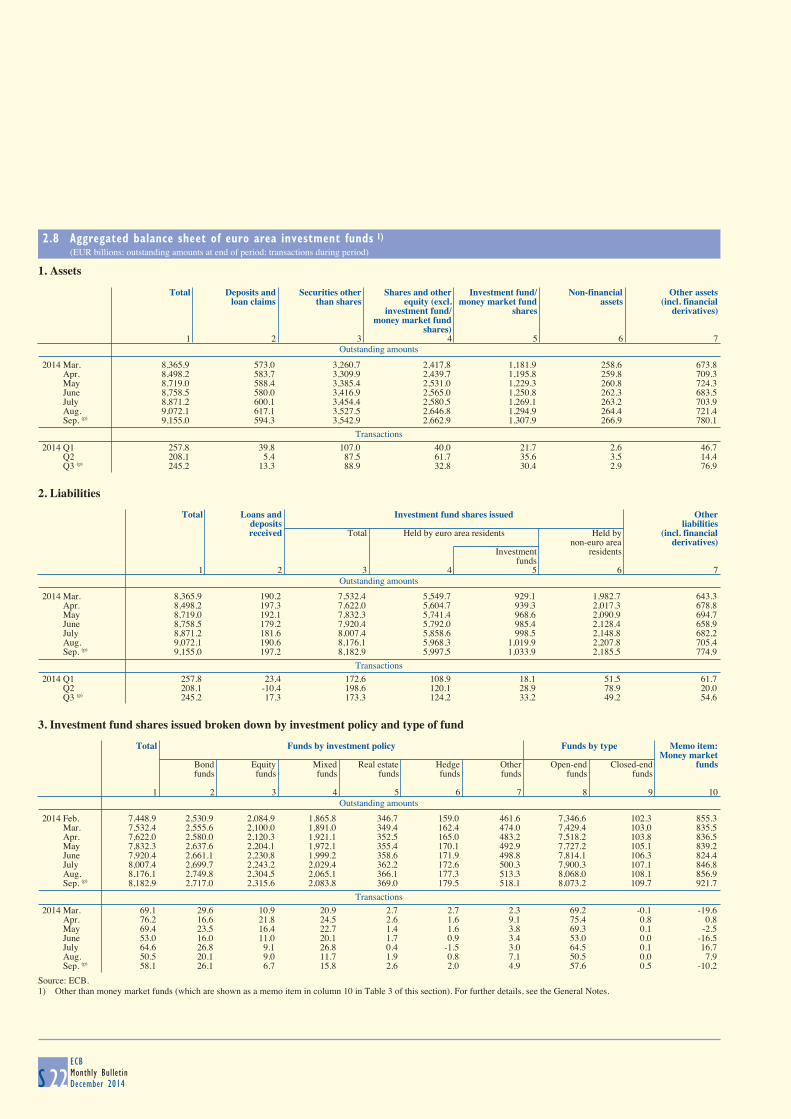
2.8 Aggregated balance sheet of euro area investment funds 1) (EUR billions; outstanding amounts at end of period; transactions during period)
S 22ECBMonthly BulletinDecember 2014
1. Assets
Outstanding amounts
Total Deposits and Securities other Shares and other Investment fund/ Non-financial Other assetsloan claims than shares equity (excl. money market fund assets (incl. financial
investment fund/ shares derivatives)money market fund
shares)1 2 3 4 5 6 7
2014 Mar. 8,365.9 573.0 3,260.7 2,417.8 1,181.9 258.6 673.8 Apr. 8,498.2 583.7 3,309.9 2,439.7 1,195.8 259.8 709.3 May 8,719.0 588.4 3,385.4 2,531.0 1,229.3 260.8 724.3 June 8,758.5 580.0 3,416.9 2,565.0 1,250.8 262.3 683.5 July 8,871.2 600.1 3,454.4 2,580.5 1,269.1 263.2 703.9 Aug. 9,072.1 617.1 3,527.5 2,646.8 1,294.9 264.4 721.4 Sep. (p) 9,155.0 594.3 3,542.9 2,662.9 1,307.9 266.9 780.1
Transactions
2014 Q1 257.8 39.8 107.0 40.0 21.7 2.6 46.7 Q2 208.1 5.4 87.5 61.7 35.6 3.5 14.4 Q3 (p) 245.2 13.3 88.9 32.8 30.4 2.9 76.9
2. Liabilities
Outstanding amounts
Total Loans and Investment fund shares issued Other
deposits liabilitiesreceived Total Held by euro area residents Held by (incl. financial
non-euro area derivatives)Investment residents
funds1 2 3 4 5 6 7
2014 Mar. 8,365.9 190.2 7,532.4 5,549.7 929.1 1,982.7 643.3 Apr. 8,498.2 197.3 7,622.0 5,604.7 939.3 2,017.3 678.8 May 8,719.0 192.1 7,832.3 5,741.4 968.6 2,090.9 694.7 June 8,758.5 179.2 7,920.4 5,792.0 985.4 2,128.4 658.9 July 8,871.2 181.6 8,007.4 5,858.6 998.5 2,148.8 682.2 Aug. 9,072.1 190.6 8,176.1 5,968.3 1,019.9 2,207.8 705.4 Sep. (p) 9,155.0 197.2 8,182.9 5,997.5 1,033.9 2,185.5 774.9
Transactions
2014 Q1 257.8 23.4 172.6 108.9 18.1 51.5 61.7 Q2 208.1 -10.4 198.6 120.1 28.9 78.9 20.0 Q3 (p) 245.2 17.3 173.3 124.2 33.2 49.2 54.6
3. Investment fund shares issued broken down by investment policy and type of fund
Outstanding amounts
Total Funds by investment policy Funds by type Memo item:
Money marketBond Equity Mixed Real estate Hedge Other Open-end Closed-end fundsfunds funds funds funds funds funds funds funds
1 2 3 4 5 6 7 8 9 10
2014 Feb. 7,448.9 2,530.9 2,084.9 1,865.8 346.7 159.0 461.6 7,346.6 102.3 855.3 Mar. 7,532.4 2,555.6 2,100.0 1,891.0 349.4 162.4 474.0 7,429.4 103.0 835.5 Apr. 7,622.0 2,580.0 2,120.3 1,921.1 352.5 165.0 483.2 7,518.2 103.8 836.5 May 7,832.3 2,637.6 2,204.1 1,972.1 355.4 170.1 492.9 7,727.2 105.1 839.2 June 7,920.4 2,661.1 2,230.8 1,999.2 358.6 171.9 498.8 7,814.1 106.3 824.4 July 8,007.4 2,699.7 2,243.2 2,029.4 362.2 172.6 500.3 7,900.3 107.1 846.8 Aug. 8,176.1 2,749.8 2,304.5 2,065.1 366.1 177.3 513.3 8,068.0 108.1 856.9 Sep. (p) 8,182.9 2,717.0 2,315.6 2,083.8 369.0 179.5 518.1 8,073.2 109.7 921.7
Transactions
2014 Mar. 69.1 29.6 10.9 20.9 2.7 2.7 2.3 69.2 -0.1 -19.6 Apr. 76.2 16.6 21.8 24.5 2.6 1.6 9.1 75.4 0.8 0.8 May 69.4 23.5 16.4 22.7 1.4 1.6 3.8 69.3 0.1 -2.5 June 53.0 16.0 11.0 20.1 1.7 0.9 3.4 53.0 0.0 -16.5 July 64.6 26.8 9.1 26.8 0.4 -1.5 3.0 64.5 0.1 16.7 Aug. 50.5 20.1 9.0 11.7 1.9 0.8 7.1 50.5 0.0 7.9 Sep. (p) 58.1 26.1 6.7 15.8 2.6 2.0 4.9 57.6 0.5 -10.2
Source: ECB.1) Other than money market funds (which are shown as a memo item in column 10 in Table 3 of this section). For further details, see the General Notes.
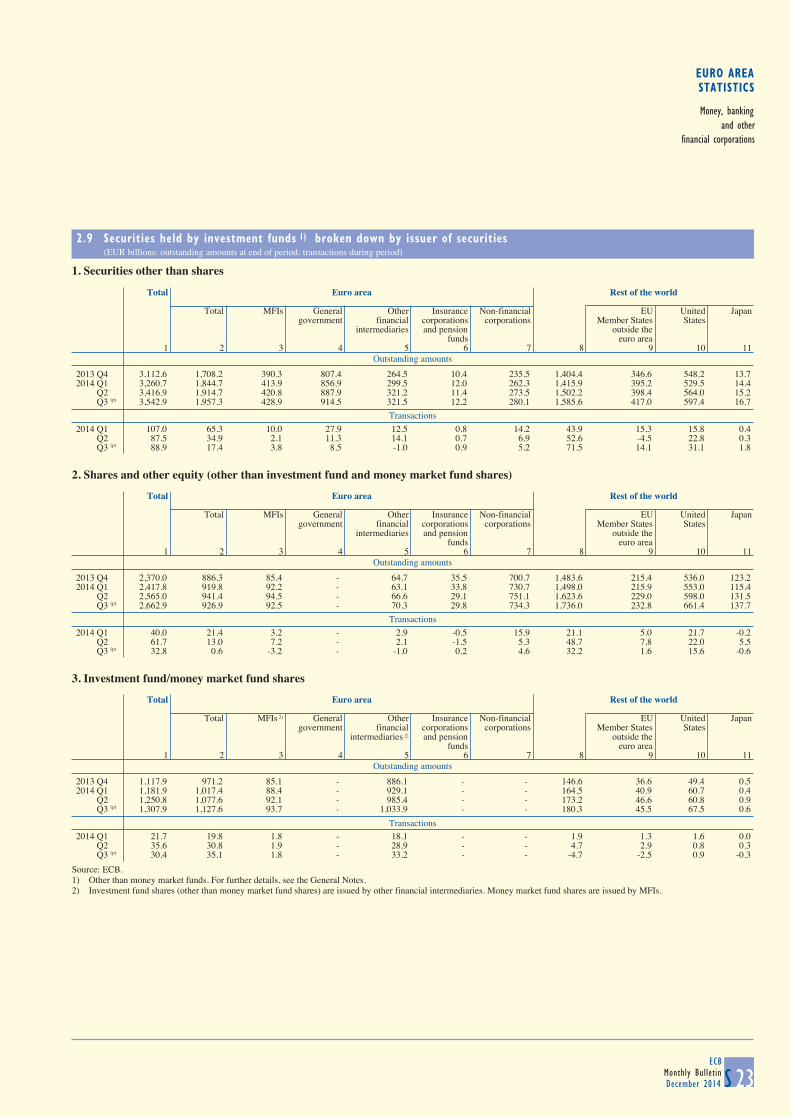
EURO AREASTATISTICS
Money, bankingand other
financial corporations
2.9 Securities held by investment funds 1) broken down by issuer of securities (EUR billions; outstanding amounts at end of period; transactions during period)
S 23ECB
Monthly BulletinDecember 2014
1. Securities other than shares
Outstanding amounts
Total Euro area Rest of the world
Total MFIs General Other Insurance Non-financial EU United Japangovernment financial corporations corporations Member States States
intermediaries and pension outside thefunds euro area
1 2 3 4 5 6 7 8 9 10 11
2013 Q4 3,112.6 1,708.2 390.3 807.4 264.5 10.4 235.5 1,404.4 346.6 548.2 13.72014 Q1 3,260.7 1,844.7 413.9 856.9 299.5 12.0 262.3 1,415.9 395.2 529.5 14.4 Q2 3,416.9 1,914.7 420.8 887.9 321.2 11.4 273.5 1,502.2 398.4 564.0 15.2 Q3 (p) 3,542.9 1,957.3 428.9 914.5 321.5 12.2 280.1 1,585.6 417.0 597.4 16.7
Transactions
2014 Q1 107.0 65.3 10.0 27.9 12.5 0.8 14.2 43.9 15.3 15.8 0.4 Q2 87.5 34.9 2.1 11.3 14.1 0.7 6.9 52.6 -4.5 22.8 0.3 Q3 (p) 88.9 17.4 3.8 8.5 -1.0 0.9 5.2 71.5 14.1 31.1 1.8
2. Shares and other equity (other than investment fund and money market fund shares)
Outstanding amounts
Total Euro area Rest of the world
Total MFIs General Other Insurance Non-financial EU United Japangovernment financial corporations corporations Member States States
intermediaries and pension outside thefunds euro area
1 2 3 4 5 6 7 8 9 10 11
2013 Q4 2,370.0 886.3 85.4 - 64.7 35.5 700.7 1,483.6 215.4 536.0 123.22014 Q1 2,417.8 919.8 92.2 - 63.1 33.8 730.7 1,498.0 215.9 553.0 115.4 Q2 2,565.0 941.4 94.5 - 66.6 29.1 751.1 1,623.6 229.0 598.0 131.5 Q3 (p) 2,662.9 926.9 92.5 - 70.3 29.8 734.3 1,736.0 232.8 661.4 137.7
Transactions
2014 Q1 40.0 21.4 3.2 - 2.9 -0.5 15.9 21.1 5.0 21.7 -0.2 Q2 61.7 13.0 7.2 - 2.1 -1.5 5.3 48.7 7.8 22.0 5.5 Q3 (p) 32.8 0.6 -3.2 - -1.0 0.2 4.6 32.2 1.6 15.6 -0.6
3. Investment fund/money market fund shares
Outstanding amounts
Total Euro area Rest of the world
Total MFIs 2) General Other Insurance Non-financial EU United Japangovernment financial corporations corporations Member States States
intermediaries 2) and pension outside thefunds euro area
1 2 3 4 5 6 7 8 9 10 11
2013 Q4 1,117.9 971.2 85.1 - 886.1 - - 146.6 36.6 49.4 0.52014 Q1 1,181.9 1,017.4 88.4 - 929.1 - - 164.5 40.9 60.7 0.4 Q2 1,250.8 1,077.6 92.1 - 985.4 - - 173.2 46.6 60.8 0.9 Q3 (p) 1,307.9 1,127.6 93.7 - 1,033.9 - - 180.3 45.5 67.5 0.6
Transactions
2014 Q1 21.7 19.8 1.8 - 18.1 - - 1.9 1.3 1.6 0.0 Q2 35.6 30.8 1.9 - 28.9 - - 4.7 2.9 0.8 0.3 Q3 (p) 30.4 35.1 1.8 - 33.2 - - -4.7 -2.5 0.9 -0.3
Source: ECB.1) Other than money market funds. For further details, see the General Notes.2) Investment fund shares (other than money market fund shares) are issued by other financial intermediaries. Money market fund shares are issued by MFIs.
2.8 Aggregated balance sheet of euro area investment funds 1) (EUR billions; outstanding amounts at end of period; transactions during period)
S 22ECBMonthly BulletinDecember 2014
1. Assets
Outstanding amounts
Total Deposits and Securities other Shares and other Investment fund/ Non-financial Other assetsloan claims than shares equity (excl. money market fund assets (incl. financial
investment fund/ shares derivatives)money market fund
shares)1 2 3 4 5 6 7
2014 Mar. 8,365.9 573.0 3,260.7 2,417.8 1,181.9 258.6 673.8 Apr. 8,498.2 583.7 3,309.9 2,439.7 1,195.8 259.8 709.3 May 8,719.0 588.4 3,385.4 2,531.0 1,229.3 260.8 724.3 June 8,758.5 580.0 3,416.9 2,565.0 1,250.8 262.3 683.5 July 8,871.2 600.1 3,454.4 2,580.5 1,269.1 263.2 703.9 Aug. 9,072.1 617.1 3,527.5 2,646.8 1,294.9 264.4 721.4 Sep. (p) 9,155.0 594.3 3,542.9 2,662.9 1,307.9 266.9 780.1
Transactions
2014 Q1 257.8 39.8 107.0 40.0 21.7 2.6 46.7 Q2 208.1 5.4 87.5 61.7 35.6 3.5 14.4 Q3 (p) 245.2 13.3 88.9 32.8 30.4 2.9 76.9
2. Liabilities
Outstanding amounts
Total Loans and Investment fund shares issued Other
deposits liabilitiesreceived Total Held by euro area residents Held by (incl. financial
non-euro area derivatives)Investment residents
funds1 2 3 4 5 6 7
2014 Mar. 8,365.9 190.2 7,532.4 5,549.7 929.1 1,982.7 643.3 Apr. 8,498.2 197.3 7,622.0 5,604.7 939.3 2,017.3 678.8 May 8,719.0 192.1 7,832.3 5,741.4 968.6 2,090.9 694.7 June 8,758.5 179.2 7,920.4 5,792.0 985.4 2,128.4 658.9 July 8,871.2 181.6 8,007.4 5,858.6 998.5 2,148.8 682.2 Aug. 9,072.1 190.6 8,176.1 5,968.3 1,019.9 2,207.8 705.4 Sep. (p) 9,155.0 197.2 8,182.9 5,997.5 1,033.9 2,185.5 774.9
Transactions
2014 Q1 257.8 23.4 172.6 108.9 18.1 51.5 61.7 Q2 208.1 -10.4 198.6 120.1 28.9 78.9 20.0 Q3 (p) 245.2 17.3 173.3 124.2 33.2 49.2 54.6
3. Investment fund shares issued broken down by investment policy and type of fund
Outstanding amounts
Total Funds by investment policy Funds by type Memo item:
Money marketBond Equity Mixed Real estate Hedge Other Open-end Closed-end fundsfunds funds funds funds funds funds funds funds
1 2 3 4 5 6 7 8 9 10
2014 Feb. 7,448.9 2,530.9 2,084.9 1,865.8 346.7 159.0 461.6 7,346.6 102.3 855.3 Mar. 7,532.4 2,555.6 2,100.0 1,891.0 349.4 162.4 474.0 7,429.4 103.0 835.5 Apr. 7,622.0 2,580.0 2,120.3 1,921.1 352.5 165.0 483.2 7,518.2 103.8 836.5 May 7,832.3 2,637.6 2,204.1 1,972.1 355.4 170.1 492.9 7,727.2 105.1 839.2 June 7,920.4 2,661.1 2,230.8 1,999.2 358.6 171.9 498.8 7,814.1 106.3 824.4 July 8,007.4 2,699.7 2,243.2 2,029.4 362.2 172.6 500.3 7,900.3 107.1 846.8 Aug. 8,176.1 2,749.8 2,304.5 2,065.1 366.1 177.3 513.3 8,068.0 108.1 856.9 Sep. (p) 8,182.9 2,717.0 2,315.6 2,083.8 369.0 179.5 518.1 8,073.2 109.7 921.7
Transactions
2014 Mar. 69.1 29.6 10.9 20.9 2.7 2.7 2.3 69.2 -0.1 -19.6 Apr. 76.2 16.6 21.8 24.5 2.6 1.6 9.1 75.4 0.8 0.8 May 69.4 23.5 16.4 22.7 1.4 1.6 3.8 69.3 0.1 -2.5 June 53.0 16.0 11.0 20.1 1.7 0.9 3.4 53.0 0.0 -16.5 July 64.6 26.8 9.1 26.8 0.4 -1.5 3.0 64.5 0.1 16.7 Aug. 50.5 20.1 9.0 11.7 1.9 0.8 7.1 50.5 0.0 7.9 Sep. (p) 58.1 26.1 6.7 15.8 2.6 2.0 4.9 57.6 0.5 -10.2
Source: ECB.1) Other than money market funds (which are shown as a memo item in column 10 in Table 3 of this section). For further details, see the General Notes.

2.10 Aggregated balance sheet of euro area financial vehicle corporations (EUR billions; outstanding amounts at end of period; transactions during period)
S 24ECBMonthly BulletinDecember 2014
1. Assets
Outstanding amounts
Total Deposits Securitised loans Securities Other Shares Other
and loan other than securitised and other assetsclaims Total Originated in euro area Originated shares assets equity
outside MFIs Other financial in- Non- General euro area
termediaries, insur- financial governmentRemaining ance corporations corporationson the MFI and pension funds
balance sheet 1)
1 2 3 4 5 6 7 8 9 10 11 12 13
2013 Q3 1,964.4 264.4 1,330.3 1,033.1 449.6 157.3 20.6 3.5 115.8 182.0 85.1 37.1 65.5 Q4 1,919.4 252.6 1,295.4 1,011.2 442.6 146.5 20.1 3.1 114.5 180.4 87.4 38.6 65.12014 Q1 1,887.1 254.8 1,258.6 976.9 430.4 158.6 21.6 3.1 98.4 164.6 98.8 45.2 65.2 Q2 1,865.9 238.3 1,252.3 975.7 421.9 164.0 20.2 0.1 92.3 166.0 99.0 43.8 66.6 Q3 1,846.4 237.6 1,235.3 961.5 421.3 164.0 19.9 0.1 89.9 170.0 95.6 45.2 62.7
Transactions
2013 Q3 -38.5 -6.4 -21.2 -9.1 - -5.3 -4.3 0.0 -2.4 -11.6 -1.5 0.5 1.7 Q4 -45.8 -11.4 -34.3 -21.6 - -10.6 -0.6 -0.4 -1.1 -0.8 2.3 1.2 -2.82014 Q1 -42.2 -10.5 -28.1 -27.7 - 0.1 -0.3 0.0 -0.2 -2.4 -1.7 0.1 0.5 Q2 -17.4 -16.3 1.4 4.8 - 4.7 -1.2 -0.4 -6.6 0.5 0.7 -1.5 -2.2 Q3 -32.2 -4.8 -17.3 -13.0 - -0.8 -0.6 0.0 -2.8 -0.3 -3.5 0.6 -6.8
2. Liabilities
Outstanding amounts
Total Loans and deposits Debt securities issued Capital and reserves Other liabilities
receivedTotal Up to 2 years Over 2 years
1 2 3 4 5 6 7
2013 Q3 1,964.4 125.0 1,583.5 56.2 1,527.3 29.3 226.7 Q4 1,919.4 117.9 1,543.7 61.0 1,482.7 29.3 228.62014 Q1 1,887.1 142.6 1,477.7 82.9 1,394.8 28.3 238.5 Q2 1,865.9 128.1 1,472.9 79.7 1,393.3 27.2 237.7 Q3 1,846.4 129.2 1,451.3 77.1 1,374.2 27.5 238.4
Transactions
2013 Q3 -38.5 -3.8 -34.5 0.0 -34.4 -0.6 0.4 Q4 -45.8 -6.3 -39.5 4.8 -44.3 0.5 -0.62014 Q1 -42.2 -1.5 -44.5 -6.4 -38.2 0.5 3.2 Q2 -17.4 -13.4 -4.6 -3.2 -1.3 -1.2 1.8 Q3 -32.2 0.1 -26.6 -2.6 -24.0 0.2 -5.9
3. Holdings of securitised loans originated by euro area MFIs and securities other than shares
Outstanding amounts
Securitised loans originated by euro area MFIs Securities other than shares
Total Euro area borrowing sector 2) Non-euro Total Euro area residents Non-euro
area areaHouseholds Non- Other Insurance General borrowing Total MFIs Non-MFIs residents
financial financial corporations government sectorcorporations intermediaries and pension Financial
funds vehiclecorporations
1 2 3 4 5 6 7 8 9 10 11 12 13
2013 Q3 1,033.1 757.9 217.1 21.8 0.2 5.7 30.5 182.0 111.1 29.0 82.1 32.1 70.9 Q4 1,011.2 744.6 205.4 23.3 0.2 5.5 32.2 180.4 109.3 28.8 80.5 34.9 71.12014 Q1 976.9 729.3 193.3 21.2 0.2 5.4 27.4 164.6 100.4 26.0 74.5 35.6 64.2 Q2 975.7 732.5 191.5 20.7 0.2 5.4 25.4 166.0 103.2 24.1 79.1 39.3 62.7 Q3 961.5 723.6 187.7 20.1 0.3 4.6 25.2 170.0 104.5 25.1 79.4 36.6 65.5
Transactions
2013 Q3 -9.1 -2.1 -8.6 0.8 0.0 0.1 0.7 -11.6 -4.1 -4.1 0.0 -0.5 -7.5 Q4 -21.6 -13.5 -11.3 1.6 0.0 -0.1 1.6 -0.8 -1.5 0.0 -1.5 2.1 0.72014 Q1 -27.7 -15.4 -8.8 -0.7 0.0 -0.1 -2.7 -2.4 -2.4 -0.5 -1.9 -1.2 0.1 Q2 4.8 3.3 -0.1 -0.5 0.0 0.0 2.1 0.5 2.2 -1.9 4.1 3.5 -1.7 Q3 -13.0 -8.0 -3.7 -0.5 0.0 -0.8 0.0 -0.3 -0.7 0.9 -1.6 -2.2 0.4
Source: ECB.1) Loans (to non-MFIs) securitised using euro area financial vehicle corporations which remain on the balance sheet of the relevant MFI, i.e. which have not been derecognised.
Whether or not loans are derecognised from the balance sheet of the MFI depends on the relevant accounting rules. For further information, see the General Notes.2) Excludes securitisations of inter-MFI loans.

EURO AREASTATISTICS
Money, bankingand other
financial corporations
2.11 Aggregated balance sheet of euro area insurance corporations and pension funds (EUR billions; outstanding amounts at end of period)
S 25ECB
Monthly BulletinDecember 2014
1. Assets
Total Currency Loans Securities Shares and Investment Money market Prepayments of Other Non-financialand other than other equity fund shares fund shares insurance accounts assets
deposits shares premiums and receivable/reserves for payable andoutstanding financial
claims derivatives
1 2 3 4 5 6 7 8 9 102011 Q3 7,148.0 792.4 463.9 2,764.6 788.2 1,581.3 88.9 255.5 264.7 148.4 Q4 7,158.9 785.2 473.6 2,725.1 793.1 1,615.9 91.2 253.5 271.1 150.12012 Q1 7,444.1 797.7 474.0 2,867.8 806.5 1,712.4 102.9 258.1 276.3 148.4 Q2 7,467.3 786.6 473.0 2,879.9 801.9 1,716.7 106.7 261.4 292.0 149.1 Q3 7,679.4 786.0 482.5 2,992.5 819.6 1,796.4 108.1 263.1 281.9 149.3 Q4 7,768.2 788.8 481.5 3,040.8 817.9 1,837.7 109.5 261.7 279.0 151.42013 Q1 7,957.0 798.7 476.2 3,109.1 835.5 1,913.6 114.6 283.5 275.0 150.8 Q2 7,899.6 777.7 475.7 3,101.9 832.9 1,906.2 100.0 283.1 269.9 152.2 Q3 7,992.7 771.0 479.5 3,118.9 854.1 1,980.7 95.8 283.6 256.1 152.9 Q4 8,080.7 755.8 480.3 3,187.5 874.7 2,021.8 83.0 282.1 240.5 155.02014 Q1 8,328.8 767.2 494.0 3,272.0 889.2 2,096.5 98.8 287.4 267.8 155.9 Q2 (p) 8,592.8 759.3 494.1 3,375.9 935.3 2,197.4 99.2 291.5 283.6 156.4
2. Holdings of securities other than shares
Total Issued by euro area residents Issued by non-euro
area residentsTotal MFIs General Other financial Insurance Non-financial
government intermediaries corporations and corporationspension funds
1 2 3 4 5 6 7 82011 Q3 2,764.6 2,346.9 635.0 1,309.3 227.4 17.0 158.2 417.7 Q4 2,725.1 2,303.1 635.5 1,264.2 223.9 16.3 163.2 422.12012 Q1 2,867.8 2,418.0 667.7 1,320.8 236.5 17.0 176.0 449.8 Q2 2,879.9 2,411.5 675.3 1,303.7 234.6 16.5 181.4 468.4 Q3 2,992.5 2,500.3 705.8 1,342.5 241.6 17.0 193.4 492.2 Q4 3,040.8 2,535.6 690.3 1,381.1 249.9 17.7 196.7 505.12013 Q1 3,109.1 2,617.4 722.6 1,412.8 257.6 17.2 207.1 491.7 Q2 3,101.9 2,600.3 703.5 1,414.6 257.3 16.1 208.9 501.6 Q3 3,118.9 2,606.6 702.0 1,409.1 265.8 16.0 213.7 512.4 Q4 3,187.5 2,656.4 676.3 1,476.5 266.6 15.6 221.4 531.12014 Q1 3,272.0 2,726.1 674.6 1,543.0 266.3 15.8 226.4 545.9 Q2 (p) 3,375.9 2,810.2 688.6 1,600.4 279.9 13.4 227.8 565.7
3. Liabilities and net worth
Liabilities Net worth
Total Loans Securities Shares and Insurance technical reserves Otherreceived other other equity accounts
than shares Net equity of Net equity of Prepayments of receivable/Total households households insurance payable and
in life in pension premiums and financialinsurance fund reserves for derivatives
reserves reserves outstanding claims
1 2 3 4 5 6 7 8 9 102011 Q3 7,061.6 270.7 41.2 409.3 6,137.9 3,275.8 2,050.2 811.8 202.4 86.4 Q4 7,076.2 263.7 41.2 408.1 6,165.0 3,283.1 2,077.4 804.4 198.2 82.72012 Q1 7,233.1 271.3 43.3 438.9 6,278.4 3,316.3 2,137.9 824.2 201.1 211.0 Q2 7,300.5 280.8 42.0 419.7 6,348.7 3,315.8 2,205.3 827.6 209.3 166.8 Q3 7,372.1 292.0 43.7 450.1 6,387.9 3,361.1 2,200.8 826.0 198.4 307.3 Q4 7,472.6 266.5 49.1 477.7 6,459.0 3,395.7 2,243.9 819.4 220.2 295.62013 Q1 7,585.2 278.5 48.7 492.8 6,541.0 3,440.5 2,252.3 848.1 224.2 371.7 Q2 7,633.8 278.7 45.6 500.0 6,576.6 3,454.6 2,275.3 846.7 232.8 265.8 Q3 7,656.1 278.0 46.2 515.2 6,593.0 3,493.4 2,253.4 846.2 223.7 336.6 Q4 7,741.7 265.5 47.2 537.6 6,673.6 3,535.5 2,296.5 841.7 217.9 338.92014 Q1 7,913.3 278.2 48.0 536.6 6,812.8 3,603.4 2,339.1 870.3 237.7 415.5 Q2 (p) 8,057.1 284.0 52.7 531.8 6,943.5 3,666.1 2,405.1 872.2 245.2 535.7
Source: ECB.
2.10 Aggregated balance sheet of euro area financial vehicle corporations (EUR billions; outstanding amounts at end of period; transactions during period)
S 24ECBMonthly BulletinDecember 2014
1. Assets
Outstanding amounts
Total Deposits Securitised loans Securities Other Shares Other
and loan other than securitised and other assetsclaims Total Originated in euro area Originated shares assets equity
outside MFIs Other financial in- Non- General euro area
termediaries, insur- financial governmentRemaining ance corporations corporationson the MFI and pension funds
balance sheet 1)
1 2 3 4 5 6 7 8 9 10 11 12 13
2013 Q3 1,964.4 264.4 1,330.3 1,033.1 449.6 157.3 20.6 3.5 115.8 182.0 85.1 37.1 65.5 Q4 1,919.4 252.6 1,295.4 1,011.2 442.6 146.5 20.1 3.1 114.5 180.4 87.4 38.6 65.12014 Q1 1,887.1 254.8 1,258.6 976.9 430.4 158.6 21.6 3.1 98.4 164.6 98.8 45.2 65.2 Q2 1,865.9 238.3 1,252.3 975.7 421.9 164.0 20.2 0.1 92.3 166.0 99.0 43.8 66.6 Q3 1,846.4 237.6 1,235.3 961.5 421.3 164.0 19.9 0.1 89.9 170.0 95.6 45.2 62.7
Transactions
2013 Q3 -38.5 -6.4 -21.2 -9.1 - -5.3 -4.3 0.0 -2.4 -11.6 -1.5 0.5 1.7 Q4 -45.8 -11.4 -34.3 -21.6 - -10.6 -0.6 -0.4 -1.1 -0.8 2.3 1.2 -2.82014 Q1 -42.2 -10.5 -28.1 -27.7 - 0.1 -0.3 0.0 -0.2 -2.4 -1.7 0.1 0.5 Q2 -17.4 -16.3 1.4 4.8 - 4.7 -1.2 -0.4 -6.6 0.5 0.7 -1.5 -2.2 Q3 -32.2 -4.8 -17.3 -13.0 - -0.8 -0.6 0.0 -2.8 -0.3 -3.5 0.6 -6.8
2. Liabilities
Outstanding amounts
Total Loans and deposits Debt securities issued Capital and reserves Other liabilities
receivedTotal Up to 2 years Over 2 years
1 2 3 4 5 6 7
2013 Q3 1,964.4 125.0 1,583.5 56.2 1,527.3 29.3 226.7 Q4 1,919.4 117.9 1,543.7 61.0 1,482.7 29.3 228.62014 Q1 1,887.1 142.6 1,477.7 82.9 1,394.8 28.3 238.5 Q2 1,865.9 128.1 1,472.9 79.7 1,393.3 27.2 237.7 Q3 1,846.4 129.2 1,451.3 77.1 1,374.2 27.5 238.4
Transactions
2013 Q3 -38.5 -3.8 -34.5 0.0 -34.4 -0.6 0.4 Q4 -45.8 -6.3 -39.5 4.8 -44.3 0.5 -0.62014 Q1 -42.2 -1.5 -44.5 -6.4 -38.2 0.5 3.2 Q2 -17.4 -13.4 -4.6 -3.2 -1.3 -1.2 1.8 Q3 -32.2 0.1 -26.6 -2.6 -24.0 0.2 -5.9
3. Holdings of securitised loans originated by euro area MFIs and securities other than shares
Outstanding amounts
Securitised loans originated by euro area MFIs Securities other than shares
Total Euro area borrowing sector 2) Non-euro Total Euro area residents Non-euro
area areaHouseholds Non- Other Insurance General borrowing Total MFIs Non-MFIs residents
financial financial corporations government sectorcorporations intermediaries and pension Financial
funds vehiclecorporations
1 2 3 4 5 6 7 8 9 10 11 12 13
2013 Q3 1,033.1 757.9 217.1 21.8 0.2 5.7 30.5 182.0 111.1 29.0 82.1 32.1 70.9 Q4 1,011.2 744.6 205.4 23.3 0.2 5.5 32.2 180.4 109.3 28.8 80.5 34.9 71.12014 Q1 976.9 729.3 193.3 21.2 0.2 5.4 27.4 164.6 100.4 26.0 74.5 35.6 64.2 Q2 975.7 732.5 191.5 20.7 0.2 5.4 25.4 166.0 103.2 24.1 79.1 39.3 62.7 Q3 961.5 723.6 187.7 20.1 0.3 4.6 25.2 170.0 104.5 25.1 79.4 36.6 65.5
Transactions
2013 Q3 -9.1 -2.1 -8.6 0.8 0.0 0.1 0.7 -11.6 -4.1 -4.1 0.0 -0.5 -7.5 Q4 -21.6 -13.5 -11.3 1.6 0.0 -0.1 1.6 -0.8 -1.5 0.0 -1.5 2.1 0.72014 Q1 -27.7 -15.4 -8.8 -0.7 0.0 -0.1 -2.7 -2.4 -2.4 -0.5 -1.9 -1.2 0.1 Q2 4.8 3.3 -0.1 -0.5 0.0 0.0 2.1 0.5 2.2 -1.9 4.1 3.5 -1.7 Q3 -13.0 -8.0 -3.7 -0.5 0.0 -0.8 0.0 -0.3 -0.7 0.9 -1.6 -2.2 0.4
Source: ECB.1) Loans (to non-MFIs) securitised using euro area financial vehicle corporations which remain on the balance sheet of the relevant MFI, i.e. which have not been derecognised.
Whether or not loans are derecognised from the balance sheet of the MFI depends on the relevant accounting rules. For further information, see the General Notes.2) Excludes securitisations of inter-MFI loans.
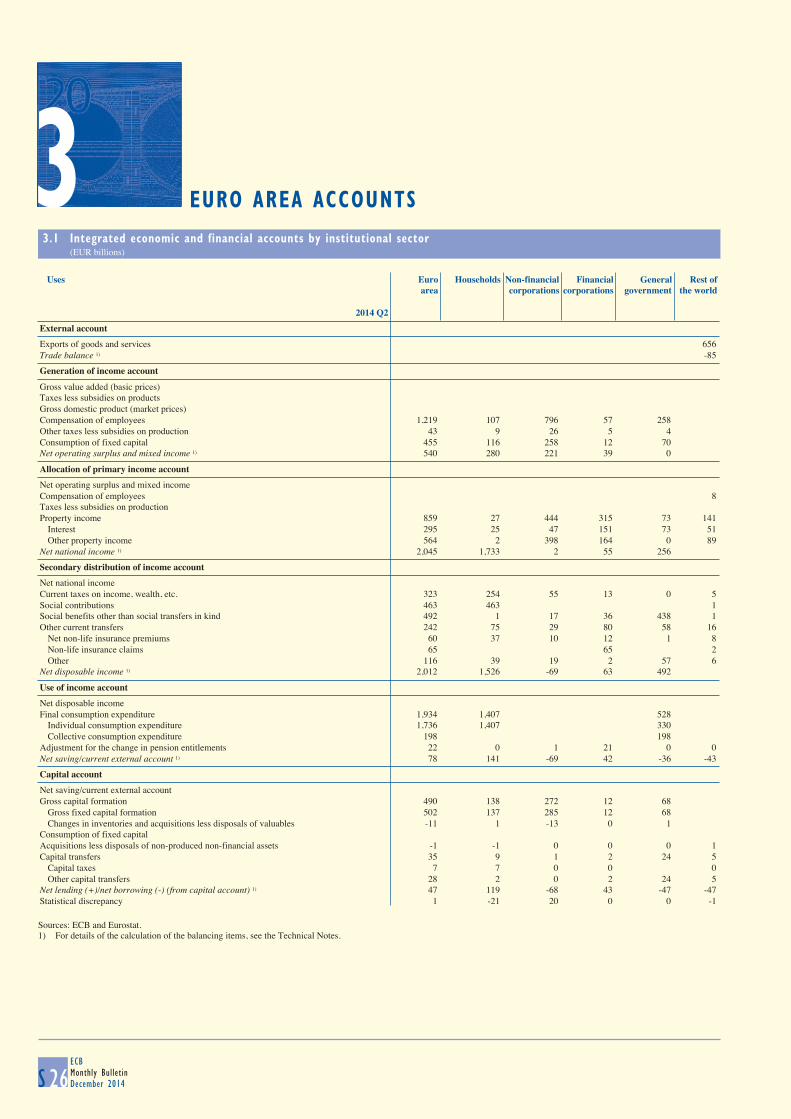
3 EURO AREA ACCOUNTS
3.1 Integrated economic and financial accounts by institutional sector (EUR billions)
S 26ECBMonthly BulletinDecember 2014
Uses Euro Households Non-financial Financial General Rest ofarea corporations corporations government the world
2014 Q2
External account
Exports of goods and services 656 Trade balance 1) -85
Generation of income account
Gross value added (basic prices) Taxes less subsidies on products Gross domestic product (market prices) Compensation of employees 1,219 107 796 57 258 Other taxes less subsidies on production 43 9 26 5 4 Consumption of fixed capital 455 116 258 12 70 Net operating surplus and mixed income 1) 540 280 221 39 0
Allocation of primary income account
Net operating surplus and mixed income Compensation of employees 8 Taxes less subsidies on production Property income 859 27 444 315 73 141 Interest 295 25 47 151 73 51 Other property income 564 2 398 164 0 89 Net national income 1) 2,045 1,733 2 55 256
Secondary distribution of income account
Net national income Current taxes on income, wealth, etc. 323 254 55 13 0 5 Social contributions 463 463 1 Social benefits other than social transfers in kind 492 1 17 36 438 1 Other current transfers 242 75 29 80 58 16 Net non-life insurance premiums 60 37 10 12 1 8 Non-life insurance claims 65 65 2 Other 116 39 19 2 57 6 Net disposable income 1) 2,012 1,526 -69 63 492
Use of income account
Net disposable income Final consumption expenditure 1,934 1,407 528 Individual consumption expenditure 1,736 1,407 330 Collective consumption expenditure 198 198 Adjustment for the change in pension entitlements 22 0 1 21 0 0 Net saving/current external account 1) 78 141 -69 42 -36 -43
Capital account
Net saving/current external account Gross capital formation 490 138 272 12 68 Gross fixed capital formation 502 137 285 12 68 Changes in inventories and acquisitions less disposals of valuables -11 1 -13 0 1 Consumption of fixed capital Acquisitions less disposals of non-produced non-financial assets -1 -1 0 0 0 1 Capital transfers 35 9 1 2 24 5 Capital taxes 7 7 0 0 0 Other capital transfers 28 2 0 2 24 5 Net lending (+)/net borrowing (-) (from capital account) 1) 47 119 -68 43 -47 -47 Statistical discrepancy 1 -21 20 0 0 -1
Sources: ECB and Eurostat.1) For details of the calculation of the balancing items, see the Technical Notes.
3
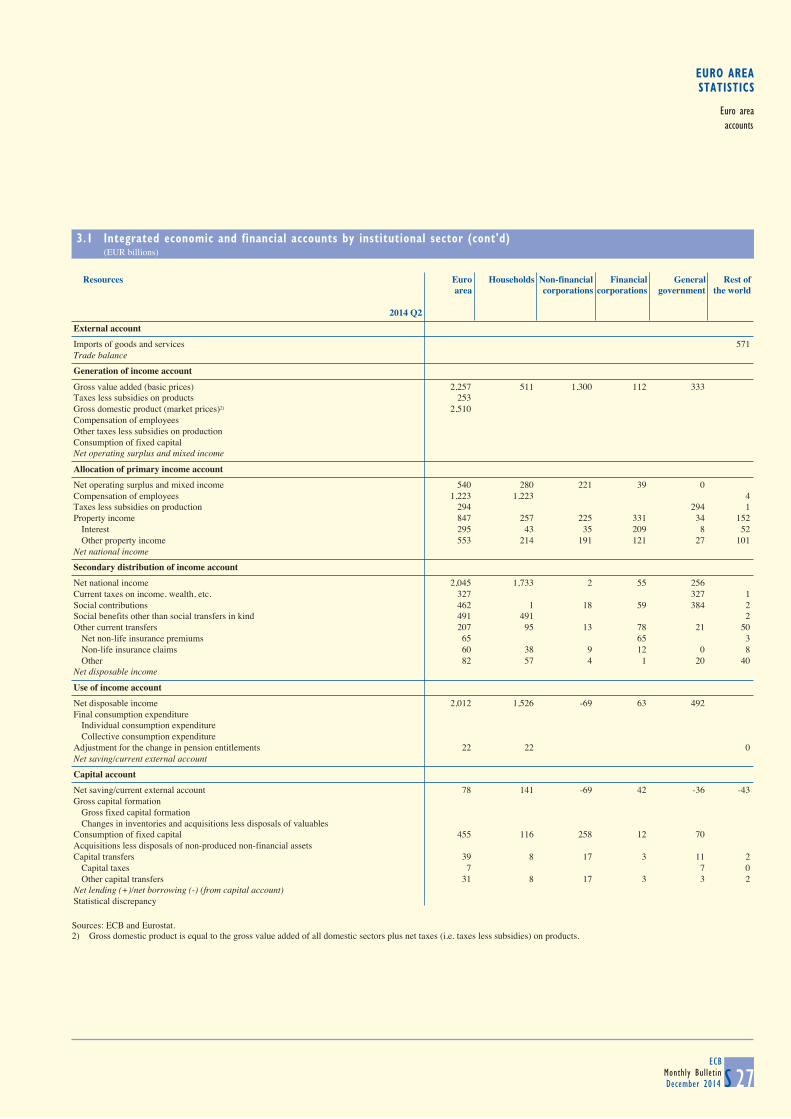
EURO AREASTATISTICS
Euro areaaccounts
3.1 Integrated economic and financial accounts by institutional sector (cont'd) (EUR billions)
S 27ECB
Monthly BulletinDecember 2014
Resources Euro Households Non-financial Financial General Rest ofarea corporations corporations government the world
2014 Q2
External account
Imports of goods and services 571 Trade balance
Generation of income account
Gross value added (basic prices) 2,257 511 1,300 112 333 Taxes less subsidies on products 253 Gross domestic product (market prices)2) 2,510 Compensation of employees Other taxes less subsidies on production Consumption of fixed capital Net operating surplus and mixed income
Allocation of primary income account
Net operating surplus and mixed income 540 280 221 39 0 Compensation of employees 1,223 1,223 4 Taxes less subsidies on production 294 294 1 Property income 847 257 225 331 34 152 Interest 295 43 35 209 8 52 Other property income 553 214 191 121 27 101 Net national income
Secondary distribution of income account
Net national income 2,045 1,733 2 55 256 Current taxes on income, wealth, etc. 327 327 1 Social contributions 462 1 18 59 384 2 Social benefits other than social transfers in kind 491 491 2 Other current transfers 207 95 13 78 21 50 Net non-life insurance premiums 65 65 3 Non-life insurance claims 60 38 9 12 0 8 Other 82 57 4 1 20 40 Net disposable income
Use of income account
Net disposable income 2,012 1,526 -69 63 492 Final consumption expenditure Individual consumption expenditure Collective consumption expenditure Adjustment for the change in pension entitlements 22 22 0 Net saving/current external account
Capital account
Net saving/current external account 78 141 -69 42 -36 -43 Gross capital formation Gross fixed capital formation Changes in inventories and acquisitions less disposals of valuables Consumption of fixed capital 455 116 258 12 70 Acquisitions less disposals of non-produced non-financial assets Capital transfers 39 8 17 3 11 2 Capital taxes 7 7 0 Other capital transfers 31 8 17 3 3 2 Net lending (+)/net borrowing (-) (from capital account) Statistical discrepancy
Sources: ECB and Eurostat.2) Gross domestic product is equal to the gross value added of all domestic sectors plus net taxes (i.e. taxes less subsidies) on products.
3 EURO AREA ACCOUNTS
3.1 Integrated economic and financial accounts by institutional sector (EUR billions)
S 26ECBMonthly BulletinDecember 2014
Uses Euro Households Non-financial Financial General Rest ofarea corporations corporations government the world
2014 Q2
External account
Exports of goods and services 656 Trade balance 1) -85
Generation of income account
Gross value added (basic prices) Taxes less subsidies on products Gross domestic product (market prices) Compensation of employees 1,219 107 796 57 258 Other taxes less subsidies on production 43 9 26 5 4 Consumption of fixed capital 455 116 258 12 70 Net operating surplus and mixed income 1) 540 280 221 39 0
Allocation of primary income account
Net operating surplus and mixed income Compensation of employees 8 Taxes less subsidies on production Property income 859 27 444 315 73 141 Interest 295 25 47 151 73 51 Other property income 564 2 398 164 0 89 Net national income 1) 2,045 1,733 2 55 256
Secondary distribution of income account
Net national income Current taxes on income, wealth, etc. 323 254 55 13 0 5 Social contributions 463 463 1 Social benefits other than social transfers in kind 492 1 17 36 438 1 Other current transfers 242 75 29 80 58 16 Net non-life insurance premiums 60 37 10 12 1 8 Non-life insurance claims 65 65 2 Other 116 39 19 2 57 6 Net disposable income 1) 2,012 1,526 -69 63 492
Use of income account
Net disposable income Final consumption expenditure 1,934 1,407 528 Individual consumption expenditure 1,736 1,407 330 Collective consumption expenditure 198 198 Adjustment for the change in pension entitlements 22 0 1 21 0 0 Net saving/current external account 1) 78 141 -69 42 -36 -43
Capital account
Net saving/current external account Gross capital formation 490 138 272 12 68 Gross fixed capital formation 502 137 285 12 68 Changes in inventories and acquisitions less disposals of valuables -11 1 -13 0 1 Consumption of fixed capital Acquisitions less disposals of non-produced non-financial assets -1 -1 0 0 0 1 Capital transfers 35 9 1 2 24 5 Capital taxes 7 7 0 0 0 Other capital transfers 28 2 0 2 24 5 Net lending (+)/net borrowing (-) (from capital account) 1) 47 119 -68 43 -47 -47 Statistical discrepancy 1 -21 20 0 0 -1
Sources: ECB and Eurostat.1) For details of the calculation of the balancing items, see the Technical Notes.
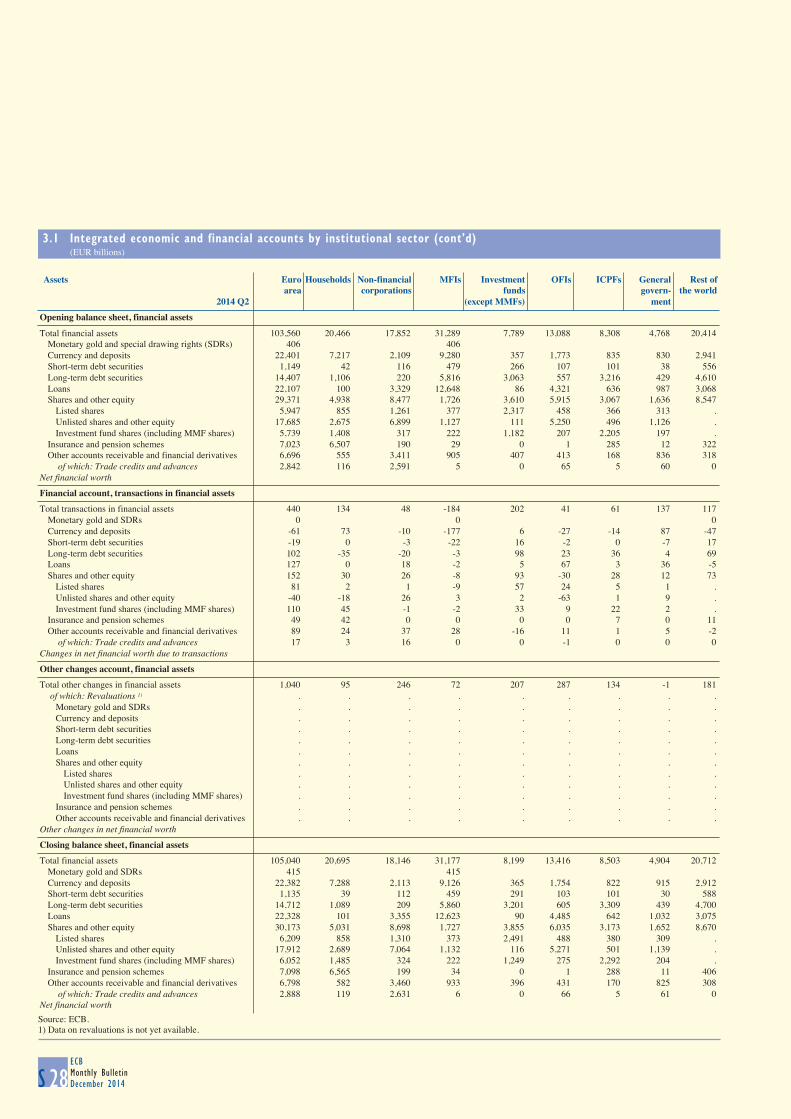
3.1 Integrated economic and financial accounts by institutional sector (cont'd) (EUR billions)
S 28ECBMonthly BulletinDecember 2014
Assets Euro Households Non-financial MFIs Investment OFIs ICPFs General Rest ofarea corporations funds govern- the world
2014 Q2 (except MMFs) ment
Opening balance sheet, financial assets
Total financial assets 103,560 20,466 17,852 31,289 7,789 13,088 8,308 4,768 20,414 Monetary gold and special drawing rights (SDRs) 406 406 Currency and deposits 22,401 7,217 2,109 9,280 357 1,773 835 830 2,941 Short-term debt securities 1,149 42 116 479 266 107 101 38 556 Long-term debt securities 14,407 1,106 220 5,816 3,063 557 3,216 429 4,610 Loans 22,107 100 3,329 12,648 86 4,321 636 987 3,068 Shares and other equity 29,371 4,938 8,477 1,726 3,610 5,915 3,067 1,636 8,547 Listed shares 5,947 855 1,261 377 2,317 458 366 313 . Unlisted shares and other equity 17,685 2,675 6,899 1,127 111 5,250 496 1,126 . Investment fund shares (including MMF shares) 5,739 1,408 317 222 1,182 207 2,205 197 . Insurance and pension schemes 7,023 6,507 190 29 0 1 285 12 322 Other accounts receivable and financial derivatives 6,696 555 3,411 905 407 413 168 836 318 of which: Trade credits and advances 2,842 116 2,591 5 0 65 5 60 0 Net financial worth
Financial account, transactions in financial assets
Total transactions in financial assets 440 134 48 -184 202 41 61 137 117 Monetary gold and SDRs 0 0 0 Currency and deposits -61 73 -10 -177 6 -27 -14 87 -47 Short-term debt securities -19 0 -3 -22 16 -2 0 -7 17 Long-term debt securities 102 -35 -20 -3 98 23 36 4 69 Loans 127 0 18 -2 5 67 3 36 -5 Shares and other equity 152 30 26 -8 93 -30 28 12 73 Listed shares 81 2 1 -9 57 24 5 1 . Unlisted shares and other equity -40 -18 26 3 2 -63 1 9 . Investment fund shares (including MMF shares) 110 45 -1 -2 33 9 22 2 . Insurance and pension schemes 49 42 0 0 0 0 7 0 11 Other accounts receivable and financial derivatives 89 24 37 28 -16 11 1 5 -2 of which: Trade credits and advances 17 3 16 0 0 -1 0 0 0 Changes in net financial worth due to transactions
Other changes account, financial assets
Total other changes in financial assets 1,040 95 246 72 207 287 134 -1 181 of which: Revaluations 1) . . . . . . . . . Monetary gold and SDRs . . . . . . . . . Currency and deposits . . . . . . . . . Short-term debt securities . . . . . . . . . Long-term debt securities . . . . . . . . . Loans . . . . . . . . . Shares and other equity . . . . . . . . . Listed shares . . . . . . . . . Unlisted shares and other equity . . . . . . . . . Investment fund shares (including MMF shares) . . . . . . . . . Insurance and pension schemes . . . . . . . . . Other accounts receivable and financial derivatives . . . . . . . . . Other changes in net financial worth
Closing balance sheet, financial assets
Total financial assets 105,040 20,695 18,146 31,177 8,199 13,416 8,503 4,904 20,712 Monetary gold and SDRs 415 415 Currency and deposits 22,382 7,288 2,113 9,126 365 1,754 822 915 2,912 Short-term debt securities 1,135 39 112 459 291 103 101 30 588 Long-term debt securities 14,712 1,089 209 5,860 3,201 605 3,309 439 4,700 Loans 22,328 101 3,355 12,623 90 4,485 642 1,032 3,075 Shares and other equity 30,173 5,031 8,698 1,727 3,855 6,035 3,173 1,652 8,670 Listed shares 6,209 858 1,310 373 2,491 488 380 309 . Unlisted shares and other equity 17,912 2,689 7,064 1,132 116 5,271 501 1,139 . Investment fund shares (including MMF shares) 6,052 1,485 324 222 1,249 275 2,292 204 . Insurance and pension schemes 7,098 6,565 199 34 0 1 288 11 406 Other accounts receivable and financial derivatives 6,798 582 3,460 933 396 431 170 825 308 of which: Trade credits and advances 2,888 119 2,631 6 0 66 5 61 0 Net financial worthSource: ECB.1) Data on revaluations is not yet available.
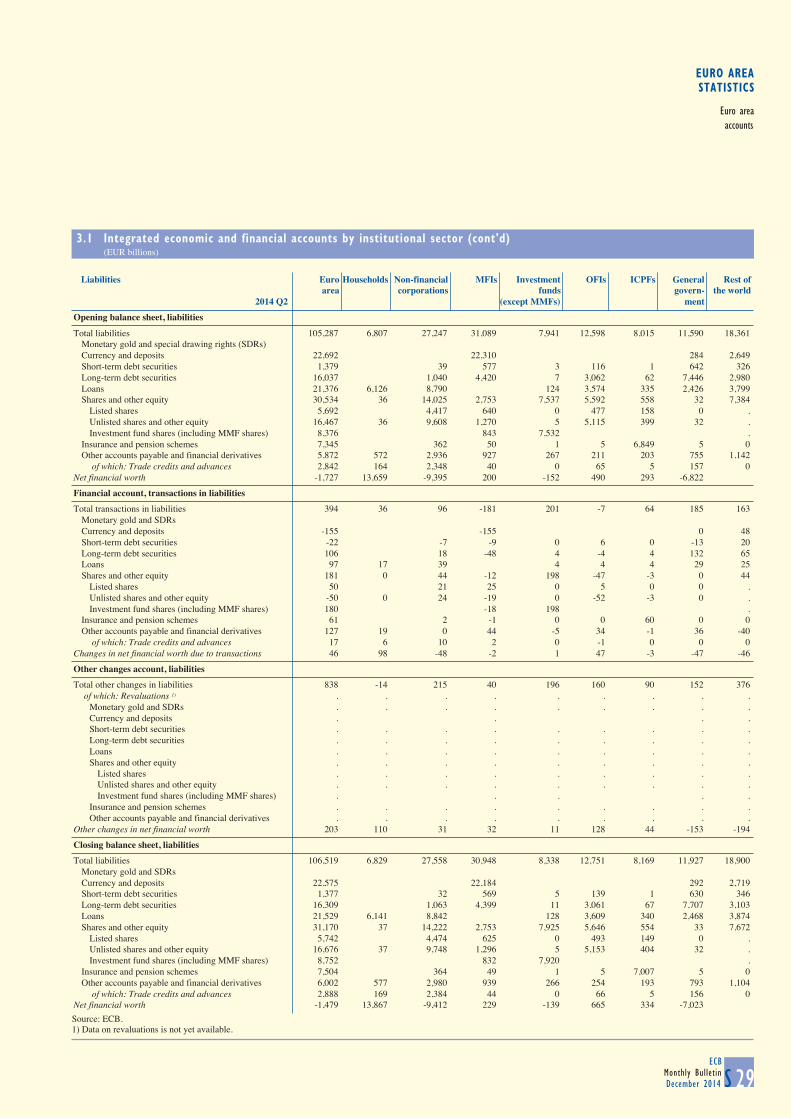
EURO AREASTATISTICS
Euro areaaccounts
3.1 Integrated economic and financial accounts by institutional sector (cont'd) (EUR billions)
S 29ECB
Monthly BulletinDecember 2014
Liabilities Euro Households Non-financial MFIs Investment OFIs ICPFs General Rest ofarea corporations funds govern- the world
2014 Q2 (except MMFs) ment
Opening balance sheet, liabilities
Total liabilities 105,287 6,807 27,247 31,089 7,941 12,598 8,015 11,590 18,361 Monetary gold and special drawing rights (SDRs) Currency and deposits 22,692 22,310 284 2,649 Short-term debt securities 1,379 39 577 3 116 1 642 326 Long-term debt securities 16,037 1,040 4,420 7 3,062 62 7,446 2,980 Loans 21,376 6,126 8,790 124 3,574 335 2,426 3,799 Shares and other equity 30,534 36 14,025 2,753 7,537 5,592 558 32 7,384 Listed shares 5,692 4,417 640 0 477 158 0 . Unlisted shares and other equity 16,467 36 9,608 1,270 5 5,115 399 32 . Investment fund shares (including MMF shares) 8,376 843 7,532 . Insurance and pension schemes 7,345 362 50 1 5 6,849 5 0 Other accounts payable and financial derivatives 5,872 572 2,936 927 267 211 203 755 1,142 of which: Trade credits and advances 2,842 164 2,348 40 0 65 5 157 0 Net financial worth -1,727 13,659 -9,395 200 -152 490 293 -6,822
Financial account, transactions in liabilities
Total transactions in liabilities 394 36 96 -181 201 -7 64 185 163 Monetary gold and SDRs Currency and deposits -155 -155 0 48 Short-term debt securities -22 -7 -9 0 6 0 -13 20 Long-term debt securities 106 18 -48 4 -4 4 132 65 Loans 97 17 39 4 4 4 29 25 Shares and other equity 181 0 44 -12 198 -47 -3 0 44 Listed shares 50 21 25 0 5 0 0 . Unlisted shares and other equity -50 0 24 -19 0 -52 -3 0 . Investment fund shares (including MMF shares) 180 -18 198 . Insurance and pension schemes 61 2 -1 0 0 60 0 0 Other accounts payable and financial derivatives 127 19 0 44 -5 34 -1 36 -40 of which: Trade credits and advances 17 6 10 2 0 -1 0 0 0 Changes in net financial worth due to transactions 46 98 -48 -2 1 47 -3 -47 -46
Other changes account, liabilities
Total other changes in liabilities 838 -14 215 40 196 160 90 152 376 of which: Revaluations 1) . . . . . . . . . Monetary gold and SDRs . . . . . . . . . Currency and deposits . . . . Short-term debt securities . . . . . . . . . Long-term debt securities . . . . . . . . . Loans . . . . . . . . . Shares and other equity . . . . . . . . . Listed shares . . . . . . . . . Unlisted shares and other equity . . . . . . . . . Investment fund shares (including MMF shares) . . . . . Insurance and pension schemes . . . . . . . . . Other accounts payable and financial derivatives . . . . . . . . . Other changes in net financial worth 203 110 31 32 11 128 44 -153 -194
Closing balance sheet, liabilities
Total liabilities 106,519 6,829 27,558 30,948 8,338 12,751 8,169 11,927 18,900 Monetary gold and SDRs Currency and deposits 22,575 22,184 292 2,719 Short-term debt securities 1,377 32 569 5 139 1 630 346 Long-term debt securities 16,309 1,063 4,399 11 3,061 67 7,707 3,103 Loans 21,529 6,141 8,842 128 3,609 340 2,468 3,874 Shares and other equity 31,170 37 14,222 2,753 7,925 5,646 554 33 7,672 Listed shares 5,742 4,474 625 0 493 149 0 . Unlisted shares and other equity 16,676 37 9,748 1,296 5 5,153 404 32 . Investment fund shares (including MMF shares) 8,752 832 7,920 . Insurance and pension schemes 7,504 364 49 1 5 7,007 5 0 Other accounts payable and financial derivatives 6,002 577 2,980 939 266 254 193 793 1,104 of which: Trade credits and advances 2,888 169 2,384 44 0 66 5 156 0 Net financial worth -1,479 13,867 -9,412 229 -139 665 334 -7,023 Source: ECB.1) Data on revaluations is not yet available.
3.1 Integrated economic and financial accounts by institutional sector (cont'd) (EUR billions)
S 28ECBMonthly BulletinDecember 2014
Assets Euro Households Non-financial MFIs Investment OFIs ICPFs General Rest ofarea corporations funds govern- the world
2014 Q2 (except MMFs) ment
Opening balance sheet, financial assets
Total financial assets 103,560 20,466 17,852 31,289 7,789 13,088 8,308 4,768 20,414 Monetary gold and special drawing rights (SDRs) 406 406 Currency and deposits 22,401 7,217 2,109 9,280 357 1,773 835 830 2,941 Short-term debt securities 1,149 42 116 479 266 107 101 38 556 Long-term debt securities 14,407 1,106 220 5,816 3,063 557 3,216 429 4,610 Loans 22,107 100 3,329 12,648 86 4,321 636 987 3,068 Shares and other equity 29,371 4,938 8,477 1,726 3,610 5,915 3,067 1,636 8,547 Listed shares 5,947 855 1,261 377 2,317 458 366 313 . Unlisted shares and other equity 17,685 2,675 6,899 1,127 111 5,250 496 1,126 . Investment fund shares (including MMF shares) 5,739 1,408 317 222 1,182 207 2,205 197 . Insurance and pension schemes 7,023 6,507 190 29 0 1 285 12 322 Other accounts receivable and financial derivatives 6,696 555 3,411 905 407 413 168 836 318 of which: Trade credits and advances 2,842 116 2,591 5 0 65 5 60 0 Net financial worth
Financial account, transactions in financial assets
Total transactions in financial assets 440 134 48 -184 202 41 61 137 117 Monetary gold and SDRs 0 0 0 Currency and deposits -61 73 -10 -177 6 -27 -14 87 -47 Short-term debt securities -19 0 -3 -22 16 -2 0 -7 17 Long-term debt securities 102 -35 -20 -3 98 23 36 4 69 Loans 127 0 18 -2 5 67 3 36 -5 Shares and other equity 152 30 26 -8 93 -30 28 12 73 Listed shares 81 2 1 -9 57 24 5 1 . Unlisted shares and other equity -40 -18 26 3 2 -63 1 9 . Investment fund shares (including MMF shares) 110 45 -1 -2 33 9 22 2 . Insurance and pension schemes 49 42 0 0 0 0 7 0 11 Other accounts receivable and financial derivatives 89 24 37 28 -16 11 1 5 -2 of which: Trade credits and advances 17 3 16 0 0 -1 0 0 0 Changes in net financial worth due to transactions
Other changes account, financial assets
Total other changes in financial assets 1,040 95 246 72 207 287 134 -1 181 of which: Revaluations 1) . . . . . . . . . Monetary gold and SDRs . . . . . . . . . Currency and deposits . . . . . . . . . Short-term debt securities . . . . . . . . . Long-term debt securities . . . . . . . . . Loans . . . . . . . . . Shares and other equity . . . . . . . . . Listed shares . . . . . . . . . Unlisted shares and other equity . . . . . . . . . Investment fund shares (including MMF shares) . . . . . . . . . Insurance and pension schemes . . . . . . . . . Other accounts receivable and financial derivatives . . . . . . . . . Other changes in net financial worth
Closing balance sheet, financial assets
Total financial assets 105,040 20,695 18,146 31,177 8,199 13,416 8,503 4,904 20,712 Monetary gold and SDRs 415 415 Currency and deposits 22,382 7,288 2,113 9,126 365 1,754 822 915 2,912 Short-term debt securities 1,135 39 112 459 291 103 101 30 588 Long-term debt securities 14,712 1,089 209 5,860 3,201 605 3,309 439 4,700 Loans 22,328 101 3,355 12,623 90 4,485 642 1,032 3,075 Shares and other equity 30,173 5,031 8,698 1,727 3,855 6,035 3,173 1,652 8,670 Listed shares 6,209 858 1,310 373 2,491 488 380 309 . Unlisted shares and other equity 17,912 2,689 7,064 1,132 116 5,271 501 1,139 . Investment fund shares (including MMF shares) 6,052 1,485 324 222 1,249 275 2,292 204 . Insurance and pension schemes 7,098 6,565 199 34 0 1 288 11 406 Other accounts receivable and financial derivatives 6,798 582 3,460 933 396 431 170 825 308 of which: Trade credits and advances 2,888 119 2,631 6 0 66 5 61 0 Net financial worthSource: ECB.1) Data on revaluations is not yet available.
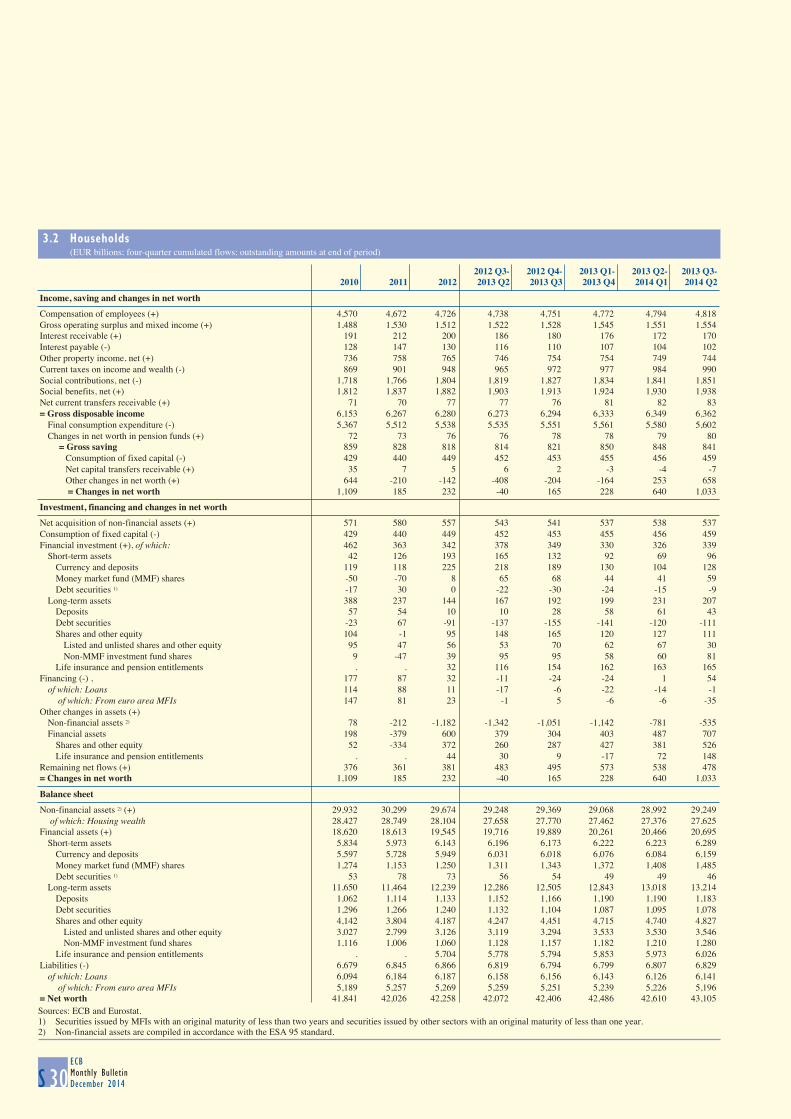
3.2 Households (EUR billions; four-quarter cumulated flows; outstanding amounts at end of period)
S 30ECBMonthly BulletinDecember 2014
2012 Q3- 2012 Q4- 2013 Q1- 2013 Q2- 2013 Q3-2010 2011 2012 2013 Q2 2013 Q3 2013 Q4 2014 Q1 2014 Q2
Income, saving and changes in net worth
Compensation of employees (+) 4,570 4,672 4,726 4,738 4,751 4,772 4,794 4,818 Gross operating surplus and mixed income (+) 1,488 1,530 1,512 1,522 1,528 1,545 1,551 1,554 Interest receivable (+) 191 212 200 186 180 176 172 170 Interest payable (-) 128 147 130 116 110 107 104 102 Other property income, net (+) 736 758 765 746 754 754 749 744 Current taxes on income and wealth (-) 869 901 948 965 972 977 984 990 Social contributions, net (-) 1,718 1,766 1,804 1,819 1,827 1,834 1,841 1,851 Social benefits, net (+) 1,812 1,837 1,882 1,903 1,913 1,924 1,930 1,938 Net current transfers receivable (+) 71 70 77 77 76 81 82 83 = Gross disposable income 6,153 6,267 6,280 6,273 6,294 6,333 6,349 6,362 Final consumption expenditure (-) 5,367 5,512 5,538 5,535 5,551 5,561 5,580 5,602 Changes in net worth in pension funds (+) 72 73 76 76 78 78 79 80 = Gross saving 859 828 818 814 821 850 848 841 Consumption of fixed capital (-) 429 440 449 452 453 455 456 459 Net capital transfers receivable (+) 35 7 5 6 2 -3 -4 -7 Other changes in net worth (+) 644 -210 -142 -408 -204 -164 253 658 = Changes in net worth 1,109 185 232 -40 165 228 640 1,033
Investment, financing and changes in net worth
Net acquisition of non-financial assets (+) 571 580 557 543 541 537 538 537 Consumption of fixed capital (-) 429 440 449 452 453 455 456 459 Financial investment (+), of which: 462 363 342 378 349 330 326 339 Short-term assets 42 126 193 165 132 92 69 96 Currency and deposits 119 118 225 218 189 130 104 128 Money market fund (MMF) shares -50 -70 8 65 68 44 41 59 Debt securities 1) -17 30 0 -22 -30 -24 -15 -9 Long-term assets 388 237 144 167 192 199 231 207 Deposits 57 54 10 10 28 58 61 43 Debt securities -23 67 -91 -137 -155 -141 -120 -111 Shares and other equity 104 -1 95 148 165 120 127 111 Listed and unlisted shares and other equity 95 47 56 53 70 62 67 30 Non-MMF investment fund shares 9 -47 39 95 95 58 60 81 Life insurance and pension entitlements . . 32 116 154 162 163 165 Financing (-) , 177 87 32 -11 -24 -24 1 54 of which: Loans 114 88 11 -17 -6 -22 -14 -1 of which: From euro area MFIs 147 81 23 -1 5 -6 -6 -35 Other changes in assets (+) Non-financial assets 2) 78 -212 -1,182 -1,342 -1,051 -1,142 -781 -535 Financial assets 198 -379 600 379 304 403 487 707 Shares and other equity 52 -334 372 260 287 427 381 526 Life insurance and pension entitlements . . 44 30 9 -17 72 148 Remaining net flows (+) 376 361 381 483 495 573 538 478 = Changes in net worth 1,109 185 232 -40 165 228 640 1,033
Balance sheet
Non-financial assets 2) (+) 29,932 30,299 29,674 29,248 29,369 29,068 28,992 29,249 of which: Housing wealth 28,427 28,749 28,104 27,658 27,770 27,462 27,376 27,625 Financial assets (+) 18,620 18,613 19,545 19,716 19,889 20,261 20,466 20,695 Short-term assets 5,834 5,973 6,143 6,196 6,173 6,222 6,223 6,289 Currency and deposits 5,597 5,728 5,949 6,031 6,018 6,076 6,084 6,159 Money market fund (MMF) shares 1,274 1,153 1,250 1,311 1,343 1,372 1,408 1,485 Debt securities 1) 53 78 73 56 54 49 49 46 Long-term assets 11,650 11,464 12,239 12,286 12,505 12,843 13,018 13,214 Deposits 1,062 1,114 1,133 1,152 1,166 1,190 1,190 1,183 Debt securities 1,296 1,266 1,240 1,132 1,104 1,087 1,095 1,078 Shares and other equity 4,142 3,804 4,187 4,247 4,451 4,715 4,740 4,827 Listed and unlisted shares and other equity 3,027 2,799 3,126 3,119 3,294 3,533 3,530 3,546 Non-MMF investment fund shares 1,116 1,006 1,060 1,128 1,157 1,182 1,210 1,280 Life insurance and pension entitlements . . 5,704 5,778 5,794 5,853 5,973 6,026 Liabilities (-) 6,679 6,845 6,866 6,819 6,794 6,799 6,807 6,829 of which: Loans 6,094 6,184 6,187 6,158 6,156 6,143 6,126 6,141 of which: From euro area MFIs 5,189 5,257 5,269 5,259 5,251 5,239 5,226 5,196 = Net worth 41,841 42,026 42,258 42,072 42,406 42,486 42,610 43,105Sources: ECB and Eurostat.1) Securities issued by MFIs with an original maturity of less than two years and securities issued by other sectors with an original maturity of less than one year.2) Non-financial assets are compiled in accordance with the ESA 95 standard.
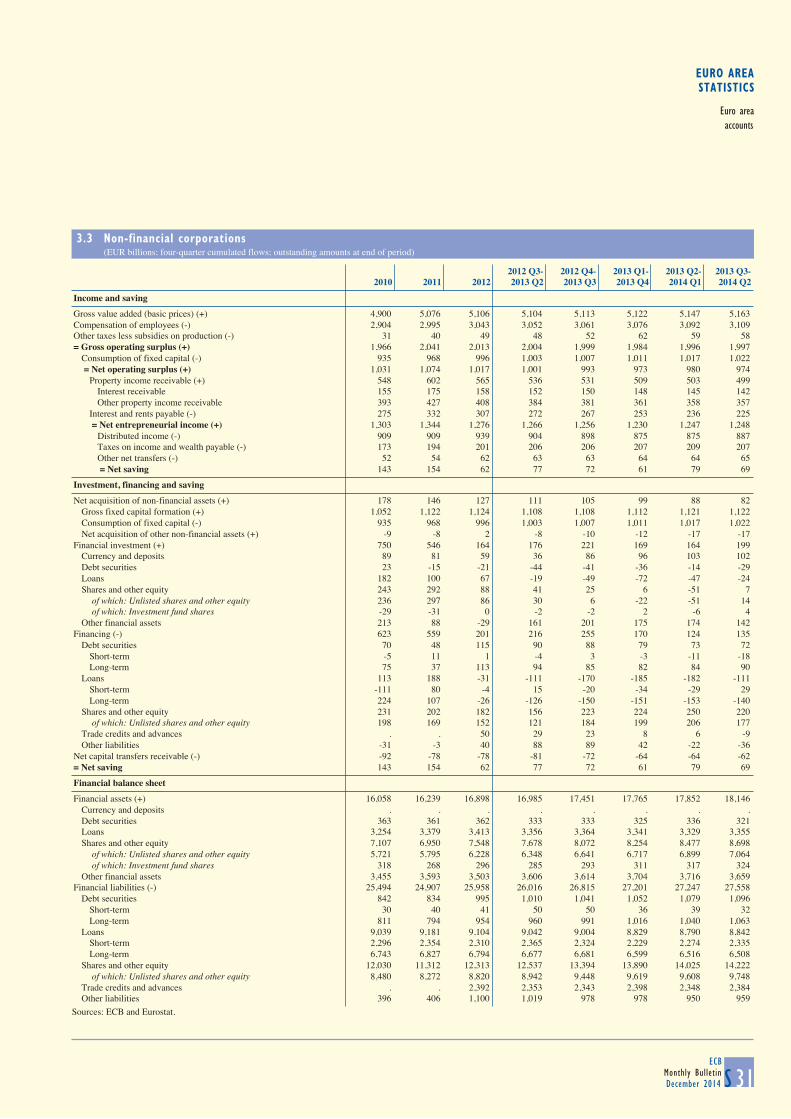
EURO AREASTATISTICS
Euro areaaccounts
3.3 Non-financial corporations (EUR billions; four-quarter cumulated flows; outstanding amounts at end of period)
S 31ECB
Monthly BulletinDecember 2014
2012 Q3- 2012 Q4- 2013 Q1- 2013 Q2- 2013 Q3-2010 2011 2012 2013 Q2 2013 Q3 2013 Q4 2014 Q1 2014 Q2
Income and saving
Gross value added (basic prices) (+) 4,900 5,076 5,106 5,104 5,113 5,122 5,147 5,163 Compensation of employees (-) 2,904 2,995 3,043 3,052 3,061 3,076 3,092 3,109 Other taxes less subsidies on production (-) 31 40 49 48 52 62 59 58 = Gross operating surplus (+) 1,966 2,041 2,013 2,004 1,999 1,984 1,996 1,997 Consumption of fixed capital (-) 935 968 996 1,003 1,007 1,011 1,017 1,022 = Net operating surplus (+) 1,031 1,074 1,017 1,001 993 973 980 974 Property income receivable (+) 548 602 565 536 531 509 503 499 Interest receivable 155 175 158 152 150 148 145 142 Other property income receivable 393 427 408 384 381 361 358 357 Interest and rents payable (-) 275 332 307 272 267 253 236 225 = Net entrepreneurial income (+) 1,303 1,344 1,276 1,266 1,256 1,230 1,247 1,248 Distributed income (-) 909 909 939 904 898 875 875 887 Taxes on income and wealth payable (-) 173 194 201 206 206 207 209 207 Other net transfers (-) 52 54 62 63 63 64 64 65 = Net saving 143 154 62 77 72 61 79 69
Investment, financing and saving
Net acquisition of non-financial assets (+) 178 146 127 111 105 99 88 82 Gross fixed capital formation (+) 1,052 1,122 1,124 1,108 1,108 1,112 1,121 1,122 Consumption of fixed capital (-) 935 968 996 1,003 1,007 1,011 1,017 1,022 Net acquisition of other non-financial assets (+) -9 -8 2 -8 -10 -12 -17 -17 Financial investment (+) 750 546 164 176 221 169 164 199 Currency and deposits 89 81 59 36 86 96 103 102 Debt securities 23 -15 -21 -44 -41 -36 -14 -29 Loans 182 100 67 -19 -49 -72 -47 -24 Shares and other equity 243 292 88 41 25 6 -51 7 of which: Unlisted shares and other equity 236 297 86 30 6 -22 -51 14 of which: Investment fund shares -29 -31 0 -2 -2 2 -6 4 Other financial assets 213 88 -29 161 201 175 174 142 Financing (-) 623 559 201 216 255 170 124 135 Debt securities 70 48 115 90 88 79 73 72 Short-term -5 11 1 -4 3 -3 -11 -18 Long-term 75 37 113 94 85 82 84 90 Loans 113 188 -31 -111 -170 -185 -182 -111 Short-term -111 80 -4 15 -20 -34 -29 29 Long-term 224 107 -26 -126 -150 -151 -153 -140 Shares and other equity 231 202 182 156 223 224 250 220 of which: Unlisted shares and other equity 198 169 152 121 184 199 206 177 Trade credits and advances . . 50 29 23 8 6 -9 Other liabilities -31 -3 40 88 89 42 -22 -36 Net capital transfers receivable (-) -92 -78 -78 -81 -72 -64 -64 -62 = Net saving 143 154 62 77 72 61 79 69
Financial balance sheet
Financial assets (+) 16,058 16,239 16,898 16,985 17,451 17,765 17,852 18,146 Currency and deposits . . . . . . . . Debt securities 363 361 362 333 333 325 336 321 Loans 3,254 3,379 3,413 3,356 3,364 3,341 3,329 3,355 Shares and other equity 7,107 6,950 7,548 7,678 8,072 8,254 8,477 8,698 of which: Unlisted shares and other equity 5,721 5,795 6,228 6,348 6,641 6,717 6,899 7,064 of which: Investment fund shares 318 268 296 285 293 311 317 324 Other financial assets 3,455 3,593 3,503 3,606 3,614 3,704 3,716 3,659 Financial liabilities (-) 25,494 24,907 25,958 26,016 26,815 27,201 27,247 27,558 Debt securities 842 834 995 1,010 1,041 1,052 1,079 1,096 Short-term 30 40 41 50 50 36 39 32 Long-term 811 794 954 960 991 1,016 1,040 1,063 Loans 9,039 9,181 9,104 9,042 9,004 8,829 8,790 8,842 Short-term 2,296 2,354 2,310 2,365 2,324 2,229 2,274 2,335 Long-term 6,743 6,827 6,794 6,677 6,681 6,599 6,516 6,508 Shares and other equity 12,030 11,312 12,313 12,537 13,394 13,890 14,025 14,222 of which: Unlisted shares and other equity 8,480 8,272 8,820 8,942 9,448 9,619 9,608 9,748 Trade credits and advances . . 2,392 2,353 2,343 2,398 2,348 2,384 Other liabilities 396 406 1,100 1,019 978 978 950 959Sources: ECB and Eurostat.
3.2 Households (EUR billions; four-quarter cumulated flows; outstanding amounts at end of period)
S 30ECBMonthly BulletinDecember 2014
2012 Q3- 2012 Q4- 2013 Q1- 2013 Q2- 2013 Q3-2010 2011 2012 2013 Q2 2013 Q3 2013 Q4 2014 Q1 2014 Q2
Income, saving and changes in net worth
Compensation of employees (+) 4,570 4,672 4,726 4,738 4,751 4,772 4,794 4,818 Gross operating surplus and mixed income (+) 1,488 1,530 1,512 1,522 1,528 1,545 1,551 1,554 Interest receivable (+) 191 212 200 186 180 176 172 170 Interest payable (-) 128 147 130 116 110 107 104 102 Other property income, net (+) 736 758 765 746 754 754 749 744 Current taxes on income and wealth (-) 869 901 948 965 972 977 984 990 Social contributions, net (-) 1,718 1,766 1,804 1,819 1,827 1,834 1,841 1,851 Social benefits, net (+) 1,812 1,837 1,882 1,903 1,913 1,924 1,930 1,938 Net current transfers receivable (+) 71 70 77 77 76 81 82 83 = Gross disposable income 6,153 6,267 6,280 6,273 6,294 6,333 6,349 6,362 Final consumption expenditure (-) 5,367 5,512 5,538 5,535 5,551 5,561 5,580 5,602 Changes in net worth in pension funds (+) 72 73 76 76 78 78 79 80 = Gross saving 859 828 818 814 821 850 848 841 Consumption of fixed capital (-) 429 440 449 452 453 455 456 459 Net capital transfers receivable (+) 35 7 5 6 2 -3 -4 -7 Other changes in net worth (+) 644 -210 -142 -408 -204 -164 253 658 = Changes in net worth 1,109 185 232 -40 165 228 640 1,033
Investment, financing and changes in net worth
Net acquisition of non-financial assets (+) 571 580 557 543 541 537 538 537 Consumption of fixed capital (-) 429 440 449 452 453 455 456 459 Financial investment (+), of which: 462 363 342 378 349 330 326 339 Short-term assets 42 126 193 165 132 92 69 96 Currency and deposits 119 118 225 218 189 130 104 128 Money market fund (MMF) shares -50 -70 8 65 68 44 41 59 Debt securities 1) -17 30 0 -22 -30 -24 -15 -9 Long-term assets 388 237 144 167 192 199 231 207 Deposits 57 54 10 10 28 58 61 43 Debt securities -23 67 -91 -137 -155 -141 -120 -111 Shares and other equity 104 -1 95 148 165 120 127 111 Listed and unlisted shares and other equity 95 47 56 53 70 62 67 30 Non-MMF investment fund shares 9 -47 39 95 95 58 60 81 Life insurance and pension entitlements . . 32 116 154 162 163 165 Financing (-) , 177 87 32 -11 -24 -24 1 54 of which: Loans 114 88 11 -17 -6 -22 -14 -1 of which: From euro area MFIs 147 81 23 -1 5 -6 -6 -35 Other changes in assets (+) Non-financial assets 2) 78 -212 -1,182 -1,342 -1,051 -1,142 -781 -535 Financial assets 198 -379 600 379 304 403 487 707 Shares and other equity 52 -334 372 260 287 427 381 526 Life insurance and pension entitlements . . 44 30 9 -17 72 148 Remaining net flows (+) 376 361 381 483 495 573 538 478 = Changes in net worth 1,109 185 232 -40 165 228 640 1,033
Balance sheet
Non-financial assets 2) (+) 29,932 30,299 29,674 29,248 29,369 29,068 28,992 29,249 of which: Housing wealth 28,427 28,749 28,104 27,658 27,770 27,462 27,376 27,625 Financial assets (+) 18,620 18,613 19,545 19,716 19,889 20,261 20,466 20,695 Short-term assets 5,834 5,973 6,143 6,196 6,173 6,222 6,223 6,289 Currency and deposits 5,597 5,728 5,949 6,031 6,018 6,076 6,084 6,159 Money market fund (MMF) shares 1,274 1,153 1,250 1,311 1,343 1,372 1,408 1,485 Debt securities 1) 53 78 73 56 54 49 49 46 Long-term assets 11,650 11,464 12,239 12,286 12,505 12,843 13,018 13,214 Deposits 1,062 1,114 1,133 1,152 1,166 1,190 1,190 1,183 Debt securities 1,296 1,266 1,240 1,132 1,104 1,087 1,095 1,078 Shares and other equity 4,142 3,804 4,187 4,247 4,451 4,715 4,740 4,827 Listed and unlisted shares and other equity 3,027 2,799 3,126 3,119 3,294 3,533 3,530 3,546 Non-MMF investment fund shares 1,116 1,006 1,060 1,128 1,157 1,182 1,210 1,280 Life insurance and pension entitlements . . 5,704 5,778 5,794 5,853 5,973 6,026 Liabilities (-) 6,679 6,845 6,866 6,819 6,794 6,799 6,807 6,829 of which: Loans 6,094 6,184 6,187 6,158 6,156 6,143 6,126 6,141 of which: From euro area MFIs 5,189 5,257 5,269 5,259 5,251 5,239 5,226 5,196 = Net worth 41,841 42,026 42,258 42,072 42,406 42,486 42,610 43,105Sources: ECB and Eurostat.1) Securities issued by MFIs with an original maturity of less than two years and securities issued by other sectors with an original maturity of less than one year.2) Non-financial assets are compiled in accordance with the ESA 95 standard.
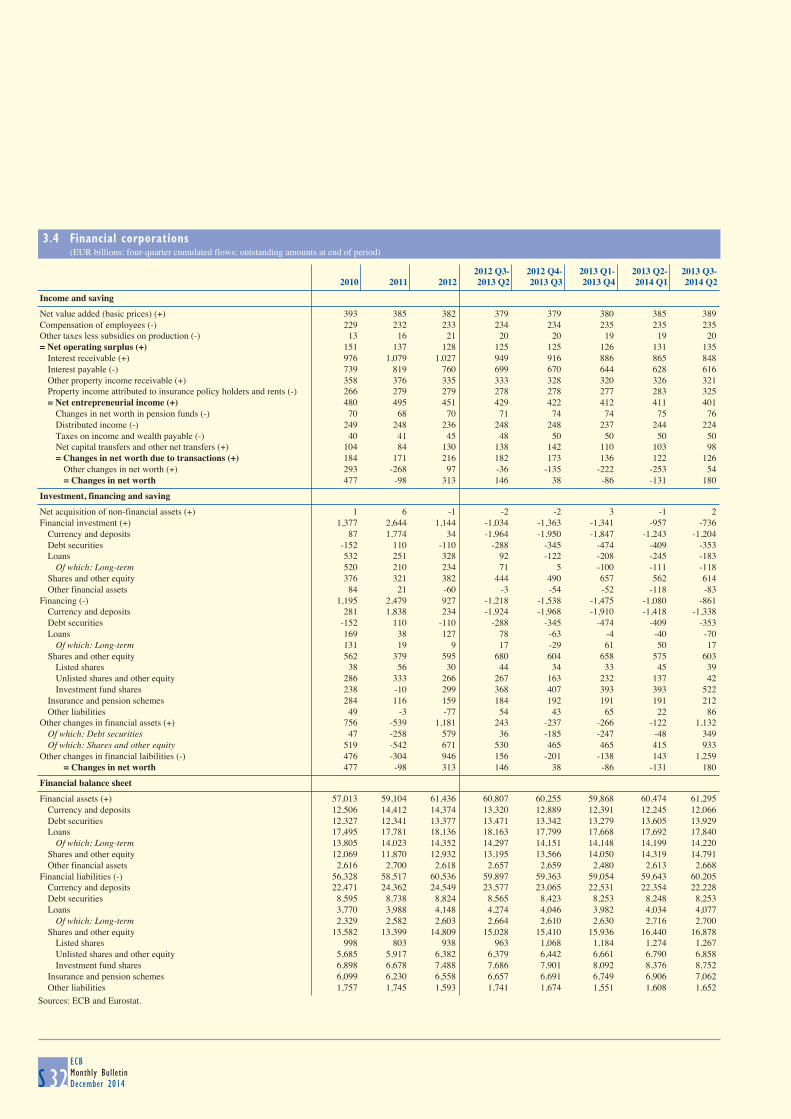
3.4 Financial corporations (EUR billions; four-quarter cumulated flows; outstanding amounts at end of period)
S 32ECBMonthly BulletinDecember 2014
2012 Q3- 2012 Q4- 2013 Q1- 2013 Q2- 2013 Q3-2010 2011 2012 2013 Q2 2013 Q3 2013 Q4 2014 Q1 2014 Q2
Income and saving
Net value added (basic prices) (+) 393 385 382 379 379 380 385 389 Compensation of employees (-) 229 232 233 234 234 235 235 235 Other taxes less subsidies on production (-) 13 16 21 20 20 19 19 20 = Net operating surplus (+) 151 137 128 125 125 126 131 135 Interest receivable (+) 976 1,079 1,027 949 916 886 865 848 Interest payable (-) 739 819 760 699 670 644 628 616 Other property income receivable (+) 358 376 335 333 328 320 326 321 Property income attributed to insurance policy holders and rents (-) 266 279 279 278 278 277 283 325 = Net entrepreneurial income (+) 480 495 451 429 422 412 411 401 Changes in net worth in pension funds (-) 70 68 70 71 74 74 75 76 Distributed income (-) 249 248 236 248 248 237 244 224 Taxes on income and wealth payable (-) 40 41 45 48 50 50 50 50 Net capital transfers and other net transfers (+) 104 84 130 138 142 110 103 98 = Changes in net worth due to transactions (+) 184 171 216 182 173 136 122 126 Other changes in net worth (+) 293 -268 97 -36 -135 -222 -253 54 = Changes in net worth 477 -98 313 146 38 -86 -131 180
Investment, financing and saving
Net acquisition of non-financial assets (+) 1 6 -1 -2 -2 3 -1 2 Financial investment (+) 1,377 2,644 1,144 -1,034 -1,363 -1,341 -957 -736 Currency and deposits 87 1,774 34 -1,964 -1,950 -1,847 -1,243 -1,204 Debt securities -152 110 -110 -288 -345 -474 -409 -353 Loans 532 251 328 92 -122 -208 -245 -183 Of which: Long-term 520 210 234 71 5 -100 -111 -118 Shares and other equity 376 321 382 444 490 657 562 614 Other financial assets 84 21 -60 -3 -54 -52 -118 -83 Financing (-) 1,195 2,479 927 -1,218 -1,538 -1,475 -1,080 -861 Currency and deposits 281 1,838 234 -1,924 -1,968 -1,910 -1,418 -1,338 Debt securities -152 110 -110 -288 -345 -474 -409 -353 Loans 169 38 127 78 -63 -4 -40 -70 Of which: Long-term 131 19 9 17 -29 61 50 17 Shares and other equity 562 379 595 680 604 658 575 603 Listed shares 38 56 30 44 34 33 45 39 Unlisted shares and other equity 286 333 266 267 163 232 137 42 Investment fund shares 238 -10 299 368 407 393 393 522 Insurance and pension schemes 284 116 159 184 192 191 191 212 Other liabilities 49 -3 -77 54 43 65 22 86 Other changes in financial assets (+) 756 -539 1,181 243 -237 -266 -122 1,132 Of which: Debt securities 47 -258 579 36 -185 -247 -48 349 Of which: Shares and other equity 519 -542 671 530 465 465 415 933 Other changes in financial laibilities (-) 476 -304 946 156 -201 -138 143 1,259 = Changes in net worth 477 -98 313 146 38 -86 -131 180
Financial balance sheet
Financial assets (+) 57,013 59,104 61,436 60,807 60,255 59,868 60,474 61,295 Currency and deposits 12,506 14,412 14,374 13,320 12,889 12,391 12,245 12,066 Debt securities 12,327 12,341 13,377 13,471 13,342 13,279 13,605 13,929 Loans 17,495 17,781 18,136 18,163 17,799 17,668 17,692 17,840 Of which: Long-term 13,805 14,023 14,352 14,297 14,151 14,148 14,199 14,220 Shares and other equity 12,069 11,870 12,932 13,195 13,566 14,050 14,319 14,791 Other financial assets 2,616 2,700 2,618 2,657 2,659 2,480 2,613 2,668 Financial liabilities (-) 56,328 58,517 60,536 59,897 59,363 59,054 59,643 60,205 Currency and deposits 22,471 24,362 24,549 23,577 23,065 22,531 22,354 22,228 Debt securities 8,595 8,738 8,824 8,565 8,423 8,253 8,248 8,253 Loans 3,770 3,988 4,148 4,274 4,046 3,982 4,034 4,077 Of which: Long-term 2,329 2,582 2,603 2,664 2,610 2,630 2,716 2,700 Shares and other equity 13,582 13,399 14,809 15,028 15,410 15,936 16,440 16,878 Listed shares 998 803 938 963 1,068 1,184 1,274 1,267 Unlisted shares and other equity 5,685 5,917 6,382 6,379 6,442 6,661 6,790 6,858 Investment fund shares 6,898 6,678 7,488 7,686 7,901 8,092 8,376 8,752 Insurance and pension schemes 6,099 6,230 6,558 6,657 6,691 6,749 6,906 7,062 Other liabilities 1,757 1,745 1,593 1,741 1,674 1,551 1,608 1,652Sources: ECB and Eurostat.
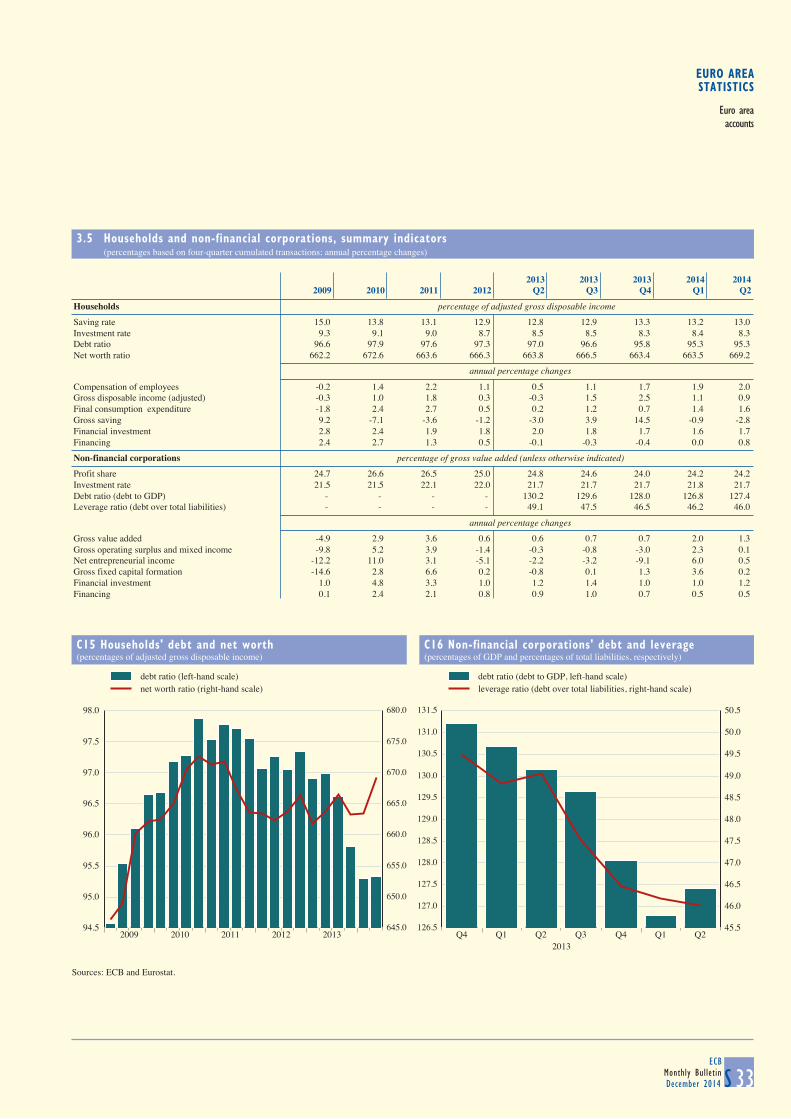
3.5 Households and non-financial corporations, summary indicators (percentages based on four-quarter cumulated transactions; annual percentage changes)
S 33ECB
Monthly BulletinDecember 2014
2013 2013 2013 2014 20142009 2010 2011 2012 Q2 Q3 Q4 Q1 Q2
Households percentage of adjusted gross disposable income
Saving rate 15.0 13.8 13.1 12.9 12.8 12.9 13.3 13.2 13.0 Investment rate 9.3 9.1 9.0 8.7 8.5 8.5 8.3 8.4 8.3 Debt ratio 96.6 97.9 97.6 97.3 97.0 96.6 95.8 95.3 95.3 Net worth ratio 662.2 672.6 663.6 666.3 663.8 666.5 663.4 663.5 669.2
annual percentage changes
Compensation of employees -0.2 1.4 2.2 1.1 0.5 1.1 1.7 1.9 2.0 Gross disposable income (adjusted) -0.3 1.0 1.8 0.3 -0.3 1.5 2.5 1.1 0.9 Final consumption expenditure -1.8 2.4 2.7 0.5 0.2 1.2 0.7 1.4 1.6 Gross saving 9.2 -7.1 -3.6 -1.2 -3.0 3.9 14.5 -0.9 -2.8 Financial investment 2.8 2.4 1.9 1.8 2.0 1.8 1.7 1.6 1.7 Financing 2.4 2.7 1.3 0.5 -0.1 -0.3 -0.4 0.0 0.8
Non-financial corporations percentage of gross value added (unless otherwise indicated)
Profit share 24.7 26.6 26.5 25.0 24.8 24.6 24.0 24.2 24.2 Investment rate 21.5 21.5 22.1 22.0 21.7 21.7 21.7 21.8 21.7 Debt ratio (debt to GDP) - - - - 130.2 129.6 128.0 126.8 127.4 Leverage ratio (debt over total liabilities) - - - - 49.1 47.5 46.5 46.2 46.0
annual percentage changes
Gross value added -4.9 2.9 3.6 0.6 0.6 0.7 0.7 2.0 1.3 Gross operating surplus and mixed income -9.8 5.2 3.9 -1.4 -0.3 -0.8 -3.0 2.3 0.1 Net entrepreneurial income -12.2 11.0 3.1 -5.1 -2.2 -3.2 -9.1 6.0 0.5 Gross fixed capital formation -14.6 2.8 6.6 0.2 -0.8 0.1 1.3 3.6 0.2 Financial investment 1.0 4.8 3.3 1.0 1.2 1.4 1.0 1.0 1.2 Financing 0.1 2.4 2.1 0.8 0.9 1.0 0.7 0.5 0.5
C15 Households' debt and net worth
(percentages of adjusted gross disposable income)
C16 Non-financial corporations' debt and leverage
(percentages of GDP and percentages of total liabilities, respectively)
94.5
95.0
95.5
96.0
96.5
97.0
97.5
98.0
2009 2010 2011 2012 2013645.0
650.0
655.0
660.0
665.0
670.0
675.0
680.0
debt ratio (left-hand scale)net worth ratio (right-hand scale)
126.5
127.0
127.5
128.0
128.5
129.0
129.5
130.0
130.5
131.0
131.5
Q4 Q1 Q2 Q3 Q4 Q1 Q22013
45.5
46.0
46.5
47.0
47.5
48.0
48.5
49.0
49.5
50.0
50.5
debt ratio (debt to GDP, left-hand scale)leverage ratio (debt over total liabilities, right-hand scale)
Sources: ECB and Eurostat.
3.4 Financial corporations (EUR billions; four-quarter cumulated flows; outstanding amounts at end of period)
S 32ECBMonthly BulletinDecember 2014
2012 Q3- 2012 Q4- 2013 Q1- 2013 Q2- 2013 Q3-2010 2011 2012 2013 Q2 2013 Q3 2013 Q4 2014 Q1 2014 Q2
Income and saving
Net value added (basic prices) (+) 393 385 382 379 379 380 385 389 Compensation of employees (-) 229 232 233 234 234 235 235 235 Other taxes less subsidies on production (-) 13 16 21 20 20 19 19 20 = Net operating surplus (+) 151 137 128 125 125 126 131 135 Interest receivable (+) 976 1,079 1,027 949 916 886 865 848 Interest payable (-) 739 819 760 699 670 644 628 616 Other property income receivable (+) 358 376 335 333 328 320 326 321 Property income attributed to insurance policy holders and rents (-) 266 279 279 278 278 277 283 325 = Net entrepreneurial income (+) 480 495 451 429 422 412 411 401 Changes in net worth in pension funds (-) 70 68 70 71 74 74 75 76 Distributed income (-) 249 248 236 248 248 237 244 224 Taxes on income and wealth payable (-) 40 41 45 48 50 50 50 50 Net capital transfers and other net transfers (+) 104 84 130 138 142 110 103 98 = Changes in net worth due to transactions (+) 184 171 216 182 173 136 122 126 Other changes in net worth (+) 293 -268 97 -36 -135 -222 -253 54 = Changes in net worth 477 -98 313 146 38 -86 -131 180
Investment, financing and saving
Net acquisition of non-financial assets (+) 1 6 -1 -2 -2 3 -1 2 Financial investment (+) 1,377 2,644 1,144 -1,034 -1,363 -1,341 -957 -736 Currency and deposits 87 1,774 34 -1,964 -1,950 -1,847 -1,243 -1,204 Debt securities -152 110 -110 -288 -345 -474 -409 -353 Loans 532 251 328 92 -122 -208 -245 -183 Of which: Long-term 520 210 234 71 5 -100 -111 -118 Shares and other equity 376 321 382 444 490 657 562 614 Other financial assets 84 21 -60 -3 -54 -52 -118 -83 Financing (-) 1,195 2,479 927 -1,218 -1,538 -1,475 -1,080 -861 Currency and deposits 281 1,838 234 -1,924 -1,968 -1,910 -1,418 -1,338 Debt securities -152 110 -110 -288 -345 -474 -409 -353 Loans 169 38 127 78 -63 -4 -40 -70 Of which: Long-term 131 19 9 17 -29 61 50 17 Shares and other equity 562 379 595 680 604 658 575 603 Listed shares 38 56 30 44 34 33 45 39 Unlisted shares and other equity 286 333 266 267 163 232 137 42 Investment fund shares 238 -10 299 368 407 393 393 522 Insurance and pension schemes 284 116 159 184 192 191 191 212 Other liabilities 49 -3 -77 54 43 65 22 86 Other changes in financial assets (+) 756 -539 1,181 243 -237 -266 -122 1,132 Of which: Debt securities 47 -258 579 36 -185 -247 -48 349 Of which: Shares and other equity 519 -542 671 530 465 465 415 933 Other changes in financial laibilities (-) 476 -304 946 156 -201 -138 143 1,259 = Changes in net worth 477 -98 313 146 38 -86 -131 180
Financial balance sheet
Financial assets (+) 57,013 59,104 61,436 60,807 60,255 59,868 60,474 61,295 Currency and deposits 12,506 14,412 14,374 13,320 12,889 12,391 12,245 12,066 Debt securities 12,327 12,341 13,377 13,471 13,342 13,279 13,605 13,929 Loans 17,495 17,781 18,136 18,163 17,799 17,668 17,692 17,840 Of which: Long-term 13,805 14,023 14,352 14,297 14,151 14,148 14,199 14,220 Shares and other equity 12,069 11,870 12,932 13,195 13,566 14,050 14,319 14,791 Other financial assets 2,616 2,700 2,618 2,657 2,659 2,480 2,613 2,668 Financial liabilities (-) 56,328 58,517 60,536 59,897 59,363 59,054 59,643 60,205 Currency and deposits 22,471 24,362 24,549 23,577 23,065 22,531 22,354 22,228 Debt securities 8,595 8,738 8,824 8,565 8,423 8,253 8,248 8,253 Loans 3,770 3,988 4,148 4,274 4,046 3,982 4,034 4,077 Of which: Long-term 2,329 2,582 2,603 2,664 2,610 2,630 2,716 2,700 Shares and other equity 13,582 13,399 14,809 15,028 15,410 15,936 16,440 16,878 Listed shares 998 803 938 963 1,068 1,184 1,274 1,267 Unlisted shares and other equity 5,685 5,917 6,382 6,379 6,442 6,661 6,790 6,858 Investment fund shares 6,898 6,678 7,488 7,686 7,901 8,092 8,376 8,752 Insurance and pension schemes 6,099 6,230 6,558 6,657 6,691 6,749 6,906 7,062 Other liabilities 1,757 1,745 1,593 1,741 1,674 1,551 1,608 1,652Sources: ECB and Eurostat.
euro areastatistics
Euro areaaccounts
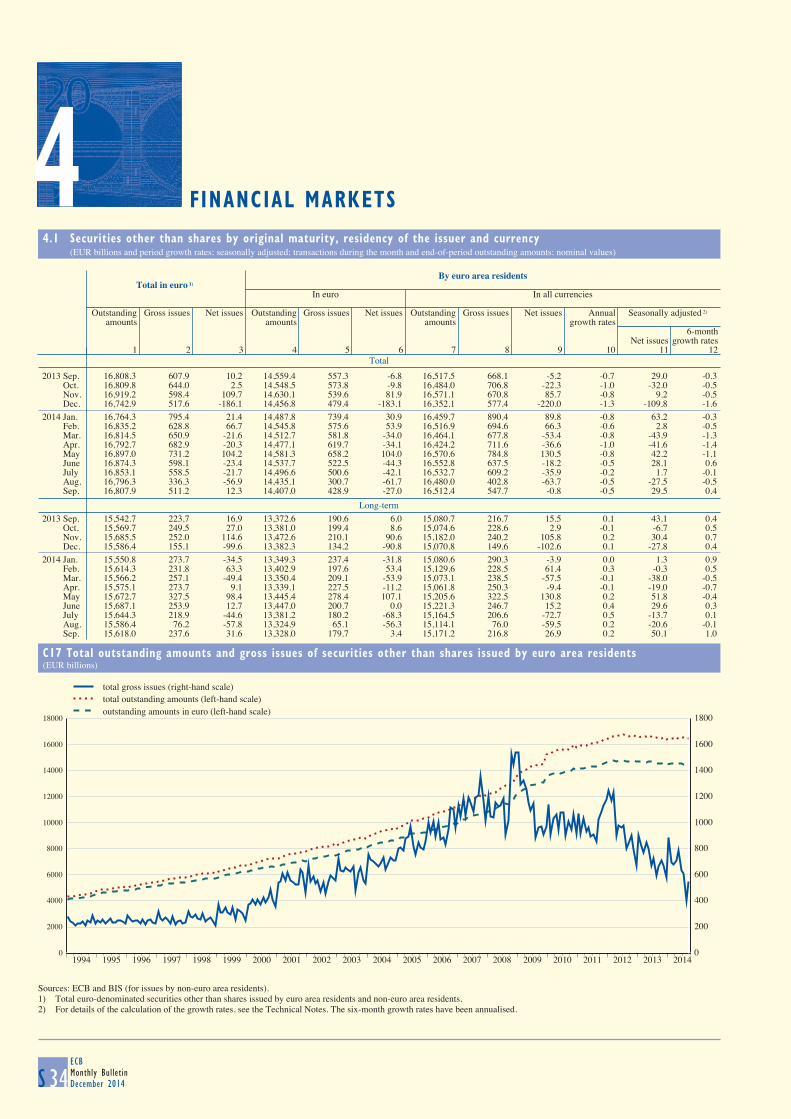
4 FINANCIAL MARKETS
4.1 Securities other than shares by original maturity, residency of the issuer and currency (EUR billions and period growth rates; seasonally adjusted; transactions during the month and end-of-period outstanding amounts; nominal values)
S 34ECBMonthly BulletinDecember 2014
Total
By euro area residents
Total in euro 1) In euro In all currencies
Outstanding Gross issues Net issues Outstanding Gross issues Net issues Outstanding Gross issues Net issues Annual Seasonally adjusted 2)
amounts amounts amounts growth rates6-month
Net issues growth rates1 2 3 4 5 6 7 8 9 10 11 12
2013 Sep. 16,808.3 607.9 10.2 14,559.4 557.3 -6.8 16,517.5 668.1 -5.2 -0.7 29.0 -0.3 Oct. 16,809.8 644.0 2.5 14,548.5 573.8 -9.8 16,484.0 706.8 -22.3 -1.0 -32.0 -0.5 Nov. 16,919.2 598.4 109.7 14,630.1 539.6 81.9 16,571.1 670.8 85.7 -0.8 9.2 -0.5 Dec. 16,742.9 517.6 -186.1 14,456.8 479.4 -183.1 16,352.1 577.4 -220.0 -1.3 -109.8 -1.62014 Jan. 16,764.3 795.4 21.4 14,487.8 739.4 30.9 16,459.7 890.4 89.8 -0.8 63.2 -0.3 Feb. 16,835.2 628.8 66.7 14,545.8 575.6 53.9 16,516.9 694.6 66.3 -0.6 2.8 -0.5 Mar. 16,814.5 650.9 -21.6 14,512.7 581.8 -34.0 16,464.1 677.8 -53.4 -0.8 -43.9 -1.3 Apr. 16,792.7 682.9 -20.3 14,477.1 619.7 -34.1 16,424.2 711.6 -36.6 -1.0 -41.6 -1.4 May 16,897.0 731.2 104.2 14,581.3 658.2 104.0 16,570.6 784.8 130.5 -0.8 42.2 -1.1 June 16,874.3 598.1 -23.4 14,537.7 522.5 -44.3 16,552.8 637.5 -18.2 -0.5 28.1 0.6 July 16,853.1 558.5 -21.7 14,496.6 500.6 -42.1 16,532.7 609.2 -35.9 -0.2 1.7 -0.1 Aug. 16,796.3 336.3 -56.9 14,435.1 300.7 -61.7 16,480.0 402.8 -63.7 -0.5 -27.5 -0.5 Sep. 16,807.9 511.2 12.3 14,407.0 428.9 -27.0 16,512.4 547.7 -0.8 -0.5 29.5 0.4
Long-term
2013 Sep. 15,542.7 223.7 16.9 13,372.6 190.6 6.0 15,080.7 216.7 15.5 0.1 43.1 0.4 Oct. 15,569.7 249.5 27.0 13,381.0 199.4 8.6 15,074.6 228.6 2.9 -0.1 -6.7 0.5 Nov. 15,685.5 252.0 114.6 13,472.6 210.1 90.6 15,182.0 240.2 105.8 0.2 30.4 0.7 Dec. 15,586.4 155.1 -99.6 13,382.3 134.2 -90.8 15,070.8 149.6 -102.6 0.1 -27.8 0.42014 Jan. 15,550.8 273.7 -34.5 13,349.3 237.4 -31.8 15,080.6 290.3 -3.9 0.0 1.3 0.9 Feb. 15,614.3 231.8 63.3 13,402.9 197.6 53.4 15,129.6 228.5 61.4 0.3 -0.3 0.5 Mar. 15,566.2 257.1 -49.4 13,350.4 209.1 -53.9 15,073.1 238.5 -57.5 -0.1 -38.0 -0.5 Apr. 15,575.1 273.7 9.1 13,339.1 227.5 -11.2 15,061.8 250.3 -9.4 -0.1 -19.0 -0.7 May 15,672.7 327.5 98.4 13,445.4 278.4 107.1 15,205.6 322.5 130.8 0.2 51.8 -0.4 June 15,687.1 253.9 12.7 13,447.0 200.7 0.0 15,221.3 246.7 15.2 0.4 29.6 0.3 July 15,644.3 218.9 -44.6 13,381.2 180.2 -68.3 15,164.5 206.6 -72.7 0.5 -13.7 0.1 Aug. 15,586.4 76.2 -57.8 13,324.9 65.1 -56.3 15,114.1 76.0 -59.5 0.2 -20.6 -0.1 Sep. 15,618.0 237.6 31.6 13,328.0 179.7 3.4 15,171.2 216.8 26.9 0.2 50.1 1.0
C17 Total outstanding amounts and gross issues of securities other than shares issued by euro area residents
(EUR billions)
0
2000
4000
6000
8000
10000
12000
14000
16000
18000
1994 1995 1996 1997 1998 1999 2000 2001 2002 2003 2004 2005 2006 2007 2008 2009 2010 2011 2012 2013 20140
200
400
600
800
1000
1200
1400
1600
1800
total gross issues (right-hand scale)total outstanding amounts (left-hand scale)outstanding amounts in euro (left-hand scale)
Sources: ECB and BIS (for issues by non-euro area residents).1) Total euro-denominated securities other than shares issued by euro area residents and non-euro area residents.2) For details of the calculation of the growth rates, see the Technical Notes. The six-month growth rates have been annualised.
4
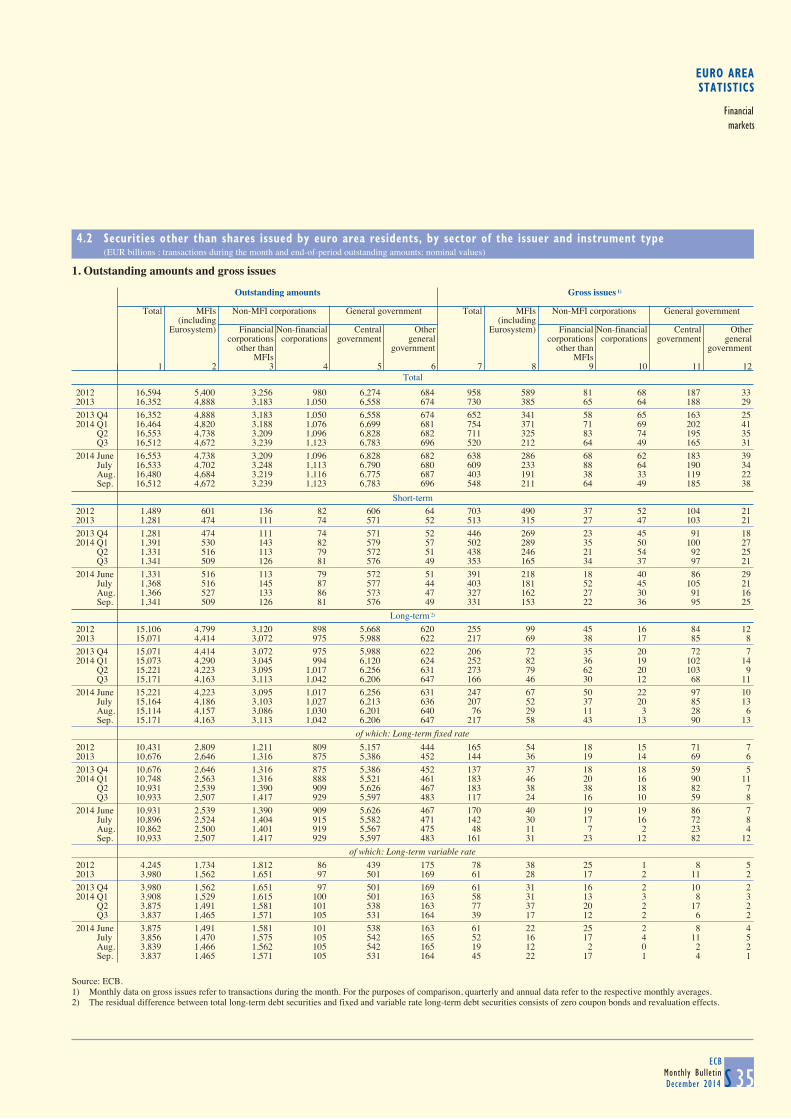
EURO AREASTATISTICS
Financialmarkets
4.2 Securities other than shares issued by euro area residents, by sector of the issuer and instrument type (EUR billions ; transactions during the month and end-of-period outstanding amounts; nominal values)
S 35ECB
Monthly BulletinDecember 2014
1. Outstanding amounts and gross issues
Total
Outstanding amounts Gross issues 1)
Total MFIs Non-MFI corporations General government Total MFIs Non-MFI corporations General government
(including (includingEurosystem) Financial Non-financial Central Other Eurosystem) Financial Non-financial Central Other
corporations corporations government general corporations corporations government generalother than government other than government
MFIs MFIs1 2 3 4 5 6 7 8 9 10 11 12
2012 16,594 5,400 3,256 980 6,274 684 958 589 81 68 187 332013 16,352 4,888 3,183 1,050 6,558 674 730 385 65 64 188 292013 Q4 16,352 4,888 3,183 1,050 6,558 674 652 341 58 65 163 252014 Q1 16,464 4,820 3,188 1,076 6,699 681 754 371 71 69 202 41 Q2 16,553 4,738 3,209 1,096 6,828 682 711 325 83 74 195 35 Q3 16,512 4,672 3,239 1,123 6,783 696 520 212 64 49 165 312014 June 16,553 4,738 3,209 1,096 6,828 682 638 286 68 62 183 39 July 16,533 4,702 3,248 1,113 6,790 680 609 233 88 64 190 34 Aug. 16,480 4,684 3,219 1,116 6,775 687 403 191 38 33 119 22 Sep. 16,512 4,672 3,239 1,123 6,783 696 548 211 64 49 185 38
Short-term
2012 1,489 601 136 82 606 64 703 490 37 52 104 212013 1,281 474 111 74 571 52 513 315 27 47 103 212013 Q4 1,281 474 111 74 571 52 446 269 23 45 91 182014 Q1 1,391 530 143 82 579 57 502 289 35 50 100 27 Q2 1,331 516 113 79 572 51 438 246 21 54 92 25 Q3 1,341 509 126 81 576 49 353 165 34 37 97 212014 June 1,331 516 113 79 572 51 391 218 18 40 86 29 July 1,368 516 145 87 577 44 403 181 52 45 105 21 Aug. 1,366 527 133 86 573 47 327 162 27 30 91 16 Sep. 1,341 509 126 81 576 49 331 153 22 36 95 25
Long-term 2)
2012 15,106 4,799 3,120 898 5,668 620 255 99 45 16 84 122013 15,071 4,414 3,072 975 5,988 622 217 69 38 17 85 82013 Q4 15,071 4,414 3,072 975 5,988 622 206 72 35 20 72 72014 Q1 15,073 4,290 3,045 994 6,120 624 252 82 36 19 102 14 Q2 15,221 4,223 3,095 1,017 6,256 631 273 79 62 20 103 9 Q3 15,171 4,163 3,113 1,042 6,206 647 166 46 30 12 68 112014 June 15,221 4,223 3,095 1,017 6,256 631 247 67 50 22 97 10 July 15,164 4,186 3,103 1,027 6,213 636 207 52 37 20 85 13 Aug. 15,114 4,157 3,086 1,030 6,201 640 76 29 11 3 28 6 Sep. 15,171 4,163 3,113 1,042 6,206 647 217 58 43 13 90 13
of which: Long-term fixed rate
2012 10,431 2,809 1,211 809 5,157 444 165 54 18 15 71 72013 10,676 2,646 1,316 875 5,386 452 144 36 19 14 69 62013 Q4 10,676 2,646 1,316 875 5,386 452 137 37 18 18 59 52014 Q1 10,748 2,563 1,316 888 5,521 461 183 46 20 16 90 11 Q2 10,931 2,539 1,390 909 5,626 467 183 38 38 18 82 7 Q3 10,933 2,507 1,417 929 5,597 483 117 24 16 10 59 82014 June 10,931 2,539 1,390 909 5,626 467 170 40 19 19 86 7 July 10,896 2,524 1,404 915 5,582 471 142 30 17 16 72 8 Aug. 10,862 2,500 1,401 919 5,567 475 48 11 7 2 23 4 Sep. 10,933 2,507 1,417 929 5,597 483 161 31 23 12 82 12
of which: Long-term variable rate
2012 4,245 1,734 1,812 86 439 175 78 38 25 1 8 52013 3,980 1,562 1,651 97 501 169 61 28 17 2 11 22013 Q4 3,980 1,562 1,651 97 501 169 61 31 16 2 10 22014 Q1 3,908 1,529 1,615 100 501 163 58 31 13 3 8 3 Q2 3,875 1,491 1,581 101 538 163 77 37 20 2 17 2 Q3 3,837 1,465 1,571 105 531 164 39 17 12 2 6 22014 June 3,875 1,491 1,581 101 538 163 61 22 25 2 8 4 July 3,856 1,470 1,575 105 542 165 52 16 17 4 11 5 Aug. 3,839 1,466 1,562 105 542 165 19 12 2 0 2 2 Sep. 3,837 1,465 1,571 105 531 164 45 22 17 1 4 1
Source: ECB.1) Monthly data on gross issues refer to transactions during the month. For the purposes of comparison, quarterly and annual data refer to the respective monthly averages.2) The residual difference between total long-term debt securities and fixed and variable rate long-term debt securities consists of zero coupon bonds and revaluation effects.
4 FINANCIAL MARKETS
4.1 Securities other than shares by original maturity, residency of the issuer and currency (EUR billions and period growth rates; seasonally adjusted; transactions during the month and end-of-period outstanding amounts; nominal values)
S 34ECBMonthly BulletinDecember 2014
Total
By euro area residents
Total in euro 1) In euro In all currencies
Outstanding Gross issues Net issues Outstanding Gross issues Net issues Outstanding Gross issues Net issues Annual Seasonally adjusted 2)
amounts amounts amounts growth rates6-month
Net issues growth rates1 2 3 4 5 6 7 8 9 10 11 12
2013 Sep. 16,808.3 607.9 10.2 14,559.4 557.3 -6.8 16,517.5 668.1 -5.2 -0.7 29.0 -0.3 Oct. 16,809.8 644.0 2.5 14,548.5 573.8 -9.8 16,484.0 706.8 -22.3 -1.0 -32.0 -0.5 Nov. 16,919.2 598.4 109.7 14,630.1 539.6 81.9 16,571.1 670.8 85.7 -0.8 9.2 -0.5 Dec. 16,742.9 517.6 -186.1 14,456.8 479.4 -183.1 16,352.1 577.4 -220.0 -1.3 -109.8 -1.62014 Jan. 16,764.3 795.4 21.4 14,487.8 739.4 30.9 16,459.7 890.4 89.8 -0.8 63.2 -0.3 Feb. 16,835.2 628.8 66.7 14,545.8 575.6 53.9 16,516.9 694.6 66.3 -0.6 2.8 -0.5 Mar. 16,814.5 650.9 -21.6 14,512.7 581.8 -34.0 16,464.1 677.8 -53.4 -0.8 -43.9 -1.3 Apr. 16,792.7 682.9 -20.3 14,477.1 619.7 -34.1 16,424.2 711.6 -36.6 -1.0 -41.6 -1.4 May 16,897.0 731.2 104.2 14,581.3 658.2 104.0 16,570.6 784.8 130.5 -0.8 42.2 -1.1 June 16,874.3 598.1 -23.4 14,537.7 522.5 -44.3 16,552.8 637.5 -18.2 -0.5 28.1 0.6 July 16,853.1 558.5 -21.7 14,496.6 500.6 -42.1 16,532.7 609.2 -35.9 -0.2 1.7 -0.1 Aug. 16,796.3 336.3 -56.9 14,435.1 300.7 -61.7 16,480.0 402.8 -63.7 -0.5 -27.5 -0.5 Sep. 16,807.9 511.2 12.3 14,407.0 428.9 -27.0 16,512.4 547.7 -0.8 -0.5 29.5 0.4
Long-term
2013 Sep. 15,542.7 223.7 16.9 13,372.6 190.6 6.0 15,080.7 216.7 15.5 0.1 43.1 0.4 Oct. 15,569.7 249.5 27.0 13,381.0 199.4 8.6 15,074.6 228.6 2.9 -0.1 -6.7 0.5 Nov. 15,685.5 252.0 114.6 13,472.6 210.1 90.6 15,182.0 240.2 105.8 0.2 30.4 0.7 Dec. 15,586.4 155.1 -99.6 13,382.3 134.2 -90.8 15,070.8 149.6 -102.6 0.1 -27.8 0.42014 Jan. 15,550.8 273.7 -34.5 13,349.3 237.4 -31.8 15,080.6 290.3 -3.9 0.0 1.3 0.9 Feb. 15,614.3 231.8 63.3 13,402.9 197.6 53.4 15,129.6 228.5 61.4 0.3 -0.3 0.5 Mar. 15,566.2 257.1 -49.4 13,350.4 209.1 -53.9 15,073.1 238.5 -57.5 -0.1 -38.0 -0.5 Apr. 15,575.1 273.7 9.1 13,339.1 227.5 -11.2 15,061.8 250.3 -9.4 -0.1 -19.0 -0.7 May 15,672.7 327.5 98.4 13,445.4 278.4 107.1 15,205.6 322.5 130.8 0.2 51.8 -0.4 June 15,687.1 253.9 12.7 13,447.0 200.7 0.0 15,221.3 246.7 15.2 0.4 29.6 0.3 July 15,644.3 218.9 -44.6 13,381.2 180.2 -68.3 15,164.5 206.6 -72.7 0.5 -13.7 0.1 Aug. 15,586.4 76.2 -57.8 13,324.9 65.1 -56.3 15,114.1 76.0 -59.5 0.2 -20.6 -0.1 Sep. 15,618.0 237.6 31.6 13,328.0 179.7 3.4 15,171.2 216.8 26.9 0.2 50.1 1.0
C17 Total outstanding amounts and gross issues of securities other than shares issued by euro area residents
(EUR billions)
0
2000
4000
6000
8000
10000
12000
14000
16000
18000
1994 1995 1996 1997 1998 1999 2000 2001 2002 2003 2004 2005 2006 2007 2008 2009 2010 2011 2012 2013 20140
200
400
600
800
1000
1200
1400
1600
1800
total gross issues (right-hand scale)total outstanding amounts (left-hand scale)outstanding amounts in euro (left-hand scale)
Sources: ECB and BIS (for issues by non-euro area residents).1) Total euro-denominated securities other than shares issued by euro area residents and non-euro area residents.2) For details of the calculation of the growth rates, see the Technical Notes. The six-month growth rates have been annualised.
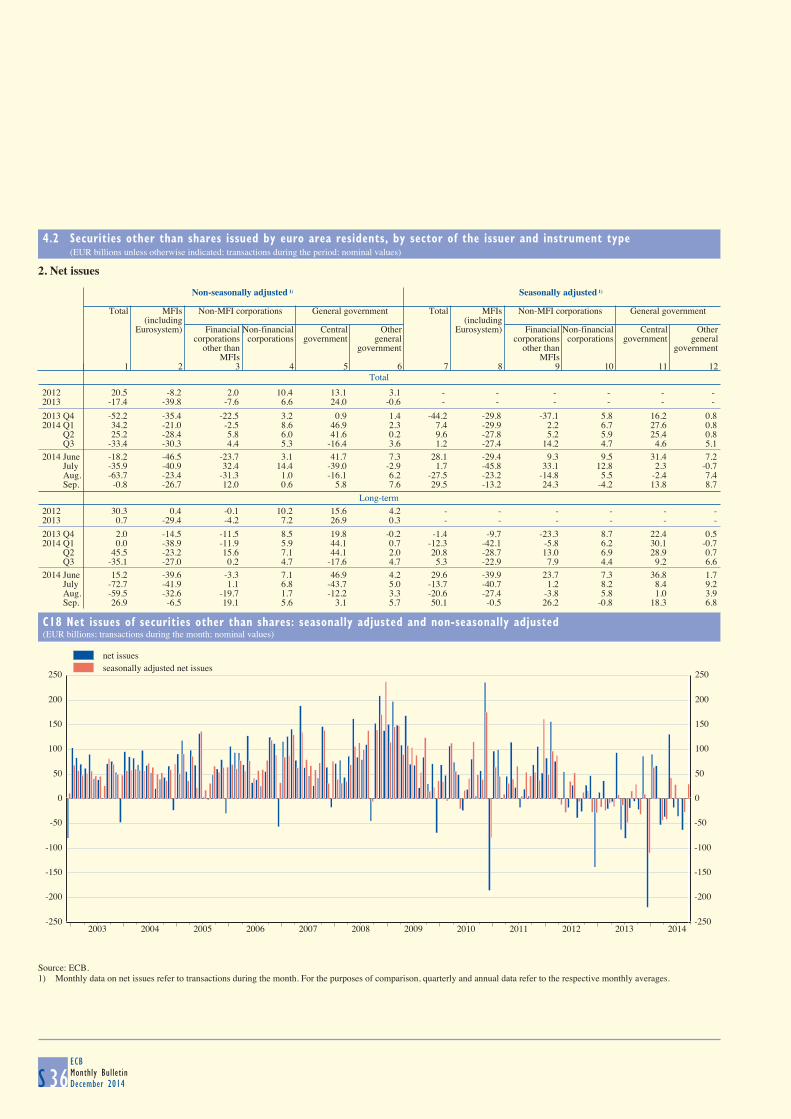
4.2 Securities other than shares issued by euro area residents, by sector of the issuer and instrument type (EUR billions unless otherwise indicated; transactions during the period; nominal values)
S 36ECBMonthly BulletinDecember 2014
2. Net issues
Total
Non-seasonally adjusted 1) Seasonally adjusted 1)
Total MFIs Non-MFI corporations General government Total MFIs Non-MFI corporations General government
(including (includingEurosystem) Financial Non-financial Central Other Eurosystem) Financial Non-financial Central Other
corporations corporations government general corporations corporations government generalother than government other than government
MFIs MFIs1 2 3 4 5 6 7 8 9 10 11 12
2012 20.5 -8.2 2.0 10.4 13.1 3.1 - - - - - - 2013 -17.4 -39.8 -7.6 6.6 24.0 -0.6 - - - - - -
2013 Q4 -52.2 -35.4 -22.5 3.2 0.9 1.4 -44.2 -29.8 -37.1 5.8 16.2 0.82014 Q1 34.2 -21.0 -2.5 8.6 46.9 2.3 7.4 -29.9 2.2 6.7 27.6 0.8 Q2 25.2 -28.4 5.8 6.0 41.6 0.2 9.6 -27.8 5.2 5.9 25.4 0.8 Q3 -33.4 -30.3 4.4 5.3 -16.4 3.6 1.2 -27.4 14.2 4.7 4.6 5.12014 June -18.2 -46.5 -23.7 3.1 41.7 7.3 28.1 -29.4 9.3 9.5 31.4 7.2 July -35.9 -40.9 32.4 14.4 -39.0 -2.9 1.7 -45.8 33.1 12.8 2.3 -0.7 Aug. -63.7 -23.4 -31.3 1.0 -16.1 6.2 -27.5 -23.2 -14.8 5.5 -2.4 7.4 Sep. -0.8 -26.7 12.0 0.6 5.8 7.6 29.5 -13.2 24.3 -4.2 13.8 8.7
Long-term
2012 30.3 0.4 -0.1 10.2 15.6 4.2 - - - - - -2013 0.7 -29.4 -4.2 7.2 26.9 0.3 - - - - - -
2013 Q4 2.0 -14.5 -11.5 8.5 19.8 -0.2 -1.4 -9.7 -23.3 8.7 22.4 0.52014 Q1 0.0 -38.9 -11.9 5.9 44.1 0.7 -12.3 -42.1 -5.8 6.2 30.1 -0.7 Q2 45.5 -23.2 15.6 7.1 44.1 2.0 20.8 -28.7 13.0 6.9 28.9 0.7 Q3 -35.1 -27.0 0.2 4.7 -17.6 4.7 5.3 -22.9 7.9 4.4 9.2 6.62014 June 15.2 -39.6 -3.3 7.1 46.9 4.2 29.6 -39.9 23.7 7.3 36.8 1.7 July -72.7 -41.9 1.1 6.8 -43.7 5.0 -13.7 -40.7 1.2 8.2 8.4 9.2 Aug. -59.5 -32.6 -19.7 1.7 -12.2 3.3 -20.6 -27.4 -3.8 5.8 1.0 3.9 Sep. 26.9 -6.5 19.1 5.6 3.1 5.7 50.1 -0.5 26.2 -0.8 18.3 6.8
C18 Net issues of securities other than shares: seasonally adjusted and non-seasonally adjusted
(EUR billions; transactions during the month; nominal values)
-250
-200
-150
-100
-50
0
50
100
150
200
250
2003 2004 2005 2006 2007 2008 2009 2010 2011 2012 2013 2014-250
-200
-150
-100
-50
0
50
100
150
200
250
net issuesseasonally adjusted net issues
Source: ECB.1) Monthly data on net issues refer to transactions during the month. For the purposes of comparison, quarterly and annual data refer to the respective monthly averages.
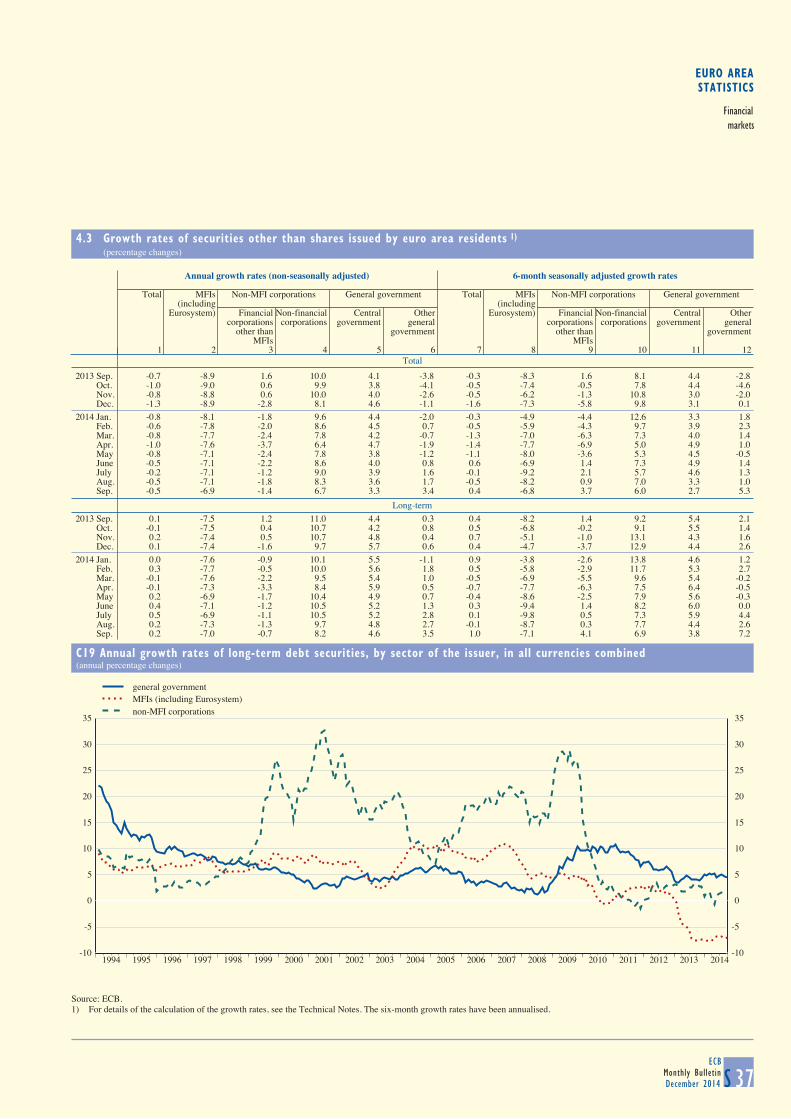
EURO AREASTATISTICS
Financialmarkets
4.3 Growth rates of securities other than shares issued by euro area residents 1) (percentage changes)
S 37ECB
Monthly BulletinDecember 2014
Total
Annual growth rates (non-seasonally adjusted) 6-month seasonally adjusted growth rates
Total MFIs Non-MFI corporations General government Total MFIs Non-MFI corporations General government
(including (includingEurosystem) Financial Non-financial Central Other Eurosystem) Financial Non-financial Central Other
corporations corporations government general corporations corporations government generalother than government other than government
MFIs MFIs1 2 3 4 5 6 7 8 9 10 11 12
2013 Sep. -0.7 -8.9 1.6 10.0 4.1 -3.8 -0.3 -8.3 1.6 8.1 4.4 -2.8 Oct. -1.0 -9.0 0.6 9.9 3.8 -4.1 -0.5 -7.4 -0.5 7.8 4.4 -4.6 Nov. -0.8 -8.8 0.6 10.0 4.0 -2.6 -0.5 -6.2 -1.3 10.8 3.0 -2.0 Dec. -1.3 -8.9 -2.8 8.1 4.6 -1.1 -1.6 -7.3 -5.8 9.8 3.1 0.12014 Jan. -0.8 -8.1 -1.8 9.6 4.4 -2.0 -0.3 -4.9 -4.4 12.6 3.3 1.8 Feb. -0.6 -7.8 -2.0 8.6 4.5 0.7 -0.5 -5.9 -4.3 9.7 3.9 2.3 Mar. -0.8 -7.7 -2.4 7.8 4.2 -0.7 -1.3 -7.0 -6.3 7.3 4.0 1.4 Apr. -1.0 -7.6 -3.7 6.4 4.7 -1.9 -1.4 -7.7 -6.9 5.0 4.9 1.0 May -0.8 -7.1 -2.4 7.8 3.8 -1.2 -1.1 -8.0 -3.6 5.3 4.5 -0.5 June -0.5 -7.1 -2.2 8.6 4.0 0.8 0.6 -6.9 1.4 7.3 4.9 1.4 July -0.2 -7.1 -1.2 9.0 3.9 1.6 -0.1 -9.2 2.1 5.7 4.6 1.3 Aug. -0.5 -7.1 -1.8 8.3 3.6 1.7 -0.5 -8.2 0.9 7.0 3.3 1.0 Sep. -0.5 -6.9 -1.4 6.7 3.3 3.4 0.4 -6.8 3.7 6.0 2.7 5.3
Long-term
2013 Sep. 0.1 -7.5 1.2 11.0 4.4 0.3 0.4 -8.2 1.4 9.2 5.4 2.1 Oct. -0.1 -7.5 0.4 10.7 4.2 0.8 0.5 -6.8 -0.2 9.1 5.5 1.4 Nov. 0.2 -7.4 0.5 10.7 4.8 0.4 0.7 -5.1 -1.0 13.1 4.3 1.6 Dec. 0.1 -7.4 -1.6 9.7 5.7 0.6 0.4 -4.7 -3.7 12.9 4.4 2.62014 Jan. 0.0 -7.6 -0.9 10.1 5.5 -1.1 0.9 -3.8 -2.6 13.8 4.6 1.2 Feb. 0.3 -7.7 -0.5 10.0 5.6 1.8 0.5 -5.8 -2.9 11.7 5.3 2.7 Mar. -0.1 -7.6 -2.2 9.5 5.4 1.0 -0.5 -6.9 -5.5 9.6 5.4 -0.2 Apr. -0.1 -7.3 -3.3 8.4 5.9 0.5 -0.7 -7.7 -6.3 7.5 6.4 -0.5 May 0.2 -6.9 -1.7 10.4 4.9 0.7 -0.4 -8.6 -2.5 7.9 5.6 -0.3 June 0.4 -7.1 -1.2 10.5 5.2 1.3 0.3 -9.4 1.4 8.2 6.0 0.0 July 0.5 -6.9 -1.1 10.5 5.2 2.8 0.1 -9.8 0.5 7.3 5.9 4.4 Aug. 0.2 -7.3 -1.3 9.7 4.8 2.7 -0.1 -8.7 0.3 7.7 4.4 2.6 Sep. 0.2 -7.0 -0.7 8.2 4.6 3.5 1.0 -7.1 4.1 6.9 3.8 7.2
C19 Annual growth rates of long-term debt securities, by sector of the issuer, in all currencies combined
(annual percentage changes)
-10
-5
0
5
10
15
20
25
30
35
1994 1995 1996 1997 1998 1999 2000 2001 2002 2003 2004 2005 2006 2007 2008 2009 2010 2011 2012 2013 2014-10
-5
0
5
10
15
20
25
30
35
general governmentMFIs (including Eurosystem)non-MFI corporations
Source: ECB.1) For details of the calculation of the growth rates, see the Technical Notes. The six-month growth rates have been annualised.
4.2 Securities other than shares issued by euro area residents, by sector of the issuer and instrument type (EUR billions unless otherwise indicated; transactions during the period; nominal values)
S 36ECBMonthly BulletinDecember 2014
2. Net issues
Total
Non-seasonally adjusted 1) Seasonally adjusted 1)
Total MFIs Non-MFI corporations General government Total MFIs Non-MFI corporations General government
(including (includingEurosystem) Financial Non-financial Central Other Eurosystem) Financial Non-financial Central Other
corporations corporations government general corporations corporations government generalother than government other than government
MFIs MFIs1 2 3 4 5 6 7 8 9 10 11 12
2012 20.5 -8.2 2.0 10.4 13.1 3.1 - - - - - - 2013 -17.4 -39.8 -7.6 6.6 24.0 -0.6 - - - - - -
2013 Q4 -52.2 -35.4 -22.5 3.2 0.9 1.4 -44.2 -29.8 -37.1 5.8 16.2 0.82014 Q1 34.2 -21.0 -2.5 8.6 46.9 2.3 7.4 -29.9 2.2 6.7 27.6 0.8 Q2 25.2 -28.4 5.8 6.0 41.6 0.2 9.6 -27.8 5.2 5.9 25.4 0.8 Q3 -33.4 -30.3 4.4 5.3 -16.4 3.6 1.2 -27.4 14.2 4.7 4.6 5.12014 June -18.2 -46.5 -23.7 3.1 41.7 7.3 28.1 -29.4 9.3 9.5 31.4 7.2 July -35.9 -40.9 32.4 14.4 -39.0 -2.9 1.7 -45.8 33.1 12.8 2.3 -0.7 Aug. -63.7 -23.4 -31.3 1.0 -16.1 6.2 -27.5 -23.2 -14.8 5.5 -2.4 7.4 Sep. -0.8 -26.7 12.0 0.6 5.8 7.6 29.5 -13.2 24.3 -4.2 13.8 8.7
Long-term
2012 30.3 0.4 -0.1 10.2 15.6 4.2 - - - - - -2013 0.7 -29.4 -4.2 7.2 26.9 0.3 - - - - - -
2013 Q4 2.0 -14.5 -11.5 8.5 19.8 -0.2 -1.4 -9.7 -23.3 8.7 22.4 0.52014 Q1 0.0 -38.9 -11.9 5.9 44.1 0.7 -12.3 -42.1 -5.8 6.2 30.1 -0.7 Q2 45.5 -23.2 15.6 7.1 44.1 2.0 20.8 -28.7 13.0 6.9 28.9 0.7 Q3 -35.1 -27.0 0.2 4.7 -17.6 4.7 5.3 -22.9 7.9 4.4 9.2 6.62014 June 15.2 -39.6 -3.3 7.1 46.9 4.2 29.6 -39.9 23.7 7.3 36.8 1.7 July -72.7 -41.9 1.1 6.8 -43.7 5.0 -13.7 -40.7 1.2 8.2 8.4 9.2 Aug. -59.5 -32.6 -19.7 1.7 -12.2 3.3 -20.6 -27.4 -3.8 5.8 1.0 3.9 Sep. 26.9 -6.5 19.1 5.6 3.1 5.7 50.1 -0.5 26.2 -0.8 18.3 6.8
C18 Net issues of securities other than shares: seasonally adjusted and non-seasonally adjusted
(EUR billions; transactions during the month; nominal values)
-250
-200
-150
-100
-50
0
50
100
150
200
250
2003 2004 2005 2006 2007 2008 2009 2010 2011 2012 2013 2014-250
-200
-150
-100
-50
0
50
100
150
200
250
net issuesseasonally adjusted net issues
Source: ECB.1) Monthly data on net issues refer to transactions during the month. For the purposes of comparison, quarterly and annual data refer to the respective monthly averages.
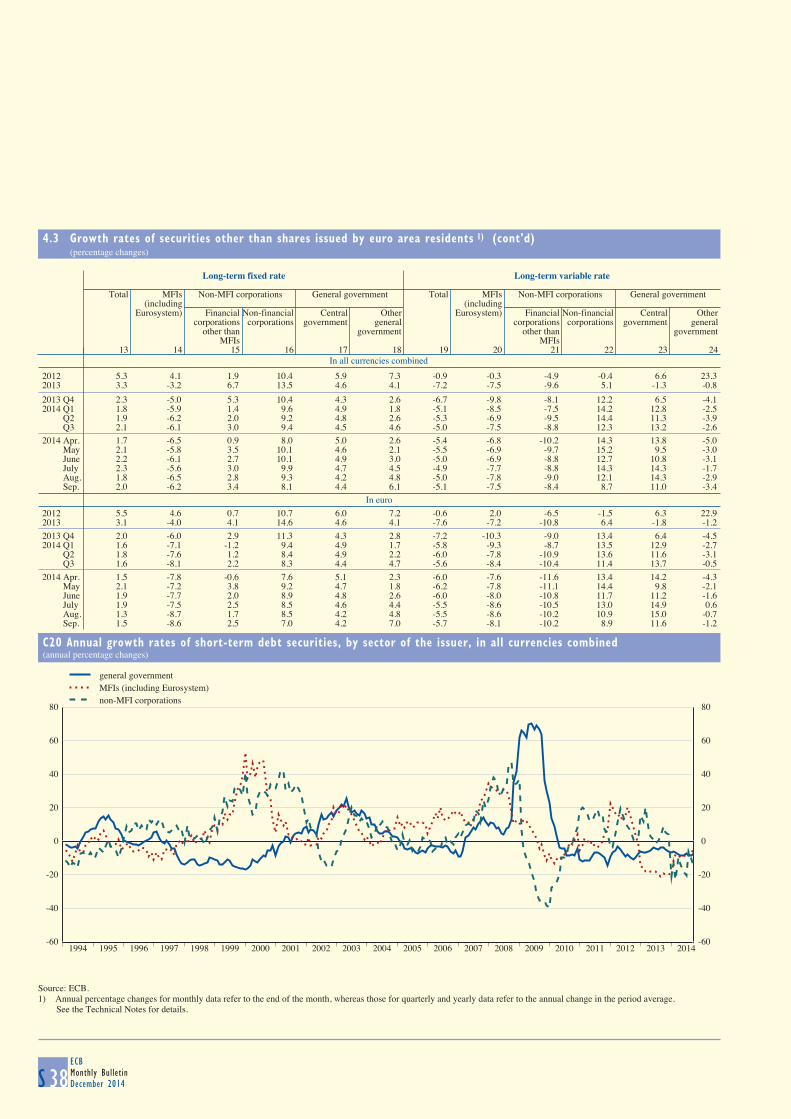
4.3 Growth rates of securities other than shares issued by euro area residents 1) (cont'd) (percentage changes)
S 38ECBMonthly BulletinDecember 2014
In all currencies combined
Long-term fixed rate Long-term variable rate
Total MFIs Non-MFI corporations General government Total MFIs Non-MFI corporations General government
(including (includingEurosystem) Financial Non-financial Central Other Eurosystem) Financial Non-financial Central Other
corporations corporations government general corporations corporations government generalother than government other than government
MFIs MFIs13 14 15 16 17 18 19 20 21 22 23 24
2012 5.3 4.1 1.9 10.4 5.9 7.3 -0.9 -0.3 -4.9 -0.4 6.6 23.32013 3.3 -3.2 6.7 13.5 4.6 4.1 -7.2 -7.5 -9.6 5.1 -1.3 -0.8
2013 Q4 2.3 -5.0 5.3 10.4 4.3 2.6 -6.7 -9.8 -8.1 12.2 6.5 -4.12014 Q1 1.8 -5.9 1.4 9.6 4.9 1.8 -5.1 -8.5 -7.5 14.2 12.8 -2.5 Q2 1.9 -6.2 2.0 9.2 4.8 2.6 -5.3 -6.9 -9.5 14.4 11.3 -3.9 Q3 2.1 -6.1 3.0 9.4 4.5 4.6 -5.0 -7.5 -8.8 12.3 13.2 -2.6
2014 Apr. 1.7 -6.5 0.9 8.0 5.0 2.6 -5.4 -6.8 -10.2 14.3 13.8 -5.0 May 2.1 -5.8 3.5 10.1 4.6 2.1 -5.5 -6.9 -9.7 15.2 9.5 -3.0 June 2.2 -6.1 2.7 10.1 4.9 3.0 -5.0 -6.9 -8.8 12.7 10.8 -3.1 July 2.3 -5.6 3.0 9.9 4.7 4.5 -4.9 -7.7 -8.8 14.3 14.3 -1.7 Aug. 1.8 -6.5 2.8 9.3 4.2 4.8 -5.0 -7.8 -9.0 12.1 14.3 -2.9 Sep. 2.0 -6.2 3.4 8.1 4.4 6.1 -5.1 -7.5 -8.4 8.7 11.0 -3.4
In euro
2012 5.5 4.6 0.7 10.7 6.0 7.2 -0.6 2.0 -6.5 -1.5 6.3 22.92013 3.1 -4.0 4.1 14.6 4.6 4.1 -7.6 -7.2 -10.8 6.4 -1.8 -1.2
2013 Q4 2.0 -6.0 2.9 11.3 4.3 2.8 -7.2 -10.3 -9.0 13.4 6.4 -4.52014 Q1 1.6 -7.1 -1.2 9.4 4.9 1.7 -5.8 -9.3 -8.7 13.5 12.9 -2.7 Q2 1.8 -7.6 1.2 8.4 4.9 2.2 -6.0 -7.8 -10.9 13.6 11.6 -3.1 Q3 1.6 -8.1 2.2 8.3 4.4 4.7 -5.6 -8.4 -10.4 11.4 13.7 -0.5
2014 Apr. 1.5 -7.8 -0.6 7.6 5.1 2.3 -6.0 -7.6 -11.6 13.4 14.2 -4.3 May 2.1 -7.2 3.8 9.2 4.7 1.8 -6.2 -7.8 -11.1 14.4 9.8 -2.1 June 1.9 -7.7 2.0 8.9 4.8 2.6 -6.0 -8.0 -10.8 11.7 11.2 -1.6 July 1.9 -7.5 2.5 8.5 4.6 4.4 -5.5 -8.6 -10.5 13.0 14.9 0.6 Aug. 1.3 -8.7 1.7 8.5 4.2 4.8 -5.5 -8.6 -10.2 10.9 15.0 -0.7 Sep. 1.5 -8.6 2.5 7.0 4.2 7.0 -5.7 -8.1 -10.2 8.9 11.6 -1.2
C20 Annual growth rates of short-term debt securities, by sector of the issuer, in all currencies combined
(annual percentage changes)
-60
-40
-20
0
20
40
60
80
1994 1995 1996 1997 1998 1999 2000 2001 2002 2003 2004 2005 2006 2007 2008 2009 2010 2011 2012 2013 2014-60
-40
-20
0
20
40
60
80
general governmentMFIs (including Eurosystem)non-MFI corporations
Source: ECB.1) Annual percentage changes for monthly data refer to the end of the month, whereas those for quarterly and yearly data refer to the annual change in the period average. See the Technical Notes for details.
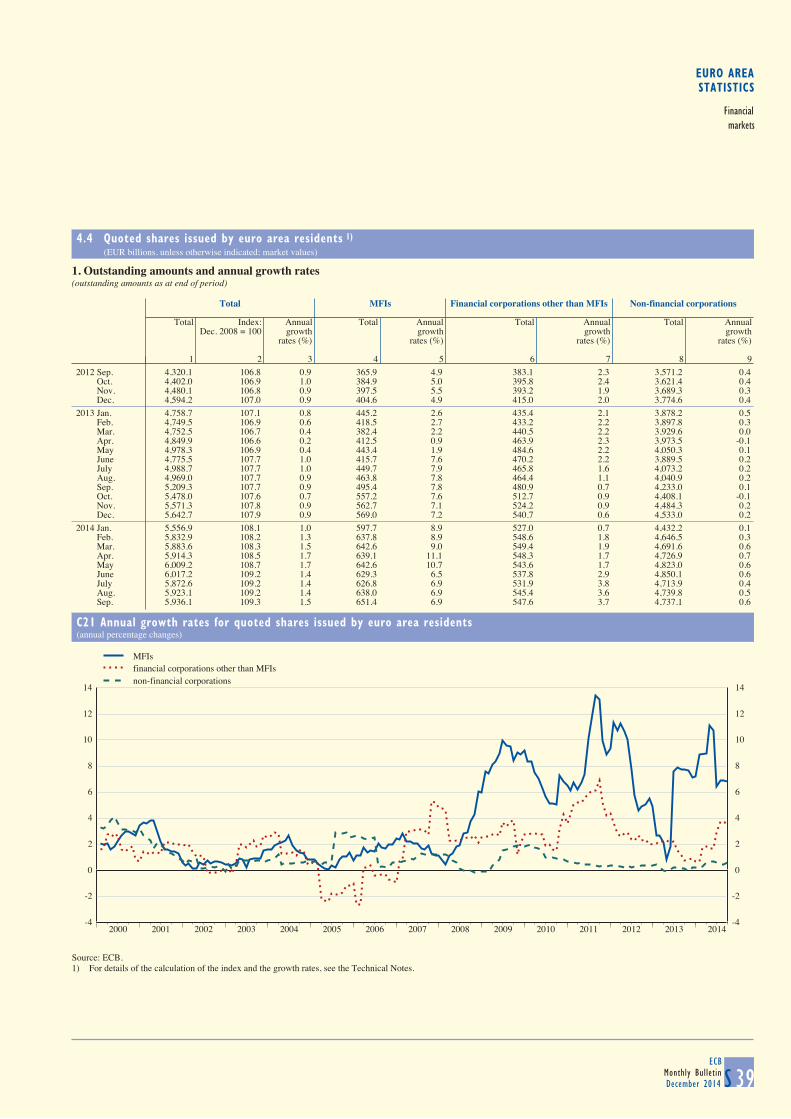
EURO AREASTATISTICS
Financialmarkets
4.4 Quoted shares issued by euro area residents 1) (EUR billions, unless otherwise indicated; market values)
S 39ECB
Monthly BulletinDecember 2014
1. Outstanding amounts and annual growth rates(outstanding amounts as at end of period)
Total MFIs Financial corporations other than MFIs Non-financial corporations
Total Index: Annual Total Annual Total Annual Total AnnualDec. 2008 = 100 growth growth growth growth
rates (%) rates (%) rates (%) rates (%)
1 2 3 4 5 6 7 8 92012 Sep. 4,320.1 106.8 0.9 365.9 4.9 383.1 2.3 3,571.2 0.4 Oct. 4,402.0 106.9 1.0 384.9 5.0 395.8 2.4 3,621.4 0.4 Nov. 4,480.1 106.8 0.9 397.5 5.5 393.2 1.9 3,689.3 0.3 Dec. 4,594.2 107.0 0.9 404.6 4.9 415.0 2.0 3,774.6 0.42013 Jan. 4,758.7 107.1 0.8 445.2 2.6 435.4 2.1 3,878.2 0.5 Feb. 4,749.5 106.9 0.6 418.5 2.7 433.2 2.2 3,897.8 0.3 Mar. 4,752.5 106.7 0.4 382.4 2.2 440.5 2.2 3,929.6 0.0 Apr. 4,849.9 106.6 0.2 412.5 0.9 463.9 2.3 3,973.5 -0.1 May 4,978.3 106.9 0.4 443.4 1.9 484.6 2.2 4,050.3 0.1 June 4,775.5 107.7 1.0 415.7 7.6 470.2 2.2 3,889.5 0.2 July 4,988.7 107.7 1.0 449.7 7.9 465.8 1.6 4,073.2 0.2 Aug. 4,969.0 107.7 0.9 463.8 7.8 464.4 1.1 4,040.9 0.2 Sep. 5,209.3 107.7 0.9 495.4 7.8 480.9 0.7 4,233.0 0.1 Oct. 5,478.0 107.6 0.7 557.2 7.6 512.7 0.9 4,408.1 -0.1 Nov. 5,571.3 107.8 0.9 562.7 7.1 524.2 0.9 4,484.3 0.2 Dec. 5,642.7 107.9 0.9 569.0 7.2 540.7 0.6 4,533.0 0.22014 Jan. 5,556.9 108.1 1.0 597.7 8.9 527.0 0.7 4,432.2 0.1 Feb. 5,832.9 108.2 1.3 637.8 8.9 548.6 1.8 4,646.5 0.3 Mar. 5,883.6 108.3 1.5 642.6 9.0 549.4 1.9 4,691.6 0.6 Apr. 5,914.3 108.5 1.7 639.1 11.1 548.3 1.7 4,726.9 0.7 May 6,009.2 108.7 1.7 642.6 10.7 543.6 1.7 4,823.0 0.6 June 6,017.2 109.2 1.4 629.3 6.5 537.8 2.9 4,850.1 0.6 July 5,872.6 109.2 1.4 626.8 6.9 531.9 3.8 4,713.9 0.4 Aug. 5,923.1 109.2 1.4 638.0 6.9 545.4 3.6 4,739.8 0.5 Sep. 5,936.1 109.3 1.5 651.4 6.9 547.6 3.7 4,737.1 0.6
C21 Annual growth rates for quoted shares issued by euro area residents
(annual percentage changes)
-4
-2
0
2
4
6
8
10
12
14
2000 2001 2002 2003 2004 2005 2006 2007 2008 2009 2010 2011 2012 2013 2014-4
-2
0
2
4
6
8
10
12
14
MFIsfinancial corporations other than MFIsnon-financial corporations
Source: ECB.1) For details of the calculation of the index and the growth rates, see the Technical Notes.
4.3 Growth rates of securities other than shares issued by euro area residents 1) (cont'd) (percentage changes)
S 38ECBMonthly BulletinDecember 2014
In all currencies combined
Long-term fixed rate Long-term variable rate
Total MFIs Non-MFI corporations General government Total MFIs Non-MFI corporations General government
(including (includingEurosystem) Financial Non-financial Central Other Eurosystem) Financial Non-financial Central Other
corporations corporations government general corporations corporations government generalother than government other than government
MFIs MFIs13 14 15 16 17 18 19 20 21 22 23 24
2012 5.3 4.1 1.9 10.4 5.9 7.3 -0.9 -0.3 -4.9 -0.4 6.6 23.32013 3.3 -3.2 6.7 13.5 4.6 4.1 -7.2 -7.5 -9.6 5.1 -1.3 -0.8
2013 Q4 2.3 -5.0 5.3 10.4 4.3 2.6 -6.7 -9.8 -8.1 12.2 6.5 -4.12014 Q1 1.8 -5.9 1.4 9.6 4.9 1.8 -5.1 -8.5 -7.5 14.2 12.8 -2.5 Q2 1.9 -6.2 2.0 9.2 4.8 2.6 -5.3 -6.9 -9.5 14.4 11.3 -3.9 Q3 2.1 -6.1 3.0 9.4 4.5 4.6 -5.0 -7.5 -8.8 12.3 13.2 -2.6
2014 Apr. 1.7 -6.5 0.9 8.0 5.0 2.6 -5.4 -6.8 -10.2 14.3 13.8 -5.0 May 2.1 -5.8 3.5 10.1 4.6 2.1 -5.5 -6.9 -9.7 15.2 9.5 -3.0 June 2.2 -6.1 2.7 10.1 4.9 3.0 -5.0 -6.9 -8.8 12.7 10.8 -3.1 July 2.3 -5.6 3.0 9.9 4.7 4.5 -4.9 -7.7 -8.8 14.3 14.3 -1.7 Aug. 1.8 -6.5 2.8 9.3 4.2 4.8 -5.0 -7.8 -9.0 12.1 14.3 -2.9 Sep. 2.0 -6.2 3.4 8.1 4.4 6.1 -5.1 -7.5 -8.4 8.7 11.0 -3.4
In euro
2012 5.5 4.6 0.7 10.7 6.0 7.2 -0.6 2.0 -6.5 -1.5 6.3 22.92013 3.1 -4.0 4.1 14.6 4.6 4.1 -7.6 -7.2 -10.8 6.4 -1.8 -1.2
2013 Q4 2.0 -6.0 2.9 11.3 4.3 2.8 -7.2 -10.3 -9.0 13.4 6.4 -4.52014 Q1 1.6 -7.1 -1.2 9.4 4.9 1.7 -5.8 -9.3 -8.7 13.5 12.9 -2.7 Q2 1.8 -7.6 1.2 8.4 4.9 2.2 -6.0 -7.8 -10.9 13.6 11.6 -3.1 Q3 1.6 -8.1 2.2 8.3 4.4 4.7 -5.6 -8.4 -10.4 11.4 13.7 -0.5
2014 Apr. 1.5 -7.8 -0.6 7.6 5.1 2.3 -6.0 -7.6 -11.6 13.4 14.2 -4.3 May 2.1 -7.2 3.8 9.2 4.7 1.8 -6.2 -7.8 -11.1 14.4 9.8 -2.1 June 1.9 -7.7 2.0 8.9 4.8 2.6 -6.0 -8.0 -10.8 11.7 11.2 -1.6 July 1.9 -7.5 2.5 8.5 4.6 4.4 -5.5 -8.6 -10.5 13.0 14.9 0.6 Aug. 1.3 -8.7 1.7 8.5 4.2 4.8 -5.5 -8.6 -10.2 10.9 15.0 -0.7 Sep. 1.5 -8.6 2.5 7.0 4.2 7.0 -5.7 -8.1 -10.2 8.9 11.6 -1.2
C20 Annual growth rates of short-term debt securities, by sector of the issuer, in all currencies combined
(annual percentage changes)
-60
-40
-20
0
20
40
60
80
1994 1995 1996 1997 1998 1999 2000 2001 2002 2003 2004 2005 2006 2007 2008 2009 2010 2011 2012 2013 2014-60
-40
-20
0
20
40
60
80
general governmentMFIs (including Eurosystem)non-MFI corporations
Source: ECB.1) Annual percentage changes for monthly data refer to the end of the month, whereas those for quarterly and yearly data refer to the annual change in the period average. See the Technical Notes for details.
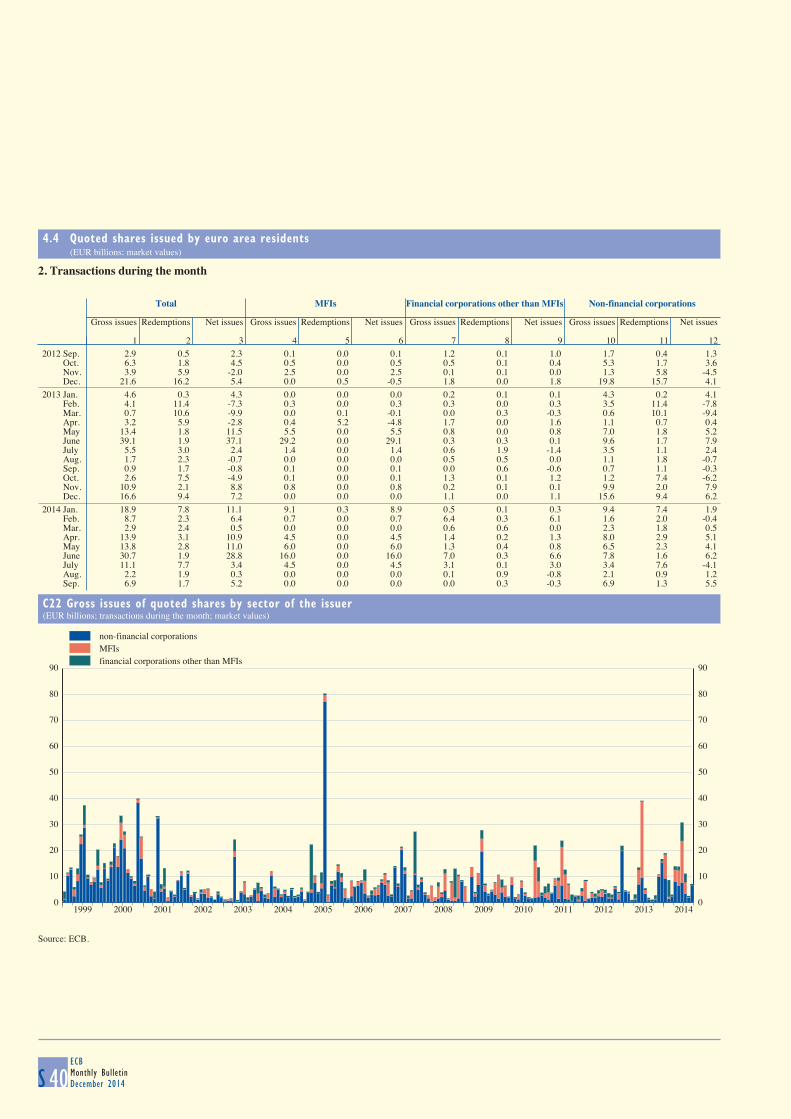
4.4 Quoted shares issued by euro area residents (EUR billions; market values)
S 40ECBMonthly BulletinDecember 2014
2. Transactions during the month
Total MFIs Financial corporations other than MFIs Non-financial corporations
Gross issues Redemptions Net issues Gross issues Redemptions Net issues Gross issues Redemptions Net issues Gross issues Redemptions Net issues
1 2 3 4 5 6 7 8 9 10 11 122012 Sep. 2.9 0.5 2.3 0.1 0.0 0.1 1.2 0.1 1.0 1.7 0.4 1.3 Oct. 6.3 1.8 4.5 0.5 0.0 0.5 0.5 0.1 0.4 5.3 1.7 3.6 Nov. 3.9 5.9 -2.0 2.5 0.0 2.5 0.1 0.1 0.0 1.3 5.8 -4.5 Dec. 21.6 16.2 5.4 0.0 0.5 -0.5 1.8 0.0 1.8 19.8 15.7 4.12013 Jan. 4.6 0.3 4.3 0.0 0.0 0.0 0.2 0.1 0.1 4.3 0.2 4.1 Feb. 4.1 11.4 -7.3 0.3 0.0 0.3 0.3 0.0 0.3 3.5 11.4 -7.8 Mar. 0.7 10.6 -9.9 0.0 0.1 -0.1 0.0 0.3 -0.3 0.6 10.1 -9.4 Apr. 3.2 5.9 -2.8 0.4 5.2 -4.8 1.7 0.0 1.6 1.1 0.7 0.4 May 13.4 1.8 11.5 5.5 0.0 5.5 0.8 0.0 0.8 7.0 1.8 5.2 June 39.1 1.9 37.1 29.2 0.0 29.1 0.3 0.3 0.1 9.6 1.7 7.9 July 5.5 3.0 2.4 1.4 0.0 1.4 0.6 1.9 -1.4 3.5 1.1 2.4 Aug. 1.7 2.3 -0.7 0.0 0.0 0.0 0.5 0.5 0.0 1.1 1.8 -0.7 Sep. 0.9 1.7 -0.8 0.1 0.0 0.1 0.0 0.6 -0.6 0.7 1.1 -0.3 Oct. 2.6 7.5 -4.9 0.1 0.0 0.1 1.3 0.1 1.2 1.2 7.4 -6.2 Nov. 10.9 2.1 8.8 0.8 0.0 0.8 0.2 0.1 0.1 9.9 2.0 7.9 Dec. 16.6 9.4 7.2 0.0 0.0 0.0 1.1 0.0 1.1 15.6 9.4 6.22014 Jan. 18.9 7.8 11.1 9.1 0.3 8.9 0.5 0.1 0.3 9.4 7.4 1.9 Feb. 8.7 2.3 6.4 0.7 0.0 0.7 6.4 0.3 6.1 1.6 2.0 -0.4 Mar. 2.9 2.4 0.5 0.0 0.0 0.0 0.6 0.6 0.0 2.3 1.8 0.5 Apr. 13.9 3.1 10.9 4.5 0.0 4.5 1.4 0.2 1.3 8.0 2.9 5.1 May 13.8 2.8 11.0 6.0 0.0 6.0 1.3 0.4 0.8 6.5 2.3 4.1 June 30.7 1.9 28.8 16.0 0.0 16.0 7.0 0.3 6.6 7.8 1.6 6.2 July 11.1 7.7 3.4 4.5 0.0 4.5 3.1 0.1 3.0 3.4 7.6 -4.1 Aug. 2.2 1.9 0.3 0.0 0.0 0.0 0.1 0.9 -0.8 2.1 0.9 1.2 Sep. 6.9 1.7 5.2 0.0 0.0 0.0 0.0 0.3 -0.3 6.9 1.3 5.5
C22 Gross issues of quoted shares by sector of the issuer
(EUR billions; transactions during the month; market values)
0
10
20
30
40
50
60
70
80
90
1999 2000 2001 2002 2003 2004 2005 2006 2007 2008 2009 2010 2011 2012 2013 20140
10
20
30
40
50
60
70
80
90
non-financial corporationsMFIsfinancial corporations other than MFIs
Source: ECB.
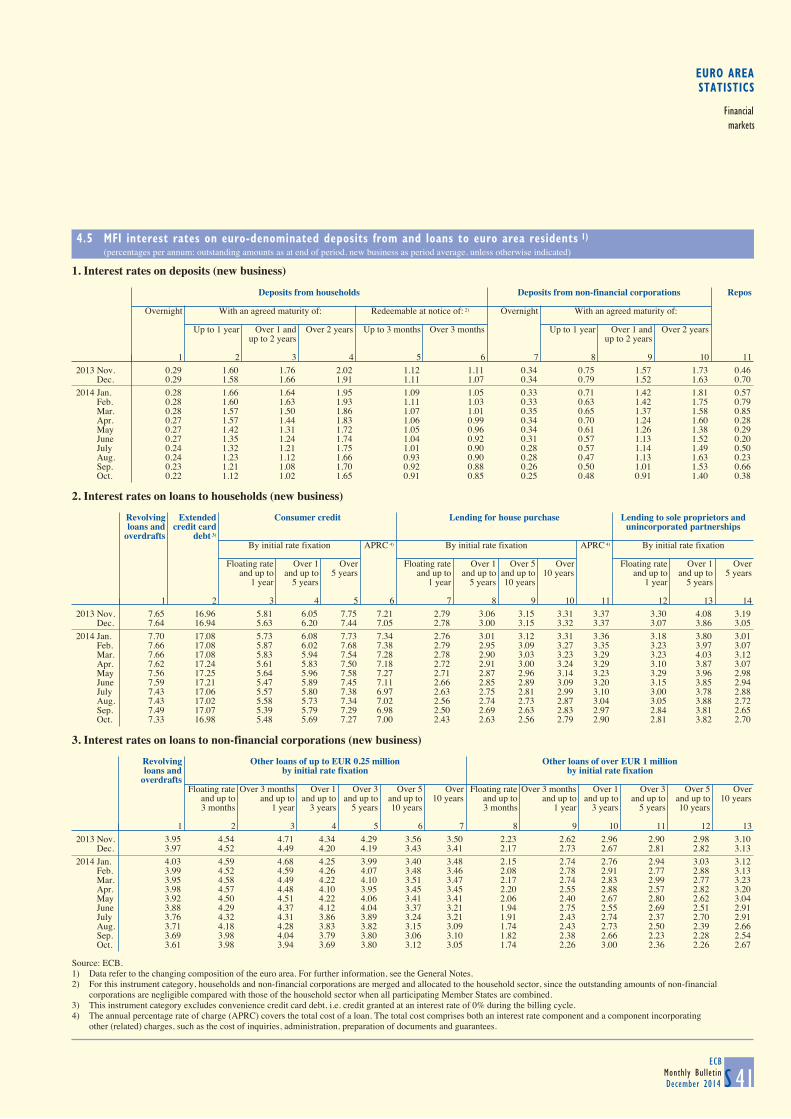
EURO AREASTATISTICS
Financialmarkets
4.5 MFI interest rates on euro-denominated deposits from and loans to euro area residents 1) (percentages per annum; outstanding amounts as at end of period, new business as period average, unless otherwise indicated)
S 41ECB
Monthly BulletinDecember 2014
1. Interest rates on deposits (new business)
Deposits from households Deposits from non-financial corporations Repos
Overnight With an agreed maturity of: Redeemable at notice of: 2) Overnight With an agreed maturity of:
Up to 1 year Over 1 and Over 2 years Up to 3 months Over 3 months Up to 1 year Over 1 and Over 2 yearsup to 2 years up to 2 years
1 2 3 4 5 6 7 8 9 10 112013 Nov. 0.29 1.60 1.76 2.02 1.12 1.11 0.34 0.75 1.57 1.73 0.46 Dec. 0.29 1.58 1.66 1.91 1.11 1.07 0.34 0.79 1.52 1.63 0.702014 Jan. 0.28 1.66 1.64 1.95 1.09 1.05 0.33 0.71 1.42 1.81 0.57 Feb. 0.28 1.60 1.63 1.93 1.11 1.03 0.33 0.63 1.42 1.75 0.79 Mar. 0.28 1.57 1.50 1.86 1.07 1.01 0.35 0.65 1.37 1.58 0.85 Apr. 0.27 1.57 1.44 1.83 1.06 0.99 0.34 0.70 1.24 1.60 0.28 May 0.27 1.42 1.31 1.72 1.05 0.96 0.34 0.61 1.26 1.38 0.29 June 0.27 1.35 1.24 1.74 1.04 0.92 0.31 0.57 1.13 1.52 0.20 July 0.24 1.32 1.21 1.75 1.01 0.90 0.28 0.57 1.14 1.49 0.50 Aug. 0.24 1.23 1.12 1.66 0.93 0.90 0.28 0.47 1.13 1.63 0.23 Sep. 0.23 1.21 1.08 1.70 0.92 0.88 0.26 0.50 1.01 1.53 0.66 Oct. 0.22 1.12 1.02 1.65 0.91 0.85 0.25 0.48 0.91 1.40 0.38
2. Interest rates on loans to households (new business)
Revolving Extended Consumer credit Lending for house purchase Lending to sole proprietors andloans and credit card unincorporated partnerships
overdrafts debt 3) By initial rate fixation APRC 4) By initial rate fixation APRC 4) By initial rate fixation
Floating rate Over 1 Over Floating rate Over 1 Over 5 Over Floating rate Over 1 Overand up to and up to 5 years and up to and up to and up to 10 years and up to and up to 5 years
1 year 5 years 1 year 5 years 10 years 1 year 5 years
1 2 3 4 5 6 7 8 9 10 11 12 13 142013 Nov. 7.65 16.96 5.81 6.05 7.75 7.21 2.79 3.06 3.15 3.31 3.37 3.30 4.08 3.19 Dec. 7.64 16.94 5.63 6.20 7.44 7.05 2.78 3.00 3.15 3.32 3.37 3.07 3.86 3.052014 Jan. 7.70 17.08 5.73 6.08 7.73 7.34 2.76 3.01 3.12 3.31 3.36 3.18 3.80 3.01 Feb. 7.66 17.08 5.87 6.02 7.68 7.38 2.79 2.95 3.09 3.27 3.35 3.23 3.97 3.07 Mar. 7.66 17.08 5.83 5.94 7.54 7.28 2.78 2.90 3.03 3.23 3.29 3.23 4.03 3.12 Apr. 7.62 17.24 5.61 5.83 7.50 7.18 2.72 2.91 3.00 3.24 3.29 3.10 3.87 3.07 May 7.56 17.25 5.64 5.96 7.58 7.27 2.71 2.87 2.96 3.14 3.23 3.29 3.96 2.98 June 7.59 17.21 5.47 5.89 7.45 7.11 2.66 2.85 2.89 3.09 3.20 3.15 3.85 2.94 July 7.43 17.06 5.57 5.80 7.38 6.97 2.63 2.75 2.81 2.99 3.10 3.00 3.78 2.88 Aug. 7.43 17.02 5.58 5.73 7.34 7.02 2.56 2.74 2.73 2.87 3.04 3.05 3.88 2.72 Sep. 7.49 17.07 5.39 5.79 7.29 6.98 2.50 2.69 2.63 2.83 2.97 2.84 3.81 2.65 Oct. 7.33 16.98 5.48 5.69 7.27 7.00 2.43 2.63 2.56 2.79 2.90 2.81 3.82 2.70
3. Interest rates on loans to non-financial corporations (new business)
Revolving Other loans of up to EUR 0.25 million Other loans of over EUR 1 millionloans and by initial rate fixation by initial rate fixation
overdraftsFloating rate Over 3 months Over 1 Over 3 Over 5 Over Floating rate Over 3 months Over 1 Over 3 Over 5 Over
and up to and up to and up to and up to and up to 10 years and up to and up to and up to and up to and up to 10 years3 months 1 year 3 years 5 years 10 years 3 months 1 year 3 years 5 years 10 years
1 2 3 4 5 6 7 8 9 10 11 12 132013 Nov. 3.95 4.54 4.71 4.34 4.29 3.56 3.50 2.23 2.62 2.96 2.90 2.98 3.10 Dec. 3.97 4.52 4.49 4.20 4.19 3.43 3.41 2.17 2.73 2.67 2.81 2.82 3.132014 Jan. 4.03 4.59 4.68 4.25 3.99 3.40 3.48 2.15 2.74 2.76 2.94 3.03 3.12 Feb. 3.99 4.52 4.59 4.26 4.07 3.48 3.46 2.08 2.78 2.91 2.77 2.88 3.13 Mar. 3.95 4.58 4.49 4.22 4.10 3.51 3.47 2.17 2.74 2.83 2.99 2.77 3.23 Apr. 3.98 4.57 4.48 4.10 3.95 3.45 3.45 2.20 2.55 2.88 2.57 2.82 3.20 May 3.92 4.50 4.51 4.22 4.06 3.41 3.41 2.06 2.40 2.67 2.80 2.62 3.04 June 3.88 4.29 4.37 4.12 4.04 3.37 3.21 1.94 2.75 2.55 2.69 2.51 2.91 July 3.76 4.32 4.31 3.86 3.89 3.24 3.21 1.91 2.43 2.74 2.37 2.70 2.91 Aug. 3.71 4.18 4.28 3.83 3.82 3.15 3.09 1.74 2.43 2.73 2.50 2.39 2.66 Sep. 3.69 3.98 4.04 3.79 3.80 3.06 3.10 1.82 2.38 2.66 2.23 2.28 2.54 Oct. 3.61 3.98 3.94 3.69 3.80 3.12 3.05 1.74 2.26 3.00 2.36 2.26 2.67
Source: ECB.1) Data refer to the changing composition of the euro area. For further information, see the General Notes.2) For this instrument category, households and non-financial corporations are merged and allocated to the household sector, since the outstanding amounts of non-financial
corporations are negligible compared with those of the household sector when all participating Member States are combined.3) This instrument category excludes convenience credit card debt, i.e. credit granted at an interest rate of 0% during the billing cycle.4) The annual percentage rate of charge (APRC) covers the total cost of a loan. The total cost comprises both an interest rate component and a component incorporating
other (related) charges, such as the cost of inquiries, administration, preparation of documents and guarantees.
4.4 Quoted shares issued by euro area residents (EUR billions; market values)
S 40ECBMonthly BulletinDecember 2014
2. Transactions during the month
Total MFIs Financial corporations other than MFIs Non-financial corporations
Gross issues Redemptions Net issues Gross issues Redemptions Net issues Gross issues Redemptions Net issues Gross issues Redemptions Net issues
1 2 3 4 5 6 7 8 9 10 11 122012 Sep. 2.9 0.5 2.3 0.1 0.0 0.1 1.2 0.1 1.0 1.7 0.4 1.3 Oct. 6.3 1.8 4.5 0.5 0.0 0.5 0.5 0.1 0.4 5.3 1.7 3.6 Nov. 3.9 5.9 -2.0 2.5 0.0 2.5 0.1 0.1 0.0 1.3 5.8 -4.5 Dec. 21.6 16.2 5.4 0.0 0.5 -0.5 1.8 0.0 1.8 19.8 15.7 4.12013 Jan. 4.6 0.3 4.3 0.0 0.0 0.0 0.2 0.1 0.1 4.3 0.2 4.1 Feb. 4.1 11.4 -7.3 0.3 0.0 0.3 0.3 0.0 0.3 3.5 11.4 -7.8 Mar. 0.7 10.6 -9.9 0.0 0.1 -0.1 0.0 0.3 -0.3 0.6 10.1 -9.4 Apr. 3.2 5.9 -2.8 0.4 5.2 -4.8 1.7 0.0 1.6 1.1 0.7 0.4 May 13.4 1.8 11.5 5.5 0.0 5.5 0.8 0.0 0.8 7.0 1.8 5.2 June 39.1 1.9 37.1 29.2 0.0 29.1 0.3 0.3 0.1 9.6 1.7 7.9 July 5.5 3.0 2.4 1.4 0.0 1.4 0.6 1.9 -1.4 3.5 1.1 2.4 Aug. 1.7 2.3 -0.7 0.0 0.0 0.0 0.5 0.5 0.0 1.1 1.8 -0.7 Sep. 0.9 1.7 -0.8 0.1 0.0 0.1 0.0 0.6 -0.6 0.7 1.1 -0.3 Oct. 2.6 7.5 -4.9 0.1 0.0 0.1 1.3 0.1 1.2 1.2 7.4 -6.2 Nov. 10.9 2.1 8.8 0.8 0.0 0.8 0.2 0.1 0.1 9.9 2.0 7.9 Dec. 16.6 9.4 7.2 0.0 0.0 0.0 1.1 0.0 1.1 15.6 9.4 6.22014 Jan. 18.9 7.8 11.1 9.1 0.3 8.9 0.5 0.1 0.3 9.4 7.4 1.9 Feb. 8.7 2.3 6.4 0.7 0.0 0.7 6.4 0.3 6.1 1.6 2.0 -0.4 Mar. 2.9 2.4 0.5 0.0 0.0 0.0 0.6 0.6 0.0 2.3 1.8 0.5 Apr. 13.9 3.1 10.9 4.5 0.0 4.5 1.4 0.2 1.3 8.0 2.9 5.1 May 13.8 2.8 11.0 6.0 0.0 6.0 1.3 0.4 0.8 6.5 2.3 4.1 June 30.7 1.9 28.8 16.0 0.0 16.0 7.0 0.3 6.6 7.8 1.6 6.2 July 11.1 7.7 3.4 4.5 0.0 4.5 3.1 0.1 3.0 3.4 7.6 -4.1 Aug. 2.2 1.9 0.3 0.0 0.0 0.0 0.1 0.9 -0.8 2.1 0.9 1.2 Sep. 6.9 1.7 5.2 0.0 0.0 0.0 0.0 0.3 -0.3 6.9 1.3 5.5
C22 Gross issues of quoted shares by sector of the issuer
(EUR billions; transactions during the month; market values)
0
10
20
30
40
50
60
70
80
90
1999 2000 2001 2002 2003 2004 2005 2006 2007 2008 2009 2010 2011 2012 2013 20140
10
20
30
40
50
60
70
80
90
non-financial corporationsMFIsfinancial corporations other than MFIs
Source: ECB.

4.5 MFI interest rates on euro-denominated deposits from and loans to euro area residents 1), * (percentages per annum; outstanding amounts as at end of period, new business as period average, unless otherwise indicated)
S 42ECBMonthly BulletinDecember 2014
4. Interest rates on deposits (outstanding amounts)
Deposits from households Deposits from non-financial corporations Repos
Overnight With an agreed maturity of: Redeemable at notice of: 2) Overnight With an agreed maturity of:
Up to 2 years Over 2 years Up to 3 months Over 3 months Up to 2 years Over 2 years
1 2 3 4 5 6 7 8 92013 Nov. 0.29 2.02 2.60 1.12 1.11 0.34 1.32 2.84 1.34 Dec. 0.29 1.94 2.57 1.11 1.07 0.34 1.29 2.79 1.052014 Jan. 0.28 1.87 2.55 1.09 1.05 0.33 1.24 2.77 1.01 Feb. 0.28 1.84 2.59 1.11 1.03 0.33 1.23 2.78 1.08 Mar. 0.28 1.79 2.53 1.07 1.01 0.35 1.20 2.76 1.11 Apr. 0.27 1.75 2.52 1.06 0.99 0.34 1.18 2.73 1.02 May 0.27 1.70 2.48 1.05 0.96 0.34 1.18 2.71 0.87 June 0.27 1.65 2.48 1.04 0.92 0.31 1.15 2.67 0.78 July 0.24 1.59 2.44 1.01 0.90 0.28 1.11 2.61 0.90 Aug. 0.24 1.54 2.43 0.93 0.90 0.28 1.08 2.57 0.82 Sep. 0.23 1.50 2.43 0.92 0.88 0.26 1.07 2.60 0.92 Oct. 0.22 1.44 2.39 0.91 0.85 0.25 1.02 2.54 0.92
5. Interest rates on loans (outstanding amounts)
Loans to households Loans to non-financial corporations
Lending for house purchase Consumer credit and other loans With a maturity of:
with a maturity of: with a maturity of:
Up to 1 year Over 1 and Over 5 years Up to 1 year Over 1 and Over 5 years Up to 1 year Over 1 and Over 5 yearsup to 5 years up to 5 years up to 5 years
1 2 3 4 5 6 7 8 92013 Nov. 3.51 3.22 3.34 7.52 6.11 4.79 3.59 3.28 3.12 Dec. 3.59 3.24 3.33 7.49 6.08 4.77 3.61 3.29 3.142014 Jan. 3.61 3.17 3.31 7.59 6.08 4.77 3.67 3.29 3.13 Feb. 3.59 3.21 3.37 7.64 6.20 4.84 3.63 3.33 3.17 Mar. 3.57 3.18 3.33 7.62 6.10 4.77 3.62 3.30 3.13 Apr. 3.63 3.16 3.31 7.51 6.11 4.79 3.63 3.30 3.14 May 3.59 3.15 3.29 7.50 6.10 4.77 3.57 3.28 3.13 June 3.27 3.15 3.29 7.49 6.12 4.79 3.51 3.28 3.13 July 3.22 3.10 3.26 7.40 6.05 4.76 3.44 3.22 3.08 Aug. 3.14 3.08 3.23 7.39 6.04 4.76 3.38 3.18 3.06 Sep. 3.13 3.06 3.24 7.45 6.05 4.75 3.34 3.13 3.05 Oct. 3.07 3.03 3.21 7.36 5.99 4.72 3.25 3.07 3.02
C23 New deposits with an agreed maturity
(percentages per annum excluding charges; period averages)
C24 New loans with a floating rate and up to 1 year's initial
rate fixation (percentages per annum excluding charges; period averages)
0.00
1.00
2.00
3.00
4.00
5.00
2003 2004 2005 2006 2007 2008 2009 2010 2011 2012 2013 20140.00
1.00
2.00
3.00
4.00
5.00
by households, up to 1 yearby non-financial corporations, up to 1 yearby households, over 2 yearsby non-financial corporations, over 2 years
1.00
2.00
3.00
4.00
5.00
6.00
7.00
8.00
9.00
2003 2004 2005 2006 2007 2008 2009 2010 2011 2012 2013 20141.00
2.00
3.00
4.00
5.00
6.00
7.00
8.00
9.00
to households for consumptionto households for house purchaseto non-financial corporations, up to EUR 1 millionto non-financial corporations, over EUR 1 million
Source: ECB.* For the source of the data in the table and the related footnotes, please see page S41.
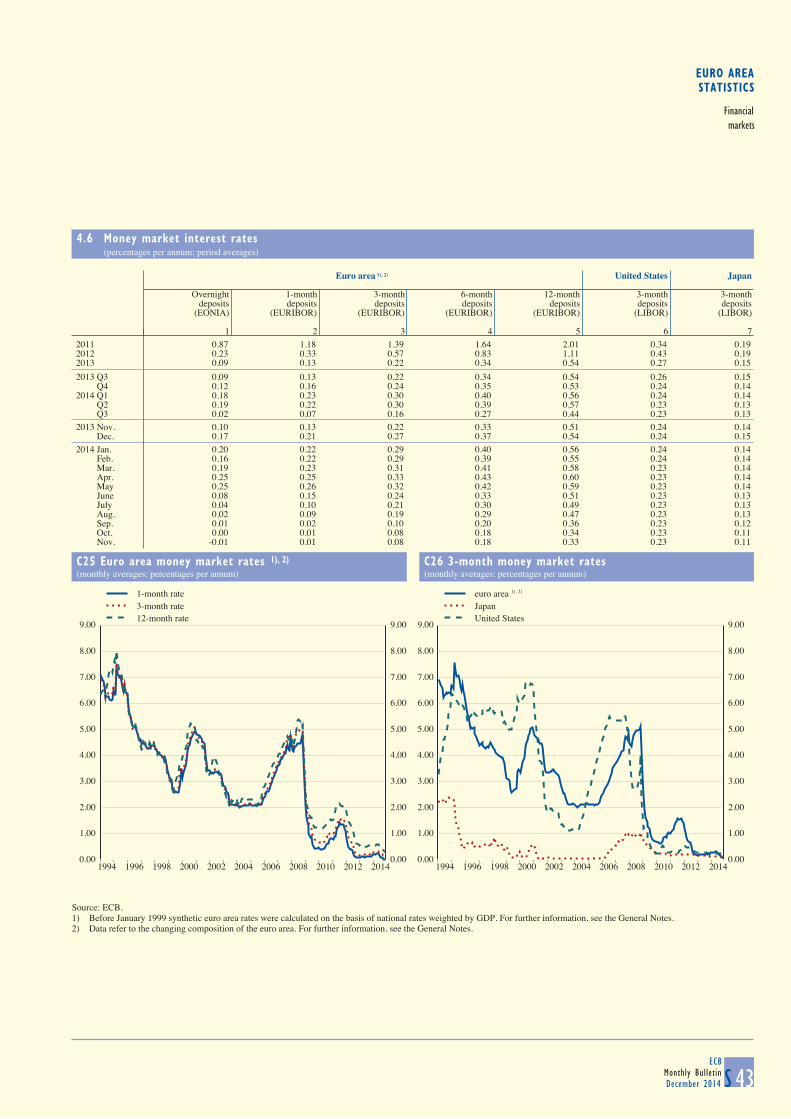
EURO AREASTATISTICS
Financialmarkets
4.6 Money market interest rates (percentages per annum; period averages)
S 43ECB
Monthly BulletinDecember 2014
Euro area 1), 2) United States Japan
Overnight 1-month 3-month 6-month 12-month 3-month 3-monthdeposits deposits deposits deposits deposits deposits deposits
(EONIA) (EURIBOR) (EURIBOR) (EURIBOR) (EURIBOR) (LIBOR) (LIBOR)
1 2 3 4 5 6 72011 0.87 1.18 1.39 1.64 2.01 0.34 0.192012 0.23 0.33 0.57 0.83 1.11 0.43 0.192013 0.09 0.13 0.22 0.34 0.54 0.27 0.15
2013 Q3 0.09 0.13 0.22 0.34 0.54 0.26 0.15 Q4 0.12 0.16 0.24 0.35 0.53 0.24 0.142014 Q1 0.18 0.23 0.30 0.40 0.56 0.24 0.14 Q2 0.19 0.22 0.30 0.39 0.57 0.23 0.13 Q3 0.02 0.07 0.16 0.27 0.44 0.23 0.13
2013 Nov. 0.10 0.13 0.22 0.33 0.51 0.24 0.14 Dec. 0.17 0.21 0.27 0.37 0.54 0.24 0.152014 Jan. 0.20 0.22 0.29 0.40 0.56 0.24 0.14 Feb. 0.16 0.22 0.29 0.39 0.55 0.24 0.14 Mar. 0.19 0.23 0.31 0.41 0.58 0.23 0.14 Apr. 0.25 0.25 0.33 0.43 0.60 0.23 0.14 May 0.25 0.26 0.32 0.42 0.59 0.23 0.14 June 0.08 0.15 0.24 0.33 0.51 0.23 0.13 July 0.04 0.10 0.21 0.30 0.49 0.23 0.13 Aug. 0.02 0.09 0.19 0.29 0.47 0.23 0.13 Sep. 0.01 0.02 0.10 0.20 0.36 0.23 0.12 Oct. 0.00 0.01 0.08 0.18 0.34 0.23 0.11 Nov. -0.01 0.01 0.08 0.18 0.33 0.23 0.11
C25 Euro area money market rates 1), 2)
(monthly averages; percentages per annum)
C26 3-month money market rates
(monthly averages; percentages per annum)
0.00
1.00
2.00
3.00
4.00
5.00
6.00
7.00
8.00
9.00
1994 1996 1998 2000 2002 2004 2006 2008 2010 2012 20140.00
1.00
2.00
3.00
4.00
5.00
6.00
7.00
8.00
9.00
1-month rate3-month rate12-month rate
0.00
1.00
2.00
3.00
4.00
5.00
6.00
7.00
8.00
9.00
1994 1996 1998 2000 2002 2004 2006 2008 2010 2012 20140.00
1.00
2.00
3.00
4.00
5.00
6.00
7.00
8.00
9.00
euro areaJapanUnited States
Source: ECB.1) Before January 1999 synthetic euro area rates were calculated on the basis of national rates weighted by GDP. For further information, see the General Notes.2) Data refer to the changing composition of the euro area. For further information, see the General Notes.
1), 2)
4.5 MFI interest rates on euro-denominated deposits from and loans to euro area residents 1), * (percentages per annum; outstanding amounts as at end of period, new business as period average, unless otherwise indicated)
S 42ECBMonthly BulletinDecember 2014
4. Interest rates on deposits (outstanding amounts)
Deposits from households Deposits from non-financial corporations Repos
Overnight With an agreed maturity of: Redeemable at notice of: 2) Overnight With an agreed maturity of:
Up to 2 years Over 2 years Up to 3 months Over 3 months Up to 2 years Over 2 years
1 2 3 4 5 6 7 8 92013 Nov. 0.29 2.02 2.60 1.12 1.11 0.34 1.32 2.84 1.34 Dec. 0.29 1.94 2.57 1.11 1.07 0.34 1.29 2.79 1.052014 Jan. 0.28 1.87 2.55 1.09 1.05 0.33 1.24 2.77 1.01 Feb. 0.28 1.84 2.59 1.11 1.03 0.33 1.23 2.78 1.08 Mar. 0.28 1.79 2.53 1.07 1.01 0.35 1.20 2.76 1.11 Apr. 0.27 1.75 2.52 1.06 0.99 0.34 1.18 2.73 1.02 May 0.27 1.70 2.48 1.05 0.96 0.34 1.18 2.71 0.87 June 0.27 1.65 2.48 1.04 0.92 0.31 1.15 2.67 0.78 July 0.24 1.59 2.44 1.01 0.90 0.28 1.11 2.61 0.90 Aug. 0.24 1.54 2.43 0.93 0.90 0.28 1.08 2.57 0.82 Sep. 0.23 1.50 2.43 0.92 0.88 0.26 1.07 2.60 0.92 Oct. 0.22 1.44 2.39 0.91 0.85 0.25 1.02 2.54 0.92
5. Interest rates on loans (outstanding amounts)
Loans to households Loans to non-financial corporations
Lending for house purchase Consumer credit and other loans With a maturity of:
with a maturity of: with a maturity of:
Up to 1 year Over 1 and Over 5 years Up to 1 year Over 1 and Over 5 years Up to 1 year Over 1 and Over 5 yearsup to 5 years up to 5 years up to 5 years
1 2 3 4 5 6 7 8 92013 Nov. 3.51 3.22 3.34 7.52 6.11 4.79 3.59 3.28 3.12 Dec. 3.59 3.24 3.33 7.49 6.08 4.77 3.61 3.29 3.142014 Jan. 3.61 3.17 3.31 7.59 6.08 4.77 3.67 3.29 3.13 Feb. 3.59 3.21 3.37 7.64 6.20 4.84 3.63 3.33 3.17 Mar. 3.57 3.18 3.33 7.62 6.10 4.77 3.62 3.30 3.13 Apr. 3.63 3.16 3.31 7.51 6.11 4.79 3.63 3.30 3.14 May 3.59 3.15 3.29 7.50 6.10 4.77 3.57 3.28 3.13 June 3.27 3.15 3.29 7.49 6.12 4.79 3.51 3.28 3.13 July 3.22 3.10 3.26 7.40 6.05 4.76 3.44 3.22 3.08 Aug. 3.14 3.08 3.23 7.39 6.04 4.76 3.38 3.18 3.06 Sep. 3.13 3.06 3.24 7.45 6.05 4.75 3.34 3.13 3.05 Oct. 3.07 3.03 3.21 7.36 5.99 4.72 3.25 3.07 3.02
C23 New deposits with an agreed maturity
(percentages per annum excluding charges; period averages)
C24 New loans with a floating rate and up to 1 year's initial
rate fixation (percentages per annum excluding charges; period averages)
0.00
1.00
2.00
3.00
4.00
5.00
2003 2004 2005 2006 2007 2008 2009 2010 2011 2012 2013 20140.00
1.00
2.00
3.00
4.00
5.00
by households, up to 1 yearby non-financial corporations, up to 1 yearby households, over 2 yearsby non-financial corporations, over 2 years
1.00
2.00
3.00
4.00
5.00
6.00
7.00
8.00
9.00
2003 2004 2005 2006 2007 2008 2009 2010 2011 2012 2013 20141.00
2.00
3.00
4.00
5.00
6.00
7.00
8.00
9.00
to households for consumptionto households for house purchaseto non-financial corporations, up to EUR 1 millionto non-financial corporations, over EUR 1 million
Source: ECB.* For the source of the data in the table and the related footnotes, please see page S41.
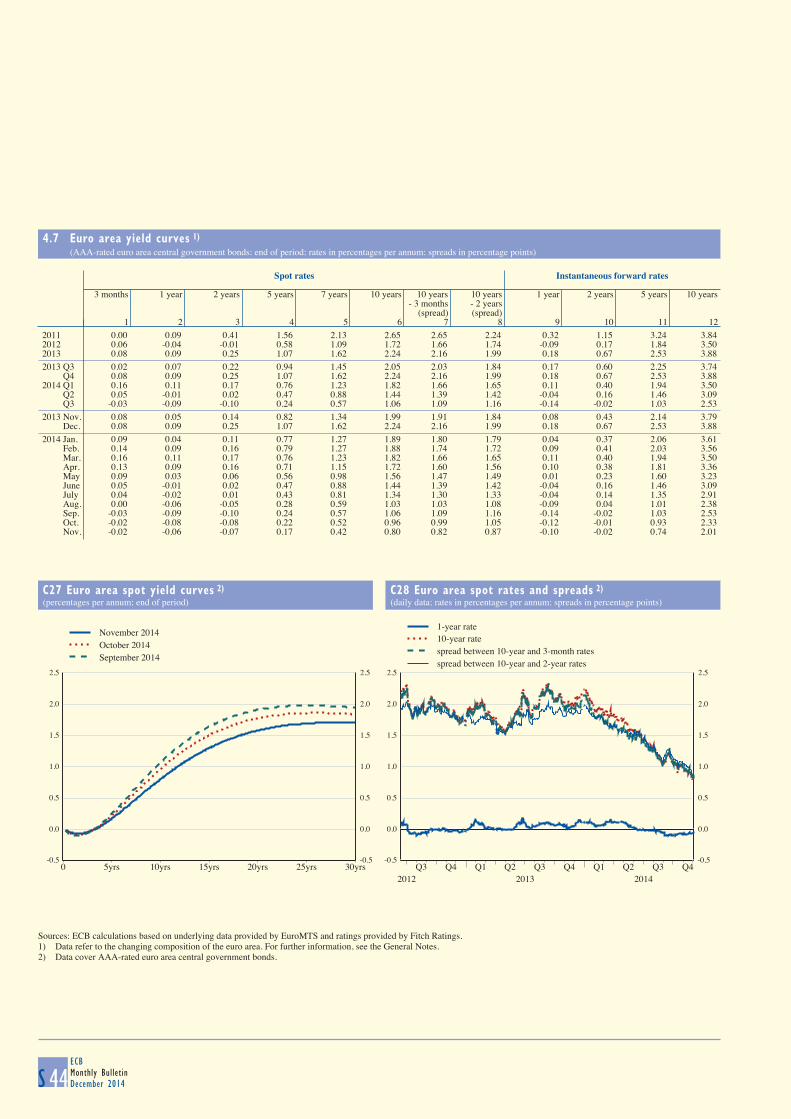
4.7 Euro area yield curves 1)
(AAA-rated euro area central government bonds; end of period; rates in percentages per annum; spreads in percentage points)
S 44ECBMonthly BulletinDecember 2014
Spot rates Instantaneous forward rates
3 months 1 year 2 years 5 years 7 years 10 years 10 years 10 years 1 year 2 years 5 years 10 years- 3 months - 2 years
(spread) (spread)1 2 3 4 5 6 7 8 9 10 11 12
2011 0.00 0.09 0.41 1.56 2.13 2.65 2.65 2.24 0.32 1.15 3.24 3.842012 0.06 -0.04 -0.01 0.58 1.09 1.72 1.66 1.74 -0.09 0.17 1.84 3.502013 0.08 0.09 0.25 1.07 1.62 2.24 2.16 1.99 0.18 0.67 2.53 3.882013 Q3 0.02 0.07 0.22 0.94 1.45 2.05 2.03 1.84 0.17 0.60 2.25 3.74 Q4 0.08 0.09 0.25 1.07 1.62 2.24 2.16 1.99 0.18 0.67 2.53 3.882014 Q1 0.16 0.11 0.17 0.76 1.23 1.82 1.66 1.65 0.11 0.40 1.94 3.50 Q2 0.05 -0.01 0.02 0.47 0.88 1.44 1.39 1.42 -0.04 0.16 1.46 3.09 Q3 -0.03 -0.09 -0.10 0.24 0.57 1.06 1.09 1.16 -0.14 -0.02 1.03 2.532013 Nov. 0.08 0.05 0.14 0.82 1.34 1.99 1.91 1.84 0.08 0.43 2.14 3.79 Dec. 0.08 0.09 0.25 1.07 1.62 2.24 2.16 1.99 0.18 0.67 2.53 3.882014 Jan. 0.09 0.04 0.11 0.77 1.27 1.89 1.80 1.79 0.04 0.37 2.06 3.61 Feb. 0.14 0.09 0.16 0.79 1.27 1.88 1.74 1.72 0.09 0.41 2.03 3.56 Mar. 0.16 0.11 0.17 0.76 1.23 1.82 1.66 1.65 0.11 0.40 1.94 3.50 Apr. 0.13 0.09 0.16 0.71 1.15 1.72 1.60 1.56 0.10 0.38 1.81 3.36 May 0.09 0.03 0.06 0.56 0.98 1.56 1.47 1.49 0.01 0.23 1.60 3.23 June 0.05 -0.01 0.02 0.47 0.88 1.44 1.39 1.42 -0.04 0.16 1.46 3.09 July 0.04 -0.02 0.01 0.43 0.81 1.34 1.30 1.33 -0.04 0.14 1.35 2.91 Aug. 0.00 -0.06 -0.05 0.28 0.59 1.03 1.03 1.08 -0.09 0.04 1.01 2.38 Sep. -0.03 -0.09 -0.10 0.24 0.57 1.06 1.09 1.16 -0.14 -0.02 1.03 2.53 Oct. -0.02 -0.08 -0.08 0.22 0.52 0.96 0.99 1.05 -0.12 -0.01 0.93 2.33 Nov. -0.02 -0.06 -0.07 0.17 0.42 0.80 0.82 0.87 -0.10 -0.02 0.74 2.01
C27 Euro area spot yield curves 2)
(percentages per annum; end of period)
C28 Euro area spot rates and spreads 2)
(daily data; rates in percentages per annum; spreads in percentage points)
-0.5
0.0
0.5
1.0
1.5
2.0
2.5
0 5yrs 10yrs 15yrs 20yrs 25yrs 30yrs-0.5
0.0
0.5
1.0
1.5
2.0
2.5
November 2014October 2014September 2014
-0.5
0.0
0.5
1.0
1.5
2.0
2.5
Q3 Q4 Q1 Q2 Q3 Q4 Q1 Q2 Q3 Q42012 2013 2014
-0.5
0.0
0.5
1.0
1.5
2.0
2.5
1-year rate10-year ratespread between 10-year and 3-month ratesspread between 10-year and 2-year rates
Sources: ECB calculations based on underlying data provided by EuroMTS and ratings provided by Fitch Ratings.1) Data refer to the changing composition of the euro area. For further information, see the General Notes.2) Data cover AAA-rated euro area central government bonds.
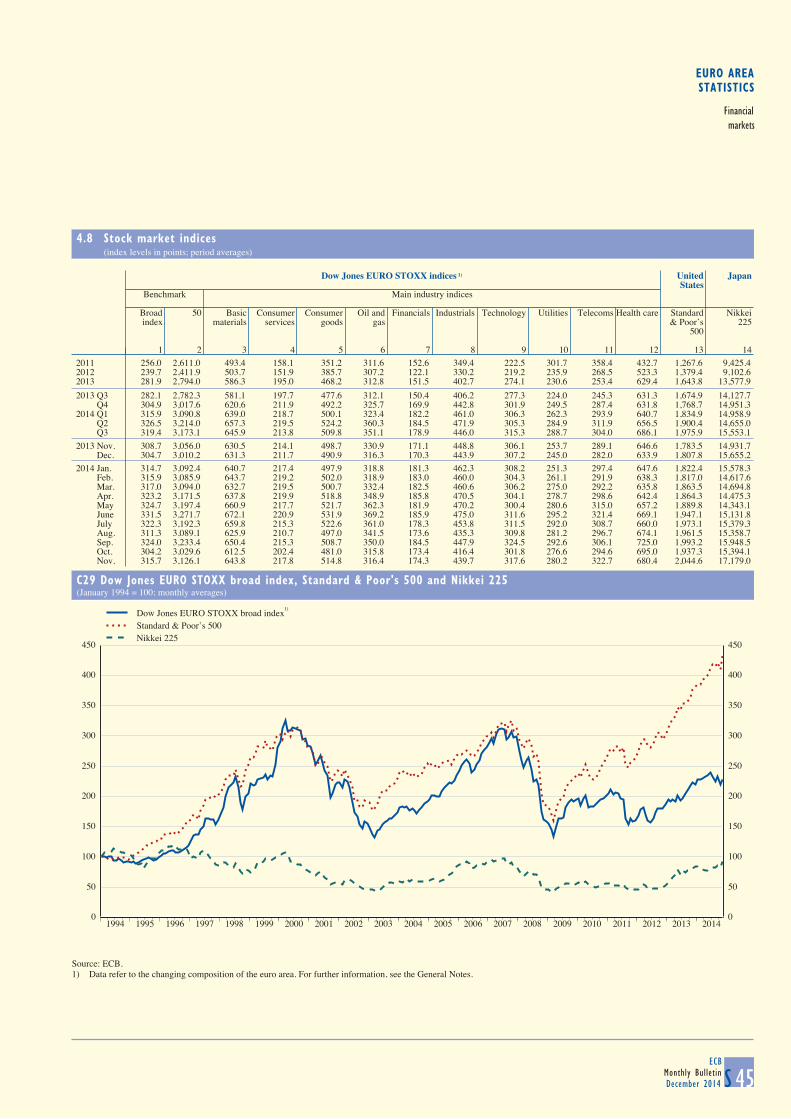
EURO AREASTATISTICS
Financialmarkets
4.8 Stock market indices (index levels in points; period averages)
S 45ECB
Monthly BulletinDecember 2014
Dow Jones EURO STOXX indices 1) United Japan
States Benchmark Main industry indices
Broad 50 Basic Consumer Consumer Oil and Financials Industrials Technology Utilities Telecoms Health care Standard Nikkeiindex materials services goods gas & Poor’s 225
500
1 2 3 4 5 6 7 8 9 10 11 12 13 142011 256.0 2,611.0 493.4 158.1 351.2 311.6 152.6 349.4 222.5 301.7 358.4 432.7 1,267.6 9,425.42012 239.7 2,411.9 503.7 151.9 385.7 307.2 122.1 330.2 219.2 235.9 268.5 523.3 1,379.4 9,102.62013 281.9 2,794.0 586.3 195.0 468.2 312.8 151.5 402.7 274.1 230.6 253.4 629.4 1,643.8 13,577.9
2013 Q3 282.1 2,782.3 581.1 197.7 477.6 312.1 150.4 406.2 277.3 224.0 245.3 631.3 1,674.9 14,127.7 Q4 304.9 3,017.6 620.6 211.9 492.2 325.7 169.9 442.8 301.9 249.5 287.4 631.8 1,768.7 14,951.32014 Q1 315.9 3,090.8 639.0 218.7 500.1 323.4 182.2 461.0 306.3 262.3 293.9 640.7 1,834.9 14,958.9 Q2 326.5 3,214.0 657.3 219.5 524.2 360.3 184.5 471.9 305.3 284.9 311.9 656.5 1,900.4 14,655.0 Q3 319.4 3,173.1 645.9 213.8 509.8 351.1 178.9 446.0 315.3 288.7 304.0 686.1 1,975.9 15,553.1
2013 Nov. 308.7 3,056.0 630.5 214.1 498.7 330.9 171.1 448.8 306.1 253.7 289.1 646.6 1,783.5 14,931.7 Dec. 304.7 3,010.2 631.3 211.7 490.9 316.3 170.3 443.9 307.2 245.0 282.0 633.9 1,807.8 15,655.22014 Jan. 314.7 3,092.4 640.7 217.4 497.9 318.8 181.3 462.3 308.2 251.3 297.4 647.6 1,822.4 15,578.3 Feb. 315.9 3,085.9 643.7 219.2 502.0 318.9 183.0 460.0 304.3 261.1 291.9 638.3 1,817.0 14,617.6 Mar. 317.0 3,094.0 632.7 219.5 500.7 332.4 182.5 460.6 306.2 275.0 292.2 635.8 1,863.5 14,694.8 Apr. 323.2 3,171.5 637.8 219.9 518.8 348.9 185.8 470.5 304.1 278.7 298.6 642.4 1,864.3 14,475.3 May 324.7 3,197.4 660.9 217.7 521.7 362.3 181.9 470.2 300.4 280.6 315.0 657.2 1,889.8 14,343.1 June 331.5 3,271.7 672.1 220.9 531.9 369.2 185.9 475.0 311.6 295.2 321.4 669.1 1,947.1 15,131.8 July 322.3 3,192.3 659.8 215.3 522.6 361.0 178.3 453.8 311.5 292.0 308.7 660.0 1,973.1 15,379.3 Aug. 311.3 3,089.1 625.9 210.7 497.0 341.5 173.6 435.3 309.8 281.2 296.7 674.1 1,961.5 15,358.7 Sep. 324.0 3,233.4 650.4 215.3 508.7 350.0 184.5 447.9 324.5 292.6 306.1 725.0 1,993.2 15,948.5 Oct. 304.2 3,029.6 612.5 202.4 481.0 315.8 173.4 416.4 301.8 276.6 294.6 695.0 1,937.3 15,394.1 Nov. 315.7 3,126.1 643.8 217.8 514.8 316.4 174.3 439.7 317.6 280.2 322.7 680.4 2,044.6 17,179.0
C29 Dow Jones EURO STOXX broad index, Standard & Poor's 500 and Nikkei 225
(January 1994 = 100; monthly averages)
0
50
100
150
200
250
300
350
400
450
1994 1995 1996 1997 1998 1999 2000 2001 2002 2003 2004 2005 2006 2007 2008 2009 2010 2011 2012 2013 20140
50
100
150
200
250
300
350
400
450
Dow Jones EURO STOXX broad indexStandard & Poor’s 500Nikkei 225
Source: ECB.1) Data refer to the changing composition of the euro area. For further information, see the General Notes.
1)
4.7 Euro area yield curves 1)
(AAA-rated euro area central government bonds; end of period; rates in percentages per annum; spreads in percentage points)
S 44ECBMonthly BulletinDecember 2014
Spot rates Instantaneous forward rates
3 months 1 year 2 years 5 years 7 years 10 years 10 years 10 years 1 year 2 years 5 years 10 years- 3 months - 2 years
(spread) (spread)1 2 3 4 5 6 7 8 9 10 11 12
2011 0.00 0.09 0.41 1.56 2.13 2.65 2.65 2.24 0.32 1.15 3.24 3.842012 0.06 -0.04 -0.01 0.58 1.09 1.72 1.66 1.74 -0.09 0.17 1.84 3.502013 0.08 0.09 0.25 1.07 1.62 2.24 2.16 1.99 0.18 0.67 2.53 3.882013 Q3 0.02 0.07 0.22 0.94 1.45 2.05 2.03 1.84 0.17 0.60 2.25 3.74 Q4 0.08 0.09 0.25 1.07 1.62 2.24 2.16 1.99 0.18 0.67 2.53 3.882014 Q1 0.16 0.11 0.17 0.76 1.23 1.82 1.66 1.65 0.11 0.40 1.94 3.50 Q2 0.05 -0.01 0.02 0.47 0.88 1.44 1.39 1.42 -0.04 0.16 1.46 3.09 Q3 -0.03 -0.09 -0.10 0.24 0.57 1.06 1.09 1.16 -0.14 -0.02 1.03 2.532013 Nov. 0.08 0.05 0.14 0.82 1.34 1.99 1.91 1.84 0.08 0.43 2.14 3.79 Dec. 0.08 0.09 0.25 1.07 1.62 2.24 2.16 1.99 0.18 0.67 2.53 3.882014 Jan. 0.09 0.04 0.11 0.77 1.27 1.89 1.80 1.79 0.04 0.37 2.06 3.61 Feb. 0.14 0.09 0.16 0.79 1.27 1.88 1.74 1.72 0.09 0.41 2.03 3.56 Mar. 0.16 0.11 0.17 0.76 1.23 1.82 1.66 1.65 0.11 0.40 1.94 3.50 Apr. 0.13 0.09 0.16 0.71 1.15 1.72 1.60 1.56 0.10 0.38 1.81 3.36 May 0.09 0.03 0.06 0.56 0.98 1.56 1.47 1.49 0.01 0.23 1.60 3.23 June 0.05 -0.01 0.02 0.47 0.88 1.44 1.39 1.42 -0.04 0.16 1.46 3.09 July 0.04 -0.02 0.01 0.43 0.81 1.34 1.30 1.33 -0.04 0.14 1.35 2.91 Aug. 0.00 -0.06 -0.05 0.28 0.59 1.03 1.03 1.08 -0.09 0.04 1.01 2.38 Sep. -0.03 -0.09 -0.10 0.24 0.57 1.06 1.09 1.16 -0.14 -0.02 1.03 2.53 Oct. -0.02 -0.08 -0.08 0.22 0.52 0.96 0.99 1.05 -0.12 -0.01 0.93 2.33 Nov. -0.02 -0.06 -0.07 0.17 0.42 0.80 0.82 0.87 -0.10 -0.02 0.74 2.01
C27 Euro area spot yield curves 2)
(percentages per annum; end of period)
C28 Euro area spot rates and spreads 2)
(daily data; rates in percentages per annum; spreads in percentage points)
-0.5
0.0
0.5
1.0
1.5
2.0
2.5
0 5yrs 10yrs 15yrs 20yrs 25yrs 30yrs-0.5
0.0
0.5
1.0
1.5
2.0
2.5
November 2014October 2014September 2014
-0.5
0.0
0.5
1.0
1.5
2.0
2.5
Q3 Q4 Q1 Q2 Q3 Q4 Q1 Q2 Q3 Q42012 2013 2014
-0.5
0.0
0.5
1.0
1.5
2.0
2.5
1-year rate10-year ratespread between 10-year and 3-month ratesspread between 10-year and 2-year rates
Sources: ECB calculations based on underlying data provided by EuroMTS and ratings provided by Fitch Ratings.1) Data refer to the changing composition of the euro area. For further information, see the General Notes.2) Data cover AAA-rated euro area central government bonds.
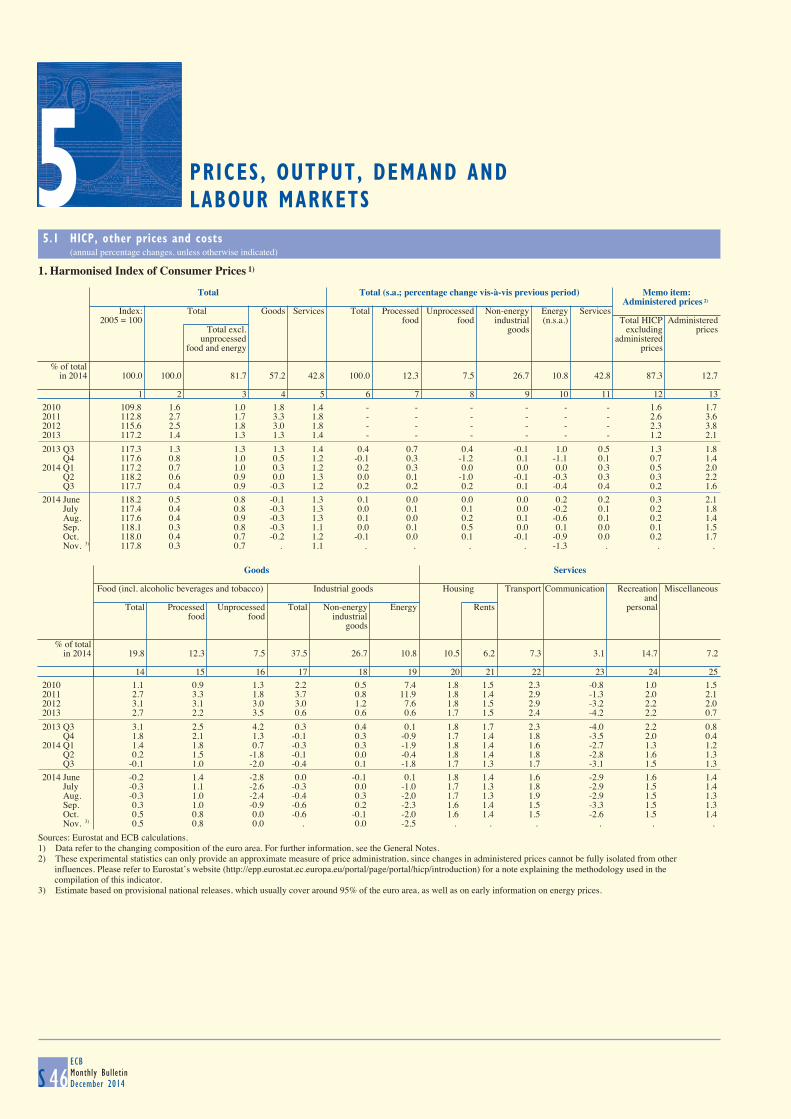
LABOUR MARKETS5 PRICES, OUTPUT, DEMAND AND
5.1 HICP, other prices and costs (annual percentage changes, unless otherwise indicated)
S 46ECBMonthly BulletinDecember 2014
1. Harmonised Index of Consumer Prices 1)
Total Total (s.a.; percentage change vis-à-vis previous period) Memo item: Administered prices 2)
Index: Total Goods Services Total Processed Unprocessed Non-energy Energy Services2005 = 100 food food industrial (n.s.a.) Total HICP Administered
Total excl. goods excluding pricesunprocessed administered
food and energy prices
% of totalin 2014 100.0 100.0 81.7 57.2 42.8 100.0 12.3 7.5 26.7 10.8 42.8 87.3 12.7
1 2 3 4 5 6 7 8 9 10 11 12 132010 109.8 1.6 1.0 1.8 1.4 - - - - - - 1.6 1.72011 112.8 2.7 1.7 3.3 1.8 - - - - - - 2.6 3.62012 115.6 2.5 1.8 3.0 1.8 - - - - - - 2.3 3.82013 117.2 1.4 1.3 1.3 1.4 - - - - - - 1.2 2.1
2013 Q3 117.3 1.3 1.3 1.3 1.4 0.4 0.7 0.4 -0.1 1.0 0.5 1.3 1.8 Q4 117.6 0.8 1.0 0.5 1.2 -0.1 0.3 -1.2 0.1 -1.1 0.1 0.7 1.42014 Q1 117.2 0.7 1.0 0.3 1.2 0.2 0.3 0.0 0.0 0.0 0.3 0.5 2.0 Q2 118.2 0.6 0.9 0.0 1.3 0.0 0.1 -1.0 -0.1 -0.3 0.3 0.3 2.2 Q3 117.7 0.4 0.9 -0.3 1.2 0.2 0.2 0.2 0.1 -0.4 0.4 0.2 1.6
2014 June 118.2 0.5 0.8 -0.1 1.3 0.1 0.0 0.0 0.0 0.2 0.2 0.3 2.1 July 117.4 0.4 0.8 -0.3 1.3 0.0 0.1 0.1 0.0 -0.2 0.1 0.2 1.8 Aug. 117.6 0.4 0.9 -0.3 1.3 0.1 0.0 0.2 0.1 -0.6 0.1 0.2 1.4 Sep. 118.1 0.3 0.8 -0.3 1.1 0.0 0.1 0.5 0.0 0.1 0.0 0.1 1.5 Oct. 118.0 0.4 0.7 -0.2 1.2 -0.1 0.0 0.1 -0.1 -0.9 0.0 0.2 1.7 Nov. 3) 117.8 0.3 0.7 . 1.1 . . . . -1.3 . . .
Goods Services
Food (incl. alcoholic beverages and tobacco) Industrial goods Housing Transport Communication Recreation Miscellaneous
andTotal Processed Unprocessed Total Non-energy Energy Rents personal
food food industrialgoods
% of totalin 2014 19.8 12.3 7.5 37.5 26.7 10.8 10.5 6.2 7.3 3.1 14.7 7.2
14 15 16 17 18 19 20 21 22 23 24 252010 1.1 0.9 1.3 2.2 0.5 7.4 1.8 1.5 2.3 -0.8 1.0 1.52011 2.7 3.3 1.8 3.7 0.8 11.9 1.8 1.4 2.9 -1.3 2.0 2.12012 3.1 3.1 3.0 3.0 1.2 7.6 1.8 1.5 2.9 -3.2 2.2 2.02013 2.7 2.2 3.5 0.6 0.6 0.6 1.7 1.5 2.4 -4.2 2.2 0.7
2013 Q3 3.1 2.5 4.2 0.3 0.4 0.1 1.8 1.7 2.3 -4.0 2.2 0.8 Q4 1.8 2.1 1.3 -0.1 0.3 -0.9 1.7 1.4 1.8 -3.5 2.0 0.42014 Q1 1.4 1.8 0.7 -0.3 0.3 -1.9 1.8 1.4 1.6 -2.7 1.3 1.2 Q2 0.2 1.5 -1.8 -0.1 0.0 -0.4 1.8 1.4 1.8 -2.8 1.6 1.3 Q3 -0.1 1.0 -2.0 -0.4 0.1 -1.8 1.7 1.3 1.7 -3.1 1.5 1.3
2014 June -0.2 1.4 -2.8 0.0 -0.1 0.1 1.8 1.4 1.6 -2.9 1.6 1.4 July -0.3 1.1 -2.6 -0.3 0.0 -1.0 1.7 1.3 1.8 -2.9 1.5 1.4 Aug. -0.3 1.0 -2.4 -0.4 0.3 -2.0 1.7 1.3 1.9 -2.9 1.5 1.3 Sep. 0.3 1.0 -0.9 -0.6 0.2 -2.3 1.6 1.4 1.5 -3.3 1.5 1.3 Oct. 0.5 0.8 0.0 -0.6 -0.1 -2.0 1.6 1.4 1.5 -2.6 1.5 1.4 Nov. 3) 0.5 0.8 0.0 . 0.0 -2.5 . . . . . .
Sources: Eurostat and ECB calculations.1) Data refer to the changing composition of the euro area. For further information, see the General Notes.2) These experimental statistics can only provide an approximate measure of price administration, since changes in administered prices cannot be fully isolated from other influences. Please refer to Eurostat’s website (http://epp.eurostat.ec.europa.eu/portal/page/portal/hicp/introduction) for a note explaining the methodology used in the compilation of this indicator.3) Estimate based on provisional national releases, which usually cover around 95% of the euro area, as well as on early information on energy prices.
5
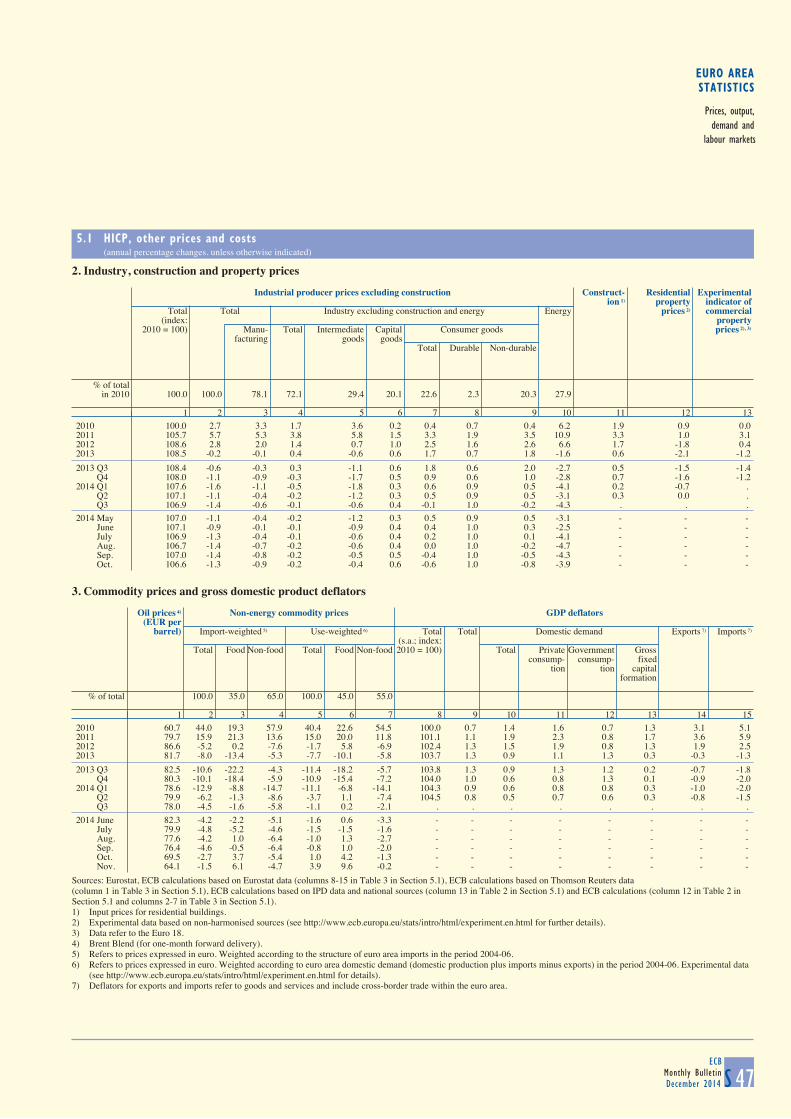
EURO AREASTATISTICS
Prices, output,demand and
labour markets
5.1 HICP, other prices and costs (annual percentage changes, unless otherwise indicated)
S 47ECB
Monthly BulletinDecember 2014
2. Industry, construction and property prices
Industrial producer prices excluding construction Construct- Residential Experimental
ion 1) property indicator ofTotal Total Industry excluding construction and energy Energy prices 2) commercial
(index: property2010 = 100) Manu- Total Intermediate Capital Consumer goods prices 2), 3)
facturing goods goodsTotal Durable Non-durable
% of totalin 2010 100.0 100.0 78.1 72.1 29.4 20.1 22.6 2.3 20.3 27.9
1 2 3 4 5 6 7 8 9 10 11 12 132010 100.0 2.7 3.3 1.7 3.6 0.2 0.4 0.7 0.4 6.2 1.9 0.9 0.02011 105.7 5.7 5.3 3.8 5.8 1.5 3.3 1.9 3.5 10.9 3.3 1.0 3.12012 108.6 2.8 2.0 1.4 0.7 1.0 2.5 1.6 2.6 6.6 1.7 -1.8 0.42013 108.5 -0.2 -0.1 0.4 -0.6 0.6 1.7 0.7 1.8 -1.6 0.6 -2.1 -1.2
2013 Q3 108.4 -0.6 -0.3 0.3 -1.1 0.6 1.8 0.6 2.0 -2.7 0.5 -1.5 -1.4 Q4 108.0 -1.1 -0.9 -0.3 -1.7 0.5 0.9 0.6 1.0 -2.8 0.7 -1.6 -1.22014 Q1 107.6 -1.6 -1.1 -0.5 -1.8 0.3 0.6 0.9 0.5 -4.1 0.2 -0.7 . Q2 107.1 -1.1 -0.4 -0.2 -1.2 0.3 0.5 0.9 0.5 -3.1 0.3 0.0 . Q3 106.9 -1.4 -0.6 -0.1 -0.6 0.4 -0.1 1.0 -0.2 -4.3 . . .
2014 May 107.0 -1.1 -0.4 -0.2 -1.2 0.3 0.5 0.9 0.5 -3.1 - - - June 107.1 -0.9 -0.1 -0.1 -0.9 0.4 0.4 1.0 0.3 -2.5 - - - July 106.9 -1.3 -0.4 -0.1 -0.6 0.4 0.2 1.0 0.1 -4.1 - - - Aug. 106.7 -1.4 -0.7 -0.2 -0.6 0.4 0.0 1.0 -0.2 -4.7 - - - Sep. 107.0 -1.4 -0.8 -0.2 -0.5 0.5 -0.4 1.0 -0.5 -4.3 - - - Oct. 106.6 -1.3 -0.9 -0.2 -0.4 0.6 -0.6 1.0 -0.8 -3.9 - - -
3. Commodity prices and gross domestic product deflators
Oil prices 4) Non-energy commodity prices GDP deflators
(EUR per barrel) Import-weighted 5) Use-weighted 6) Total Total Domestic demand Exports 7) Imports 7)
(s.a.; index:Total Food Non-food Total Food Non-food 2010 = 100) Total Private Government Gross
consump- consump- fixedtion tion capital
formation
% of total 100.0 35.0 65.0 100.0 45.0 55.0
1 2 3 4 5 6 7 8 9 10 11 12 13 14 152010 60.7 44.0 19.3 57.9 40.4 22.6 54.5 100.0 0.7 1.4 1.6 0.7 1.3 3.1 5.12011 79.7 15.9 21.3 13.6 15.0 20.0 11.8 101.1 1.1 1.9 2.3 0.8 1.7 3.6 5.92012 86.6 -5.2 0.2 -7.6 -1.7 5.8 -6.9 102.4 1.3 1.5 1.9 0.8 1.3 1.9 2.52013 81.7 -8.0 -13.4 -5.3 -7.7 -10.1 -5.8 103.7 1.3 0.9 1.1 1.3 0.3 -0.3 -1.3
2013 Q3 82.5 -10.6 -22.2 -4.3 -11.4 -18.2 -5.7 103.8 1.3 0.9 1.3 1.2 0.2 -0.7 -1.8 Q4 80.3 -10.1 -18.4 -5.9 -10.9 -15.4 -7.2 104.0 1.0 0.6 0.8 1.3 0.1 -0.9 -2.02014 Q1 78.6 -12.9 -8.8 -14.7 -11.1 -6.8 -14.1 104.3 0.9 0.6 0.8 0.8 0.3 -1.0 -2.0 Q2 79.9 -6.2 -1.3 -8.6 -3.7 1.1 -7.4 104.5 0.8 0.5 0.7 0.6 0.3 -0.8 -1.5 Q3 78.0 -4.5 -1.6 -5.8 -1.1 0.2 -2.1 . . . . . . . .
2014 June 82.3 -4.2 -2.2 -5.1 -1.6 0.6 -3.3 - - - - - - - - July 79.9 -4.8 -5.2 -4.6 -1.5 -1.5 -1.6 - - - - - - - - Aug. 77.6 -4.2 1.0 -6.4 -1.0 1.3 -2.7 - - - - - - - - Sep. 76.4 -4.6 -0.5 -6.4 -0.8 1.0 -2.0 - - - - - - - - Oct. 69.5 -2.7 3.7 -5.4 1.0 4.2 -1.3 - - - - - - - - Nov. 64.1 -1.5 6.1 -4.7 3.9 9.6 -0.2 - - - - - - - -
Sources: Eurostat, ECB calculations based on Eurostat data (columns 8-15 in Table 3 in Section 5.1), ECB calculations based on Thomson Reuters data (column 1 in Table 3 in Section 5.1), ECB calculations based on IPD data and national sources (column 13 in Table 2 in Section 5.1) and ECB calculations (column 12 in Table 2 in Section 5.1 and columns 2-7 in Table 3 in Section 5.1).1) Input prices for residential buildings.2) Experimental data based on non-harmonised sources (see http://www.ecb.europa.eu/stats/intro/html/experiment.en.html for further details).3) Data refer to the Euro 18.4) Brent Blend (for one-month forward delivery).5) Refers to prices expressed in euro. Weighted according to the structure of euro area imports in the period 2004-06.6) Refers to prices expressed in euro. Weighted according to euro area domestic demand (domestic production plus imports minus exports) in the period 2004-06. Experimental data
(see http://www.ecb.europa.eu/stats/intro/html/experiment.en.html for details).7) Deflators for exports and imports refer to goods and services and include cross-border trade within the euro area.
LABOUR MARKETS5 PRICES, OUTPUT, DEMAND AND
5.1 HICP, other prices and costs (annual percentage changes, unless otherwise indicated)
S 46ECBMonthly BulletinDecember 2014
1. Harmonised Index of Consumer Prices 1)
Total Total (s.a.; percentage change vis-à-vis previous period) Memo item: Administered prices 2)
Index: Total Goods Services Total Processed Unprocessed Non-energy Energy Services2005 = 100 food food industrial (n.s.a.) Total HICP Administered
Total excl. goods excluding pricesunprocessed administered
food and energy prices
% of totalin 2014 100.0 100.0 81.7 57.2 42.8 100.0 12.3 7.5 26.7 10.8 42.8 87.3 12.7
1 2 3 4 5 6 7 8 9 10 11 12 132010 109.8 1.6 1.0 1.8 1.4 - - - - - - 1.6 1.72011 112.8 2.7 1.7 3.3 1.8 - - - - - - 2.6 3.62012 115.6 2.5 1.8 3.0 1.8 - - - - - - 2.3 3.82013 117.2 1.4 1.3 1.3 1.4 - - - - - - 1.2 2.1
2013 Q3 117.3 1.3 1.3 1.3 1.4 0.4 0.7 0.4 -0.1 1.0 0.5 1.3 1.8 Q4 117.6 0.8 1.0 0.5 1.2 -0.1 0.3 -1.2 0.1 -1.1 0.1 0.7 1.42014 Q1 117.2 0.7 1.0 0.3 1.2 0.2 0.3 0.0 0.0 0.0 0.3 0.5 2.0 Q2 118.2 0.6 0.9 0.0 1.3 0.0 0.1 -1.0 -0.1 -0.3 0.3 0.3 2.2 Q3 117.7 0.4 0.9 -0.3 1.2 0.2 0.2 0.2 0.1 -0.4 0.4 0.2 1.6
2014 June 118.2 0.5 0.8 -0.1 1.3 0.1 0.0 0.0 0.0 0.2 0.2 0.3 2.1 July 117.4 0.4 0.8 -0.3 1.3 0.0 0.1 0.1 0.0 -0.2 0.1 0.2 1.8 Aug. 117.6 0.4 0.9 -0.3 1.3 0.1 0.0 0.2 0.1 -0.6 0.1 0.2 1.4 Sep. 118.1 0.3 0.8 -0.3 1.1 0.0 0.1 0.5 0.0 0.1 0.0 0.1 1.5 Oct. 118.0 0.4 0.7 -0.2 1.2 -0.1 0.0 0.1 -0.1 -0.9 0.0 0.2 1.7 Nov. 3) 117.8 0.3 0.7 . 1.1 . . . . -1.3 . . .
Goods Services
Food (incl. alcoholic beverages and tobacco) Industrial goods Housing Transport Communication Recreation Miscellaneous
andTotal Processed Unprocessed Total Non-energy Energy Rents personal
food food industrialgoods
% of totalin 2014 19.8 12.3 7.5 37.5 26.7 10.8 10.5 6.2 7.3 3.1 14.7 7.2
14 15 16 17 18 19 20 21 22 23 24 252010 1.1 0.9 1.3 2.2 0.5 7.4 1.8 1.5 2.3 -0.8 1.0 1.52011 2.7 3.3 1.8 3.7 0.8 11.9 1.8 1.4 2.9 -1.3 2.0 2.12012 3.1 3.1 3.0 3.0 1.2 7.6 1.8 1.5 2.9 -3.2 2.2 2.02013 2.7 2.2 3.5 0.6 0.6 0.6 1.7 1.5 2.4 -4.2 2.2 0.7
2013 Q3 3.1 2.5 4.2 0.3 0.4 0.1 1.8 1.7 2.3 -4.0 2.2 0.8 Q4 1.8 2.1 1.3 -0.1 0.3 -0.9 1.7 1.4 1.8 -3.5 2.0 0.42014 Q1 1.4 1.8 0.7 -0.3 0.3 -1.9 1.8 1.4 1.6 -2.7 1.3 1.2 Q2 0.2 1.5 -1.8 -0.1 0.0 -0.4 1.8 1.4 1.8 -2.8 1.6 1.3 Q3 -0.1 1.0 -2.0 -0.4 0.1 -1.8 1.7 1.3 1.7 -3.1 1.5 1.3
2014 June -0.2 1.4 -2.8 0.0 -0.1 0.1 1.8 1.4 1.6 -2.9 1.6 1.4 July -0.3 1.1 -2.6 -0.3 0.0 -1.0 1.7 1.3 1.8 -2.9 1.5 1.4 Aug. -0.3 1.0 -2.4 -0.4 0.3 -2.0 1.7 1.3 1.9 -2.9 1.5 1.3 Sep. 0.3 1.0 -0.9 -0.6 0.2 -2.3 1.6 1.4 1.5 -3.3 1.5 1.3 Oct. 0.5 0.8 0.0 -0.6 -0.1 -2.0 1.6 1.4 1.5 -2.6 1.5 1.4 Nov. 3) 0.5 0.8 0.0 . 0.0 -2.5 . . . . . .
Sources: Eurostat and ECB calculations.1) Data refer to the changing composition of the euro area. For further information, see the General Notes.2) These experimental statistics can only provide an approximate measure of price administration, since changes in administered prices cannot be fully isolated from other influences. Please refer to Eurostat’s website (http://epp.eurostat.ec.europa.eu/portal/page/portal/hicp/introduction) for a note explaining the methodology used in the compilation of this indicator.3) Estimate based on provisional national releases, which usually cover around 95% of the euro area, as well as on early information on energy prices.
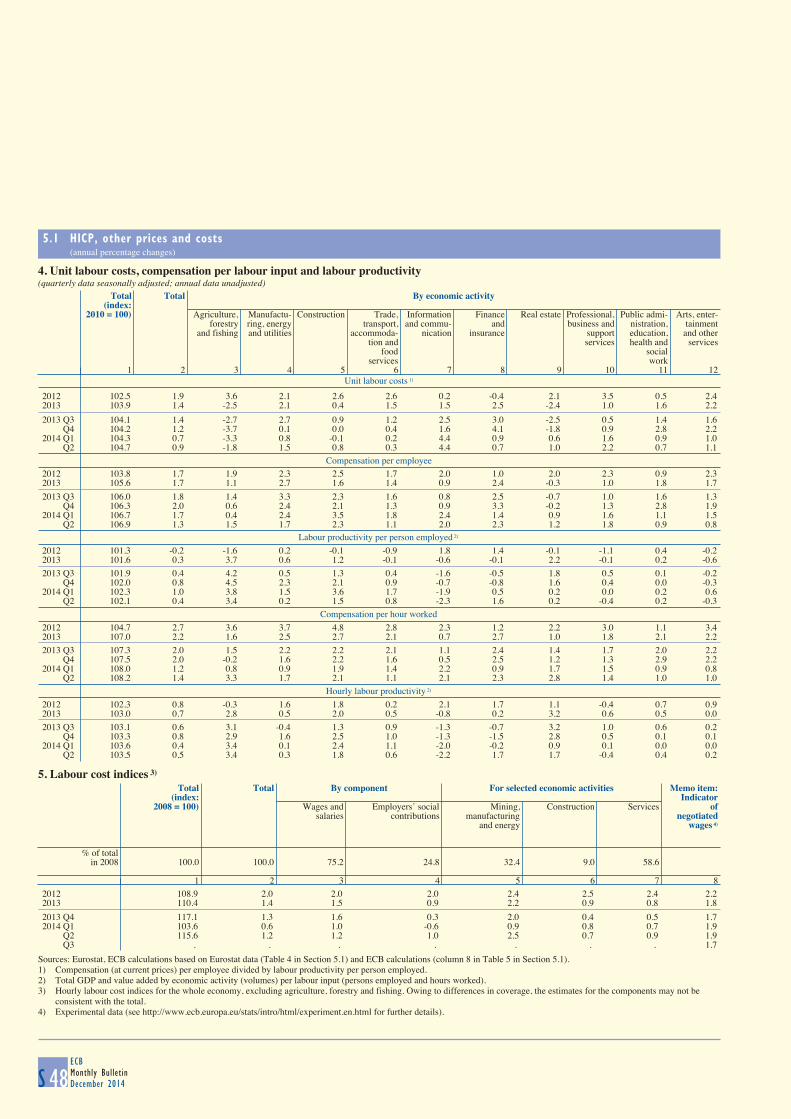
5.1 HICP, other prices and costs (annual percentage changes)
S 48ECBMonthly BulletinDecember 2014
4. Unit labour costs, compensation per labour input and labour productivity(quarterly data seasonally adjusted; annual data unadjusted)
Unit labour costs 1)
Total Total By economic activity
(index:2010 = 100) Agriculture, Manufactu- Construction Trade, Information Finance Real estate Professional, Public admi- Arts, enter-
forestry ring, energy transport, and commu- and business and nistration, tainmentand fishing and utilities accommoda- nication insurance support education, and other
tion and services health and servicesfood social
services work1 2 3 4 5 6 7 8 9 10 11 12
2012 102.5 1.9 3.6 2.1 2.6 2.6 0.2 -0.4 2.1 3.5 0.5 2.42013 103.9 1.4 -2.5 2.1 0.4 1.5 1.5 2.5 -2.4 1.0 1.6 2.2
2013 Q3 104.1 1.4 -2.7 2.7 0.9 1.2 2.5 3.0 -2.5 0.5 1.4 1.6 Q4 104.2 1.2 -3.7 0.1 0.0 0.4 1.6 4.1 -1.8 0.9 2.8 2.22014 Q1 104.3 0.7 -3.3 0.8 -0.1 0.2 4.4 0.9 0.6 1.6 0.9 1.0 Q2 104.7 0.9 -1.8 1.5 0.8 0.3 4.4 0.7 1.0 2.2 0.7 1.1
Compensation per employee
2012 103.8 1.7 1.9 2.3 2.5 1.7 2.0 1.0 2.0 2.3 0.9 2.32013 105.6 1.7 1.1 2.7 1.6 1.4 0.9 2.4 -0.3 1.0 1.8 1.7
2013 Q3 106.0 1.8 1.4 3.3 2.3 1.6 0.8 2.5 -0.7 1.0 1.6 1.3 Q4 106.3 2.0 0.6 2.4 2.1 1.3 0.9 3.3 -0.2 1.3 2.8 1.92014 Q1 106.7 1.7 0.4 2.4 3.5 1.8 2.4 1.4 0.9 1.6 1.1 1.5 Q2 106.9 1.3 1.5 1.7 2.3 1.1 2.0 2.3 1.2 1.8 0.9 0.8
Labour productivity per person employed 2)
2012 101.3 -0.2 -1.6 0.2 -0.1 -0.9 1.8 1.4 -0.1 -1.1 0.4 -0.22013 101.6 0.3 3.7 0.6 1.2 -0.1 -0.6 -0.1 2.2 -0.1 0.2 -0.6
2013 Q3 101.9 0.4 4.2 0.5 1.3 0.4 -1.6 -0.5 1.8 0.5 0.1 -0.2 Q4 102.0 0.8 4.5 2.3 2.1 0.9 -0.7 -0.8 1.6 0.4 0.0 -0.32014 Q1 102.3 1.0 3.8 1.5 3.6 1.7 -1.9 0.5 0.2 0.0 0.2 0.6 Q2 102.1 0.4 3.4 0.2 1.5 0.8 -2.3 1.6 0.2 -0.4 0.2 -0.3
Compensation per hour worked
2012 104.7 2.7 3.6 3.7 4.8 2.8 2.3 1.2 2.2 3.0 1.1 3.42013 107.0 2.2 1.6 2.5 2.7 2.1 0.7 2.7 1.0 1.8 2.1 2.2
2013 Q3 107.3 2.0 1.5 2.2 2.2 2.1 1.1 2.4 1.4 1.7 2.0 2.2 Q4 107.5 2.0 -0.2 1.6 2.2 1.6 0.5 2.5 1.2 1.3 2.9 2.22014 Q1 108.0 1.2 0.8 0.9 1.9 1.4 2.2 0.9 1.7 1.5 0.9 0.8 Q2 108.2 1.4 3.3 1.7 2.1 1.1 2.1 2.3 2.8 1.4 1.0 1.0
Hourly labour productivity 2)
2012 102.3 0.8 -0.3 1.6 1.8 0.2 2.1 1.7 1.1 -0.4 0.7 0.92013 103.0 0.7 2.8 0.5 2.0 0.5 -0.8 0.2 3.2 0.6 0.5 0.0
2013 Q3 103.1 0.6 3.1 -0.4 1.3 0.9 -1.3 -0.7 3.2 1.0 0.6 0.2 Q4 103.3 0.8 2.9 1.6 2.5 1.0 -1.3 -1.5 2.8 0.5 0.1 0.12014 Q1 103.6 0.4 3.4 0.1 2.4 1.1 -2.0 -0.2 0.9 0.1 0.0 0.0 Q2 103.5 0.5 3.4 0.3 1.8 0.6 -2.2 1.7 1.7 -0.4 0.4 0.2
5. Labour cost indices 3)
Total Total By component For selected economic activities Memo item:
(index: Indicator2008 = 100) Wages and Employers’ social Mining, Construction Services of
salaries contributions manufacturing negotiatedand energy wages 4)
% of totalin 2008 100.0 100.0 75.2 24.8 32.4 9.0 58.6
1 2 3 4 5 6 7 82012 108.9 2.0 2.0 2.0 2.4 2.5 2.4 2.22013 110.4 1.4 1.5 0.9 2.2 0.9 0.8 1.8
2013 Q4 117.1 1.3 1.6 0.3 2.0 0.4 0.5 1.72014 Q1 103.6 0.6 1.0 -0.6 0.9 0.8 0.7 1.9 Q2 115.6 1.2 1.2 1.0 2.5 0.7 0.9 1.9 Q3 . . . . . . . 1.7
Sources: Eurostat, ECB calculations based on Eurostat data (Table 4 in Section 5.1) and ECB calculations (column 8 in Table 5 in Section 5.1).1) Compensation (at current prices) per employee divided by labour productivity per person employed.2) Total GDP and value added by economic activity (volumes) per labour input (persons employed and hours worked).3) Hourly labour cost indices for the whole economy, excluding agriculture, forestry and fishing. Owing to differences in coverage, the estimates for the components may not be
consistent with the total.4) Experimental data (see http://www.ecb.europa.eu/stats/intro/html/experiment.en.html for further details).
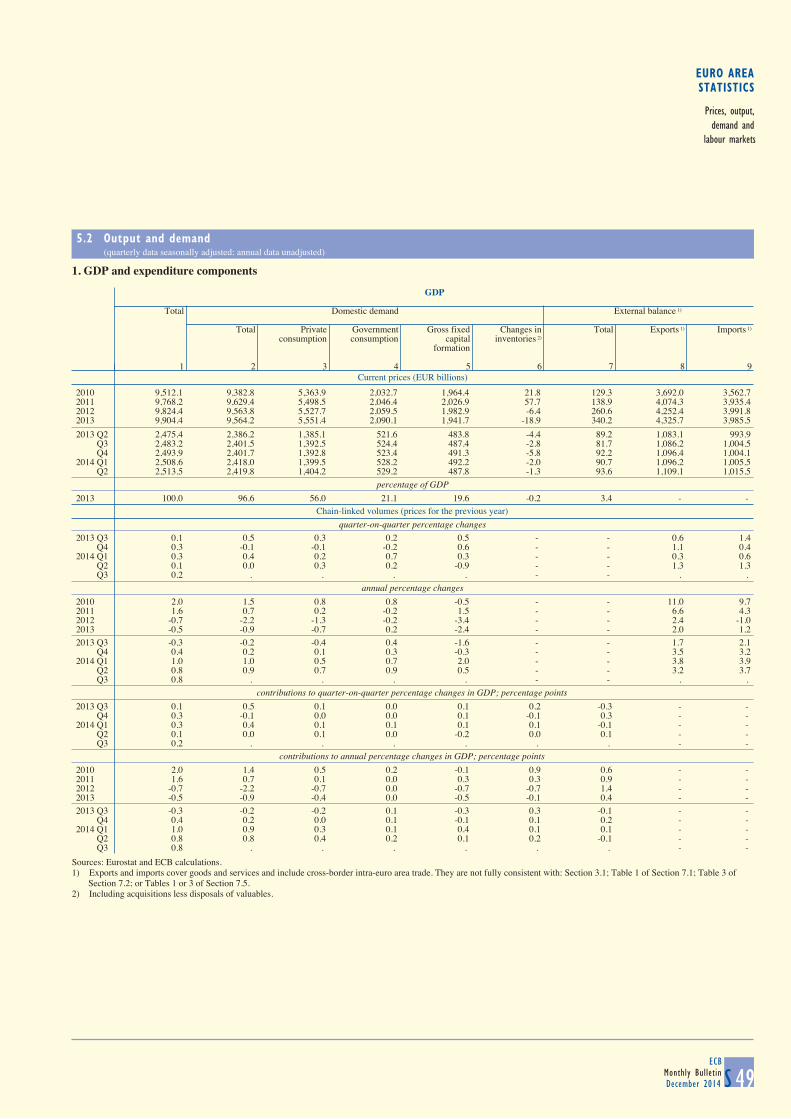
EURO AREASTATISTICS
Prices, output,demand and
labour markets
5.2 Output and demand (quarterly data seasonally adjusted; annual data unadjusted)
S 49ECB
Monthly BulletinDecember 2014
1. GDP and expenditure components
Current prices (EUR billions)
GDP
Total Domestic demand External balance 1)
Total Private Government Gross fixed Changes in Total Exports 1) Imports 1)
consumption consumption capital inventories 2)
formation
1 2 3 4 5 6 7 8 9
2010 9,512.1 9,382.8 5,363.9 2,032.7 1,964.4 21.8 129.3 3,692.0 3,562.72011 9,768.2 9,629.4 5,498.5 2,046.4 2,026.9 57.7 138.9 4,074.3 3,935.42012 9,824.4 9,563.8 5,527.7 2,059.5 1,982.9 -6.4 260.6 4,252.4 3,991.82013 9,904.4 9,564.2 5,551.4 2,090.1 1,941.7 -18.9 340.2 4,325.7 3,985.5
2013 Q2 2,475.4 2,386.2 1,385.1 521.6 483.8 -4.4 89.2 1,083.1 993.9 Q3 2,483.2 2,401.5 1,392.5 524.4 487.4 -2.8 81.7 1,086.2 1,004.5 Q4 2,493.9 2,401.7 1,392.8 523.4 491.3 -5.8 92.2 1,096.4 1,004.12014 Q1 2,508.6 2,418.0 1,399.5 528.2 492.2 -2.0 90.7 1,096.2 1,005.5 Q2 2,513.5 2,419.8 1,404.2 529.2 487.8 -1.3 93.6 1,109.1 1,015.5
percentage of GDP 2013 100.0 96.6 56.0 21.1 19.6 -0.2 3.4 - -
Chain-linked volumes (prices for the previous year)
quarter-on-quarter percentage changes
2013 Q3 0.1 0.5 0.3 0.2 0.5 - - 0.6 1.4 Q4 0.3 -0.1 -0.1 -0.2 0.6 - - 1.1 0.42014 Q1 0.3 0.4 0.2 0.7 0.3 - - 0.3 0.6 Q2 0.1 0.0 0.3 0.2 -0.9 - - 1.3 1.3 Q3 0.2 . . . . - - . .
annual percentage changes
2010 2.0 1.5 0.8 0.8 -0.5 - - 11.0 9.72011 1.6 0.7 0.2 -0.2 1.5 - - 6.6 4.32012 -0.7 -2.2 -1.3 -0.2 -3.4 - - 2.4 -1.02013 -0.5 -0.9 -0.7 0.2 -2.4 - - 2.0 1.2
2013 Q3 -0.3 -0.2 -0.4 0.4 -1.6 - - 1.7 2.1 Q4 0.4 0.2 0.1 0.3 -0.3 - - 3.5 3.22014 Q1 1.0 1.0 0.5 0.7 2.0 - - 3.8 3.9 Q2 0.8 0.9 0.7 0.9 0.5 - - 3.2 3.7 Q3 0.8 . . . . - - . .
contributions to quarter-on-quarter percentage changes in GDP; percentage points
2013 Q3 0.1 0.5 0.1 0.0 0.1 0.2 -0.3 - - Q4 0.3 -0.1 0.0 0.0 0.1 -0.1 0.3 - - 2014 Q1 0.3 0.4 0.1 0.1 0.1 0.1 -0.1 - - Q2 0.1 0.0 0.1 0.0 -0.2 0.0 0.1 - - Q3 0.2 . . . . . . - -
contributions to annual percentage changes in GDP; percentage points
2010 2.0 1.4 0.5 0.2 -0.1 0.9 0.6 - - 2011 1.6 0.7 0.1 0.0 0.3 0.3 0.9 - - 2012 -0.7 -2.2 -0.7 0.0 -0.7 -0.7 1.4 - - 2013 -0.5 -0.9 -0.4 0.0 -0.5 -0.1 0.4 - -
2013 Q3 -0.3 -0.2 -0.2 0.1 -0.3 0.3 -0.1 - - Q4 0.4 0.2 0.0 0.1 -0.1 0.1 0.2 - - 2014 Q1 1.0 0.9 0.3 0.1 0.4 0.1 0.1 - - Q2 0.8 0.8 0.4 0.2 0.1 0.2 -0.1 - - Q3 0.8 . . . . . . - -
Sources: Eurostat and ECB calculations.1) Exports and imports cover goods and services and include cross-border intra-euro area trade. They are not fully consistent with: Section 3.1; Table 1 of Section 7.1; Table 3 of Section 7.2; or Tables 1 or 3 of Section 7.5.2) Including acquisitions less disposals of valuables.
5.1 HICP, other prices and costs (annual percentage changes)
S 48ECBMonthly BulletinDecember 2014
4. Unit labour costs, compensation per labour input and labour productivity(quarterly data seasonally adjusted; annual data unadjusted)
Unit labour costs 1)
Total Total By economic activity
(index:2010 = 100) Agriculture, Manufactu- Construction Trade, Information Finance Real estate Professional, Public admi- Arts, enter-
forestry ring, energy transport, and commu- and business and nistration, tainmentand fishing and utilities accommoda- nication insurance support education, and other
tion and services health and servicesfood social
services work1 2 3 4 5 6 7 8 9 10 11 12
2012 102.5 1.9 3.6 2.1 2.6 2.6 0.2 -0.4 2.1 3.5 0.5 2.42013 103.9 1.4 -2.5 2.1 0.4 1.5 1.5 2.5 -2.4 1.0 1.6 2.2
2013 Q3 104.1 1.4 -2.7 2.7 0.9 1.2 2.5 3.0 -2.5 0.5 1.4 1.6 Q4 104.2 1.2 -3.7 0.1 0.0 0.4 1.6 4.1 -1.8 0.9 2.8 2.22014 Q1 104.3 0.7 -3.3 0.8 -0.1 0.2 4.4 0.9 0.6 1.6 0.9 1.0 Q2 104.7 0.9 -1.8 1.5 0.8 0.3 4.4 0.7 1.0 2.2 0.7 1.1
Compensation per employee
2012 103.8 1.7 1.9 2.3 2.5 1.7 2.0 1.0 2.0 2.3 0.9 2.32013 105.6 1.7 1.1 2.7 1.6 1.4 0.9 2.4 -0.3 1.0 1.8 1.7
2013 Q3 106.0 1.8 1.4 3.3 2.3 1.6 0.8 2.5 -0.7 1.0 1.6 1.3 Q4 106.3 2.0 0.6 2.4 2.1 1.3 0.9 3.3 -0.2 1.3 2.8 1.92014 Q1 106.7 1.7 0.4 2.4 3.5 1.8 2.4 1.4 0.9 1.6 1.1 1.5 Q2 106.9 1.3 1.5 1.7 2.3 1.1 2.0 2.3 1.2 1.8 0.9 0.8
Labour productivity per person employed 2)
2012 101.3 -0.2 -1.6 0.2 -0.1 -0.9 1.8 1.4 -0.1 -1.1 0.4 -0.22013 101.6 0.3 3.7 0.6 1.2 -0.1 -0.6 -0.1 2.2 -0.1 0.2 -0.6
2013 Q3 101.9 0.4 4.2 0.5 1.3 0.4 -1.6 -0.5 1.8 0.5 0.1 -0.2 Q4 102.0 0.8 4.5 2.3 2.1 0.9 -0.7 -0.8 1.6 0.4 0.0 -0.32014 Q1 102.3 1.0 3.8 1.5 3.6 1.7 -1.9 0.5 0.2 0.0 0.2 0.6 Q2 102.1 0.4 3.4 0.2 1.5 0.8 -2.3 1.6 0.2 -0.4 0.2 -0.3
Compensation per hour worked
2012 104.7 2.7 3.6 3.7 4.8 2.8 2.3 1.2 2.2 3.0 1.1 3.42013 107.0 2.2 1.6 2.5 2.7 2.1 0.7 2.7 1.0 1.8 2.1 2.2
2013 Q3 107.3 2.0 1.5 2.2 2.2 2.1 1.1 2.4 1.4 1.7 2.0 2.2 Q4 107.5 2.0 -0.2 1.6 2.2 1.6 0.5 2.5 1.2 1.3 2.9 2.22014 Q1 108.0 1.2 0.8 0.9 1.9 1.4 2.2 0.9 1.7 1.5 0.9 0.8 Q2 108.2 1.4 3.3 1.7 2.1 1.1 2.1 2.3 2.8 1.4 1.0 1.0
Hourly labour productivity 2)
2012 102.3 0.8 -0.3 1.6 1.8 0.2 2.1 1.7 1.1 -0.4 0.7 0.92013 103.0 0.7 2.8 0.5 2.0 0.5 -0.8 0.2 3.2 0.6 0.5 0.0
2013 Q3 103.1 0.6 3.1 -0.4 1.3 0.9 -1.3 -0.7 3.2 1.0 0.6 0.2 Q4 103.3 0.8 2.9 1.6 2.5 1.0 -1.3 -1.5 2.8 0.5 0.1 0.12014 Q1 103.6 0.4 3.4 0.1 2.4 1.1 -2.0 -0.2 0.9 0.1 0.0 0.0 Q2 103.5 0.5 3.4 0.3 1.8 0.6 -2.2 1.7 1.7 -0.4 0.4 0.2
5. Labour cost indices 3)
Total Total By component For selected economic activities Memo item:
(index: Indicator2008 = 100) Wages and Employers’ social Mining, Construction Services of
salaries contributions manufacturing negotiatedand energy wages 4)
% of totalin 2008 100.0 100.0 75.2 24.8 32.4 9.0 58.6
1 2 3 4 5 6 7 82012 108.9 2.0 2.0 2.0 2.4 2.5 2.4 2.22013 110.4 1.4 1.5 0.9 2.2 0.9 0.8 1.8
2013 Q4 117.1 1.3 1.6 0.3 2.0 0.4 0.5 1.72014 Q1 103.6 0.6 1.0 -0.6 0.9 0.8 0.7 1.9 Q2 115.6 1.2 1.2 1.0 2.5 0.7 0.9 1.9 Q3 . . . . . . . 1.7
Sources: Eurostat, ECB calculations based on Eurostat data (Table 4 in Section 5.1) and ECB calculations (column 8 in Table 5 in Section 5.1).1) Compensation (at current prices) per employee divided by labour productivity per person employed.2) Total GDP and value added by economic activity (volumes) per labour input (persons employed and hours worked).3) Hourly labour cost indices for the whole economy, excluding agriculture, forestry and fishing. Owing to differences in coverage, the estimates for the components may not be
consistent with the total.4) Experimental data (see http://www.ecb.europa.eu/stats/intro/html/experiment.en.html for further details).
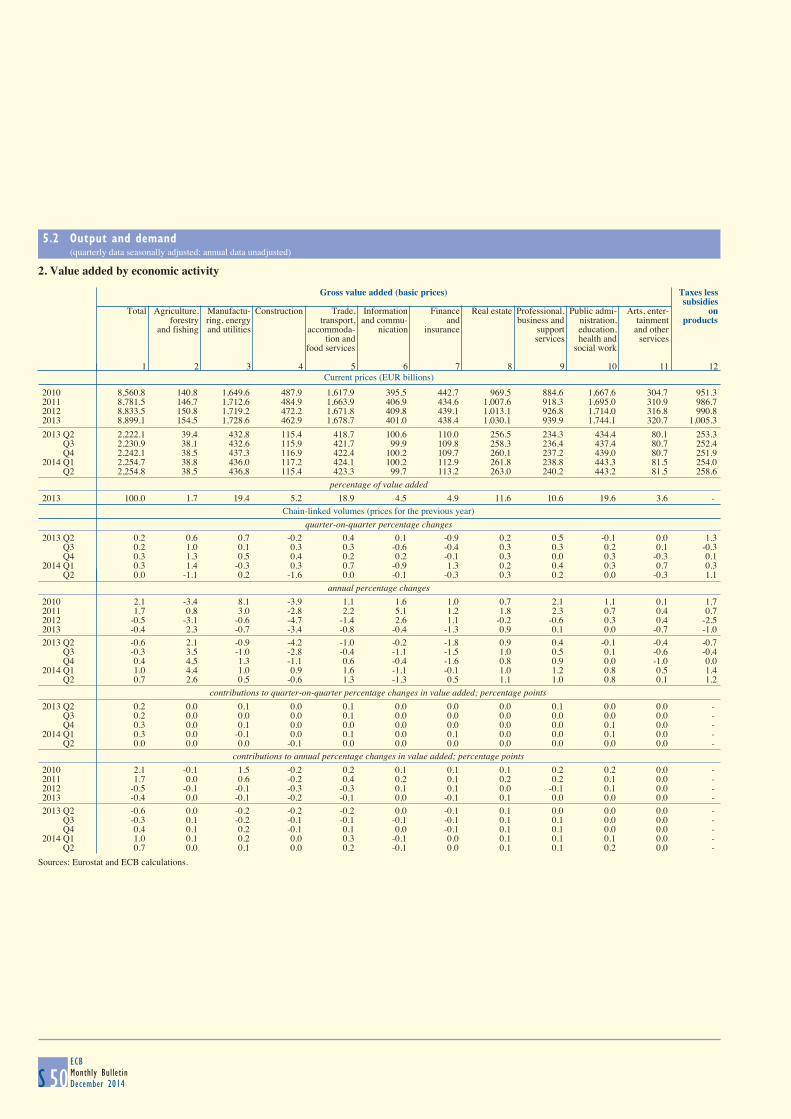
5.2 Output and demand (quarterly data seasonally adjusted; annual data unadjusted)
S 50ECBMonthly BulletinDecember 2014
2. Value added by economic activity
Current prices (EUR billions)
Gross value added (basic prices) Taxes less
subsidiesTotal Agriculture, Manufactu- Construction Trade, Information Finance Real estate Professional, Public admi- Arts, enter- on
forestry ring, energy transport, and commu- and business and nistration, tainment productsand fishing and utilities accommoda- nication insurance support education, and other
tion and services health and servicesfood services social work
1 2 3 4 5 6 7 8 9 10 11 12
2010 8,560.8 140.8 1,649.6 487.9 1,617.9 395.5 442.7 969.5 884.6 1,667.6 304.7 951.32011 8,781.5 146.7 1,712.6 484.9 1,663.9 406.9 434.6 1,007.6 918.3 1,695.0 310.9 986.72012 8,833.5 150.8 1,719.2 472.2 1,671.8 409.8 439.1 1,013.1 926.8 1,714.0 316.8 990.82013 8,899.1 154.5 1,728.6 462.9 1,678.7 401.0 438.4 1,030.1 939.9 1,744.1 320.7 1,005.3
2013 Q2 2,222.1 39.4 432.8 115.4 418.7 100.6 110.0 256.5 234.3 434.4 80.1 253.3 Q3 2,230.9 38.1 432.6 115.9 421.7 99.9 109.8 258.3 236.4 437.4 80.7 252.4 Q4 2,242.1 38.5 437.3 116.9 422.4 100.2 109.7 260.1 237.2 439.0 80.7 251.92014 Q1 2,254.7 38.8 436.0 117.2 424.1 100.2 112.9 261.8 238.8 443.3 81.5 254.0 Q2 2,254.8 38.5 436.8 115.4 423.3 99.7 113.2 263.0 240.2 443.2 81.5 258.6
percentage of value added 2013 100.0 1.7 19.4 5.2 18.9 4.5 4.9 11.6 10.6 19.6 3.6 -
Chain-linked volumes (prices for the previous year)
quarter-on-quarter percentage changes
2013 Q2 0.2 0.6 0.7 -0.2 0.4 0.1 -0.9 0.2 0.5 -0.1 0.0 1.3 Q3 0.2 1.0 0.1 0.3 0.3 -0.6 -0.4 0.3 0.3 0.2 0.1 -0.3 Q4 0.3 1.3 0.5 0.4 0.2 0.2 -0.1 0.3 0.0 0.3 -0.3 0.12014 Q1 0.3 1.4 -0.3 0.3 0.7 -0.9 1.3 0.2 0.4 0.3 0.7 0.3 Q2 0.0 -1.1 0.2 -1.6 0.0 -0.1 -0.3 0.3 0.2 0.0 -0.3 1.1
annual percentage changes
2010 2.1 -3.4 8.1 -3.9 1.1 1.6 1.0 0.7 2.1 1.1 0.1 1.72011 1.7 0.8 3.0 -2.8 2.2 5.1 1.2 1.8 2.3 0.7 0.4 0.72012 -0.5 -3.1 -0.6 -4.7 -1.4 2.6 1.1 -0.2 -0.6 0.3 0.4 -2.52013 -0.4 2.3 -0.7 -3.4 -0.8 -0.4 -1.3 0.9 0.1 0.0 -0.7 -1.0
2013 Q2 -0.6 2.1 -0.9 -4.2 -1.0 -0.2 -1.8 0.9 0.4 -0.1 -0.4 -0.7 Q3 -0.3 3.5 -1.0 -2.8 -0.4 -1.1 -1.5 1.0 0.5 0.1 -0.6 -0.4 Q4 0.4 4.5 1.3 -1.1 0.6 -0.4 -1.6 0.8 0.9 0.0 -1.0 0.02014 Q1 1.0 4.4 1.0 0.9 1.6 -1.1 -0.1 1.0 1.2 0.8 0.5 1.4 Q2 0.7 2.6 0.5 -0.6 1.3 -1.3 0.5 1.1 1.0 0.8 0.1 1.2
contributions to quarter-on-quarter percentage changes in value added; percentage points
2013 Q2 0.2 0.0 0.1 0.0 0.1 0.0 0.0 0.0 0.1 0.0 0.0 - Q3 0.2 0.0 0.0 0.0 0.1 0.0 0.0 0.0 0.0 0.0 0.0 - Q4 0.3 0.0 0.1 0.0 0.0 0.0 0.0 0.0 0.0 0.1 0.0 - 2014 Q1 0.3 0.0 -0.1 0.0 0.1 0.0 0.1 0.0 0.0 0.1 0.0 - Q2 0.0 0.0 0.0 -0.1 0.0 0.0 0.0 0.0 0.0 0.0 0.0 -
contributions to annual percentage changes in value added; percentage points
2010 2.1 -0.1 1.5 -0.2 0.2 0.1 0.1 0.1 0.2 0.2 0.0 - 2011 1.7 0.0 0.6 -0.2 0.4 0.2 0.1 0.2 0.2 0.1 0.0 - 2012 -0.5 -0.1 -0.1 -0.3 -0.3 0.1 0.1 0.0 -0.1 0.1 0.0 - 2013 -0.4 0.0 -0.1 -0.2 -0.1 0.0 -0.1 0.1 0.0 0.0 0.0 -
2013 Q2 -0.6 0.0 -0.2 -0.2 -0.2 0.0 -0.1 0.1 0.0 0.0 0.0 - Q3 -0.3 0.1 -0.2 -0.1 -0.1 -0.1 -0.1 0.1 0.1 0.0 0.0 - Q4 0.4 0.1 0.2 -0.1 0.1 0.0 -0.1 0.1 0.1 0.0 0.0 - 2014 Q1 1.0 0.1 0.2 0.0 0.3 -0.1 0.0 0.1 0.1 0.1 0.0 - Q2 0.7 0.0 0.1 0.0 0.2 -0.1 0.0 0.1 0.1 0.2 0.0 -
Sources: Eurostat and ECB calculations.
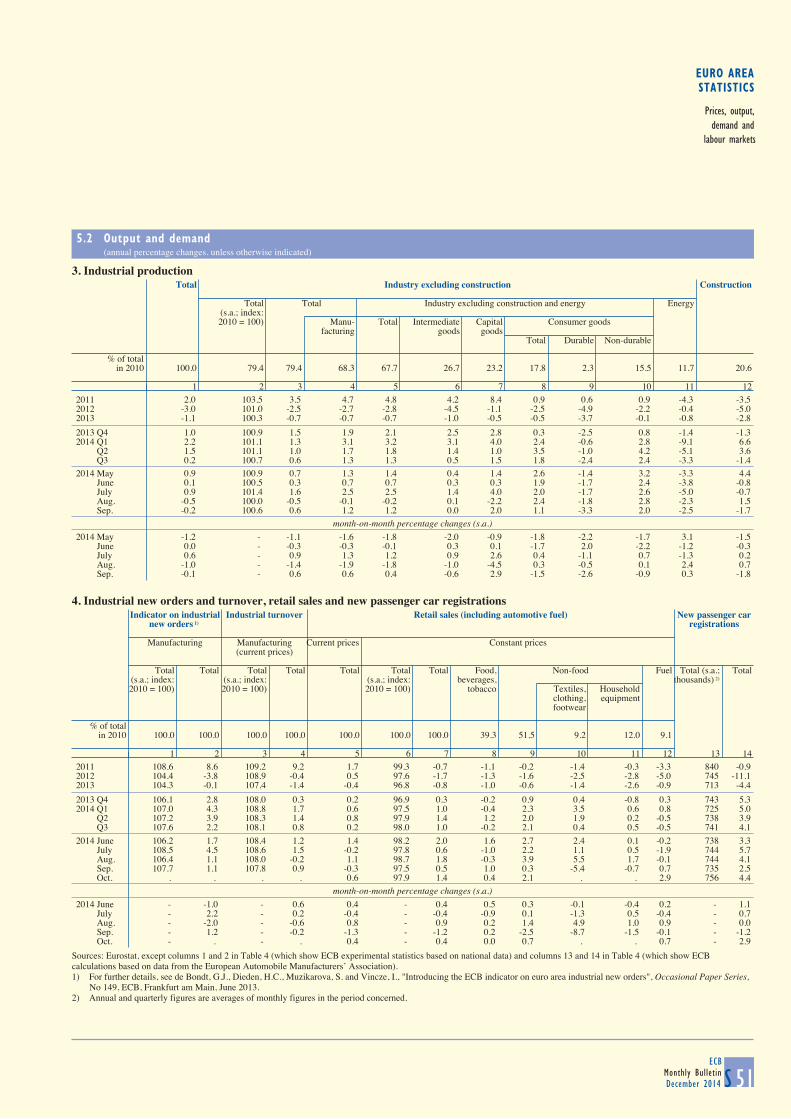
EURO AREASTATISTICS
Prices, output,demand and
labour markets
5.2 Output and demand (annual percentage changes, unless otherwise indicated)
S 51ECB
Monthly BulletinDecember 2014
3. Industrial production
Total Industry excluding construction Construction
Total Total Industry excluding construction and energy Energy
(s.a.; index: 2010 = 100) Manu- Total Intermediate Capital Consumer goods
facturing goods goodsTotal Durable Non-durable
% of totalin 2010 100.0 79.4 79.4 68.3 67.7 26.7 23.2 17.8 2.3 15.5 11.7 20.6
1 2 3 4 5 6 7 8 9 10 11 122011 2.0 103.5 3.5 4.7 4.8 4.2 8.4 0.9 0.6 0.9 -4.3 -3.52012 -3.0 101.0 -2.5 -2.7 -2.8 -4.5 -1.1 -2.5 -4.9 -2.2 -0.4 -5.02013 -1.1 100.3 -0.7 -0.7 -0.7 -1.0 -0.5 -0.5 -3.7 -0.1 -0.8 -2.8
2013 Q4 1.0 100.9 1.5 1.9 2.1 2.5 2.8 0.3 -2.5 0.8 -1.4 -1.32014 Q1 2.2 101.1 1.3 3.1 3.2 3.1 4.0 2.4 -0.6 2.8 -9.1 6.6 Q2 1.5 101.1 1.0 1.7 1.8 1.4 1.0 3.5 -1.0 4.2 -5.1 3.6 Q3 0.2 100.7 0.6 1.3 1.3 0.5 1.5 1.8 -2.4 2.4 -3.3 -1.4
2014 May 0.9 100.9 0.7 1.3 1.4 0.4 1.4 2.6 -1.4 3.2 -3.3 4.4 June 0.1 100.5 0.3 0.7 0.7 0.3 0.3 1.9 -1.7 2.4 -3.8 -0.8 July 0.9 101.4 1.6 2.5 2.5 1.4 4.0 2.0 -1.7 2.6 -5.0 -0.7 Aug. -0.5 100.0 -0.5 -0.1 -0.2 0.1 -2.2 2.4 -1.8 2.8 -2.3 1.5 Sep. -0.2 100.6 0.6 1.2 1.2 0.0 2.0 1.1 -3.3 2.0 -2.5 -1.7
month-on-month percentage changes (s.a.)
2014 May -1.2 - -1.1 -1.6 -1.8 -2.0 -0.9 -1.8 -2.2 -1.7 3.1 -1.5 June 0.0 - -0.3 -0.3 -0.1 0.3 0.1 -1.7 2.0 -2.2 -1.2 -0.3 July 0.6 - 0.9 1.3 1.2 0.9 2.6 0.4 -1.1 0.7 -1.3 0.2 Aug. -1.0 - -1.4 -1.9 -1.8 -1.0 -4.5 0.3 -0.5 0.1 2.4 0.7 Sep. -0.1 - 0.6 0.6 0.4 -0.6 2.9 -1.5 -2.6 -0.9 0.3 -1.8
4. Industrial new orders and turnover, retail sales and new passenger car registrations
Indicator on industrial Industrial turnover Retail sales (including automotive fuel) New passenger car
new orders 1) registrations
Manufacturing Manufacturing Current prices Constant prices (current prices)
Total Total Total Total Total Total Total Food, Non-food Fuel Total (s.a.; Total
(s.a.; index: (s.a.; index: (s.a.; index: beverages, thousands) 2)
2010 = 100) 2010 = 100) 2010 = 100) tobacco Textiles, Householdclothing, equipmentfootwear
% of totalin 2010 100.0 100.0 100.0 100.0 100.0 100.0 100.0 39.3 51.5 9.2 12.0 9.1
1 2 3 4 5 6 7 8 9 10 11 12 13 142011 108.6 8.6 109.2 9.2 1.7 99.3 -0.7 -1.1 -0.2 -1.4 -0.3 -3.3 840 -0.92012 104.4 -3.8 108.9 -0.4 0.5 97.6 -1.7 -1.3 -1.6 -2.5 -2.8 -5.0 745 -11.12013 104.3 -0.1 107.4 -1.4 -0.4 96.8 -0.8 -1.0 -0.6 -1.4 -2.6 -0.9 713 -4.4
2013 Q4 106.1 2.8 108.0 0.3 0.2 96.9 0.3 -0.2 0.9 0.4 -0.8 0.3 743 5.32014 Q1 107.0 4.3 108.8 1.7 0.6 97.5 1.0 -0.4 2.3 3.5 0.6 0.8 725 5.0 Q2 107.2 3.9 108.3 1.4 0.8 97.9 1.4 1.2 2.0 1.9 0.2 -0.5 738 3.9 Q3 107.6 2.2 108.1 0.8 0.2 98.0 1.0 -0.2 2.1 0.4 0.5 -0.5 741 4.1
2014 June 106.2 1.7 108.4 1.2 1.4 98.2 2.0 1.6 2.7 2.4 0.1 -0.2 738 3.3 July 108.5 4.5 108.6 1.5 -0.2 97.8 0.6 -1.0 2.2 1.1 0.5 -1.9 744 5.7 Aug. 106.4 1.1 108.0 -0.2 1.1 98.7 1.8 -0.3 3.9 5.5 1.7 -0.1 744 4.1 Sep. 107.7 1.1 107.8 0.9 -0.3 97.5 0.5 1.0 0.3 -5.4 -0.7 0.7 735 2.5 Oct. . . . . 0.6 97.9 1.4 0.4 2.1 . . 2.9 756 4.4
month-on-month percentage changes (s.a.)
2014 June - -1.0 - 0.6 0.4 - 0.4 0.5 0.3 -0.1 -0.4 0.2 - 1.1 July - 2.2 - 0.2 -0.4 - -0.4 -0.9 0.1 -1.3 0.5 -0.4 - 0.7 Aug. - -2.0 - -0.6 0.8 - 0.9 0.2 1.4 4.9 1.0 0.9 - 0.0 Sep. - 1.2 - -0.2 -1.3 - -1.2 0.2 -2.5 -8.7 -1.5 -0.1 - -1.2 Oct. - . - . 0.4 - 0.4 0.0 0.7 . . 0.7 - 2.9
Sources: Eurostat, except columns 1 and 2 in Table 4 (which show ECB experimental statistics based on national data) and columns 13 and 14 in Table 4 (which show ECBcalculations based on data from the European Automobile Manufacturers’ Association).1) For further details, see de Bondt, G.J., Dieden, H.C., Muzikarova, S. and Vincze, I., "Introducing the ECB indicator on euro area industrial new orders", Occasional Paper Series,
No 149, ECB, Frankfurt am Main, June 2013.2) Annual and quarterly figures are averages of monthly figures in the period concerned.
5.2 Output and demand (quarterly data seasonally adjusted; annual data unadjusted)
S 50ECBMonthly BulletinDecember 2014
2. Value added by economic activity
Current prices (EUR billions)
Gross value added (basic prices) Taxes less
subsidiesTotal Agriculture, Manufactu- Construction Trade, Information Finance Real estate Professional, Public admi- Arts, enter- on
forestry ring, energy transport, and commu- and business and nistration, tainment productsand fishing and utilities accommoda- nication insurance support education, and other
tion and services health and servicesfood services social work
1 2 3 4 5 6 7 8 9 10 11 12
2010 8,560.8 140.8 1,649.6 487.9 1,617.9 395.5 442.7 969.5 884.6 1,667.6 304.7 951.32011 8,781.5 146.7 1,712.6 484.9 1,663.9 406.9 434.6 1,007.6 918.3 1,695.0 310.9 986.72012 8,833.5 150.8 1,719.2 472.2 1,671.8 409.8 439.1 1,013.1 926.8 1,714.0 316.8 990.82013 8,899.1 154.5 1,728.6 462.9 1,678.7 401.0 438.4 1,030.1 939.9 1,744.1 320.7 1,005.3
2013 Q2 2,222.1 39.4 432.8 115.4 418.7 100.6 110.0 256.5 234.3 434.4 80.1 253.3 Q3 2,230.9 38.1 432.6 115.9 421.7 99.9 109.8 258.3 236.4 437.4 80.7 252.4 Q4 2,242.1 38.5 437.3 116.9 422.4 100.2 109.7 260.1 237.2 439.0 80.7 251.92014 Q1 2,254.7 38.8 436.0 117.2 424.1 100.2 112.9 261.8 238.8 443.3 81.5 254.0 Q2 2,254.8 38.5 436.8 115.4 423.3 99.7 113.2 263.0 240.2 443.2 81.5 258.6
percentage of value added 2013 100.0 1.7 19.4 5.2 18.9 4.5 4.9 11.6 10.6 19.6 3.6 -
Chain-linked volumes (prices for the previous year)
quarter-on-quarter percentage changes
2013 Q2 0.2 0.6 0.7 -0.2 0.4 0.1 -0.9 0.2 0.5 -0.1 0.0 1.3 Q3 0.2 1.0 0.1 0.3 0.3 -0.6 -0.4 0.3 0.3 0.2 0.1 -0.3 Q4 0.3 1.3 0.5 0.4 0.2 0.2 -0.1 0.3 0.0 0.3 -0.3 0.12014 Q1 0.3 1.4 -0.3 0.3 0.7 -0.9 1.3 0.2 0.4 0.3 0.7 0.3 Q2 0.0 -1.1 0.2 -1.6 0.0 -0.1 -0.3 0.3 0.2 0.0 -0.3 1.1
annual percentage changes
2010 2.1 -3.4 8.1 -3.9 1.1 1.6 1.0 0.7 2.1 1.1 0.1 1.72011 1.7 0.8 3.0 -2.8 2.2 5.1 1.2 1.8 2.3 0.7 0.4 0.72012 -0.5 -3.1 -0.6 -4.7 -1.4 2.6 1.1 -0.2 -0.6 0.3 0.4 -2.52013 -0.4 2.3 -0.7 -3.4 -0.8 -0.4 -1.3 0.9 0.1 0.0 -0.7 -1.0
2013 Q2 -0.6 2.1 -0.9 -4.2 -1.0 -0.2 -1.8 0.9 0.4 -0.1 -0.4 -0.7 Q3 -0.3 3.5 -1.0 -2.8 -0.4 -1.1 -1.5 1.0 0.5 0.1 -0.6 -0.4 Q4 0.4 4.5 1.3 -1.1 0.6 -0.4 -1.6 0.8 0.9 0.0 -1.0 0.02014 Q1 1.0 4.4 1.0 0.9 1.6 -1.1 -0.1 1.0 1.2 0.8 0.5 1.4 Q2 0.7 2.6 0.5 -0.6 1.3 -1.3 0.5 1.1 1.0 0.8 0.1 1.2
contributions to quarter-on-quarter percentage changes in value added; percentage points
2013 Q2 0.2 0.0 0.1 0.0 0.1 0.0 0.0 0.0 0.1 0.0 0.0 - Q3 0.2 0.0 0.0 0.0 0.1 0.0 0.0 0.0 0.0 0.0 0.0 - Q4 0.3 0.0 0.1 0.0 0.0 0.0 0.0 0.0 0.0 0.1 0.0 - 2014 Q1 0.3 0.0 -0.1 0.0 0.1 0.0 0.1 0.0 0.0 0.1 0.0 - Q2 0.0 0.0 0.0 -0.1 0.0 0.0 0.0 0.0 0.0 0.0 0.0 -
contributions to annual percentage changes in value added; percentage points
2010 2.1 -0.1 1.5 -0.2 0.2 0.1 0.1 0.1 0.2 0.2 0.0 - 2011 1.7 0.0 0.6 -0.2 0.4 0.2 0.1 0.2 0.2 0.1 0.0 - 2012 -0.5 -0.1 -0.1 -0.3 -0.3 0.1 0.1 0.0 -0.1 0.1 0.0 - 2013 -0.4 0.0 -0.1 -0.2 -0.1 0.0 -0.1 0.1 0.0 0.0 0.0 -
2013 Q2 -0.6 0.0 -0.2 -0.2 -0.2 0.0 -0.1 0.1 0.0 0.0 0.0 - Q3 -0.3 0.1 -0.2 -0.1 -0.1 -0.1 -0.1 0.1 0.1 0.0 0.0 - Q4 0.4 0.1 0.2 -0.1 0.1 0.0 -0.1 0.1 0.1 0.0 0.0 - 2014 Q1 1.0 0.1 0.2 0.0 0.3 -0.1 0.0 0.1 0.1 0.1 0.0 - Q2 0.7 0.0 0.1 0.0 0.2 -0.1 0.0 0.1 0.1 0.2 0.0 -
Sources: Eurostat and ECB calculations.
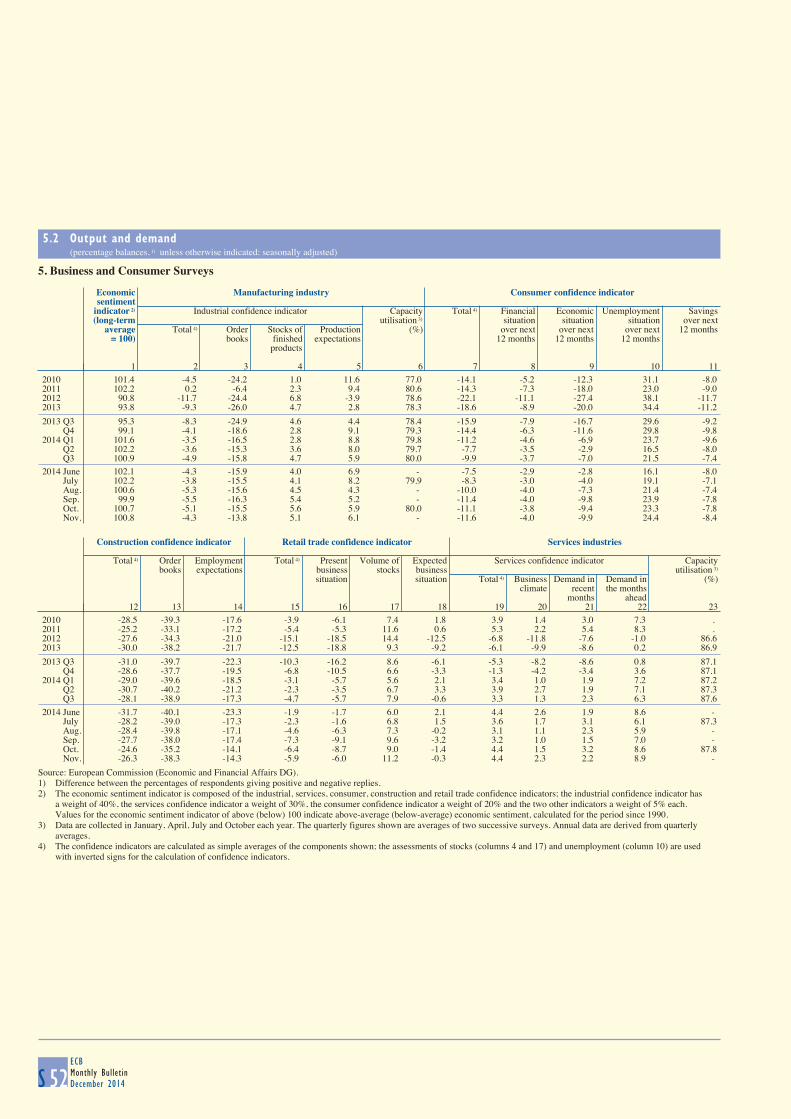
5.2 Output and demand (percentage balances, 1) unless otherwise indicated; seasonally adjusted)
S 52ECBMonthly BulletinDecember 2014
5. Business and Consumer Surveys
Economic Manufacturing industry Consumer confidence indicatorsentiment
indicator 2) Industrial confidence indicator Capacity Total 4) Financial Economic Unemployment Savings(long-term utilisation 3) situation situation situation over next
average Total 4) Order Stocks of Production (%) over next over next over next 12 months= 100) books finished expectations 12 months 12 months 12 months
products
1 2 3 4 5 6 7 8 9 10 112010 101.4 -4.5 -24.2 1.0 11.6 77.0 -14.1 -5.2 -12.3 31.1 -8.02011 102.2 0.2 -6.4 2.3 9.4 80.6 -14.3 -7.3 -18.0 23.0 -9.02012 90.8 -11.7 -24.4 6.8 -3.9 78.6 -22.1 -11.1 -27.4 38.1 -11.72013 93.8 -9.3 -26.0 4.7 2.8 78.3 -18.6 -8.9 -20.0 34.4 -11.2
2013 Q3 95.3 -8.3 -24.9 4.6 4.4 78.4 -15.9 -7.9 -16.7 29.6 -9.2 Q4 99.1 -4.1 -18.6 2.8 9.1 79.3 -14.4 -6.3 -11.6 29.8 -9.82014 Q1 101.6 -3.5 -16.5 2.8 8.8 79.8 -11.2 -4.6 -6.9 23.7 -9.6 Q2 102.2 -3.6 -15.3 3.6 8.0 79.7 -7.7 -3.5 -2.9 16.5 -8.0 Q3 100.9 -4.9 -15.8 4.7 5.9 80.0 -9.9 -3.7 -7.0 21.5 -7.4
2014 June 102.1 -4.3 -15.9 4.0 6.9 - -7.5 -2.9 -2.8 16.1 -8.0 July 102.2 -3.8 -15.5 4.1 8.2 79.9 -8.3 -3.0 -4.0 19.1 -7.1 Aug. 100.6 -5.3 -15.6 4.5 4.3 - -10.0 -4.0 -7.3 21.4 -7.4 Sep. 99.9 -5.5 -16.3 5.4 5.2 - -11.4 -4.0 -9.8 23.9 -7.8 Oct. 100.7 -5.1 -15.5 5.6 5.9 80.0 -11.1 -3.8 -9.4 23.3 -7.8 Nov. 100.8 -4.3 -13.8 5.1 6.1 - -11.6 -4.0 -9.9 24.4 -8.4
Construction confidence indicator Retail trade confidence indicator Services industries
Total 4) Order Employment Total 4) Present Volume of Expected Services confidence indicator Capacity
books expectations business stocks business utilisation 3)
situation situation Total 4) Business Demand in Demand in (%)climate recent the months
months ahead12 13 14 15 16 17 18 19 20 21 22 23
2010 -28.5 -39.3 -17.6 -3.9 -6.1 7.4 1.8 3.9 1.4 3.0 7.3 . 2011 -25.2 -33.1 -17.2 -5.4 -5.3 11.6 0.6 5.3 2.2 5.4 8.3 . 2012 -27.6 -34.3 -21.0 -15.1 -18.5 14.4 -12.5 -6.8 -11.8 -7.6 -1.0 86.62013 -30.0 -38.2 -21.7 -12.5 -18.8 9.3 -9.2 -6.1 -9.9 -8.6 0.2 86.9
2013 Q3 -31.0 -39.7 -22.3 -10.3 -16.2 8.6 -6.1 -5.3 -8.2 -8.6 0.8 87.1 Q4 -28.6 -37.7 -19.5 -6.8 -10.5 6.6 -3.3 -1.3 -4.2 -3.4 3.6 87.12014 Q1 -29.0 -39.6 -18.5 -3.1 -5.7 5.6 2.1 3.4 1.0 1.9 7.2 87.2 Q2 -30.7 -40.2 -21.2 -2.3 -3.5 6.7 3.3 3.9 2.7 1.9 7.1 87.3 Q3 -28.1 -38.9 -17.3 -4.7 -5.7 7.9 -0.6 3.3 1.3 2.3 6.3 87.6
2014 June -31.7 -40.1 -23.3 -1.9 -1.7 6.0 2.1 4.4 2.6 1.9 8.6 - July -28.2 -39.0 -17.3 -2.3 -1.6 6.8 1.5 3.6 1.7 3.1 6.1 87.3 Aug. -28.4 -39.8 -17.1 -4.6 -6.3 7.3 -0.2 3.1 1.1 2.3 5.9 - Sep. -27.7 -38.0 -17.4 -7.3 -9.1 9.6 -3.2 3.2 1.0 1.5 7.0 - Oct. -24.6 -35.2 -14.1 -6.4 -8.7 9.0 -1.4 4.4 1.5 3.2 8.6 87.8 Nov. -26.3 -38.3 -14.3 -5.9 -6.0 11.2 -0.3 4.4 2.3 2.2 8.9 -
Source: European Commission (Economic and Financial Affairs DG).1) Difference between the percentages of respondents giving positive and negative replies.2) The economic sentiment indicator is composed of the industrial, services, consumer, construction and retail trade confidence indicators; the industrial confidence indicator has
a weight of 40%, the services confidence indicator a weight of 30%, the consumer confidence indicator a weight of 20% and the two other indicators a weight of 5% each.Values for the economic sentiment indicator of above (below) 100 indicate above-average (below-average) economic sentiment, calculated for the period since 1990.
3) Data are collected in January, April, July and October each year. The quarterly figures shown are averages of two successive surveys. Annual data are derived from quarterly averages.
4) The confidence indicators are calculated as simple averages of the components shown; the assessments of stocks (columns 4 and 17) and unemployment (column 10) are used with inverted signs for the calculation of confidence indicators.
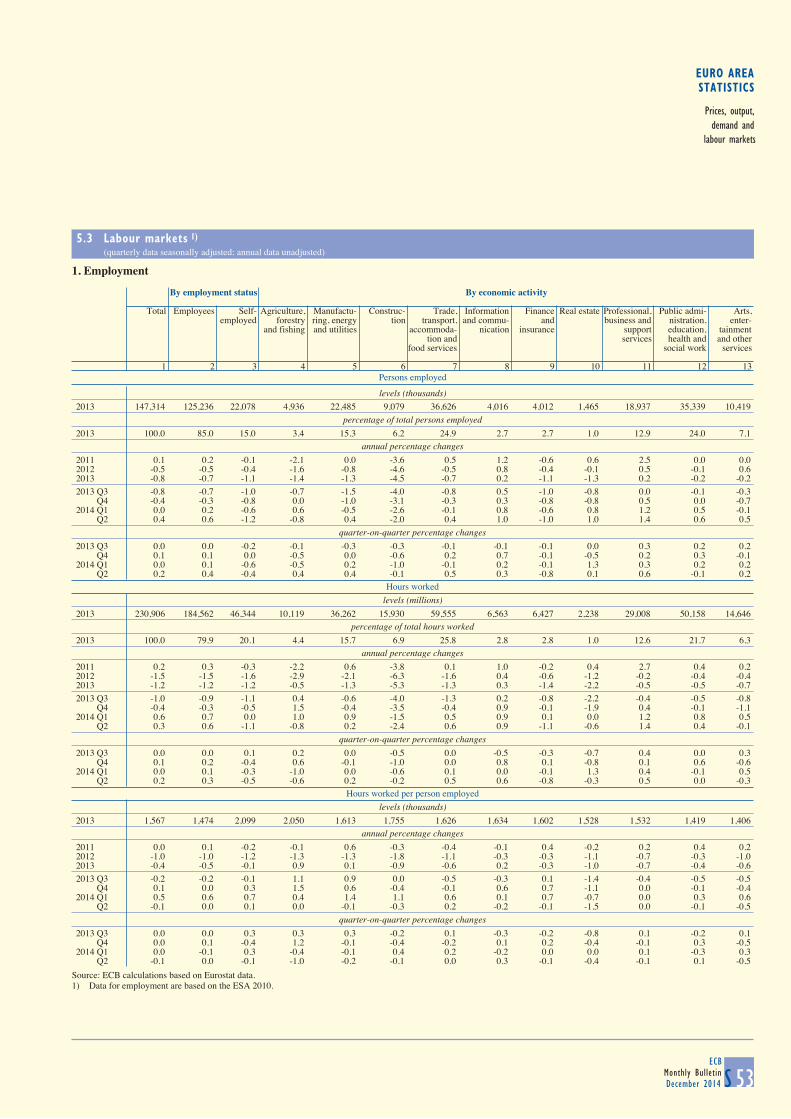
EURO AREASTATISTICS
Prices, output,demand and
labour markets
5.3 Labour markets 1)
(quarterly data seasonally adjusted; annual data unadjusted)
S 53ECB
Monthly BulletinDecember 2014
1. Employment
Persons employed
By employment status By economic activity
Total Employees Self- Agriculture, Manufactu- Construc- Trade, Information Finance Real estate Professional, Public admi- Arts,employed forestry ring, energy tion transport, and commu- and business and nistration, enter-
and fishing and utilities accommoda- nication insurance support education, tainmenttion and services health and and other
food services social work services
1 2 3 4 5 6 7 8 9 10 11 12 13
levels (thousands) 2013 147,314 125,236 22,078 4,936 22,485 9,079 36,626 4,016 4,012 1,465 18,937 35,339 10,419
percentage of total persons employed 2013 100.0 85.0 15.0 3.4 15.3 6.2 24.9 2.7 2.7 1.0 12.9 24.0 7.1
annual percentage changes
2011 0.1 0.2 -0.1 -2.1 0.0 -3.6 0.5 1.2 -0.6 0.6 2.5 0.0 0.02012 -0.5 -0.5 -0.4 -1.6 -0.8 -4.6 -0.5 0.8 -0.4 -0.1 0.5 -0.1 0.62013 -0.8 -0.7 -1.1 -1.4 -1.3 -4.5 -0.7 0.2 -1.1 -1.3 0.2 -0.2 -0.2
2013 Q3 -0.8 -0.7 -1.0 -0.7 -1.5 -4.0 -0.8 0.5 -1.0 -0.8 0.0 -0.1 -0.3 Q4 -0.4 -0.3 -0.8 0.0 -1.0 -3.1 -0.3 0.3 -0.8 -0.8 0.5 0.0 -0.72014 Q1 0.0 0.2 -0.6 0.6 -0.5 -2.6 -0.1 0.8 -0.6 0.8 1.2 0.5 -0.1 Q2 0.4 0.6 -1.2 -0.8 0.4 -2.0 0.4 1.0 -1.0 1.0 1.4 0.6 0.5
quarter-on-quarter percentage changes
2013 Q3 0.0 0.0 -0.2 -0.1 -0.3 -0.3 -0.1 -0.1 -0.1 0.0 0.3 0.2 0.2 Q4 0.1 0.1 0.0 -0.5 0.0 -0.6 0.2 0.7 -0.1 -0.5 0.2 0.3 -0.12014 Q1 0.0 0.1 -0.6 -0.5 0.2 -1.0 -0.1 0.2 -0.1 1.3 0.3 0.2 0.2 Q2 0.2 0.4 -0.4 0.4 0.4 -0.1 0.5 0.3 -0.8 0.1 0.6 -0.1 0.2
Hours worked
levels (millions) 2013 230,906 184,562 46,344 10,119 36,262 15,930 59,555 6,563 6,427 2,238 29,008 50,158 14,646
percentage of total hours worked 2013 100.0 79.9 20.1 4.4 15.7 6.9 25.8 2.8 2.8 1.0 12.6 21.7 6.3
annual percentage changes
2011 0.2 0.3 -0.3 -2.2 0.6 -3.8 0.1 1.0 -0.2 0.4 2.7 0.4 0.22012 -1.5 -1.5 -1.6 -2.9 -2.1 -6.3 -1.6 0.4 -0.6 -1.2 -0.2 -0.4 -0.42013 -1.2 -1.2 -1.2 -0.5 -1.3 -5.3 -1.3 0.3 -1.4 -2.2 -0.5 -0.5 -0.7
2013 Q3 -1.0 -0.9 -1.1 0.4 -0.6 -4.0 -1.3 0.2 -0.8 -2.2 -0.4 -0.5 -0.8 Q4 -0.4 -0.3 -0.5 1.5 -0.4 -3.5 -0.4 0.9 -0.1 -1.9 0.4 -0.1 -1.12014 Q1 0.6 0.7 0.0 1.0 0.9 -1.5 0.5 0.9 0.1 0.0 1.2 0.8 0.5 Q2 0.3 0.6 -1.1 -0.8 0.2 -2.4 0.6 0.9 -1.1 -0.6 1.4 0.4 -0.1
quarter-on-quarter percentage changes
2013 Q3 0.0 0.0 0.1 0.2 0.0 -0.5 0.0 -0.5 -0.3 -0.7 0.4 0.0 0.3 Q4 0.1 0.2 -0.4 0.6 -0.1 -1.0 0.0 0.8 0.1 -0.8 0.1 0.6 -0.62014 Q1 0.0 0.1 -0.3 -1.0 0.0 -0.6 0.1 0.0 -0.1 1.3 0.4 -0.1 0.5 Q2 0.2 0.3 -0.5 -0.6 0.2 -0.2 0.5 0.6 -0.8 -0.3 0.5 0.0 -0.3
Hours worked per person employed
levels (thousands) 2013 1,567 1,474 2,099 2,050 1,613 1,755 1,626 1,634 1,602 1,528 1,532 1,419 1,406
annual percentage changes
2011 0.0 0.1 -0.2 -0.1 0.6 -0.3 -0.4 -0.1 0.4 -0.2 0.2 0.4 0.22012 -1.0 -1.0 -1.2 -1.3 -1.3 -1.8 -1.1 -0.3 -0.3 -1.1 -0.7 -0.3 -1.02013 -0.4 -0.5 -0.1 0.9 0.1 -0.9 -0.6 0.2 -0.3 -1.0 -0.7 -0.4 -0.6
2013 Q3 -0.2 -0.2 -0.1 1.1 0.9 0.0 -0.5 -0.3 0.1 -1.4 -0.4 -0.5 -0.5 Q4 0.1 0.0 0.3 1.5 0.6 -0.4 -0.1 0.6 0.7 -1.1 0.0 -0.1 -0.42014 Q1 0.5 0.6 0.7 0.4 1.4 1.1 0.6 0.1 0.7 -0.7 0.0 0.3 0.6 Q2 -0.1 0.0 0.1 0.0 -0.1 -0.3 0.2 -0.2 -0.1 -1.5 0.0 -0.1 -0.5
quarter-on-quarter percentage changes
2013 Q3 0.0 0.0 0.3 0.3 0.3 -0.2 0.1 -0.3 -0.2 -0.8 0.1 -0.2 0.1 Q4 0.0 0.1 -0.4 1.2 -0.1 -0.4 -0.2 0.1 0.2 -0.4 -0.1 0.3 -0.52014 Q1 0.0 -0.1 0.3 -0.4 -0.1 0.4 0.2 -0.2 0.0 0.0 0.1 -0.3 0.3 Q2 -0.1 0.0 -0.1 -1.0 -0.2 -0.1 0.0 0.3 -0.1 -0.4 -0.1 0.1 -0.5
Source: ECB calculations based on Eurostat data.1) Data for employment are based on the ESA 2010.
5.2 Output and demand (percentage balances, 1) unless otherwise indicated; seasonally adjusted)
S 52ECBMonthly BulletinDecember 2014
5. Business and Consumer Surveys
Economic Manufacturing industry Consumer confidence indicatorsentiment
indicator 2) Industrial confidence indicator Capacity Total 4) Financial Economic Unemployment Savings(long-term utilisation 3) situation situation situation over next
average Total 4) Order Stocks of Production (%) over next over next over next 12 months= 100) books finished expectations 12 months 12 months 12 months
products
1 2 3 4 5 6 7 8 9 10 112010 101.4 -4.5 -24.2 1.0 11.6 77.0 -14.1 -5.2 -12.3 31.1 -8.02011 102.2 0.2 -6.4 2.3 9.4 80.6 -14.3 -7.3 -18.0 23.0 -9.02012 90.8 -11.7 -24.4 6.8 -3.9 78.6 -22.1 -11.1 -27.4 38.1 -11.72013 93.8 -9.3 -26.0 4.7 2.8 78.3 -18.6 -8.9 -20.0 34.4 -11.2
2013 Q3 95.3 -8.3 -24.9 4.6 4.4 78.4 -15.9 -7.9 -16.7 29.6 -9.2 Q4 99.1 -4.1 -18.6 2.8 9.1 79.3 -14.4 -6.3 -11.6 29.8 -9.82014 Q1 101.6 -3.5 -16.5 2.8 8.8 79.8 -11.2 -4.6 -6.9 23.7 -9.6 Q2 102.2 -3.6 -15.3 3.6 8.0 79.7 -7.7 -3.5 -2.9 16.5 -8.0 Q3 100.9 -4.9 -15.8 4.7 5.9 80.0 -9.9 -3.7 -7.0 21.5 -7.4
2014 June 102.1 -4.3 -15.9 4.0 6.9 - -7.5 -2.9 -2.8 16.1 -8.0 July 102.2 -3.8 -15.5 4.1 8.2 79.9 -8.3 -3.0 -4.0 19.1 -7.1 Aug. 100.6 -5.3 -15.6 4.5 4.3 - -10.0 -4.0 -7.3 21.4 -7.4 Sep. 99.9 -5.5 -16.3 5.4 5.2 - -11.4 -4.0 -9.8 23.9 -7.8 Oct. 100.7 -5.1 -15.5 5.6 5.9 80.0 -11.1 -3.8 -9.4 23.3 -7.8 Nov. 100.8 -4.3 -13.8 5.1 6.1 - -11.6 -4.0 -9.9 24.4 -8.4
Construction confidence indicator Retail trade confidence indicator Services industries
Total 4) Order Employment Total 4) Present Volume of Expected Services confidence indicator Capacity
books expectations business stocks business utilisation 3)
situation situation Total 4) Business Demand in Demand in (%)climate recent the months
months ahead12 13 14 15 16 17 18 19 20 21 22 23
2010 -28.5 -39.3 -17.6 -3.9 -6.1 7.4 1.8 3.9 1.4 3.0 7.3 . 2011 -25.2 -33.1 -17.2 -5.4 -5.3 11.6 0.6 5.3 2.2 5.4 8.3 . 2012 -27.6 -34.3 -21.0 -15.1 -18.5 14.4 -12.5 -6.8 -11.8 -7.6 -1.0 86.62013 -30.0 -38.2 -21.7 -12.5 -18.8 9.3 -9.2 -6.1 -9.9 -8.6 0.2 86.9
2013 Q3 -31.0 -39.7 -22.3 -10.3 -16.2 8.6 -6.1 -5.3 -8.2 -8.6 0.8 87.1 Q4 -28.6 -37.7 -19.5 -6.8 -10.5 6.6 -3.3 -1.3 -4.2 -3.4 3.6 87.12014 Q1 -29.0 -39.6 -18.5 -3.1 -5.7 5.6 2.1 3.4 1.0 1.9 7.2 87.2 Q2 -30.7 -40.2 -21.2 -2.3 -3.5 6.7 3.3 3.9 2.7 1.9 7.1 87.3 Q3 -28.1 -38.9 -17.3 -4.7 -5.7 7.9 -0.6 3.3 1.3 2.3 6.3 87.6
2014 June -31.7 -40.1 -23.3 -1.9 -1.7 6.0 2.1 4.4 2.6 1.9 8.6 - July -28.2 -39.0 -17.3 -2.3 -1.6 6.8 1.5 3.6 1.7 3.1 6.1 87.3 Aug. -28.4 -39.8 -17.1 -4.6 -6.3 7.3 -0.2 3.1 1.1 2.3 5.9 - Sep. -27.7 -38.0 -17.4 -7.3 -9.1 9.6 -3.2 3.2 1.0 1.5 7.0 - Oct. -24.6 -35.2 -14.1 -6.4 -8.7 9.0 -1.4 4.4 1.5 3.2 8.6 87.8 Nov. -26.3 -38.3 -14.3 -5.9 -6.0 11.2 -0.3 4.4 2.3 2.2 8.9 -
Source: European Commission (Economic and Financial Affairs DG).1) Difference between the percentages of respondents giving positive and negative replies.2) The economic sentiment indicator is composed of the industrial, services, consumer, construction and retail trade confidence indicators; the industrial confidence indicator has
a weight of 40%, the services confidence indicator a weight of 30%, the consumer confidence indicator a weight of 20% and the two other indicators a weight of 5% each.Values for the economic sentiment indicator of above (below) 100 indicate above-average (below-average) economic sentiment, calculated for the period since 1990.
3) Data are collected in January, April, July and October each year. The quarterly figures shown are averages of two successive surveys. Annual data are derived from quarterly averages.
4) The confidence indicators are calculated as simple averages of the components shown; the assessments of stocks (columns 4 and 17) and unemployment (column 10) are used with inverted signs for the calculation of confidence indicators.
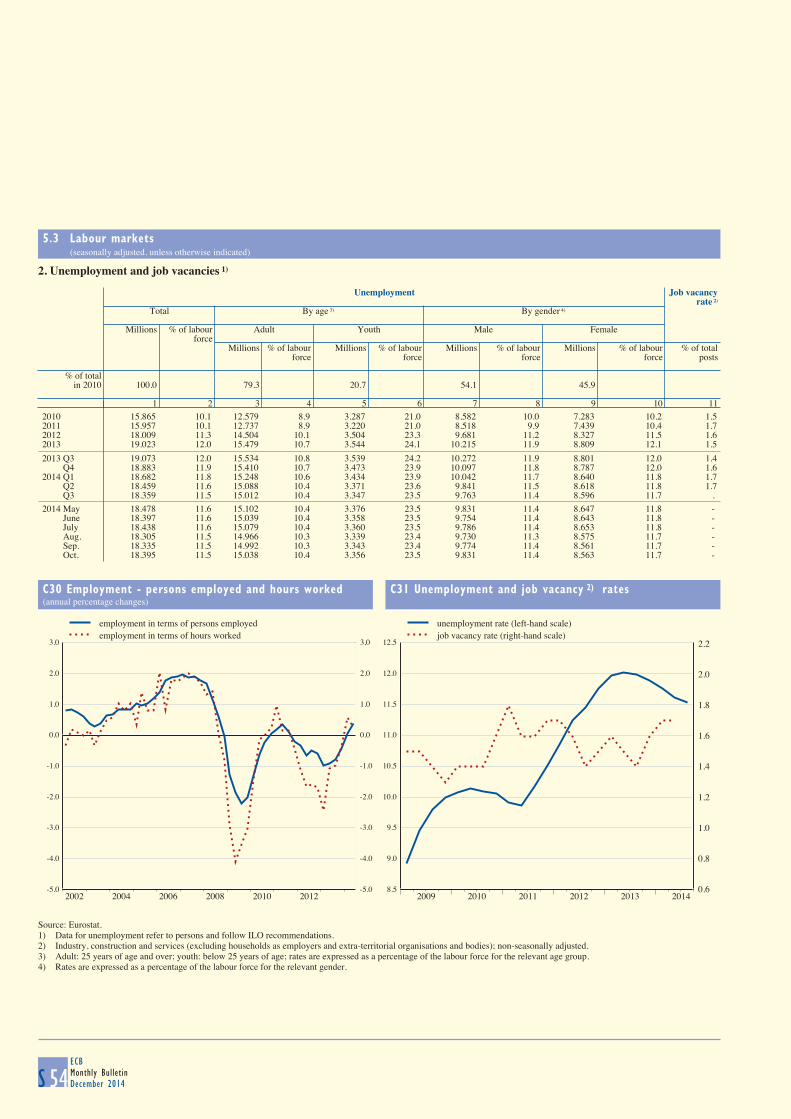
5.3 Labour markets (seasonally adjusted, unless otherwise indicated)
S 54ECBMonthly BulletinDecember 2014
2. Unemployment and job vacancies 1)
Unemployment Job vacancy
rate 2)
Total By age 3) By gender 4)
Millions % of labour Adult Youth Male Femaleforce
Millions % of labour Millions % of labour Millions % of labour Millions % of labour % of totalforce force force force posts
% of totalin 2010 100.0 79.3 20.7 54.1 45.9
1 2 3 4 5 6 7 8 9 10 112010 15.865 10.1 12.579 8.9 3.287 21.0 8.582 10.0 7.283 10.2 1.52011 15.957 10.1 12.737 8.9 3.220 21.0 8.518 9.9 7.439 10.4 1.72012 18.009 11.3 14.504 10.1 3.504 23.3 9.681 11.2 8.327 11.5 1.62013 19.023 12.0 15.479 10.7 3.544 24.1 10.215 11.9 8.809 12.1 1.5
2013 Q3 19.073 12.0 15.534 10.8 3.539 24.2 10.272 11.9 8.801 12.0 1.4 Q4 18.883 11.9 15.410 10.7 3.473 23.9 10.097 11.8 8.787 12.0 1.62014 Q1 18.682 11.8 15.248 10.6 3.434 23.9 10.042 11.7 8.640 11.8 1.7 Q2 18.459 11.6 15.088 10.4 3.371 23.6 9.841 11.5 8.618 11.8 1.7 Q3 18.359 11.5 15.012 10.4 3.347 23.5 9.763 11.4 8.596 11.7 .
2014 May 18.478 11.6 15.102 10.4 3.376 23.5 9.831 11.4 8.647 11.8 - June 18.397 11.6 15.039 10.4 3.358 23.5 9.754 11.4 8.643 11.8 - July 18.438 11.6 15.079 10.4 3.360 23.5 9.786 11.4 8.653 11.8 - Aug. 18.305 11.5 14.966 10.3 3.339 23.4 9.730 11.3 8.575 11.7 - Sep. 18.335 11.5 14.992 10.3 3.343 23.4 9.774 11.4 8.561 11.7 - Oct. 18.395 11.5 15.038 10.4 3.356 23.5 9.831 11.4 8.563 11.7 -
C30 Employment - persons employed and hours worked
(annual percentage changes)
C31 Unemployment and job vacancy 2) rates
-5.0
-4.0
-3.0
-2.0
-1.0
0.0
1.0
2.0
3.0
2002 2004 2006 2008 2010 2012-5.0
-4.0
-3.0
-2.0
-1.0
0.0
1.0
2.0
3.0
employment in terms of persons employedemployment in terms of hours worked
8.5
9.0
9.5
10.0
10.5
11.0
11.5
12.0
12.5
2009 2010 2011 2012 2013 20140.6
0.8
1.0
1.2
1.4
1.6
1.8
2.0
2.2
unemployment rate (left-hand scale)job vacancy rate (right-hand scale)
Source: Eurostat.1) Data for unemployment refer to persons and follow ILO recommendations.2) Industry, construction and services (excluding households as employers and extra-territorial organisations and bodies); non-seasonally adjusted.3) Adult: 25 years of age and over; youth: below 25 years of age; rates are expressed as a percentage of the labour force for the relevant age group.4) Rates are expressed as a percentage of the labour force for the relevant gender.
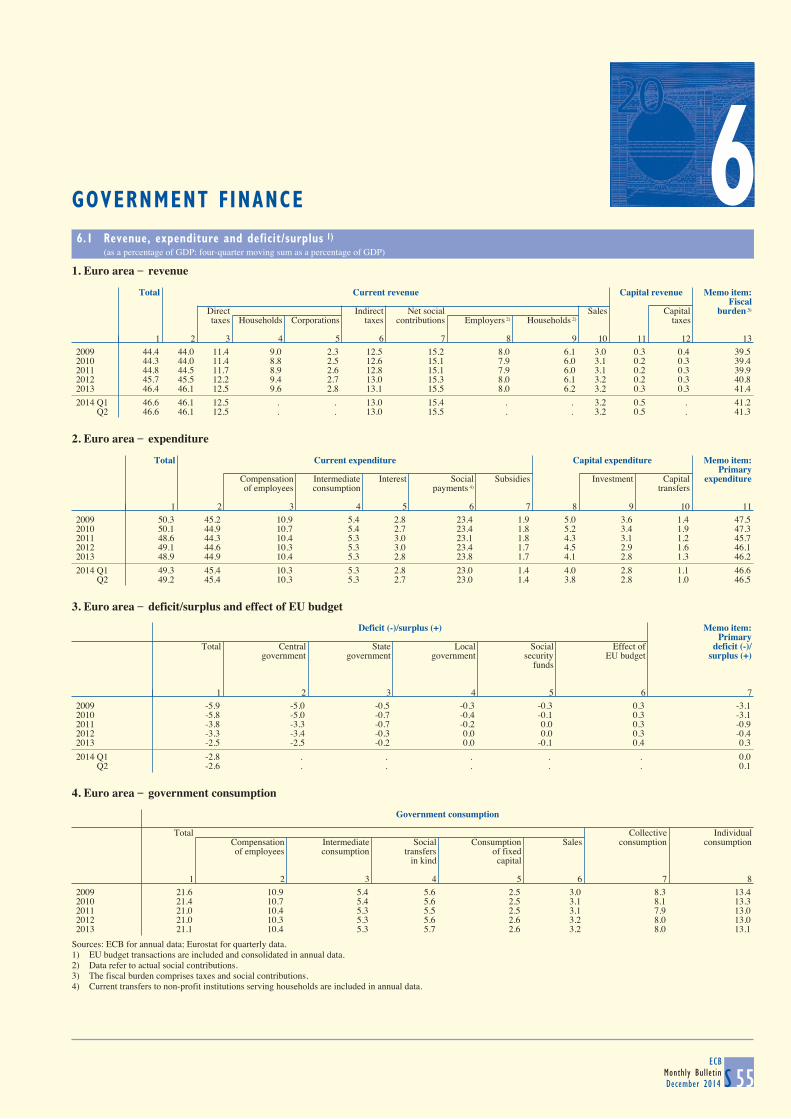
6GOVERNMENT FINANCE
6.1 Revenue, expenditure and deficit/surplus 1) (as a percentage of GDP; four-quarter moving sum as a percentage of GDP)
S 55ECB
Monthly BulletinDecember 2014
1. Euro area _ revenue
Total Current revenue Capital revenue Memo item:
FiscalDirect Indirect Net social Sales Capital burden 3)
taxes Households Corporations taxes contributions Employers 2) Households 2) taxes
1 2 3 4 5 6 7 8 9 10 11 12 132009 44.4 44.0 11.4 9.0 2.3 12.5 15.2 8.0 6.1 3.0 0.3 0.4 39.52010 44.3 44.0 11.4 8.8 2.5 12.6 15.1 7.9 6.0 3.1 0.2 0.3 39.42011 44.8 44.5 11.7 8.9 2.6 12.8 15.1 7.9 6.0 3.1 0.2 0.3 39.92012 45.7 45.5 12.2 9.4 2.7 13.0 15.3 8.0 6.1 3.2 0.2 0.3 40.82013 46.4 46.1 12.5 9.6 2.8 13.1 15.5 8.0 6.2 3.2 0.3 0.3 41.4
2014 Q1 46.6 46.1 12.5 . . 13.0 15.4 . . 3.2 0.5 . 41.2 Q2 46.6 46.1 12.5 . . 13.0 15.5 . . 3.2 0.5 . 41.3
2. Euro area _ expenditure
Total Current expenditure Capital expenditure Memo item:
PrimaryCompensation Intermediate Interest Social Subsidies Investment Capital expenditureof employees consumption payments 4) transfers
1 2 3 4 5 6 7 8 9 10 112009 50.3 45.2 10.9 5.4 2.8 23.4 1.9 5.0 3.6 1.4 47.52010 50.1 44.9 10.7 5.4 2.7 23.4 1.8 5.2 3.4 1.9 47.32011 48.6 44.3 10.4 5.3 3.0 23.1 1.8 4.3 3.1 1.2 45.72012 49.1 44.6 10.3 5.3 3.0 23.4 1.7 4.5 2.9 1.6 46.12013 48.9 44.9 10.4 5.3 2.8 23.8 1.7 4.1 2.8 1.3 46.2
2014 Q1 49.3 45.4 10.3 5.3 2.8 23.0 1.4 4.0 2.8 1.1 46.6 Q2 49.2 45.4 10.3 5.3 2.7 23.0 1.4 3.8 2.8 1.0 46.5
3. Euro area _ deficit/surplus and effect of EU budget
Deficit (-)/surplus (+) Memo item:
PrimaryTotal Central State Local Social Effect of deficit (-)/
government government government security EU budget surplus (+)funds
1 2 3 4 5 6 72009 -5.9 -5.0 -0.5 -0.3 -0.3 0.3 -3.12010 -5.8 -5.0 -0.7 -0.4 -0.1 0.3 -3.12011 -3.8 -3.3 -0.7 -0.2 0.0 0.3 -0.92012 -3.3 -3.4 -0.3 0.0 0.0 0.3 -0.42013 -2.5 -2.5 -0.2 0.0 -0.1 0.4 0.3
2014 Q1 -2.8 . . . . . 0.0 Q2 -2.6 . . . . . 0.1
4. Euro area _ government consumption
Government consumption
Total Collective Individual
Compensation Intermediate Social Consumption Sales consumption consumptionof employees consumption transfers of fixed
in kind capital
1 2 3 4 5 6 7 82009 21.6 10.9 5.4 5.6 2.5 3.0 8.3 13.42010 21.4 10.7 5.4 5.6 2.5 3.1 8.1 13.32011 21.0 10.4 5.3 5.5 2.5 3.1 7.9 13.02012 21.0 10.3 5.3 5.6 2.6 3.2 8.0 13.02013 21.1 10.4 5.3 5.7 2.6 3.2 8.0 13.1
Sources: ECB for annual data; Eurostat for quarterly data.1) EU budget transactions are included and consolidated in annual data.2) Data refer to actual social contributions.3) The fiscal burden comprises taxes and social contributions.4) Current transfers to non-profit institutions serving households are included in annual data.
5.3 Labour markets (seasonally adjusted, unless otherwise indicated)
S 54ECBMonthly BulletinDecember 2014
2. Unemployment and job vacancies 1)
Unemployment Job vacancy
rate 2)
Total By age 3) By gender 4)
Millions % of labour Adult Youth Male Femaleforce
Millions % of labour Millions % of labour Millions % of labour Millions % of labour % of totalforce force force force posts
% of totalin 2010 100.0 79.3 20.7 54.1 45.9
1 2 3 4 5 6 7 8 9 10 112010 15.865 10.1 12.579 8.9 3.287 21.0 8.582 10.0 7.283 10.2 1.52011 15.957 10.1 12.737 8.9 3.220 21.0 8.518 9.9 7.439 10.4 1.72012 18.009 11.3 14.504 10.1 3.504 23.3 9.681 11.2 8.327 11.5 1.62013 19.023 12.0 15.479 10.7 3.544 24.1 10.215 11.9 8.809 12.1 1.5
2013 Q3 19.073 12.0 15.534 10.8 3.539 24.2 10.272 11.9 8.801 12.0 1.4 Q4 18.883 11.9 15.410 10.7 3.473 23.9 10.097 11.8 8.787 12.0 1.62014 Q1 18.682 11.8 15.248 10.6 3.434 23.9 10.042 11.7 8.640 11.8 1.7 Q2 18.459 11.6 15.088 10.4 3.371 23.6 9.841 11.5 8.618 11.8 1.7 Q3 18.359 11.5 15.012 10.4 3.347 23.5 9.763 11.4 8.596 11.7 .
2014 May 18.478 11.6 15.102 10.4 3.376 23.5 9.831 11.4 8.647 11.8 - June 18.397 11.6 15.039 10.4 3.358 23.5 9.754 11.4 8.643 11.8 - July 18.438 11.6 15.079 10.4 3.360 23.5 9.786 11.4 8.653 11.8 - Aug. 18.305 11.5 14.966 10.3 3.339 23.4 9.730 11.3 8.575 11.7 - Sep. 18.335 11.5 14.992 10.3 3.343 23.4 9.774 11.4 8.561 11.7 - Oct. 18.395 11.5 15.038 10.4 3.356 23.5 9.831 11.4 8.563 11.7 -
C30 Employment - persons employed and hours worked
(annual percentage changes)
C31 Unemployment and job vacancy 2) rates
-5.0
-4.0
-3.0
-2.0
-1.0
0.0
1.0
2.0
3.0
2002 2004 2006 2008 2010 2012-5.0
-4.0
-3.0
-2.0
-1.0
0.0
1.0
2.0
3.0
employment in terms of persons employedemployment in terms of hours worked
8.5
9.0
9.5
10.0
10.5
11.0
11.5
12.0
12.5
2009 2010 2011 2012 2013 20140.6
0.8
1.0
1.2
1.4
1.6
1.8
2.0
2.2
unemployment rate (left-hand scale)job vacancy rate (right-hand scale)
Source: Eurostat.1) Data for unemployment refer to persons and follow ILO recommendations.2) Industry, construction and services (excluding households as employers and extra-territorial organisations and bodies); non-seasonally adjusted.3) Adult: 25 years of age and over; youth: below 25 years of age; rates are expressed as a percentage of the labour force for the relevant age group.4) Rates are expressed as a percentage of the labour force for the relevant gender.
6
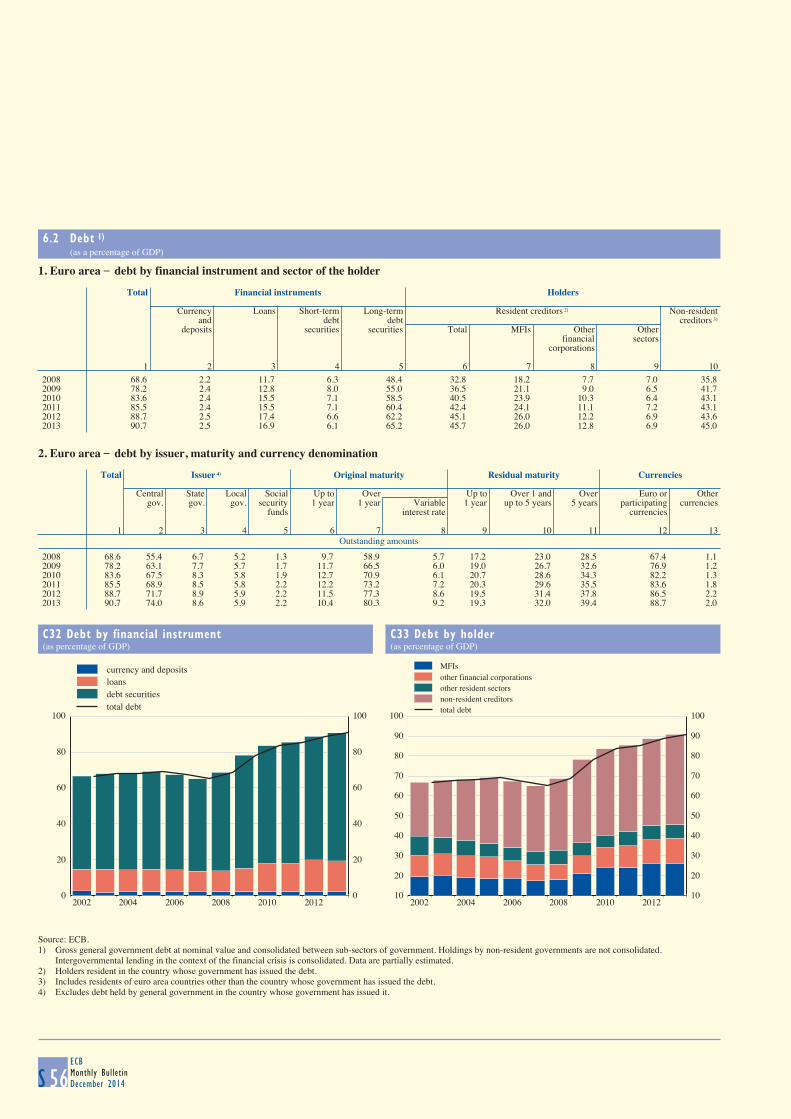
6.2 Debt 1) (as a percentage of GDP)
S 56ECBMonthly BulletinDecember 2014
1. Euro area _ debt by financial instrument and sector of the holder
Total Financial instruments Holders
Currency Loans Short-term Long-term Resident creditors 2) Non-resident
and debt debt creditors 3)
deposits securities securities Total MFIs Other Otherfinancial sectors
corporations
1 2 3 4 5 6 7 8 9 102008 68.6 2.2 11.7 6.3 48.4 32.8 18.2 7.7 7.0 35.82009 78.2 2.4 12.8 8.0 55.0 36.5 21.1 9.0 6.5 41.72010 83.6 2.4 15.5 7.1 58.5 40.5 23.9 10.3 6.4 43.12011 85.5 2.4 15.5 7.1 60.4 42.4 24.1 11.1 7.2 43.12012 88.7 2.5 17.4 6.6 62.2 45.1 26.0 12.2 6.9 43.62013 90.7 2.5 16.9 6.1 65.2 45.7 26.0 12.8 6.9 45.0
2. Euro area _ debt by issuer, maturity and currency denomination
Outstanding amounts
Total Issuer 4) Original maturity Residual maturity Currencies
Central State Local Social Up to Over Up to Over 1 and Over Euro or Other
gov. gov. gov. security 1 year 1 year Variable 1 year up to 5 years 5 years participating currenciesfunds interest rate currencies
1 2 3 4 5 6 7 8 9 10 11 12 13
2008 68.6 55.4 6.7 5.2 1.3 9.7 58.9 5.7 17.2 23.0 28.5 67.4 1.12009 78.2 63.1 7.7 5.7 1.7 11.7 66.5 6.0 19.0 26.7 32.6 76.9 1.22010 83.6 67.5 8.3 5.8 1.9 12.7 70.9 6.1 20.7 28.6 34.3 82.2 1.32011 85.5 68.9 8.5 5.8 2.2 12.2 73.2 7.2 20.3 29.6 35.5 83.6 1.82012 88.7 71.7 8.9 5.9 2.2 11.5 77.3 8.6 19.5 31.4 37.8 86.5 2.22013 90.7 74.0 8.6 5.9 2.2 10.4 80.3 9.2 19.3 32.0 39.4 88.7 2.0
C32 Debt by financial instrument
(as percentage of GDP)
C33 Debt by holder
(as percentage of GDP)
0
20
40
60
80
100
2002 2004 2006 2008 2010 20120
20
40
60
80
100
currency and depositsloansdebt securitiestotal debt
10
20
30
40
50
60
70
80
90
100
2002 2004 2006 2008 2010 201210
20
30
40
50
60
70
80
90
100
MFIsother financial corporationsother resident sectorsnon-resident creditorstotal debt
Source: ECB.1) Gross general government debt at nominal value and consolidated between sub-sectors of government. Holdings by non-resident governments are not consolidated.
Intergovernmental lending in the context of the financial crisis is consolidated. Data are partially estimated.2) Holders resident in the country whose government has issued the debt. 3) Includes residents of euro area countries other than the country whose government has issued the debt. 4) Excludes debt held by general government in the country whose government has issued it.
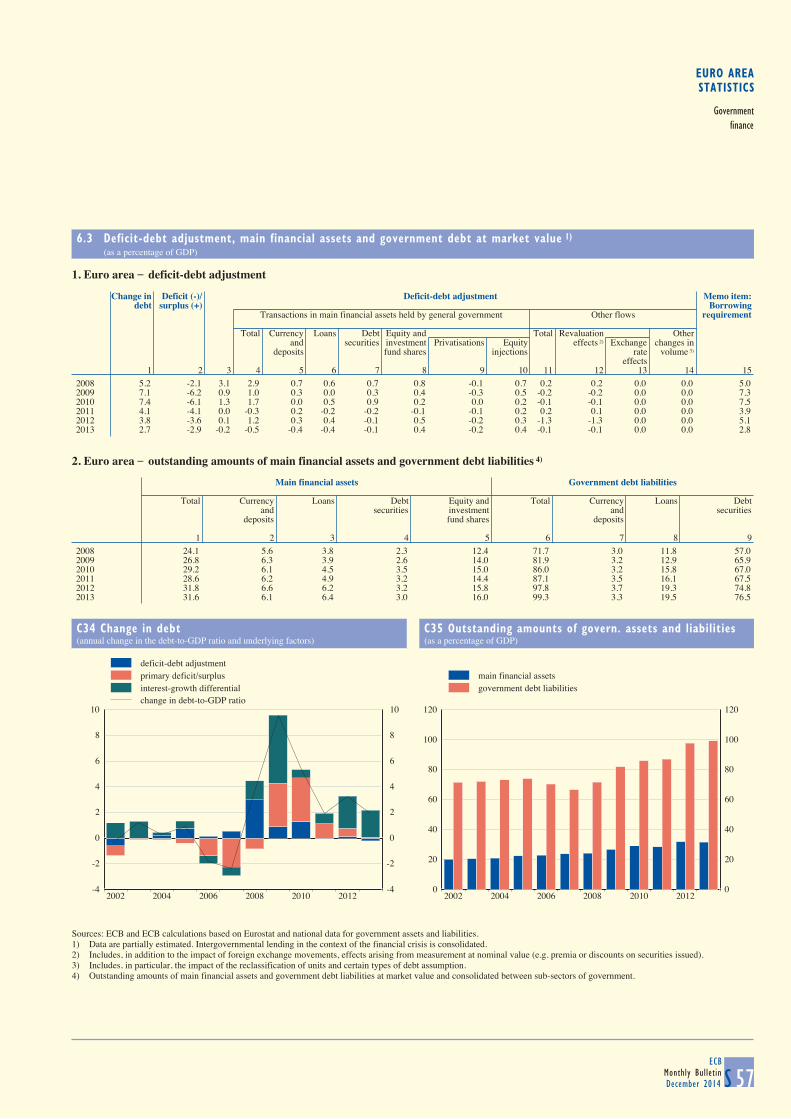
EURO AREASTATISTICS
Governmentfinance
6.3 Deficit-debt adjustment, main financial assets and government debt at market value 1) (as a percentage of GDP)
S 57ECB
Monthly BulletinDecember 2014
1. Euro area _ deficit-debt adjustment
Change in Deficit (-)/ Deficit-debt adjustment Memo item:
debt surplus (+) Borrowing Transactions in main financial assets held by general government Other flows requirement
Total Currency Loans Debt Equity and Total Revaluation Other
and securities investment Privatisations Equity effects 2) Exchange changes indeposits fund shares injections rate volume 3)
effects1 2 3 4 5 6 7 8 9 10 11 12 13 14 15
2008 5.2 -2.1 3.1 2.9 0.7 0.6 0.7 0.8 -0.1 0.7 0.2 0.2 0.0 0.0 5.02009 7.1 -6.2 0.9 1.0 0.3 0.0 0.3 0.4 -0.3 0.5 -0.2 -0.2 0.0 0.0 7.32010 7.4 -6.1 1.3 1.7 0.0 0.5 0.9 0.2 0.0 0.2 -0.1 -0.1 0.0 0.0 7.52011 4.1 -4.1 0.0 -0.3 0.2 -0.2 -0.2 -0.1 -0.1 0.2 0.2 0.1 0.0 0.0 3.92012 3.8 -3.6 0.1 1.2 0.3 0.4 -0.1 0.5 -0.2 0.3 -1.3 -1.3 0.0 0.0 5.12013 2.7 -2.9 -0.2 -0.5 -0.4 -0.4 -0.1 0.4 -0.2 0.4 -0.1 -0.1 0.0 0.0 2.8
2. Euro area _ outstanding amounts of main financial assets and government debt liabilities 4)
Main financial assets Government debt liabilities
Total Currency Loans Debt Equity and Total Currency Loans Debtand securities investment and securities
deposits fund shares deposits
1 2 3 4 5 6 7 8 92008 24.1 5.6 3.8 2.3 12.4 71.7 3.0 11.8 57.02009 26.8 6.3 3.9 2.6 14.0 81.9 3.2 12.9 65.92010 29.2 6.1 4.5 3.5 15.0 86.0 3.2 15.8 67.02011 28.6 6.2 4.9 3.2 14.4 87.1 3.5 16.1 67.52012 31.8 6.6 6.2 3.2 15.8 97.8 3.7 19.3 74.82013 31.6 6.1 6.4 3.0 16.0 99.3 3.3 19.5 76.5
C34 Change in debt
(annual change in the debt-to-GDP ratio and underlying factors)
C35 Outstanding amounts of govern. assets and liabilities
(as a percentage of GDP)
-4
-2
0
2
4
6
8
10
2002 2004 2006 2008 2010 2012-4
-2
0
2
4
6
8
10
deficit-debt adjustmentprimary deficit/surplusinterest-growth differentialchange in debt-to-GDP ratio
0
20
40
60
80
100
120
2002 2004 2006 2008 2010 20120
20
40
60
80
100
120
main financial assetsgovernment debt liabilities
Sources: ECB and ECB calculations based on Eurostat and national data for government assets and liabilities.1) Data are partially estimated. Intergovernmental lending in the context of the financial crisis is consolidated.2) Includes, in addition to the impact of foreign exchange movements, effects arising from measurement at nominal value (e.g. premia or discounts on securities issued).3) Includes, in particular, the impact of the reclassification of units and certain types of debt assumption.4) Outstanding amounts of main financial assets and government debt liabilities at market value and consolidated between sub-sectors of government.
6.2 Debt 1) (as a percentage of GDP)
S 56ECBMonthly BulletinDecember 2014
1. Euro area _ debt by financial instrument and sector of the holder
Total Financial instruments Holders
Currency Loans Short-term Long-term Resident creditors 2) Non-resident
and debt debt creditors 3)
deposits securities securities Total MFIs Other Otherfinancial sectors
corporations
1 2 3 4 5 6 7 8 9 102008 68.6 2.2 11.7 6.3 48.4 32.8 18.2 7.7 7.0 35.82009 78.2 2.4 12.8 8.0 55.0 36.5 21.1 9.0 6.5 41.72010 83.6 2.4 15.5 7.1 58.5 40.5 23.9 10.3 6.4 43.12011 85.5 2.4 15.5 7.1 60.4 42.4 24.1 11.1 7.2 43.12012 88.7 2.5 17.4 6.6 62.2 45.1 26.0 12.2 6.9 43.62013 90.7 2.5 16.9 6.1 65.2 45.7 26.0 12.8 6.9 45.0
2. Euro area _ debt by issuer, maturity and currency denomination
Outstanding amounts
Total Issuer 4) Original maturity Residual maturity Currencies
Central State Local Social Up to Over Up to Over 1 and Over Euro or Other
gov. gov. gov. security 1 year 1 year Variable 1 year up to 5 years 5 years participating currenciesfunds interest rate currencies
1 2 3 4 5 6 7 8 9 10 11 12 13
2008 68.6 55.4 6.7 5.2 1.3 9.7 58.9 5.7 17.2 23.0 28.5 67.4 1.12009 78.2 63.1 7.7 5.7 1.7 11.7 66.5 6.0 19.0 26.7 32.6 76.9 1.22010 83.6 67.5 8.3 5.8 1.9 12.7 70.9 6.1 20.7 28.6 34.3 82.2 1.32011 85.5 68.9 8.5 5.8 2.2 12.2 73.2 7.2 20.3 29.6 35.5 83.6 1.82012 88.7 71.7 8.9 5.9 2.2 11.5 77.3 8.6 19.5 31.4 37.8 86.5 2.22013 90.7 74.0 8.6 5.9 2.2 10.4 80.3 9.2 19.3 32.0 39.4 88.7 2.0
C32 Debt by financial instrument
(as percentage of GDP)
C33 Debt by holder
(as percentage of GDP)
0
20
40
60
80
100
2002 2004 2006 2008 2010 20120
20
40
60
80
100
currency and depositsloansdebt securitiestotal debt
10
20
30
40
50
60
70
80
90
100
2002 2004 2006 2008 2010 201210
20
30
40
50
60
70
80
90
100
MFIsother financial corporationsother resident sectorsnon-resident creditorstotal debt
Source: ECB.1) Gross general government debt at nominal value and consolidated between sub-sectors of government. Holdings by non-resident governments are not consolidated.
Intergovernmental lending in the context of the financial crisis is consolidated. Data are partially estimated.2) Holders resident in the country whose government has issued the debt. 3) Includes residents of euro area countries other than the country whose government has issued the debt. 4) Excludes debt held by general government in the country whose government has issued it.

6.4 Government debt securities 1) (Principal and interest during the debt service period; outstanding amounts at end of period; transactions as 12-month average)
S 58ECBMonthly BulletinDecember 2014
1. Euro area _ debt service due in two years
EUR billions
Debt service Average
residualTotal Up to 1 year Over 1 and up to 2 years maturity 3)
Total Principal 2) Interest Total Principal Interest
Total Up to 3 Over 3 Total Up to 3 Over 3months months months months
1 2 3 4 5 6 7 8 9 10 11 12
2011 2,632.2 1,691.0 1,479.4 589.3 890.2 211.6 54.4 157.2 941.1 753.9 187.2 6.42012 2,598.4 1,597.9 1,391.6 478.8 912.9 206.3 52.9 153.4 1,000.4 815.2 185.3 6.3
2013 Q4 2,674.3 1,639.3 1,430.9 497.0 933.9 208.4 53.4 155.0 1,035.1 849.8 185.2 6.32014 Q1 2,666.8 1,693.2 1,481.8 489.8 992.0 211.4 54.4 157.0 973.6 784.7 189.0 6.4 Q2 2,652.5 1,669.9 1,459.9 542.7 917.2 210.0 53.8 156.2 982.6 793.4 189.2 6.4
2014 May 2,707.0 1,667.7 1,456.1 506.4 949.7 211.6 54.3 157.3 1,039.3 849.1 190.2 6.4 June 2,652.5 1,669.9 1,459.9 542.7 917.2 210.0 53.8 156.2 982.6 793.4 189.2 6.4 July 2,672.7 1,685.9 1,474.6 511.9 962.7 211.3 54.2 157.1 986.8 796.1 190.7 6.4 Aug. 2,749.5 1,769.1 1,561.0 607.7 953.3 208.1 53.4 154.6 980.4 792.4 188.0 6.3 Sep. 2,751.4 1,742.6 1,534.3 578.4 955.9 208.3 53.5 154.8 1,008.7 820.1 188.7 6.3 Oct. 2,724.4 1,701.2 1,494.3 564.3 930.0 206.9 53.1 153.8 1,023.1 835.7 187.5 6.3
As a percentage of GDP
2011 27.1 17.4 15.1 6.0 9.1 2.2 0.6 1.7 9.7 7.7 2.0 - 2012 26.6 16.3 14.2 4.9 9.3 2.2 0.6 1.6 10.2 8.3 1.9 -
2013 Q4 27.1 16.6 14.4 5.0 9.4 2.2 0.6 1.6 10.5 8.6 1.9 - 2014 Q1 27.0 17.1 15.0 4.9 10.0 2.1 0.6 1.6 9.8 7.9 1.9 - Q2 26.8 16.9 14.7 5.5 9.3 2.1 0.5 1.6 9.9 8.0 1.9 -
2014 May 27.4 16.9 14.7 5.1 9.6 2.2 0.6 1.6 10.5 8.6 1.9 - June 26.8 16.9 14.7 5.5 9.3 2.1 0.5 1.6 9.9 8.0 1.9 - July 27.0 17.0 14.9 5.2 9.7 2.1 0.6 1.6 10.0 8.0 1.9 - Aug. 27.8 17.9 15.8 6.1 9.6 2.1 0.5 1.6 9.9 8.0 1.9 - Sep. 27.8 17.6 15.5 5.8 9.7 2.1 0.5 1.6 10.2 8.3 1.9 - Oct. 27.5 17.2 15.1 5.7 9.4 2.1 0.5 1.6 10.3 8.4 1.9 -
2. Euro area _ average nominal yields
Percentages per annum
Outstanding amounts Transactions
Total Zero Floating Fixed rate Issuance Redemptions
coupon rateTotal Up to Over Total Up to Total Over
1 year 5 years 1 year 1 year1 2 3 4 5 6 7 8 9 10
2011 4.0 3.0 2.5 4.2 3.7 4.6 . . 3.2 3.22012 3.7 3.0 1.6 3.9 3.3 4.4 1.6 1.6 2.7 2.9
2013 Q4 3.4 1.0 1.6 3.7 3.2 4.2 1.0 0.7 1.8 2.82014 Q1 3.2 0.8 1.6 3.7 3.2 4.1 1.1 0.6 1.7 2.8 Q2 3.2 0.8 1.5 3.6 3.1 4.0 1.1 0.7 1.7 2.9
2014 May 3.2 0.7 1.5 3.6 3.2 4.1 1.0 0.6 1.6 2.8 June 3.2 0.8 1.5 3.6 3.1 4.0 1.1 0.7 1.7 2.9 July 3.2 0.9 1.6 3.6 3.0 4.0 1.2 0.8 1.7 2.9 Aug. 3.1 0.5 1.5 3.6 3.1 4.0 0.9 0.5 1.6 2.8 Sep. 3.1 0.5 1.5 3.5 3.0 3.9 0.9 0.5 1.7 2.9 Oct. 3.1 0.4 1.5 3.5 3.0 3.9 0.9 0.5 1.7 2.9
Source: ECB.1) Data on government debt securities are recorded at face value and not consolidated within the general government sector.2) Principal amounts do not cover short-term securities issued and redeemed within the next 12 months. 3) Average residual maturity in years.
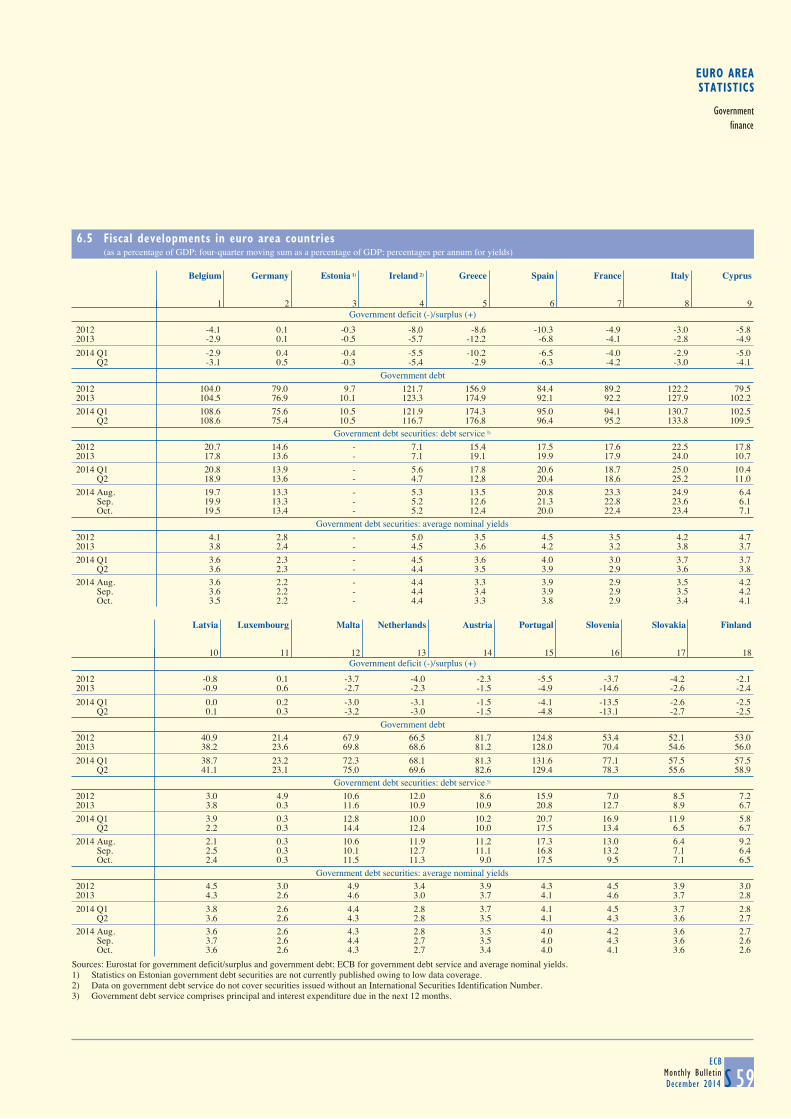
EURO AREASTATISTICS
Governmentfinance
6.5 Fiscal developments in euro area countries (as a percentage of GDP; four-quarter moving sum as a percentage of GDP; percentages per annum for yields)
S 59ECB
Monthly BulletinDecember 2014
Government deficit (-)/surplus (+)
Belgium Germany Estonia 1) Ireland 2) Greece Spain France Italy Cyprus
1 2 3 4 5 6 7 8 9
2012 -4.1 0.1 -0.3 -8.0 -8.6 -10.3 -4.9 -3.0 -5.82013 -2.9 0.1 -0.5 -5.7 -12.2 -6.8 -4.1 -2.8 -4.9
2014 Q1 -2.9 0.4 -0.4 -5.5 -10.2 -6.5 -4.0 -2.9 -5.0 Q2 -3.1 0.5 -0.3 -5.4 -2.9 -6.3 -4.2 -3.0 -4.1
Government debt
2012 104.0 79.0 9.7 121.7 156.9 84.4 89.2 122.2 79.52013 104.5 76.9 10.1 123.3 174.9 92.1 92.2 127.9 102.2
2014 Q1 108.6 75.6 10.5 121.9 174.3 95.0 94.1 130.7 102.5 Q2 108.6 75.4 10.5 116.7 176.8 96.4 95.2 133.8 109.5
Government debt securities: debt service 3)
2012 20.7 14.6 - 7.1 15.4 17.5 17.6 22.5 17.82013 17.8 13.6 - 7.1 19.1 19.9 17.9 24.0 10.7
2014 Q1 20.8 13.9 - 5.6 17.8 20.6 18.7 25.0 10.4 Q2 18.9 13.6 - 4.7 12.8 20.4 18.6 25.2 11.0
2014 Aug. 19.7 13.3 - 5.3 13.5 20.8 23.3 24.9 6.4 Sep. 19.9 13.3 - 5.2 12.6 21.3 22.8 23.6 6.1 Oct. 19.5 13.4 - 5.2 12.4 20.0 22.4 23.4 7.1
Government debt securities: average nominal yields
2012 4.1 2.8 - 5.0 3.5 4.5 3.5 4.2 4.72013 3.8 2.4 - 4.5 3.6 4.2 3.2 3.8 3.7
2014 Q1 3.6 2.3 - 4.5 3.6 4.0 3.0 3.7 3.7 Q2 3.6 2.3 - 4.4 3.5 3.9 2.9 3.6 3.8
2014 Aug. 3.6 2.2 - 4.4 3.3 3.9 2.9 3.5 4.2 Sep. 3.6 2.2 - 4.4 3.4 3.9 2.9 3.5 4.2 Oct. 3.5 2.2 - 4.4 3.3 3.8 2.9 3.4 4.1
Government deficit (-)/surplus (+)
Latvia Luxembourg Malta Netherlands Austria Portugal Slovenia Slovakia Finland
10 11 12 13 14 15 16 17 18
2012 -0.8 0.1 -3.7 -4.0 -2.3 -5.5 -3.7 -4.2 -2.12013 -0.9 0.6 -2.7 -2.3 -1.5 -4.9 -14.6 -2.6 -2.4
2014 Q1 0.0 0.2 -3.0 -3.1 -1.5 -4.1 -13.5 -2.6 -2.5 Q2 0.1 0.3 -3.2 -3.0 -1.5 -4.8 -13.1 -2.7 -2.5
Government debt
2012 40.9 21.4 67.9 66.5 81.7 124.8 53.4 52.1 53.02013 38.2 23.6 69.8 68.6 81.2 128.0 70.4 54.6 56.0
2014 Q1 38.7 23.2 72.3 68.1 81.3 131.6 77.1 57.5 57.5 Q2 41.1 23.1 75.0 69.6 82.6 129.4 78.3 55.6 58.9
Government debt securities: debt service 3)
2012 3.0 4.9 10.6 12.0 8.6 15.9 7.0 8.5 7.22013 3.8 0.3 11.6 10.9 10.9 20.8 12.7 8.9 6.7
2014 Q1 3.9 0.3 12.8 10.0 10.2 20.7 16.9 11.9 5.8 Q2 2.2 0.3 14.4 12.4 10.0 17.5 13.4 6.5 6.7
2014 Aug. 2.1 0.3 10.6 11.9 11.2 17.3 13.0 6.4 9.2 Sep. 2.5 0.3 10.1 12.7 11.1 16.8 13.2 7.1 6.4 Oct. 2.4 0.3 11.5 11.3 9.0 17.5 9.5 7.1 6.5
Government debt securities: average nominal yields
2012 4.5 3.0 4.9 3.4 3.9 4.3 4.5 3.9 3.02013 4.3 2.6 4.6 3.0 3.7 4.1 4.6 3.7 2.8
2014 Q1 3.8 2.6 4.4 2.8 3.7 4.1 4.5 3.7 2.8 Q2 3.6 2.6 4.3 2.8 3.5 4.1 4.3 3.6 2.7
2014 Aug. 3.6 2.6 4.3 2.8 3.5 4.0 4.2 3.6 2.7 Sep. 3.7 2.6 4.4 2.7 3.5 4.0 4.3 3.6 2.6 Oct. 3.6 2.6 4.3 2.7 3.4 4.0 4.1 3.6 2.6
Sources: Eurostat for government deficit/surplus and government debt; ECB for government debt service and average nominal yields.1) Statistics on Estonian government debt securities are not currently published owing to low data coverage.2) Data on government debt service do not cover securities issued without an International Securities Identification Number.3) Government debt service comprises principal and interest expenditure due in the next 12 months.
6.4 Government debt securities 1) (Principal and interest during the debt service period; outstanding amounts at end of period; transactions as 12-month average)
S 58ECBMonthly BulletinDecember 2014
1. Euro area _ debt service due in two years
EUR billions
Debt service Average
residualTotal Up to 1 year Over 1 and up to 2 years maturity 3)
Total Principal 2) Interest Total Principal Interest
Total Up to 3 Over 3 Total Up to 3 Over 3months months months months
1 2 3 4 5 6 7 8 9 10 11 12
2011 2,632.2 1,691.0 1,479.4 589.3 890.2 211.6 54.4 157.2 941.1 753.9 187.2 6.42012 2,598.4 1,597.9 1,391.6 478.8 912.9 206.3 52.9 153.4 1,000.4 815.2 185.3 6.3
2013 Q4 2,674.3 1,639.3 1,430.9 497.0 933.9 208.4 53.4 155.0 1,035.1 849.8 185.2 6.32014 Q1 2,666.8 1,693.2 1,481.8 489.8 992.0 211.4 54.4 157.0 973.6 784.7 189.0 6.4 Q2 2,652.5 1,669.9 1,459.9 542.7 917.2 210.0 53.8 156.2 982.6 793.4 189.2 6.4
2014 May 2,707.0 1,667.7 1,456.1 506.4 949.7 211.6 54.3 157.3 1,039.3 849.1 190.2 6.4 June 2,652.5 1,669.9 1,459.9 542.7 917.2 210.0 53.8 156.2 982.6 793.4 189.2 6.4 July 2,672.7 1,685.9 1,474.6 511.9 962.7 211.3 54.2 157.1 986.8 796.1 190.7 6.4 Aug. 2,749.5 1,769.1 1,561.0 607.7 953.3 208.1 53.4 154.6 980.4 792.4 188.0 6.3 Sep. 2,751.4 1,742.6 1,534.3 578.4 955.9 208.3 53.5 154.8 1,008.7 820.1 188.7 6.3 Oct. 2,724.4 1,701.2 1,494.3 564.3 930.0 206.9 53.1 153.8 1,023.1 835.7 187.5 6.3
As a percentage of GDP
2011 27.1 17.4 15.1 6.0 9.1 2.2 0.6 1.7 9.7 7.7 2.0 - 2012 26.6 16.3 14.2 4.9 9.3 2.2 0.6 1.6 10.2 8.3 1.9 -
2013 Q4 27.1 16.6 14.4 5.0 9.4 2.2 0.6 1.6 10.5 8.6 1.9 - 2014 Q1 27.0 17.1 15.0 4.9 10.0 2.1 0.6 1.6 9.8 7.9 1.9 - Q2 26.8 16.9 14.7 5.5 9.3 2.1 0.5 1.6 9.9 8.0 1.9 -
2014 May 27.4 16.9 14.7 5.1 9.6 2.2 0.6 1.6 10.5 8.6 1.9 - June 26.8 16.9 14.7 5.5 9.3 2.1 0.5 1.6 9.9 8.0 1.9 - July 27.0 17.0 14.9 5.2 9.7 2.1 0.6 1.6 10.0 8.0 1.9 - Aug. 27.8 17.9 15.8 6.1 9.6 2.1 0.5 1.6 9.9 8.0 1.9 - Sep. 27.8 17.6 15.5 5.8 9.7 2.1 0.5 1.6 10.2 8.3 1.9 - Oct. 27.5 17.2 15.1 5.7 9.4 2.1 0.5 1.6 10.3 8.4 1.9 -
2. Euro area _ average nominal yields
Percentages per annum
Outstanding amounts Transactions
Total Zero Floating Fixed rate Issuance Redemptions
coupon rateTotal Up to Over Total Up to Total Over
1 year 5 years 1 year 1 year1 2 3 4 5 6 7 8 9 10
2011 4.0 3.0 2.5 4.2 3.7 4.6 . . 3.2 3.22012 3.7 3.0 1.6 3.9 3.3 4.4 1.6 1.6 2.7 2.9
2013 Q4 3.4 1.0 1.6 3.7 3.2 4.2 1.0 0.7 1.8 2.82014 Q1 3.2 0.8 1.6 3.7 3.2 4.1 1.1 0.6 1.7 2.8 Q2 3.2 0.8 1.5 3.6 3.1 4.0 1.1 0.7 1.7 2.9
2014 May 3.2 0.7 1.5 3.6 3.2 4.1 1.0 0.6 1.6 2.8 June 3.2 0.8 1.5 3.6 3.1 4.0 1.1 0.7 1.7 2.9 July 3.2 0.9 1.6 3.6 3.0 4.0 1.2 0.8 1.7 2.9 Aug. 3.1 0.5 1.5 3.6 3.1 4.0 0.9 0.5 1.6 2.8 Sep. 3.1 0.5 1.5 3.5 3.0 3.9 0.9 0.5 1.7 2.9 Oct. 3.1 0.4 1.5 3.5 3.0 3.9 0.9 0.5 1.7 2.9
Source: ECB.1) Data on government debt securities are recorded at face value and not consolidated within the general government sector.2) Principal amounts do not cover short-term securities issued and redeemed within the next 12 months. 3) Average residual maturity in years.
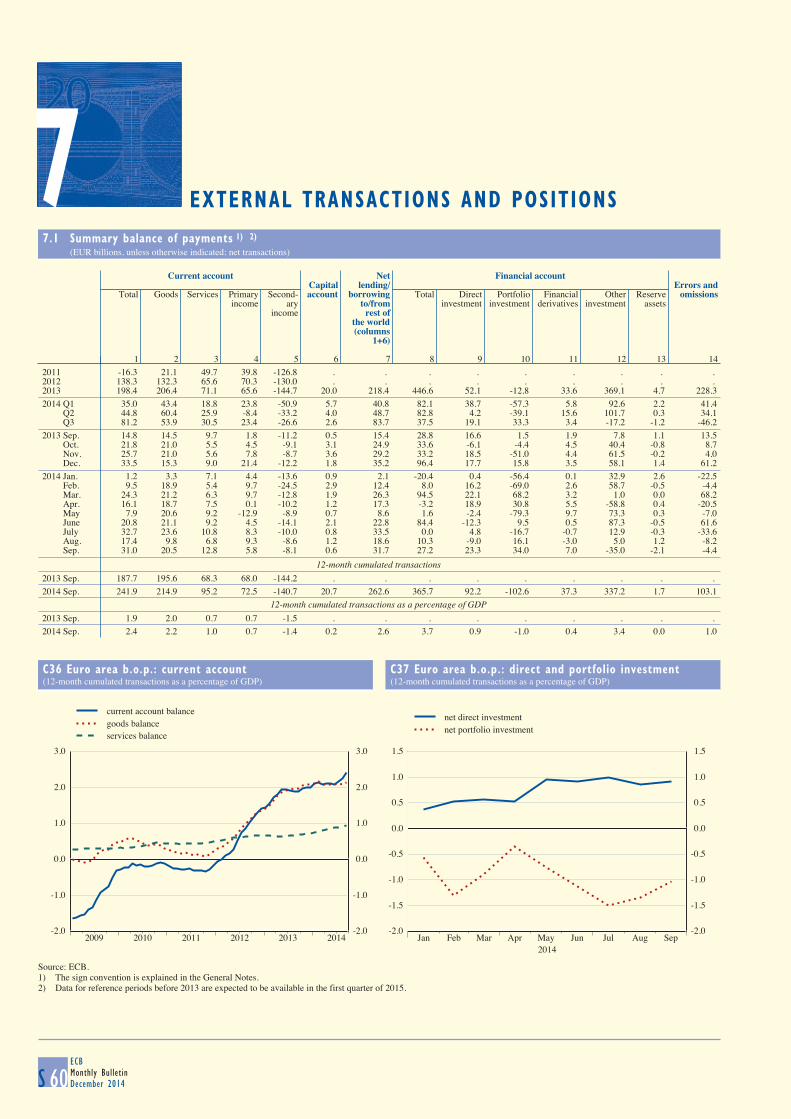
7 EXTERNAL TRANSACTIONS AND POSITIONS
7.1 Summary balance of payments 1) 2) (EUR billions, unless otherwise indicated; net transactions)
S 60ECBMonthly BulletinDecember 2014
Current account Net Financial account
Capital lending/ Errors andTotal Goods Services Primary Second- account borrowing Total Direct Portfolio Financial Other Reserve omissions
income ary to/from investment investment derivatives investment assetsincome rest of
the world(columns
1+6)
1 2 3 4 5 6 7 8 9 10 11 12 13 142011 -16.3 21.1 49.7 39.8 -126.8 . . . . . . . . . 2012 138.3 132.3 65.6 70.3 -130.0 . . . . . . . . . 2013 198.4 206.4 71.1 65.6 -144.7 20.0 218.4 446.6 52.1 -12.8 33.6 369.1 4.7 228.32014 Q1 35.0 43.4 18.8 23.8 -50.9 5.7 40.8 82.1 38.7 -57.3 5.8 92.6 2.2 41.4 Q2 44.8 60.4 25.9 -8.4 -33.2 4.0 48.7 82.8 4.2 -39.1 15.6 101.7 0.3 34.1 Q3 81.2 53.9 30.5 23.4 -26.6 2.6 83.7 37.5 19.1 33.3 3.4 -17.2 -1.2 -46.22013 Sep. 14.8 14.5 9.7 1.8 -11.2 0.5 15.4 28.8 16.6 1.5 1.9 7.8 1.1 13.5 Oct. 21.8 21.0 5.5 4.5 -9.1 3.1 24.9 33.6 -6.1 -4.4 4.5 40.4 -0.8 8.7 Nov. 25.7 21.0 5.6 7.8 -8.7 3.6 29.2 33.2 18.5 -51.0 4.4 61.5 -0.2 4.0 Dec. 33.5 15.3 9.0 21.4 -12.2 1.8 35.2 96.4 17.7 15.8 3.5 58.1 1.4 61.22014 Jan. 1.2 3.3 7.1 4.4 -13.6 0.9 2.1 -20.4 0.4 -56.4 0.1 32.9 2.6 -22.5 Feb. 9.5 18.9 5.4 9.7 -24.5 2.9 12.4 8.0 16.2 -69.0 2.6 58.7 -0.5 -4.4 Mar. 24.3 21.2 6.3 9.7 -12.8 1.9 26.3 94.5 22.1 68.2 3.2 1.0 0.0 68.2 Apr. 16.1 18.7 7.5 0.1 -10.2 1.2 17.3 -3.2 18.9 30.8 5.5 -58.8 0.4 -20.5 May 7.9 20.6 9.2 -12.9 -8.9 0.7 8.6 1.6 -2.4 -79.3 9.7 73.3 0.3 -7.0 June 20.8 21.1 9.2 4.5 -14.1 2.1 22.8 84.4 -12.3 9.5 0.5 87.3 -0.5 61.6 July 32.7 23.6 10.8 8.3 -10.0 0.8 33.5 0.0 4.8 -16.7 -0.7 12.9 -0.3 -33.6 Aug. 17.4 9.8 6.8 9.3 -8.6 1.2 18.6 10.3 -9.0 16.1 -3.0 5.0 1.2 -8.2 Sep. 31.0 20.5 12.8 5.8 -8.1 0.6 31.7 27.2 23.3 34.0 7.0 -35.0 -2.1 -4.4
12-month cumulated transactions 2013 Sep. 187.7 195.6 68.3 68.0 -144.2 . . . . . . . . . 2014 Sep. 241.9 214.9 95.2 72.5 -140.7 20.7 262.6 365.7 92.2 -102.6 37.3 337.2 1.7 103.1
12-month cumulated transactions as a percentage of GDP 2013 Sep. 1.9 2.0 0.7 0.7 -1.5 . . . . . . . . . 2014 Sep. 2.4 2.2 1.0 0.7 -1.4 0.2 2.6 3.7 0.9 -1.0 0.4 3.4 0.0 1.0
C36 Euro area b.o.p.: current account
(12-month cumulated transactions as a percentage of GDP)
C37 Euro area b.o.p.: direct and portfolio investment
(12-month cumulated transactions as a percentage of GDP)
-2.0
-1.0
0.0
1.0
2.0
3.0
2009 2010 2011 2012 2013 2014-2.0
-1.0
0.0
1.0
2.0
3.0
current account balancegoods balanceservices balance
-2.0
-1.5
-1.0
-0.5
0.0
0.5
1.0
1.5
Jan Feb Mar Apr May Jun Jul Aug Sep2014
-2.0
-1.5
-1.0
-0.5
0.0
0.5
1.0
1.5
net direct investmentnet portfolio investment
Source: ECB.1) The sign convention is explained in the General Notes.2) Data for reference periods before 2013 are expected to be available in the first quarter of 2015.
7

EURO AREASTATISTICS
Externaltransactions
andpositions
7.2 Current and capital accounts 1) (EUR billions, unless otherwise indicated; transactions)
S 61ECB
Monthly BulletinDecember 2014
1. Summary current and capital accounts
Current account Capital
account Total Goods Services Primary income Secondary income
Credit Debit Net Credit Debit Credit Debit Credit Debit Credit Debit Credit Debit
Compen- Compen-sation of sation of
employees employees
1 2 3 4 5 6 7 8 9 10 11 12 13 14 152011 2,951.7 2,967.9 -16.3 1,726.5 1,705.4 564.3 514.6 583.0 . 543.2 . 77.9 204.7 . . 2012 3,152.7 3,014.4 138.3 1,870.0 1,737.8 608.8 543.2 595.6 . 525.3 . 78.1 208.1 . . 2013 3,231.0 3,032.6 198.4 1,899.7 1,693.3 641.2 570.1 605.7 30.9 540.1 14.0 84.4 229.1 38.9 18.92014 Q1 787.9 752.8 35.0 467.0 423.6 155.2 136.5 145.9 7.9 122.1 2.6 19.8 70.7 9.3 3.6 Q2 830.9 786.1 44.8 484.9 424.5 171.5 145.6 151.5 7.8 159.8 3.7 23.0 56.1 7.5 3.5 Q3 822.1 740.9 81.2 482.2 428.3 183.8 153.3 136.4 7.8 113.0 4.1 19.6 46.3 5.3 2.82014 May 276.0 268.1 7.9 161.9 141.4 56.6 47.4 49.4 2.6 62.3 1.2 8.0 16.9 2.3 1.6 June 288.0 267.2 20.8 163.0 141.9 61.7 52.4 55.3 2.6 50.8 1.3 8.0 22.1 3.1 1.0 July 284.4 251.7 32.7 171.9 148.3 62.0 51.2 43.9 2.6 35.6 1.4 6.6 16.5 1.8 1.0 Aug. 249.0 231.6 17.4 140.1 130.3 59.2 52.4 43.3 2.6 34.0 1.3 6.4 15.0 2.1 0.9 Sep. 288.7 257.7 31.0 170.2 149.7 62.5 49.7 49.2 2.5 43.5 1.4 6.7 14.8 1.5 0.9
12-month cumulated transactions 2013 Sep. 3,210.9 3,023.2 187.7 1,893.5 1,697.9 630.5 562.2 603.8 . 535.8 . 83.0 227.2 . . 2014 Sep. 3,273.3 3,031.4 241.9 1,917.2 1,702.2 677.9 582.7 594.4 31.5 521.9 13.9 83.8 224.6 38.0 17.3
12-month cumulated transactions as a percentage of GDP 2013 Sep. 32.5 30.6 1.9 19.2 17.2 6.4 5.7 6.1 . 5.4 . 0.8 2.3 . . 2014 Sep. 32.8 30.4 2.4 19.2 17.0 6.8 5.8 6.0 0.3 5.2 0.1 0.8 2.2 0.4 0.2
Year-on-year percentage changes 2013 Sep. 0.0 0.0 0.0 0.0 0.0 0.0 0.0 0.0 . 0.0 . 0.0 0.0 . . 2014 Sep. 5.0 -0.9 109.0 6.6 3.1 6.7 1.7 -0.4 0.4 -8.7 0.8 -6.4 -19.3 -17.1 -33.7
Seasonally adjusted
2014 Q1 814.2 754.8 59.3 474.1 422.9 168.7 143.9 149.9 - 131.2 - 21.4 56.8 - - Q2 824.5 764.6 59.9 484.8 427.4 171.8 148.0 147.2 - 130.0 - 20.6 59.3 - - Q3 820.7 745.0 75.7 481.8 425.5 172.4 145.6 145.9 - 122.2 - 20.6 51.7 - -2014 May 273.4 250.4 23.0 161.1 140.0 56.6 48.3 48.8 - 43.4 - 6.9 18.7 - - June 277.8 260.3 17.5 162.5 144.2 59.3 51.5 48.7 - 43.0 - 7.3 21.5 - - July 270.0 247.1 22.9 159.9 142.4 56.6 47.8 46.8 - 38.3 - 6.6 18.7 - - Aug. 266.5 243.7 22.8 154.3 136.3 57.0 49.6 47.9 - 40.2 - 7.3 17.7 - - Sep. 284.3 254.2 30.0 167.6 146.9 58.8 48.3 51.3 - 43.7 - 6.7 15.3 - -
Month-on-month percentage changes
2014 July -2.8 -5.1 30.6 -1.6 -1.3 -4.5 -7.3 -3.9 - -10.9 - -10.0 -13.3 - - Aug. -1.3 -1.4 -0.3 -3.5 -4.3 0.7 3.8 2.4 - 5.0 - 10.0 -5.4 - - Sep. 6.7 4.3 31.8 8.6 7.8 3.1 -2.5 7.1 - 8.7 - -8.1 -13.2 - -
2. Services
Total Transport Travel Insurance, pension Telecommunications Other Other
and financial computer and infor- business services 3) services mation services services 2)
Credit Debit Credit Debit Credit Debit Credit Debit Credit Debit Credit Debit Credit Debit
1 2 3 4 5 6 7 8 9 10 11 12 13 142011 564.3 514.6 . . . . . . . . . . . . 2012 608.8 543.2 . . . . . . . . . . . . 2013 641.2 570.1 127.4 123.0 112.6 93.1 75.9 52.0 75.2 40.4 161.9 164.3 88.2 97.22013 Q3 171.5 148.7 33.5 31.4 39.9 31.9 19.2 12.5 18.3 9.6 39.2 39.7 21.5 23.6 Q4 167.3 147.3 31.4 30.6 23.3 21.6 20.2 13.6 21.3 10.8 45.8 45.3 25.3 25.42014 Q1 155.2 136.5 29.7 30.0 20.7 18.1 18.8 14.0 19.2 9.9 41.3 39.6 25.5 24.9 Q2 171.5 145.6 31.4 30.4 30.8 23.4 19.9 14.0 20.7 10.2 43.6 42.6 24.8 25.1 Q3 183.8 153.3 - - - - - - - - - - - -
Source: ECB.1) Data for reference periods before 2013 are expected to be available in the first quarter of 2015.2) Comprises research and development services, professional and management consulting services, and technical, trade-related and other business services not included in
the previous categories.3) Comprises manufacturing services on physical inputs owned by others, maintenance and repair services not included elsewhere, construction, charges for the use of intellectual property,
personal, cultural and recreational services, government goods and services and services not allocated.
7 EXTERNAL TRANSACTIONS AND POSITIONS
7.1 Summary balance of payments 1) 2) (EUR billions, unless otherwise indicated; net transactions)
S 60ECBMonthly BulletinDecember 2014
Current account Net Financial account
Capital lending/ Errors andTotal Goods Services Primary Second- account borrowing Total Direct Portfolio Financial Other Reserve omissions
income ary to/from investment investment derivatives investment assetsincome rest of
the world(columns
1+6)
1 2 3 4 5 6 7 8 9 10 11 12 13 142011 -16.3 21.1 49.7 39.8 -126.8 . . . . . . . . . 2012 138.3 132.3 65.6 70.3 -130.0 . . . . . . . . . 2013 198.4 206.4 71.1 65.6 -144.7 20.0 218.4 446.6 52.1 -12.8 33.6 369.1 4.7 228.32014 Q1 35.0 43.4 18.8 23.8 -50.9 5.7 40.8 82.1 38.7 -57.3 5.8 92.6 2.2 41.4 Q2 44.8 60.4 25.9 -8.4 -33.2 4.0 48.7 82.8 4.2 -39.1 15.6 101.7 0.3 34.1 Q3 81.2 53.9 30.5 23.4 -26.6 2.6 83.7 37.5 19.1 33.3 3.4 -17.2 -1.2 -46.22013 Sep. 14.8 14.5 9.7 1.8 -11.2 0.5 15.4 28.8 16.6 1.5 1.9 7.8 1.1 13.5 Oct. 21.8 21.0 5.5 4.5 -9.1 3.1 24.9 33.6 -6.1 -4.4 4.5 40.4 -0.8 8.7 Nov. 25.7 21.0 5.6 7.8 -8.7 3.6 29.2 33.2 18.5 -51.0 4.4 61.5 -0.2 4.0 Dec. 33.5 15.3 9.0 21.4 -12.2 1.8 35.2 96.4 17.7 15.8 3.5 58.1 1.4 61.22014 Jan. 1.2 3.3 7.1 4.4 -13.6 0.9 2.1 -20.4 0.4 -56.4 0.1 32.9 2.6 -22.5 Feb. 9.5 18.9 5.4 9.7 -24.5 2.9 12.4 8.0 16.2 -69.0 2.6 58.7 -0.5 -4.4 Mar. 24.3 21.2 6.3 9.7 -12.8 1.9 26.3 94.5 22.1 68.2 3.2 1.0 0.0 68.2 Apr. 16.1 18.7 7.5 0.1 -10.2 1.2 17.3 -3.2 18.9 30.8 5.5 -58.8 0.4 -20.5 May 7.9 20.6 9.2 -12.9 -8.9 0.7 8.6 1.6 -2.4 -79.3 9.7 73.3 0.3 -7.0 June 20.8 21.1 9.2 4.5 -14.1 2.1 22.8 84.4 -12.3 9.5 0.5 87.3 -0.5 61.6 July 32.7 23.6 10.8 8.3 -10.0 0.8 33.5 0.0 4.8 -16.7 -0.7 12.9 -0.3 -33.6 Aug. 17.4 9.8 6.8 9.3 -8.6 1.2 18.6 10.3 -9.0 16.1 -3.0 5.0 1.2 -8.2 Sep. 31.0 20.5 12.8 5.8 -8.1 0.6 31.7 27.2 23.3 34.0 7.0 -35.0 -2.1 -4.4
12-month cumulated transactions 2013 Sep. 187.7 195.6 68.3 68.0 -144.2 . . . . . . . . . 2014 Sep. 241.9 214.9 95.2 72.5 -140.7 20.7 262.6 365.7 92.2 -102.6 37.3 337.2 1.7 103.1
12-month cumulated transactions as a percentage of GDP 2013 Sep. 1.9 2.0 0.7 0.7 -1.5 . . . . . . . . . 2014 Sep. 2.4 2.2 1.0 0.7 -1.4 0.2 2.6 3.7 0.9 -1.0 0.4 3.4 0.0 1.0
C36 Euro area b.o.p.: current account
(12-month cumulated transactions as a percentage of GDP)
C37 Euro area b.o.p.: direct and portfolio investment
(12-month cumulated transactions as a percentage of GDP)
-2.0
-1.0
0.0
1.0
2.0
3.0
2009 2010 2011 2012 2013 2014-2.0
-1.0
0.0
1.0
2.0
3.0
current account balancegoods balanceservices balance
-2.0
-1.5
-1.0
-0.5
0.0
0.5
1.0
1.5
Jan Feb Mar Apr May Jun Jul Aug Sep2014
-2.0
-1.5
-1.0
-0.5
0.0
0.5
1.0
1.5
net direct investmentnet portfolio investment
Source: ECB.1) The sign convention is explained in the General Notes.2) Data for reference periods before 2013 are expected to be available in the first quarter of 2015.

7.2 Current and capital accounts 1) (EUR billions)
S 62ECBMonthly BulletinDecember 2014
3. Investment income(transactions)
Total Direct investment Portfolio investment Other investment Reserve
assets
Credit Debit Equity Debt instruments Equity Debt securities Credit Debit Credit
Credit Debit Credit Debit Credit Debit Credit Debit
Reinv. Reinv.earnings earnings
1 2 3 4 5 6 7 8 9 10 11 12 13 14 15 2011 . . . . . . . . . . . . . . . 2012 . . . . . . . . . . . . . . . 2013 535.2 510.0 271.7 32.1 183.0 38.7 64.1 50.9 45.5 111.7 102.6 110.2 48.7 54.2 2.7 2013 Q3 133.0 124.7 67.1 17.0 47.5 16.4 15.2 12.3 12.7 25.3 25.7 27.0 11.6 12.7 0.7 Q4 132.9 119.2 67.5 -9.3 45.8 -3.5 17.3 13.1 9.9 19.5 25.5 27.1 12.0 13.6 0.7 2014 Q1 125.3 115.5 61.8 17.9 40.6 12.5 16.2 13.9 11.2 20.2 24.9 27.3 10.5 13.4 0.7 Q2 140.7 152.1 70.9 7.6 42.5 8.2 15.1 14.5 18.2 56.5 25.4 25.5 10.4 13.2 0.7 Q3 125.6 105.3 61.0 13.2 35.3 13.2 12.3 9.8 14.5 22.7 25.6 25.4 11.6 12.1 0.7
4. Geographical breakdown(four-quarter cumulated transactions)
Total EU Member States outside the euro area Brazil Canada China India Japan Russia Switzer- United Other
land States countries 2
Total United Other EU EUKingdom countries insti-
2013 Q3 to tutions2014 Q2 1 2 3 4 5 6 7 8 9 10 11 12 13 14
Credits
Current account 3,260.0 1,044.1 493.8 485.0 65.2 58.3 46.2 165.6 37.5 76.0 120.9 264.3 437.4 1,009.6 Goods 1,908.1 607.7 253.8 353.3 0.5 31.6 24.1 130.4 27.6 43.2 82.0 105.7 224.2 631.6 Services 665.6 202.3 123.5 71.1 7.7 10.7 10.8 20.4 7.4 16.2 21.1 74.2 106.1 196.5 Primary income 601.6 195.6 91.9 54.8 48.9 15.5 10.7 14.3 2.2 13.0 17.2 71.4 96.0 165.6 Investment income 531.8 150.0 89.4 53.8 6.8 15.3 10.6 14.2 2.2 12.9 17.2 55.0 94.4 160.1 Secondary income 84.6 35.7 24.6 3.0 8.1 0.6 0.6 0.6 0.2 3.7 0.6 13.1 11.0 18.6 Capital account 40.4 31.1 5.0 0.7 25.3 0.0 0.0 0.7 0.1 0.3 0.1 2.9 0.5 4.8
Debits
Current account 3,052.5 Goods 1,700.4 477.9 164.3 313.6 0.0 25.3 14.5 199.8 25.2 42.2 133.1 96.8 141.2 544.4 Services 578.0 167.7 92.9 73.6 1.3 5.3 8.2 16.4 7.0 10.1 10.4 50.5 125.4 177.1 Primary income 541.7 Investment income 511.5 Secondary income 232.4 130.2 24.1 6.4 99.8 1.7 1.1 2.5 1.1 3.4 0.8 14.4 16.4 60.7 Capital account 17.9 6.4 4.6 1.5 0.4 0.2 0.4 0.2 0.1 0.0 0.0 0.7 1.8 7.9
Net
Current account 207.4 Goods 207.7 129.7 89.5 39.7 0.5 6.4 9.6 -69.3 2.4 0.9 -51.1 8.9 83.0 87.2 Services 87.6 34.6 30.6 -2.4 6.4 5.4 2.6 3.9 0.4 6.1 10.7 23.7 -19.3 19.4 Primary income 59.9 Investment income 20.3 Secondary income -147.8 -91.8 0.5 -0.6 -91.6 -1.1 -0.6 -1.9 -0.9 0.2 -0.3 -1.3 -5.3 -44.8 Capital account 22.6 42.5 0.5 17.1 25.0 -0.2 -0.4 0.5 0.0 0.3 0.1 2.1 -1.3 -21.0
Source: ECB.1) Data for reference periods before 2013 are expected to be available in the first quarter of 2015.2) All income on reserve assets is allocated to other countries
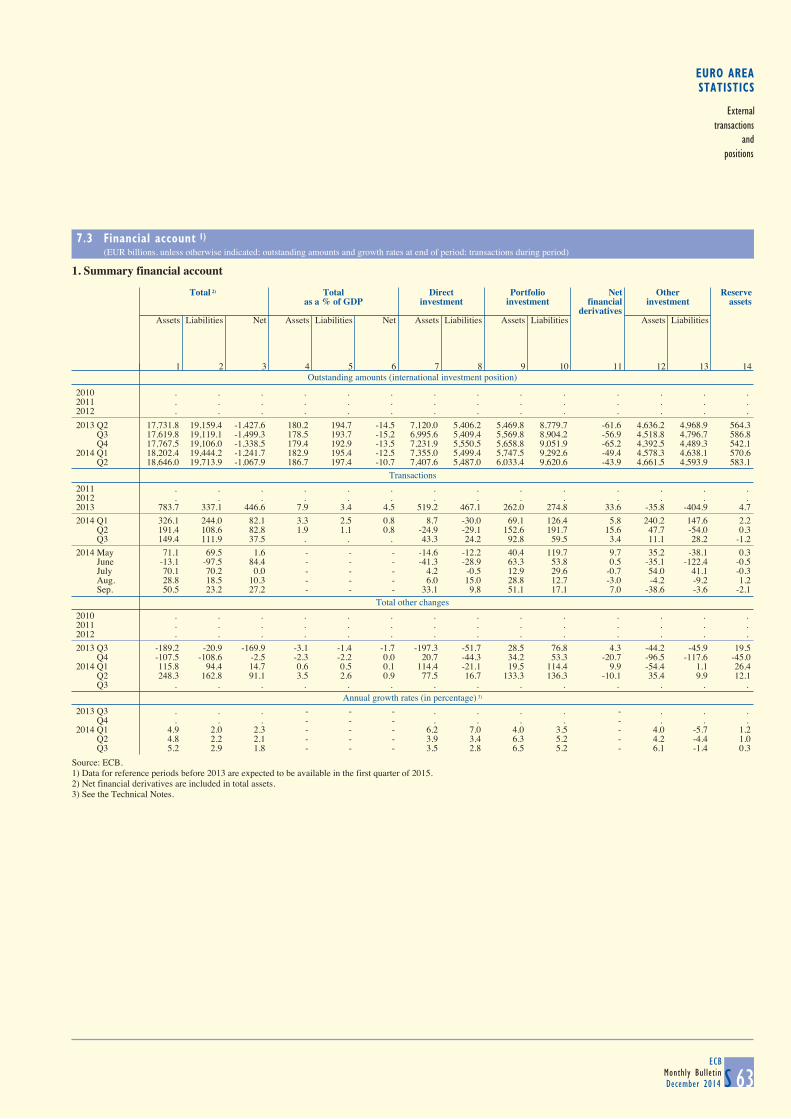
EURO AREASTATISTICS
Externaltransactions
andpositions
7.3 Financial account 1) (EUR billions, unless otherwise indicated; outstanding amounts and growth rates at end of period; transactions during period)
S 63ECB
Monthly BulletinDecember 2014
1. Summary financial account
Outstanding amounts (international investment position)
Total 2) Total Direct Portfolio Net Other Reserve
as a % of GDP investment investment financial investment assetsderivatives
Assets Liabilities Net Assets Liabilities Net Assets Liabilities Assets Liabilities Assets Liabilities
1 2 3 4 5 6 7 8 9 10 11 12 13 14
2010 . . . . . . . . . . . . . . 2011 . . . . . . . . . . . . . . 2012 . . . . . . . . . . . . . .
2013 Q2 17,731.8 19,159.4 -1,427.6 180.2 194.7 -14.5 7,120.0 5,406.2 5,469.8 8,779.7 -61.6 4,636.2 4,968.9 564.3 Q3 17,619.8 19,119.1 -1,499.3 178.5 193.7 -15.2 6,995.6 5,409.4 5,569.8 8,904.2 -56.9 4,518.8 4,796.7 586.8 Q4 17,767.5 19,106.0 -1,338.5 179.4 192.9 -13.5 7,231.9 5,550.5 5,658.8 9,051.9 -65.2 4,392.5 4,489.3 542.12014 Q1 18,202.4 19,444.2 -1,241.7 182.9 195.4 -12.5 7,355.0 5,499.4 5,747.5 9,292.6 -49.4 4,578.3 4,638.1 570.6 Q2 18,646.0 19,713.9 -1,067.9 186.7 197.4 -10.7 7,407.6 5,487.0 6,033.4 9,620.6 -43.9 4,661.5 4,593.9 583.1
Transactions
2011 . . . . . . . . . . . . . . 2012 . . . . . . . . . . . . . . 2013 783.7 337.1 446.6 7.9 3.4 4.5 519.2 467.1 262.0 274.8 33.6 -35.8 -404.9 4.7
2014 Q1 326.1 244.0 82.1 3.3 2.5 0.8 8.7 -30.0 69.1 126.4 5.8 240.2 147.6 2.2 Q2 191.4 108.6 82.8 1.9 1.1 0.8 -24.9 -29.1 152.6 191.7 15.6 47.7 -54.0 0.3 Q3 149.4 111.9 37.5 . . . 43.3 24.2 92.8 59.5 3.4 11.1 28.2 -1.2
2014 May 71.1 69.5 1.6 - - - -14.6 -12.2 40.4 119.7 9.7 35.2 -38.1 0.3 June -13.1 -97.5 84.4 - - - -41.3 -28.9 63.3 53.8 0.5 -35.1 -122.4 -0.5 July 70.1 70.2 0.0 - - - 4.2 -0.5 12.9 29.6 -0.7 54.0 41.1 -0.3 Aug. 28.8 18.5 10.3 - - - 6.0 15.0 28.8 12.7 -3.0 -4.2 -9.2 1.2 Sep. 50.5 23.2 27.2 - - - 33.1 9.8 51.1 17.1 7.0 -38.6 -3.6 -2.1
Total other changes
2010 . . . . . . . . . . . . . . 2011 . . . . . . . . . . . . . . 2012 . . . . . . . . . . . . . .
2013 Q3 -189.2 -20.9 -169.9 -3.1 -1.4 -1.7 -197.3 -51.7 28.5 76.8 4.3 -44.2 -45.9 19.5 Q4 -107.5 -108.6 -2.5 -2.3 -2.2 0.0 20.7 -44.3 34.2 53.3 -20.7 -96.5 -117.6 -45.02014 Q1 115.8 94.4 14.7 0.6 0.5 0.1 114.4 -21.1 19.5 114.4 9.9 -54.4 1.1 26.4 Q2 248.3 162.8 91.1 3.5 2.6 0.9 77.5 16.7 133.3 136.3 -10.1 35.4 9.9 12.1 Q3 . . . . . . . . . . . . . .
Annual growth rates (in percentage) 3)
2013 Q3 . . . - - - . . . . - . . . Q4 . . . - - - . . . . - . . . 2014 Q1 4.9 2.0 2.3 - - - 6.2 7.0 4.0 3.5 - 4.0 -5.7 1.2 Q2 4.8 2.2 2.1 - - - 3.9 3.4 6.3 5.2 - 4.2 -4.4 1.0 Q3 5.2 2.9 1.8 - - - 3.5 2.8 6.5 5.2 - 6.1 -1.4 0.3
Source: ECB.1) Data for reference periods before 2013 are expected to be available in the first quarter of 2015.2) Net financial derivatives are included in total assets.3) See the Technical Notes.
7.2 Current and capital accounts 1) (EUR billions)
S 62ECBMonthly BulletinDecember 2014
3. Investment income(transactions)
Total Direct investment Portfolio investment Other investment Reserve
assets
Credit Debit Equity Debt instruments Equity Debt securities Credit Debit Credit
Credit Debit Credit Debit Credit Debit Credit Debit
Reinv. Reinv.earnings earnings
1 2 3 4 5 6 7 8 9 10 11 12 13 14 15 2011 . . . . . . . . . . . . . . . 2012 . . . . . . . . . . . . . . . 2013 535.2 510.0 271.7 32.1 183.0 38.7 64.1 50.9 45.5 111.7 102.6 110.2 48.7 54.2 2.7 2013 Q3 133.0 124.7 67.1 17.0 47.5 16.4 15.2 12.3 12.7 25.3 25.7 27.0 11.6 12.7 0.7 Q4 132.9 119.2 67.5 -9.3 45.8 -3.5 17.3 13.1 9.9 19.5 25.5 27.1 12.0 13.6 0.7 2014 Q1 125.3 115.5 61.8 17.9 40.6 12.5 16.2 13.9 11.2 20.2 24.9 27.3 10.5 13.4 0.7 Q2 140.7 152.1 70.9 7.6 42.5 8.2 15.1 14.5 18.2 56.5 25.4 25.5 10.4 13.2 0.7 Q3 125.6 105.3 61.0 13.2 35.3 13.2 12.3 9.8 14.5 22.7 25.6 25.4 11.6 12.1 0.7
4. Geographical breakdown(four-quarter cumulated transactions)
Total EU Member States outside the euro area Brazil Canada China India Japan Russia Switzer- United Other
land States countries 2
Total United Other EU EUKingdom countries insti-
2013 Q3 to tutions2014 Q2 1 2 3 4 5 6 7 8 9 10 11 12 13 14
Credits
Current account 3,260.0 1,044.1 493.8 485.0 65.2 58.3 46.2 165.6 37.5 76.0 120.9 264.3 437.4 1,009.6 Goods 1,908.1 607.7 253.8 353.3 0.5 31.6 24.1 130.4 27.6 43.2 82.0 105.7 224.2 631.6 Services 665.6 202.3 123.5 71.1 7.7 10.7 10.8 20.4 7.4 16.2 21.1 74.2 106.1 196.5 Primary income 601.6 195.6 91.9 54.8 48.9 15.5 10.7 14.3 2.2 13.0 17.2 71.4 96.0 165.6 Investment income 531.8 150.0 89.4 53.8 6.8 15.3 10.6 14.2 2.2 12.9 17.2 55.0 94.4 160.1 Secondary income 84.6 35.7 24.6 3.0 8.1 0.6 0.6 0.6 0.2 3.7 0.6 13.1 11.0 18.6 Capital account 40.4 31.1 5.0 0.7 25.3 0.0 0.0 0.7 0.1 0.3 0.1 2.9 0.5 4.8
Debits
Current account 3,052.5 Goods 1,700.4 477.9 164.3 313.6 0.0 25.3 14.5 199.8 25.2 42.2 133.1 96.8 141.2 544.4 Services 578.0 167.7 92.9 73.6 1.3 5.3 8.2 16.4 7.0 10.1 10.4 50.5 125.4 177.1 Primary income 541.7 Investment income 511.5 Secondary income 232.4 130.2 24.1 6.4 99.8 1.7 1.1 2.5 1.1 3.4 0.8 14.4 16.4 60.7 Capital account 17.9 6.4 4.6 1.5 0.4 0.2 0.4 0.2 0.1 0.0 0.0 0.7 1.8 7.9
Net
Current account 207.4 Goods 207.7 129.7 89.5 39.7 0.5 6.4 9.6 -69.3 2.4 0.9 -51.1 8.9 83.0 87.2 Services 87.6 34.6 30.6 -2.4 6.4 5.4 2.6 3.9 0.4 6.1 10.7 23.7 -19.3 19.4 Primary income 59.9 Investment income 20.3 Secondary income -147.8 -91.8 0.5 -0.6 -91.6 -1.1 -0.6 -1.9 -0.9 0.2 -0.3 -1.3 -5.3 -44.8 Capital account 22.6 42.5 0.5 17.1 25.0 -0.2 -0.4 0.5 0.0 0.3 0.1 2.1 -1.3 -21.0
Source: ECB.1) Data for reference periods before 2013 are expected to be available in the first quarter of 2015.2) All income on reserve assets is allocated to other countries
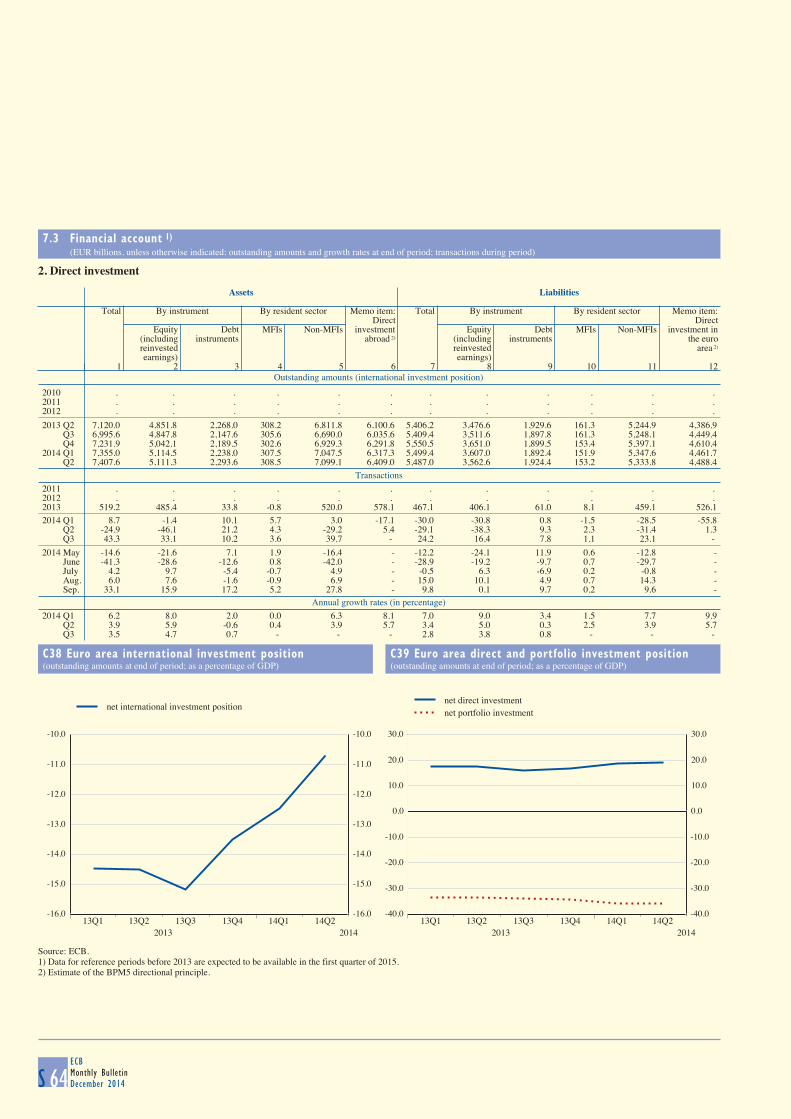
7.3 Financial account 1) (EUR billions, unless otherwise indicated; outstanding amounts and growth rates at end of period; transactions during period)
S 64ECBMonthly BulletinDecember 2014
2. Direct investment
Outstanding amounts (international investment position)
Assets Liabilities
Total By instrument By resident sector Memo item: Total By instrument By resident sector Memo item:
Direct DirectEquity Debt MFIs Non-MFIs investment Equity Debt MFIs Non-MFIs investment in
(including instruments abroad 2) (including instruments the euroreinvested reinvested area 2)
earnings) earnings)1 2 3 4 5 6 7 8 9 10 11 12
2010 . . . . . . . . . . . . 2011 . . . . . . . . . . . . 2012 . . . . . . . . . . . .
2013 Q2 7,120.0 4,851.8 2,268.0 308.2 6,811.8 6,100.6 5,406.2 3,476.6 1,929.6 161.3 5,244.9 4,386.9 Q3 6,995.6 4,847.8 2,147.6 305.6 6,690.0 6,035.6 5,409.4 3,511.6 1,897.8 161.3 5,248.1 4,449.4 Q4 7,231.9 5,042.1 2,189.5 302.6 6,929.3 6,291.8 5,550.5 3,651.0 1,899.5 153.4 5,397.1 4,610.42014 Q1 7,355.0 5,114.5 2,238.0 307.5 7,047.5 6,317.3 5,499.4 3,607.0 1,892.4 151.9 5,347.6 4,461.7 Q2 7,407.6 5,111.3 2,293.6 308.5 7,099.1 6,409.0 5,487.0 3,562.6 1,924.4 153.2 5,333.8 4,488.4
Transactions
2011 . . . . . . . . . . . . 2012 . . . . . . . . . . . . 2013 519.2 485.4 33.8 -0.8 520.0 578.1 467.1 406.1 61.0 8.1 459.1 526.12014 Q1 8.7 -1.4 10.1 5.7 3.0 -17.1 -30.0 -30.8 0.8 -1.5 -28.5 -55.8 Q2 -24.9 -46.1 21.2 4.3 -29.2 5.4 -29.1 -38.3 9.3 2.3 -31.4 1.3 Q3 43.3 33.1 10.2 3.6 39.7 - 24.2 16.4 7.8 1.1 23.1 -
2014 May -14.6 -21.6 7.1 1.9 -16.4 - -12.2 -24.1 11.9 0.6 -12.8 - June -41.3 -28.6 -12.6 0.8 -42.0 - -28.9 -19.2 -9.7 0.7 -29.7 - July 4.2 9.7 -5.4 -0.7 4.9 - -0.5 6.3 -6.9 0.2 -0.8 - Aug. 6.0 7.6 -1.6 -0.9 6.9 - 15.0 10.1 4.9 0.7 14.3 - Sep. 33.1 15.9 17.2 5.2 27.8 - 9.8 0.1 9.7 0.2 9.6 -
Annual growth rates (in percentage)
2014 Q1 6.2 8.0 2.0 0.0 6.3 8.1 7.0 9.0 3.4 1.5 7.7 9.9 Q2 3.9 5.9 -0.6 0.4 3.9 5.7 3.4 5.0 0.3 2.5 3.9 5.7 Q3 3.5 4.7 0.7 - - - 2.8 3.8 0.8 - - -
C38 Euro area international investment position
(outstanding amounts at end of period; as a percentage of GDP)
C39 Euro area direct and portfolio investment position
(outstanding amounts at end of period; as a percentage of GDP)
-16.0
-15.0
-14.0
-13.0
-12.0
-11.0
-10.0
13Q1 13Q2 13Q3 13Q4 14Q1 14Q22013 2014
-16.0
-15.0
-14.0
-13.0
-12.0
-11.0
-10.0
net international investment position
-40.0
-30.0
-20.0
-10.0
0.0
10.0
20.0
30.0
13Q1 13Q2 13Q3 13Q4 14Q1 14Q22013 2014
-40.0
-30.0
-20.0
-10.0
0.0
10.0
20.0
30.0
net direct investmentnet portfolio investment
Source: ECB.1) Data for reference periods before 2013 are expected to be available in the first quarter of 2015.2) Estimate of the BPM5 directional principle.
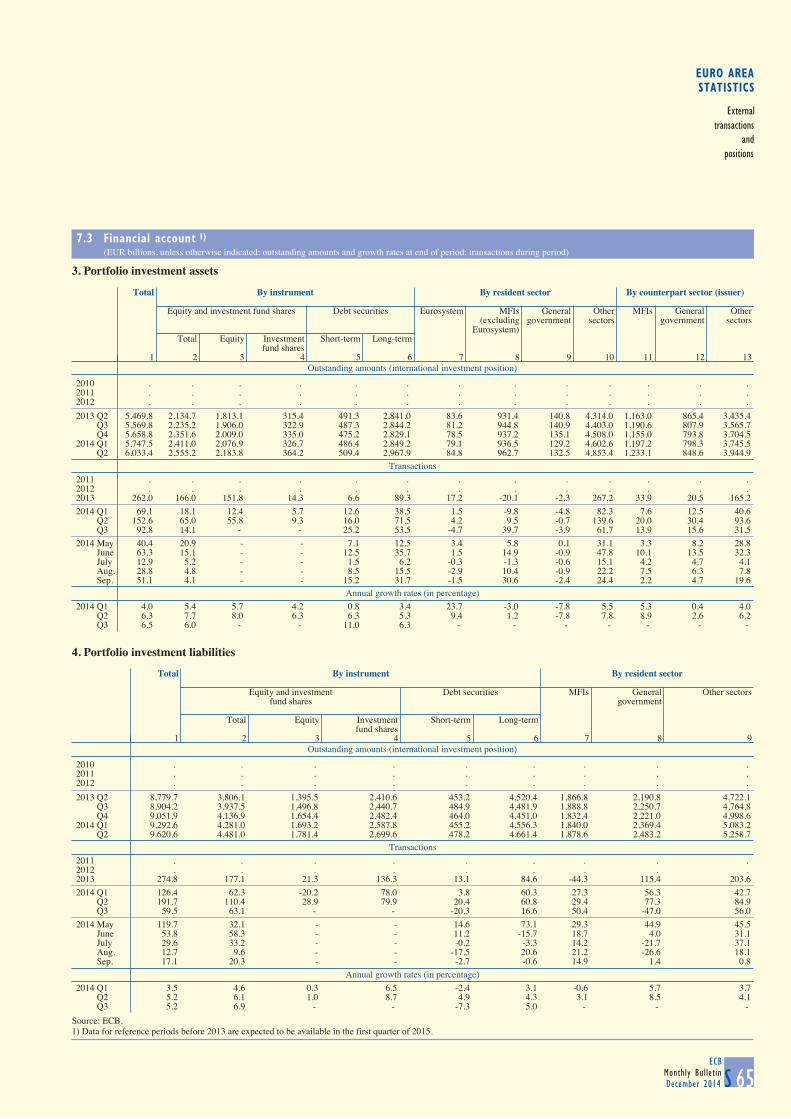
EURO AREASTATISTICS
Externaltransactions
andpositions
7.3 Financial account 1) (EUR billions, unless otherwise indicated; outstanding amounts and growth rates at end of period; transactions during period)
S 65ECB
Monthly BulletinDecember 2014
3. Portfolio investment assets
Outstanding amounts (international investment position)
Total By instrument By resident sector By counterpart sector (issuer)
Equity and investment fund shares Debt securities Eurosystem MFIs General Other MFIs General Other
(excluding government sectors government sectorsEurosystem)
Total Equity Investment Short-term Long-termfund shares
1 2 3 4 5 6 7 8 9 10 11 12 13
2010 . . . . . . . . . . . . . 2011 . . . . . . . . . . . . . 2012 . . . . . . . . . . . . .
2013 Q2 5,469.8 2,134.7 1,813.1 315.4 491.3 2,841.0 83.6 931.4 140.8 4,314.0 1,163.0 865.4 3,435.4 Q3 5,569.8 2,235.2 1,906.0 322.9 487.3 2,844.2 81.2 944.8 140.9 4,403.0 1,190.6 807.9 3,565.7 Q4 5,658.8 2,351.6 2,009.0 335.0 475.2 2,829.1 78.5 937.2 135.1 4,508.0 1,155.0 793.8 3,704.52014 Q1 5,747.5 2,411.0 2,076.9 326.7 486.4 2,849.2 79.1 936.5 129.2 4,602.6 1,197.2 798.3 3,745.5 Q2 6,033.4 2,555.2 2,183.8 364.2 509.4 2,967.9 84.8 962.7 132.5 4,853.4 1,233.1 848.6 3,944.9
Transactions
2011 . . . . . . . . . . . . . 2012 . . . . . . . . . . . . . 2013 262.0 166.0 151.8 14.3 6.6 89.3 17.2 -20.1 -2.3 267.2 33.9 20.5 165.2
2014 Q1 69.1 18.1 12.4 5.7 12.6 38.5 1.5 -9.8 -4.8 82.3 7.6 12.5 40.6 Q2 152.6 65.0 55.8 9.3 16.0 71.5 4.2 9.5 -0.7 139.6 20.0 30.4 93.6 Q3 92.8 14.1 - - 25.2 53.5 -4.7 39.7 -3.9 61.7 13.9 15.6 31.5
2014 May 40.4 20.9 - - 7.1 12.5 3.4 5.8 0.1 31.1 3.3 8.2 28.8 June 63.3 15.1 - - 12.5 35.7 1.5 14.9 -0.9 47.8 10.1 13.5 32.3 July 12.9 5.2 - - 1.5 6.2 -0.3 -1.3 -0.6 15.1 4.2 4.7 4.1 Aug. 28.8 4.8 - - 8.5 15.5 -2.9 10.4 -0.9 22.2 7.5 6.3 7.8 Sep. 51.1 4.1 - - 15.2 31.7 -1.5 30.6 -2.4 24.4 2.2 4.7 19.6
Annual growth rates (in percentage)
2014 Q1 4.0 5.4 5.7 4.2 0.8 3.4 23.7 -3.0 -7.8 5.5 5.3 0.4 4.0 Q2 6.3 7.7 8.0 6.3 6.3 5.3 9.4 1.2 -7.8 7.8 8.9 2.6 6.2 Q3 6.5 6.0 - - 11.0 6.3 - - - - - - -
4. Portfolio investment liabilities
Outstanding amounts (international investment position)
Total By instrument By resident sector
Equity and investment Debt securities MFIs General Other sectors
fund shares government
Total Equity Investment Short-term Long-termfund shares
1 2 3 4 5 6 7 8 9
2010 . . . . . . . . . 2011 . . . . . . . . . 2012 . . . . . . . . .
2013 Q2 8,779.7 3,806.1 1,395.5 2,410.6 453.2 4,520.4 1,866.8 2,190.8 4,722.1 Q3 8,904.2 3,937.5 1,496.8 2,440.7 484.9 4,481.9 1,888.8 2,250.7 4,764.8 Q4 9,051.9 4,136.9 1,654.4 2,482.4 464.0 4,451.0 1,832.4 2,221.0 4,998.62014 Q1 9,292.6 4,281.0 1,693.2 2,587.8 455.2 4,556.3 1,840.0 2,369.4 5,083.2 Q2 9,620.6 4,481.0 1,781.4 2,699.6 478.2 4,661.4 1,878.6 2,483.2 5,258.7
Transactions
2011 . . . . . . . . . 2012 . . . . . . . . . 2013 274.8 177.1 21.3 136.3 13.1 84.6 -44.3 115.4 203.6
2014 Q1 126.4 62.3 -20.2 78.0 3.8 60.3 27.3 56.3 42.7 Q2 191.7 110.4 28.9 79.9 20.4 60.8 29.4 77.3 84.9 Q3 59.5 63.1 - - -20.3 16.6 50.4 -47.0 56.0
2014 May 119.7 32.1 - - 14.6 73.1 29.3 44.9 45.5 June 53.8 58.3 - - 11.2 -15.7 18.7 4.0 31.1 July 29.6 33.2 - - -0.2 -3.3 14.2 -21.7 37.1 Aug. 12.7 9.6 - - -17.5 20.6 21.2 -26.6 18.1 Sep. 17.1 20.3 - - -2.7 -0.6 14.9 1.4 0.8
Annual growth rates (in percentage)
2014 Q1 3.5 4.6 0.3 6.5 -2.4 3.1 -0.6 5.7 3.7 Q2 5.2 6.1 1.0 8.7 4.9 4.3 3.1 8.5 4.1 Q3 5.2 6.9 - - -7.3 5.0 - - -
Source: ECB.1) Data for reference periods before 2013 are expected to be available in the first quarter of 2015.
7.3 Financial account 1) (EUR billions, unless otherwise indicated; outstanding amounts and growth rates at end of period; transactions during period)
S 64ECBMonthly BulletinDecember 2014
2. Direct investment
Outstanding amounts (international investment position)
Assets Liabilities
Total By instrument By resident sector Memo item: Total By instrument By resident sector Memo item:
Direct DirectEquity Debt MFIs Non-MFIs investment Equity Debt MFIs Non-MFIs investment in
(including instruments abroad 2) (including instruments the euroreinvested reinvested area 2)
earnings) earnings)1 2 3 4 5 6 7 8 9 10 11 12
2010 . . . . . . . . . . . . 2011 . . . . . . . . . . . . 2012 . . . . . . . . . . . .
2013 Q2 7,120.0 4,851.8 2,268.0 308.2 6,811.8 6,100.6 5,406.2 3,476.6 1,929.6 161.3 5,244.9 4,386.9 Q3 6,995.6 4,847.8 2,147.6 305.6 6,690.0 6,035.6 5,409.4 3,511.6 1,897.8 161.3 5,248.1 4,449.4 Q4 7,231.9 5,042.1 2,189.5 302.6 6,929.3 6,291.8 5,550.5 3,651.0 1,899.5 153.4 5,397.1 4,610.42014 Q1 7,355.0 5,114.5 2,238.0 307.5 7,047.5 6,317.3 5,499.4 3,607.0 1,892.4 151.9 5,347.6 4,461.7 Q2 7,407.6 5,111.3 2,293.6 308.5 7,099.1 6,409.0 5,487.0 3,562.6 1,924.4 153.2 5,333.8 4,488.4
Transactions
2011 . . . . . . . . . . . . 2012 . . . . . . . . . . . . 2013 519.2 485.4 33.8 -0.8 520.0 578.1 467.1 406.1 61.0 8.1 459.1 526.12014 Q1 8.7 -1.4 10.1 5.7 3.0 -17.1 -30.0 -30.8 0.8 -1.5 -28.5 -55.8 Q2 -24.9 -46.1 21.2 4.3 -29.2 5.4 -29.1 -38.3 9.3 2.3 -31.4 1.3 Q3 43.3 33.1 10.2 3.6 39.7 - 24.2 16.4 7.8 1.1 23.1 -
2014 May -14.6 -21.6 7.1 1.9 -16.4 - -12.2 -24.1 11.9 0.6 -12.8 - June -41.3 -28.6 -12.6 0.8 -42.0 - -28.9 -19.2 -9.7 0.7 -29.7 - July 4.2 9.7 -5.4 -0.7 4.9 - -0.5 6.3 -6.9 0.2 -0.8 - Aug. 6.0 7.6 -1.6 -0.9 6.9 - 15.0 10.1 4.9 0.7 14.3 - Sep. 33.1 15.9 17.2 5.2 27.8 - 9.8 0.1 9.7 0.2 9.6 -
Annual growth rates (in percentage)
2014 Q1 6.2 8.0 2.0 0.0 6.3 8.1 7.0 9.0 3.4 1.5 7.7 9.9 Q2 3.9 5.9 -0.6 0.4 3.9 5.7 3.4 5.0 0.3 2.5 3.9 5.7 Q3 3.5 4.7 0.7 - - - 2.8 3.8 0.8 - - -
C38 Euro area international investment position
(outstanding amounts at end of period; as a percentage of GDP)
C39 Euro area direct and portfolio investment position
(outstanding amounts at end of period; as a percentage of GDP)
-16.0
-15.0
-14.0
-13.0
-12.0
-11.0
-10.0
13Q1 13Q2 13Q3 13Q4 14Q1 14Q22013 2014
-16.0
-15.0
-14.0
-13.0
-12.0
-11.0
-10.0
net international investment position
-40.0
-30.0
-20.0
-10.0
0.0
10.0
20.0
30.0
13Q1 13Q2 13Q3 13Q4 14Q1 14Q22013 2014
-40.0
-30.0
-20.0
-10.0
0.0
10.0
20.0
30.0
net direct investmentnet portfolio investment
Source: ECB.1) Data for reference periods before 2013 are expected to be available in the first quarter of 2015.2) Estimate of the BPM5 directional principle.
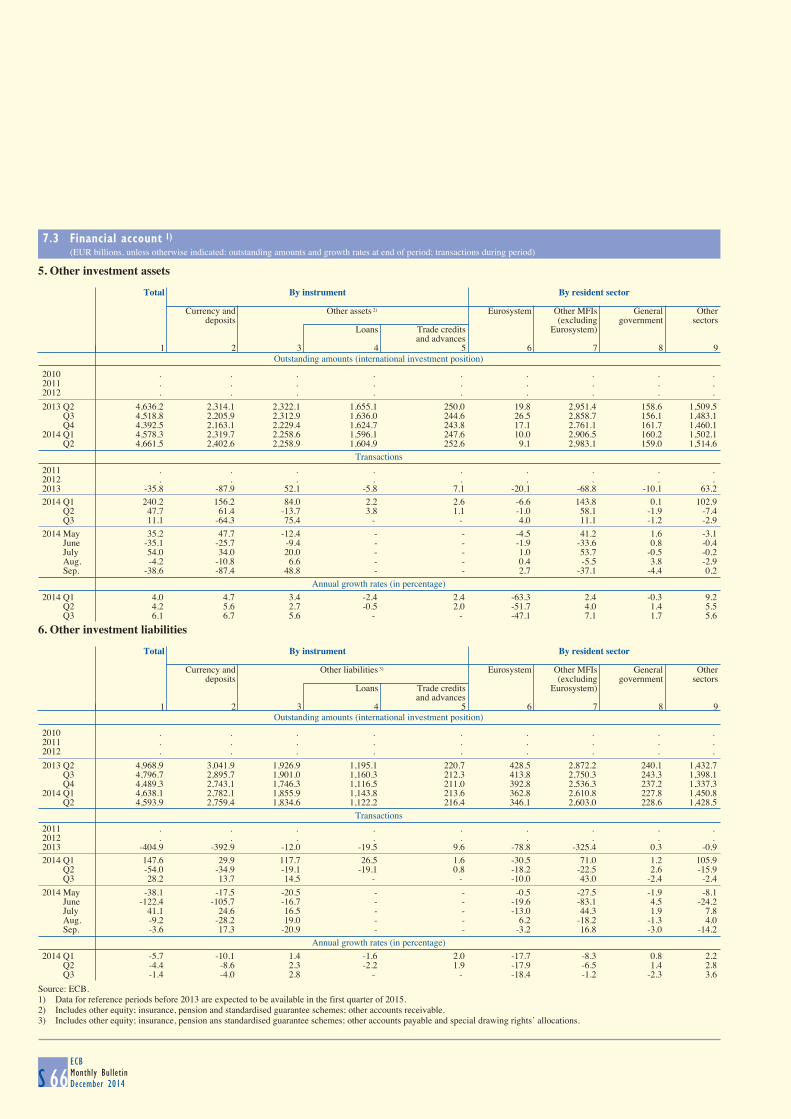
7.3 Financial account 1) (EUR billions, unless otherwise indicated; outstanding amounts and growth rates at end of period; transactions during period)
S 66ECBMonthly BulletinDecember 2014
5. Other investment assets
Outstanding amounts (international investment position)
Total By instrument By resident sector
Currency and Other assets 2) Eurosystem Other MFIs General Other
deposits (excluding government sectorsLoans Trade credits Eurosystem)
and advances1 2 3 4 5 6 7 8 9
2010 . . . . . . . . . 2011 . . . . . . . . . 2012 . . . . . . . . .
2013 Q2 4,636.2 2,314.1 2,322.1 1,655.1 250.0 19.8 2,951.4 158.6 1,509.5 Q3 4,518.8 2,205.9 2,312.9 1,636.0 244.6 26.5 2,858.7 156.1 1,483.1 Q4 4,392.5 2,163.1 2,229.4 1,624.7 243.8 17.1 2,761.1 161.7 1,460.12014 Q1 4,578.3 2,319.7 2,258.6 1,596.1 247.6 10.0 2,906.5 160.2 1,502.1 Q2 4,661.5 2,402.6 2,258.9 1,604.9 252.6 9.1 2,983.1 159.0 1,514.6
Transactions
2011 . . . . . . . . . 2012 . . . . . . . . . 2013 -35.8 -87.9 52.1 -5.8 7.1 -20.1 -68.8 -10.1 63.22014 Q1 240.2 156.2 84.0 2.2 2.6 -6.6 143.8 0.1 102.9 Q2 47.7 61.4 -13.7 3.8 1.1 -1.0 58.1 -1.9 -7.4 Q3 11.1 -64.3 75.4 - - 4.0 11.1 -1.2 -2.9
2014 May 35.2 47.7 -12.4 - - -4.5 41.2 1.6 -3.1 June -35.1 -25.7 -9.4 - - -1.9 -33.6 0.8 -0.4 July 54.0 34.0 20.0 - - 1.0 53.7 -0.5 -0.2 Aug. -4.2 -10.8 6.6 - - 0.4 -5.5 3.8 -2.9 Sep. -38.6 -87.4 48.8 - - 2.7 -37.1 -4.4 0.2
Annual growth rates (in percentage)
2014 Q1 4.0 4.7 3.4 -2.4 2.4 -63.3 2.4 -0.3 9.2 Q2 4.2 5.6 2.7 -0.5 2.0 -51.7 4.0 1.4 5.5 Q3 6.1 6.7 5.6 - - -47.1 7.1 1.7 5.6
6. Other investment liabilities
Outstanding amounts (international investment position)
Total By instrument By resident sector
Currency and Other liabilities 3) Eurosystem Other MFIs General Other
deposits (excluding government sectorsLoans Trade credits Eurosystem)
and advances1 2 3 4 5 6 7 8 9
2010 . . . . . . . . . 2011 . . . . . . . . . 2012 . . . . . . . . .
2013 Q2 4,968.9 3,041.9 1,926.9 1,195.1 220.7 428.5 2,872.2 240.1 1,432.7 Q3 4,796.7 2,895.7 1,901.0 1,160.3 212.3 413.8 2,750.3 243.3 1,398.1 Q4 4,489.3 2,743.1 1,746.3 1,116.5 211.0 392.8 2,536.3 237.2 1,337.32014 Q1 4,638.1 2,782.1 1,855.9 1,143.8 213.6 362.8 2,610.8 227.8 1,450.8 Q2 4,593.9 2,759.4 1,834.6 1,122.2 216.4 346.1 2,603.0 228.6 1,428.5
Transactions
2011 . . . . . . . . . 2012 . . . . . . . . . 2013 -404.9 -392.9 -12.0 -19.5 9.6 -78.8 -325.4 0.3 -0.92014 Q1 147.6 29.9 117.7 26.5 1.6 -30.5 71.0 1.2 105.9 Q2 -54.0 -34.9 -19.1 -19.1 0.8 -18.2 -22.5 2.6 -15.9 Q3 28.2 13.7 14.5 - - -10.0 43.0 -2.4 -2.4
2014 May -38.1 -17.5 -20.5 - - -0.5 -27.5 -1.9 -8.1 June -122.4 -105.7 -16.7 - - -19.6 -83.1 4.5 -24.2 July 41.1 24.6 16.5 - - -13.0 44.3 1.9 7.8 Aug. -9.2 -28.2 19.0 - - 6.2 -18.2 -1.3 4.0 Sep. -3.6 17.3 -20.9 - - -3.2 16.8 -3.0 -14.2
Annual growth rates (in percentage)
2014 Q1 -5.7 -10.1 1.4 -1.6 2.0 -17.7 -8.3 0.8 2.2 Q2 -4.4 -8.6 2.3 -2.2 1.9 -17.9 -6.5 1.4 2.8 Q3 -1.4 -4.0 2.8 - - -18.4 -1.2 -2.3 3.6
Source: ECB.1) Data for reference periods before 2013 are expected to be available in the first quarter of 2015.2) Includes other equity; insurance, pension and standardised guarantee schemes; other accounts receivable.3) Includes other equity; insurance, pension ans standardised guarantee schemes; other accounts payable and special drawing rights’ allocations.
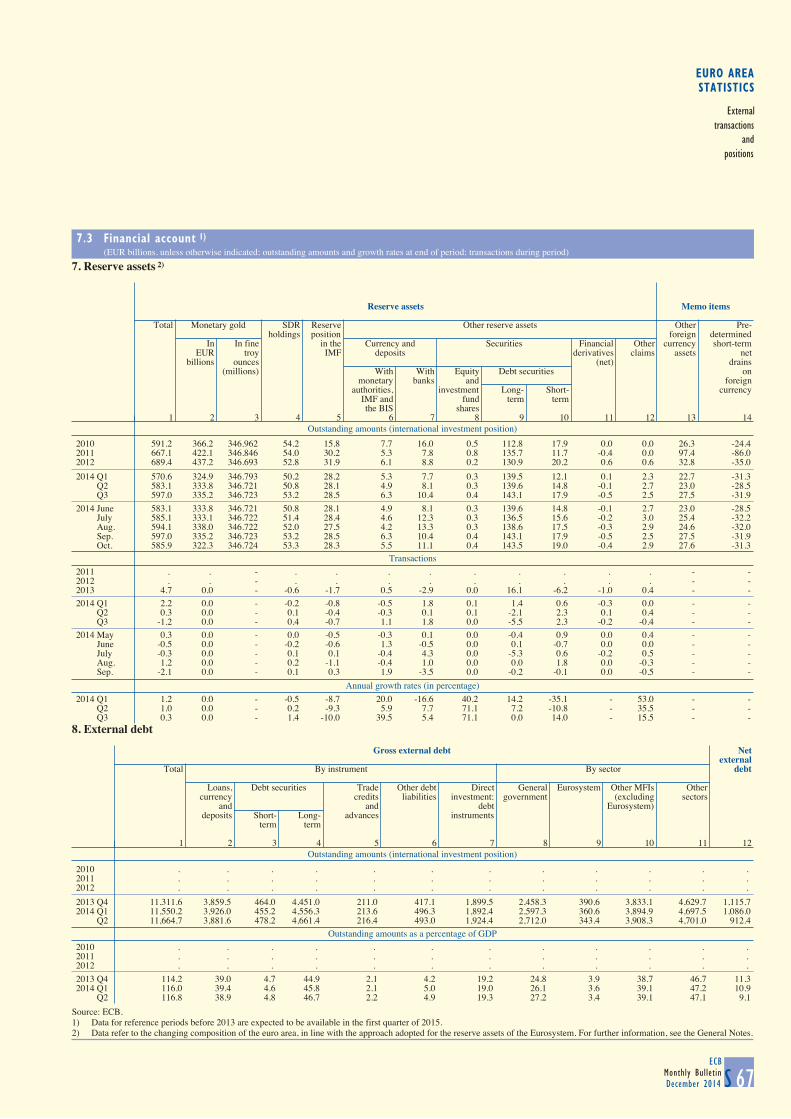
EURO AREASTATISTICS
Externaltransactions
andpositions
7.3 Financial account 1) (EUR billions, unless otherwise indicated; outstanding amounts and growth rates at end of period; transactions during period)
S 67ECB
Monthly BulletinDecember 2014
7. Reserve assets 2)
Outstanding amounts (international investment position)
Reserve assets Memo items
Total Monetary gold SDR Reserve Other reserve assets Other Pre-holdings position foreign determined
In In fine in the Currency and Securities Financial Other currency short-termEUR troy IMF deposits derivatives claims assets net
billions ounces (net) drains(millions) With With Equity Debt securities on
monetary banks and foreignauthorities, investment Long- Short- currency
IMF and fund term termthe BIS shares
1 2 3 4 5 6 7 8 9 10 11 12 13 14
2010 591.2 366.2 346.962 54.2 15.8 7.7 16.0 0.5 112.8 17.9 0.0 0.0 26.3 -24.42011 667.1 422.1 346.846 54.0 30.2 5.3 7.8 0.8 135.7 11.7 -0.4 0.0 97.4 -86.02012 689.4 437.2 346.693 52.8 31.9 6.1 8.8 0.2 130.9 20.2 0.6 0.6 32.8 -35.0
2014 Q1 570.6 324.9 346.793 50.2 28.2 5.3 7.7 0.3 139.5 12.1 0.1 2.3 22.7 -31.3 Q2 583.1 333.8 346.721 50.8 28.1 4.9 8.1 0.3 139.6 14.8 -0.1 2.7 23.0 -28.5 Q3 597.0 335.2 346.723 53.2 28.5 6.3 10.4 0.4 143.1 17.9 -0.5 2.5 27.5 -31.9
2014 June 583.1 333.8 346.721 50.8 28.1 4.9 8.1 0.3 139.6 14.8 -0.1 2.7 23.0 -28.5 July 585.1 333.1 346.722 51.4 28.4 4.6 12.3 0.3 136.5 15.6 -0.2 3.0 25.4 -32.2 Aug. 594.1 338.0 346.722 52.0 27.5 4.2 13.3 0.3 138.6 17.5 -0.3 2.9 24.6 -32.0 Sep. 597.0 335.2 346.723 53.2 28.5 6.3 10.4 0.4 143.1 17.9 -0.5 2.5 27.5 -31.9 Oct. 585.9 322.3 346.724 53.3 28.3 5.5 11.1 0.4 143.5 19.0 -0.4 2.9 27.6 -31.3
Transactions
2011 . . - . . . . . . . . . - -2012 . . - . . . . . . . . . - -2013 4.7 0.0 - -0.6 -1.7 0.5 -2.9 0.0 16.1 -6.2 -1.0 0.4 - -2014 Q1 2.2 0.0 - -0.2 -0.8 -0.5 1.8 0.1 1.4 0.6 -0.3 0.0 - - Q2 0.3 0.0 - 0.1 -0.4 -0.3 0.1 0.1 -2.1 2.3 0.1 0.4 - - Q3 -1.2 0.0 - 0.4 -0.7 1.1 1.8 0.0 -5.5 2.3 -0.2 -0.4 - -2014 May 0.3 0.0 - 0.0 -0.5 -0.3 0.1 0.0 -0.4 0.9 0.0 0.4 - - June -0.5 0.0 - -0.2 -0.6 1.3 -0.5 0.0 0.1 -0.7 0.0 0.0 - - July -0.3 0.0 - 0.1 0.1 -0.4 4.3 0.0 -5.3 0.6 -0.2 0.5 - - Aug. 1.2 0.0 - 0.2 -1.1 -0.4 1.0 0.0 0.0 1.8 0.0 -0.3 - - Sep. -2.1 0.0 - 0.1 0.3 1.9 -3.5 0.0 -0.2 -0.1 0.0 -0.5 - -
Annual growth rates (in percentage)
2014 Q1 1.2 0.0 - -0.5 -8.7 20.0 -16.6 40.2 14.2 -35.1 - 53.0 - - Q2 1.0 0.0 - 0.2 -9.3 5.9 7.7 71.1 7.2 -10.8 - 35.5 - - Q3 0.3 0.0 - 1.4 -10.0 39.5 5.4 71.1 0.0 14.0 - 15.5 - -
8. External debt
Outstanding amounts (international investment position)
Gross external debt Net
externalTotal By instrument By sector debt
Loans, Debt securities Trade Other debt Direct General Eurosystem Other MFIs Other
currency credits liabilities investment: government (excluding sectorsand and debt Eurosystem)
deposits Short- Long- advances instrumentsterm term
1 2 3 4 5 6 7 8 9 10 11 12
2010 . . . . . . . . . . . . 2011 . . . . . . . . . . . . 2012 . . . . . . . . . . . .
2013 Q4 11,311.6 3,859.5 464.0 4,451.0 211.0 417.1 1,899.5 2,458.3 390.6 3,833.1 4,629.7 1,115.72014 Q1 11,550.2 3,926.0 455.2 4,556.3 213.6 496.3 1,892.4 2,597.3 360.6 3,894.9 4,697.5 1,086.0 Q2 11,664.7 3,881.6 478.2 4,661.4 216.4 493.0 1,924.4 2,712.0 343.4 3,908.3 4,701.0 912.4
Outstanding amounts as a percentage of GDP
2010 . . . . . . . . . . . . 2011 . . . . . . . . . . . . 2012 . . . . . . . . . . . .
2013 Q4 114.2 39.0 4.7 44.9 2.1 4.2 19.2 24.8 3.9 38.7 46.7 11.32014 Q1 116.0 39.4 4.6 45.8 2.1 5.0 19.0 26.1 3.6 39.1 47.2 10.9 Q2 116.8 38.9 4.8 46.7 2.2 4.9 19.3 27.2 3.4 39.1 47.1 9.1
Source: ECB.1) Data for reference periods before 2013 are expected to be available in the first quarter of 2015.2) Data refer to the changing composition of the euro area, in line with the approach adopted for the reserve assets of the Eurosystem. For further information, see the General Notes.
7.3 Financial account 1) (EUR billions, unless otherwise indicated; outstanding amounts and growth rates at end of period; transactions during period)
S 66ECBMonthly BulletinDecember 2014
5. Other investment assets
Outstanding amounts (international investment position)
Total By instrument By resident sector
Currency and Other assets 2) Eurosystem Other MFIs General Other
deposits (excluding government sectorsLoans Trade credits Eurosystem)
and advances1 2 3 4 5 6 7 8 9
2010 . . . . . . . . . 2011 . . . . . . . . . 2012 . . . . . . . . .
2013 Q2 4,636.2 2,314.1 2,322.1 1,655.1 250.0 19.8 2,951.4 158.6 1,509.5 Q3 4,518.8 2,205.9 2,312.9 1,636.0 244.6 26.5 2,858.7 156.1 1,483.1 Q4 4,392.5 2,163.1 2,229.4 1,624.7 243.8 17.1 2,761.1 161.7 1,460.12014 Q1 4,578.3 2,319.7 2,258.6 1,596.1 247.6 10.0 2,906.5 160.2 1,502.1 Q2 4,661.5 2,402.6 2,258.9 1,604.9 252.6 9.1 2,983.1 159.0 1,514.6
Transactions
2011 . . . . . . . . . 2012 . . . . . . . . . 2013 -35.8 -87.9 52.1 -5.8 7.1 -20.1 -68.8 -10.1 63.22014 Q1 240.2 156.2 84.0 2.2 2.6 -6.6 143.8 0.1 102.9 Q2 47.7 61.4 -13.7 3.8 1.1 -1.0 58.1 -1.9 -7.4 Q3 11.1 -64.3 75.4 - - 4.0 11.1 -1.2 -2.9
2014 May 35.2 47.7 -12.4 - - -4.5 41.2 1.6 -3.1 June -35.1 -25.7 -9.4 - - -1.9 -33.6 0.8 -0.4 July 54.0 34.0 20.0 - - 1.0 53.7 -0.5 -0.2 Aug. -4.2 -10.8 6.6 - - 0.4 -5.5 3.8 -2.9 Sep. -38.6 -87.4 48.8 - - 2.7 -37.1 -4.4 0.2
Annual growth rates (in percentage)
2014 Q1 4.0 4.7 3.4 -2.4 2.4 -63.3 2.4 -0.3 9.2 Q2 4.2 5.6 2.7 -0.5 2.0 -51.7 4.0 1.4 5.5 Q3 6.1 6.7 5.6 - - -47.1 7.1 1.7 5.6
6. Other investment liabilities
Outstanding amounts (international investment position)
Total By instrument By resident sector
Currency and Other liabilities 3) Eurosystem Other MFIs General Other
deposits (excluding government sectorsLoans Trade credits Eurosystem)
and advances1 2 3 4 5 6 7 8 9
2010 . . . . . . . . . 2011 . . . . . . . . . 2012 . . . . . . . . .
2013 Q2 4,968.9 3,041.9 1,926.9 1,195.1 220.7 428.5 2,872.2 240.1 1,432.7 Q3 4,796.7 2,895.7 1,901.0 1,160.3 212.3 413.8 2,750.3 243.3 1,398.1 Q4 4,489.3 2,743.1 1,746.3 1,116.5 211.0 392.8 2,536.3 237.2 1,337.32014 Q1 4,638.1 2,782.1 1,855.9 1,143.8 213.6 362.8 2,610.8 227.8 1,450.8 Q2 4,593.9 2,759.4 1,834.6 1,122.2 216.4 346.1 2,603.0 228.6 1,428.5
Transactions
2011 . . . . . . . . . 2012 . . . . . . . . . 2013 -404.9 -392.9 -12.0 -19.5 9.6 -78.8 -325.4 0.3 -0.92014 Q1 147.6 29.9 117.7 26.5 1.6 -30.5 71.0 1.2 105.9 Q2 -54.0 -34.9 -19.1 -19.1 0.8 -18.2 -22.5 2.6 -15.9 Q3 28.2 13.7 14.5 - - -10.0 43.0 -2.4 -2.4
2014 May -38.1 -17.5 -20.5 - - -0.5 -27.5 -1.9 -8.1 June -122.4 -105.7 -16.7 - - -19.6 -83.1 4.5 -24.2 July 41.1 24.6 16.5 - - -13.0 44.3 1.9 7.8 Aug. -9.2 -28.2 19.0 - - 6.2 -18.2 -1.3 4.0 Sep. -3.6 17.3 -20.9 - - -3.2 16.8 -3.0 -14.2
Annual growth rates (in percentage)
2014 Q1 -5.7 -10.1 1.4 -1.6 2.0 -17.7 -8.3 0.8 2.2 Q2 -4.4 -8.6 2.3 -2.2 1.9 -17.9 -6.5 1.4 2.8 Q3 -1.4 -4.0 2.8 - - -18.4 -1.2 -2.3 3.6
Source: ECB.1) Data for reference periods before 2013 are expected to be available in the first quarter of 2015.2) Includes other equity; insurance, pension and standardised guarantee schemes; other accounts receivable.3) Includes other equity; insurance, pension ans standardised guarantee schemes; other accounts payable and special drawing rights’ allocations.

7.3 Financial account (EUR billions; outstanding amounts at end of period; transactions during period)
S 68ECBMonthly BulletinDecember 2014
9. Geographical breakdown
Total Canada China Hong Japan Switzer- United Offshore Interna- Other EU Member States Kong land States financial tional countries
outside the euro area centres organisa-tions
Total United Other EUKingdom EU insti-
tutions1 2 3 4 5 6 7 8 9 10 11 12 13 14
2014 Q2 Outstanding amounts (international investment position)
Direct investment 1,920.6 799.6 519.1 282.2 -1.7 103.6 120.8 10.5 -44.8 228.9 68.0 -339.7 -0.3 974.0 Assets 7,407.6 2,221.7 1,579.4 642.2 0.1 235.3 152.3 56.9 126.1 727.0 1,665.6 635.3 0.2 1,587.2 Equity/reinvested earnings 5,111.3 1,494.8 1,048.6 446.2 0.0 172.9 119.7 37.9 95.5 483.1 1,123.0 478.1 0.1 1,106.2 Debt instruments 2,293.6 724.0 530.8 193.1 0.1 62.5 32.6 19.0 30.6 243.9 542.6 157.2 0.1 481.0 Liabilities 5,487.0 1,422.1 1,060.3 360.0 1.8 131.7 31.5 46.3 170.9 498.1 1,597.7 975.0 0.5 613.2 Equity/reinvested earnings 3,562.6 1,025.0 761.4 262.4 1.3 110.4 9.4 17.9 151.1 273.9 1,103.5 469.3 0.1 402.0 Debt instruments 1,924.4 397.0 298.9 97.6 0.5 21.3 22.1 28.4 19.9 224.2 494.1 505.7 0.4 211.2 Portfolio investment assets 6,033.4 1,899.4 1,006.8 659.3 233.3 121.3 60.5 59.6 301.4 181.9 1,935.5 419.7 40.0 1,014.0 Equity, investment fund shares 2,555.2 524.1 363.9 160.0 0.2 41.6 55.1 48.0 199.6 160.3 900.4 241.6 1.1 383.3 Debt securities 3,478.2 1,375.3 642.9 499.3 233.1 79.7 5.4 11.6 101.7 21.6 1,035.1 178.1 39.0 630.7 Short-term 509.4 162.3 89.0 72.7 0.6 9.3 1.1 5.1 71.5 6.1 183.7 23.3 2.2 44.7 Long-term 2,967.9 1,212.0 553.8 425.7 232.4 70.4 4.3 6.5 30.3 15.5 851.4 154.8 36.7 586.0 Other investment 59.6 -199.7 83.6 -40.2 -243.1 5.2 13.2 29.1 53.6 20.8 88.4 115.9 -209.1 142.2 Assets 4,661.5 1,990.5 1,639.8 334.6 16.2 30.5 68.8 81.7 138.2 274.7 762.1 428.6 36.9 849.4 MFIs 2,992.2 1,347.3 1,099.7 245.2 2.4 18.4 48.5 75.3 113.2 159.3 466.0 337.5 6.8 420.1 Non-MFIs 1,673.6 647.6 540.0 93.8 13.8 12.1 20.3 6.5 25.0 115.4 296.0 91.1 30.2 429.3 Liabilities 4,593.9 2,182.3 1,556.2 366.8 259.2 25.3 55.6 52.6 84.6 253.9 673.7 312.7 246.0 707.3 MFIs 2,949.1 1,417.3 989.0 322.2 106.0 16.5 26.1 42.8 48.9 184.8 352.5 240.1 112.9 507.3 Non-MFIs 1,657.2 777.4 567.2 57.0 153.2 8.8 29.5 9.9 35.7 69.1 321.2 72.6 133.1 200.0
2013 Q3 to 2014 Q2 Four-quarter cumulated transactions
Direct investment 91.1 155.2 120.5 35.1 -0.3 7.6 2.8 -0.6 -24.0 -58.8 -110.6 38.2 0.0 81.3 Assets 272.3 100.3 85.6 14.7 0.1 23.4 10.8 7.1 -15.3 -33.2 38.6 47.0 0.0 93.6 Equity/reinvested earnings 283.9 107.0 76.3 30.7 0.0 31.6 7.5 0.6 -12.7 -45.9 70.6 44.4 0.0 80.8 Debt instruments -11.6 -6.6 9.3 -16.0 0.0 -8.2 3.3 6.5 -2.7 12.7 -32.0 2.7 0.0 12.7 Liabilities 181.3 -54.9 -34.9 -20.4 0.4 15.8 8.0 7.8 8.6 25.6 149.2 8.8 0.0 12.3 Equity/reinvested earnings 175.3 -48.4 -25.0 -23.4 0.0 14.6 5.3 0.8 9.4 16.5 128.8 16.2 0.0 31.9 Debt instruments 6.0 -6.5 -9.9 3.0 0.4 1.2 2.7 6.9 -0.7 9.1 20.3 -7.4 0.0 -19.7 Portfolio investment assets 348.0 97.4 73.4 9.0 15.0 17.0 4.7 1.6 22.4 14.0 114.7 9.8 5.7 60.8 Equity, investment fund shares 171.0 51.2 32.0 19.0 0.2 4.1 3.3 -1.5 21.2 7.3 74.1 1.1 0.0 10.3 Debt securities 177.0 46.2 41.4 -10.0 14.8 12.8 1.4 3.1 1.2 6.7 40.5 8.7 5.7 50.6 Short-term 29.8 9.5 17.0 -7.0 -0.5 2.0 0.0 1.8 4.0 1.7 5.5 5.0 1.0 -0.6 Long-term 147.2 36.7 24.4 -3.0 15.3 10.8 1.4 1.3 -2.8 5.0 35.1 3.8 4.7 51.2 Other investment 407.4 163.3 168.4 -6.4 1.3 4.8 9.1 14.7 42.0 61.7 34.1 13.5 0.9 63.3 Assets 185.0 -57.0 -65.1 8.0 0.1 7.5 12.1 25.3 48.0 26.5 74.6 39.2 0.9 7.7 MFIs 101.3 -77.4 -76.4 -1.4 0.4 0.7 11.7 26.7 45.2 17.9 53.6 31.7 0.8 -9.7 Non-MFIs 83.7 20.4 11.3 9.4 -0.3 6.8 0.4 -1.4 2.8 8.6 21.0 7.6 0.1 17.4 Liabilities -222.4 -220.2 -233.4 14.4 -1.2 2.7 3.0 10.6 6.0 -35.2 40.5 25.7 0.0 -55.6 MFIs -263.0 -185.5 -194.3 13.7 -4.9 -1.7 -1.3 8.4 4.1 -44.8 22.3 17.7 -4.3 -77.9 Non-MFIs 40.6 -34.8 -39.2 0.7 3.7 4.4 4.3 2.2 1.9 9.6 18.2 8.0 4.3 22.4
Source: ECB.
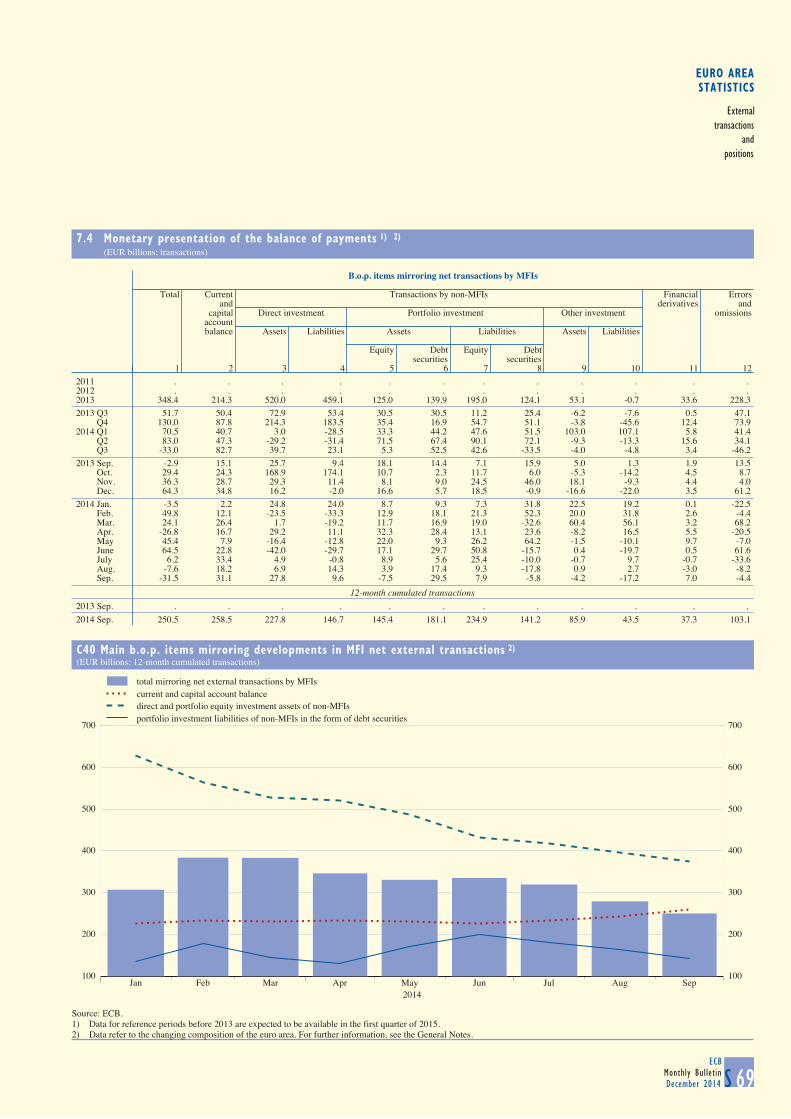
EURO AREASTATISTICS
Externaltransactions
andpositions
7.4 Monetary presentation of the balance of payments 1) 2) (EUR billions; transactions)
S 69ECB
Monthly BulletinDecember 2014
B.o.p. items mirroring net transactions by MFIs
Total Current Transactions by non-MFIs Financial Errors
and derivatives andcapital Direct investment Portfolio investment Other investment omissions
account balance Assets Liabilities Assets Liabilities Assets Liabilities
Equity Debt Equity Debtsecurities securities
1 2 3 4 5 6 7 8 9 10 11 122011 . . . . . . . . . . . . 2012 . . . . . . . . . . . . 2013 348.4 214.3 520.0 459.1 125.0 139.9 195.0 124.1 53.1 -0.7 33.6 228.32013 Q3 51.7 50.4 72.9 53.4 30.5 30.5 11.2 25.4 -6.2 -7.6 0.5 47.1 Q4 130.0 87.8 214.3 183.5 35.4 16.9 54.7 51.1 -3.8 -45.6 12.4 73.92014 Q1 70.5 40.7 3.0 -28.5 33.3 44.2 47.6 51.5 103.0 107.1 5.8 41.4 Q2 83.0 47.3 -29.2 -31.4 71.5 67.4 90.1 72.1 -9.3 -13.3 15.6 34.1 Q3 -33.0 82.7 39.7 23.1 5.3 52.5 42.6 -33.5 -4.0 -4.8 3.4 -46.22013 Sep. -2.9 15.1 25.7 9.4 18.1 14.4 7.1 15.9 5.0 1.3 1.9 13.5 Oct. 29.4 24.3 168.9 174.1 10.7 2.3 11.7 6.0 -5.3 -14.2 4.5 8.7 Nov. 36.3 28.7 29.3 11.4 8.1 9.0 24.5 46.0 18.1 -9.3 4.4 4.0 Dec. 64.3 34.8 16.2 -2.0 16.6 5.7 18.5 -0.9 -16.6 -22.0 3.5 61.22014 Jan. -3.5 2.2 24.8 24.0 8.7 9.3 7.3 31.8 22.5 19.2 0.1 -22.5 Feb. 49.8 12.1 -23.5 -33.3 12.9 18.1 21.3 52.3 20.0 31.8 2.6 -4.4 Mar. 24.1 26.4 1.7 -19.2 11.7 16.9 19.0 -32.6 60.4 56.1 3.2 68.2 Apr. -26.8 16.7 29.2 11.1 32.3 28.4 13.1 23.6 -8.2 16.5 5.5 -20.5 May 45.4 7.9 -16.4 -12.8 22.0 9.3 26.2 64.2 -1.5 -10.1 9.7 -7.0 June 64.5 22.8 -42.0 -29.7 17.1 29.7 50.8 -15.7 0.4 -19.7 0.5 61.6 July 6.2 33.4 4.9 -0.8 8.9 5.6 25.4 -10.0 -0.7 9.7 -0.7 -33.6 Aug. -7.6 18.2 6.9 14.3 3.9 17.4 9.3 -17.8 0.9 2.7 -3.0 -8.2 Sep. -31.5 31.1 27.8 9.6 -7.5 29.5 7.9 -5.8 -4.2 -17.2 7.0 -4.4
12-month cumulated transactions 2013 Sep. . . . . . . . . . . . . 2014 Sep. 250.5 258.5 227.8 146.7 145.4 181.1 234.9 141.2 85.9 43.5 37.3 103.1
C40 Main b.o.p. items mirroring developments in MFI net external transactions 2)
(EUR billions; 12-month cumulated transactions)
100
200
300
400
500
600
700
Jan Feb Mar Apr May Jun Jul Aug Sep2014
100
200
300
400
500
600
700
total mirroring net external transactions by MFIscurrent and capital account balancedirect and portfolio equity investment assets of non-MFIsportfolio investment liabilities of non-MFIs in the form of debt securities
Source: ECB.1) Data for reference periods before 2013 are expected to be available in the first quarter of 2015.2) Data refer to the changing composition of the euro area. For further information, see the General Notes.
7.3 Financial account (EUR billions; outstanding amounts at end of period; transactions during period)
S 68ECBMonthly BulletinDecember 2014
9. Geographical breakdown
Total Canada China Hong Japan Switzer- United Offshore Interna- Other EU Member States Kong land States financial tional countries
outside the euro area centres organisa-tions
Total United Other EUKingdom EU insti-
tutions1 2 3 4 5 6 7 8 9 10 11 12 13 14
2014 Q2 Outstanding amounts (international investment position)
Direct investment 1,920.6 799.6 519.1 282.2 -1.7 103.6 120.8 10.5 -44.8 228.9 68.0 -339.7 -0.3 974.0 Assets 7,407.6 2,221.7 1,579.4 642.2 0.1 235.3 152.3 56.9 126.1 727.0 1,665.6 635.3 0.2 1,587.2 Equity/reinvested earnings 5,111.3 1,494.8 1,048.6 446.2 0.0 172.9 119.7 37.9 95.5 483.1 1,123.0 478.1 0.1 1,106.2 Debt instruments 2,293.6 724.0 530.8 193.1 0.1 62.5 32.6 19.0 30.6 243.9 542.6 157.2 0.1 481.0 Liabilities 5,487.0 1,422.1 1,060.3 360.0 1.8 131.7 31.5 46.3 170.9 498.1 1,597.7 975.0 0.5 613.2 Equity/reinvested earnings 3,562.6 1,025.0 761.4 262.4 1.3 110.4 9.4 17.9 151.1 273.9 1,103.5 469.3 0.1 402.0 Debt instruments 1,924.4 397.0 298.9 97.6 0.5 21.3 22.1 28.4 19.9 224.2 494.1 505.7 0.4 211.2 Portfolio investment assets 6,033.4 1,899.4 1,006.8 659.3 233.3 121.3 60.5 59.6 301.4 181.9 1,935.5 419.7 40.0 1,014.0 Equity, investment fund shares 2,555.2 524.1 363.9 160.0 0.2 41.6 55.1 48.0 199.6 160.3 900.4 241.6 1.1 383.3 Debt securities 3,478.2 1,375.3 642.9 499.3 233.1 79.7 5.4 11.6 101.7 21.6 1,035.1 178.1 39.0 630.7 Short-term 509.4 162.3 89.0 72.7 0.6 9.3 1.1 5.1 71.5 6.1 183.7 23.3 2.2 44.7 Long-term 2,967.9 1,212.0 553.8 425.7 232.4 70.4 4.3 6.5 30.3 15.5 851.4 154.8 36.7 586.0 Other investment 59.6 -199.7 83.6 -40.2 -243.1 5.2 13.2 29.1 53.6 20.8 88.4 115.9 -209.1 142.2 Assets 4,661.5 1,990.5 1,639.8 334.6 16.2 30.5 68.8 81.7 138.2 274.7 762.1 428.6 36.9 849.4 MFIs 2,992.2 1,347.3 1,099.7 245.2 2.4 18.4 48.5 75.3 113.2 159.3 466.0 337.5 6.8 420.1 Non-MFIs 1,673.6 647.6 540.0 93.8 13.8 12.1 20.3 6.5 25.0 115.4 296.0 91.1 30.2 429.3 Liabilities 4,593.9 2,182.3 1,556.2 366.8 259.2 25.3 55.6 52.6 84.6 253.9 673.7 312.7 246.0 707.3 MFIs 2,949.1 1,417.3 989.0 322.2 106.0 16.5 26.1 42.8 48.9 184.8 352.5 240.1 112.9 507.3 Non-MFIs 1,657.2 777.4 567.2 57.0 153.2 8.8 29.5 9.9 35.7 69.1 321.2 72.6 133.1 200.0
2013 Q3 to 2014 Q2 Four-quarter cumulated transactions
Direct investment 91.1 155.2 120.5 35.1 -0.3 7.6 2.8 -0.6 -24.0 -58.8 -110.6 38.2 0.0 81.3 Assets 272.3 100.3 85.6 14.7 0.1 23.4 10.8 7.1 -15.3 -33.2 38.6 47.0 0.0 93.6 Equity/reinvested earnings 283.9 107.0 76.3 30.7 0.0 31.6 7.5 0.6 -12.7 -45.9 70.6 44.4 0.0 80.8 Debt instruments -11.6 -6.6 9.3 -16.0 0.0 -8.2 3.3 6.5 -2.7 12.7 -32.0 2.7 0.0 12.7 Liabilities 181.3 -54.9 -34.9 -20.4 0.4 15.8 8.0 7.8 8.6 25.6 149.2 8.8 0.0 12.3 Equity/reinvested earnings 175.3 -48.4 -25.0 -23.4 0.0 14.6 5.3 0.8 9.4 16.5 128.8 16.2 0.0 31.9 Debt instruments 6.0 -6.5 -9.9 3.0 0.4 1.2 2.7 6.9 -0.7 9.1 20.3 -7.4 0.0 -19.7 Portfolio investment assets 348.0 97.4 73.4 9.0 15.0 17.0 4.7 1.6 22.4 14.0 114.7 9.8 5.7 60.8 Equity, investment fund shares 171.0 51.2 32.0 19.0 0.2 4.1 3.3 -1.5 21.2 7.3 74.1 1.1 0.0 10.3 Debt securities 177.0 46.2 41.4 -10.0 14.8 12.8 1.4 3.1 1.2 6.7 40.5 8.7 5.7 50.6 Short-term 29.8 9.5 17.0 -7.0 -0.5 2.0 0.0 1.8 4.0 1.7 5.5 5.0 1.0 -0.6 Long-term 147.2 36.7 24.4 -3.0 15.3 10.8 1.4 1.3 -2.8 5.0 35.1 3.8 4.7 51.2 Other investment 407.4 163.3 168.4 -6.4 1.3 4.8 9.1 14.7 42.0 61.7 34.1 13.5 0.9 63.3 Assets 185.0 -57.0 -65.1 8.0 0.1 7.5 12.1 25.3 48.0 26.5 74.6 39.2 0.9 7.7 MFIs 101.3 -77.4 -76.4 -1.4 0.4 0.7 11.7 26.7 45.2 17.9 53.6 31.7 0.8 -9.7 Non-MFIs 83.7 20.4 11.3 9.4 -0.3 6.8 0.4 -1.4 2.8 8.6 21.0 7.6 0.1 17.4 Liabilities -222.4 -220.2 -233.4 14.4 -1.2 2.7 3.0 10.6 6.0 -35.2 40.5 25.7 0.0 -55.6 MFIs -263.0 -185.5 -194.3 13.7 -4.9 -1.7 -1.3 8.4 4.1 -44.8 22.3 17.7 -4.3 -77.9 Non-MFIs 40.6 -34.8 -39.2 0.7 3.7 4.4 4.3 2.2 1.9 9.6 18.2 8.0 4.3 22.4
Source: ECB.
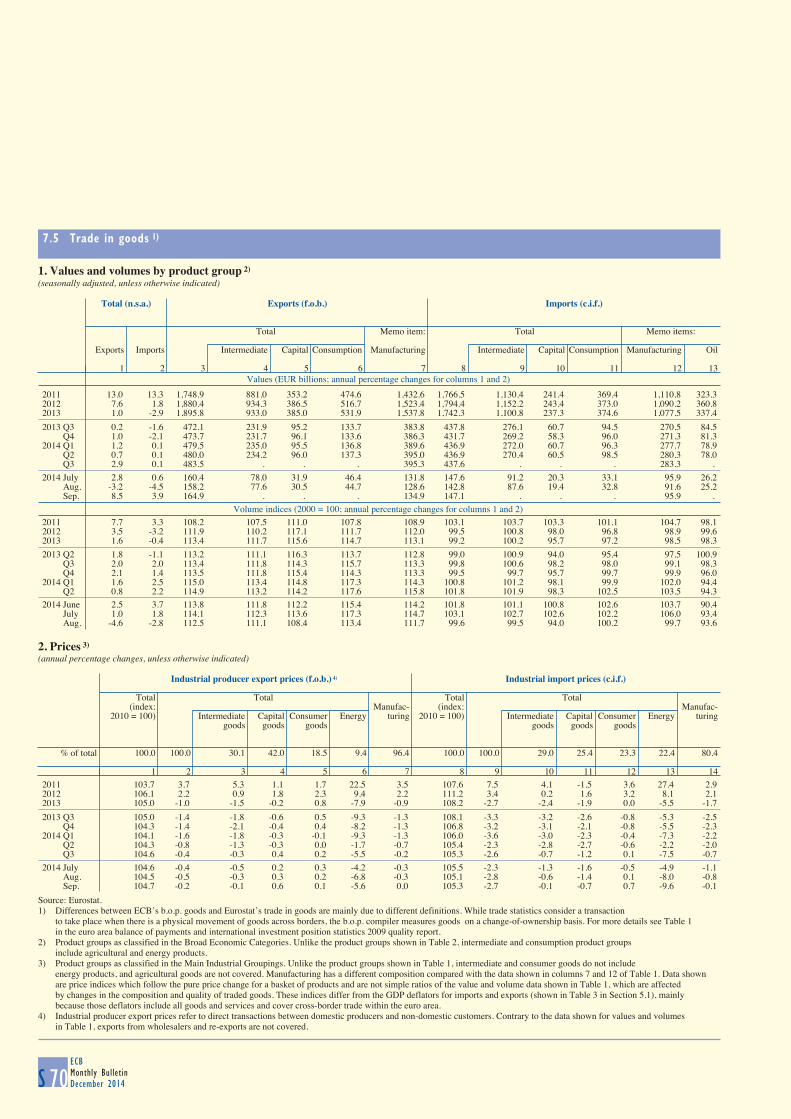
7.5 Trade in goods 1)
S 70ECBMonthly BulletinDecember 2014
1. Values and volumes by product group 2) (seasonally adjusted, unless otherwise indicated)
Values (EUR billions; annual percentage changes for columns 1 and 2)
Total (n.s.a.) Exports (f.o.b.) Imports (c.i.f.)
Total Memo item: Total Memo items:
Exports Imports Intermediate Capital Consumption Manufacturing Intermediate Capital Consumption Manufacturing Oil
1 2 3 4 5 6 7 8 9 10 11 12 13
2011 13.0 13.3 1,748.9 881.0 353.2 474.6 1,432.6 1,766.5 1,130.4 241.4 369.4 1,110.8 323.32012 7.6 1.8 1,880.4 934.3 386.5 516.7 1,523.4 1,794.4 1,152.2 243.4 373.0 1,090.2 360.82013 1.0 -2.9 1,895.8 933.0 385.0 531.9 1,537.8 1,742.3 1,100.8 237.3 374.6 1,077.5 337.4
2013 Q3 0.2 -1.6 472.1 231.9 95.2 133.7 383.8 437.8 276.1 60.7 94.5 270.5 84.5 Q4 1.0 -2.1 473.7 231.7 96.1 133.6 386.3 431.7 269.2 58.3 96.0 271.3 81.32014 Q1 1.2 0.1 479.5 235.0 95.5 136.8 389.6 436.9 272.0 60.7 96.3 277.7 78.9 Q2 0.7 0.1 480.0 234.2 96.0 137.3 395.0 436.9 270.4 60.5 98.5 280.3 78.0 Q3 2.9 0.1 483.5 . . . 395.3 437.6 . . . 283.3 .
2014 July 2.8 0.6 160.4 78.0 31.9 46.4 131.8 147.6 91.2 20.3 33.1 95.9 26.2 Aug. -3.2 -4.5 158.2 77.6 30.5 44.7 128.6 142.8 87.6 19.4 32.8 91.6 25.2 Sep. 8.5 3.9 164.9 . . . 134.9 147.1 . . . 95.9 .
Volume indices (2000 = 100; annual percentage changes for columns 1 and 2)
2011 7.7 3.3 108.2 107.5 111.0 107.8 108.9 103.1 103.7 103.3 101.1 104.7 98.12012 3.5 -3.2 111.9 110.2 117.1 111.7 112.0 99.5 100.8 98.0 96.8 98.9 99.62013 1.6 -0.4 113.4 111.7 115.6 114.7 113.1 99.2 100.2 95.7 97.2 98.5 98.3
2013 Q2 1.8 -1.1 113.2 111.1 116.3 113.7 112.8 99.0 100.9 94.0 95.4 97.5 100.9 Q3 2.0 2.0 113.4 111.8 114.3 115.7 113.3 99.8 100.6 98.2 98.0 99.1 98.3 Q4 2.1 1.4 113.5 111.8 115.4 114.3 113.3 99.5 99.7 95.7 99.7 99.9 96.02014 Q1 1.6 2.5 115.0 113.4 114.8 117.3 114.3 100.8 101.2 98.1 99.9 102.0 94.4 Q2 0.8 2.2 114.9 113.2 114.2 117.6 115.8 101.8 101.9 98.3 102.5 103.5 94.3
2014 June 2.5 3.7 113.8 111.8 112.2 115.4 114.2 101.8 101.1 100.8 102.6 103.7 90.4 July 1.0 1.8 114.1 112.3 113.6 117.3 114.7 103.1 102.7 102.6 102.2 106.0 93.4 Aug. -4.6 -2.8 112.5 111.1 108.4 113.4 111.7 99.6 99.5 94.0 100.2 99.7 93.6
2. Prices 3) (annual percentage changes, unless otherwise indicated)
Industrial producer export prices (f.o.b.) 4) Industrial import prices (c.i.f.)
Total Total Total Total
(index: Manufac- (index: Manufac-2010 = 100) Intermediate Capital Consumer Energy turing 2010 = 100) Intermediate Capital Consumer Energy turing
goods goods goods goods goods goods
% of total 100.0 100.0 30.1 42.0 18.5 9.4 96.4 100.0 100.0 29.0 25.4 23.3 22.4 80.4
1 2 3 4 5 6 7 8 9 10 11 12 13 142011 103.7 3.7 5.3 1.1 1.7 22.5 3.5 107.6 7.5 4.1 -1.5 3.6 27.4 2.92012 106.1 2.2 0.9 1.8 2.3 9.4 2.2 111.2 3.4 0.2 1.6 3.2 8.1 2.12013 105.0 -1.0 -1.5 -0.2 0.8 -7.9 -0.9 108.2 -2.7 -2.4 -1.9 0.0 -5.5 -1.7
2013 Q3 105.0 -1.4 -1.8 -0.6 0.5 -9.3 -1.3 108.1 -3.3 -3.2 -2.6 -0.8 -5.3 -2.5 Q4 104.3 -1.4 -2.1 -0.4 0.4 -8.2 -1.3 106.8 -3.2 -3.1 -2.1 -0.8 -5.5 -2.32014 Q1 104.1 -1.6 -1.8 -0.3 -0.1 -9.3 -1.3 106.0 -3.6 -3.0 -2.3 -0.4 -7.3 -2.2 Q2 104.3 -0.8 -1.3 -0.3 0.0 -1.7 -0.7 105.4 -2.3 -2.8 -2.7 -0.6 -2.2 -2.0 Q3 104.6 -0.4 -0.3 0.4 0.2 -5.5 -0.2 105.3 -2.6 -0.7 -1.2 0.1 -7.5 -0.7
2014 July 104.6 -0.4 -0.5 0.2 0.3 -4.2 -0.3 105.5 -2.3 -1.3 -1.6 -0.5 -4.9 -1.1 Aug. 104.5 -0.5 -0.3 0.3 0.2 -6.8 -0.3 105.1 -2.8 -0.6 -1.4 0.1 -8.0 -0.8 Sep. 104.7 -0.2 -0.1 0.6 0.1 -5.6 0.0 105.3 -2.7 -0.1 -0.7 0.7 -9.6 -0.1
Source: Eurostat.1) Differences between ECB’s b.o.p. goods and Eurostat’s trade in goods are mainly due to different definitions. While trade statistics consider a transaction
to take place when there is a physical movement of goods across borders, the b.o.p. compiler measures goods on a change-of-ownership basis. For more details see Table 1in the euro area balance of payments and international investment position statistics 2009 quality report.
2) Product groups as classified in the Broad Economic Categories. Unlike the product groups shown in Table 2, intermediate and consumption product groupsinclude agricultural and energy products.
3) Product groups as classified in the Main Industrial Groupings. Unlike the product groups shown in Table 1, intermediate and consumer goods do not includeenergy products, and agricultural goods are not covered. Manufacturing has a different composition compared with the data shown in columns 7 and 12 of Table 1. Data shownare price indices which follow the pure price change for a basket of products and are not simple ratios of the value and volume data shown in Table 1, which are affectedby changes in the composition and quality of traded goods. These indices differ from the GDP deflators for imports and exports (shown in Table 3 in Section 5.1), mainlybecause those deflators include all goods and services and cover cross-border trade within the euro area.
4) Industrial producer export prices refer to direct transactions between domestic producers and non-domestic customers. Contrary to the data shown for values and volumesin Table 1, exports from wholesalers and re-exports are not covered.

EURO AREASTATISTICS
Externaltransactions
andpositions
7.5 Trade in goods (EUR billions, unless otherwise indicated; seasonally adjusted)
S 71ECB
Monthly BulletinDecember 2014
3. Geographical breakdown
Exports (f.o.b.)
Total EU Member States outside Russia Switzer- Turkey United Asia Africa Latin Other
the euro area land States America
Total United Other EU China JapanKingdom countries
1 2 3 4 5 6 7 8 9 10 11 12 13 14
2011 1,748.9 557.1 214.4 342.7 81.7 109.2 57.0 201.7 408.5 115.9 39.6 112.8 84.9 135.52012 1,880.4 573.2 230.0 343.1 92.2 116.3 59.5 223.7 440.7 120.7 44.6 126.5 97.4 151.12013 1,895.8 589.5 239.3 350.2 88.4 110.3 60.2 222.4 443.2 121.9 43.9 129.3 97.6 154.3
2013 Q3 472.1 148.0 59.8 88.1 21.6 27.7 14.7 55.3 109.9 31.0 11.1 31.8 24.7 38.2 Q4 473.7 151.6 62.0 89.6 20.6 27.3 14.5 56.0 112.1 31.3 11.0 30.9 23.4 37.32014 Q1 479.5 154.6 63.3 91.4 20.2 26.9 14.6 57.9 112.3 32.0 11.0 33.1 23.5 35.9 Q2 480.0 154.8 63.2 91.7 19.5 27.4 14.0 59.3 113.6 32.3 10.6 32.6 22.7 36.0 Q3 483.5 157.3 . . 18.5 28.1 14.0 60.6 116.1 33.4 10.8 31.7 22.5 .
2014 July 160.4 53.0 21.4 31.6 6.4 9.3 4.5 19.5 38.6 11.1 3.6 10.3 7.4 11.3 Aug. 158.2 51.5 21.1 30.5 5.9 9.4 4.7 19.6 37.6 10.7 3.6 10.3 7.5 11.6 Sep. 164.9 52.7 . . 6.2 9.4 4.7 21.5 39.8 11.6 3.7 11.1 7.6 .
12-month cumulated transactions as percentage of total exports 2013 Sep. 100.0 30.7 12.4 18.3 4.8 5.9 3.2 11.6 23.4 6.3 2.3 6.9 5.2 8.2 2014 Sep. 100.0 32.3 . . 4.1 5.7 3.0 12.2 23.7 6.7 2.3 6.7 4.8 .
Imports (c.i.f.)
2011 1,766.5 483.2 167.5 315.7 139.6 82.2 35.1 140.8 556.9 220.1 53.8 129.3 91.4 108.12012 1,794.4 482.7 167.5 315.2 144.9 82.3 34.5 151.2 540.7 214.3 49.2 157.5 89.8 111.32013 1,742.3 488.9 164.6 324.4 145.9 82.1 36.1 149.2 510.4 204.3 43.6 141.5 80.2 108.1
2013 Q3 437.8 123.3 41.1 82.2 36.9 20.9 9.0 38.0 127.9 50.8 10.7 34.5 20.1 27.0 Q4 431.7 123.0 40.7 82.3 35.5 20.6 9.2 38.4 126.9 50.7 10.9 32.4 19.8 25.92014 Q1 436.9 124.6 40.6 84.0 34.7 21.1 9.3 37.1 130.3 53.6 10.7 32.7 19.5 27.8 Q2 436.9 125.4 40.7 84.7 33.9 21.5 9.5 37.5 129.4 53.3 10.3 33.0 19.8 27.2 Q3 437.6 123.9 . . 31.3 21.1 9.5 39.4 132.0 55.5 10.5 33.8 19.6 .
2014 July 147.6 41.8 13.0 28.8 10.6 7.3 3.2 13.0 44.4 18.4 3.6 11.3 6.7 9.8 Aug. 142.8 40.4 12.9 27.5 10.6 7.0 3.1 13.1 43.0 18.0 3.5 11.1 6.4 8.1 Sep. 147.1 41.7 . . 10.1 6.8 3.3 13.3 44.7 19.2 3.5 11.5 6.5 .
12-month cumulated transactions as percentage of total imports 2013 Sep. 100.0 27.7 9.5 18.3 8.4 4.7 2.0 8.4 29.3 11.7 2.5 8.5 4.7 6.2 2014 Sep. 100.0 28.5 . . 7.8 4.8 2.2 8.7 29.8 12.2 2.4 7.6 4.5 .
Balance
2011 -17.5 73.9 46.9 27.0 -57.8 27.0 21.9 60.8 -148.3 -104.2 -14.2 -16.5 -6.5 27.42012 86.0 90.5 62.6 27.9 -52.7 34.1 25.0 72.5 -100.0 -93.6 -4.6 -31.1 7.6 39.82013 153.5 100.5 74.7 25.8 -57.5 28.3 24.1 73.2 -67.2 -82.4 0.2 -12.1 17.4 46.2
2013 Q3 34.3 24.7 18.7 5.9 -15.3 6.8 5.7 17.2 -18.0 -19.8 0.4 -2.7 4.6 11.3 Q4 42.0 28.6 21.3 7.3 -14.9 6.7 5.3 17.6 -14.8 -19.4 0.0 -1.5 3.6 11.42014 Q1 42.6 30.1 22.7 7.3 -14.5 5.7 5.4 20.8 -18.0 -21.5 0.4 0.4 4.1 8.1 Q2 43.0 29.5 22.5 7.0 -14.4 6.0 4.5 21.8 -15.8 -21.0 0.3 -0.4 2.9 8.8 Q3 45.9 33.4 . . -12.8 7.0 4.4 21.2 -16.0 -22.2 0.3 -2.2 3.0 .
2014 July 12.8 11.3 8.4 2.8 -4.2 2.0 1.3 6.5 -5.8 -7.3 0.0 -0.9 0.8 1.5 Aug. 15.4 11.1 8.2 3.0 -4.6 2.4 1.6 6.5 -5.3 -7.3 0.1 -0.8 1.2 3.5 Sep. 17.7 11.1 . . -3.9 2.6 1.5 8.2 -4.9 -7.6 0.2 -0.4 1.0 .
Source: Eurostat.
7.5 Trade in goods 1)
S 70ECBMonthly BulletinDecember 2014
1. Values and volumes by product group 2) (seasonally adjusted, unless otherwise indicated)
Values (EUR billions; annual percentage changes for columns 1 and 2)
Total (n.s.a.) Exports (f.o.b.) Imports (c.i.f.)
Total Memo item: Total Memo items:
Exports Imports Intermediate Capital Consumption Manufacturing Intermediate Capital Consumption Manufacturing Oil
1 2 3 4 5 6 7 8 9 10 11 12 13
2011 13.0 13.3 1,748.9 881.0 353.2 474.6 1,432.6 1,766.5 1,130.4 241.4 369.4 1,110.8 323.32012 7.6 1.8 1,880.4 934.3 386.5 516.7 1,523.4 1,794.4 1,152.2 243.4 373.0 1,090.2 360.82013 1.0 -2.9 1,895.8 933.0 385.0 531.9 1,537.8 1,742.3 1,100.8 237.3 374.6 1,077.5 337.4
2013 Q3 0.2 -1.6 472.1 231.9 95.2 133.7 383.8 437.8 276.1 60.7 94.5 270.5 84.5 Q4 1.0 -2.1 473.7 231.7 96.1 133.6 386.3 431.7 269.2 58.3 96.0 271.3 81.32014 Q1 1.2 0.1 479.5 235.0 95.5 136.8 389.6 436.9 272.0 60.7 96.3 277.7 78.9 Q2 0.7 0.1 480.0 234.2 96.0 137.3 395.0 436.9 270.4 60.5 98.5 280.3 78.0 Q3 2.9 0.1 483.5 . . . 395.3 437.6 . . . 283.3 .
2014 July 2.8 0.6 160.4 78.0 31.9 46.4 131.8 147.6 91.2 20.3 33.1 95.9 26.2 Aug. -3.2 -4.5 158.2 77.6 30.5 44.7 128.6 142.8 87.6 19.4 32.8 91.6 25.2 Sep. 8.5 3.9 164.9 . . . 134.9 147.1 . . . 95.9 .
Volume indices (2000 = 100; annual percentage changes for columns 1 and 2)
2011 7.7 3.3 108.2 107.5 111.0 107.8 108.9 103.1 103.7 103.3 101.1 104.7 98.12012 3.5 -3.2 111.9 110.2 117.1 111.7 112.0 99.5 100.8 98.0 96.8 98.9 99.62013 1.6 -0.4 113.4 111.7 115.6 114.7 113.1 99.2 100.2 95.7 97.2 98.5 98.3
2013 Q2 1.8 -1.1 113.2 111.1 116.3 113.7 112.8 99.0 100.9 94.0 95.4 97.5 100.9 Q3 2.0 2.0 113.4 111.8 114.3 115.7 113.3 99.8 100.6 98.2 98.0 99.1 98.3 Q4 2.1 1.4 113.5 111.8 115.4 114.3 113.3 99.5 99.7 95.7 99.7 99.9 96.02014 Q1 1.6 2.5 115.0 113.4 114.8 117.3 114.3 100.8 101.2 98.1 99.9 102.0 94.4 Q2 0.8 2.2 114.9 113.2 114.2 117.6 115.8 101.8 101.9 98.3 102.5 103.5 94.3
2014 June 2.5 3.7 113.8 111.8 112.2 115.4 114.2 101.8 101.1 100.8 102.6 103.7 90.4 July 1.0 1.8 114.1 112.3 113.6 117.3 114.7 103.1 102.7 102.6 102.2 106.0 93.4 Aug. -4.6 -2.8 112.5 111.1 108.4 113.4 111.7 99.6 99.5 94.0 100.2 99.7 93.6
2. Prices 3) (annual percentage changes, unless otherwise indicated)
Industrial producer export prices (f.o.b.) 4) Industrial import prices (c.i.f.)
Total Total Total Total
(index: Manufac- (index: Manufac-2010 = 100) Intermediate Capital Consumer Energy turing 2010 = 100) Intermediate Capital Consumer Energy turing
goods goods goods goods goods goods
% of total 100.0 100.0 30.1 42.0 18.5 9.4 96.4 100.0 100.0 29.0 25.4 23.3 22.4 80.4
1 2 3 4 5 6 7 8 9 10 11 12 13 142011 103.7 3.7 5.3 1.1 1.7 22.5 3.5 107.6 7.5 4.1 -1.5 3.6 27.4 2.92012 106.1 2.2 0.9 1.8 2.3 9.4 2.2 111.2 3.4 0.2 1.6 3.2 8.1 2.12013 105.0 -1.0 -1.5 -0.2 0.8 -7.9 -0.9 108.2 -2.7 -2.4 -1.9 0.0 -5.5 -1.7
2013 Q3 105.0 -1.4 -1.8 -0.6 0.5 -9.3 -1.3 108.1 -3.3 -3.2 -2.6 -0.8 -5.3 -2.5 Q4 104.3 -1.4 -2.1 -0.4 0.4 -8.2 -1.3 106.8 -3.2 -3.1 -2.1 -0.8 -5.5 -2.32014 Q1 104.1 -1.6 -1.8 -0.3 -0.1 -9.3 -1.3 106.0 -3.6 -3.0 -2.3 -0.4 -7.3 -2.2 Q2 104.3 -0.8 -1.3 -0.3 0.0 -1.7 -0.7 105.4 -2.3 -2.8 -2.7 -0.6 -2.2 -2.0 Q3 104.6 -0.4 -0.3 0.4 0.2 -5.5 -0.2 105.3 -2.6 -0.7 -1.2 0.1 -7.5 -0.7
2014 July 104.6 -0.4 -0.5 0.2 0.3 -4.2 -0.3 105.5 -2.3 -1.3 -1.6 -0.5 -4.9 -1.1 Aug. 104.5 -0.5 -0.3 0.3 0.2 -6.8 -0.3 105.1 -2.8 -0.6 -1.4 0.1 -8.0 -0.8 Sep. 104.7 -0.2 -0.1 0.6 0.1 -5.6 0.0 105.3 -2.7 -0.1 -0.7 0.7 -9.6 -0.1
Source: Eurostat.1) Differences between ECB’s b.o.p. goods and Eurostat’s trade in goods are mainly due to different definitions. While trade statistics consider a transaction
to take place when there is a physical movement of goods across borders, the b.o.p. compiler measures goods on a change-of-ownership basis. For more details see Table 1in the euro area balance of payments and international investment position statistics 2009 quality report.
2) Product groups as classified in the Broad Economic Categories. Unlike the product groups shown in Table 2, intermediate and consumption product groupsinclude agricultural and energy products.
3) Product groups as classified in the Main Industrial Groupings. Unlike the product groups shown in Table 1, intermediate and consumer goods do not includeenergy products, and agricultural goods are not covered. Manufacturing has a different composition compared with the data shown in columns 7 and 12 of Table 1. Data shownare price indices which follow the pure price change for a basket of products and are not simple ratios of the value and volume data shown in Table 1, which are affectedby changes in the composition and quality of traded goods. These indices differ from the GDP deflators for imports and exports (shown in Table 3 in Section 5.1), mainlybecause those deflators include all goods and services and cover cross-border trade within the euro area.
4) Industrial producer export prices refer to direct transactions between domestic producers and non-domestic customers. Contrary to the data shown for values and volumesin Table 1, exports from wholesalers and re-exports are not covered.
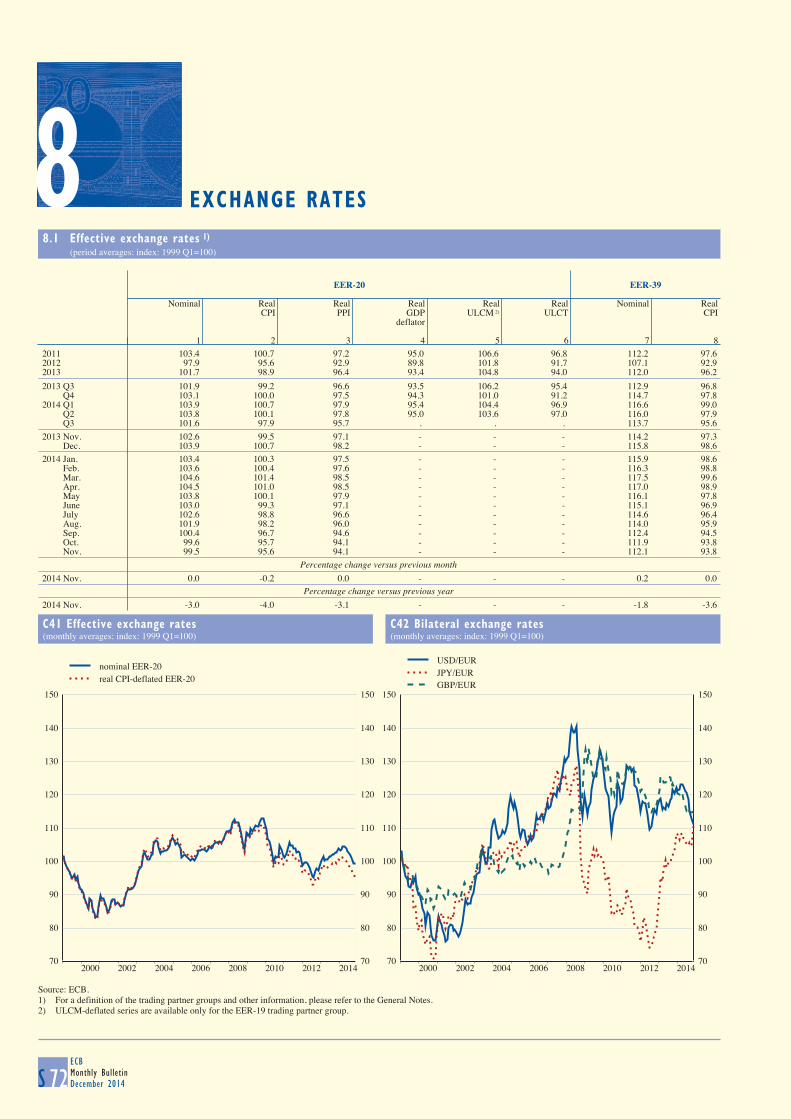
8 EXCHANGE RATES
8.1 Effective exchange rates 1) (period averages; index: 1999 Q1=100)
S 72ECBMonthly BulletinDecember 2014
EER-20 EER-39
Nominal Real Real Real Real Real Nominal RealCPI PPI GDP ULCM 2) ULCT CPI
deflator
1 2 3 4 5 6 7 82011 103.4 100.7 97.2 95.0 106.6 96.8 112.2 97.62012 97.9 95.6 92.9 89.8 101.8 91.7 107.1 92.92013 101.7 98.9 96.4 93.4 104.8 94.0 112.0 96.2
2013 Q3 101.9 99.2 96.6 93.5 106.2 95.4 112.9 96.8 Q4 103.1 100.0 97.5 94.3 101.0 91.2 114.7 97.82014 Q1 103.9 100.7 97.9 95.4 104.4 96.9 116.6 99.0 Q2 103.8 100.1 97.8 95.0 103.6 97.0 116.0 97.9 Q3 101.6 97.9 95.7 . . . 113.7 95.6
2013 Nov. 102.6 99.5 97.1 - - - 114.2 97.3 Dec. 103.9 100.7 98.2 - - - 115.8 98.62014 Jan. 103.4 100.3 97.5 - - - 115.9 98.6 Feb. 103.6 100.4 97.6 - - - 116.3 98.8 Mar. 104.6 101.4 98.5 - - - 117.5 99.6 Apr. 104.5 101.0 98.5 - - - 117.0 98.9 May 103.8 100.1 97.9 - - - 116.1 97.8 June 103.0 99.3 97.1 - - - 115.1 96.9 July 102.6 98.8 96.6 - - - 114.6 96.4 Aug. 101.9 98.2 96.0 - - - 114.0 95.9 Sep. 100.4 96.7 94.6 - - - 112.4 94.5 Oct. 99.6 95.7 94.1 - - - 111.9 93.8 Nov. 99.5 95.6 94.1 - - - 112.1 93.8
Percentage change versus previous month 2014 Nov. 0.0 -0.2 0.0 - - - 0.2 0.0
Percentage change versus previous year 2014 Nov. -3.0 -4.0 -3.1 - - - -1.8 -3.6
C41 Effective exchange rates
(monthly averages; index: 1999 Q1=100)
C42 Bilateral exchange rates
(monthly averages; index: 1999 Q1=100)
70
80
90
100
110
120
130
140
150
2000 2002 2004 2006 2008 2010 2012 201470
80
90
100
110
120
130
140
150
nominal EER-20real CPI-deflated EER-20
70
80
90
100
110
120
130
140
150
2000 2002 2004 2006 2008 2010 2012 201470
80
90
100
110
120
130
140
150
USD/EURJPY/EURGBP/EUR
Source: ECB.1) For a definition of the trading partner groups and other information, please refer to the General Notes.2) ULCM-deflated series are available only for the EER-19 trading partner group.
8
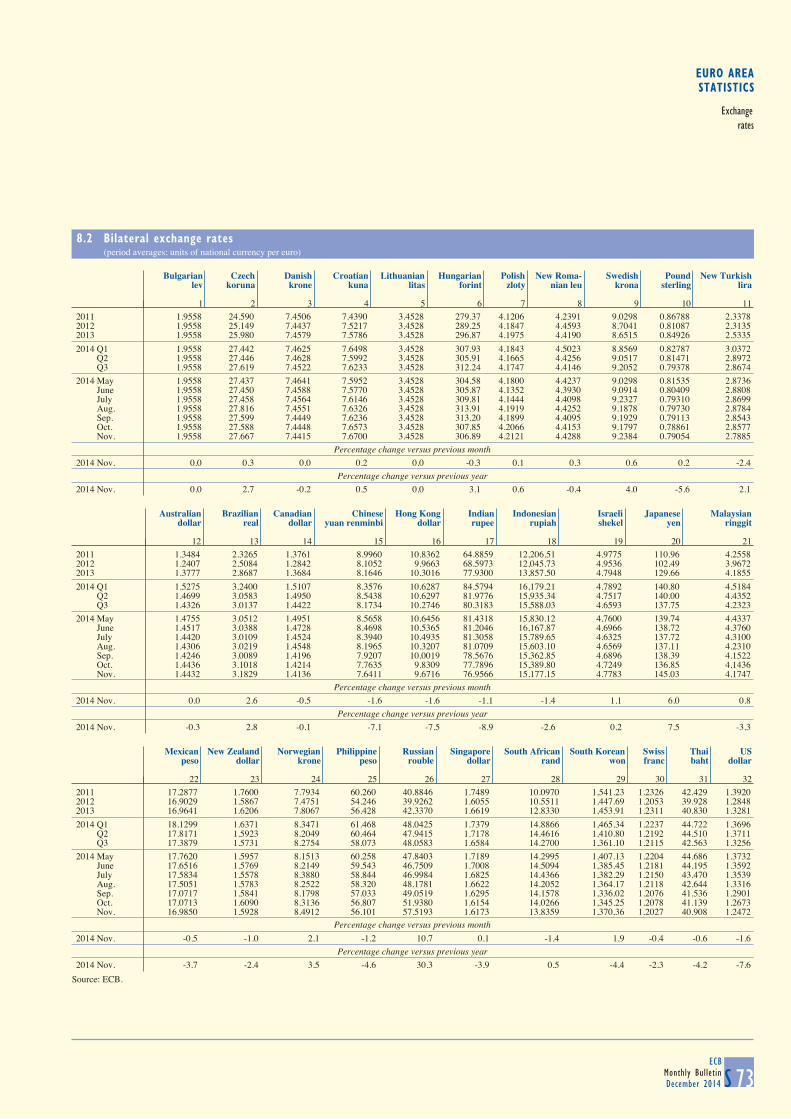
EURO AREASTATISTICS
Exchangerates
8.2 Bilateral exchange rates (period averages; units of national currency per euro)
S 73ECB
Monthly BulletinDecember 2014
Bulgarian Czech Danish Croatian Lithuanian Hungarian Polish New Roma- Swedish Pound New Turkishlev koruna krone kuna litas forint zloty nian leu krona sterling lira
1 2 3 4 5 6 7 8 9 10 112011 1.9558 24.590 7.4506 7.4390 3.4528 279.37 4.1206 4.2391 9.0298 0.86788 2.33782012 1.9558 25.149 7.4437 7.5217 3.4528 289.25 4.1847 4.4593 8.7041 0.81087 2.31352013 1.9558 25.980 7.4579 7.5786 3.4528 296.87 4.1975 4.4190 8.6515 0.84926 2.5335
2014 Q1 1.9558 27.442 7.4625 7.6498 3.4528 307.93 4.1843 4.5023 8.8569 0.82787 3.0372 Q2 1.9558 27.446 7.4628 7.5992 3.4528 305.91 4.1665 4.4256 9.0517 0.81471 2.8972 Q3 1.9558 27.619 7.4522 7.6233 3.4528 312.24 4.1747 4.4146 9.2052 0.79378 2.8674
2014 May 1.9558 27.437 7.4641 7.5952 3.4528 304.58 4.1800 4.4237 9.0298 0.81535 2.8736 June 1.9558 27.450 7.4588 7.5770 3.4528 305.87 4.1352 4.3930 9.0914 0.80409 2.8808 July 1.9558 27.458 7.4564 7.6146 3.4528 309.81 4.1444 4.4098 9.2327 0.79310 2.8699 Aug. 1.9558 27.816 7.4551 7.6326 3.4528 313.91 4.1919 4.4252 9.1878 0.79730 2.8784 Sep. 1.9558 27.599 7.4449 7.6236 3.4528 313.20 4.1899 4.4095 9.1929 0.79113 2.8543 Oct. 1.9558 27.588 7.4448 7.6573 3.4528 307.85 4.2066 4.4153 9.1797 0.78861 2.8577 Nov. 1.9558 27.667 7.4415 7.6700 3.4528 306.89 4.2121 4.4288 9.2384 0.79054 2.7885
Percentage change versus previous month 2014 Nov. 0.0 0.3 0.0 0.2 0.0 -0.3 0.1 0.3 0.6 0.2 -2.4
Percentage change versus previous year 2014 Nov. 0.0 2.7 -0.2 0.5 0.0 3.1 0.6 -0.4 4.0 -5.6 2.1
Australian Brazilian Canadian Chinese Hong Kong Indian Indonesian Israeli Japanese Malaysiandollar real dollar yuan renminbi dollar rupee rupiah shekel yen ringgit
12 13 14 15 16 17 18 19 20 212011 1.3484 2.3265 1.3761 8.9960 10.8362 64.8859 12,206.51 4.9775 110.96 4.25582012 1.2407 2.5084 1.2842 8.1052 9.9663 68.5973 12,045.73 4.9536 102.49 3.96722013 1.3777 2.8687 1.3684 8.1646 10.3016 77.9300 13,857.50 4.7948 129.66 4.1855
2014 Q1 1.5275 3.2400 1.5107 8.3576 10.6287 84.5794 16,179.21 4.7892 140.80 4.5184 Q2 1.4699 3.0583 1.4950 8.5438 10.6297 81.9776 15,935.34 4.7517 140.00 4.4352 Q3 1.4326 3.0137 1.4422 8.1734 10.2746 80.3183 15,588.03 4.6593 137.75 4.2323
2014 May 1.4755 3.0512 1.4951 8.5658 10.6456 81.4318 15,830.12 4.7600 139.74 4.4337 June 1.4517 3.0388 1.4728 8.4698 10.5365 81.2046 16,167.87 4.6966 138.72 4.3760 July 1.4420 3.0109 1.4524 8.3940 10.4935 81.3058 15,789.65 4.6325 137.72 4.3100 Aug. 1.4306 3.0219 1.4548 8.1965 10.3207 81.0709 15,603.10 4.6569 137.11 4.2310 Sep. 1.4246 3.0089 1.4196 7.9207 10.0019 78.5676 15,362.85 4.6896 138.39 4.1522 Oct. 1.4436 3.1018 1.4214 7.7635 9.8309 77.7896 15,389.80 4.7249 136.85 4.1436 Nov. 1.4432 3.1829 1.4136 7.6411 9.6716 76.9566 15,177.15 4.7783 145.03 4.1747
Percentage change versus previous month 2014 Nov. 0.0 2.6 -0.5 -1.6 -1.6 -1.1 -1.4 1.1 6.0 0.8
Percentage change versus previous year 2014 Nov. -0.3 2.8 -0.1 -7.1 -7.5 -8.9 -2.6 0.2 7.5 -3.3
Mexican New Zealand Norwegian Philippine Russian Singapore South African South Korean Swiss Thai USpeso dollar krone peso rouble dollar rand won franc baht dollar
22 23 24 25 26 27 28 29 30 31 322011 17.2877 1.7600 7.7934 60.260 40.8846 1.7489 10.0970 1,541.23 1.2326 42.429 1.39202012 16.9029 1.5867 7.4751 54.246 39.9262 1.6055 10.5511 1,447.69 1.2053 39.928 1.28482013 16.9641 1.6206 7.8067 56.428 42.3370 1.6619 12.8330 1,453.91 1.2311 40.830 1.3281
2014 Q1 18.1299 1.6371 8.3471 61.468 48.0425 1.7379 14.8866 1,465.34 1.2237 44.722 1.3696 Q2 17.8171 1.5923 8.2049 60.464 47.9415 1.7178 14.4616 1,410.80 1.2192 44.510 1.3711 Q3 17.3879 1.5731 8.2754 58.073 48.0583 1.6584 14.2700 1,361.10 1.2115 42.563 1.3256
2014 May 17.7620 1.5957 8.1513 60.258 47.8403 1.7189 14.2995 1,407.13 1.2204 44.686 1.3732 June 17.6516 1.5769 8.2149 59.543 46.7509 1.7008 14.5094 1,385.45 1.2181 44.195 1.3592 July 17.5834 1.5578 8.3880 58.844 46.9984 1.6825 14.4366 1,382.29 1.2150 43.470 1.3539 Aug. 17.5051 1.5783 8.2522 58.320 48.1781 1.6622 14.2052 1,364.17 1.2118 42.644 1.3316 Sep. 17.0717 1.5841 8.1798 57.033 49.0519 1.6295 14.1578 1,336.02 1.2076 41.536 1.2901 Oct. 17.0713 1.6090 8.3136 56.807 51.9380 1.6154 14.0266 1,345.25 1.2078 41.139 1.2673 Nov. 16.9850 1.5928 8.4912 56.101 57.5193 1.6173 13.8359 1,370.36 1.2027 40.908 1.2472
Percentage change versus previous month 2014 Nov. -0.5 -1.0 2.1 -1.2 10.7 0.1 -1.4 1.9 -0.4 -0.6 -1.6
Percentage change versus previous year 2014 Nov. -3.7 -2.4 3.5 -4.6 30.3 -3.9 0.5 -4.4 -2.3 -4.2 -7.6
Source: ECB.
8 EXCHANGE RATES
8.1 Effective exchange rates 1) (period averages; index: 1999 Q1=100)
S 72ECBMonthly BulletinDecember 2014
EER-20 EER-39
Nominal Real Real Real Real Real Nominal RealCPI PPI GDP ULCM 2) ULCT CPI
deflator
1 2 3 4 5 6 7 82011 103.4 100.7 97.2 95.0 106.6 96.8 112.2 97.62012 97.9 95.6 92.9 89.8 101.8 91.7 107.1 92.92013 101.7 98.9 96.4 93.4 104.8 94.0 112.0 96.2
2013 Q3 101.9 99.2 96.6 93.5 106.2 95.4 112.9 96.8 Q4 103.1 100.0 97.5 94.3 101.0 91.2 114.7 97.82014 Q1 103.9 100.7 97.9 95.4 104.4 96.9 116.6 99.0 Q2 103.8 100.1 97.8 95.0 103.6 97.0 116.0 97.9 Q3 101.6 97.9 95.7 . . . 113.7 95.6
2013 Nov. 102.6 99.5 97.1 - - - 114.2 97.3 Dec. 103.9 100.7 98.2 - - - 115.8 98.62014 Jan. 103.4 100.3 97.5 - - - 115.9 98.6 Feb. 103.6 100.4 97.6 - - - 116.3 98.8 Mar. 104.6 101.4 98.5 - - - 117.5 99.6 Apr. 104.5 101.0 98.5 - - - 117.0 98.9 May 103.8 100.1 97.9 - - - 116.1 97.8 June 103.0 99.3 97.1 - - - 115.1 96.9 July 102.6 98.8 96.6 - - - 114.6 96.4 Aug. 101.9 98.2 96.0 - - - 114.0 95.9 Sep. 100.4 96.7 94.6 - - - 112.4 94.5 Oct. 99.6 95.7 94.1 - - - 111.9 93.8 Nov. 99.5 95.6 94.1 - - - 112.1 93.8
Percentage change versus previous month 2014 Nov. 0.0 -0.2 0.0 - - - 0.2 0.0
Percentage change versus previous year 2014 Nov. -3.0 -4.0 -3.1 - - - -1.8 -3.6
C41 Effective exchange rates
(monthly averages; index: 1999 Q1=100)
C42 Bilateral exchange rates
(monthly averages; index: 1999 Q1=100)
70
80
90
100
110
120
130
140
150
2000 2002 2004 2006 2008 2010 2012 201470
80
90
100
110
120
130
140
150
nominal EER-20real CPI-deflated EER-20
70
80
90
100
110
120
130
140
150
2000 2002 2004 2006 2008 2010 2012 201470
80
90
100
110
120
130
140
150
USD/EURJPY/EURGBP/EUR
Source: ECB.1) For a definition of the trading partner groups and other information, please refer to the General Notes.2) ULCM-deflated series are available only for the EER-19 trading partner group.
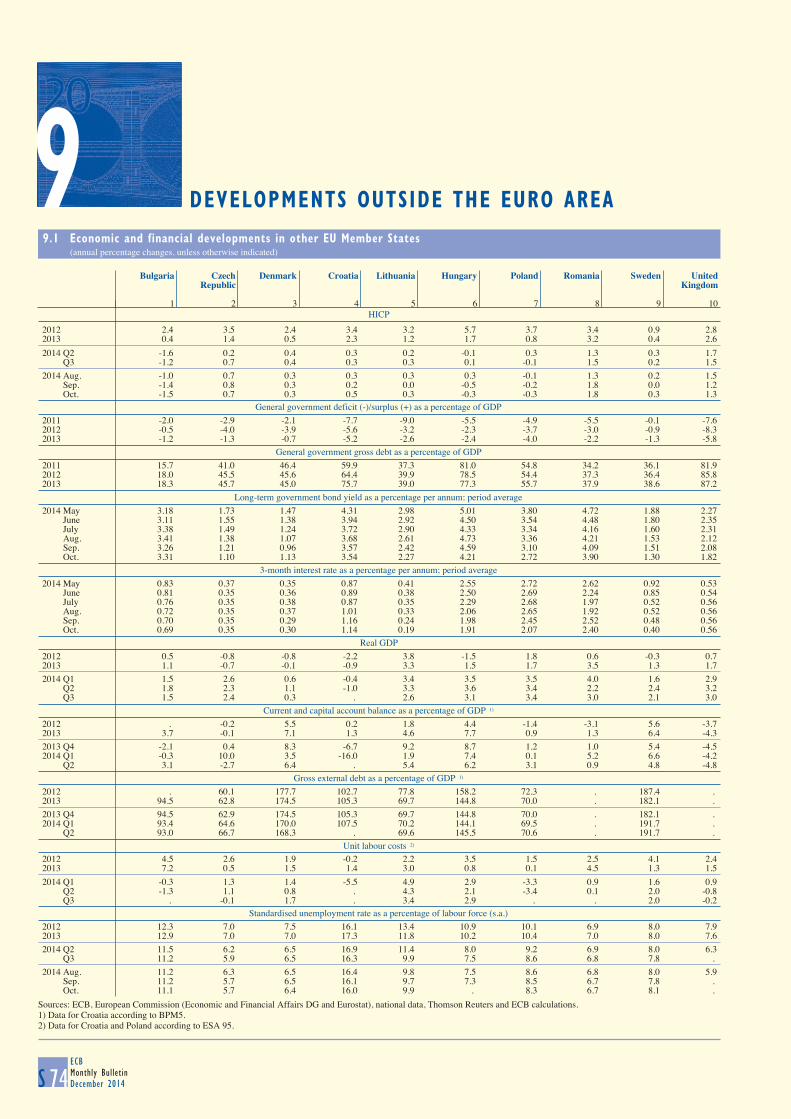
9 DEVELOPMENTS OUTSIDE THE EURO AREA
9.1 Economic and financial developments in other EU Member States (annual percentage changes, unless otherwise indicated)
S 74ECBMonthly BulletinDecember 2014
HICP
Bulgaria Czech Denmark Croatia Lithuania Hungary Poland Romania Sweden UnitedRepublic Kingdom
1 2 3 4 5 6 7 8 9 10
2012 2.4 3.5 2.4 3.4 3.2 5.7 3.7 3.4 0.9 2.82013 0.4 1.4 0.5 2.3 1.2 1.7 0.8 3.2 0.4 2.6
2014 Q2 -1.6 0.2 0.4 0.3 0.2 -0.1 0.3 1.3 0.3 1.7 Q3 -1.2 0.7 0.4 0.3 0.3 0.1 -0.1 1.5 0.2 1.5
2014 Aug. -1.0 0.7 0.3 0.3 0.3 0.3 -0.1 1.3 0.2 1.5 Sep. -1.4 0.8 0.3 0.2 0.0 -0.5 -0.2 1.8 0.0 1.2 Oct. -1.5 0.7 0.3 0.5 0.3 -0.3 -0.3 1.8 0.3 1.3
General government deficit (-)/surplus (+) as a percentage of GDP
2011 -2.0 -2.9 -2.1 -7.7 -9.0 -5.5 -4.9 -5.5 -0.1 -7.62012 -0.5 -4.0 -3.9 -5.6 -3.2 -2.3 -3.7 -3.0 -0.9 -8.32013 -1.2 -1.3 -0.7 -5.2 -2.6 -2.4 -4.0 -2.2 -1.3 -5.8
General government gross debt as a percentage of GDP
2011 15.7 41.0 46.4 59.9 37.3 81.0 54.8 34.2 36.1 81.92012 18.0 45.5 45.6 64.4 39.9 78.5 54.4 37.3 36.4 85.82013 18.3 45.7 45.0 75.7 39.0 77.3 55.7 37.9 38.6 87.2
Long-term government bond yield as a percentage per annum; period average
2014 May 3.18 1.73 1.47 4.31 2.98 5.01 3.80 4.72 1.88 2.27 June 3.11 1.55 1.38 3.94 2.92 4.50 3.54 4.48 1.80 2.35 July 3.38 1.49 1.24 3.72 2.90 4.33 3.34 4.16 1.60 2.31 Aug. 3.41 1.38 1.07 3.68 2.61 4.73 3.36 4.21 1.53 2.12 Sep. 3.26 1.21 0.96 3.57 2.42 4.59 3.10 4.09 1.51 2.08 Oct. 3.31 1.10 1.13 3.54 2.27 4.21 2.72 3.90 1.30 1.82
3-month interest rate as a percentage per annum; period average
2014 May 0.83 0.37 0.35 0.87 0.41 2.55 2.72 2.62 0.92 0.53 June 0.81 0.35 0.36 0.89 0.38 2.50 2.69 2.24 0.85 0.54 July 0.76 0.35 0.38 0.87 0.35 2.29 2.68 1.97 0.52 0.56 Aug. 0.72 0.35 0.37 1.01 0.33 2.06 2.65 1.92 0.52 0.56 Sep. 0.70 0.35 0.29 1.16 0.24 1.98 2.45 2.52 0.48 0.56 Oct. 0.69 0.35 0.30 1.14 0.19 1.91 2.07 2.40 0.40 0.56
Real GDP
2012 0.5 -0.8 -0.8 -2.2 3.8 -1.5 1.8 0.6 -0.3 0.72013 1.1 -0.7 -0.1 -0.9 3.3 1.5 1.7 3.5 1.3 1.7
2014 Q1 1.5 2.6 0.6 -0.4 3.4 3.5 3.5 4.0 1.6 2.9 Q2 1.8 2.3 1.1 -1.0 3.3 3.6 3.4 2.2 2.4 3.2 Q3 1.5 2.4 0.3 . 2.6 3.1 3.4 3.0 2.1 3.0
Current and capital account balance as a percentage of GDP 1)
2012 . -0.2 5.5 0.2 1.8 4.4 -1.4 -3.1 5.6 -3.72013 3.7 -0.1 7.1 1.3 4.6 7.7 0.9 1.3 6.4 -4.3
2013 Q4 -2.1 0.4 8.3 -6.7 9.2 8.7 1.2 1.0 5.4 -4.52014 Q1 -0.3 10.0 3.5 -16.0 1.9 7.4 0.1 5.2 6.6 -4.2 Q2 3.1 -2.7 6.4 . 5.4 6.2 3.1 0.9 4.8 -4.8
Gross external debt as a percentage of GDP 1)
2012 . 60.1 177.7 102.7 77.8 158.2 72.3 . 187.4 . 2013 94.5 62.8 174.5 105.3 69.7 144.8 70.0 . 182.1 .
2013 Q4 94.5 62.9 174.5 105.3 69.7 144.8 70.0 . 182.1 . 2014 Q1 93.4 64.6 170.0 107.5 70.2 144.1 69.5 . 191.7 . Q2 93.0 66.7 168.3 . 69.6 145.5 70.6 . 191.7 .
Unit labour costs 2)
2012 4.5 2.6 1.9 -0.2 2.2 3.5 1.5 2.5 4.1 2.42013 7.2 0.5 1.5 1.4 3.0 0.8 0.1 4.5 1.3 1.5
2014 Q1 -0.3 1.3 1.4 -5.5 4.9 2.9 -3.3 0.9 1.6 0.9 Q2 -1.3 1.1 0.8 . 4.3 2.1 -3.4 0.1 2.0 -0.8 Q3 . -0.1 1.7 . 3.4 2.9 . . 2.0 -0.2
Standardised unemployment rate as a percentage of labour force (s.a.)
2012 12.3 7.0 7.5 16.1 13.4 10.9 10.1 6.9 8.0 7.92013 12.9 7.0 7.0 17.3 11.8 10.2 10.4 7.0 8.0 7.6
2014 Q2 11.5 6.2 6.5 16.9 11.4 8.0 9.2 6.9 8.0 6.3 Q3 11.2 5.9 6.5 16.3 9.9 7.5 8.6 6.8 7.8 .
2014 Aug. 11.2 6.3 6.5 16.4 9.8 7.5 8.6 6.8 8.0 5.9 Sep. 11.2 5.7 6.5 16.1 9.7 7.3 8.5 6.7 7.8 . Oct. 11.1 5.7 6.4 16.0 9.9 . 8.3 6.7 8.1 .
Sources: ECB, European Commission (Economic and Financial Affairs DG and Eurostat), national data, Thomson Reuters and ECB calculations.1) Data for Croatia according to BPM5.2) Data for Croatia and Poland according to ESA 95.
9
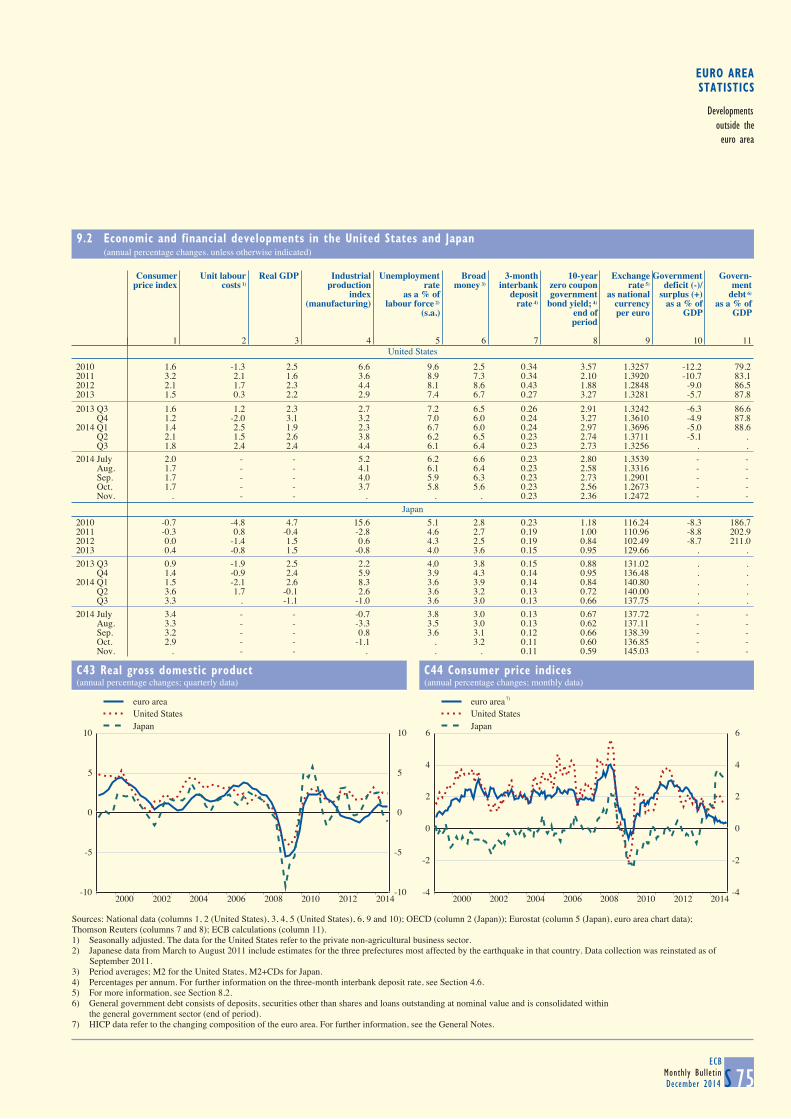
EURO AREASTATISTICS
Developmentsoutside theeuro area
9.2 Economic and financial developments in the United States and Japan (annual percentage changes, unless otherwise indicated)
S 75ECB
Monthly BulletinDecember 2014
United States
Consumer Unit labour Real GDP Industrial Unemployment Broad 3-month 10-year Exchange Government Govern-price index costs 1) production rate money 3) interbank zero coupon rate 5) deficit (-)/ ment
index as a % of deposit government as national surplus (+) debt 6)
(manufacturing) labour force 2) rate 4) bond yield; 4) currency as a % of as a % of(s.a.) end of per euro GDP GDP
period
1 2 3 4 5 6 7 8 9 10 11
2010 1.6 -1.3 2.5 6.6 9.6 2.5 0.34 3.57 1.3257 -12.2 79.22011 3.2 2.1 1.6 3.6 8.9 7.3 0.34 2.10 1.3920 -10.7 83.12012 2.1 1.7 2.3 4.4 8.1 8.6 0.43 1.88 1.2848 -9.0 86.52013 1.5 0.3 2.2 2.9 7.4 6.7 0.27 3.27 1.3281 -5.7 87.8
2013 Q3 1.6 1.2 2.3 2.7 7.2 6.5 0.26 2.91 1.3242 -6.3 86.6 Q4 1.2 -2.0 3.1 3.2 7.0 6.0 0.24 3.27 1.3610 -4.9 87.82014 Q1 1.4 2.5 1.9 2.3 6.7 6.0 0.24 2.97 1.3696 -5.0 88.6 Q2 2.1 1.5 2.6 3.8 6.2 6.5 0.23 2.74 1.3711 -5.1 . Q3 1.8 2.4 2.4 4.4 6.1 6.4 0.23 2.73 1.3256 . .
2014 July 2.0 - - 5.2 6.2 6.6 0.23 2.80 1.3539 - - Aug. 1.7 - - 4.1 6.1 6.4 0.23 2.58 1.3316 - - Sep. 1.7 - - 4.0 5.9 6.3 0.23 2.73 1.2901 - - Oct. 1.7 - - 3.7 5.8 5.6 0.23 2.56 1.2673 - - Nov. . - - . . . 0.23 2.36 1.2472 - -
Japan
2010 -0.7 -4.8 4.7 15.6 5.1 2.8 0.23 1.18 116.24 -8.3 186.72011 -0.3 0.8 -0.4 -2.8 4.6 2.7 0.19 1.00 110.96 -8.8 202.92012 0.0 -1.4 1.5 0.6 4.3 2.5 0.19 0.84 102.49 -8.7 211.02013 0.4 -0.8 1.5 -0.8 4.0 3.6 0.15 0.95 129.66 . .
2013 Q3 0.9 -1.9 2.5 2.2 4.0 3.8 0.15 0.88 131.02 . . Q4 1.4 -0.9 2.4 5.9 3.9 4.3 0.14 0.95 136.48 . . 2014 Q1 1.5 -2.1 2.6 8.3 3.6 3.9 0.14 0.84 140.80 . . Q2 3.6 1.7 -0.1 2.6 3.6 3.2 0.13 0.72 140.00 . . Q3 3.3 . -1.1 -1.0 3.6 3.0 0.13 0.66 137.75 . .
2014 July 3.4 - - -0.7 3.8 3.0 0.13 0.67 137.72 - - Aug. 3.3 - - -3.3 3.5 3.0 0.13 0.62 137.11 - - Sep. 3.2 - - 0.8 3.6 3.1 0.12 0.66 138.39 - - Oct. 2.9 - - -1.1 . 3.2 0.11 0.60 136.85 - - Nov. . - - . . . 0.11 0.59 145.03 - -
C43 Real gross domestic product
(annual percentage changes; quarterly data)
C44 Consumer price indices
(annual percentage changes; monthly data)
-10
-5
0
5
10
2000 2002 2004 2006 2008 2010 2012 2014-10
-5
0
5
10
euro areaUnited StatesJapan
-4
-2
0
2
4
6
2000 2002 2004 2006 2008 2010 2012 2014-4
-2
0
2
4
6
euro areaUnited StatesJapan
Sources: National data (columns 1, 2 (United States), 3, 4, 5 (United States), 6, 9 and 10); OECD (column 2 (Japan)); Eurostat (column 5 (Japan), euro area chart data);Thomson Reuters (columns 7 and 8); ECB calculations (column 11).1) Seasonally adjusted. The data for the United States refer to the private non-agricultural business sector.2) Japanese data from March to August 2011 include estimates for the three prefectures most affected by the earthquake in that country. Data collection was reinstated as of
September 2011.3) Period averages; M2 for the United States, M2+CDs for Japan.4) Percentages per annum. For further information on the three-month interbank deposit rate, see Section 4.6.5) For more information, see Section 8.2.6) General government debt consists of deposits, securities other than shares and loans outstanding at nominal value and is consolidated within
the general government sector (end of period).7) HICP data refer to the changing composition of the euro area. For further information, see the General Notes.
7)
9 DEVELOPMENTS OUTSIDE THE EURO AREA
9.1 Economic and financial developments in other EU Member States (annual percentage changes, unless otherwise indicated)
S 74ECBMonthly BulletinDecember 2014
HICP
Bulgaria Czech Denmark Croatia Lithuania Hungary Poland Romania Sweden UnitedRepublic Kingdom
1 2 3 4 5 6 7 8 9 10
2012 2.4 3.5 2.4 3.4 3.2 5.7 3.7 3.4 0.9 2.82013 0.4 1.4 0.5 2.3 1.2 1.7 0.8 3.2 0.4 2.6
2014 Q2 -1.6 0.2 0.4 0.3 0.2 -0.1 0.3 1.3 0.3 1.7 Q3 -1.2 0.7 0.4 0.3 0.3 0.1 -0.1 1.5 0.2 1.5
2014 Aug. -1.0 0.7 0.3 0.3 0.3 0.3 -0.1 1.3 0.2 1.5 Sep. -1.4 0.8 0.3 0.2 0.0 -0.5 -0.2 1.8 0.0 1.2 Oct. -1.5 0.7 0.3 0.5 0.3 -0.3 -0.3 1.8 0.3 1.3
General government deficit (-)/surplus (+) as a percentage of GDP
2011 -2.0 -2.9 -2.1 -7.7 -9.0 -5.5 -4.9 -5.5 -0.1 -7.62012 -0.5 -4.0 -3.9 -5.6 -3.2 -2.3 -3.7 -3.0 -0.9 -8.32013 -1.2 -1.3 -0.7 -5.2 -2.6 -2.4 -4.0 -2.2 -1.3 -5.8
General government gross debt as a percentage of GDP
2011 15.7 41.0 46.4 59.9 37.3 81.0 54.8 34.2 36.1 81.92012 18.0 45.5 45.6 64.4 39.9 78.5 54.4 37.3 36.4 85.82013 18.3 45.7 45.0 75.7 39.0 77.3 55.7 37.9 38.6 87.2
Long-term government bond yield as a percentage per annum; period average
2014 May 3.18 1.73 1.47 4.31 2.98 5.01 3.80 4.72 1.88 2.27 June 3.11 1.55 1.38 3.94 2.92 4.50 3.54 4.48 1.80 2.35 July 3.38 1.49 1.24 3.72 2.90 4.33 3.34 4.16 1.60 2.31 Aug. 3.41 1.38 1.07 3.68 2.61 4.73 3.36 4.21 1.53 2.12 Sep. 3.26 1.21 0.96 3.57 2.42 4.59 3.10 4.09 1.51 2.08 Oct. 3.31 1.10 1.13 3.54 2.27 4.21 2.72 3.90 1.30 1.82
3-month interest rate as a percentage per annum; period average
2014 May 0.83 0.37 0.35 0.87 0.41 2.55 2.72 2.62 0.92 0.53 June 0.81 0.35 0.36 0.89 0.38 2.50 2.69 2.24 0.85 0.54 July 0.76 0.35 0.38 0.87 0.35 2.29 2.68 1.97 0.52 0.56 Aug. 0.72 0.35 0.37 1.01 0.33 2.06 2.65 1.92 0.52 0.56 Sep. 0.70 0.35 0.29 1.16 0.24 1.98 2.45 2.52 0.48 0.56 Oct. 0.69 0.35 0.30 1.14 0.19 1.91 2.07 2.40 0.40 0.56
Real GDP
2012 0.5 -0.8 -0.8 -2.2 3.8 -1.5 1.8 0.6 -0.3 0.72013 1.1 -0.7 -0.1 -0.9 3.3 1.5 1.7 3.5 1.3 1.7
2014 Q1 1.5 2.6 0.6 -0.4 3.4 3.5 3.5 4.0 1.6 2.9 Q2 1.8 2.3 1.1 -1.0 3.3 3.6 3.4 2.2 2.4 3.2 Q3 1.5 2.4 0.3 . 2.6 3.1 3.4 3.0 2.1 3.0
Current and capital account balance as a percentage of GDP 1)
2012 . -0.2 5.5 0.2 1.8 4.4 -1.4 -3.1 5.6 -3.72013 3.7 -0.1 7.1 1.3 4.6 7.7 0.9 1.3 6.4 -4.3
2013 Q4 -2.1 0.4 8.3 -6.7 9.2 8.7 1.2 1.0 5.4 -4.52014 Q1 -0.3 10.0 3.5 -16.0 1.9 7.4 0.1 5.2 6.6 -4.2 Q2 3.1 -2.7 6.4 . 5.4 6.2 3.1 0.9 4.8 -4.8
Gross external debt as a percentage of GDP 1)
2012 . 60.1 177.7 102.7 77.8 158.2 72.3 . 187.4 . 2013 94.5 62.8 174.5 105.3 69.7 144.8 70.0 . 182.1 .
2013 Q4 94.5 62.9 174.5 105.3 69.7 144.8 70.0 . 182.1 . 2014 Q1 93.4 64.6 170.0 107.5 70.2 144.1 69.5 . 191.7 . Q2 93.0 66.7 168.3 . 69.6 145.5 70.6 . 191.7 .
Unit labour costs 2)
2012 4.5 2.6 1.9 -0.2 2.2 3.5 1.5 2.5 4.1 2.42013 7.2 0.5 1.5 1.4 3.0 0.8 0.1 4.5 1.3 1.5
2014 Q1 -0.3 1.3 1.4 -5.5 4.9 2.9 -3.3 0.9 1.6 0.9 Q2 -1.3 1.1 0.8 . 4.3 2.1 -3.4 0.1 2.0 -0.8 Q3 . -0.1 1.7 . 3.4 2.9 . . 2.0 -0.2
Standardised unemployment rate as a percentage of labour force (s.a.)
2012 12.3 7.0 7.5 16.1 13.4 10.9 10.1 6.9 8.0 7.92013 12.9 7.0 7.0 17.3 11.8 10.2 10.4 7.0 8.0 7.6
2014 Q2 11.5 6.2 6.5 16.9 11.4 8.0 9.2 6.9 8.0 6.3 Q3 11.2 5.9 6.5 16.3 9.9 7.5 8.6 6.8 7.8 .
2014 Aug. 11.2 6.3 6.5 16.4 9.8 7.5 8.6 6.8 8.0 5.9 Sep. 11.2 5.7 6.5 16.1 9.7 7.3 8.5 6.7 7.8 . Oct. 11.1 5.7 6.4 16.0 9.9 . 8.3 6.7 8.1 .
Sources: ECB, European Commission (Economic and Financial Affairs DG and Eurostat), national data, Thomson Reuters and ECB calculations.1) Data for Croatia according to BPM5.2) Data for Croatia and Poland according to ESA 95.
ECBMonthly BulletinDecember 2014S 76
list of chartsC1 Monetary aggregates s12C2 Counterparts s12C3 Components of monetary aggregates s13C4 Componentsoflonger-termfinancialliabilities s13C5 Loanstootherfinancialintermediariesandnon-financialcorporations s14C6 Loans to households s14C7 Loans to government s16C8 Loans to non-euro area residents s16C9 Deposits by insurance corporations and pension funds s17C10 Depositsbyotherfinancialintermediaries s17C11 Depositsbynon-financialcorporations s18C12 Deposits by households s18C13 Deposits by government and non-euro area residents s19C14 MFI holdings of securities s20C15 Households’ debt and net worth s33C16 Non-financialcorporations’debtandleverage s33C17 Total outstanding amounts and gross issues of securities other than shares issued by euro area residents s34C18 Net issues of securities other than shares: seasonally adjusted and non-seasonally adjusted s36C19 Annual growth rates of long-term debt securities, by sector of the issuer, in all currencies combined s37C20 Annual growth rates of short-term debt securities, by sector of the issuer, in all currencies combined s38C21 Annual growth rates for quoted shares issued by euro area residents s39C22 Gross issues of quoted shares by sector of the issuer s40C23 New deposits with an agreed maturity s42C24 Newloanswithafloatingrateandupto1year’sinitialratefixation s42C25 Euro area money market rates s43C26 3-month money market rates s43C27 Euro area spot yield curves s44C28 Euro area spot rates and spreads s44C29 Dow Jones EURO STOXX broad index, Standard & Poor’s 500 and Nikkei 225 s45C30 Employment – persons employed and hours worked s54C31 Unemployment and job vacancy rates s54C32 Debtbyfinancialinstruments s56C33 Debt by holder s56C34 Change in debt s57C35 Outstanding amounts of govern. assets and liabilities s57C36 Euro area b.o.p.: current account s60C37 Euro area b.o.p.: direct and portfolio investment s60C38 Euro area international investment position s64C39 Euro area direct and portfolio investment position s64C40 Main b.o.p. items mirroring developments in MFI net external transactions s69C41 Effective exchange rates s72C42 Bilateral exchange rates s72C43 Real gross domestic product s75C44 Consumer price indices s75
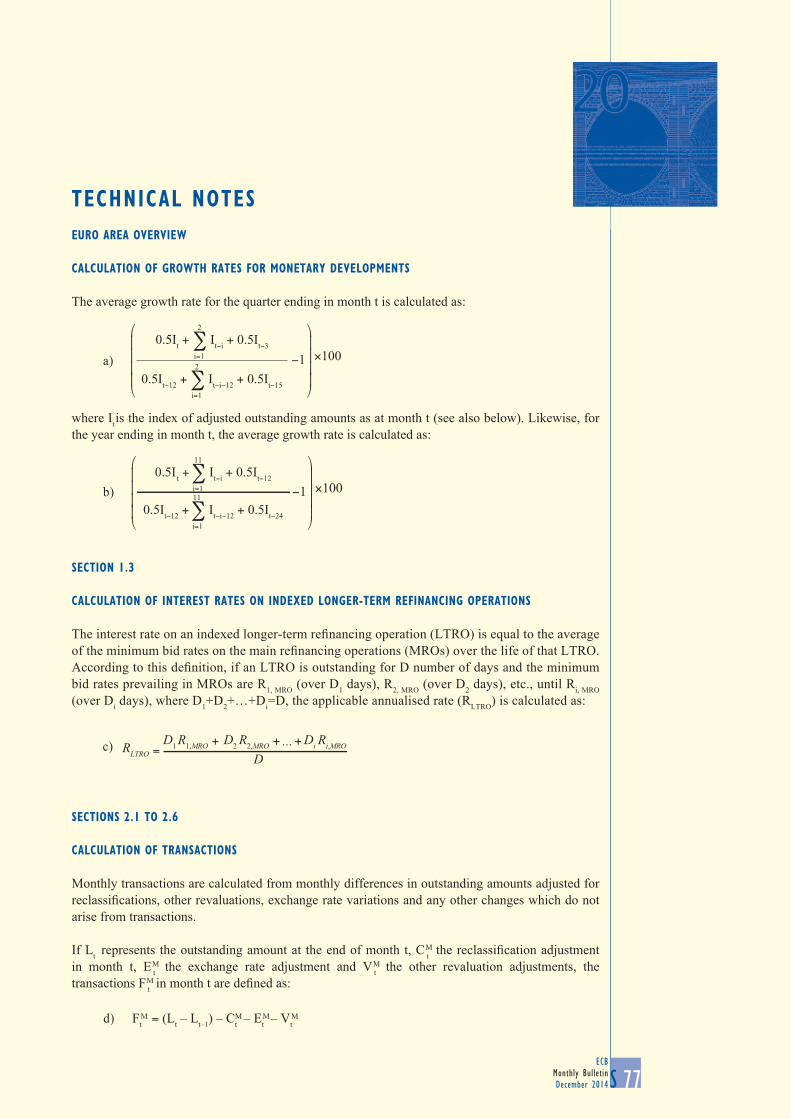
ECBMonthly BulletinDecember 2014 S 77
technical noteseuro area overview
calculation of Growth rates for monetary Developments
The average growth rate for the quarter ending in month t is calculated as:
where It is the index of adjusted outstanding amounts as at month t (see also below). Likewise, for the year ending in month t, the average growth rate is calculated as:
section 1.3
calculation of interest rates on inDeXeD lonGer-term refinancinG operations
Theinterestrateonanindexedlonger-termrefinancingoperation(LTRO)isequaltotheaverageoftheminimumbidratesonthemainrefinancingoperations(MROs)overthelifeofthatLTRO.Accordingtothisdefinition,ifanLTROisoutstandingforDnumberofdaysandtheminimumbid rates prevailing in MROs are R1, MRO (over D1 days), R2, MRO (over D2 days), etc., until Ri, MRO (over Di days), where D1+D2+…+Di=D, the applicable annualised rate (RLTRO) is calculated as:
sections 2.1 to 2.6
calculation of transactions
Monthly transactions are calculated from monthly differences in outstanding amounts adjusted for reclassifications,otherrevaluations,exchangeratevariationsandanyotherchangeswhichdonotarise from transactions.
If Lt represents the outstanding amount at the end of month t, C tM thereclassificationadjustment
in month t, E tM the exchange rate adjustment and V t
M the other revaluation adjustments, the transactions F t
Minmonthtaredefinedas:
−1
⎞
⎠
⎟⎟⎟⎟
⎞
⎠
⎟⎟⎟⎟
×100
0.5It−12 + ∑ It−i−12 + 0.5It−15
2
i=1
0.5It + ∑ It−i + 0.5It−3
2
i=1a)
⎞
⎠
⎟⎟⎟⎟
⎞
⎠
⎟⎟⎟⎟
−1 ×1000.5It + ∑ It−i + 0.5It−12
11
i=1
0.5It−12 + ∑ It−i−12 + 0.5It−24
11
i=1
b)
RLTRO =D1 R1,MRO + D2 R2,MRO + +Di Ri,MRO
D. . .c)
Ft = (Lt – Lt–1) – Ct – Et – VtM M M Md)

ECBMonthly BulletinDecember 2014S 78
Similarly, the quarterly transactions F tQforthequarterendinginmonthtaredefinedas:
where Lt-3 is the amount outstanding at the end of month t-3 (the end of the previous quarter) and, for example, C t
Qisthereclassificationadjustmentinthequarterendinginmontht.
For those quarterly series for which monthly observations are now available (see below), the quarterly transactions can be derived as the sum of the three monthly transactions in the quarter.
calculation of Growth rates for monthly series
Growth rates can be calculated from transactions or from the index of adjusted outstanding amounts. If F t
M and Ltaredefinedasabove,theindexIt of adjusted outstanding amounts in month t isdefinedas:
The base of the index (for the non-seasonally adjusted series) is currently set as December 2010 = 100. Time series for the index of adjusted outstanding amounts are available on the ECB’s website (www.ecb.europa.eu)inthe“Monetaryandfinancialstatistics”sub-sectionofthe“Statistics”section.
The annual growth rate at for month t – i.e. the change in the 12 months ending in month t – can be calculated using either of the following two formulae:
Unless otherwise indicated, the annual growth rates refer to the end of the indicated period. For example, the annual percentage change for the year 2002 is calculated in h) by dividing the index for December 2002 by the index for December 2001.
Growth rates for intra-annual periods can be derived by adapting formula h). For example, the month-on-month growth rate aM
t can be calculated as:
Finally, the three-month moving average (centred) for the annual growth rate of M3 is obtained as (at+1 + at + at-1)/3, where atisdefinedasing)orh)above.
Ft = (Lt – Lt–3) – Ct – Et – VtQ Q Q Qe)
I t = It−1 ×Ft
Lt−1
M⎛
⎝⎜
⎞
⎠⎟1+f )
at =Ft−i
Lt−1−i
M
i=0
⎛
⎝⎜
⎞
⎠⎟
⎡
⎣⎢
⎤
⎦⎥×100∏ 1 + −1
11
g)
at =It
It−12
⎛⎝⎜
⎞⎠⎟ × 100−1h)
ItIt−1
at =M −1
⎛
⎝⎜
⎞
⎠⎟ ×100i)
ECBMonthly BulletinDecember 2014 S 79
EURO AREA STATISTICS
Technical Notes
calculation of Growth rates for quarterly series
If F tQ and Lt-3 are defined as above, the index It of adjusted outstanding amounts for the quarter
endinginmonthtisdefinedas:
The annual growth rate in the four quarters ending in month t (i.e. at) can be calculated using formula h).
seasonal aDJustment of the euro area monetary statistics 1
The approach used is based on multiplicative decomposition using X-12-ARIMA.2 The seasonal adjustment may include a day-of-the-week adjustment, and for some series it is carried out indirectly by means of a linear combination of components. This is the case for M3, which is derived by aggregating the seasonally adjusted series for M1, M2 less M1, and M3 less M2.
Theseasonaladjustmentproceduresarefirstappliedtotheindexofadjustedoutstandingamounts.3 The resulting estimates of seasonal factors are then applied to the levels and to the adjustments arising from reclassifications and revaluations, in turn yielding seasonally adjusted transactions.Seasonal (and trading day) factors are revised at annual intervals or as required.
sections 3.1 to 3.5
equality of uses anD resources
InSection3.1thedataconformtoabasicaccountingidentity.Fornon-financialtransactions,totalusesequaltotalresourcesforeachtransactioncategory.Thisaccountingidentityisalsoreflectedinthefinancialaccount–i.e.foreachfinancialinstrumentcategory,totaltransactionsinfinancialassetsequaltotaltransactionsinliabilities.Intheotherchangesinassetsaccountandthefinancialbalancesheets, totalfinancialassetsequal total liabilities foreachfinancial instrumentcategory,with the exception ofmonetary gold and special drawing rights, which are by definition not aliability of any sector.
It = It−3 ×⎛
⎝⎜
⎞
⎠⎟Lt−3
FtQ
1+j)
1 For details, see “Seasonal adjustment of monetary aggregates and HICP for the euro area”, ECB (August 2000) and the “Monetary and financialstatistics”sub-sectionofthe“Statistics”sectionoftheECB’swebsite(www.ecb.europa.eu).
2 For details, see Findley, D., Monsell, B., Bell, W., Otto, M. and Chen, B. C. (1998), “New Capabilities and Methods of the X-12-ARIMA Seasonal Adjustment Program”, Journal of Business and Economic Statistics, 16, 2, pp.127-152, or“X-12-ARIMA Reference Manual”, Time Series Staff, Bureau of the Census, Washington, D.C.For internal purposes, the model-based approach of TRAMO-SEATS is also used. For details of TRAMO-SEATS, see Gomez, V. and Maravall, A. (1996), “Programs TRAMO and SEATS: Instructions for the User”, Banco de España, Working Paper No 9628, Madrid.
3 It follows that for the seasonally adjusted series, the level of the index for the base period (i.e. December 2010) generally differs from 100, reflectingtheseasonalityofthatmonth.

ECBMonthly BulletinDecember 2014S 80
calculation of balancinG items
The balancing items at the end of each account in Sections 3.1, 3.2 and 3.3 are computed as follows.
The trade balance equals euro area imports minus exports vis-à-vis the rest of the world for goods and services.
Netoperatingsurplusandmixed incomeisdefinedforresidentsectorsonlyand iscalculatedasgross value added (gross domestic product at market prices for the euro area) minus compensation of employees (uses) minus other taxes less subsidies on production (uses) minus consumption of fixedcapital(uses).
Netnationalincomeisdefinedforresidentsectorsonlyandiscomputedasnetoperatingsurplusandmixed income plus compensation of employees (resources) plus taxes less subsidies on production (resources) plus net property income (resources minus uses).
Net disposable income is also defined only for resident sectors and equals net national incomeplus net current taxes on income and wealth (resources minus uses) plus net social contributions (resourcesminususes)plusnetsocialbenefitsotherthansocialtransfersinkind(resourcesminususes) plus net other current transfers (resources minus uses).
Netsavingisdefinedforresidentsectorsandiscalculatedasnetdisposableincomeplusthenetadjustment for the change in the net equity of households in pension fund reserves (resources minus uses)minusfinalconsumptionexpenditure (uses).For the restof theworld, thecurrentexternalaccount is compiled as the trade balance plus all net income (resources minus uses).
Net lending/net borrowing is computed from the capital account as net saving plus net capital transfers (resources minus uses) minus gross capital formation (uses) minus acquisitions less disposals of non-produced non-financial assets (uses) plus consumption of fixed capital(resources). It can also be calculated in the financial account as total transactions in financialassetsminustotaltransactionsinliabilities(alsoknownaschangesinnetfinancialworth(wealth)duetotransactions).Forthehouseholdandnon-financialcorporationsectors,thereisastatisticaldiscrepancybetween the balancing items computed from the capital account and thefinancialaccount.
Changes innetfinancialworth(wealth)dueto transactionsarecomputedas total transactions infinancialassetsminustotaltransactionsinliabilities,whereasotherchangesinnetfinancialworth(wealth)arecalculatedas (total)otherchanges infinancialassetsminus (total)otherchanges inliabilities.
Netfinancialworth (wealth) iscalculatedas totalfinancialassetsminus total liabilities,whereaschanges in net financial worth (wealth) are equal to the sum of changes in net financial worth(wealth)duetotransactions(lending/netborrowingfromthefinancialaccount)andotherchangesinnetfinancialworth(wealth).
Changes in net worth (wealth) are calculated as changes in net worth (wealth) due to savings andcapitaltransfersplusotherchangesinnetfinancialworth(wealth)andotherchangesinnon-financialassets.
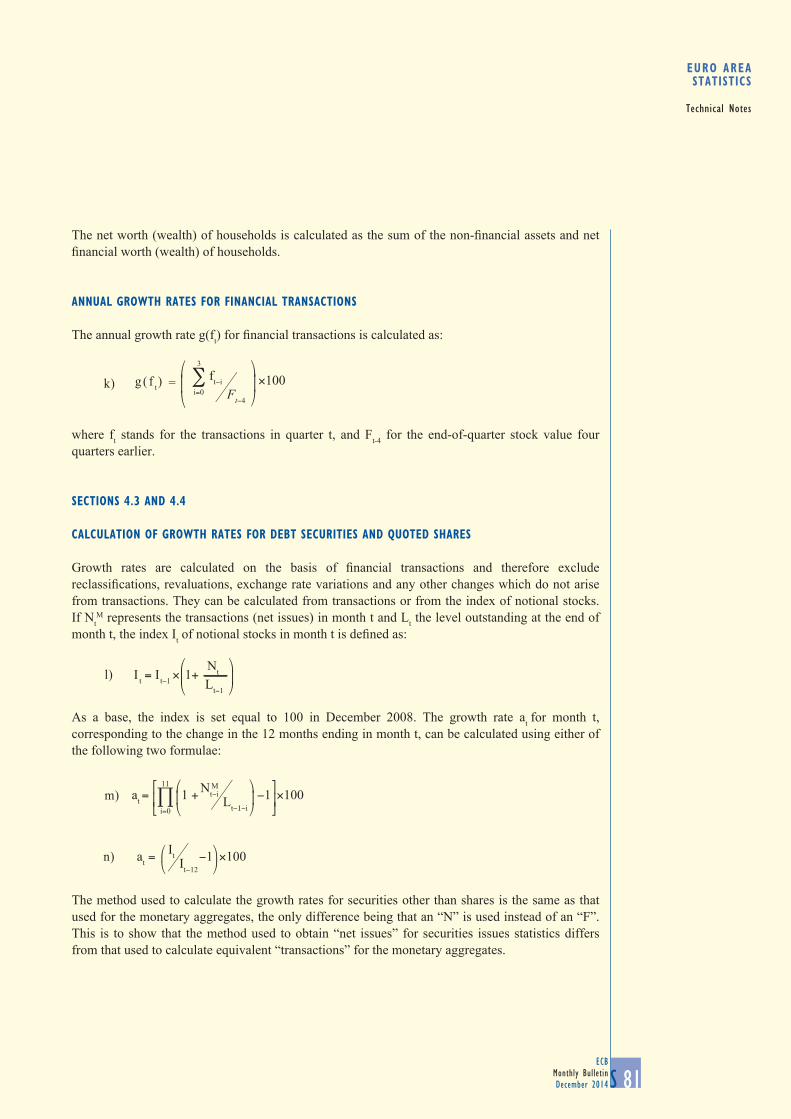
ECBMonthly BulletinDecember 2014 S 81
EURO AREA STATISTICS
Technical Notes
Thenetworth(wealth)ofhouseholdsiscalculatedasthesumofthenon-financialassetsandnetfinancialworth(wealth)ofhouseholds.
annual Growth rates for financial transactions
The annual growth rate g(ft)forfinancialtransactionsiscalculatedas:
where ft stands for the transactions in quarter t, and Ft-4 for the end-of-quarter stock value four quarters earlier.
sections 4.3 anD 4.4
calculation of Growth rates for Debt securities anD quoteD shares
Growth rates are calculated on the basis of financial transactions and therefore excludereclassifications,revaluations,exchangeratevariationsandanyotherchangeswhichdonotarisefrom transactions. They can be calculated from transactions or from the index of notional stocks. If Nt
M represents the transactions (net issues) in month t and Lt the level outstanding at the end of month t, the index Itofnotionalstocksinmonthtisdefinedas:
As a base, the index is set equal to 100 in December 2008. The growth rate at for month t, corresponding to the change in the 12 months ending in month t, can be calculated using either of the following two formulae:
The method used to calculate the growth rates for securities other than shares is the same as that used for the monetary aggregates, the only difference being that an “N” is used instead of an “F”. This is to show that the method used to obtain “net issues” for securities issues statistics differs from that used to calculate equivalent “transactions” for the monetary aggregates.
∑ ft−i 3
i=0k)
Ft−4
⎛
⎝⎜
⎞
⎠⎟ ×100g ( f t) =
I t = It−1 ×Nt
Lt−1
⎛
⎝⎜
⎞
⎠⎟1+l)
at =Nt−i
Lt−1−i
M
i=0
⎛
⎝⎜
⎞
⎠⎟
⎡
⎣⎢
⎤
⎦⎥×100∏ 1 + −1
11
m)
at =It
It−12
⎛⎝⎜
⎞⎠⎟×100−1n)
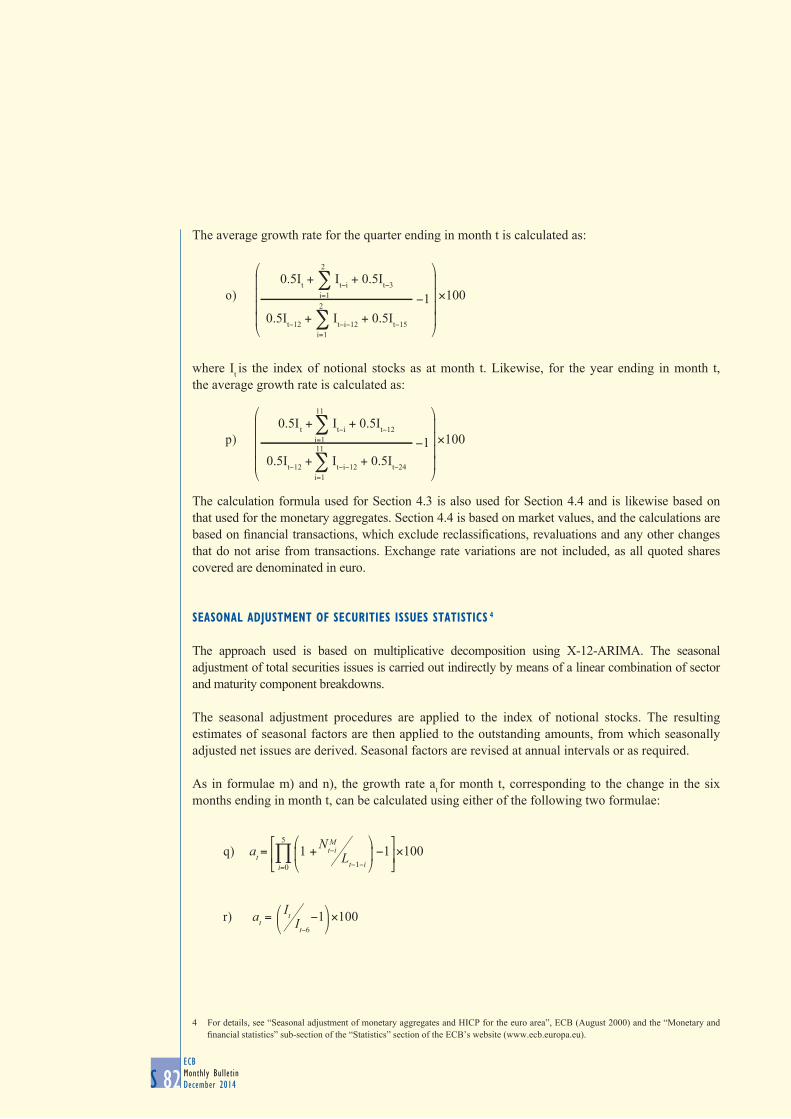
ECBMonthly BulletinDecember 2014S 82
The average growth rate for the quarter ending in month t is calculated as:
where It is the index of notional stocks as at month t. Likewise, for the year ending in month t, the average growth rate is calculated as:
The calculation formula used for Section 4.3 is also used for Section 4.4 and is likewise based on that used for the monetary aggregates. Section 4.4 is based on market values, and the calculations are basedonfinancialtransactions,whichexcludereclassifications,revaluationsandanyotherchangesthat do not arise from transactions. Exchange rate variations are not included, as all quoted shares covered are denominated in euro.
seasonal aDJustment of securities issues statistics 4
The approach used is based on multiplicative decomposition using X-12-ARIMA. The seasonal adjustment of total securities issues is carried out indirectly by means of a linear combination of sector and maturity component breakdowns.
The seasonal adjustment procedures are applied to the index of notional stocks. The resulting estimates of seasonal factors are then applied to the outstanding amounts, from which seasonally adjusted net issues are derived. Seasonal factors are revised at annual intervals or as required.
As in formulae m) and n), the growth rate at for month t, corresponding to the change in the six months ending in month t, can be calculated using either of the following two formulae:
−1
⎞
⎠
⎟⎟⎟⎟
⎞
⎠
⎟⎟⎟⎟
×1002
0.5It−12 + ∑ It−i−12 + 0.5It−15i=1
0.5It + ∑ It−i + 0.5It−3
2
i=1o)
⎞
⎠
⎟⎟⎟⎟
⎞
⎠
⎟⎟⎟⎟
−1 ×1000.5It + ∑ It−i + 0.5It−12
11
i=1
0.5It−12 + ∑ It−i−12 + 0.5It−24
11
i=1
p)
4 For details, see “Seasonal adjustment of monetary aggregates and HICP for the euro area”, ECB (August 2000) and the “Monetary and financialstatistics”sub-sectionofthe“Statistics”sectionoftheECB’swebsite(www.ecb.europa.eu).
at =Nt−i
Lt−1−i
M
i=0
⎛
⎝⎜
⎞
⎠⎟
⎡
⎣⎢
⎤
⎦⎥×100∏ 1 + −1
5
q)
at =It
It−6
⎛⎝⎜
⎞⎠⎟×100−1r)
ECBMonthly BulletinDecember 2014 S 83
EURO AREA STATISTICS
Technical Notes
table 1 in section 5.1
seasonal aDJustment of the hicp 4
The approach used is based on multiplicative decomposition using X-12-ARIMA (see footnote 2 on page S81). The seasonal adjustment of the overall HICP for the euro area is carried out indirectly by aggregating the seasonally adjusted euro area series for processed food, unprocessed food, industrial goods excluding energy, and services. Energy is added without adjustment, since there is no statistical evidence of seasonality. Seasonal factors are revised at annual intervals or as required.
table 1 in section 7.2
seasonal aDJustment of the balance of payments current account
The approach used is based on multiplicative decomposition, using X-12-ARIMA or TRAMO-SEATS depending on the item. The raw data for goods, services, income and current transfers are pre-adjustedinordertotakeintoaccountsignificantworkingdayeffects.Theworkingdayadjustmentfor goods and services takes account of national public holidays. The seasonal adjustment of these items is carried out using these pre-adjusted series. The seasonal adjustment of the total current account is carried out by aggregating the seasonally adjusted euro area series for goods, services, income and current transfers. Seasonal (and trading day) factors are revised at biannual intervals or as required.
section 7.3
calculation of Growth rates for the quarterly anD annual series
The annual growth rate for quarter t is calculated on the basis of quarterly transactions (Ft) and positions (Lt) as follows:
The growth rate for the annual series is equal to the growth rate in the last quarter of the year.
at
t= ×100⎛⎝⎜
⎛⎝⎜
⎞⎠⎟
⎞⎠⎟
i=t–3∏ 1 + Fi
Li–l
— −1s)

ECBMonthly BulletinDecember 2014 S 85
GENERAL NOTESThe “Euro area statistics” section of the Monthly Bulletin focuses on statistics for the euro area as a whole. More detailed and longer runs of data, with further explanatory notes, are available in the “Statistics” section of the ECB’s website (www.ecb.europa.eu). This allows user-friendly access to data via the ECB’s Statistical Data Warehouse (http://sdw.ecb.europa.eu), which includes search and download facilities. Further services available in the “Data services” sub-section include subscriptions to different datasets and a repository of compressed Comma Separated Value (CSV) files. For further information, please contact us at: [email protected].
In general, the cut-off date for the statistics included in the Monthly Bulletin is the day preceding the Governing Council of the ECB’s first meeting of the month. For this issue, the cut-off date was 3 December 2014.
Unless otherwise indicated, all data series relate to the group of 18 countries that are members of the euro area (the Euro 18) for the whole time series. For interest rates, monetary statistics, the HICP and reserve assets (and, for consistency reasons, the components and counterparts of M3 and the components of the HICP), euro area statistical series take into account the changing composition of the euro area.
The composition of the euro area has changed a number of times over the years. When the euro was introduced in 1999, the euro area comprised the following 11 countries (the Euro 11): Belgium, Germany, Ireland, Spain, France, Italy, Luxembourg, the Netherlands, Austria, Portugal and Finland. Greece then joined in 2001, forming the Euro 12. Slovenia joined in 2007, forming the Euro 13; Cyprus and Malta joined in 2008, forming the Euro 15; Slovakia joined in 2009, forming the Euro 16; and Estonia joined in 2011, forming the Euro 17. Latvia joined in 2014, bringing the number of euro area countries to 18. From October 2012, the euro area statistics also include the European Stability Mechanism, an international organisation resident in the euro area for statistical purposes.
EURO AREA SERIES WITH A FIXED COMPOSITION
Aggregated statistical series for fixed compositions of the euro area relate to a given fixed composition for the whole time series, regardless of the composition at the time to which the statistics relate. For example, aggregated series are calculated for the Euro 18 for all years, despite the fact that the euro area has only had this composition since 1 January 2014. Unless otherwise indicated, the ECB’s Monthly Bulletin provides statistical series for the current composition.
EURO AREA SERIES WITH A CHANGING COMPOSITION
Aggregated statistical series with a changing composition take into account the composition of the euro area at the time to which the statistics relate. For example, euro area statistical series with a changing composition aggregate the data of the Euro 11 for the period up to the end of 2000, the Euro 12 for the period from 2001 to the end of 2006, and so on. With this approach, each individual statistical series covers all of the various compositions of the euro area.
For the HICP, as well as statistics based on the balance sheet of the MFI sector (“monetary statistics”), rates of change are compiled from chain-linked indices, with the new composition
ECBMonthly BulletinDecember 2014S 86
introduced by the linking factor at the point of enlargement. Thus, if a country joins the euro area in January of a given year, the factors contributing to the chain-linked indices relate to the previous composition of the euro area up to and including December of the previous year, and the enlarged composition of the euro area thereafter. For further details on monetary statistics, refer to the “Manual on MFI balance sheet statistics”, available in the “Statistics” section of the ECB’s website.
Given that the composition of the European currency unit (ECU) does not coincide with the former currencies of the countries that have adopted the single currency, pre-1999 amounts originally expressed in the participating currencies and converted into ECU at current ECU exchange rates are affected by movements in the currencies of EU Member States that have not adopted the euro. To avoid this effect on the monetary statistics, pre-1999 data1 are expressed in units converted from national currencies at the irrevocable euro exchange rates established on 31 December 1998. Unless otherwise indicated, price and cost statistics before 1999 are based on data expressed in national currency terms.
Methods of aggregation and/or consolidation (including cross-country consolidation) have been used where appropriate.
Recent data are often provisional and may be revised. Discrepancies between totals and their components may arise from rounding.
The group “Other EU Member States” comprises (unless otherwise indicated) Bulgaria, the Czech Republic, Denmark, Croatia, Lithuania, Hungary, Poland, Romania, Sweden and the United Kingdom.
In most cases, the terminology used within the tables follows international standards, such as those contained in the European System of Accounts and the IMF Balance of Payments and International Investment Position Manual. Transactions refer to voluntary exchanges (measured directly or derived), while flows also encompass changes in outstanding amounts owing to price and exchange rate changes, write-offs and other changes.
In the tables, the wording “up to (x) years” means “up to and including (x) years”.
OVERVIEW
Developments in key indicators for the euro area are summarised in an overview table.
MONETARY POLICY STATISTICS
Section 1.4 shows statistics on minimum reserve and liquidity factors. Maintenance periods for minimum reserve requirements start every month on the settlement day of the main refinancing operation (MRO) following the Governing Council meeting for which the monthly assessment of the monetary policy stance is scheduled. They end on the day preceding the corresponding
1 Data on monetary statistics in Sections 2.1 to 2.8 are available for periods prior to January 1999 on the ECB’s website (http://www.ecb.europa.eu/stats/services/downloads/html/index.en.html) and in the SDW (http://sdw.ecb.europa.eu/browse.do?node=2018811).
ECBMonthly BulletinDecember 2014 S 87
EURO AREA STATISTICS
General Notes
settlement day in the following month. Annual/quarterly observations refer to averages for the last reserve maintenance period of the year/quarter.
Table 1 in Section 1.4 shows the components of the reserve base of credit institutions subject to reserve requirements. Liabilities vis-à-vis other credit institutions subject to the ESCB’s minimum reserve system, the ECB and participating national central banks are excluded from the reserve base. When a credit institution cannot provide evidence of the amount of its issues of debt securities with a maturity of up to two years which are held by the institutions mentioned above, it may deduct a certain percentage of these liabilities from its reserve base. The percentage used to calculate the reserve base was 10% until November 1999 and has been 30% since that date.
Table 2 in Section 1.4 contains average data for completed maintenance periods. First, the reserve requirement of each individual credit institution is calculated by applying the reserve ratios for the corresponding categories of liability to the eligible liabilities, using the balance sheet data from the end of each calendar month. Subsequently, each credit institution deducts from this figure a lump-sum allowance of €100,000. The resulting required reserves are then aggregated at the euro area level (column 1). Current account holdings (column 2) are the aggregate average daily current account holdings of credit institutions, including those that serve to fulfil reserve requirements. Excess reserves (column 3) are the average current account holdings over the maintenance period in excess of the required reserves. Deficiencies (column 4) are defined as the average shortfalls of current account holdings from required reserves over the maintenance period, computed on the basis of those credit institutions that have not fulfilled their reserve requirements. The interest rate on minimum reserves (column 5) is equal to the average, over the maintenance period, of the ECB’s rate (weighted according to the number of calendar days) on the Eurosystem’s MROs (see Section 1.3).
Table 3 in Section 1.4 shows the banking system’s liquidity position, which is defined as euro area credit institutions’ current account holdings with the Eurosystem in euro. All amounts are derived from the consolidated financial statement of the Eurosystem. Other liquidity-absorbing operations (column 7) exclude the issuance of debt certificates initiated by NCBs in Stage Two of EMU. Net other factors (column 10) represent the netted remaining items in the consolidated financial statement of the Eurosystem. Credit institutions’ current accounts (column 11) are equal to the difference between the sum of liquidity-providing factors (columns 1 to 5) and the sum of liquidity-absorbing factors (columns 6 to 10). Base money (column 12) is calculated as the sum of the deposit facility (column 6), banknotes in circulation (column 8) and credit institutions’ current account holdings (column 11).
MONEY, BANKING AND OTHER FINANCIAL CORPORATIONS
Chapter 2 shows balance sheet statistics for MFIs and other financial corporations. Other financial corporations comprise investment funds (other than money market funds, which are part of the MFI sector), financial vehicle corporations, insurance corporations and pension funds.
Section 2.1 shows the aggregated balance sheet of the MFI sector, i.e. the sum of the harmonised balance sheets of all MFIs resident in the euro area. MFIs comprise central banks, credit institutions as defined under EU law, money market funds and other institutions whose business it is to receive deposits and/or close substitutes for deposits from entities other than MFIs and, for their
ECBMonthly BulletinDecember 2014S 88
own account (at least in economic terms), to grant credit and/or make investments in securities. A complete list of MFIs is published on the ECB’s website.
Section 2.2 shows the consolidated balance sheet of the MFI sector, which is obtained by netting the aggregated balance sheet positions of MFIs in the euro area. Owing to a small amount of heterogeneity in recording practices, the sum of the inter-MFI positions is not necessarily zero; the balance is shown in column 10 of the liabilities side of Section 2.2. Section 2.3 sets out the euro area monetary aggregates and counterparts. These are derived from the consolidated MFI balance sheet and include positions of non-MFIs resident in the euro area held with MFIs resident in the euro area; they also take account of some monetary assets/liabilities of central government. Statistics on monetary aggregates and counterparts are adjusted for seasonal and trading day effects. The external liabilities item in Sections 2.1 and 2.2 shows the holdings by non-euro area residents of: (i) shares/units issued by money market funds located in the euro area; and (ii) debt securities issued with a maturity of up to two years by MFIs located in the euro area. In Section 2.3, however, these holdings are excluded from the monetary aggregates and contribute to the item “net external assets”.
Section 2.4 provides analysis, broken down by sector, type and original maturity, of loans granted by MFIs other than the Eurosystem (i.e. the banking system) resident in the euro area. Section 2.5 provides analysis, broken down by sector and instrument, of deposits held with the euro area banking system. Section 2.6 shows the securities held by the euro area banking system, broken down by type of issuer. Section 2.7 shows a quarterly currency breakdown for selected MFI balance sheet items.
Sections 2.2 to 2.6 also provide growth rates based on those transactions in the form of annual percentage changes.
Since 1 January 1999 statistical information has been collected and compiled on the basis of various ECB regulations concerning the balance sheet of the monetary financial institution sector. Since July 2010 this has been carried out on the basis of Regulation ECB/2008/322. Detailed sector definitions are set out in the third edition of the “Monetary financial institutions and markets statistics sector manual – Guidance for the statistical classification of customers” (ECB, March 2007).
Section 2.8 shows outstanding amounts and transactions on the balance sheet of euro area investment funds (other than money market funds, which are included in the MFI balance sheet statistics). An investment fund is a collective investment undertaking that invests capital raised from the public in financial and/or non-financial assets. A complete list of euro area investment funds is published on the ECB’s website. The balance sheet is aggregated, so investment funds’ assets include their holdings of shares/units issued by other investment funds. Shares/units issued by investment funds are also broken down by investment policy (i.e. into bond funds, equity funds, mixed funds, real estate funds, hedge funds and other funds) and by type (i.e. into open-end funds and closed-end funds). Section 2.9 provides further details on the main types of asset held by euro area investment funds. This section contains a geographical breakdown of the issuers of securities held by investment funds, as well as breaking issuers down by economic sector where they are resident in the euro area.
2 OJ L 15, 20.01.2009, p. 14.

ECBMonthly BulletinDecember 2014 S 89
EURO AREA STATISTICS
General Notes
Since December 2008 harmonised statistical information has been collected and compiled on the basis of Regulation ECB/2007/83 concerning statistics on the assets and liabilities of investment funds. Further information on these investment fund statistics can be found in the “Manual on investment fund statistics” (ECB, May 2009).
Section 2.10 shows the aggregated balance sheet of financial vehicle corporations (FVCs) resident in the euro area. FVCs are entities which are set up in order to carry out securitisation transactions. Securitisation generally involves the transfer of an asset or pool of assets to an FVC, with such assets reported on the FVC’s balance sheet as securitised loans, securities other than shares, or other securitised assets. Alternatively, the credit risk relating to an asset or pool of assets may be transferred to an FVC through credit default swaps, guarantees or other such mechanisms. Collateral held by the FVC against these exposures is typically a deposit held with an MFI or invested in securities other than shares. FVCs typically securitise loans which have been originated by the MFI sector. FVCs must report such loans on their statistical balance sheet, regardless of whether the relevant accounting rules allow the MFI to derecognise the loans. Data on loans which are securitised by FVCs but remain on the balance sheet of the relevant MFI (and thus remain in the MFI statistics) are provided separately. These quarterly data are collected under Regulation ECB/2008/304 as of December 2009.
Section 2.11 shows the aggregated balance sheet of insurance corporations and pension funds resident in the euro area. Insurance corporations cover both the insurance and reinsurance sectors, while pension funds include entities which have autonomy in terms of decision-making and keep a complete set of accounts (i.e. autonomous pension funds). This section also contains a geographical and sectoral breakdown of issuing counterparties for securities other than shares held by insurance corporations and pension funds.
EURO AREA ACCOUNTS
Section 3.1 shows quarterly integrated euro area accounts data, which provide comprehensive information on the economic activities of households (including non-profit institutions serving households), non-financial corporations, financial corporations and general government, as well as on the interaction between these sectors and both the euro area and the rest of the world. Non-seasonally adjusted data at current prices are displayed for the last available quarter, following a simplified sequence of accounts in accordance with the methodological framework of the European System of Accounts 1995.
In short, the sequence of accounts (transactions) comprises: (1) the generation of income account, which shows how production activity translates into various categories of income; (2) the allocation of primary income account, which records receipts and expenses relating to various forms of property income (for the economy as a whole; the balancing item of the primary income account is national income); (3) the secondary distribution of income account, which shows how the national income of an institutional sector changes because of current transfers; (4) the use of income account, which shows how disposable income is spent on consumption or saved; (5) the capital account, which shows how savings and net capital transfers are spent in the acquisition of non-financial assets (the balancing item of the capital account is net lending/net borrowing); and (6) the financial
3 OJ L 211, 11.08.2007, p. 8.4 OJ L 15, 20.01.2009, p. 1.

ECBMonthly BulletinDecember 2014S 90
account, which records the net acquisitions of financial assets and the net incurrence of liabilities. As each non-financial transaction is mirrored by a financial transaction, the balancing item of the financial account conceptually also equals net lending/net borrowing as calculated from the capital account.
In addition, opening and closing financial balance sheets are presented, which provide a picture of the financial wealth of each individual sector at a given point in time. Finally, other changes in financial assets and liabilities, in particular revaluations (e.g. those resulting from the impact of changes in asset prices) are shown.
The sectoral coverage of the financial account and the financial balance sheets is more detailed for the financial corporation sector, which is broken down into MFIs, investment funds (other than money market funds), other financial institutions (OFIs, including financial auxiliaries and captive financial institutions), and insurance corporations and pension funds.
Section 3.2 shows four-quarter cumulated flows (transactions and other changes) for households’ income, expenditure and accumulation accounts, as well as outstanding amounts in the financial and non-financial balance sheet accounts, presenting data in a more analytical manner. Sector-specific transactions and balancing items are arranged in a way that more clearly depicts the financing and investment decisions of households, while respecting the accounting identities presented in Section 3.1.
Sections 3.3 and 3.4 display four-quarter cumulated flows (transactions) for, respectively, non-financial corporations’ and financial corporations’ income and accumulation accounts, as well as outstanding amounts for the financial balance sheet accounts, presenting data in a more analytical manner.
Section 3.5 shows summary indicators and charts for households and non-financial corporations.
FINANCIAL MARKETS
The series on financial market statistics for the euro area cover those EU Member States that had adopted the euro at the time to which the statistics relate (i.e. a changing composition), with the exception of statistics on securities issues (Sections 4.1 to 4.4), which relate to the Euro 17 for the whole time series (i.e. a fixed composition).
Statistics on securities other than shares and statistics on quoted shares (Sections 4.1 to 4.4) are produced by the ECB using data from the ESCB and the BIS. Section 4.5 presents MFI interest rates on euro-denominated deposits from and loans to euro area residents. Statistics on money market interest rates, long-term government bond yields and stock market indices (Sections 4.6 to 4.8) are produced by the ECB using data from wire services.
Statistics on securities issues cover: (i) securities other than shares, excluding financial derivatives; and (ii) quoted shares. The former are presented in Sections 4.1, 4.2 and 4.3, while the latter are presented in Section 4.4. Debt securities are broken down into short-term and long-term securities. “Short-term” means securities with an original maturity of one year or less (in exceptional cases, two years or less). Securities with (i) a longer maturity, (ii) optional maturity dates, the latest of which is more than one year away, or (iii) indefinite maturity dates are classified as “long-term”.
ECBMonthly BulletinDecember 2014 S 91
EURO AREA STATISTICS
General Notes
Long-term debt securities issued by euro area residents are broken down further into fixed and variable rate issues. Fixed rate issues consist of issues where the coupon rate does not change during the life of the issue. Variable rate issues comprise all issues where the coupon is periodically refixed with reference to an independent interest rate or index. The euro-denominated securities indicated in Sections 4.1, 4.2 and 4.3 also include items expressed in national denominations of the euro.
Section 4.1 shows securities other than shares, broken down by original maturity, residency of the issuer and currency. It presents outstanding amounts, gross issues and net issues of securities other than shares, broken down into: (i) issues denominated in euro and issues in all currencies; (ii) issues by euro area residents and total issues; and (iii) total and long-term maturities. Net issues differ from the changes in outstanding amounts owing to valuation changes, reclassifications and other adjustments. This section also presents seasonally adjusted statistics, including six-month annualised seasonally adjusted growth rates for total and long-term debt securities. Seasonally adjusted data are derived from the index of notional stocks, from which the seasonal effects have been removed. See the Technical Notes for details.
Section 4.2 contains a sectoral breakdown of outstanding amounts, gross issues and net issues for issuers resident in the euro area in line with the ESA 95. The ECB is included in the Eurosystem.
The total outstanding amounts for total and long-term debt securities in column 1 of Table 1 in Section 4.2 correspond to the data on outstanding amounts for total and long-term debt securities issued by euro area residents in column 7 of Section 4.1. The outstanding amounts for total and long-term debt securities issued by MFIs in column 2 of Table 1 in Section 4.2 are broadly comparable with the data on debt securities issued on the liabilities side of the aggregated MFI balance sheet in column 8 of Table 2 in Section 2.1. The total net issues for total debt securities in column 1 of Table 2 in Section 4.2 correspond to the data on total net issues by euro area residents in column 9 of Section 4.1. The residual difference between long-term debt securities and total fixed and variable rate long-term debt securities in Table 1 of Section 4.2 consists of zero coupon bonds and revaluation effects.
Section 4.3 shows seasonally adjusted and non-seasonally adjusted growth rates for debt securities issued by euro area residents (broken down by maturity, type of instrument, sector of the issuer and currency), which are based on financial transactions that occur when an institutional unit incurs or redeems liabilities. The growth rates therefore exclude reclassifications, revaluations, exchange rate variations and any other changes that do not arise from transactions. The seasonally adjusted growth rates have been annualised for presentational purposes. See the Technical Notes for details.
Columns 1, 4, 6 and 8 in Table 1 of Section 4.4 show the outstanding amounts of quoted shares issued by euro area residents broken down by issuing sector. The monthly data for quoted shares issued by non-financial corporations correspond to the quarterly series shown in Section 3.4 (financial balance sheet; quoted shares).
Columns 3, 5, 7 and 9 in Table 1 of Section 4.4 show annual growth rates for quoted shares issued by euro area residents (broken down by the sector of the issuer), which are based on financial transactions that occur when an issuer issues or redeems shares for cash, excluding investments in the issuer’s own shares. The calculation of annual growth rates excludes reclassifications, revaluations and any other changes that do not arise from transactions.
ECBMonthly BulletinDecember 2014S 92
Section 4.5 presents statistics on all the interest rates that MFIs resident in the euro area apply to euro-denominated deposits and loans vis-à-vis households and non-financial corporations resident in the euro area. Euro area MFI interest rates are calculated as a weighted average (by corresponding business volume) of the euro area countries’ interest rates for each category.
MFI interest rate statistics are broken down by type of business coverage, sector, instrument category and maturity, period of notice or initial period of interest rate fixation. These MFI interest rate statistics replaced the ten transitional statistical series on euro area retail interest rates that had been published in the Monthly Bulletin as of January 1999.
Section 4.6 presents money market interest rates for the euro area, the United States and Japan. For the euro area, a broad spectrum of money market interest rates is covered, ranging from interest rates on overnight deposits to those on twelve-month deposits. Before January 1999, synthetic euro area interest rates were calculated on the basis of national rates weighted by GDP. With the exception of the overnight rate prior to January 1999, monthly, quarterly and yearly values are period averages. Overnight deposits are represented by end-of-period interbank deposit bid rates up to and including December 1998 and period averages for the euro overnight index average (EONIA) thereafter. As of January 1999, euro area interest rates on one, three, six and twelve-month deposits are euro interbank offered rates (EURIBOR); prior to that date, they are London interbank offered rates (LIBOR) where available. For the United States and Japan, interest rates on three-month deposits are represented by LIBOR.
Section 4.7 shows end-of-period rates estimated from nominal spot yield curves based on AAA-rated euro-denominated bonds issued by euro area central governments. The yield curves are estimated using the Svensson model5. Spreads between the ten-year rates and the three-month and two-year rates are also released. Additional yield curves (daily releases, including charts and tables) and the corresponding methodological information are available at: http://www.ecb.europa.eu/stats/money/yc/html/index.en.html. Daily data can also be downloaded.
Section 4.8 shows stock market indices for the euro area, the United States and Japan.
PRICES, OUTPUT, DEMAND AND LABOUR MARKETS
Most of the data described in this section are produced by the European Commission (mainly Eurostat) and national statistical authorities. Euro area results are obtained by aggregating data for individual countries. As far as possible, the data are harmonised and comparable. Statistics on labour costs indices, GDP and expenditure components, value added by economic activity, industrial production, retail sales passenger car registrations and employment in terms of hours worked are working day-adjusted.
The Harmonised Index of Consumer Prices (HICP) for the euro area (Table 1 in Section 5.1) is available from 1995 onwards. It is based on national HICPs, which follow the same methodology in all euro area countries. The breakdown into goods and services components is derived from the classification of individual consumption by purpose (Coicop/HICP). The HICP covers monetary expenditure by households on final consumption in the economic territory of the euro area. The table
5 Svensson, L.E., “Estimating and Interpreting Forward Interest Rates: Sweden 1992-1994”, CEPR Discussion Papers, No 1051. Centre for Economic Policy Research, London, 1994.
ECBMonthly BulletinDecember 2014 S 93
EURO AREA STATISTICS
General Notes
includes seasonally adjusted HICP data, which are compiled by the ECB, and experimental HICP-based indices of administered prices.
Industrial producer prices (Table 2 in Section 5.1), industrial production, industrial turnover and retail sales (Section 5.2) are covered by Council Regulation (EC) No 1165/98 of 19 May 1998 concerning short-term statistics6. Since January 2009 the revised classification of economic activities (NACE Revision 2), as covered by Regulation (EC) No 1893/2006 of the European Parliament and of the Council of 20 December 2006 establishing the statistical classification of economic activities NACE Revision 2 and amending Council Regulation (EEC) No 3037/90, as well as certain EC Regulations on specific statistical domains7, has been applied in the production of short-term statistics. The breakdown by end use of product for industrial producer prices and industrial production is the harmonised sub-division of industry excluding construction (NACE Revision 2, sections B to E) into Main Industrial Groupings (MIGs) as defined by Commission Regulation (EC) No 656/2007 of 14 June 20078. Industrial producer prices reflect the ex-factory gate prices of producers. They include indirect taxes except VAT and other deductible taxes. Industrial production reflects the value added of the industries concerned.
The two non-energy commodity price indices shown in Table 3 in Section 5.1 are compiled with the same commodity coverage, but using two different weighting schemes: one based on the respective commodity imports of the euro area (columns 2-4), and the other (columns 5-7) based on estimated euro area domestic demand, or “use”, taking into account information on imports, exports and the domestic production of each commodity (ignoring, for the sake of simplicity, inventories, which are assumed to be relatively stable over the observed period). The import-weighted commodity price index is appropriate for analysing external developments, while the use-weighted index is suitable for the specific purpose of analysing international commodity price pressures on euro area inflation. The use-weighted commodity price indices are experimental data. For more details as regards the compilation of the ECB commodity price indices, see Box 1 in the December 2008 issue of the Monthly Bulletin.
The labour cost indices (Table 5 in Section 5.1) measure the changes in labour costs per hour worked in industry (including construction) and market services. Their methodology is laid down in Regulation (EC) No 450/2003 of the European Parliament and of the Council of 27 February 2003 concerning the labour cost index9 and in the implementing Commission Regulation (EC) No 1216/2003 of 7 July 200310. A breakdown of the labour cost indices for the euro area is available by labour cost component (wages and salaries, and employers’ social contributions plus employment-related taxes paid by the employer less subsidies received by the employer) and by economic activity. The ECB calculates the indicator of negotiated wages (memo item in Table 5 of Section 5.1) on the basis of non-harmonised, national-definition data.
Unit labour cost components (Table 4 in Section 5.1), GDP and its components (Tables 1 and 2 in Section 5.2), GDP deflators (Table 3 in Section 5.1) and employment statistics (Table 1 in Section 5.3) are derived from the ESA 201011 quarterly national accounts. As of September 2014, the updated ESA 2010 regulation replaces the ESA 95 and becomes compulsory in the Member States of the EU. As in the past, the new regulation defines the methodology on common standards,
6 OJ L 162, 5.6.1998, p. 1.7 OJ L 393, 30.12.2006, p. 1.8 OJ L 155, 15.6.2007, p. 3.9 OJ L 69, 13.3.2003, p. 1.10 OJ L 169, 8.7.2003, p. 37.11 OJ L 174, 26.6.2013, p. 1.
ECBMonthly BulletinDecember 2014S 94
definitions, classifications and accounting rules used for compiling national accounts and tables in the EU as well as the data transmission programme setting out the time limits by which Member States shall make their data available. The ESA 2010 also employs concepts related to other statistical classifications, e.g. the NACE Revision 2. The publication of euro area national accounts data applying this new classification began in November 2014.
Indices for turnover in industry and for the retail trade (Table 4 in Section 5.2) measure the turnover, including all duties and taxes (with the exception of VAT), invoiced during the reference period. Retail trade turnover covers all retail trade (excluding sales of motor vehicles and motorcycles), including automotive fuel. New passenger car registrations cover registrations of both private and commercial passenger cars.
Qualitative business and consumer survey data (Table 5 in Section 5.2) draw on the European Commission Business and Consumer Surveys.
Unemployment rates (Table 4 in Section 5.3) conform to International Labour Organization guidelines. They refer to persons actively seeking work as a share of the labour force, using harmonised criteria and definitions. The labour force estimates underlying the unemployment rate are different from the sum of the employment and unemployment levels published in Section 5.3.
GOVERNMENT FINANCE
Sections 6.1 to 6.5 show the general government fiscal position in the euro area. The data are mainly consolidated and are based on the ESA 2010 methodology.
The annual euro area aggregates in Sections 6.1 to 6.3 are compiled by the ECB on the basis of statistical reporting requirements laid down in the ECB Guideline of 3 June 2014 on government finance statistics (ECB/2014/21)12. Harmonised data provided by the NCBs are regularly updated. Annual figures on government revenue and expenditure (Section 6.1) include transactions with the EU budget (e.g. agricultural subsidies).
The quarterly euro area aggregates in Sections 6.1 to 6.3 are provided by Eurostat and may not be fully consistent with the annual data, for instance owing to different data cut-off dates and the exclusion of EU budget transactions in the quarterly data.
The monthly euro area aggregates in Section 6.4 are compiled by the ECB on the basis of security-by-security information provided from the ESCB’s Centralised Securities Database (CSDB)13.
Individual euro area country data in Section 6.5 are reported on the basis of Eurostat (for government deficit/surplus and government debt) and CSDB data (for debt service and average nominal yields). The annual figures presented in Section 6.5 on government deficit/surplus and government debt are reported to the European Commission under Commission Regulation (EU) No 220/2014 of 7 March 2014 amending Council Regulation (EC) No 479/2009 as regards references to the European system of national and regional accounts in the European Union.
12 OJ L 267, 06.09.2014, p. 9–26.13 See the methodological note on “Debt securities issuance and service by EU governments”, available on the ECB’s website (http://www.
ecb.europa.eu).
ECBMonthly BulletinDecember 2014 S 95
EURO AREA STATISTICS
General Notes
EXTERNAL TRANSACTIONS AND POSITIONS
On 9 December 2011 the ECB Guideline on the statistical requirements of the European Central Bank in the field of external statistics (ECB/2011/23)14 was adopted by the Governing Council of the ECB. This legal act lays down the new reporting requirements in the field of external statistics, which mainly reflect methodological changes introduced in the sixth edition of the IMF’s Balance of Payments and International Investment Position Manual (BPM6).
The sign conventions for the b.o.p. current and capital accounts (tables in Sections 7.1, 7.2 and 7.4) give a plus sign for surpluses and credit and debit transactions; a negative sign denotes a deficit. As regards the b.o.p. financial account (tables in Sections 7.1, 7.3 and 7.4), a plus sign represents a net increase, and a minus sign represents a net decrease, in assets or liabilities.
The euro area b.o.p. is compiled by the ECB. Recent monthly figures should be regarded as provisional. Data are revised when figures for the following month and/or the detailed quarterly b.o.p. are published. Earlier data are revised periodically or as a result of methodological changes in the compilation of the source data.
Table 1 in Section 7.2 also contains seasonally adjusted data for the current account. Where appropriate, the adjustment also covers working day, leap year and/or Easter-related effects. Table 4 in Section 7.2 and Table 9 in Section 7.3 present a breakdown of the euro area b.o.p. and i.i.p. vis-à-vis major partner countries, both individually and as a group, distinguishing between EU Member States outside the euro area and countries or areas outside the European Union. The breakdown also shows transactions and positions vis-à-vis EU institutions and international organisations (which, with the exception of the ECB and the European Stability Mechanism, are considered to be resident outside the euro area for statistical purposes, regardless of their physical location) as well as offshore centres. The breakdown does not cover transactions or positions in portfolio investment liabilities, financial derivatives or international reserves. In addition, separate data are not provided for investment income payable to Brazil, mainland China, India or Russia.
The data on the euro area b.o.p. financial account and i.i.p. in Section 7.3 are based on transactions and positions vis-à-vis non-residents of the euro area, regarding the euro area as a single economic entity. The i.i.p. is valued at current market prices, with the exception of direct investment, where book values are generally used for unquoted shares, and other investment (e.g. loans and deposits).
Table 1 in Section 7.3 summarises the i.i.p. and financial transactions in the euro area b.o.p. In Table 2, columns 6 and 12 refer respectively to direct investment by resident units abroad and direct investment by non-resident units in the euro area. These direct investment concepts are from the previous edition of the IMF’s Balance of Payments and International Investment Position Manual (BPM5) and are aimed at bridging the gap between the concepts in the two manuals.
In Table 5 in Section 7.3, the breakdown into “currency and deposits” and “loans” is based on the sector of the non-resident counterpart – i.e. assets vis-à-vis non-resident banks are classified as deposits, whereas assets vis-à-vis other non-resident sectors are classified as loans. This breakdown follows the distinction made in other statistics, such as the MFI consolidated balance sheet, and conforms to the IMF Balance of Payments Manual.
14 OJ L 65, 3.3.2012, p. 1.
ECBMonthly BulletinDecember 2014S 96
The outstanding amounts for the Eurosystem’s international reserves and related assets and liabilities are shown in Table 7 of Section 7.3. These figures are not fully comparable with those in the Eurosystem’s weekly financial statement owing to differences in coverage and valuation. The data in Table 7 are in line with the recommendations for the template on international reserves and foreign currency liquidity. By definition, the assets included in the Eurosystem’s international reserves take account of the changing composition of the euro area. Before countries join the euro area, the assets of their national central banks are included in portfolio investment (in the case of securities) or other investment (in the case of other assets). Changes in the gold holdings of the Eurosystem (column 3) are due to transactions in gold within the terms of the Central Bank Gold Agreement of 26 September 1999, which was updated on 27 September 2009. More information on the statistical treatment of the Eurosystem’s international reserves can be found in a publication entitled “Statistical treatment of the Eurosystem’s international reserves” (October 2000), which can be downloaded from the ECB’s website. The website also contains more comprehensive data in accordance with the template on international reserves and foreign currency liquidity.
The euro area’s gross external debt statistics in Table 8 of Section 7.3 represent outstanding actual (rather than contingent) liabilities vis-à-vis non-euro area residents that require the payment of principal and/or interest by the debtor at one or more points in the future. Table 8 shows a breakdown of gross external debt by instrument and institutional sector, as well as net external debt (i.e. gross external debt net of external debt assets).
Section 7.4 contains a monetary presentation of the euro area balance of payments, showing the transactions by non-MFIs that mirror the net external transactions by MFIs. Included in the transactions by non-MFIs are b.o.p. transactions for which a sectoral breakdown is not available. These concern the current and capital accounts (column 2) and financial derivatives (column 11). A methodological note on the monetary presentation of the euro area balance of payments is available in the “Statistics” section of the ECB’s website. See also Box 1 in the June 2003 issue of the Monthly Bulletin.
Section 7.5 shows data on euro area external trade in goods. The source is Eurostat. Value data and volume indices are seasonally and working day-adjusted. The breakdown by product group in columns 4 to 6 and 9 to 11 of Table 1 in Section 7.5 is in line with the classification contained in the Broad Economic Categories and corresponds to the basic classes of goods in the System of National Accounts. Manufactured goods (columns 7 and 12) and oil (column 13) are in line with the SITC Rev. 4 definition. The geographical breakdown (Table 3 in Section 7.5) shows major trading partners both individually and in regional groups. China excludes Hong Kong. On account of differences in definitions, classification, coverage and time of recording, external trade data, in particular for imports, are not fully comparable with the goods item in the b.o.p. statistics (Sections 7.1 and 7.2). Part of the difference arises from the inclusion of insurance and freight services in the recording of imported goods in external trade data. For more details see Table 1 in Euro area balance of payments and international investment position statistics – 2009 quality report, ECB, Frankfurt am Main, March 2010.
Industrial import prices and industrial producer export prices (or industrial output prices for the non-domestic market) shown in Table 2 in Section 7.5 were introduced by Regulation (EC) No 1158/2005 of the European Parliament and of the Council of 6 July 2005 amending Council Regulation (EC) No 1165/98, which is the principal legal basis for short-term statistics. The industrial import price index covers industrial products imported from outside the euro area under
ECBMonthly BulletinDecember 2014 S 97
EURO AREA STATISTICS
General Notes
sections B to E of the Statistical Classification of Products by Activity in the European Economic Community (CPA) and all institutional import sectors except households, governments and non-profit institutions. It reflects the cost, insurance and freight price excluding import duties and taxes, and refers to actual transactions in euro recorded at the point when ownership of the goods is transferred. The industrial producer export prices cover all industrial products exported directly by euro area producers to the extra-euro area market under sections B to E of NACE Revision 2. Exports from wholesalers and re-exports are not covered. The indices reflect the free on board price expressed in euro and calculated at the euro area frontier, including any indirect taxes except VAT and other deductible taxes. Industrial import prices and industrial producer export prices are available by Main Industrial Grouping as defined by Commission Regulation (EC) No 656/2007 of 14 June 2007. For more details, see Box 11 in the December 2008 issue of the Monthly Bulletin.
EXCHANGE RATES
Section 8.1 shows nominal and real effective exchange rate indices for the euro, which are calculated by the ECB on the basis of weighted averages of the euro’s bilateral exchange rates against the currencies of the selected trading partners of the euro area. A positive change denotes an appreciation of the euro. Weights are based on trade in manufactured goods with those trading partners in the periods 1995-1997, 1998-2000, 2001-2003, 2004-2006 and 2007-2009 and are calculated to account for third-market effects. The EER indices are obtained by chain-linking the indicators based on each of these five sets of trade weights at the end of each three-year period. The base period of the resulting EER index is the first quarter of 1999. The EER-20 group of trading partners is composed of the 10 non-euro area EU Member States plus Australia, Canada, China, Hong Kong, Japan, Norway, Singapore, South Korea, Switzerland and the United States. The EER-19 group excludes Croatia. The EER-39 group comprises the EER-20 plus the following countries: Algeria, Argentina, Brazil, Chile, Iceland, India, Indonesia, Israel, Malaysia, Mexico, Morocco, New Zealand, the Philippines, Russia, South Africa, Taiwan, Thailand, Turkey and Venezuela. Real EERs are calculated using consumer price indices (CPIs), producer price indices (PPIs), gross domestic product deflators and unit labour costs, both for the manufacturing sector (ULCM) and for the total economy (ULCT). ULCM-deflated EERs are available only for the EER-19.
For more detailed information on the calculation of the EERs, see the relevant methodological note and ECB Occasional Paper No 134 (“Revisiting the effective exchange rates of the euro” by Martin Schmitz, Maarten De Clercq, Michael Fidora, Bernadette Lauro and Cristina Pinheiro, June 2012), which can be downloaded from the ECB’s website.
The bilateral rates shown in Section 8.2 are monthly averages of those published daily as reference rates for these currencies. The most recent rate for the Icelandic krona is 290.0 per euro and refers to 3 December 2008.
DEVELOPMENTS OUTSIDE THE EURO AREA
Statistics on other EU Member States (Section 9.1) follow the same principles as data relating to the euro area. However, data shown in this table on current and capital accounts and gross external debt follow the respective national concept and do not include special-purpose vehicles. The data for the United States and Japan contained in Section 9.2 are obtained from national sources.

ECBMonthly BulletinDecember 2014 I
anneXes
chronoloGy of monetary policy measures of the eurosystem1
1 The chronology of monetary policy measures taken by the Eurosystem between 1999 and 2011 can be found in the ECB’s Annual Report for the respective years.
12 January 2012
TheGoverningCounciloftheECBdecidesthattheinterestrateonthemainrefinancingoperationsand the interest rates on the marginal lending facility and the deposit facility will remain unchanged at 1.00%, 1.75% and 0.25% respectively.
9 february 2012
TheGoverningCounciloftheECBdecidesthattheinterestrateonthemainrefinancingoperationsand the interest rates on the marginal lending facility and the deposit facility will remain unchanged at1.00%,1.75%and0.25%respectively.Italsoapprovesspecificnationaleligibilitycriteriaandrisk control measures for the temporary acceptance in a number of countries of additional credit claims as collateral in Eurosystem credit operations.
8 march, 4 april anD 3 may 2012
TheGoverningCounciloftheECBdecidesthattheinterestrateonthemainrefinancingoperationsand the interest rates on the marginal lending facility and the deposit facility will remain unchanged at 1.00%, 1.75% and 0.25% respectively.
6 June 2012
TheGoverningCounciloftheECBdecidesthattheinterestrateonthemainrefinancingoperationsand the interest rates on the marginal lending facility and the deposit facility will remain unchanged at 1.00%, 1.75% and 0.25% respectively. It also decides on the details as regards the tender proceduresandmodalitiestobeappliedinitsrefinancingoperationsupto15January2013,notablytocontinueitsfixedratetenderprocedureswithfullallotment.
5 July 2012
TheGoverningCouncil of theECBdecides to decrease the interest rate on themain refinancingoperations by 25 basis points to 0.75%, starting from the operation to be settled on 11 July 2012. In addition, it decides to decrease the interest rates on both the marginal lending facility and the deposit facility by 25 basis points, to 1.50% and 0.00% respectively, both with effect from 11 July 2012.
2 auGust 2012
TheGoverningCounciloftheECBdecidesthattheinterestrateonthemainrefinancingoperationsand the interest rates on the marginal lending facility and the deposit facility will remain unchanged at 0.75%, 1.50% and 0.00% respectively.
ECBMonthly BulletinDecember 2014II
6 september 2012
TheGoverningCounciloftheECBdecidesthattheinterestrateonthemainrefinancingoperationsand the interest rates on the marginal lending facility and the deposit facility will remain unchanged at 0.75%, 1.50% and 0.00% respectively. It also decides on the modalities for undertaking Outright Monetary Transactions (OMTs) in secondary markets for sovereign bonds in the euro area.
4 october anD 8 november 2012
TheGoverningCounciloftheECBdecidesthattheinterestrateonthemainrefinancingoperationsand the interest rates on the marginal lending facility and the deposit facility will remain unchanged at 0.75%, 1.50% and 0.00% respectively.
6 December 2012
TheGoverningCounciloftheECBdecidesthattheinterestrateonthemainrefinancingoperationsand the interest rates on the marginal lending facility and the deposit facility will remain unchanged at 0.75%, 1.50% and 0.00% respectively. It also decides on the details as regards the tender proceduresandmodalitiestobeappliedinitsrefinancingoperationsupto9July2013,notablytocontinueitsfixedratetenderprocedureswithfullallotment.
10 January, 7 february, 7 march anD 4 april 2013
TheGoverningCounciloftheECBdecidesthattheinterestrateonthemainrefinancingoperationsand the interest rates on the marginal lending facility and the deposit facility will remain unchanged at 0.75%, 1.50% and 0.00% respectively.
2 may 2013
TheGoverningCouncilof theECBdecidestodecreasetheinterestrateonthemainrefinancingoperations by 25 basis points to 0.50%, starting from the operation to be settled on 8 May 2013. In addition, it decides to decrease the interest rate on the marginal lending facility by 50 basis points to 1.00%, with effect from 8 May 2013, and to keep the interest rate on the deposit facility unchanged at 0.00%. It also decides on the details as regards the tender procedures and modalities tobeappliedinitsrefinancingoperationsupto8July2014,notablytocontinueitsfixedratetenderprocedures with full allotment.
6 June, 4 July, 1 auGust, 5 september anD 2 october 2013
TheGoverningCounciloftheECBdecidesthattheinterestrateonthemainrefinancingoperationsand the interest rates on the marginal lending facility and the deposit facility will remain unchanged at 0.50%, 1.00% and 0.00% respectively.
ECBMonthly BulletinDecember 2014
Chronology
III
7 november 2013
The Governing Council of the ECB decides to decrease the interest rate on the main refinancing operations by 25 basis points to 0.25%, starting from the operation to be settled on13 November 2013. In addition, it decides to decrease the interest rate on the marginal lending facility by 25 basis points to 0.75%, with effect from 13 November 2013, and to keep the interest rate on the deposit facility unchanged at 0.00%. It also decides on the details as regards the tender proceduresandmodalitiestobeappliedinitsrefinancingoperationsupto7July2015,notablytocontinueitsfixedratetenderprocedureswithfullallotment.
5 December 2013, 9 January, 6 february, 6 march, 3 april anD 8 may 2014
TheGoverningCounciloftheECBdecidesthattheinterestrateonthemainrefinancingoperationsand the interest rates on the marginal lending facility and the deposit facility will remain unchanged at 0.25%, 0.75% and 0.00% respectively.
5 June 2014
TheGoverningCouncilof theECBdecidestodecreasetheinterestrateonthemainrefinancingoperations (MROs) by 10 basis points to 0.15%, starting from the operation to be settled on 11 June 2014. In addition, it decides to decrease the interest rate on the marginal lending facility by 35 basis points to 0.40% and the interest rate on the deposit facility by 10 basis points to -0.10%, both with effect from 11 June 2014. It also decides to adopt further non-standard measures, notably: (i) to conduct a series of targeted longer-term refinancing operations (TLTROs) maturing inSeptember2018tosupportbanklendingto thenon-financialprivatesector,withan interest ratefixedover thelifeofeachoperationat therateontheEurosystem’smainrefinancingoperationsprevailingatthetimeoftake-up,plusafixedspreadof10basispoints;(ii)tocontinueconductingtheMROsasfixedratetenderprocedureswithfullallotmentatleastuntiltheendofthereservemaintenance period ending in December 2016; (iii) to conduct the three-month longer-term refinancingoperations (LTROs) tobe allottedbefore the endof the reservemaintenanceperiodending in December 2016 as fixed rate tender procedures with full allotment; (iv) to suspendthe weekly fine-tuning operation sterilising the liquidity injected under the Securities MarketsProgramme; (v) to intensify preparatory work related to outright purchases in the ABS market.
3 July anD 7 auGust 2014
TheGoverningCounciloftheECBdecidesthattheinterestrateonthemainrefinancingoperationsand the interest rates on the marginal lending facility and the deposit facility will remain unchanged at 0.15%, 0.40% and -0.10% respectively.
4 september 2014
The Governing Council of the ECB decides to decrease the interest rate on the main refinancing operations by 10 basis points to 0.05%, starting from the operation to be settled on10 September 2014. In addition, it decides to decrease the interest rates on both the marginal lending
ECBMonthly BulletinDecember 2014IV
facility and the deposit facility by 10 basis points, to 0.30% and -0.20% respectively, with effect from 10 September 2014. It also decides to (i) purchase a broad portfolio of simple and transparent asset-backed securities (ABSs) with underlying assets consisting of claims against the euro area non-financialprivatesectorunderanABSpurchaseprogramme(ABSPP),and(ii)purchaseabroadportfolio of euro-denominated covered bonds issued by MFIs domiciled in the euro area under a new covered bond purchase programme (CBPP3). Interventions under both of these programmes will start in October 2014.
2 october 2014
TheGoverningCounciloftheECBdecidesthattheinterestrateonthemainrefinancingoperationsand the interest rates on the marginal lending facility and the deposit facility will remain unchanged at 0.05%, 0.30% and -0.20% respectively. It also decides on the operational details of asset-backed securities and covered bond purchase programmes.
6 november anD 4 December 2014
TheGoverningCounciloftheECBdecidesthattheinterestrateonthemainrefinancingoperationsand the interest rates on the marginal lending facility and the deposit facility will remain unchanged at 0.05%, 0.30% and -0.20% respectively.

ECBMonthly BulletinDecember 2014 V
the tarGet (trans-european automateD real-time Gross settlement eXpress transfer) system TARGET2 1 is instrumental in promoting an integrated euro area money market, which is a prerequisite for the effective conduct of the single monetary policy. It also contributes to the integrationofeuroareafinancialmarkets.TARGET2isaccessibletoalargenumberofparticipants.More than 1,000 credit institutions in Europe use TARGET2 to make payments on their own behalf, on behalf of other (indirect) participants or on their customers’ behalf. Taking into account branches and subsidiaries, almost 57,000 banks worldwide (and thus all the customers of these banks) can be reached via TARGET2.
TARGET2 is used to make large-value and time-critical payments, including payments to facilitate settlement in other interbank funds transfer systems (e.g. Continuous Linked Settlement or EURO1), and to settle money market, foreign exchange and securities transactions. It is also used for smaller-value customer payments. TARGET2 provides intraday finality for transactions andallows the funds credited to a participant’s account to be available immediately for other payments.
payment flows in tarGet2In the third quarter of 2014 TARGET2 settled 22,205,429 transactions, with a total value of €120,886 billion. This corresponds to a daily average of 336,446 transactions, with an average dailyvalueof€1,832billion.ThehighestlevelofTARGET2trafficinthisquarterwasrecordedon 30 September, when 485,239 payments were processed. With a market share of 61% in terms of volume and 91% in terms of value, TARGET2 maintained its dominant position in the market for large-valuepaymentsineuro.ThesizeofTARGET2’smarketshareconfirmsbanks’stronginterestin settlement in central bank money. Interbank payments accounted for 40% of total payments in terms of volume and 91% in terms of value. The average value of an interbank payment processed in the system was €12.5 million, while that of a customer payment was €0.8 million. 67% of the payments had a value of less than €50,000, while 13% had a value of more than €1 million. On average, there were 194 payments per day with a value of more than €1 billion. All of these figuresaresimilartothoserecordedforthepreviousquarter.
intraDay pattern of volumes anD valuesThechartshowstheintradaydistributionofTARGET2traffic(i.e.theaveragepercentageofdailyvolumes and values processed at different times of the day) for the third quarter of 2014. In volume terms, the curve is well above the linear distribution, with 70% of the volume exchanged by 1 p.m. CET and 99.7% exchanged by one hour before the system closes. In value terms, the curve is slightly above the linear distribution until the middle of the day, with 57% of the value exchanged by 1 p.m. CET. The curve then moves closer towards the linear distribution, an indication that higher-value payments are settled towards the end of the TARGET2 business day.
1 TARGET2 is the second generation of TARGET and was launched in 2007.
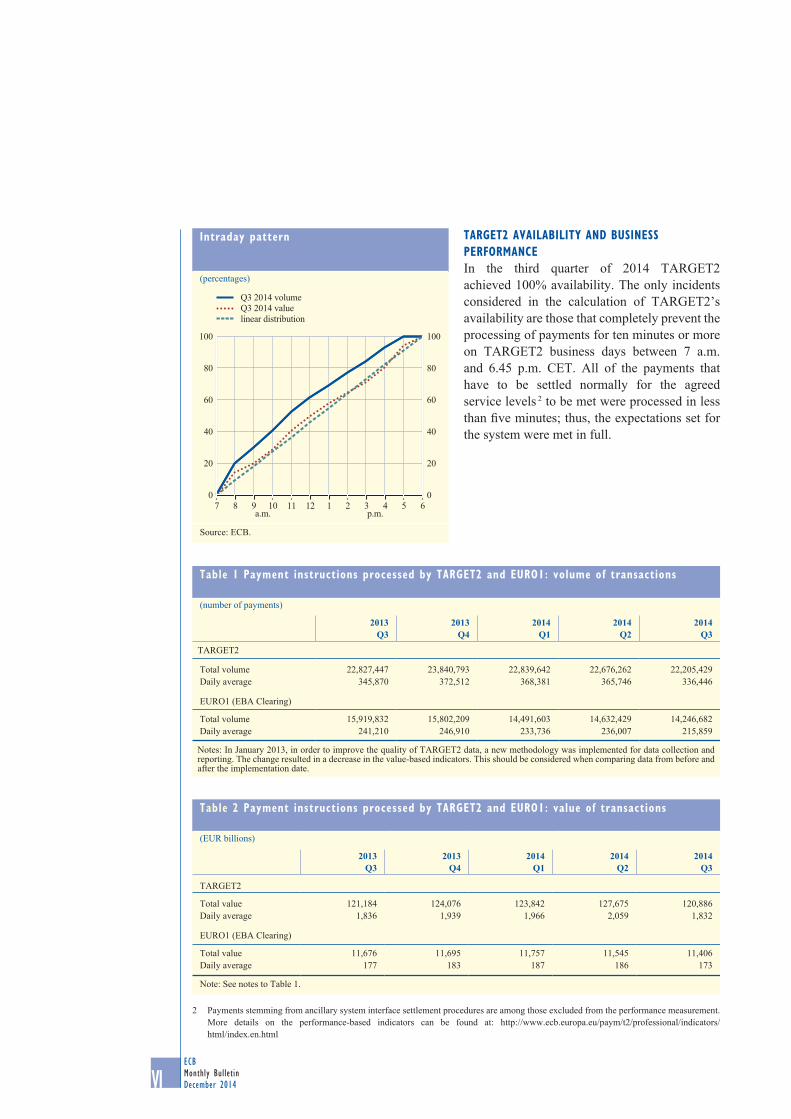
ECBMonthly BulletinDecember 2014VI
tarGet2 availability anD business performanceIn the third quarter of 2014 TARGET2 achieved 100% availability. The only incidents considered in the calculation of TARGET2’s availability are those that completely prevent the processing of payments for ten minutes or more on TARGET2 business days between 7 a.m. and 6.45 p.m. CET. All of the payments that have to be settled normally for the agreed service levels 2 to be met were processed in less thanfiveminutes;thus,theexpectationssetforthe system were met in full.
2 Payments stemming from ancillary system interface settlement procedures are among those excluded from the performance measurement. More details on the performance-based indicators can be found at: http://www.ecb.europa.eu/paym/t2/professional/indicators/ html/index.en.html
intraday pattern
(percentages)
0
20
40
60
80
100
7 8 9 10 11 12 1 2 3 4 5 6 a.m. p.m.
0
20
40
60
80
100
Q3 2014 volumeQ3 2014 valuelinear distribution
Source: ECB.
table 1 payment instructions processed by tarGet2 and euro1: volume of transactions
(number of payments)
2013Q3
2013Q4
2014Q1
2014Q2
2014 Q3
TARGET2
Total volume 22,827,447 23,840,793 22,839,642 22,676,262 22,205,429Daily average 345,870 372,512 368,381 365,746 336,446
EURO1 (EBA Clearing)
Total volume 15,919,832 15,802,209 14,491,603 14,632,429 14,246,682Daily average 241,210 246,910 233,736 236,007 215,859
Notes: In January 2013, in order to improve the quality of TARGET2 data, a new methodology was implemented for data collection and reporting. The change resulted in a decrease in the value-based indicators. This should be considered when comparing data from before and after the implementation date.
table 2 payment instructions processed by tarGet2 and euro1: value of transactions
(EUR billions)
2013Q3
2013Q4
2014Q1
2014Q2
2014Q3
TARGET2
Total value 121,184 124,076 123,842 127,675 120,886Daily average 1,836 1,939 1,966 2,059 1,832
EURO1 (EBA Clearing)
Total value 11,676 11,695 11,757 11,545 11,406Daily average 177 183 187 186 173
Note: See notes to Table 1.
ECBMonthly BulletinDecember 2014 VII
publications proDuceD by the european central banKThe ECB produces a number of publications which provide information about its core activities: monetary policy, statistics, payment and securities settlement systems, financial stability andsupervision, international and European cooperation, and legal matters. These include the following:
statutory publications
– Annual Report – Convergence Report – Monthly Bulletin
research papers
– Legal Working Paper Series – Occasional Paper Series – Research Bulletin – Working Paper Series
other/tasK-relateD publications
– Enhancing monetary analysis – Financial integration in Europe – Financial Stability Review – Statistics Pocket Book – The European Central Bank: history, role and functions – The international role of the euro – The implementation of monetary policy in the euro area (“General Documentation”) – The monetary policy of the ECB – The payment system
The ECB also publishes brochures and information materials on a variety of topics, such as the euro banknotes and coins, as well as seminar and conference proceedings.
For a complete list of documents (in PDF format) published by the ECB and the European Monetary Institute, the ECB’s forerunner from 1994 to 1998, please visit the ECB’s website at http://www.ecb.europa.eu/pub/. Language codes indicate the languages in which each publication is available.

ECBMonthly BulletinDecember 2014 IX
GlossaryThis glossary contains selected items that are frequently used in the Monthly Bulletin. A more comprehensive and detailed glossary can be found on the ECB’s website (www.ecb.europa.eu/home/glossary/html/index.en.html).
Autonomous liquidity factors: liquidity factors that do not normally stem from the use of monetary policy instruments. Such factors are, for example, banknotes in circulation, government deposits with the central bank and the net foreign assets of the central bank.
Balance of payments (b.o.p.):astatisticalstatementthatsummarises,foraspecificperiodoftime,the economic transactions of an economy with the rest of the world.
Bank lending survey (BLS): a quarterly survey on lending policies that has been conducted by the Eurosystem since January 2003. It addresses qualitative questions on developments in credit standards, terms and conditions of loans and loan demand for both enterprises and households to a predefinedsamplegroupofbanksintheeuroarea.
Borrowing requirement (general government): net incurrence of debt by the general government.
Break-even inflation rate:thespreadbetweentheyieldonanominalbondandthatonaninflation-linked bond of the same (or as similar as possible) maturity.
Capital account: a b.o.p. account that covers all capital transfers and acquisitions/disposals of non-produced,non-financialassetsbetweenresidentsandnon-residents.
Capital accounts: part of the system of national (or euro area) accounts consisting of the change in networththatisduetonetsaving,netcapitaltransfersandnetacquisitionsofnon-financialassets.
Central parity (or central rate): the exchange rate of each ERM II member currency vis-à-vis the euro,aroundwhichtheERMIIfluctuationmarginsaredefined.
Compensation per employee or per hour worked: the total remuneration, in cash or in kind, that is payable by employers to employees, i.e. gross wages and salaries, as well as bonuses, overtime payments and employers’ social security contributions, divided by the total number of employees or by the total number of employees’ hours worked.
Consolidated balance sheet of the MFI sector: a balance sheet obtained by netting out inter-MFI positions (e.g. inter-MFI loans and deposits) in the aggregated MFI balance sheet. It provides statistical information on the MFI sector’s assets and liabilities vis-à-vis residents of the euro area not belonging to this sector (i.e. the general government and other euro area residents) and vis-à-vis non-euro area residents. It is the main statistical source for the calculation of monetary aggregates, and it provides the basis for the regular analysis of the counterparts of M3.
Collateral: assets pledged or transferred in some form as a guarantee for the repayment of loans, as well as assets sold under repurchase agreements. Collateral used in Eurosystem reverse transactionsmustfulfilcertaineligibilitycriteria.
Current account: a b.o.p. account that covers all transactions in goods and services, income and current transfers between residents and non-residents.
ECBMonthly BulletinDecember 2014
Current transfers account: a technical b.o.p. account in which the value of real resources or financial items is recorded when these are transferred without receiving anything in exchange.Current transfers cover all transfers that are not capital transfers.
Debt (financial accounts): loans taken out by households, as well as the loans, debt securities and pension fund reserves (resulting from employers’ direct pension commitments on behalf of their employees)ofnon-financialcorporations,valuedatmarketpricesattheendoftheperiod.
Debt (general government): the gross debt (currency and deposits, loans and debt securities) at nominal value outstanding at the end of the year and consolidated between and within the sectors of general government.
Debt security: a promise on the part of the issuer (i.e. the borrower) to make one or more payment(s) to theholder (the lender)ona specified futuredateordates.Suchsecuritiesusuallycarryaspecificrateofinterest(thecoupon)and/oraresoldatadiscounttotheamountthatwillbe repaid at maturity. Debt securities issued with an original maturity of more than one year are classifiedaslong-term.
Debt-to-GDP ratio (general government): the ratio of general government debt to GDP at current marketprices.ItisthesubjectofoneofthefiscalcriterialaiddowninArticle126(2)oftheTreatyontheFunctioningoftheEuropeanUniontodefinetheexistenceofanexcessivedeficit.
Deficit (general government): the general government’s net borrowing, i.e. the difference between total government revenue and total government expenditure.
Deficit-debt adjustment (general government): the difference between the general government deficitandthechangeingeneralgovernmentdebt.
Deficit ratio (general government):theratioofthegeneralgovernmentdeficittoGDPatcurrentmarketprices.ItisthesubjectofoneofthefiscalcriterialaiddowninArticle126(2)oftheTreatyontheFunctioningoftheEuropeanUniontodefinetheexistenceofanexcessivedeficit.Itisalsoreferredtoasthebudgetdeficitratioorthefiscaldeficitratio.
Deflation:asignificantandpersistentdeclineinthepricesofaverybroadsetofconsumergoodsand services that becomes entrenched in expectations.
Deposit facility: a standing facility of the Eurosystem enabling eligible counterparties to make, on their own initiative, overnight deposits with the NCB in their respective jurisdiction. Deposits are remuneratedatapre-specifiedratethatnormallyprovidesafloorforovernightmarketinterestrates.
Disinflation: a process of decelerating inflation that may lead to negative inflation rates of atemporary nature.
Direct investment: cross-border investment for the purpose of obtaining a lasting interest in an enterprise resident in another economy (assumed, in practice, for ownership of at least 10% of the ordinary shares or voting power). Included are equity capital, reinvested earnings and other capital associated with inter-company operations. The direct investment account records net transactions/positions in assets abroad by euro area residents (as “direct investment abroad”) and net transactions/positions in euro area assets by non-residents (as “direct investment in the euro area”).
X
ECBMonthly BulletinDecember 2014
GLOSSARY
Effective exchange rates (EERs) of the euro (nominal/real): weighted averages of bilateral euro exchange rates against the currencies of the euro area’s main trading partners. The EER indices of the euro are calculated against different groups of trading partners: the EER-20 comprises the ten non-euro area EU Member States and ten trading partners outside the EU, and the EER-40 encompassestheEER-20and20additionalcountries.Theweightsusedreflecttheshareofeachpartner country in the euro area’s trade in manufactured goods and account for competition in thirdmarkets.RealEERsarenominalEERsdeflatedbyaweightedaverageofforeign,relativetodomestic, prices or costs. They are thus measures of price and cost competitiveness.
Enhanced credit support: the non-standard measures taken by the ECB/Eurosystem during the financialcrisiswithaviewtosupportingfinancingconditionsandcreditflowsaboveandbeyondwhat could be achieved through reductions in key ECB interest rates alone.
EONIA (euro overnight index average): a measure of the effective interest rate prevailing in the euro interbank overnight market. It is calculated as a weighted average of the interest rates on unsecured overnight lending transactions denominated in euro, as reported by a panel of contributing banks.
Equities: securities representing ownership of a stake in a corporation, e.g. shares traded on stock exchanges (quoted shares), unquoted shares and other forms of equity. Equities usually produce income in the form of dividends.
ERM II (exchange rate mechanism II): the exchange rate arrangement that provides the framework for exchange rate policy cooperation between the euro area countries and the EU Member States not participating in Stage Three of EMU.
EURIBOR (euro interbank offered rate): the rate at which what is known as a prime bank is willing to lend funds (denominated in euro) to another prime bank. The EURIBOR is computed daily, based on the rates of a sample of selected banks, for different maturities of up to 12 months.
Euro area: the area formed by those EU Member States in which the euro has been adopted as the single currency in accordance with the Treaty on the Functioning of the European Union.
European Commission surveys: harmonised surveys of business and/or consumer sentiment conducted on behalf of the European Commission in each of the EU Member States. Such questionnaire-based surveys are addressed to managers in the manufacturing, construction, retail and services industries, as well as to consumers. From each monthly survey, composite indicators are calculated that summarise the replies to a number of different questions in a single indicator (confidenceindicators).
Eurosystem: the central banking system made up of the ECB and the NCBs of those EU Member States whose currency is the euro.
Eurozone Purchasing Managers’ Surveys: surveys of business conditions in manufacturing and in services industries conducted for a number of countries in the euro area and used to compile indices. The Eurozone Manufacturing Purchasing Managers’ Index (PMI) is a weighted indicator calculated from indices of output, new orders, employment, suppliers’ delivery times and stocks of purchases. The services sector survey asks questions on business activity, expectations of future business activity, the amount of business outstanding, incoming new business, employment, input
XI
ECBMonthly BulletinDecember 2014
prices and prices charged. The Eurozone Composite Index is calculated by combining the results from the manufacturing and services sector surveys.
Excess liquidity: the amount of central bank reserves held by banks in excess of the aggregate needs of the banking system, which are determined by reserve requirements and autonomous factors.
External trade in goods: exports and imports of goods with countries outside the euro area, measured in terms of value and as indices of volume and unit value. External trade statistics are not comparable with the exports and imports recorded in the national accounts, as the latter include both intra-euro area and extra-euro area transactions, and also combine goods and services. Nor are they fully comparable with the goods item in b.o.p. statistics. Besides methodological adjustments, the main difference is that imports in external trade statistics are recorded including insurance and freight services, whereas they are recorded free on board in the goods item in the b.o.p. statistics.
Financial account: a b.o.p. account that covers transactions between residents and non-residents in directinvestment,portfolioinvestment,otherinvestment,financialderivativesandreserveassets.
Financial accounts:partofthesystemofnational(oreuroarea)accountsshowingthefinancialpositions (stocks or balance sheets), financial transactions and other changes of the differentinstitutionalsectorsofaneconomybytypeoffinancialasset.
Financial vehicle corporation (FVC): an entity whose principal activity is to carry out securitisation transactions. An FVC typically issues marketable securities that are offered for sale to the general public, or sold in the form of private placements. These securities are backed by a portfolio of assets (typically loans) which are held by the FVC. In some cases, a securitisation transaction may involve a number of FVCs, where one FVC holds the securitised assets and another issues the securities backed by those assets.
Fixed rate tender: a tender procedure inwhich the interest rate is specified in advance by thecentral bank and in which participating counterparties bid the amount of money they wish to transactatthefixedinterestrate.
Fixed rate full-allotment tender procedure: a tender procedure in which the interest rate is pre-specified by the central bank (fixed rate) and in which counterparties bid the amount ofmoney theywant to transactat that rate,knowing inadvance thatall theirbidswillbe satisfied(full allotment).
Forward guidance: communication by a central bank on the orientation of monetary policy with respect to the future path of policy interest rates.
General government: a sector defined in the ESA 95 as comprising resident entities that areengaged primarily in the production of non-market goods and services intended for individual and collective consumption and/or in the redistribution of national income and wealth. Included are central, regional and local government authorities as well as social security funds. Excluded are government-owned entities that conduct commercial operations, such as public enterprises.
Gross domestic product (GDP): the value of an economy’s total output of goods and services less intermediate consumption, plus net taxes on products and imports. GDP can be broken down by
XII
ECBMonthly BulletinDecember 2014
GLOSSARY
output, expenditure or income components. The main expenditure aggregates that make up GDP are householdfinalconsumption,governmentfinalconsumption,grossfixedcapitalformation,changesin inventories, and imports and exports of goods and services (including intra-euro area trade).
Gross external debt: the outstanding amount of an economy’s actual (i.e. non-contingent) current liabilities that require payment of principal and/or interest to non-residents at some point in the future.
Harmonised Index of Consumer Prices (HICP): a measure of the development of consumer prices that is compiled by Eurostat and harmonised for all EU Member States.
Hourly labour cost index: a measure of labour costs, including gross wages and salaries (in cash and in kind, including bonuses) and other labour costs (employers’ social contributions plus employment-related taxes paid by the employer minus subsidies received by the employer), per hour actually worked (including overtime).
Implied volatility: the expected volatility (i.e. standard deviation) in the rates of change of the price of an asset (e.g. a share or a bond). It can be derived from the asset’s price, maturity date and exercise price of its options, as well as from a riskless rate of return, using an option pricing model such as the Black-Scholes model.
Income account: a b.o.p. account that covers two types of transactions with non-residents, namely (i) those involving compensation of employees that is paid to non-resident workers (e.g., cross-border, seasonal, and other short-term workers) and (ii) those involving investment income receipts and payments on external financial assets and liabilities, with the latter including receipts andpayments on direct investment, portfolio investment and other investment, as well as receipts on reserve assets.
Index of negotiated wages: a measure of the direct outcome of collective bargaining in terms of basic pay (i.e. excluding bonuses) at the euro area level. It refers to the implied average change in monthly wages and salaries.
Industrial producer prices: factory-gate prices (transportation costs are not included) of all products sold by industry, excluding construction, on the domestic markets of the euro area countries, excluding imports.
Industrial production: the gross value added created by industry at constant prices.
Inflation: an increase in the general price level, e.g. in the consumer price index.
Inflation-indexed government bonds: debt securities issued by the general government, the couponpaymentsandprincipalofwhicharelinkedtoaspecificconsumerpriceindex.
Insurance corporations and pension funds:financialcorporationsandquasi-corporationsthatareengagedprimarilyinfinancialintermediationastheconsequenceofthepoolingofrisks.
International investment position (i.i.p.): the value and composition of an economy’s outstanding netfinancialclaimson(orfinancialliabilitiesto)therestoftheworld.
XIII
ECBMonthly BulletinDecember 2014
International reserves: external assets readily available to and controlled by monetary authorities fordirectlyfinancingorregulatingthemagnitudeofpaymentimbalancesthroughinterventioninexchange markets. The international reserves of the euro area comprise non-euro-denominated claims on non-euro area residents, gold, special drawing rights and the reserve positions in the IMF which are held by the Eurosystem.
Investment funds (except money market funds): financial institutions that pool capital raisedfromthepublicandinvestitinfinancialandnon-financialassets.SeealsoMFIs.
Job vacancies: a collective term covering newly created jobs, unoccupied jobs or jobs about to becomevacantinthenearfuture,forwhichtheemployerhasrecentlytakenactivestepstofindasuitable candidate.
Key ECB interest rates: the interest rates, set by the Governing Council, which reflect themonetarypolicystanceoftheECB.Theyaretheratesatthemainrefinancingoperations,onthemarginal lending facility and on the deposit facility.
Labour force: the sum total of persons in employment and the number of unemployed.
Labour productivity: the output that can be produced with a given input of labour. It can be measured in several ways, but is commonly measured as GDP (volume) divided by either total employment or total hours worked.
Liquidity-absorbing operation: an operation through which the Eurosystem absorbs liquidity in order to reduce excess liquidity, or to create a shortage of liquidity. Such operations can be conductedbyissuingdebtcertificatesorfixed-termdeposits.
Longer-term refinancing operation (LTRO): an open market operation with a maturity of more than one week that is executed by the Eurosystem in the form of a reverse transaction. The regular monthlyoperationshaveamaturityofthreemonths.Duringthefinancialmarketturmoilthatstartedin August 2007, supplementary operations with maturities ranging from one maintenance period to 36 months were conducted, the frequency of which varied.
M1: a narrow monetary aggregate that comprises currency in circulation plus overnight deposits heldwithMFIsandcentralgovernment(e.g.atthepostofficeortreasury).
M2: an intermediate monetary aggregate that comprises M1 plus deposits redeemable at a period of notice of up to and including three months (i.e. short-term savings deposits) and deposits with an agreed maturity of up to and including two years (i.e. short-term time deposits) held with MFIs and central government.
M3: a broad monetary aggregate that comprises M2 plus marketable instruments, in particular repurchase agreements, money market fund shares and units, and debt securities with a maturity of up to and including two years issued by MFIs.
Main refinancing operation (MRO): a regular open market operation executed by the Eurosystem in the form of reverse transactions. Such operations are carried out through a weekly standard tender and normally have a maturity of one week.
XIV
ECBMonthly BulletinDecember 2014
GLOSSARY
XV
Marginal lending facility: a standing facility of the Eurosystem enabling eligible counterparties, on their own initiative, to receive overnight credit from the NCB in their jurisdiction at a pre-specifiedrateintheformofareversetransaction.Therateonloansextendedwithinthescopeofthe marginal lending facility normally provides an upper bound for overnight market interest rates.
Maximum bid rate: the upper limit to the interest rates at which counterparties may submit bids in variable rate liquidity-absorbing tender operations.
MFI credit to euro area residents: MFI loans granted to non-MFI euro area residents (including general government and the private sector) and MFI holdings of securities (shares, other equity and debt securities) issued by non-MFI euro area residents.
MFI interest rates: the interest rates that are applied by resident credit institutions and other MFIs, excluding central banks and money market funds, to euro-denominated deposits and loans vis-à-vis householdsandnon-financialcorporationsresidentintheeuroarea.
MFI longer-term financial liabilities: deposits with an agreed maturity of over two years, deposits redeemable at a period of notice of over three months, debt securities issued by euro area MFIs with an original maturity of more than two years and the capital and reserves of the euro area MFI sector.
MFI net external assets: the external assets of the euro area MFI sector (such as gold, foreign currency banknotes and coins, securities issued by non-euro area residents and loans granted to non-euro area residents) minus the external liabilities of the euro area MFI sector (such as non-euro area residents’ deposits and repurchase agreements, as well as their holdings of money market fund shares/units and debt securities issued by MFIs with a maturity of up to and including two years).
MFIs (monetary financial institutions): financial institutionswhich together form themoney-issuing sector of the euro area. These include (i) the Eurosystem, (ii) resident credit institutions (as defined in EU law), (iii) other financial institutions whose business is to receive deposits and/or close substitutes for deposits from entities other than MFIs and, for their own account (at least in economic terms), to grant credit and/or invest in securities, as well as electronic money institutionsthatareprincipallyengagedinfinancialintermediationintheformofissuingelectronicmoney, and (iv) money market funds, i.e. collective investment undertakings that invest in short-term and low-risk instruments.
Minimum bid rate: the lower limit to the interest rates at which counterparties may submit bids in variable rate liquidity-providing tender operations.
Open market operation: a financialmarket operation executed on the initiative of the centralbank. These operations include reverse transactions, outright transactions as well as the issuance of fixed-termdepositsordebtcertificatesorforeignexchangeswaps.Theopenmarketoperationscanbe liquidity providing or liquidity absorbing.
Other investment:anitemintheb.o.p.andthei.i.p.thatcoversthefinancialtransactions/positionswith non-residents in trade credits, deposits and loans, and other accounts receivable and payable.
Portfolio investment: euro area residents’ net transactions and/or positions in securities issued by non-residents of the euro area (“assets”) and non-residents’ net transactions and/or positions in securities issued by euro area residents (“liabilities”). Included are equity securities and debt
ECBMonthly BulletinDecember 2014
securities (bonds and notes, and money market instruments). Transactions are recorded at the effective price paid or received, less commissions and expenses. To be regarded as a portfolio asset, ownership in an enterprise must be equivalent to less than 10% of the ordinary shares or voting power.
Price stability:asdefinedbytheGoverningCouncil,ayear-on-yearincreaseintheHICPfortheeuro area of below 2%. The Governing Council has also made it clear that, in the pursuit of price stability,itaimstomaintaininflationratesbelow,butcloseto,2%overthemediumterm.
Purchasing power parity (PPP): the rate at which one currency is converted into another so as to equalise the purchasing power of the two currencies by eliminating the differences in the price levels prevailing in the countries concerned. In their simplest form, PPPs show the ratio of the prices in national currency of the same good or service in different countries.
Reference value for M3 growth: the annual growth rate of M3 that is deemed to be compatible with price stability over the medium term.
Reserve requirement: the requirement for institutions to hold minimum reserves with the central bank over a maintenance period. Compliance with the requirement is determined on the basis of the average of the daily balances in the reserve accounts over the maintenance period.
Reverse transaction: an operation whereby the NCB buys or sells assets under a repurchase agreement or conducts credit operations against collateral.
Securitisation:atransactionorschemewherebyanassetorapoolofcashflow-producingassets,often consisting of loans (mortgages, consumer loans, etc.), is transferred from an originator (usuallyacreditinstitution)toafinancialvehiclecorporation(FVC).TheFVCeffectivelyconvertsthese assets into marketable securities by issuing debt instruments with principal and interest servicedthroughthecashflowsproducedbytheassetpool.
Structural fiscal balance (general government): the actual budget balance corrected for cyclical factors(i.e.thecyclicallyadjustedbalance)andone-offfiscalmeasures.
Survey of Professional Forecasters (SPF): a quarterly survey that has been conducted by the ECBsince1999tocollectmacroeconomicforecastsoneuroareainflation,realGDPgrowthandunemploymentfromapanelofexpertsaffiliatedtofinancialandnon-financialorganisationsbasedin the EU.
Unit labour costs: a measure of total labour costs per unit of output calculated for the euro area as theratiooftotalcompensationperemployeetolabourproductivity(definedasGDP(volume)perperson employed).
Variable rate tender: a tender procedure where the counterparties bid both the amount of money they wish to transact with the central bank and the interest rate at which they wish to enter into the transaction.
Volatility:thedegreeoffluctuationinagivenvariable.
XVI
ECBMonthly BulletinDecember 2014
GLOSSARY
XVII
Write-down: a downward adjustment to the value of loans recorded in the balance sheets of MFIs when it is recognised that the loans have become partly unrecoverable.
Write-off: the removal of the value of loans from the balance sheets of MFIs when the loans are considered to be totally unrecoverable.
Yield curve: a graphical representation of the relationship between the interest rate or yield and the residualmaturityatagivenpointintimeforsufficientlyhomogenousdebtsecuritieswithdifferentmaturity dates. The slope of the yield curve can be measured as the difference between the interest rates or yield at two selected maturities.

