monthly business report - auckland transport · pdf filemonthly business report september 2010...
TRANSCRIPT

MONTHLY BUSINESS REPORT
September 2010
CONTRIBUTION LIST
The following is a list of Business Unit Managers responsible for providing detailed monthly reports.
Business Unit Name
Customer Services Mark Lambert
Project Delivery Allen Bufton
Strategy and Planning Peter Clark
Marketing and Communications Shelley Watson
Corporate Services Stephen Smith

0
TABLE OF CONTENTS
1 CUSTOMER SERVICES ....................................................................................................... 2
1.1. PASSENGER TRANSPORT PATRONAGE – NETWORK WIDE .......................................................................................... 2 1.2. SERVICE DEVELOPMENT ................................................................................................................................................... 10 1.3. MAJOR INFRASTRUCTURE WORKS ................................................................................................................................. 11 1.4. SPECIAL EVENT PASSENGER TRANSPORT SERVICES ................................................................................................. 11 1.5. REGISTERED SERVICE NOTIFICATIONS RECEIVED BY ARTA UNDER THE PUBLIC TRANSPORT
MANAGEMENT ACT 2008 ................................................................................................................................................... 12 1.6. PUBLIC TRANSPORT CONCESSIONARY FARE SCHEME (CFS) ................................................................................... 12 1.7. AUCKLAND TOTAL MOBILITY SCHEME ........................................................................................................................ 13 1.8. TRAVEL PLANNING ............................................................................................................................................................ 13
2 PROJECT DELIVERY ......................................................................................................... 14
2.1. INFRASTRUCTURE DEVELOPMENT ................................................................................................................................ 14 2.3. FERRY TERMINAL DEVELOPMENTS BIRKENHEAD ......................................................................................................... 14 2.4. NETWORK DEVELOPMENT ............................................................................................................................................... 14 2.5. REAL TIME PASSENGER INFORMATION SYSTEMS (RTPIS) ........................................................................................ 15 2.6. ASSET MANAGEMENT ........................................................................................................................................................ 15
3 STRATEGY AND PLANNING ............................................................................................. 16
3.1. STRATEGIC TRANSPORT PLANNING .............................................................................................................................. 16 3.2. PLANNING AND PROGRAMMING ..................................................................................................................................... 16 3.3. WALKING AND CYCLING COORDINATION ................................................................................................................... 18 3.4. REGIONAL ROAD SAFETY COORDINATION .................................................................................................................. 18
4 MARKETING AND COMMUNICATIONS ............................................................................ 19
4.1. MARKETING AND CUSTOMER INFORMATION CHANNELS ....................................................................................... 19 4.2. MEDIA AND COMMUNICATIONS – SEPTEMBER 2010 .................................................................................................. 20
5 CORPORATE SERVICE ..................................................................................................... 21
5.1. FINANCIAL REPORT ............................................................................................................................................................ 21 5.2. STATEMENT OF FINANCIAL PERFORMANCE ................................................................................................................ 24 5.3. STATEMENT OF FINANCIAL POSITION ........................................................................................................................... 26

1
SUMMARY
More Aucklanders get on board PT
Public transport use continues to gather speed – with total PT patronage for the month of September 2010 increasing by 7% on the same month last year.
Rail’s popularity continues to grow significantly with patronage increasing by 27.2% in September. Bus was up by 4.4% while ferry patronage was down slightly by 2.4%.
There has also been a steady increase in total public transport patronage for the 3 months to 30 Sept with an increase of 6.2% on last year to date. This has seen rail use increase by 18.2%, bus by 4.7% and ferry down fractionally by 0.4% compared to last year.
The Northern Express continues to show excellent growth with patronage up by 20.2% for the month of September and by 20.7% compared to the equivalent 3 months to date last year.
Service improvements for our passengers
The recently reopened Onehunga Branch Line has seen strong patronage continue in September with approximately 500 passengers using the service per day.
ARTA’s pledge to offer free train services on the weekend of 4 and 5 September attracted 25,000 passengers. This was a very successful initiative which helped to reduce the impact of the closure of the Newmarket motorway viaduct.
Six carriage train services were introduced at peak times on the Western Line in September to increase capacity and improve services for passengers.
Rail service punctuality for September declined to 82.0% of services on time from 85.4% in August and 85.5% in September last year, partly due to adverse weather conditions at the end of the month.
Infrastructure developments still coming
The highly anticipated state-of-the-art New Lynn Rail and Bus Interchange was officially opened on 24 September by the Governor General and the Minister of Transport.
The historic Onehunga Branch Line and the new stations at Penrose, Te Papapa and Onehunga were officially opened on 18 September with passenger services commencing on 19 September.
The station base slab at Manukau Station is now complete and platform construction is continuing.
Development of the stabling facilities at the Tamaki site is underway with the installation of track and signal components.
The new outer berth at Birkenhead Ferry Terminal will officially open on 8 October.

2
1 CUSTOMER SERVICES
1.1. PASSENGER TRANSPORT PATRONAGE – NETWORK WIDE
The total combined bus, ferry, and rail patronage for the month of September is 7.0% (366,137 boardings) higher than September 2009 at 5,559,954 boardings. For the financial year to date (3 months) the total cumulative patronage is 6.2% (975,520 boardings) higher than the corresponding months in the 2009/10 financial year.
-
500,000
1,000,000
1,500,000
2,000,000
2,500,000
3,000,000
3,500,000
4,000,000
4,500,000
5,000,000
5,500,000
6,000,000
6,500,000
7,000,000
Ja
n-0
2
Ma
r-02
Ma
y-0
2
Ju
l-02
Se
p-0
2
No
v-0
2
Ja
n-0
3
Ma
r-03
Ma
y-0
3
Ju
l-03
Se
p-0
3
No
v-0
3
Ja
n-0
4
Ma
r-04
Ma
y-0
4
Ju
l-04
Se
p-0
4
No
v-0
4
Ja
n-0
5
Ma
r-05
Ma
y-0
5
Ju
l-05
Se
p-0
5
No
v-0
5
Ja
n-0
6
Ma
r-06
Ma
y-0
6
Ju
l-06
Se
p-0
6
No
v-0
6
Ja
n-0
7
Ma
r-07
Ma
y-0
7
Ju
l-07
Se
p-0
7
No
v-0
7
Ja
n-0
8
Ma
r-08
Ma
y-0
8
Ju
l-08
Se
p-0
8
No
v-0
8
Ja
n-0
9
Ma
r-09
Ma
y-0
9
Ju
l-09
Se
p-0
9
No
v-0
9
Ja
n-1
0
Ma
r-10
Ma
y-1
0
Ju
l-10
Se
p-1
0
Monthly Patronage by mode
Total patronage
Bus
Rail
Ferry
Moving Average
Rapid Transit Network (Rail and Northern Express):
The total RTN patronage for September is 26.0% (219,907 boardings) higher than September 2009. For the financial year to date RTN patronage is 18.6% (479,159 boardings) higher than the corresponding months in the 2009/10 financial year.
-
200,000
400,000
600,000
800,000
1,000,000
1,200,000
Jul Aug Sep Oct Nov Dec Jan Feb Mar Apr May Jun
Rapid Transit Network (RTN) Monthly Patronage
2005/06 2006/07 2007/08
2008/09 2009/10 2010/11
12.1%
17.8%26.0%

3
The Northern Express patronage grew by 20.2% or 29,070 boardings for September 2010 compared to September 2009 and for the financial year to date is up by 20.7% (89,442 boardings) compared to the corresponding three months in the last financial year.
There has been 1.88 million passengers recorded using the Northern Express over the last twelve months, an increase of 20.3% on the same period last year.
-
50,000
100,000
150,000
200,000
250,000
July August September October November December January February March April May June
Northern Express Patronage
2005/06 2006/07 2007/08 2008/09 2009/10 2010/11
Full busway Opens
February 2008November 2005
Constellation
and Albany stations open
21.2%
20.6%
20.2%
Bus Patronage
Bus patronage grew by 4.4% (183,500 boardings) compared to last September. For the financial year to date, bus patronage is up 4.7% (589,911 boardings) compared to the same three months of the 2009/10 financial year.
-
500,000
1,000,000
1,500,000
2,000,000
2,500,000
3,000,000
3,500,000
4,000,000
4,500,000
5,000,000
5,500,000
July August September October November December January February March April May June
Bus patronage by month
2005/06 2006/07 2007/08
2008/09 2009/10 2010/11
2.5%
7.0%
4.4%
4
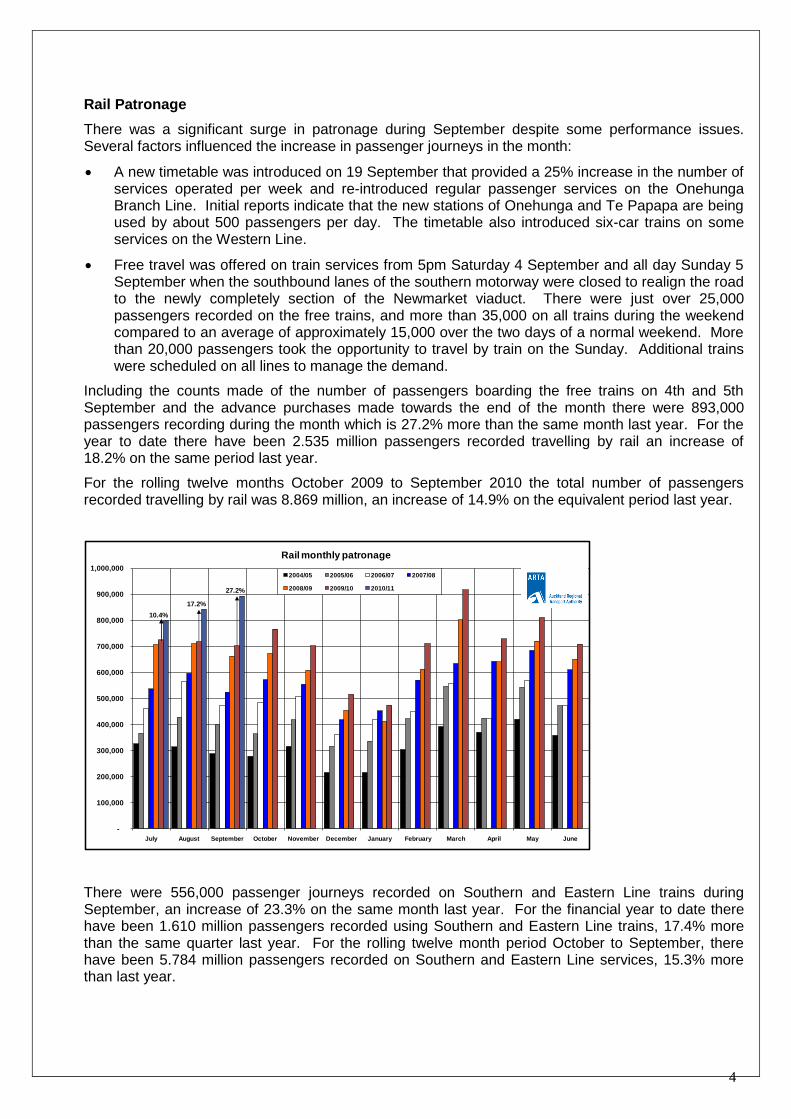
Rail Patronage
There was a significant surge in patronage during September despite some performance issues. Several factors influenced the increase in passenger journeys in the month:
A new timetable was introduced on 19 September that provided a 25% increase in the number of services operated per week and re-introduced regular passenger services on the Onehunga Branch Line. Initial reports indicate that the new stations of Onehunga and Te Papapa are being used by about 500 passengers per day. The timetable also introduced six-car trains on some services on the Western Line.
Free travel was offered on train services from 5pm Saturday 4 September and all day Sunday 5 September when the southbound lanes of the southern motorway were closed to realign the road to the newly completely section of the Newmarket viaduct. There were just over 25,000 passengers recorded on the free trains, and more than 35,000 on all trains during the weekend compared to an average of approximately 15,000 over the two days of a normal weekend. More than 20,000 passengers took the opportunity to travel by train on the Sunday. Additional trains were scheduled on all lines to manage the demand.
Including the counts made of the number of passengers boarding the free trains on 4th and 5th September and the advance purchases made towards the end of the month there were 893,000 passengers recording during the month which is 27.2% more than the same month last year. For the year to date there have been 2.535 million passengers recorded travelling by rail an increase of 18.2% on the same period last year.
For the rolling twelve months October 2009 to September 2010 the total number of passengers recorded travelling by rail was 8.869 million, an increase of 14.9% on the equivalent period last year.
-
100,000
200,000
300,000
400,000
500,000
600,000
700,000
800,000
900,000
1,000,000
July August September October November December January February March April May June
Rail monthly patronage
2004/05 2005/06 2006/07 2007/08
2008/09 2009/10 2010/11
10.4%
17.2%
27.2%
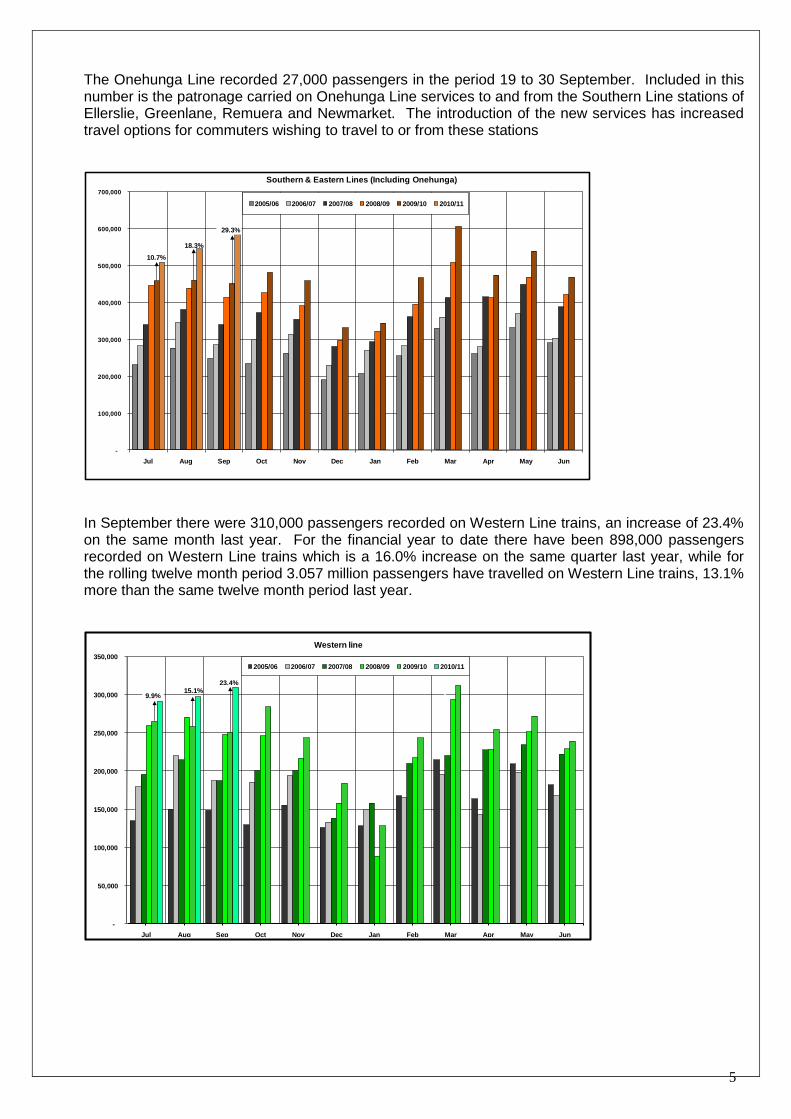
There were 556,000 passenger journeys recorded on Southern and Eastern Line trains during September, an increase of 23.3% on the same month last year. For the financial year to date there have been 1.610 million passengers recorded using Southern and Eastern Line trains, 17.4% more than the same quarter last year. For the rolling twelve month period October to September, there have been 5.784 million passengers recorded on Southern and Eastern Line services, 15.3% more than last year.
5
The Onehunga Line recorded 27,000 passengers in the period 19 to 30 September. Included in this number is the patronage carried on Onehunga Line services to and from the Southern Line stations of Ellerslie, Greenlane, Remuera and Newmarket. The introduction of the new services has increased travel options for commuters wishing to travel to or from these stations
-
100,000
200,000
300,000
400,000
500,000
600,000
700,000
Jul Aug Sep Oct Nov Dec Jan Feb Mar Apr May Jun
Southern & Eastern Lines (Including Onehunga)
2005/06 2006/07 2007/08 2008/09 2009/10 2010/11
10.7%
18.3%
29.3%
In September there were 310,000 passengers recorded on Western Line trains, an increase of 23.4% on the same month last year. For the financial year to date there have been 898,000 passengers recorded on Western Line trains which is a 16.0% increase on the same quarter last year, while for the rolling twelve month period 3.057 million passengers have travelled on Western Line trains, 13.1% more than the same twelve month period last year.
-
50,000
100,000
150,000
200,000
250,000
300,000
350,000
Jul Aug Sep Oct Nov Dec Jan Feb Mar Apr May Jun
Western line
2005/06 2006/07 2007/08 2008/09 2009/10 2010/11
9.9%15.1%
23.4%

6
Ferry Patronage
Ferry patronage for September is -2.4% (8,199 boardings) lower than last September, for the financial year to date patronage is down by -0.4% (4,106 boardings) compared to the same period in the 2009/10 financial year.
In September 2009 a promotion was run whereby a number of ferries offered free travel, resulting in a patronage increase of 7.6% for that month. Although ferry patronage this September is down on the September 2009, it has increased by 5.1% over the last two years compared to September 2008.
-
50,000
100,000
150,000
200,000
250,000
300,000
350,000
400,000
450,000
500,000
July August September October November December January February March April May June
Ferry patronage monthly comparisons
2006/07 2007/08 2008/09 2009/10 2010/11
2.7%
-1.3%-2.4%
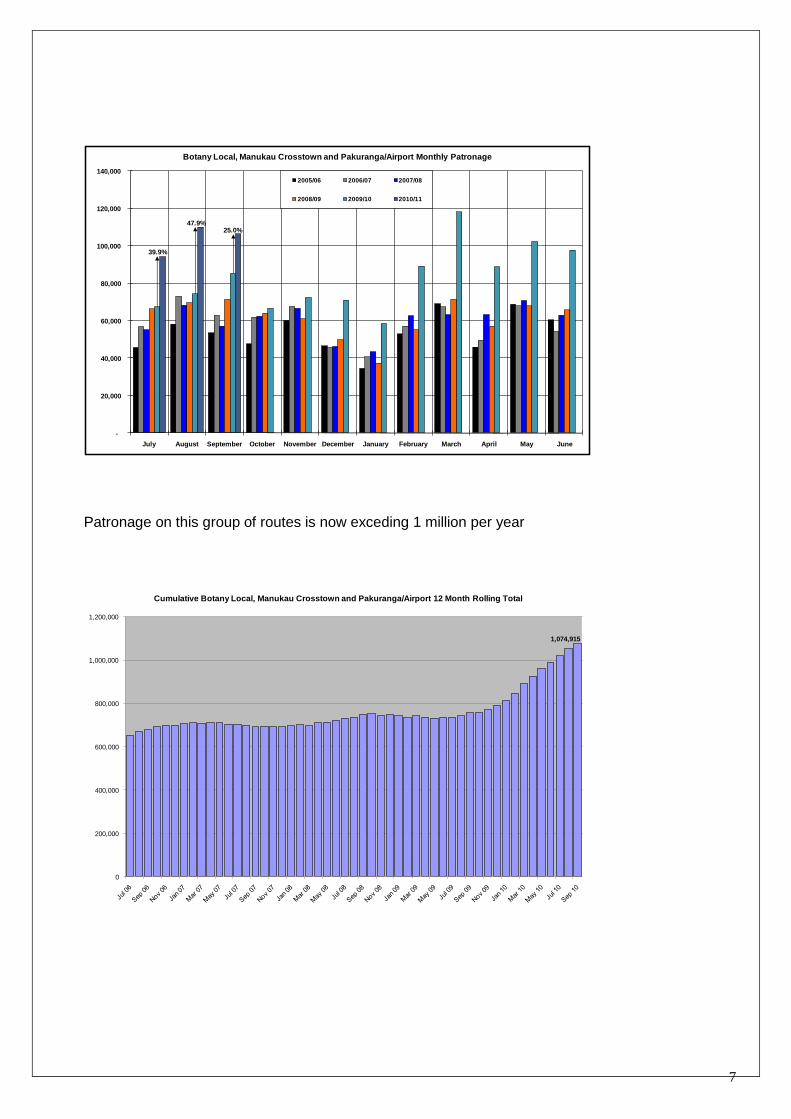
Patronage Analysis
Growth in the bus sector has been seen primarily in the North and South of Auckland. These are areas where services have been redesigned over the last two to three years with simpler and higher frequency services.
Jul 24,281 3.1% 24,281 3.1% 3,829 1.0% 3,829 1.0%
Aug 70,930 8.0% 95,210 5.7% 16,405 3.9% 20,235 2.5%
Sep 50,372 6.1% 145,582 5.8%
By Month Cumulative By Month Cumulative
Jul 54,543 7.2% 54,543 7.2% 6,741- -0.4% 6,741- -0.4%
Aug 97,083 11.1% 151,625 9.3% 92,758 4.5% 86,017 2.2%
Sep 39,699 4.7% 191,325 7.7% 86,147 4.5% 172,165 2.9%
South Sector Isthmus Sector
North Sector (excluding Northern Express) West Sector
By Month Cumulative By Month Cumulative
Ritchies data unavailable at time of writing
7
-
20,000
40,000
60,000
80,000
100,000
120,000
140,000
July August September October November December January February March April May June
Botany Local, Manukau Crosstown and Pakuranga/Airport Monthly Patronage
2005/06 2006/07 2007/08
2008/09 2009/10 2010/11
39.9%
47.9%25.0%
Patronage on this group of routes is now exceding 1 million per year
0
200,000
400,000
600,000
800,000
1,000,000
1,200,000
Cumulative Botany Local, Manukau Crosstown and Pakuranga/Airport 12 Month Rolling Total
1,074,915

8
PT Service Punctuality and Reliability
Rail Service
September was a challenging month for rail service performance. The normal “teething” issues associated with the implementation of a new timetable that represented a 25% increase in service levels, and included the introduction of six-car trains on the Western Line, coincided with a period of extreme weather conditions which saw a decline in service performance in the latter part of the month. In September 82.0% of services operated on time or within five minutes of their schedule during the month compared to 85.4% in August and 85.5% for the same month last year.
The newly introduced Onehunga services recorded the best performance of the service groupings in September with 88.1% of services arriving within 5 minutes of their scheduled time. Trains on the line were subject to speed restrictions during the first week of operation as a precautionary measure given the number of level crossings on the line and while the signals were still subject to testing.
Services on the Western Line services recorded a slight decline on recent results with 85.5% of services operating on time or within five minutes of schedule in September. This compares to 88.4% last month and 88.4% in the same month last year.
Southern and Eastern Line trains continued to be impacted to a greater extent by the major incidents (detailed below) and the network upgrade works than were the services on the Western Line. For the month 79.4% of Southern and Eastern Line services operated on time or within five minutes of their schedule which is a reduction on the 83.9% recorded last month and 84.0% for the same month last year.
The following major incidents were reported during the month:
Signal, points and track failures – During the evening peak of 3 September a fault with a computer that controls the signals at Britomart resulted in delays to services operating on all lines.
Train faults – Two train faults occurred during the month that resulted in the train being disabled at critical points on the network causing extensive delays to services. The first occurred at Sturges Road during the morning peak of 22 September. All services were terminated at Henderson until the train could be recovered and bus replacements were arranged between Waitakere and Henderson. Shortly before midday on 29 September a train was disabled at Middlemore which led to extensive delays to services on the Southern and Eastern Lines, with consequential impacts on the Western and Onehunga Lines, which continued through to the evening peak.
Operations – The free travel offered on 5 September resulted in a large number of people travelling by train, including family groups with small children, and this increased the time the trains were stopped at stations to ensure that all passengers had the opportunity to board and alight safely. As a result delays accrued to services on all lines.
Other – Precautionary speed restrictions were imposed across the network on two occasions during a week of extreme weather conditions when there was a risk of the strong winds blowing debris across the rail corridor into the path of a train. These conditions caused part of the roof of the Lion Breweries building in Khyber Pass to lift which then landed by the tracks, narrowly avoiding a train. Speed restrictions were in place from the evening of 17 September through to the morning of 18 September and again from mid-morning through to the early evening of 22 September and these measures caused significant disruptions to planned services on all lines.
9
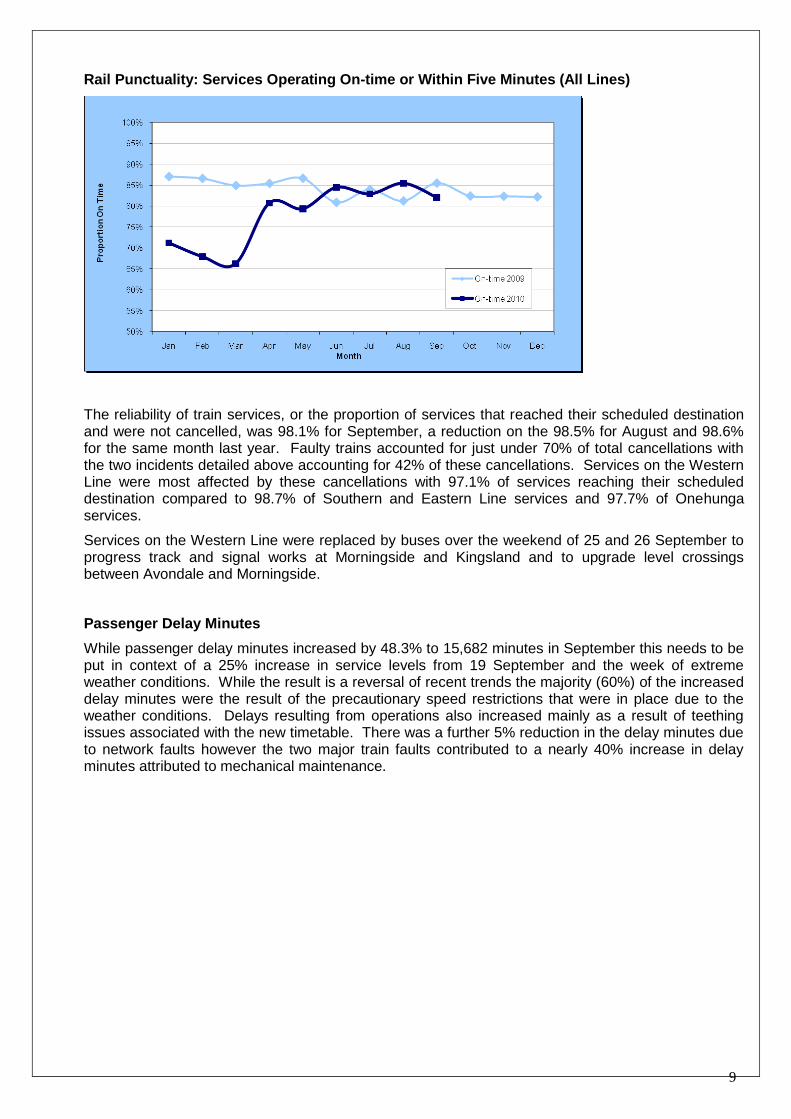
Rail Punctuality: Services Operating On-time or Within Five Minutes (All Lines)
The reliability of train services, or the proportion of services that reached their scheduled destination and were not cancelled, was 98.1% for September, a reduction on the 98.5% for August and 98.6% for the same month last year. Faulty trains accounted for just under 70% of total cancellations with the two incidents detailed above accounting for 42% of these cancellations. Services on the Western Line were most affected by these cancellations with 97.1% of services reaching their scheduled destination compared to 98.7% of Southern and Eastern Line services and 97.7% of Onehunga services.
Services on the Western Line were replaced by buses over the weekend of 25 and 26 September to progress track and signal works at Morningside and Kingsland and to upgrade level crossings between Avondale and Morningside.
Passenger Delay Minutes
While passenger delay minutes increased by 48.3% to 15,682 minutes in September this needs to be put in context of a 25% increase in service levels from 19 September and the week of extreme weather conditions. While the result is a reversal of recent trends the majority (60%) of the increased delay minutes were the result of the precautionary speed restrictions that were in place due to the weather conditions. Delays resulting from operations also increased mainly as a result of teething issues associated with the new timetable. There was a further 5% reduction in the delay minutes due to network faults however the two major train faults contributed to a nearly 40% increase in delay minutes attributed to mechanical maintenance.

10
Passenger Delay Minutes – Last Twelve Months
Infrastructure-related delay minutes fell by about 5% from August (4,222 minutes in September compared to 4,434 minutes in August). There were reductions in all areas except for a small increase in the train delays caused by track protection measures, most of which related to track work in preparation for electrification.
Delay Minutes Proportion
Network Control 504 11.9%
Signal/points failure 436 10.3%
Speed restrictions 417 9.9%
Track protection measures* 2,865 67.9%
Total 4,222
*Track protection measures are put in place at sites where work that involves activities close to the track is underway.
These require trains to slow or stop at a safe distance prior to the actual site and only proceed after receiving approval from the site protector that the track is clear of all obstructions.
1.2. SERVICE DEVELOPMENT
North West Bus Service Changes
Service changes and new timetables were implemented for North West Auckland on 19 September 2010.
Green Bay Bus Service Changes Consultation
Green Bay and New Lynn local bus simplifications integrated with train timetables were implemented 19 September 2010.
Onehunga Train Station – Bus Route Change Consultation
Bus routes to and from Mangere were re-routed to serve Onehunga Train Station from 19 September 2010.

11
1.3. MAJOR INFRASTRUCTURE WORKS
Victoria Park Tunnel
Construction on Victoria Park Tunnel began in November 2009 and is expected to be completed in April 2012.
Wellington St on-ramp closed on 23 August 2010 for three months. Congestion continues to be successfully mitigated with little impact on bus service travel time as a result.
Other works requiring detours or lane or road closures are being undertaken in off peak times, predominantly evenings and weekends, to minimise impact.
Newmarket Viaduct SH1 southbound closure on 4 and 5 September 2010
A closure of SH1 southbound CBD onramps and the Newmarket Viaduct was undertaken on 4 and 5 September to enable work to switch traffic onto the newly constructed southbound viaduct and to relocate the 800 tonne construction gantry.
Public transport changes included bus service detour or delay customer communications and operation of additional train services including doubling of 2-car trains to 4-car trains and operation of a Saturday timetable on Sunday. Free travel by train to encourage usage was very successful.
1.4. SPECIAL EVENT PASSENGER TRANSPORT SERVICES
Events
26 events were held in September and 12 had an impact on public transport either with road closures and/or route diversions, or had additional services provided by ARTA.
ITM Cup, Auckland vs. Taranaki, Eden Park: 5th September
(Crowd: 5829)
ARTA/Eden Park/Auckland Rugby agreed to provide free travel on rail for all ticket holders to the 2010 ITM Cup Season at Eden Park. Free travel patronage could not be calculated on this day due to the closure of Newmarket Motorway section where ARTA provided free travel on all rail to all patrons across the rail network.
ITM Cup, Auckland vs. Wellington, Eden Park: 11th September
(Crowd: 5101)
Passenger numbers were:
Ingress Egress
Rail 662 696
% of Crowd 12.98 13.64
12
1.5. REGISTERED SERVICE NOTIFICATIONS RECEIVED BY ARTA UNDER THE PUBLIC TRANSPORT MANAGEMENT ACT 2008
Under the Public Transport Management Act 2008, the following applications for registered services have been approved during September 2010:
Fullers Group Ltd: Notification to register a scheduled timetable for 3 return trips between Auckland and Half Moon Bay on 4 September 2010 only and 5 return trips on 5 September 2010 only. Approved 02-Sep-10.
Sealink Travel Group (NZ) Ltd: Notification to vary the summer timetable to operate the times 11:30am ex Half Moon Bay and 12:30pm ex Kennedy Point between 16 December 2010 to 28 January 2011 (Monday to Friday only). Approved 10-Sep-10.
Sealink Travel Group (NZ) Ltd: Notification to vary the summer timetable to vary the 9:30pm time ex Kennedy Point to depart 9:00pm (Friday only). Approved 10-Sep-10.
Sealink Travel Group (NZ) Ltd: Notification to increase fares for ferry services between Half Moon Bay and Kennedy Point from 1 October 2010. Approved 10-Sep-10.
Waiheke Shipping Ltd: Notification to vary the standard timetable permanently to operate reduced times effective 23 October 2010. Approved 22-Sep-10.
Sealink Travel Group (NZ) Ltd: Notification to vary the Friday only sailings on 5, 12, 19 and 26 November 2010 only. Approved 29-Sep-10.
Fullers Group Ltd: Notification to increase fares for Rangitoto ferry services from 1 October 2010. Approved 30-Sep-10.
1.6. PUBLIC TRANSPORT CONCESSIONARY FARE SCHEME (CFS)
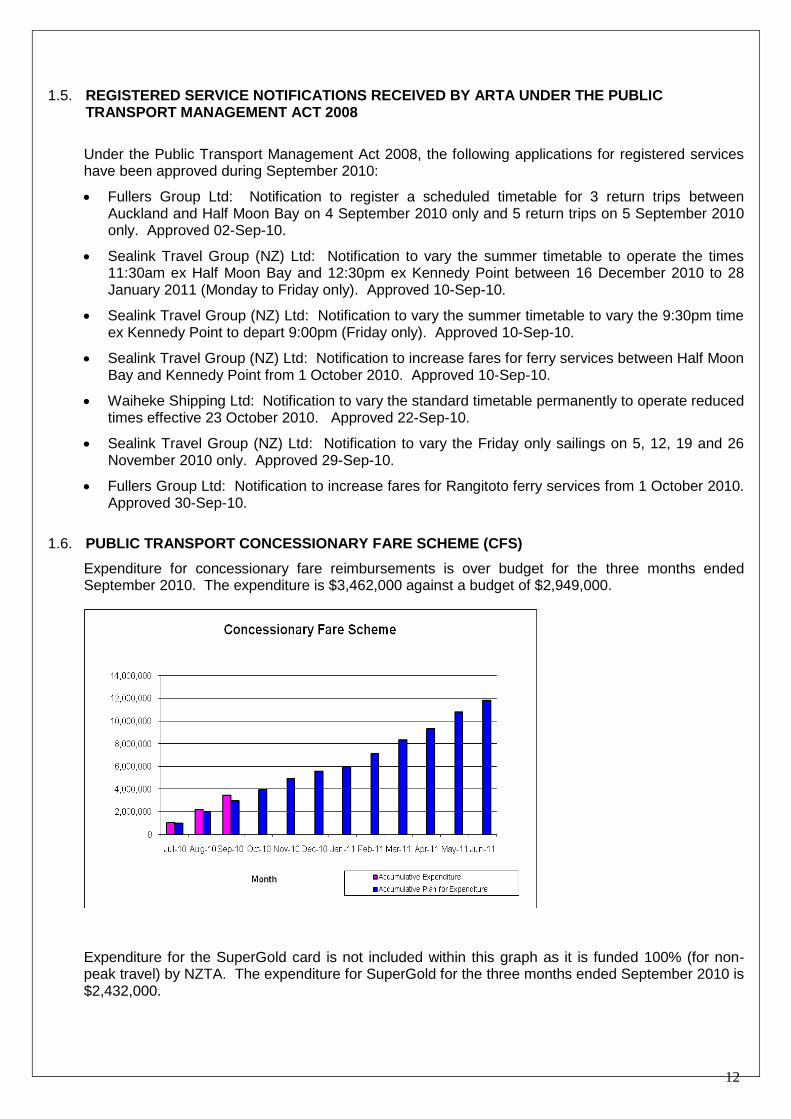
Expenditure for concessionary fare reimbursements is over budget for the three months ended September 2010. The expenditure is $3,462,000 against a budget of $2,949,000.
Expenditure for the SuperGold card is not included within this graph as it is funded 100% (for non-peak travel) by NZTA. The expenditure for SuperGold for the three months ended September 2010 is $2,432,000.

13
1.7. AUCKLAND TOTAL MOBILITY SCHEME
223 new Total Mobility applications were processed in September 2010 compared with 154 in June, 210 in July and 195 in August.
Expenditure for Total Mobility reimbursements is below budget for the three months ended September 2010. The expenditure is $940,000 against a budget of $1,059,000.
1.8. TRAVEL PLANNING
School Travel Planning
The following school’s launched their travel plans during September:
Three Kings Primary School
Huapai Primary School
Walking School Bus Programme
Due to the school holidays taking up most of September, no new walking school buses joined the programme.
14
2 PROJECT DELIVERY
2.1. INFRASTRUCTURE DEVELOPMENT
Progress made on each joint ARTA-ONTRACK DART project is described below:
Western Line Duplication Stage 3 - New Lynn (DART 6)
The station was officially opened on 24 September.
Distributed Stabling (DART 17)
Tamaki Drive – The Strand
KiwiRail has commenced the installation of the track and signal components for the Emergency Station, and are expected to commission the systems in January/February 2011. Following this the structural upgrade works for the station and stabling facilities will commence with an expected completion mid 2011.
2.2. FERRY TERMINAL DEVELOPMENTS Birkenhead
The new facilities are now complete and the official opening ceremony will be held on 8 October 2010. Fullers have trialled the berth and confirmed it is suitable for operation.
Birkenhead Inner Berth
The seabed survey is complete and detailed design is progressing well. NZTA has confirmed funding for the project and the resource and building consent applications are ready to lodge.
The project will progress to tender in November.
Hobsonville
Hobsonville Land Company (HLC) have received approval for coastal land consents. The consents will be novated to ARTA/Auckland Transport.
Seabed surveys are complete and the design work is being progressed in consultation with Waitakere City Council and HLC.
The project is still on target for construction completion in late 2011 with commencement of ferry operations thereafter.
2.3. NETWORK DEVELOPMENT
Onehunga Branch Line Rehabilitation (DART 19)
The Onehunga Branch Line Stations officially opened on 18 September and passenger services commenced on 19 September 2010.
Manukau Rail Link (DART 9)
The station base slab is now complete and platform construction is continuing. The precast concrete wall panels have been installed. The additional design for the final platform works and temporary entrance feature is now underway with the intention to issue tender documents prior to end of October 2010, with station operation expected by the end of July 2011.
The combined MIT/MCC/ARTA concourse concept design is progressing well through a lead architect and specialist consultants

15
2.4. REAL TIME PASSENGER INFORMATION SYSTEMS (RTPIS)
Type 1 & 2- VPID’s for Bus Services:
The RTPIS system expansion program of on-street infrastructure: that comprises 173 VPID’s at bus stops has been completed. However the following projects have been added to the program:
New Lynn Transport Centre - Bus Interchange; 5 double sided bus stop VPID’s to be completed 8 October 2010
New Lynn Transport Centre - Bus/Rail Interchange; a 42ins. LCD screen programmed for completion by 22 October 2010
Onehunga Bus/Rail Interchange; double sided VPID at the new outbound bus stop scheduled for completion by 22 October 2010
Victoria Street, Sky Tower Bus Stops; installation of single sided VPID planned completion is by 30 November 2010
Type- 2 Solar Powered VPID’s for Bus Services:
A RFT for up to 200 Type-2 solar powered VPID’s has been advertised, it is planned that installation will commence early in 2011 with completion by 30 September 2011.
Rail and Ferry Services RTPIS Expansion:
RTPI Operating System for Ferry and Rail Services; the upgraded RAPID operating system for rail and ferry services is programmed for completion by 30 April 2011 and commissioned prior to the RWC.
New Lynn Rail Station; PID’s have been installed, commissioned and are fully operational
Onehunga Line Rail Stations; PID’s are installed, commissioned and operational on the platforms of Onehunga, Te Papapa and platform 3 of Penrose Stations.
Common Element Upgraded Rail Stations (20 in total); wiring and support fixings for the installation of PID’s on the upgraded rail stations is programmed for completion by mid November 2010 with the installation of PID’s scheduled for completion by 30 June 2011
2.5. ASSET MANAGEMENT
Downtown Ferry Terminals Structural renewals (Piers 1 & 2)
Work has now been completed on the area located beneath the contractor’s site area on Pier 2 and the contractor has disestablished from site.
ARTA are expecting to receive the ongoing inspection and maintenance plan from its consultant in October.

16
3 STRATEGY AND PLANNING
3.1. STRATEGIC TRANSPORT PLANNING
The business case and the concept designs for the preferred alignment and station locations are progressing. It is anticipated that a draft concept design and business case for the project will be completed in October 2010.
3.2. PLANNING AND PROGRAMMING
2009/2012 Auckland Regional Land Transport Programme (RLTP)
During the September monthly reviews, 17 funding applications totalling $14,733,323 were submitted to ARTA for consideration.
ARTA recommended all the applications for funding. Of the recommended applications by ARTA, 2 applications worth $4,784,920 have been deferred by NZTA for further information while the remaining 15 applications worth $9,948,403 have been approved by NZTA.
Figure 1 shows the breakdown of scheme types.
Note The percentage values in the chart above relates to number of schemes processed as opposed to the value of the
scheme.

17
Table 1 – September Recommended Schemes to NZ Transport Agency
The September 2010 monthly review considered a variety of applications. Notable were a number of road reconstruction projects; these tend to be the more serious (and expensive) repair work undertaken by the local authorities outside of general maintenance. There were also a number of emergency repair projects after the heavy rains at the end of August.
Other notable funding approvals were Hobsonville Ferry Wharf and Birkenhead Inner Berth design and construction.
18
3.3. WALKING AND CYCLING COORDINATION
ARTA has approved a variation to an Infrastructure Auckland Grant awarded to ACC for a project to install cycling and pedestrian facilities that will improve safety on Ian McKinnon Drive and will connect the proposed cycle lanes on Dominion Road to the proposed Central Motorway Junction Cycleway.
ARTA has approved a variation to an Infrastructure Auckland Grant awarded to MCC for a project that will provide cycling and pedestrian facilities on four rail bridges that have been reconstructed as part of the Rail Electrification Project.
Regional Cycle Network projects: Cycle lanes and other safety improvements have been completed in Onehunga through the Onehunga Mall up to Campbell Road.
3.4. REGIONAL ROAD SAFETY COORDINATION
Regional Road Deaths at 30 September 2010 compared with 30 September 2009
RDC NSCC WCC ACC MCC PDC FDC Region
Sept 2010 7 2 4 12 10 0 7 42
Sept 2009 14 5 15 9 10 1 11 65
The annual regional road toll to September 30 2010 was 42, i.e. 23 less deaths than at the same time in 2009. The number of fatalities for the month of September 2010 (6), was the same as that for September 2009 (6).

19
4 MARKETING AND COMMUNICATIONS
4.1. MARKETING AND CUSTOMER INFORMATION CHANNELS
New Developments – September 2010
Service Consultation
Bus Service Consultation - Pukekohe
Proposed changes to bus services in Pukekohe were consulted on during September. Consultation activity included posters at bus stops and on buses, brochures distributed by mailbox drop and MAXX Ambassadors, and a feedback form available on the MAXX website. Feedback will be analysed and decisions on proposed changes made in the next few months.
Service Changes
New train timetable and the Onehunga Line
A new timetable was introduced on the Southern, Eastern and Western Lines on Sunday 19 September, including the introduction of 6-car trains on the Western Line and more services during the day across the network. The Onehunga Line also opened on this day. Overall the changes represented a 25% increase in train services.
A major campaign communicated the changes to train users and promoted the Onehunga Line. Tools used included advertising in the NZ Herald and local papers, Facebook, Dress-Smart door decals, radio advertising, posters on trains and at stations, Onehunga area mailbox drop, MAXX Ambassadors handing out timetables at stations and information on the MAXX website.
Bus Service Changes
Changes were made to bus services in Green Bay, North-West Auckland, Mahia Road, Marua Road and Onehunga on Sunday 19 September. Customers were advised of the changes via posters at bus stops and on buses, brochures distributed by mailbox drop and MAXX Ambassadors, advertising in local papers and on the MAXX website.
New Lynn Station Opening
The new bus-train interchange opened on Sunday 19 September. The new station makes it easier for passengers to connect between bus and train services and provides a comfortable indoor wait area, ticket office and other facilities for passengers.
A communications and marketing campaign promoted the new interchange and informed customers of bus stop changes. Tools used included flyers handed out by MAXX Ambassadors, on-board bus posters, posters in Lynn Mall, flyers distributed to local residents by mailbox drop and advertising in the Western Leader.
Special Event Transport Promotions
ITM Cup Eden Park Auckland V Wellington 11 September 2010
Train services were promoted via on-board posters, radio adverts and flyers distributed with ticket sales by Ticketmaster and Rebel Sport. A total of 662 train trips were made before the game and 696 trips after the game using the free transport with game ticket offer.
20
4.2. MEDIA AND COMMUNICATIONS – SEPTEMBER 2010
23 Sep 2010
Public Transport fares to rise in line with GST increase
The Auckland Regional Transport Authority (ARTA) announced the government’s GST increase will come into effect for all public transport fares in Auckland starting in early October 2010.
22 Sep 2010
Bus replacements on the Western and Eastern Lines
As intensive work to prepare the rail network for electrification continues, buses will be taking over on the Western and Eastern lines over the coming weekends. Vital maintenance and upgrading work will
also be carried out; such as platform extensions to improve services even further for passengers.
22 Sep 2010
State-of-the-art transport interchange opens in New Lynn
The highly anticipated New Lynn Transport Interchange, one of Auckland’s most exciting new developments, opened to the public on Sunday 19th September.
22 Sep 2010
ARTA asks Aucklanders to pledge to go ‘Car Free’
In celebration of World Car Free Day on Wednesday 22 September, the Auckland Regional Transport Authority (ARTA) is encouraging Aucklanders to vow to leave the car keys behind and pledge to go
car free and be in to win a Giant mountain bike worth over $800.
15 Sep 2010
Onehunga branch line reopening full steam ahead
A special historic steam train filled with guests celebrating the reopening of the Onehunga branch line will roll into a brand new Onehunga station on Saturday 18th September. The guests will be the first passengers to use the line in 37 years.
09 Sep 2010
MAXX launches RWC 2011 one-year-to-go webpage
MAXX has today launched its Rugby World Cup (RWC 2011) one-year-to-go webpage.
01 Sep 2010
Aucklanders buy before they board.
The Auckland Regional Transport Authority (ARTA) announced today it will be withdrawing the sale of monthly rail passes on-board trains from 3rd October following its highly successful customer driven campaign to encourage people to buy tickets before boarding.
21
5 CORPORATE SERVICE
5.1. FINANCIAL REPORT
NZD '000
September-10 Original
Budget Actual
Variance
Fav/(Unfav)
Original
Budget Actual
Variance
Fav/(Unfav)
Original
Budget
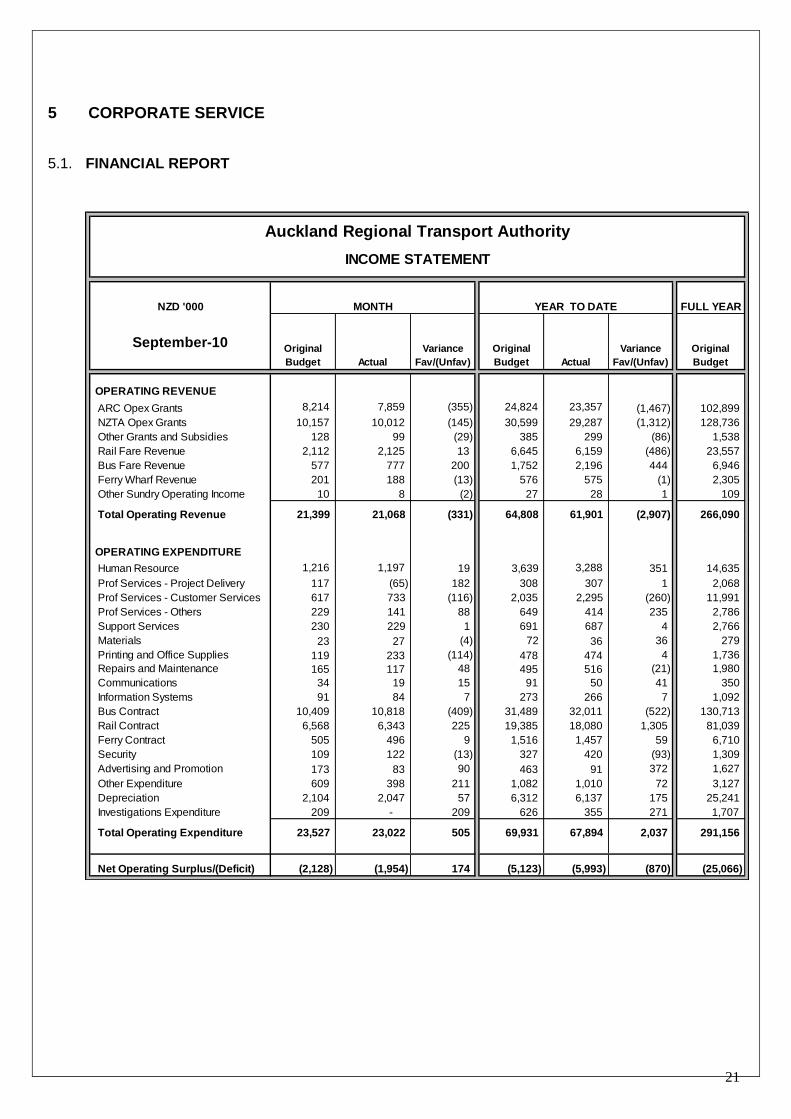
OPERATING REVENUE
ARC Opex Grants 8,214 7,859 (355) 24,824 23,357 (1,467) 102,899
NZTA Opex Grants 10,157 10,012 (145) 30,599 29,287 (1,312) 128,736
Other Grants and Subsidies 128 99 (29) 385 299 (86) 1,538
Rail Fare Revenue 2,112 2,125 13 6,645 6,159 (486) 23,557
Bus Fare Revenue 577 777 200 1,752 2,196 444 6,946
Ferry Wharf Revenue 201 188 (13) 576 575 (1) 2,305
Other Sundry Operating Income 10 8 (2) 27 28 1 109
Total Operating Revenue 21,399 21,068 (331) 64,808 61,901 (2,907) 266,090
OPERATING EXPENDITURE
Human Resource 1,216 1,197 19 3,639 3,288 351 14,635
Prof Services - Project Delivery 117 (65) 182 308 307 1 2,068
Prof Services - Customer Services 617 733 (116) 2,035 2,295 (260) 11,991
Prof Services - Others 229 141 88 649 414 235 2,786
Support Services 230 229 1 691 687 4 2,766
Materials 23 27 (4) 72 36 36 279
Printing and Office Supplies 119 233 (114) 478 474 4 1,736
Repairs and Maintenance 165 117 48 495 516 (21) 1,980
Communications 34 19 15 91 50 41 350
Information Systems 91 84 7 273 266 7 1,092
Bus Contract 10,409 10,818 (409) 31,489 32,011 (522) 130,713
Rail Contract 6,568 6,343 225 19,385 18,080 1,305 81,039
Ferry Contract 505 496 9 1,516 1,457 59 6,710
Security 109 122 (13) 327 420 (93) 1,309
Advertising and Promotion 173 83 90 463 91 372 1,627
Other Expenditure 609 398 211 1,082 1,010 72 3,127
Depreciation 2,104 2,047 57 6,312 6,137 175 25,241
Investigations Expenditure 209 - 209 626 355 271 1,707
Total Operating Expenditure 23,527 23,022 505 69,931 67,894 2,037 291,156
Net Operating Surplus/(Deficit) (2,128) (1,954) 174 (5,123) (5,993) (870) (25,066)
MONTH YEAR TO DATE FULL YEAR
Auckland Regional Transport Authority
INCOME STATEMENT
22
Jun-10 Sep-10 Aug-10 Movement Jun-10 Sep-10 Aug-10 Movement
$000s $000s $000s $000s $000s $000s $000s $000s
Liabilities Assets
Current Liabilities Current assets
Trade payables 7,983 8,794 8,037 756 Cash and cash equivalents 840 1,094 3,701 (2,607)
GST payable 667 744 192 552 Trade receivables 1,290 450 500 (50)
Employee benefit liabilities 848 1,153 1,030 123 GST receivable 0 0 0 0
Income in advance 49 8,374 11,167 (2,792) Accrued income 21,220 10,920 15,731 (4,811)
Accrued expenditure 39,323 22,970 33,286 (10,316) Prepayments 75 294 3,089 (2,795)
Transport grants payable 9,738 4,185 4,185 0 Inventories 5,661 5,740 5,696 44
Total current liabilities 58,608 46,220 57,898 (11,677) Related party receivables
Operating account 29,130 33,354 34,236 (882)
Non-current Liabilities Transport grants 9,738 4,185 4,185 0
Transport grants payable 0 0 0 0
Deferred tax 5,375 5,375 5,375 0 Total current assets 67,954 56,036 67,138 (11,102)
Non Realised Foreign Exchange Losses 4,966 3,686 3,938 (252)
Total non-current Liabilities 10,341 9,060 9,313 (252) Non-current assets
Property, plant & equipment 315,727 315,333 316,162 (829)
Total liabilities 68,949 55,281 67,210 (11,929) Intangible assets 21,539 21,449 21,479 (30)
Equity Related party receivables
Accumulated funds (1,233) 363 (392) 755 Transport grants (0) (0) (0) 0
Capital grants reserve 337,503 337,175 337,961 (786)
Total non-current assets 337,265 336,783 337,641 (858)
Total equity 336,271 337,538 337,569 (31)
Total equity and liabilities 405,220 392,819 404,779 (11,960) Total assets 405,220 392,819 404,779 (11,960)
ARTA ARTA
Statement of Financial Position
As at 30 September 2010

23
Full Year
Ended 30
June 2010
As at 30
September
2010
$000 Cash flows from operating activities $000
Cash was provided from:
88,939 ARC Opex grants 19,133
56,172 ARC Capex grants 3,479
11,233 ARC funding for IA grants vested in ARTA 5,553
32,306 LTNZ Capex grants 11,413
114,341 LTNZ Opex grants (excl. GST) 31,957
1,232 Other Grants and Subsidies 8,582
20,273 Rail Fare revenue 5,767
7,775 Bus Fare revenue 2,186
2,624 Ferry Wharf revenue 580
667 GST 77
113 Other Sundry Operating income 23
335,676 88,751
Cash was applied to:
214,261 Payments to Suppliers (excl. GST) 74,309
12,753 Payments to Employees 2,982
11,233 Payments to recipients of IA grants vested in ARTA 5,553
0 GST 0
238,248 82,845
97,429 Net Cash from Operating Activities 5,906
Cash Flows from Investing Activities
Cash was provided from:
- Realisation of Other Investments -
- Proceeds from Sale of Intangible Assets -
- -
Cash was applied to:
96,694 Purchase and Development of Fixed Assets 5,652
- Purchase and Development of Intangible Assets -
- Other Investments -
96,694 5,652
(96,694) Net Cash applied to Investing Activities (5,652)
Cash Flows from Financing Activities
Cash was provided from:
- Increase in loans -
Cash was applied to:
- Repayment of Loans -
- Net Cash from Financing Activities -
735 Net (Decrease)/Increase in Cash & Investments Held 254
105 Cash & Investments Balances at Beginning of the Period 840
840 Cash & Investments Balances at the End of the Period 1,094
Cash & Investments Balances Consist of:
- Bank Overdraft -
840 Cash 1,094
- Short Term Investments -
840 1,094
Reconciliation of Net Surplus with Net Cash Flows from Operating Activities
September 10
$000Cash was provided from:
Net Surplus 14-
Adjustment for items not involving cash:
Depreciation and amortisation 6,137
Donated asset 0
Deferred tax 0
Movements in working capital:
(Increase) in receivables from ARC (4,224)
(Increase) in trade and other receivables 10,921
Decrease/(Increase) in Inventory (79)
Increase in GST 77
Decrease/(Increase) in grants receivable from ARC 5,553
(Decrease)/Increase in trade and other payables (6,912)
(Decrease)/Increase in grants payable (5,553)
Net Cash from Operating Activities 5,906
Statement of Cash Flows
For the Period Ended 30 September 2010

24
5.2. STATEMENT OF FINANCIAL PERFORMANCE
SUMMARY OF OPERATIONAL VARIANCES
Services Revenue Income - $0.1m less than budget (lower than planned patronage on Rail in early months).
Bus Contract - $0.5m more than budget (continued demand growth across all concession groups).
Rail Contract - $1.3m less than budget (lower fuel prices than anticipated and lower reactive maintenance at stations).
Ferry Contract - $0.1m less than budget actual/budget phasing.
Security - $0.1m more than budget due to increased security at stations.
Depreciation - $0.2m less than budget (capitalisation of projects later than budgeted).
Advertising and Promotion - $0.4m less than budget (fewer advertising costs for marketing campaigns).
Investigations - $0.3m less than budget (actual/budget phasing).
Human Resources - $0.4m less than budget (less staff than budgeted).
OPERATING RESULTS – MONTH SEPTEMBER 2010
The results for the September month are reported against the revised 2010/11 Opex ARTA budget approved by the ARTA Board in December 2009.
Revenue
Operating Revenue on the lines Auckland Regional Council (ARC) Operating (Opex) Grants and New Zealand Transport Agency (NZTA) Opex Grants is claimed from funders in proportion to expenditure.
ARC Opex Grants are $0.4m less than budget and NZTA Opex Grants are $0.1m less than budget mainly due to less expenditure than budgeted.
Bus Fare Revenue is $0.2m more than budget due to higher patronage than forecast.
Expenditure
Major variances to budget are:
a) Professional Services – Project Delivery is $0.2m less than budget due to a timing difference between actual and budget.
b) Professional Services – Customer Services is $0.1m more than budget due to unplanned external support for AIFS.
c) Professional Services – Others is $0.1m less than budget due to a timing difference between actual and budget.
d) Printing and Office Supplies is $0.1m more than budget due to a timing difference between actual and budget.
e) Bus Contract is $0.4m more than budget due to concessions, particularly tertiary CFS and SuperGold.
f) Rail Contract is $0.2m less than budget due to lower fuel prices and lower than anticipated reactive maintenance at stations.
g) Advertising & Promotion is $0.1m less than budget due to reduced media costs in September.
h) Other Expenditure is $0.2m more than budget due to a timing difference between actual and budget.
i) Depreciation is $0.1m less than budget due to a timing difference in the capitalisation of some fixed assets.
j) Investigations Expenditure is $0.2m less than budget due to no work being undertaken in September.
25
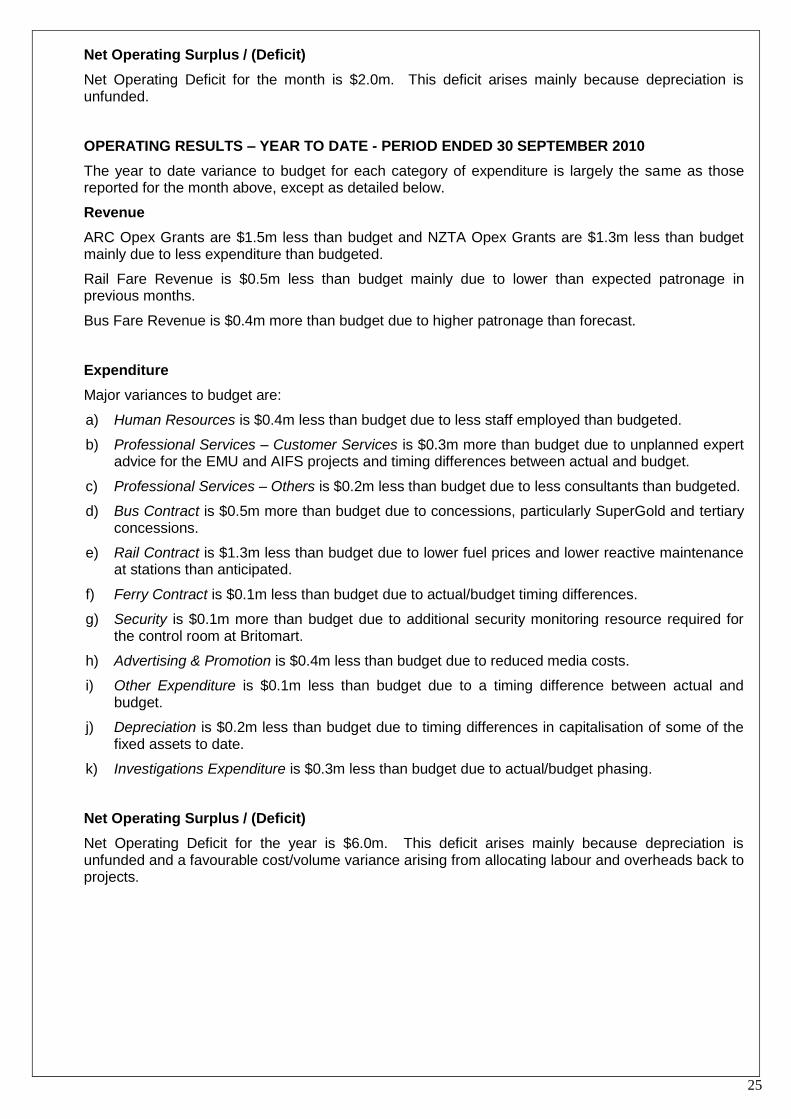
Net Operating Surplus / (Deficit)
Net Operating Deficit for the month is $2.0m. This deficit arises mainly because depreciation is unfunded.
OPERATING RESULTS – YEAR TO DATE - PERIOD ENDED 30 SEPTEMBER 2010
The year to date variance to budget for each category of expenditure is largely the same as those reported for the month above, except as detailed below.
Revenue
ARC Opex Grants are $1.5m less than budget and NZTA Opex Grants are $1.3m less than budget mainly due to less expenditure than budgeted.
Rail Fare Revenue is $0.5m less than budget mainly due to lower than expected patronage in previous months.
Bus Fare Revenue is $0.4m more than budget due to higher patronage than forecast.
Expenditure
Major variances to budget are:
a) Human Resources is $0.4m less than budget due to less staff employed than budgeted.
b) Professional Services – Customer Services is $0.3m more than budget due to unplanned expert advice for the EMU and AIFS projects and timing differences between actual and budget.
c) Professional Services – Others is $0.2m less than budget due to less consultants than budgeted.
d) Bus Contract is $0.5m more than budget due to concessions, particularly SuperGold and tertiary concessions.
e) Rail Contract is $1.3m less than budget due to lower fuel prices and lower reactive maintenance at stations than anticipated.
f) Ferry Contract is $0.1m less than budget due to actual/budget timing differences.
g) Security is $0.1m more than budget due to additional security monitoring resource required for the control room at Britomart.
h) Advertising & Promotion is $0.4m less than budget due to reduced media costs.
i) Other Expenditure is $0.1m less than budget due to a timing difference between actual and budget.
j) Depreciation is $0.2m less than budget due to timing differences in capitalisation of some of the fixed assets to date.
k) Investigations Expenditure is $0.3m less than budget due to actual/budget phasing.
Net Operating Surplus / (Deficit)
Net Operating Deficit for the year is $6.0m. This deficit arises mainly because depreciation is unfunded and a favourable cost/volume variance arising from allocating labour and overheads back to projects.

26
5.3. STATEMENT OF FINANCIAL POSITION
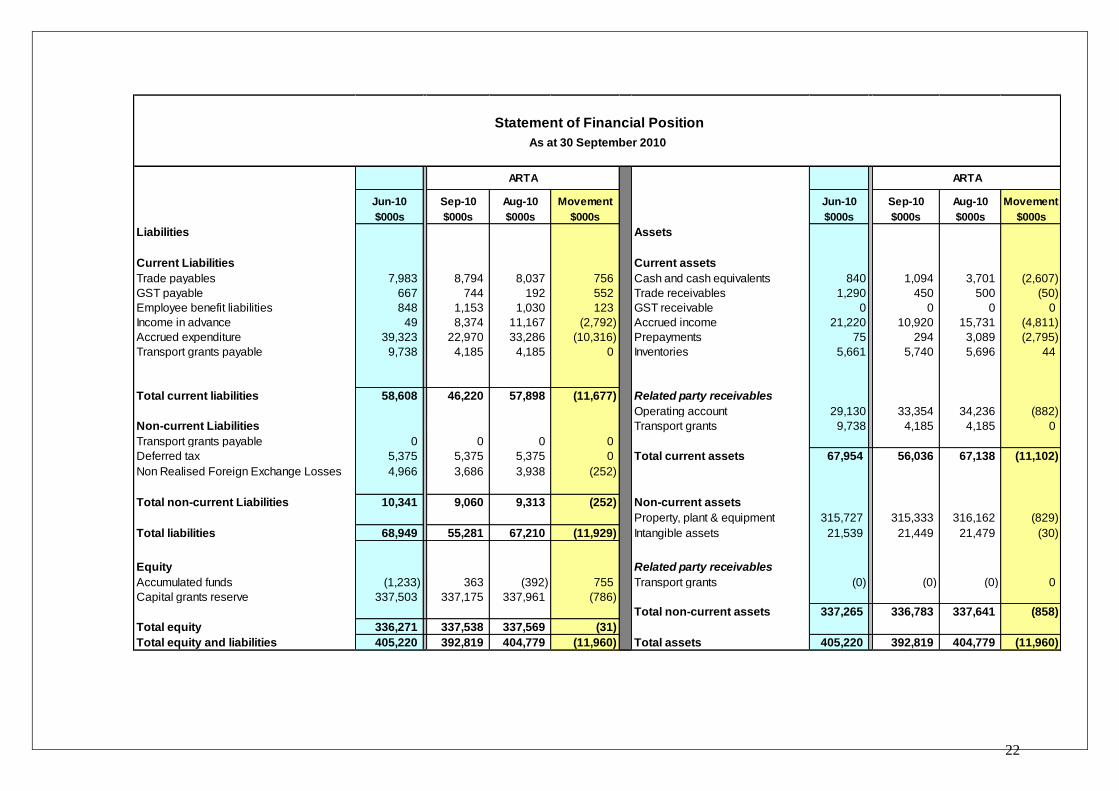
The key features of the Statement of Financial Position as at 30 September 2010 are:
Current Liabilities
The total trade payables have increased by $0.8m between August and September mainly due to Capex invoices for New Lynn.
Income in advance has decreased by $2.8m due to the Veolia quarterly invoice.
Accrued expenditure has decreased by $10.3m due to a reduction in Rail & General Capex accruals.
Creditors (included in Trade Payables)
Detail Current 30-60 Days More than 60 Days
Accounts Payable – September 10 $668,750
Accounts Payable – August 10 $4,959,668 $348,767 $26,072
Accounts Payable (60+ days) explanation:
- August amount was paid on the 1st of September.
Grants Payable and Grants Receivable are equal and opposite current and long term liabilities and assets recognising the ex Infrastructure Auckland grants that were taken over by ARTA. This recognises that we have a payable to an external party and a matching receivable from the ARC.
Current Assets
Accrued income has decreased by $4.8m mainly due to a decrease in the amount to be claimed from NZTA.
Prepayments have decreased by $2.8m mainly due to the Veolia 1st quarter invoice.
Debtors (included in Trade Receivables)
Detail Current 30–60 Days More than 60
days
Accounts Receivable – September 10
$251,481 $138,234 $59,712
Accounts Receivable – August 10
$413,698 $66,426 $19,455
Debtors (60+ days) explanation
- Ferry related $59,712 (including $45,736 for Fullers Group – see below)
Fullers Group has been followed up and a copy invoice sent. The remaining Ferry debtors are on payment plans.
Public Equity
Transport Ring Fence represents the appropriation of grants for rolling stock refurbishment and fixed asset purchase. These grants will be appropriated back to the profit and loss account to offset depreciation.