monthly rental report according to analysis from corelogic rp data, rental rates across the combined...
TRANSCRIPT

Monthly Rental Report
According to analysis from CoreLogic RP Data, rental rates across the combined capital cities fell by -0.3% in July 2015 and the annual rate of growth continues to slow, reaching a new record low of 0.9%.
Across the combined capital cities, dwelling rental rates are recorded at $486 per week and they have fallen by -0.3% over the month, are up by 0.3% over the first seven months of the year and have increased by just 0.9% over the past 12 months. The 0.9% annual rise in capital city rents is the slowest rate of growth on record, with data going back to December 1995. The sluggish pace of rental appreciation continues to be attributed to the ongoing boom in dwelling construction across Australia’s capital cities accompanied by record high participation in the housing market from investors. A high proportion of the inner city unit development in particular is being targeted by domestic investors and foreign purchasers.
Looking across the individual capital cities, over the past year, Sydney and Hobart have recorded the greatest increases in weekly rents. Over the past month, weekly rents have moved lower across every capital city and over the past three months rents are lower in all cities except for Melbourne.
CHANGE IN RENTS YIELDS
Region Current Month Quarter YoY Current 12 Months Ago
Sydney $593 -0.2% -0.2% 2.5% 3.3% 3.9%
Melbourne $448 -0.3% 0.4% 2.1% 3.1% 3.4%
Brisbane $433 -0.1% -0.4% 1.1% 4.5% 4.6%
Adelaide $367 -0.1% -0.4% 0.3% 4.2% 4.4%
Perth $468 -0.8% -2.4% -5.6% 4.0% 4.2%
Hobart $339 -0.6% -1.0% 2.3% 5.2% 5.2%
Darwin $549 -0.9% -4.1% -9.3% 5.6% 5.9%
Canberra $494 -0.4% -0.7% 0.5% 4.1% 4.2%
Combined Capitals $486 -0.3% -0.3% 0.9% 3.5% 3.9%
Rental Index results as at July 31, 2015
Weekly rents fall across every capital city over the month of July
CoreLogic RP Data July Rental Index Results
Rental Review Snapshot – Released: August 10, 2015
1
Weekly rents rising at the slowest pace on record
• After weekly rents fell a further 0.3% over the month of July, the annual pace of rental growth across the combined capital cities has fallen to a new record low of just 0.9% per annum
• Despite recording the strongest growth, Sydney rents rose just 2.5% per annum• Rents are falling in Darwin and Perth, down by 9.3% and 5.6% over the past twelve months• Combined capital city rental rates are recorded at $490 per week for houses and $462 per
week for units.• With home values growing faster than rents, gross rental yields are at a record low level and
continue to edge lower

Monthly Rental Report
Combined capital city house rents were recorded at $490 per week in July 2015 and unit rents were $462 per week. The gap in the rental cost remains significantly lower than the actual purchase cost of a house relative to a unit. Over the past month, house rents have fallen by -0.3% while unit rental rates were steady.
Over the three months to July 2015, rental rates for houses are down 0.5% whilst for units they have barely risen (0.2%). The data points to the fact that more recently the rate of rental growth has started to slow even further. Over the past year house rents have increased by 0.7% while units have recorded a slightly greater 1.6% annual rise. The ongoing slowdown in rental growth is likely due to heightened new housing supply and historic high levels of housing investment.
Annual rental growth is currently at its slowest pace on record and is also well below its 10 year average levels. The 10 year annual rate of rental growth is currently higher than growth over the past year across each capital city. Sluggish rental growth is most likely due to surging investment demand, record high levels of new housing construction and a slowing
Change in rental rates for houses over past 12 months
Annual change in rentals rates over past 10 years
Change in rental rates for units over past 12 months
2
rate of population growth nationally. These factors are creating more rental accommodation and suppressing rental increases.
With rental rates already increasing at their slowest annual rate on record, we envisage that the growth in rental rates could slow even further over the coming months. The pipeline of residential construction activity as well as investment demand is at a record high which means people choosing to rent will continue to have more accommodation choices and owners will have less scope to increase rent
CoreLogic RP Data July Rental Index Results
SydneyMelbourne
BrisbaneAdelaide
PerthHobartDarwin
CanberraCombined Capitals
-12%-10% -8% -6% -4% -2% 0% 2% 4%
2.3%2.1%
1.3%0.4%
-5.5%2.2%
-9.5%0.6%0.7%
SydneyMelbourne
BrisbaneAdelaide
PerthHobartDarwin
CanberraCombined Capitals
-10% -8% -6% -4% -2% 0% 2% 4% 6%
2.9%1.8%
-0.2%0.3%
-7.2%4.1%
-8.1%-0.8%
1.6%
Sydney
Melbourne
Brisbane
Adelaide
Perth
Hobart
Darwin
Canberra
Combined Capitals
0% 1% 2% 3% 4% 5% 6%
4.8%
3.6%
4.1%
3.2%
5.2%
3.1%
4.6%
2.9%
4.4%
Monthly Rental Report
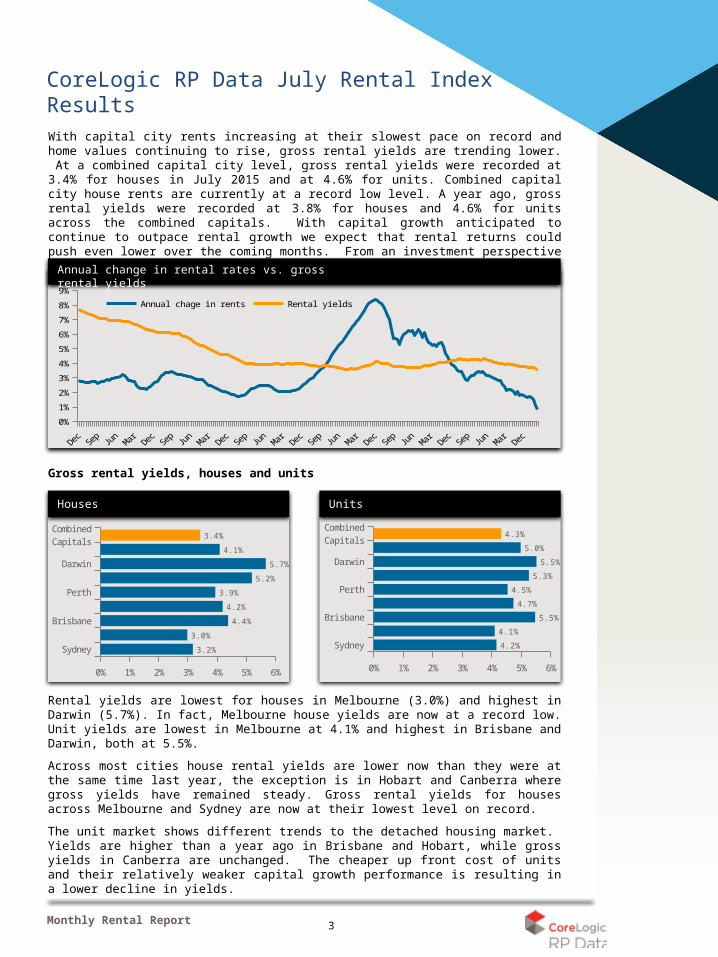
With capital city rents increasing at their slowest pace on record and home values continuing to rise, gross rental yields are trending lower. At a combined capital city level, gross rental yields were recorded at 3.4% for houses in July 2015 and at 4.6% for units. Combined capital city house rents are currently at a record low level. A year ago, gross rental yields were recorded at 3.8% for houses and 4.6% for units across the combined capitals. With capital growth anticipated to continue to outpace rental growth we expect that rental returns could push even lower over the coming months. From an investment perspective it means that capital growth is going to be much more important for a return on investment.
Annual change in rental rates vs. gross rental yields
Houses Units
Gross rental yields, houses and units
3
Rental yields are lowest for houses in Melbourne (3.0%) and highest in Darwin (5.7%). In fact, Melbourne house yields are now at a record low. Unit yields are lowest in Melbourne at 4.1% and highest in Brisbane and Darwin, both at 5.5%.
Across most cities house rental yields are lower now than they were at the same time last year, the exception is in Hobart and Canberra where gross yields have remained steady. Gross rental yields for houses across Melbourne and Sydney are now at their lowest level on record.
The unit market shows different trends to the detached housing market. Yields are higher than a year ago in Brisbane and Hobart, while gross yields in Canberra are unchanged. The cheaper up front cost of units and their relatively weaker capital growth performance is resulting in a lower decline in yields.
CoreLogic RP Data July Rental Index Results
Jul-97 Jul-99 Jul-01 Jul-03 Jul-05 Jul-07 Jul-09 Jul-11 Jul-13 Jul-15
0%
1%
2%
3%
4%
5%
6%
7%
8%
9%
Annual chage in rents Rental yields
Sydney
Brisbane
Perth
Darwin
Combined Capitals
0% 1% 2% 3% 4% 5% 6%
3.2%
3.0%
4.4%
4.2%
3.9%
5.2%
5.7%
4.1%
3.4%
Sydney
Brisbane
Perth
Darwin
Combined Capitals
0% 1% 2% 3% 4% 5% 6%
4.2%
4.1%
5.5%
4.7%
4.5%
5.3%
5.5%
5.0%
4.3%
Monthly Rental Report
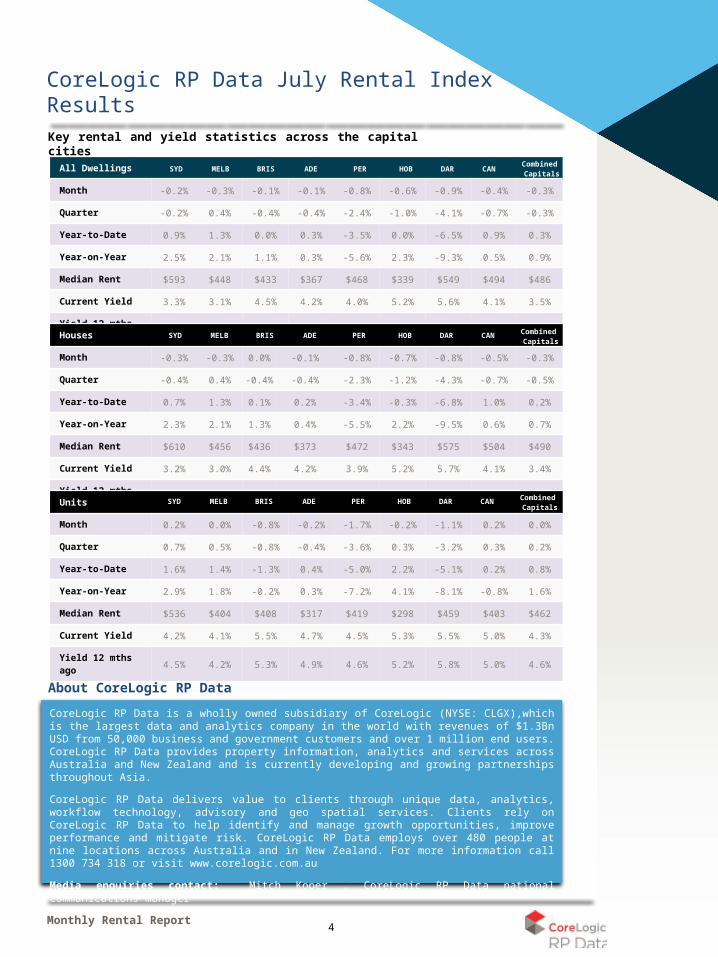
All Dwellings
Month -0.2% -0.3% -0.1% -0.1% -0.8% -0.6% -0.9% -0.4% -0.3%
Quarter -0.2% 0.4% -0.4% -0.4% -2.4% -1.0% -4.1% -0.7% -0.3%
Year-to-Date 0.9% 1.3% 0.0% 0.3% -3.5% 0.0% -6.5% 0.9% 0.3%
Year-on-Year 2.5% 2.1% 1.1% 0.3% -5.6% 2.3% -9.3% 0.5% 0.9%
Median Rent $593 $448 $433 $367 $468 $339 $549 $494 $486
Current Yield 3.3% 3.1% 4.5% 4.2% 4.0% 5.2% 5.6% 4.1% 3.5%
Yield 12 mths ago 3.9% 3.4% 4.6% 4.4% 4.2% 5.2% 5.9% 4.2% 3.9%
SYD MELB BRIS ADE PER HOB DAR CANCombined
Capitals
Houses
Month -0.3% -0.3% 0.0% -0.1% -0.8% -0.7% -0.8% -0.5% -0.3%
Quarter -0.4% 0.4% -0.4% -0.4% -2.3% -1.2% -4.3% -0.7% -0.5%
Year-to-Date 0.7% 1.3% 0.1% 0.2% -3.4% -0.3% -6.8% 1.0% 0.2%
Year-on-Year 2.3% 2.1% 1.3% 0.4% -5.5% 2.2% -9.5% 0.6% 0.7%
Median Rent $610 $456 $436 $373 $472 $343 $575 $504 $490
Current Yield 3.2% 3.0% 4.4% 4.2% 3.9% 5.2% 5.7% 4.1% 3.4%
Yield 12 mths ago 3.7% 3.3% 4.5% 4.3% 4.2% 5.2% 5.9% 4.1% 3.8%
Units
Month 0.2% 0.0% -0.8% -0.2% -1.7% -0.2% -1.1% 0.2% 0.0%
Quarter 0.7% 0.5% -0.8% -0.4% -3.6% 0.3% -3.2% 0.3% 0.2%
Year-to-Date 1.6% 1.4% -1.3% 0.4% -5.0% 2.2% -5.1% 0.2% 0.8%
Year-on-Year 2.9% 1.8% -0.2% 0.3% -7.2% 4.1% -8.1% -0.8% 1.6%
Median Rent $536 $404 $408 $317 $419 $298 $459 $403 $462
Current Yield 4.2% 4.1% 5.5% 4.7% 4.5% 5.3% 5.5% 5.0% 4.3%
Yield 12 mths ago 4.5% 4.2% 5.3% 4.9% 4.6% 5.2% 5.8% 5.0% 4.6%
Key rental and yield statistics across the capital cities
4
About CoreLogic RP Data
CoreLogic RP Data is a wholly owned subsidiary of CoreLogic (NYSE: CLGX),which is the largest data and analytics company in the world with revenues of $1.3Bn USD from 50,000 business and government customers and over 1 million end users. CoreLogic RP Data provides property information, analytics and services across Australia and New Zealand and is currently developing and growing partnerships throughout Asia.
CoreLogic RP Data delivers value to clients through unique data, analytics, workflow technology, advisory and geo spatial services. Clients rely on CoreLogic RP Data to help identify and manage growth opportunities, improve performance and mitigate risk. CoreLogic RP Data employs over 480 people at nine locations across Australia and in New Zealand. For more information call 1300 734 318 or visit www.corelogic.com.au
Media enquiries contact: Mitch Koper , CoreLogic RP Data national communications manager – 07 3114 9879 or [email protected]
SYD MELB BRIS ADE PER HOB DAR CANCombined
Capitals
SYD MELB BRIS ADE PER HOB DAR CANCombined
Capitals
CoreLogic RP Data July Rental Index Results
Monthly Rental Report
SYD MELB BRIS ADE PER HOB DAR CANCombined
Capitals
4
SYD MELB BRIS ADE PER HOB DAR CANCombined
Capitals
SYD MELB BRIS ADE PER HOB DAR CANCombined
Capitals
Disclaimers
© 2015 Copyright RP Data Pty Ltd, Local, State, and Commonwealth Governments. All rights reserved. No reproduction, distribution or transmission of the copyrighted materials in this publication is permitted whether in whole or in part.
The information provided in this publication is current as at the publication date only. This publication is supplied on the basis that while rpdata.com believes all the information in it is deemed reliable at the publication date, it does not warrant its accuracy or completeness and to the full extent allowed by law excludes liability in contract, tort or otherwise, for any loss or damage sustained by yourself, or by any other person or body corporate arising from or in connection with the supply or use of the whole or any part of the information in this publication through any cause whatsoever and limits any liability it may have to the amount paid to rpdata.com for the supply of such information.
This publication provides general information only – it is not intended as advice and should not be relied upon as such. The material has not been prepared by taking into account your investment objectives, financial situation or personal needs. You should make your own inquiries and if necessary take independent financial advice tailored to your specific circumstances before making any investment decisions.
Queensland Data© The State of Queensland (Department of Environment and Resource Management) 2014. Based on data provided with the permission of the Department of Natural Resources and Mines: [QVAS 2014)]. The Department of Environment and Resource Management makes no representations or warranties about accuracy, reliability, completeness or suitability of the data for any particular purpose and disclaims all responsibility and all liability (including without limitation, liability in negligence) for all expenses, losses and damages (including indirect or consequential damage) and costs which might be incurred as a result of the data being inaccurate or incomplete in any way and for any reason.
South Australian DataThis information is based on data supplied by the South Australian Government and is published by permission. The South Australian Government does not accept any responsibility for the accuracy or completeness of the published information or suitability for any purpose of the published information or the underlying data.
New South Wales DataContains property sales information provided under licence from the Land and Property Information (“LPI”). RP Data is authorised as a Property Sales Information provider by the LPI.
Victorian DataTo the extent that this report has been developed using information owned by the State of Victoria, the State of Victoria owns the copyright in the Property Sales Data which constitutes the basis of this report and reproduction of that data in any way without the consent of the State of Victoria will constitute a breach of the Copyright Act 1968 (Cth). The State of Victoria does not warrant the accuracy or completeness of the information contained in this report and any person using or relying upon such information does so on the basis that the State of Victoria accepts no responsibility or liability whatsoever for any errors, faults, defects or omissions in the information supplied.
Western Australian DataBased on information provided by and with the permission of the Western Australian Land Information Authority (2014) trading as Landgate.
Australian Capital Territory DataThe Territory Data is the property of the Australian Capital Territory. No part of it may in any form or by any means (electronic, mechanical, microcopying, photocopying, recording or otherwise) be reproduced, stored in a retrieval system or transmitted without prior written permission. Enquiries should be directed to: Director, Customer Services ACT Planning and Land Authority GPO Box 1908 Canberra ACT 2601.
Tasmanian DataThis product incorporates data that is copyright owned by the Crown in Right of Tasmania. The data has been used in the product with the permission of the Crown in Right of Tasmania. The Crown in Right of Tasmania and its employees and agents:a) give no warranty regarding the data’s accuracy, completeness, currency or suitability for any particular purpose; andb) do not accept liability howsoever arising, including but not limited to negligence for any loss resulting from the use of or reliance upon the data.
Base data from the LIST © State of Tasmania http://www.thelist.tas.gov.au