monthly report of december 2017sakala.kar.nic.in/sakala_monthly_report/2017/report of...chapter 1b:...
TRANSCRIPT

MONTHLY REPORT OF
DECEMBER 2017


FROM THE DESK OF MISSION DIRECTOR
District Ranking:
Rank District District Rank
1 Bengaluru Rural Kodagu 28
2 Chikkaballapura Bengaluru 29
3 Udupi Dakshina Kannada 30
Records shown above as on 31/12/2017 12:00:00
Taluka Rankings:
Rank Taluk District
1 Shimoga Shivamogga
2 Sirsi Uttara Kannada
3 Hubli Dharwad Records shown above as on 31/12/2017 12:00:00
Applications and Disposal Trends:
Receipts Disposals
Month of Dec -2017 22,11,019 21,05,172
Cumulative Count 15,48,66,982 15,41,74,731 Records shown above as on 31/12/2017 12:00:00
Over Due: A total of 62,413 overdue were seen at the close of the month.
Delayed Disposal: 98,082 applications were disposed with delay in this month.
4.659 % is the delayed disposals rate for this month.
Rejections: 1,31,908 applications were rejected in this month. 6.266% is the
rejection rate for this month
Offices with 7 or more defaults: 1,178 offices were found to have made
defaults 7 or more times in this calendar month.
Rajeev Chawla, IAS
Mission Director
Sakala

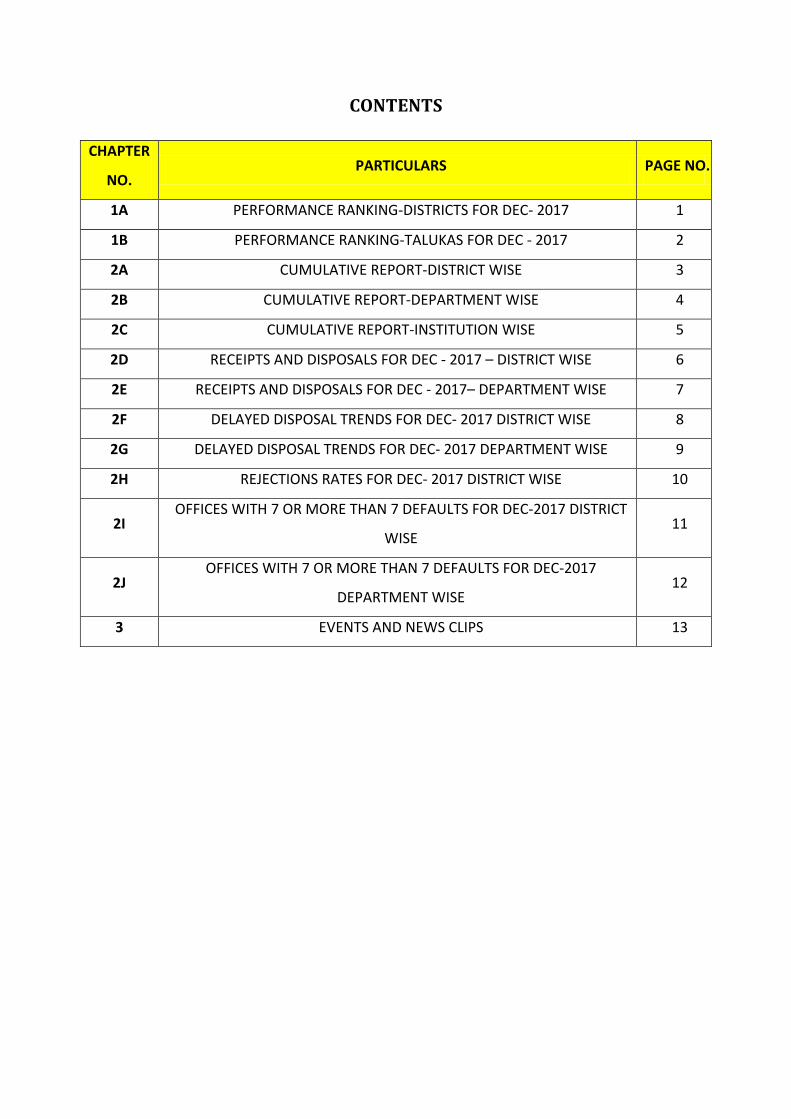
CONTENTS
CHAPTER
NO. PARTICULARS PAGE NO.
1A PERFORMANCE RANKING-DISTRICTS FOR DEC- 2017 1
1B PERFORMANCE RANKING-TALUKAS FOR DEC - 2017 2
2A CUMULATIVE REPORT-DISTRICT WISE 3
2B CUMULATIVE REPORT-DEPARTMENT WISE 4
2C CUMULATIVE REPORT-INSTITUTION WISE 5
2D RECEIPTS AND DISPOSALS FOR DEC - 2017 – DISTRICT WISE 6
2E RECEIPTS AND DISPOSALS FOR DEC - 2017– DEPARTMENT WISE 7
2F DELAYED DISPOSAL TRENDS FOR DEC- 2017 DISTRICT WISE 8
2G DELAYED DISPOSAL TRENDS FOR DEC- 2017 DEPARTMENT WISE 9
2H REJECTIONS RATES FOR DEC- 2017 DISTRICT WISE 10
2I OFFICES WITH 7 OR MORE THAN 7 DEFAULTS FOR DEC-2017 DISTRICT
WISE 11
2J OFFICES WITH 7 OR MORE THAN 7 DEFAULTS FOR DEC-2017
DEPARTMENT WISE 12
3 EVENTS AND NEWS CLIPS 13


1
CHAPTER 1A: DISTRICT PERFORMANCE RANKING FOR DECEMBER
2017
S N
District
Ranking based on In
time disposals(A)
Ranking based on SAKALA
Receipts/One lakh population(B)
Overall Ranking((A+B)/2)
1 Bengaluru Rural 8 1 1
2 Chikkaballapura 11 3 2
3 Udupi 6 8 3
4 Mandya 13 2 4
5 Dharwad 4 11 5
6 Shivamogga 2 14 6
7 Kolar 17 4 7
8 Bidar 13 9 8
9 Davanagere 6 19 9
10 Hassan 20 6 10
11 Chamarajanagar 3 23 11
12 Uttara Kannada 1 26 12
13 Mysuru 17 13 13
14 Chitradurga 8 22 14
15 Tumakuru 27 5 15
16 Yadgir 25 7 16
17 Haveri 4 29 17
18 Kalaburagi 19 16 18
19 Vijayapura 11 24 19
20 Bagalkot 10 25 20
21 Gadag 16 20 21
22 Ballari 20 17 22
23 Ramanagara 28 10 23
24 Chikkamagaluru 23 15 24
25 Koppal 30 12 25
26 Raichur 24 18 26
27 Belagavi 15 28 27
28 Kodagu 22 27 28
29 Bengaluru 29 21 29
30 Dakshina Kannada
26 30 30
Records shown above as on 31/12/2017 12:00:00
2
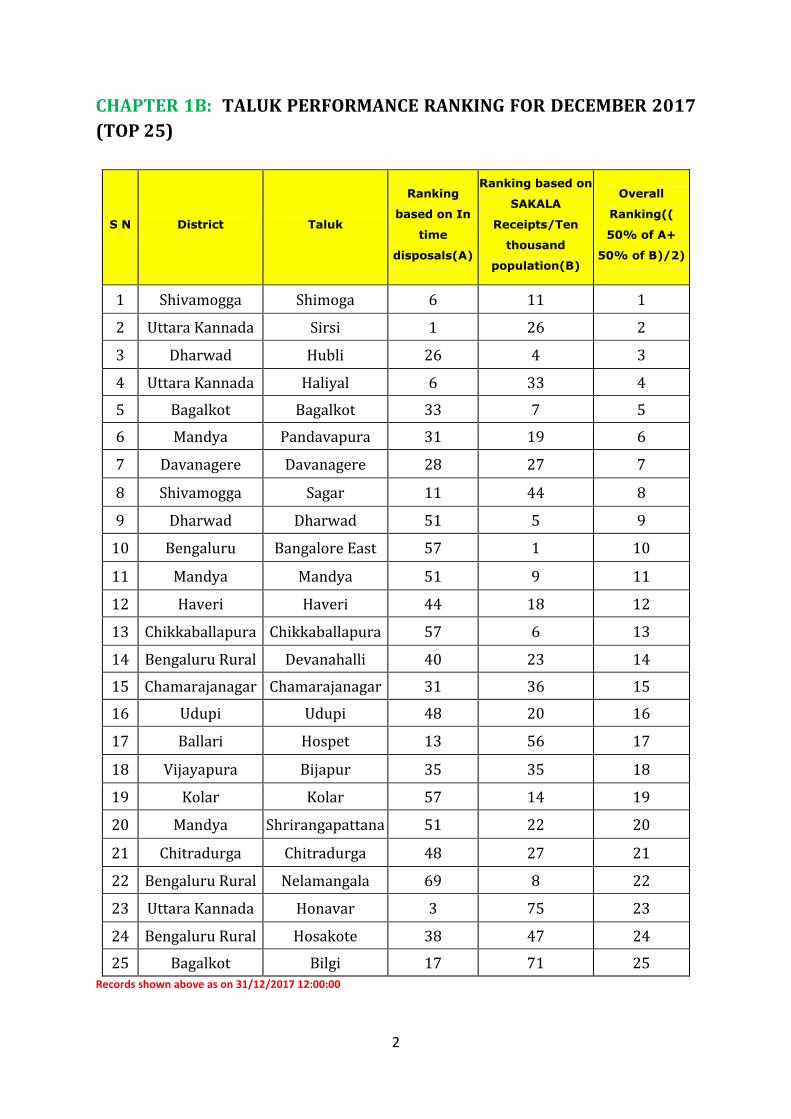
CHAPTER 1B: TALUK PERFORMANCE RANKING FOR DECEMBER 2017
(TOP 25)
S N District Taluk
Ranking
based on In
time
disposals(A)
Ranking based on
SAKALA
Receipts/Ten
thousand
population(B)
Overall
Ranking((
50% of A+
50% of B)/2)
1 Shivamogga Shimoga 6 11 1
2 Uttara Kannada Sirsi 1 26 2
3 Dharwad Hubli 26 4 3
4 Uttara Kannada Haliyal 6 33 4
5 Bagalkot Bagalkot 33 7 5
6 Mandya Pandavapura 31 19 6
7 Davanagere Davanagere 28 27 7
8 Shivamogga Sagar 11 44 8
9 Dharwad Dharwad 51 5 9
10 Bengaluru Bangalore East 57 1 10
11 Mandya Mandya 51 9 11
12 Haveri Haveri 44 18 12
13 Chikkaballapura Chikkaballapura 57 6 13
14 Bengaluru Rural Devanahalli 40 23 14
15 Chamarajanagar Chamarajanagar 31 36 15
16 Udupi Udupi 48 20 16
17 Ballari Hospet 13 56 17
18 Vijayapura Bijapur 35 35 18
19 Kolar Kolar 57 14 19
20 Mandya Shrirangapattana 51 22 20
21 Chitradurga Chitradurga 48 27 21
22 Bengaluru Rural Nelamangala 69 8 22
23 Uttara Kannada Honavar 3 75 23
24 Bengaluru Rural Hosakote 38 47 24
25 Bagalkot Bilgi 17 71 25 Records shown above as on 31/12/2017 12:00:00

3
CHAPTER 2A: CUMULATIVE REPORT-DISTRICT WISE
S No DISTRICT TOTAL NO.
OF RECIEPTS
TOTAL NO. OF
DISPOSALS
TOTAL NO. OF
APPEAL1
RECEIVED
TOTAL NO. OF
APPEAL_1 RECIEPTS
DISPOSALS
TOTAL NO. OF
APPEAL2
RECEIVED
TOTAL NO. OF
APPEAL2 DISPOSAL
S
NO. OF PENDENCY AFTER
DUE DATE
1 Mysuru 7425971 7384894 59 51 1 0 8492
2 Bengaluru 25921982 25829438 660 303 16 7 7902
3 Tumakuru 7721035 7681661 82 62 1 0 3656
4 Ballari 6073746 6040770 110 92 15 15 3335
5 Mandya 5381814 5351741 51 28 3 1 3325
6 Raichur 4710327 4685189 177 147 54 54 3053
7 Vijayapura 5024385 4996460 50 34 2 1 2899
8 Dakshina Kannada
5150094 5128149 10 7 0 0 2546
9 Kalaburagi 5722695 5686461 126 96 4 4 2474
10 Koppal 3380308 3358649 43 8 0 0 2384
11 Ramanagara 2937359 2927625 15 9 0 0 2019
12 Bagalkot 4654678 4640892 33 26 2 2 1935
13 Belagavi 10280399 10259011 89 72 3 2 1904
14 Hassan 5049690 5024562 36 26 1 0 1720
15 Davanagere 4673632 4648017 228 221 50 50 1397
16 Dharwad 4644449 4625469 47 45 31 29 1273
17 Kolar 4635984 4620301 57 54 3 3 1265
18 Chikkamagal
uru 2953326 2940779 27 19 3 2 1244
19 Gadag 2708997 2695321 15 15 3 3 1211
20 Yadgir 2524768 2499899 71 70 1 1 1189
21 Chitradurga 4183800 4169826 35 33 2 2 1105
22 Udupi 3056698 3040239 24 16 1 1 988
23 Chikkaballa
pura 4089462 4066816 57 42 1 0 981
24 Bidar 3745203 3715418 101 57 2 2 968
25 Haveri 3497665 3487669 51 29 5 1 755
26 Bengaluru
Rural 2779737 2767068 57 22 0 0 567
27 Kodagu 1255042 1250679 3 3 0 0 567
28 Chamarajan
agar 2441560 2431535 33 33 1 0 465
29 Uttara
Kannada 3778827 3769312 25 24 1 1 436
30 Shivamogga 4463349 4450881 25 23 0 0 358
Total
154866982 154174731 2397 1667 206 181 62413
Records shown above as on 31/12/2017 12:00:00

4
CHAPTER 2B: CUMULATIVE REPORT-DEPARTMENT WISE
S No MAIN DEPARTMENT TOTAL NO.
OF RECIEPTS
TOTAL NO. OF DISPOSALS
TOTAL NO. OF
APPEAL1 RECEIVED
TOTAL NO. OF
APPEAL1 DISPOSAL
S
TOTAL NO. OF
APPEAL2
RECEIVED
TOTAL NO. OF
APPEAL2
DISPOSALS
PENDENCY AFTER DUE
DATE
1 REVENUE DEPARTMENT 84299269 83764076 1957 1446 183 171 48744
2 TRANSPORT DEPARTMENT 30163206 30098690 7 5 0 0 4395
3 URBAN DEVELOPMENT 4604413 4592032 148 68 5 2 2535
4 PRIMARY AND SECONDARY
EDUCATION
644247 638479 63 45 3 3 1576
5 HOME DEPARTMENT 6228009 6185682 25 7 0 0 1377
6 FINANCE DEPARTMENT 12599074 12594868 13 7 0 0 927
7 RDPR 6813121 6800089 178 87 14 4 804
8 FOREST, ECOLOGY AND
ENVIRONMENT
22056 21130 0 0 0 0 538
9 HEALTH AND FAMILY
WELFARE
1544365 1541750 0 0 0 0 440
10 WOMEN AND CHILD
WELFARE
1486311 1484261 0 0 0 0 310
11 FOOD AND CIVIL SUPPLIES 5005536 5003899 2 2 1 1 251
12 CO-OPERATION 99991 98413 0 0 0 0 149
13 LABOUR DEPARTMENT 843266 838570 0 0 0 0 135
14 HIGHER EDUCATION 258671 257952 2 0 0 0 121
15 ANIMAL HUSBANDRY AND FISHERIES DEPARTMENT
16562 16347 0 0 0 0 59
16 PUBLIC WORKS, PORTS
AND INLAND WATER TRANSPORT DEPARTMENT
2062 2030 0 0 0 0 27
17 HOUSING DEPARTMENT 11713 11679 0 0 0 0 7
18 DEPARTMENT OF YOUTH
EMPOWERMENT AND SPORTS
854 813 0 0 0 0 5
19 HORTICULTURE 52407 52181 0 0 0 0 4
20 KANNADA, CULTURE AND
INFORMATION
4082 4078 0 0 0 0 3
21 COMMERCE AND
INDUSTRIES DEPARTMENT
166600 166550 2 0 0 0 3
22
INFORMATION TECHNOLOGY,BIO
TECHNOLOGY AND SCIENCE AND TECHNOLOGY
13 9 0 0 0 0 2
23 DPAR 1152 1151 0 0 0 0 1
24 MINES AND GEOLOGY
DEPARTMENT
0 0 0 0 0 0 0
25 BACKWARD CLASSES
WELFARE DEPARTMENT
2 2 0 0 0 0 0
26 WATER RESOURCES
DEPARTMENT
0 0 0 0 0 0 0
154866982 154174731 2397 1667 206 181 62413
Records shown above as on 31/12/2017 12:00:00
5
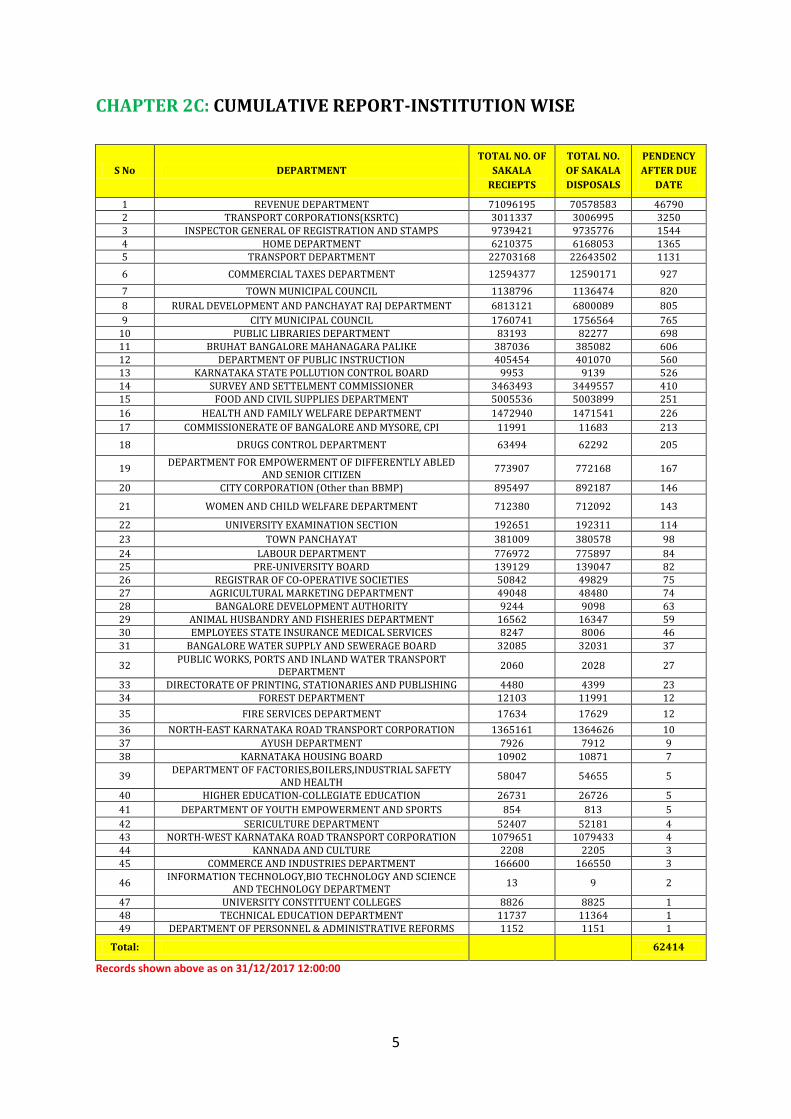
CHAPTER 2C: CUMULATIVE REPORT-INSTITUTION WISE
S No DEPARTMENT
TOTAL NO. OF
SAKALA
RECIEPTS
TOTAL NO.
OF SAKALA
DISPOSALS
PENDENCY
AFTER DUE
DATE
1 REVENUE DEPARTMENT 71096195 70578583 46790 2 TRANSPORT CORPORATIONS(KSRTC) 3011337 3006995 3250 3 INSPECTOR GENERAL OF REGISTRATION AND STAMPS 9739421 9735776 1544 4 HOME DEPARTMENT 6210375 6168053 1365 5 TRANSPORT DEPARTMENT 22703168 22643502 1131
6 COMMERCIAL TAXES DEPARTMENT 12594377 12590171 927
7 TOWN MUNICIPAL COUNCIL 1138796 1136474 820
8 RURAL DEVELOPMENT AND PANCHAYAT RAJ DEPARTMENT 6813121 6800089 805
9 CITY MUNICIPAL COUNCIL 1760741 1756564 765 10 PUBLIC LIBRARIES DEPARTMENT 83193 82277 698 11 BRUHAT BANGALORE MAHANAGARA PALIKE 387036 385082 606 12 DEPARTMENT OF PUBLIC INSTRUCTION 405454 401070 560 13 KARNATAKA STATE POLLUTION CONTROL BOARD 9953 9139 526 14 SURVEY AND SETTELMENT COMMISSIONER 3463493 3449557 410 15 FOOD AND CIVIL SUPPLIES DEPARTMENT 5005536 5003899 251
16 HEALTH AND FAMILY WELFARE DEPARTMENT 1472940 1471541 226
17 COMMISSIONERATE OF BANGALORE AND MYSORE, CPI 11991 11683 213
18 DRUGS CONTROL DEPARTMENT 63494 62292 205
19 DEPARTMENT FOR EMPOWERMENT OF DIFFERENTLY ABLED
AND SENIOR CITIZEN 773907 772168 167
20 CITY CORPORATION (Other than BBMP) 895497 892187 146
21 WOMEN AND CHILD WELFARE DEPARTMENT 712380 712092 143
22 UNIVERSITY EXAMINATION SECTION 192651 192311 114
23 TOWN PANCHAYAT 381009 380578 98
24 LABOUR DEPARTMENT 776972 775897 84 25 PRE-UNIVERSITY BOARD 139129 139047 82 26 REGISTRAR OF CO-OPERATIVE SOCIETIES 50842 49829 75 27 AGRICULTURAL MARKETING DEPARTMENT 49048 48480 74 28 BANGALORE DEVELOPMENT AUTHORITY 9244 9098 63 29 ANIMAL HUSBANDRY AND FISHERIES DEPARTMENT 16562 16347 59 30 EMPLOYEES STATE INSURANCE MEDICAL SERVICES 8247 8006 46
31 BANGALORE WATER SUPPLY AND SEWERAGE BOARD 32085 32031 37
32 PUBLIC WORKS, PORTS AND INLAND WATER TRANSPORT
DEPARTMENT 2060 2028 27
33 DIRECTORATE OF PRINTING, STATIONARIES AND PUBLISHING 4480 4399 23 34 FOREST DEPARTMENT 12103 11991 12
35 FIRE SERVICES DEPARTMENT 17634 17629 12
36 NORTH-EAST KARNATAKA ROAD TRANSPORT CORPORATION 1365161 1364626 10
37 AYUSH DEPARTMENT 7926 7912 9
38 KARNATAKA HOUSING BOARD 10902 10871 7
39 DEPARTMENT OF FACTORIES,BOILERS,INDUSTRIAL SAFETY
AND HEALTH 58047 54655 5
40 HIGHER EDUCATION-COLLEGIATE EDUCATION 26731 26726 5
41 DEPARTMENT OF YOUTH EMPOWERMENT AND SPORTS 854 813 5
42 SERICULTURE DEPARTMENT 52407 52181 4 43 NORTH-WEST KARNATAKA ROAD TRANSPORT CORPORATION 1079651 1079433 4 44 KANNADA AND CULTURE 2208 2205 3 45 COMMERCE AND INDUSTRIES DEPARTMENT 166600 166550 3
46 INFORMATION TECHNOLOGY,BIO TECHNOLOGY AND SCIENCE
AND TECHNOLOGY DEPARTMENT 13 9 2
47 UNIVERSITY CONSTITUENT COLLEGES 8826 8825 1 48 TECHNICAL EDUCATION DEPARTMENT 11737 11364 1 49 DEPARTMENT OF PERSONNEL & ADMINISTRATIVE REFORMS 1152 1151 1
Total:
62414
Records shown above as on 31/12/2017 12:00:00

6
CHAPTER 2D: RECEIPTS AND DISPOSALS FOR DECEMBER 2017-
DISTRICT WISE
S No DISTRICT NO. OF SAKALA
RECIEPTS DURING THE MONTH
NO. OF SAKALA DISPOSALS DURING
THE MONTH
1 Bagalkot 58330 56944
2 Ballari 94108 90806
3 Belagavi 132658 136775
4 Bengaluru 334786 315115
5 Bengaluru Rural 47475 46687
6 Bidar 70931 62297
7 Chamarajanagar 34519 33512
8 Chikkaballapura 55645 53918
9 Chikkamagaluru 42573 42011
10 Chitradurga 56052 52894
11 Dakshina Kannada 53440 54060
12 Davanagere 70006 64395
13 Dharwad 72745 70386
14 Gadag 35418 33078
15 Hassan 73078 69583
16 Haveri 42302 41736
17 Kalaburagi 96227 88542
18 Kodagu 14625 15325
19 Kolar 68630 68514
20 Koppal 51899 47498
21 Mandya 92763 87675
22 Mysuru 114422 105339
23 Raichur 70899 66636
24 Ramanagara 41045 40507
25 Shivamogga 66914 67092
26 Tumakuru 114420 111040
27 Udupi 46305 44965
28 Uttara Kannada 42957 42067
29 Vijayapura 69367 58708
30 Yadgir 46480 37067
Total 2211019 2105172 Records shown above as on 31/12/2017 12:00:00

7
CHAPTER 2E: RECEIPTS AND DISPOSALS FOR DECEMBER 2017-
DEPARTMENT WISE
S No MAIN DEPARTMENT
NO. OF SAKALA RECIEPTS
DURING THE MONTH
NO. OF SAKALA DISPOSALS
DURING THE MONTH
1 ANIMAL HUSBANDRY AND FISHERIES
DEPARTMENT
94 244
2 BACKWARD CLASSES WELFARE
DEPARTMENT
0 0
3 COMMERCE AND INDUSTRIES
DEPARTMENT
205 180
4 CO-OPERATION DEPARTMENT 1846 1534
5 DEPARMENT OF PERSONNEL &
ADMINISTRATIVE REFORMS
0 0
6 DEPARTMENT OF YOUTH
EMPOWERMENT AND SPORTS
69 35
7 FINANCE DEPARTMENT 101033 100855
8 FOOD AND CIVIL SUPPLIES 181174 181747
9 FOREST, ECOLOGY AND
ENVIRONMENT DEPARTMENT
945 902
10 HEALTH AND FAMILY WELFARE 19340 18419 11 HIGHER EDUCATION 3346 3080
12 HOME DEPARTMENT 88367 90765
13 HORTICULTURE DEPARTMENT 1484 1312
14 HOUSING DEPARTMENT 72 52
15 INFORMATION TECHNOLOGY,BIO TECHNOLOGY AND SCIENCE AND
TECHNOLOGY DEPARTMENT
2 0
16 KANNADA, CULTURE AND
INFORMATION DEPARTMENT
3 2
17 LABOUR DEPARTMENT 6849 7494 18 MINES AND GEOLOGY DEPARTMENT 0 0
19 PRIMARY AND SECONDARY
EDUCATION
6235 6948
20 PUBLIC WORKS, PORTS AND INLAND WATER TRANSPORT DEPARTMENT
54 59
21 REVENUE DEPARTMENT 1243731 1112751
22 RURAL DEVELOPMENT AND
PANCHAYAT RAJ
77793 77540
23 TRANSPORT DEPARTMENT 412162 433086
24 URBAN DEVELOPMENT 42387 43677
25 WATER RESOURCES DEPARTMENT 0 0
26 WOMEN AND CHILD WELFARE 23828 24490
Total 2211019 2105172 Records shown above as on 31/12/2017 12:00:00
8
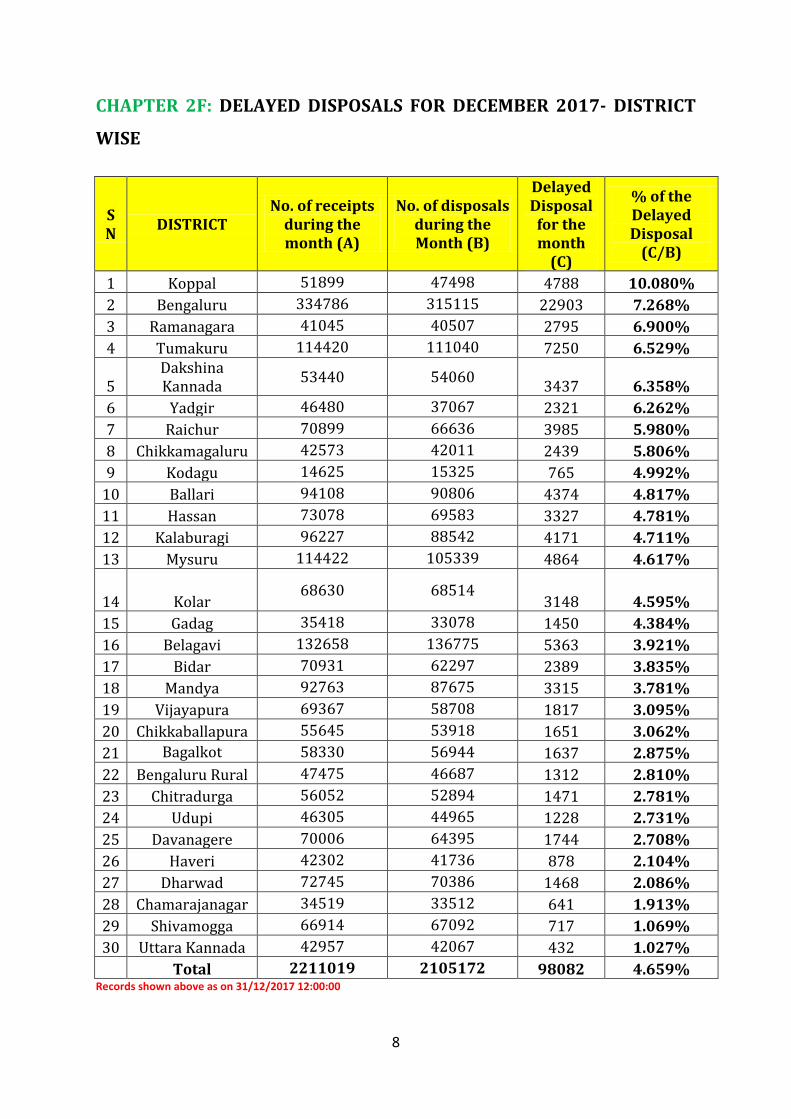
CHAPTER 2F: DELAYED DISPOSALS FOR DECEMBER 2017- DISTRICT
WISE
S N
DISTRICT No. of receipts
during the month (A)
No. of disposals during the Month (B)
Delayed Disposal
for the month
(C)
% of the Delayed Disposal
(C/B)
1 Koppal
51899 47498 4788 10.080%
2 Bengaluru
334786 315115 22903 7.268%
3 Ramanagara
41045 40507 2795 6.900%
4 Tumakuru
114420 111040 7250 6.529%
5 Dakshina Kannada
53440 54060 3437 6.358%
6 Yadgir
46480 37067 2321 6.262%
7 Raichur
70899 66636 3985 5.980%
8 Chikkamagaluru
42573 42011 2439 5.806%
9 Kodagu
14625 15325 765 4.992%
10 Ballari
94108 90806 4374 4.817%
11 Hassan
73078 69583 3327 4.781%
12 Kalaburagi
96227 88542 4171 4.711%
13 Mysuru
114422 105339 4864 4.617%
14 Kolar
68630 68514 3148 4.595%
15 Gadag
35418 33078 1450 4.384%
16 Belagavi
132658 136775 5363 3.921%
17 Bidar
70931 62297 2389 3.835%
18 Mandya
92763 87675 3315 3.781%
19 Vijayapura
69367 58708 1817 3.095%
20 Chikkaballapura
55645 53918 1651 3.062%
21 Bagalkot 58330 56944 1637 2.875%
22 Bengaluru Rural
47475 46687 1312 2.810%
23 Chitradurga
56052 52894 1471 2.781%
24 Udupi
46305 44965 1228 2.731%
25 Davanagere
70006 64395 1744 2.708%
26 Haveri
42302 41736 878 2.104%
27 Dharwad
72745 70386 1468 2.086%
28 Chamarajanagar
34519 33512 641 1.913%
29 Shivamogga
66914 67092 717 1.069%
30 Uttara Kannada
42957 42067 432 1.027%
Total 2211019 2105172 98082 4.659% Records shown above as on 31/12/2017 12:00:00

9
CHAPTER 2G: DELAYED DISPOSALS FOR DECEMBER 2017-
DEPARTMENT WISE
S
No Main Department
No. of
receipts
during
the
month
(A)
No. of
disposals
during
the Month
(B)
Delayed
Disposal
for the
month
(C)
% of the
Delayed
Disposal
(C/B)
1 ANIMAL HUSBANDRY AND
FISHERIES DEPARTMENT
94 244 116 47.541%
2 PRIMARY AND SECONDARY
EDUCATION
6235 6948 1632 23.489%
3 URBAN DEVELOPMENT 42387 43677 5511 12.618%
4
PUBLIC WORKS, PORTS AND
INLAND WATER TRANSPORT
DEPARTMENT
54 59 6 10.169%
5 HOME DEPARTMENT 88367 90765 8605 9.481%
6 FOREST, ECOLOGY AND
ENVIRONMENT DEPARTMENT
945 902 81 8.980%
7 CO-OPERATION DEPARTMENT 1846 1534 114 7.432%
8 LABOUR DEPARTMENT 6849 7494 507 6.765%
9 REVENUE DEPARTMENT 1243731 1112751 71165 6.395%
10 DEPARTMENT OF YOUTH
EMPOWERMENT AND SPORTS
69 35 2 5.714%
11 HEALTH AND FAMILY
WELFARE
19340 18419 720 3.909%
12 HIGHER EDUCATION 3346 3080 91 2.955%
13 RURAL DEVELOPMENT AND
PANCHAYAT RAJ
77793 77540 1607 2.072%
14 HOUSING DEPARTMENT 72 52 1 1.923%
15 TRANSPORT DEPARTMENT 412162 433086 5579 1.288%
16 FOOD AND CIVIL SUPPLIES 181174 181747 1924 1.059%
17 HORTICULTURE DEPARTMENT 1484 1312 9 0.686%
18 COMMERCE AND INDUSTRIES
DEPARTMENT
205 180 1 0.556%
19 WOMEN AND CHILD WELFARE 23828 24490 134 0.547%
20 FINANCE DEPARTMENT 101033 100855 277 0.275%
Total 2211019 2105172 98082 4.659% Records shown above as on 31/12/2017 12:00:00

10
CHAPTER 2H: REJECTION RATES FOR DECEMBER 2017- DISTRICT
WISE
S.N District Name
No. of receipts
during the month
No. of disposals
during the Month
Total Rejections
Rejection Rate(%age)
1 Bidar 70931 62297 7554 12.126%
2 Raichur 70899 66636 7323 10.990%
3 Davanagere 70006 64395 6154 9.557%
4 Koppal 51899 47498 4207 8.857%
5 Ballari 94108 90806 7408 8.158%
6 Kalaburagi 96227 88542 7048 7.960%
7 Vijayapura 69367 58708 4335 7.384%
8 Chikkaballapura 55645 53918 3887 7.209%
9 Gadag 35418 33078 2357 7.126%
10 Haveri 42302 41736 2849 6.826%
11 Chitradurga 56052 52894 3556 6.723%
12 Mandya 92763 87675 5864 6.688%
13 Tumakuru 114420 111040 7326 6.598%
14 Bengaluru 334786 315115 20605 6.539%
15 Yadgir 46480 37067 2300 6.205%
16 Chikkamagaluru 42573 42011 2489 5.925%
17 Mysuru 114422 105339 6170 5.857%
18 Bengaluru Rural 47475 46687 2695 5.772%
19 Kodagu 14625 15325 883 5.762%
20 Hassan 73078 69583 3920 5.634%
21 Chamarajanagar 34519 33512 1874 5.592%
22 Shivamogga 66914 67092 3607 5.376%
23 Kolar 68630 68514 3528 5.149%
24 Ramanagara 41045 40507 1445 3.567%
25 Bagalkot 58330 56944 2001 3.514%
26 Dharwad 72745 70386 2316 3.290%
27 Belagavi 132658 136775 4365 3.191%
28 Dakshina Kannada 53440 54060 1662 3.074%
29 Udupi 46305 44965 1158 2.575%
30 Uttara Kannada 42957 42067 1022 2.429%
Total 2211019 2105172 131908 6.266%
Records shown above as on 31/12/2017 12:00:00

11
CHAPTER 2I: OFFICES WITH 7 OR MORE DEFAULTS FOR DECEMBER
2017- DISTRICT WISE
S.N District Name No. of Offices with 7 or more than 7 defaults
1 Bengaluru 169
2 Tumakuru 79
3 Mysuru 70
4 Mandya 55
5 Ballari 50
6 Hassan 48
7 Raichur 46
8 Chikkamagaluru 40
9 Kalaburagi 40
10 Bidar 38
11 Koppal 37
12 Kolar 37
13 Vijayapura 36
14 Belagavi 36
15 Davanagere 35
16 Chitradurga 35
17 Dakshina Kannada 33
18 Dharwad 30
19 Bagalkot 28
20 Chikkaballapura 28
21 Yadgir 28
22 Ramanagara 26
23 Bengaluru Rural 26
24 Gadag 26
25 Haveri 24
26 Shivamogga 19
27 Chamarajanagar 17
28 Uttara Kannada 16
29 Kodagu 13
30 Udupi 13
Total 1178 Records shown above as on 31/12/2017 12:00:00

12
CHAPTER 2J: OFFICES WITH 7 OR MORE DEFAULTS FOR DECEMBER
2017- DEPARTMENT WISE
S.No Department Name No. of Offices with 7
or more than 7 defaults
1 REVENUE DEPARTMENT 574
2 HOME DEPARTMENT 81
3 INSPECTOR GENERAL OF REGISTRATION AND STAMPS 76
4 DEPARTMENT OF PUBLIC INSTRUCTION 65
5 SURVEY AND SETTELMENT COMMISSIONER 61
6 RURAL DEVELOPMENT AND PANCHAYAT RAJ DEPARTMENT 54
7 TOWN MUNICIPAL COUNCIL 45
8 TRANSPORT DEPARTMENT 45
9 CITY MUNICIPAL COUNCIL 28
10 COMMERCIAL TAXES DEPARTMENT 24
11 BRUHAT BANGALORE MAHANAGARA PALIKE 20
12 FOOD AND CIVIL SUPPLIES DEPARTMENT 20
13 HEALTH AND FAMILY WELFARE DEPARTMENT 14
14 CITY CORPORATION (Other than BBMP) 11
15 ANIMAL HUSBANDRY AND FISHERIES DEPARTMENT 7
16 TOWN PANCHAYAT 7
17 TRANSPORT CORPORATIONS(KSRTC) 7
18 LABOUR DEPARTMENT 6
19 PUBLIC LIBRARIES DEPARTMENT 4
20 WOMEN AND CHILD WELFARE DEPARTMENT 4
21 BANGALORE DEVELOPMENT AUTHORITY 3
22 DEPARTMENT FOR EMPOWERMENT OF DIFFERENTLY ABLED AND
SENIOR CITIZEN
3
23 DEPARTMENT OF FACTORIES,BOILERS,INDUSTRIAL SAFETY AND
HEALTH
3
24 REGISTRAR OF CO-OPERATIVE SOCIETIES 3
25 DRUGS CONTROL DEPARTMENT 2
26 EMPLOYEES STATE INSURANCE MEDICAL SERVICES 2
27 AYUSH DEPARTMENT 1
28 AGRICULTURAL MARKETING DEPARTMENT 1
29 COMMISSIONERATE OF BANGALORE AND MYSORE, CPI 1
30 FIRE SERVICES DEPARTMENT 1
31 DIRECTORATE OF PRINTING, STATIONARIES AND PUBLISHING 1
32 KARNATAKA HOUSING BOARD 1
33 NORTH-EAST KARNATAKA ROAD TRANSPORT CORPORATION 1
34 KARNATAKA STATE POLLUTION CONTROL BOARD 1
35 UNIVERSITY EXAMINATION SECTION 1
Total 1178 Records shown above as on 31/12/2017 12:00:00
Disclaimer: Data may vary due to Technical updates between portals of various
Departments and differential time these reports are drawn from the portal

13
CHAPTER 3: EVENTS AND NEWS CLIPS
1. 27.12.2017 and 28.12.2017 Bengaluru: ACS along with ACS, DPAR (e-Gov) conducted
inspections of various offices in Bengaluru North Taluka to ensure the implementation of
Sakala Act.

14
2. 4.12.2017 Bengaluru: Team of officers from Assam visited Sakala Mission to study the
implementation of Sakala Act. Administrative officer explained the journey Sakala Mission has
taken over the years.

15
NEWS CLIPS
Middlemen rule the roost in delivering govt.
services despite Sakala: Study
Nagesh Prabhu
BENGALURU, DECEMBER 10, 2017 22:31 IST
The NLSIU research says that corruption prevalent in the form of
dalal in departments such as Transport and Revenue
The Karnataka Sakala Services launched in 2011 — to ensure timely delivery of
government services — is not meeting its end if a recent study by the National Law
School of India University (NLSIU), Bengaluru, is an indication.
Corruption still dogs the delivery of services in government departments, according
to the study by Yashomati Ghosh, Associate Professor, NLSIU, who conducted the
study (2017) for the Union Ministry of Law and Justice. It found that corruption was
prevalent in the form of “dalal” in departments such Transport and Revenue.
The study said: “The dalal works as a mediator and facilitates applicant for getting
services with the help of government officials.”
In most cases, higher officials either do not listen to applicants or do not take action
against the defaulting officers.

16
Absence of a full time-director, delivery of services by hiring of over 1,000
outsourced employees as computer operators, and delay in the release of salary for
employees, poor infrastructure in the form of computer, internet connectivity,
printer, and generators contributed to poor delivery of services under Sakala, the
research said.
‘Supervisory position’
The Sakala Mission has no powers to take action against officers defaulting in
delivery of services. The mission has been given only supervisory position without
power.
More than 725 services are being provided under the Sakala Act. It said the mission
has become only a monitoring body with the primary function of data collection.
“The Sakala Mission does not have any statutory power of implementing the
provisions of the statute. It merely monitors the electronic database relating to case
status, number of applications filed, number of applications rejected, reasons for
rejections, how many cases went for first appeal and second appeal, and how many
cases are pending with departments,” the study noted.
Compensation
It said many applicants seeking services do not claim compensation for the delay in
services owing to the meagre compensation amount.
The corpus fund of ₹5 crore has been set aside for providing compensation. But only
₹84,180 was disbursed as compensation as on September 2016.
Display boards not updated
The NLSIU study noted that there is discrepancy between the number of services
listed under Sakala and actual services provided in offices. The Sakala services
display board has not been maintained in taluk offices, Nadakacheri, and police
stations.
For example, the Sakala information board was not updated at the RTO office in
Rajajinagar, Bengaluru. Further, the Department of Stamps and Registration neither
display information on Sakala nor provide any services.
The office of the Senior Sub-Registrar and Marriage, Yelahanka in Bengaluru, and
the Drug Control Department have failed to comply with the Sakala rules, the study
said.
Most offices do not have help desks to tell applicants about process, officer,
departments, and documents. Often, designated officers accept application without
issuing acknowledgement slips. There were irregularities in publication of monthly
and annual reports, the study said.

17

18
Sakala scheme to get more robust
SPECIAL CORRESPONDENT BENGALURU, DECEMBER 20, 2017 00:00 IST
It will now have stronger penal clauses
The Sakala scheme, unveiled in 2011 to cut red tape and ensure timely delivery of
government services, is riddled with problems.
The Siddaramaiah government is now set to re-launch the scheme with stronger
penal clauses for erring officials and a commission for its implementation. A new
Bill is to be tabled in the January/February session of the State legislature to make
way for the changes.
Among its key features will be a steep hike in penalty for delay in delivery of
service from the present Rs. 20 to Rs. 250 per day, with the total sum going up to
Rs. 50,000. The existing Sakala Mission has been given only supervisory position,
without powers to collect penalty. More than 725 services are covered under the
Sakala Act.

19
Paltry sum claimed as compensation so
far
Sharath S. Srivatsa
BENGALURU, DECEMBER 20, 2017 00:00 IST
Just about Rs. 95,000 has been claimed as compensation by those whose
applications under Sakala scheme were disposed of after the stipulated period in
the last six years. This is despite more than 50 lakh applications being cleared by
various departments beyond the stipulated days over the years, officials say.
According to statistics available on the Sakala website, since its inception till
November this year, 775 applications seeking compensation of Rs. 94,780 had
come. The Revenue Department alone has seen a compensation claim of Rs.
75,560 with 602 applications filed.
In April this year, the number of applications stood at 732 and compensation of Rs.
88,880 had been disbursed, which means only 43 more applications seeking
compensation came in the seven preceding months despite several thousand
applications being processed beyond the due date, officials pointed out. A rough
estimate based on the applications processed after the due date, according to an
official in Sakala Mission, shows that at least Rs. 50 crore should have been paid
out as compensation to citizens for overdue delays varying between a few days and
several months. Under the rules, the compensation for delayed services at the rate

20
of Rs. 20 per day after the stipulated time is to be paid by the government and later
recover from the salary of the official who is responsible for the delay.
Currently, 852 services in 73 departments are covered under Sakala for quick
disposal of applications.
“Most citizens, whose application for services were delayed, have not claimed
compensation for the delay. At Rs. 20 per day in the current setup, we feel
compensation is very low. One may end up spending more than what he/she gets as
compensation, on transport and the amount of man-hours the applicant has to
spend for running from pillar to post,” said an official in E-governance
Department.”
The official said: “If an application is not processed on time in a rural area, the first
appeal has to be made to the Assistant Commissioner and the second appeal with
the Deputy Commissioner. Considering the distance between offices, an applicant
may not be inclined to seek a compensation of Rs. 20 per day.”
Also, though many distraught applicants have approached Sakala Mission’s office
after exhausting the appeals, nothing could be done since rules do not give any
power to the mission to direct the departments to provide compensation, the
official added.
At Rs. 20 per day in the current setup, we feel compensation is very low. One may
spend more than what he/she gets as compensation, on transport and for running
from pillar to post Official in E-governance Department