monthly report on short-term … · monthly report on ... introduction 1 ... chuzachen hep...
TRANSCRIPT
Monthly Report on
Short-term Transactions of Electricity in India
February, 2018
Economics Division
Central Electricity Regulatory Commission 36, Janpath, Chanderlok Building 36, Janpath, New Delhi -110001
i
Contents
S.No. Contents Page
No
Contents i
List of Tables and Figures ii
Abbreviations iii
Introduction 1
I Volume of Short-term Transactions of Electricity 1
II Price of Short-term Transactions of Electricity 2
(i) Price of electricity transacted through Traders 2
(ii) Price of electricity transacted through Power Exchanges 3
(iii) Price of electricity transacted through DSM 3
III Volume of Short-term Transactions of Electricity (Regional Entity-wise) 3
IV Congestion on Inter-State Transmission Corridor for Day-Ahead Market on
Power Exchanges
4
V Bilateral Contracts executed by Traders 5
(i) Duration of bilateral contracts 5
(ii) Forward Curve based on Price of bilateral contracts 5
VI Volume and Price of Renewable Energy Certificates (RECs) 6
VII Inferences 7
ii
List of Tables and Figures
S.No. List of Tables and Figures Page No.
I List of Tables
Table-1 Volume of Short-term Transactions of Electricity in India 9
Table-2 Percentage Share of Electricity Transacted by Trading Licensees 11
Table-3 Price of Electricity Transacted through Traders 12
Table-4 Price of Electricity Transacted through Traders (Time-wise) 12
Table-5 Price of Electricity Transacted through Power Exchanges 12
Table-6 Volume and Price of Electricity in Term Ahead Market of IEX 12
Table-7 Volume and Price of Electricity in Term Ahead Market of PXIL 12
Table-8 Price of Electricity Transacted through DSM 12
Table-9 Volume of Electricity Sold through Bilateral 14
Table-10 Volume of Electricity Purchased through Bilateral 15
Table-11 Volume of Electricity Sold through Power Exchanges 16
Table-12 Volume of Electricity Purchased through Power Exchanges 18
Table-13 Volume of Electricity Underdrawal through DSM 19
Table-14 Volume of Electricity Over drawal through DSM 21
Table-15 Total Volume of Net Short-term Transactions of Electricity
(Regional Entity-wise)
23
Table-16 Details of Congestion in Power Exchanges 25
Table-17 Volume of Short-term Transactions of Electricity in India (Day-
wise)
26
Table-18 Price of Electricity in Short-term Transactions (Day-wise) 27
Table-19 Volume of Short-term Transactions of Electricity (Regional
Entity-wise)
28
Table-20 Volume and Price of Renewable Energy Certificates (RECs)
Transacted through Power Exchanges
31
II List of Figures
Figure-1 Volume of Short-term Transactions of Electricity 9
Figure-2 Volume of Various Kinds of Electricity Transactions in Total
Electricity Generation 9
Figure-3 Volume of Short-term Transactions of Electricity (Day-wise) 10
Figure-4 Percentage Share of Electricity Transacted by Trading Licensees 11
Figure-5 Price of Electricity in Short-term Transactions 13
Figure-6 Price of Electricity in Short-term Transactions (Day-wise) 13
Figure-7 Bilateral Contracts Executed by Traders in March, 2018 30
Figure-8 Forward Curve based on Prices of Bilateral Contracts 30
iii
Abbreviations
Abbreviation Expanded Version
ACBIL ACB ( India) Limited
ACP Area Clearing Price
ACV Area Clearing Volume
Adani HVDC
AD HYDRO
Adani Power Limited (High Voltage Direct Line Current Line)
AD Hydro Power Limited
BALCO Bharat Aluminum Company Limited
CEA Central Electricity Authority
CERC Central Electricity Regulatory Commission
CGPL Coastal Gujarat Power Limited
CHUZACHEN HEP Chuzachen Hydro Electric Power Project
COASTGEN Coastal Energen Private Limited
DAGACHU Dagachhu Hydro Power Corporation
DB POWER Diligent Power Pvt. Ltd.
DCPP Donga Mahua Captive Power Plant
DGEN MEGA POWER DGEN Mega Power Project
DHARIWAL POWER Dhariwal Power Station
DOYANG HEP Doyang Hydro Electric Project
DSM Deviation Settlement Mechanism
DVC Damodar Valley Corporation
EMCO EMCO Energy Limited
ESSAR POWER Essar Power Limited
ESSAR STEEL Essar Steel Ltd
GMR CHHATTISGARH GMR Chhattisgarh Energy Limited
GMR KAMALANGA GMR Kamalanga Energy Ltd.
IEX Indian Energy Exchange Limited
ILF&S Infrastructure Leasing & Financial Services Limited
J&K Jammu & Kashmir
JAYPEE NIGRIE Jaypee Nigrie Super Thermal Power Project
JINDAL POWER Jindal Power Limited
JINDAL STAGE-II Jindal Power Ltd Stage II
JITPL Jindal India Thermal Power Ltd.
JORETHANG
KARCHAM WANGTOO
Jorethang Loop Hydroelectric Power Project
Jaypee Karcham Hydro Corporation Limited
KORBA WEST POWER Korba West Power Company Limited
KSK MAHANADI KSK Mahanadi Power Ltd
LANKO BUDHIL LancoBudhil Hydro Power Private Limited
LANKOAMK LancoAmarkantak Power Private Limited
LANKOKONDAPALLY LancoKondapally Power Private Limited
LOKTAK Loktak Power Project
MALANA Malana Hydroelectric Plant
Maruti Coal Maruti Clean Coal and Power Limited
MB POWER MB Power Ltd
MEENAKSHI Meenakshi Energy Private Limited
MP Madhya Pradesh
MUs Million Units
iv
NEEPCO
NHPC STATIONS
North Eastern Electric Power Corporation Limited
National Hydro Electric Power Corporation Ltd. Stations
NLC Neyveli Lignite Corporation Limited
NTPC STATIONS National Thermal Power Corporation Ltd. Stations
NJPC Nathpa Jhakri Hydroelectric Power Station
NLDC National Load Despatch Centre
NSPCL NTPC - SAIL Power Company Private Limited
NVVN
NTECL Vallur
NTPC Vidyut Vyapar Nigam Limited
NTPC Tamilnadu Energy Company Limited Vallur
ONGC Platana ONGC Tripura Power Company
OTC Over The Counter
PX Power Exchange
PXIL Power Exchange India Limited
RANGIT HEP Rangit Hydro electric power project
REC Renewable Energy Certificate
RGPPL Ratnagiri Gas and Power Private Limited
RLDC Regional Load Despatch Centre
RTC Round The Clock
Sasan UMPP Sasan Ultra Mega Power Project
SEMBCORP Sembcorp Gayatri Power Ltd
SHREE CEMENT Shree Cement Limited
SIMHAPURI
SKS Power
Simhapuri Energy Private Limited
SKS Power Generation Chhatisgarh Limited
SPECTRUM Spectrum Power Generation Ltd
TEESTA STG3
Teesta Stage 3 Hydro Power Project
1
Introduction
A well-functioning electricity market requires an effective market monitoring process.
As part of the market monitoring process, the monthly report on short-term transactions of
electricity, is being prepared and posted on the website of CERC since August 2008. Here,
“short-term transactions of electricity” refers to the contracts of less than one year period, for
electricity transacted (inter-State & intra-State) through inter-State Trading Licensees and
directly by the Distribution Licensees, Power Exchanges (Indian Energy Exchange Ltd (IEX)
and Power Exchange India Ltd (PXIL), and Deviation Settlement Mechanism (DSM)). The
objectives of the report are: (i) to observe the trends in volume and price of the short-term
transactions of electricity; (ii) to analyse competition among the market players; (iii) to
analyse effect of congestion on volume of electricity transacted through power exchanges;
(iv) to analyse bilateral contracts executed by traders; (v) to provide information on volume
and price of Renewable Energy Certificates (RECs) transacted through power exchanges; and
(vi) to disclose/disseminate all relevant market information. The details of the report for the
month of February, 2018 are as under:
I: Volume of Short-term Transactions of Electricity
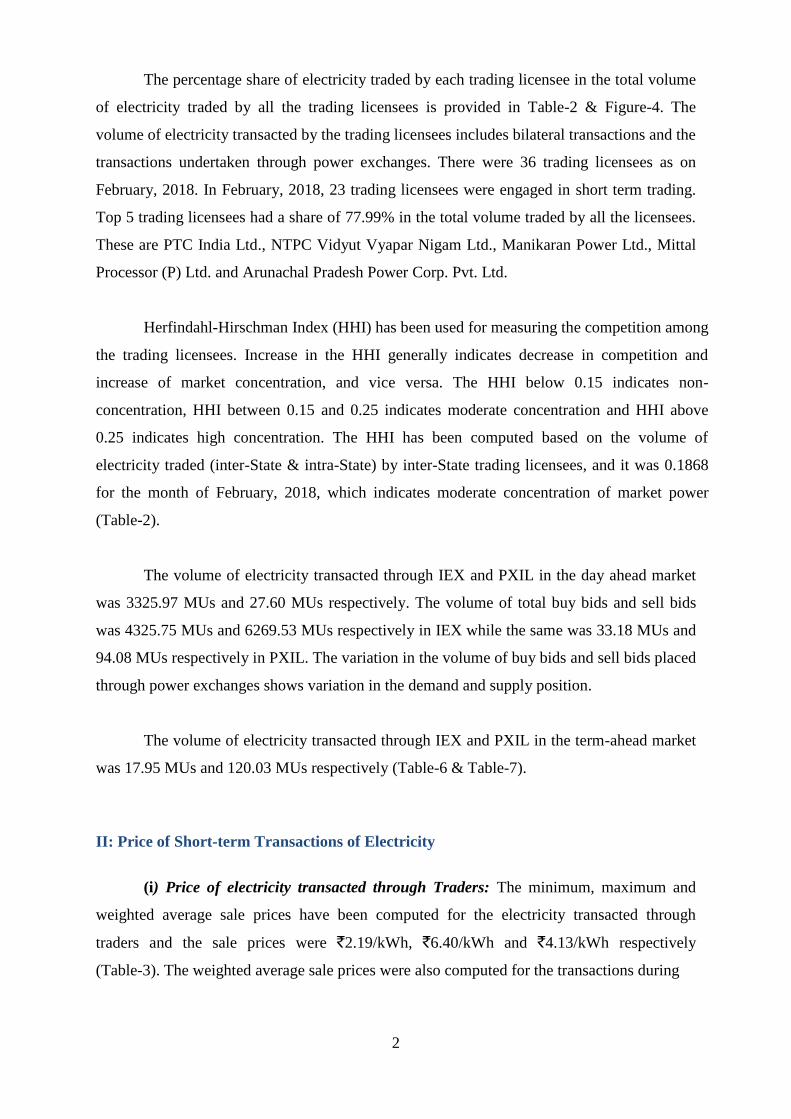
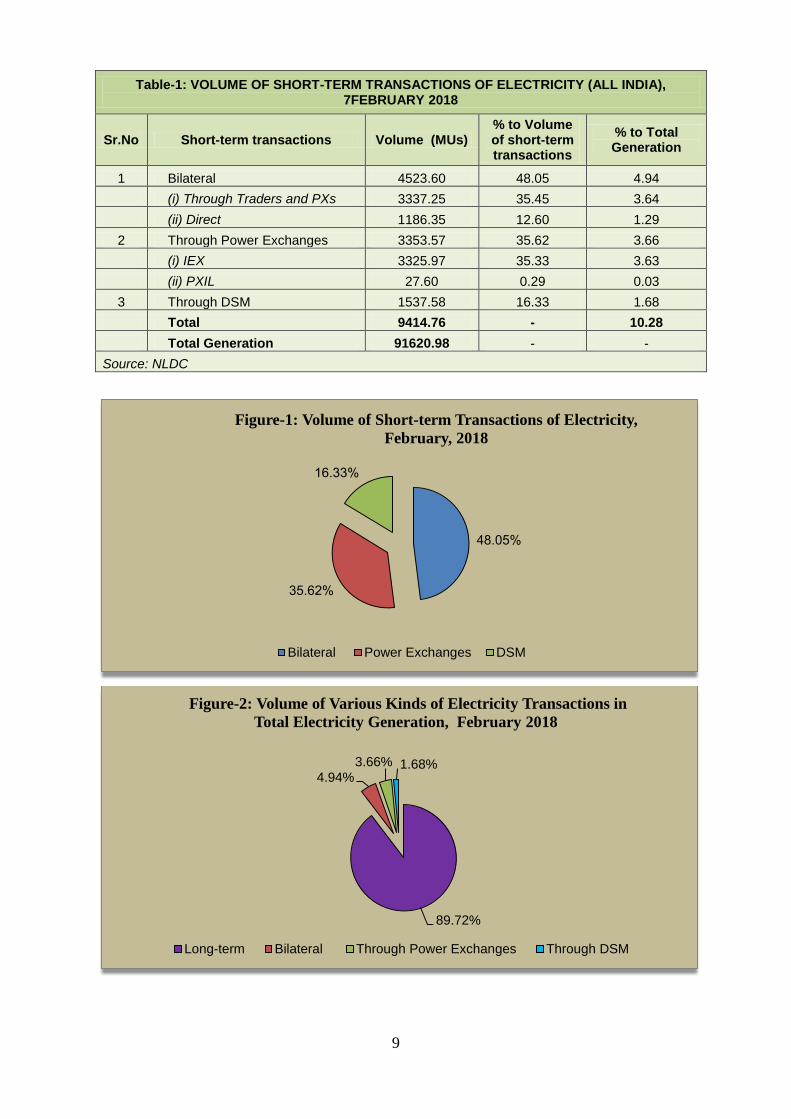
During February 2018, total electricity generation excluding generation from
renewable and captive power plants in India was 91620.98 MUs (Table-1).
Of the total electricity generation, 9414.76 MUs (10.28%) was transacted through
short-term, comprising of 4523.60 MUs (4.94%) through bilateral (through traders and term-
ahead contracts on power exchanges and directly between distribution companies), followed
by 3353.57 MUs (3.66%) through day ahead collective transactions on power exchanges
(IEX and PXIL) and 1537.58 MUs (1.68%) through DSM (Table-1 & Figure-2).
Of the total short-term transactions, bilateral constitutes 48.05% (35.45% through
traders and term-ahead contracts on power exchanges and 12.60% directly between
distribution companies) followed by 35.62% through day ahead collective transactions on
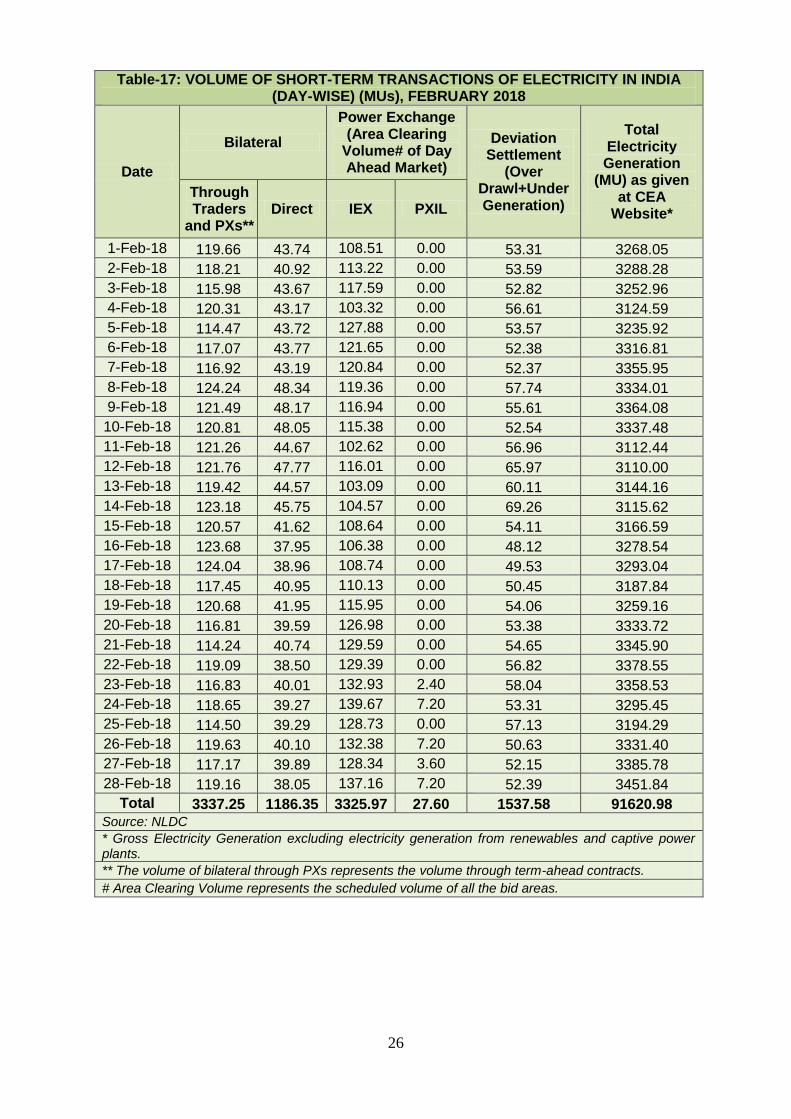
power exchanges and 16.33% through DSM (Table-1 & Figure-1). Daily volume of short-
term transactions is shown in Table-17 & Figure-3.
2
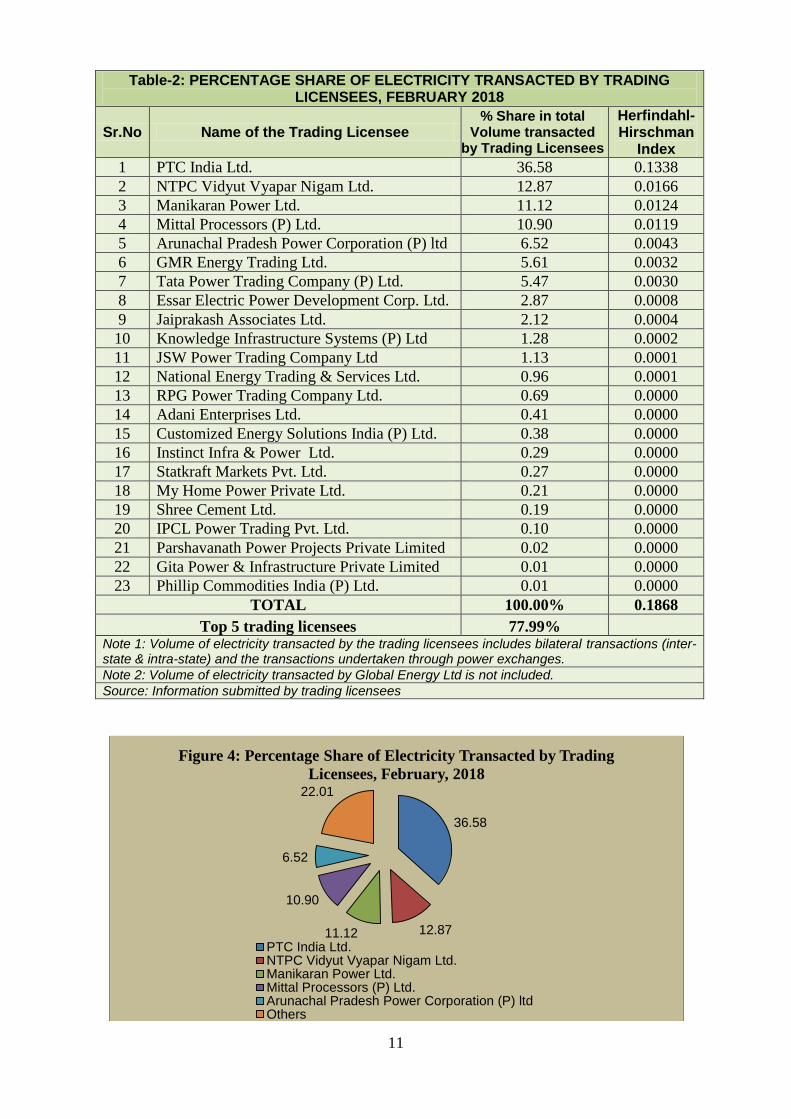
The percentage share of electricity traded by each trading licensee in the total volume
of electricity traded by all the trading licensees is provided in Table-2 & Figure-4. The
volume of electricity transacted by the trading licensees includes bilateral transactions and the
transactions undertaken through power exchanges. There were 36 trading licensees as on
February, 2018. In February, 2018, 23 trading licensees were engaged in short term trading.
Top 5 trading licensees had a share of 77.99% in the total volume traded by all the licensees.
These are PTC India Ltd., NTPC Vidyut Vyapar Nigam Ltd., Manikaran Power Ltd., Mittal
Processor (P) Ltd. and Arunachal Pradesh Power Corp. Pvt. Ltd.
Herfindahl-Hirschman Index (HHI) has been used for measuring the competition among
the trading licensees. Increase in the HHI generally indicates decrease in competition and
increase of market concentration, and vice versa. The HHI below 0.15 indicates non-
concentration, HHI between 0.15 and 0.25 indicates moderate concentration and HHI above
0.25 indicates high concentration. The HHI has been computed based on the volume of
electricity traded (inter-State & intra-State) by inter-State trading licensees, and it was 0.1868
for the month of February, 2018, which indicates moderate concentration of market power
(Table-2).
The volume of electricity transacted through IEX and PXIL in the day ahead market
was 3325.97 MUs and 27.60 MUs respectively. The volume of total buy bids and sell bids
was 4325.75 MUs and 6269.53 MUs respectively in IEX while the same was 33.18 MUs and
94.08 MUs respectively in PXIL. The variation in the volume of buy bids and sell bids placed
through power exchanges shows variation in the demand and supply position.
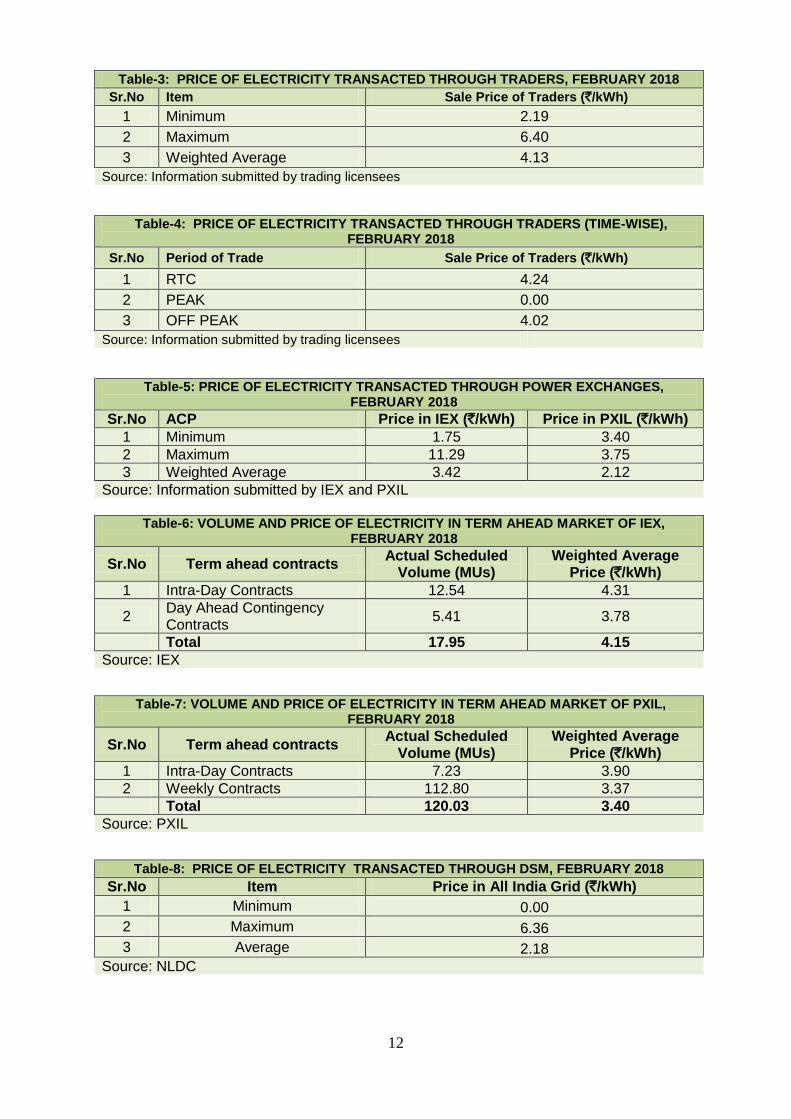
The volume of electricity transacted through IEX and PXIL in the term-ahead market
was 17.95 MUs and 120.03 MUs respectively (Table-6 & Table-7).
II: Price of Short-term Transactions of Electricity
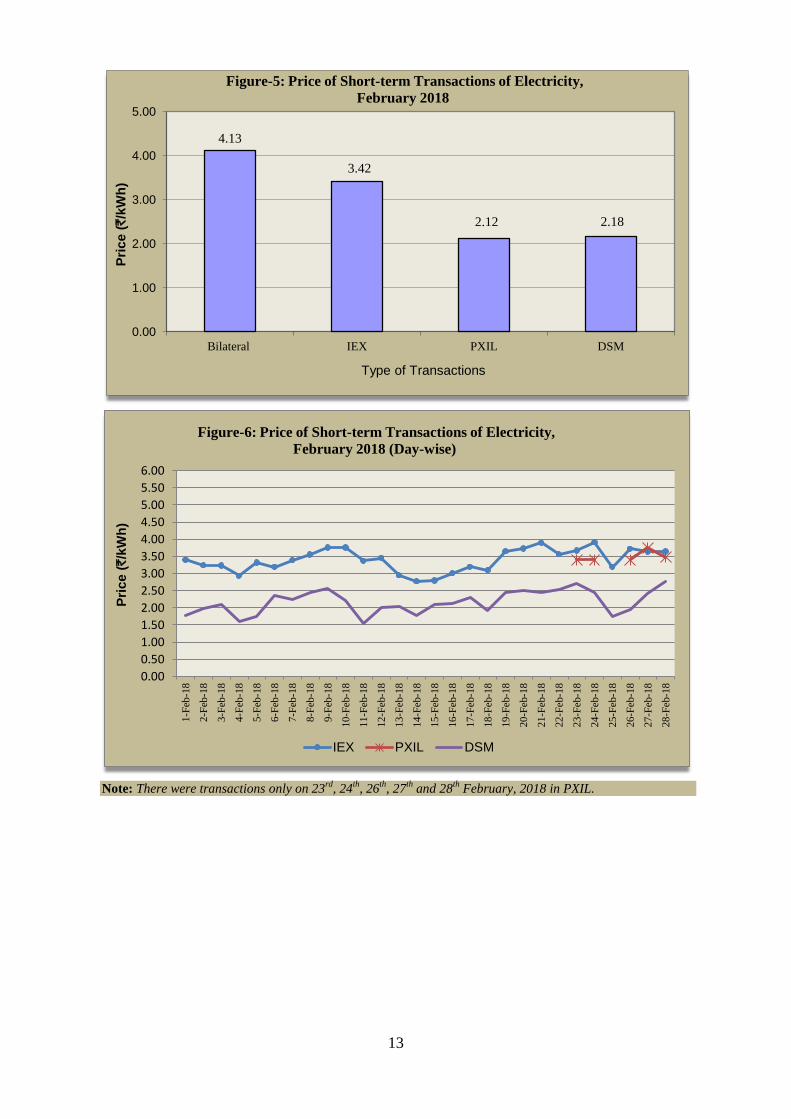
(i) Price of electricity transacted through Traders: The minimum, maximum and
weighted average sale prices have been computed for the electricity transacted through
traders and the sale prices were `2.19/kWh, `6.40/kWh and `4.13/kWh respectively
(Table-3). The weighted average sale prices were also computed for the transactions during
3
Round the Clock (RTC), Peak and Off-peak periods separately, and the sale prices were
`4.24/kWh, `0.00/kWh, and `4.02/kWh respectively (Table-4).
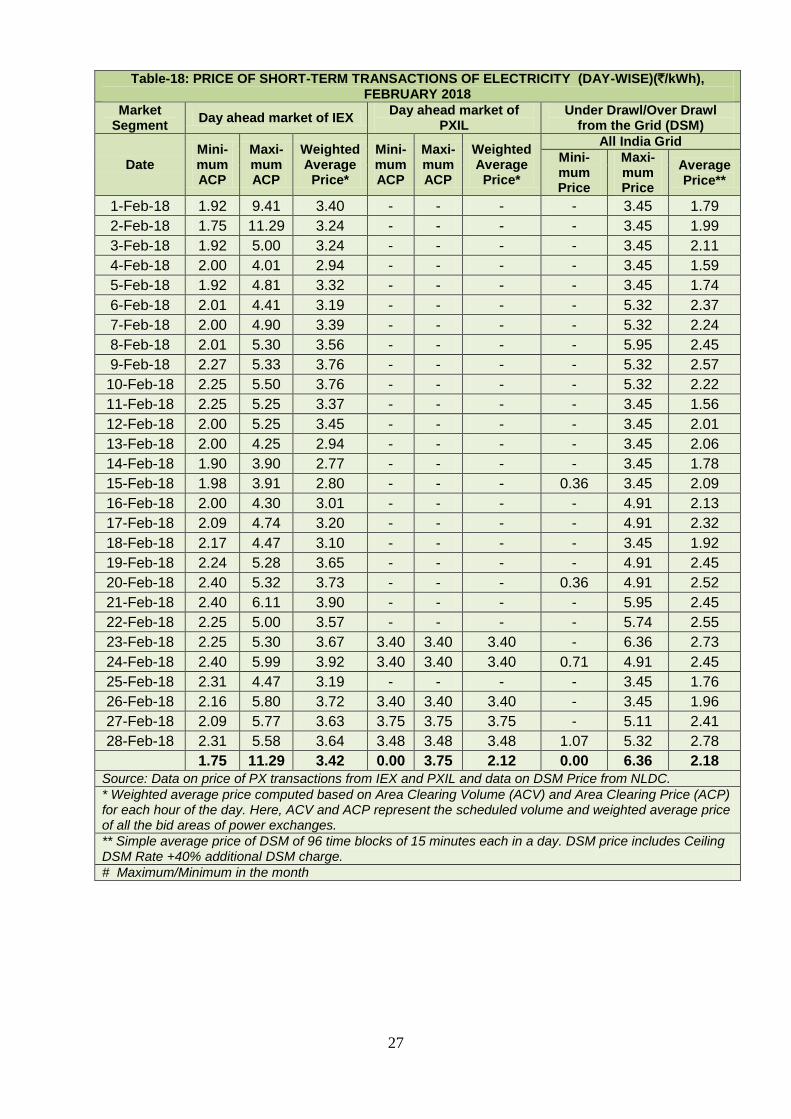
(ii) Price of electricity transacted through Power Exchanges: The minimum,
maximum and weighted average prices have been computed for the electricity transacted
through IEX and PXIL separately. The minimum, maximum and weighted average prices
were `1.75/kWh, `11.29/kWh and `3.42/kWh respectively in IEX and `3.40/kWh,
`3.75/kWh and `2.12/kWh respectively in PXIL. (Table-5).
The price of electricity transacted through IEX and PXIL in the term-ahead market
was `4.15/kWh and `3.40/kWh respectively (Table-6 and Table-7).
(iii) Price of electricity transacted through DSM: The average deviation settlement
price was `2.18/kWh. The minimum and maximum deviation settlement prices were
`0.00/kWh and `6.36/kWh respectively (Table-8).
The prices of electricity transacted through trading licensees, power exchanges and
DSM and their comparison is shown in Table-18, Figure-5 & 6.
III: Volume of Short-term Transactions of Electricity (Regional Entity1-Wise)
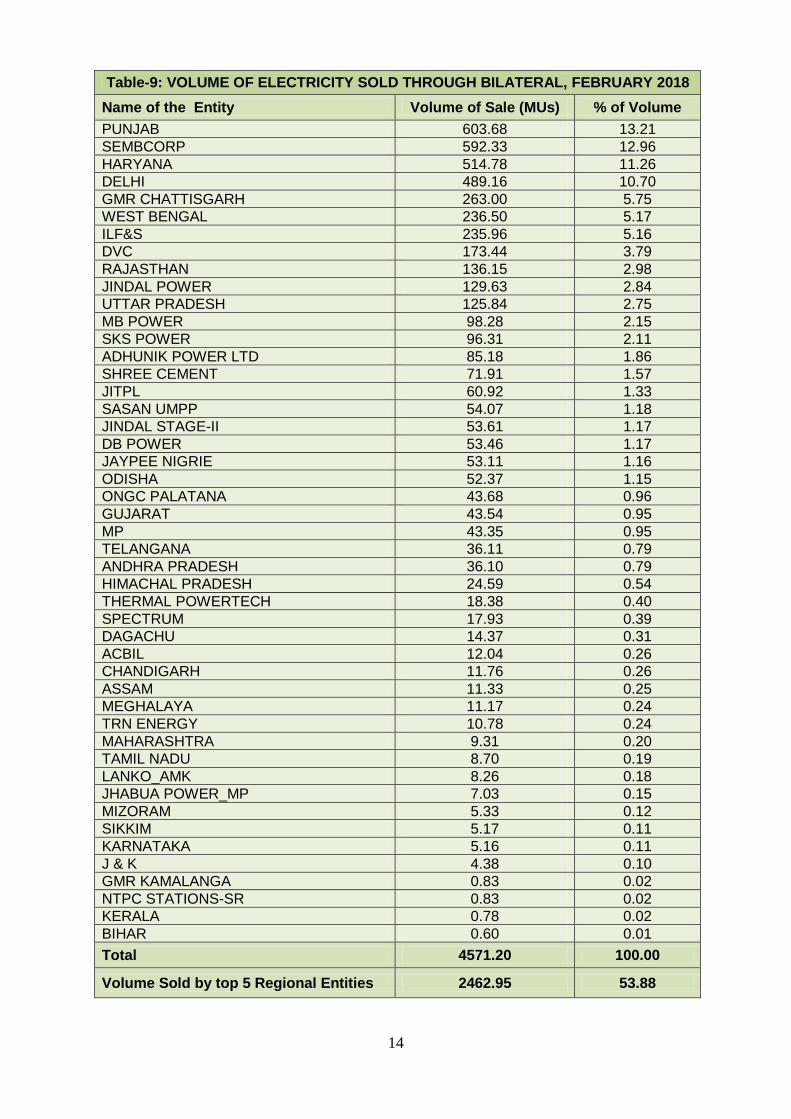
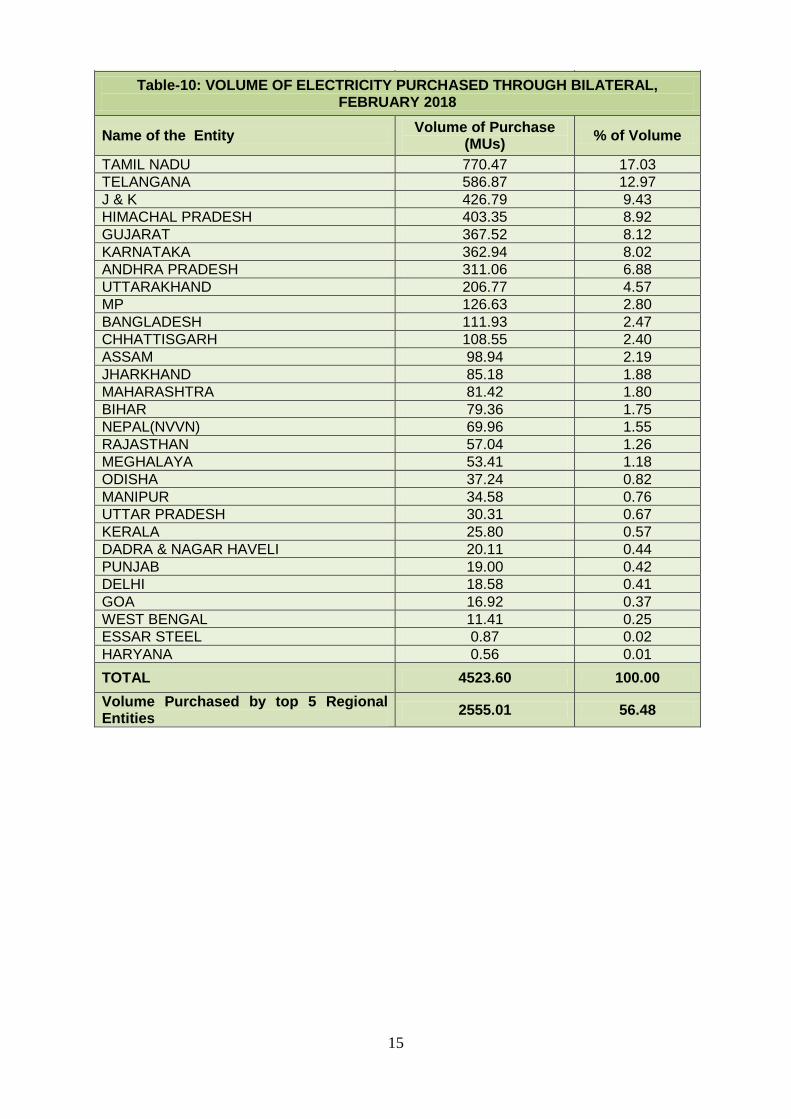
Of the total bilateral transactions, top 5 regional entities sold 53.88% of the volume,
and these were Punjab, Sembcorp Gayatri Power Ltd., Haryana, Delhi and GMR
Chhattisgarh Energy Limited. Top 5 regional entities purchased 56.48% of the volume, and
these were Tamil Nadu, Telangana, Jammu & Kashmir, Himachal Pradesh and Gujarat
(Table-9 & 10).
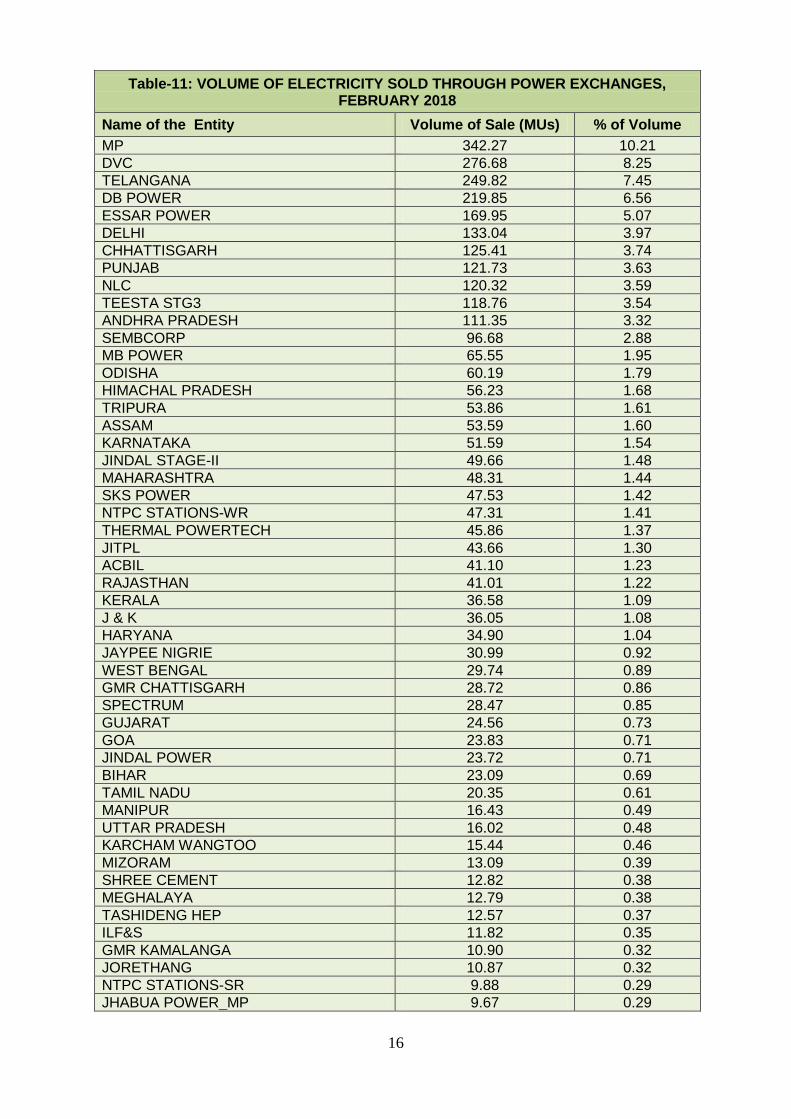
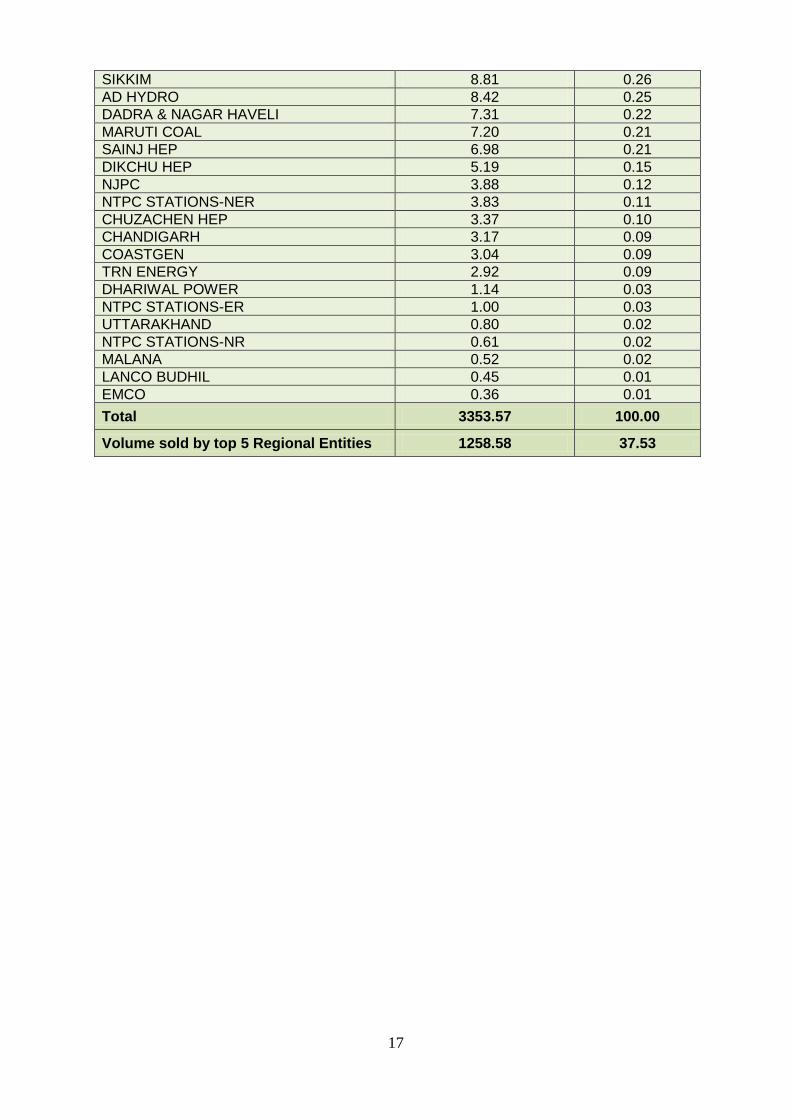
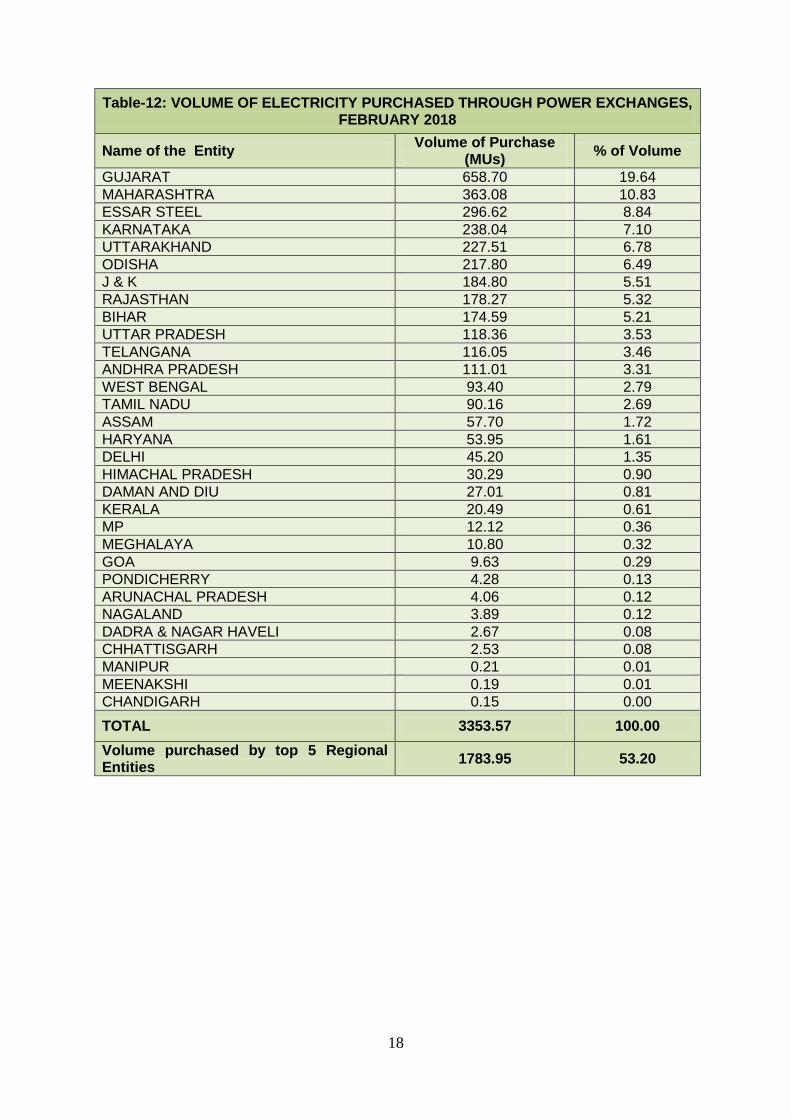
Of the total power exchange transactions, top 5 regional entities sold 37.53% of the
volume, and these were Madhya Pradesh, Damodar Valley Corporation, Telangana, Diligent
Power Pvt. Ltd. and Essar Power Limited. Top 5 regional entities purchased 53.20% of the
volume, and these were Gujarat, Maharashtra, Essar Steel Limited, Karnataka and
Uttarakhand (Table-11 & 12).
1 In case of a state, the entities which are “selling” also include generators connected to state grid
and the entities which are “buying” also include open access consumers.
4
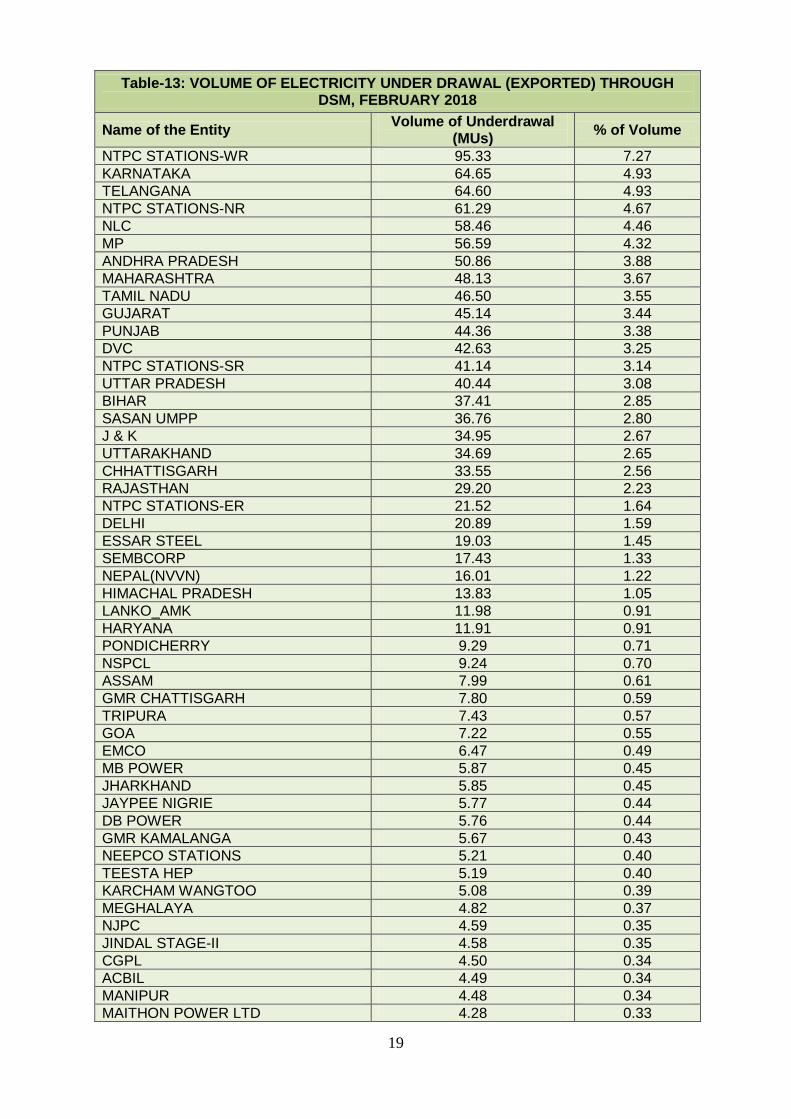
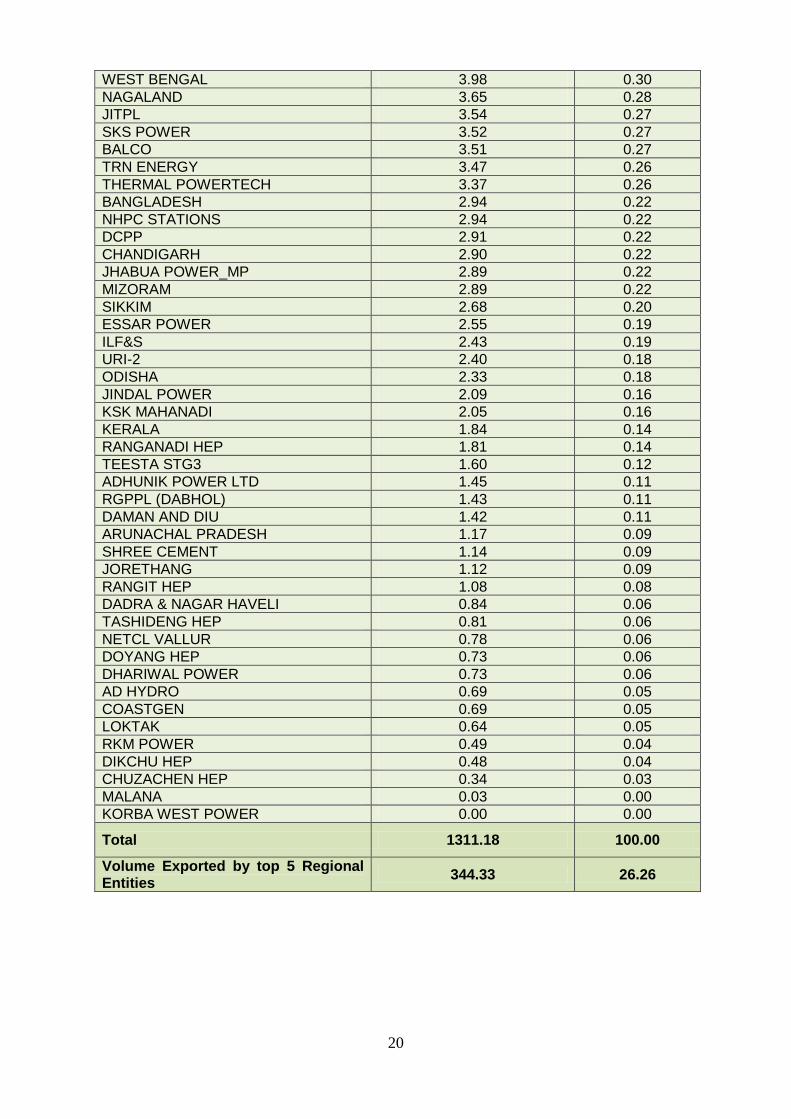
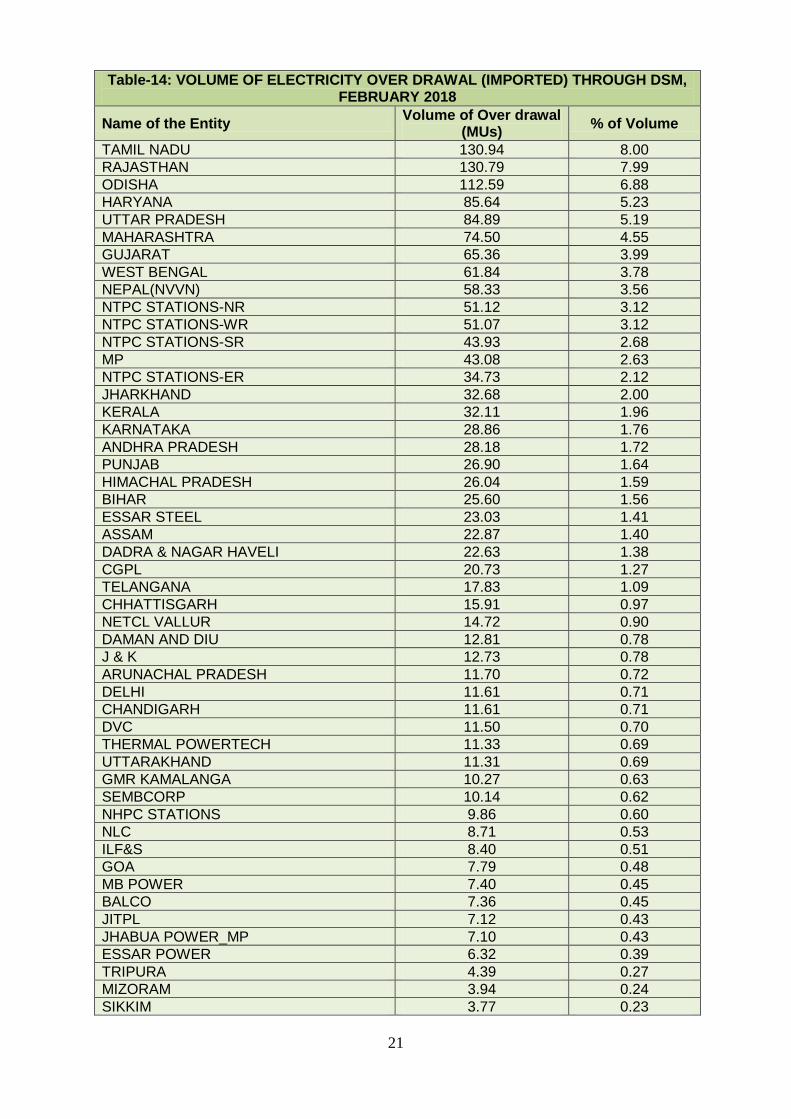
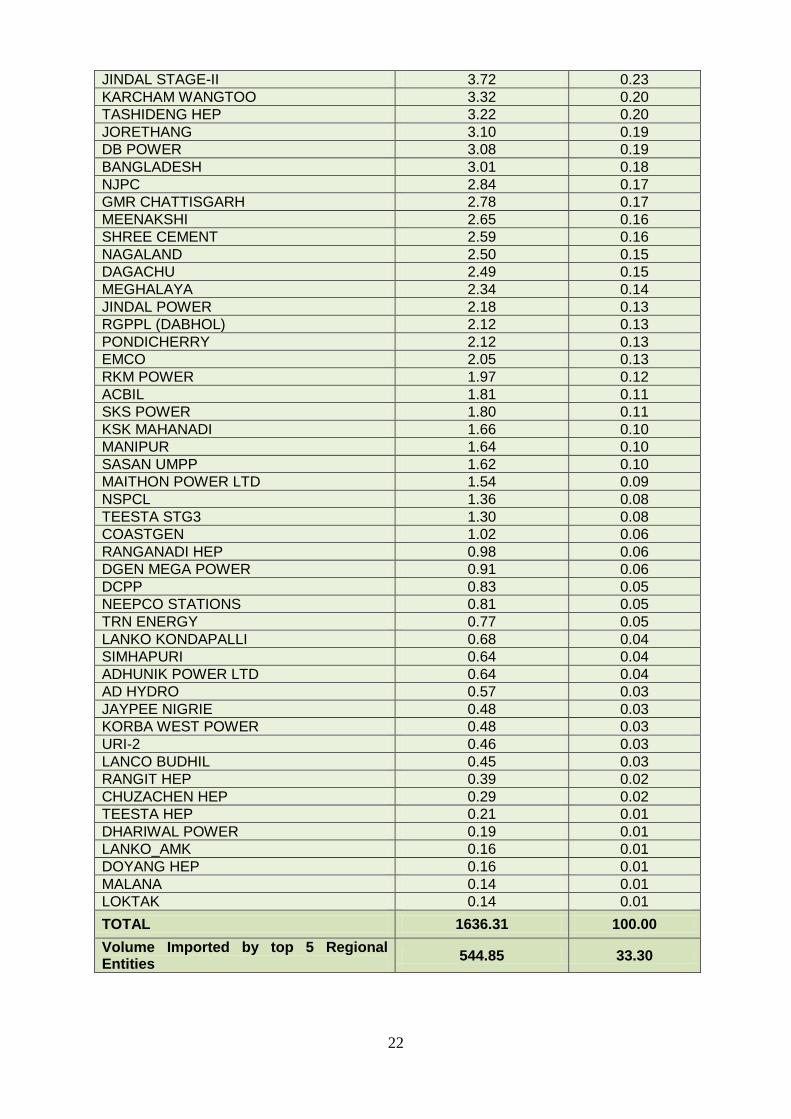
Of the total DSM transactions, top 5 regional entities underdrew 26.26% of the volume,
and these were NTPC Stations (Western region), Karnataka, Telangana, NTPC Stations
(Northern region) and Neyveli Lignite Corporation Limited (Table-13). Top 5 regional
entities overdrew 33.30% of the volume, and these were Tamil Nadu, Rajasthan, Odisha,
Haryana and Uttar Pradesh (Table-14).
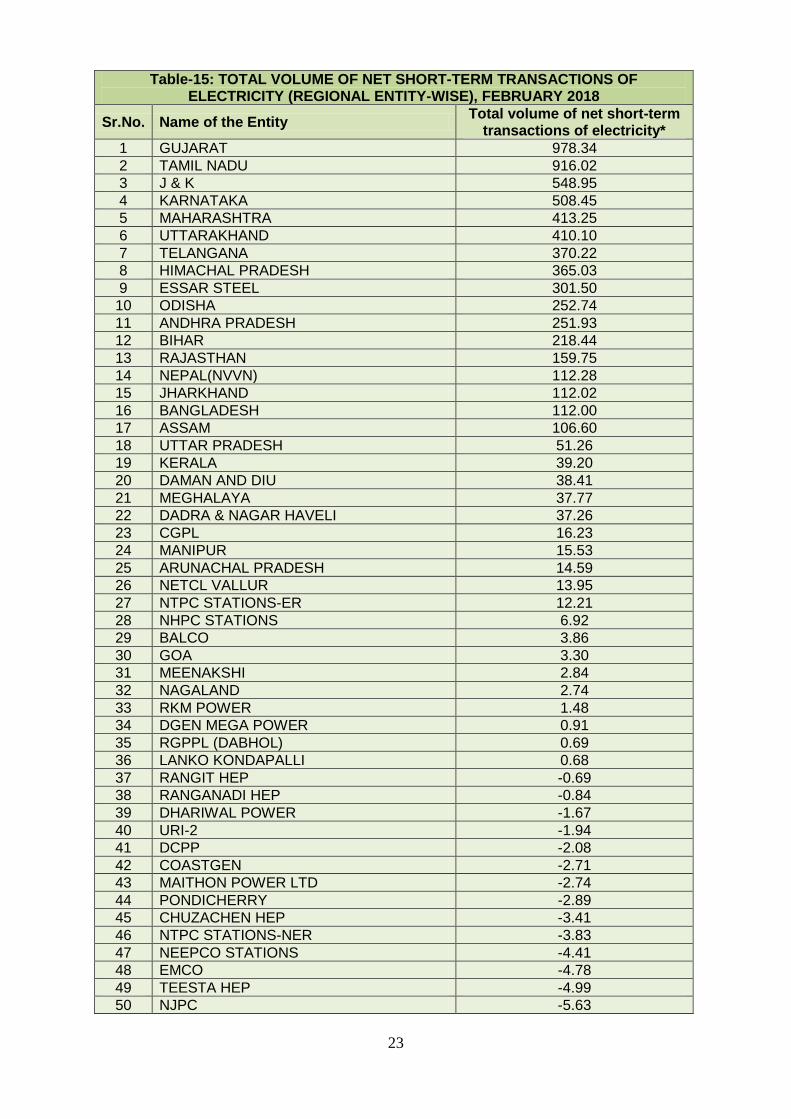
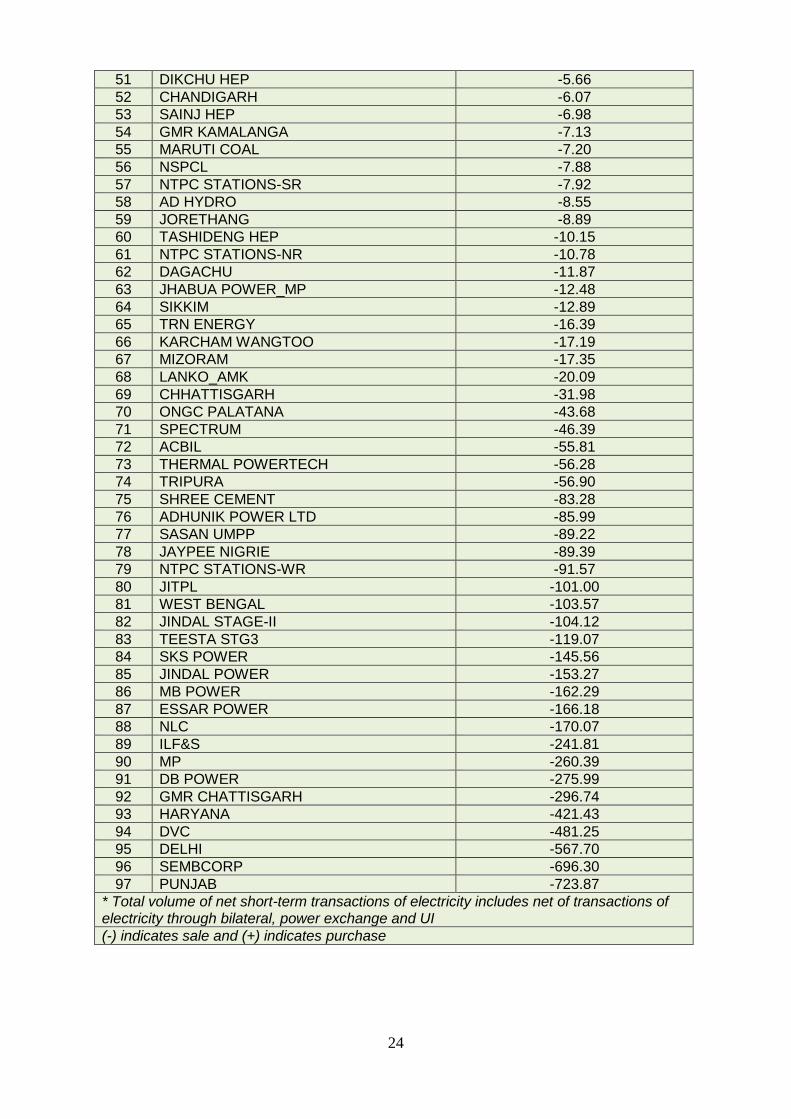
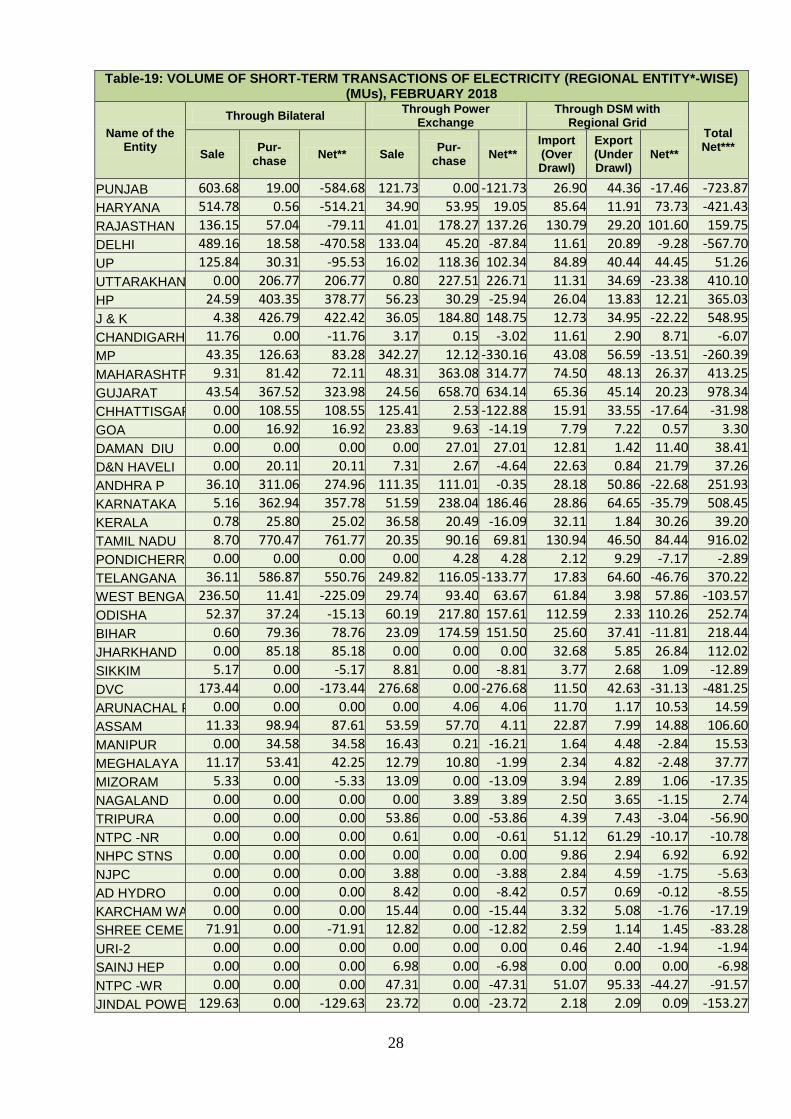
Regional entity-wise total volume of net short-term transactions of electricity i.e. volume
of net transactions through bilateral, power exchanges and DSM is shown in Table-15 & 19.
Top 5 electricity selling regional entities were Punjab, Sembcorp Gayatri Power Ltd., Delhi,
Damodar Valley Corporation and Haryana. Top 5 electricity purchasing regional entities
were Gujarat, Tamil Nadu, Jammu & Kashmir, Karnataka and Maharashtra.
IV: Congestion2 on Inter-State Transmission Corridor for Day-Ahead Market on Power
Exchanges
Power Exchanges use a price discovery mechanism in which the aggregate demand
and supply are matched to arrive at an unconstrained market price and volume. This step
assumes that there is no congestion in the inter-State transmission system between different
regions. However, in reality, the system operator (NLDC) in coordination with RLDCs limits
the flow (due to congestion) in the inter-State transmission system. In such a situation, power
exchanges adopt a mechanism called “Market Splitting”3.
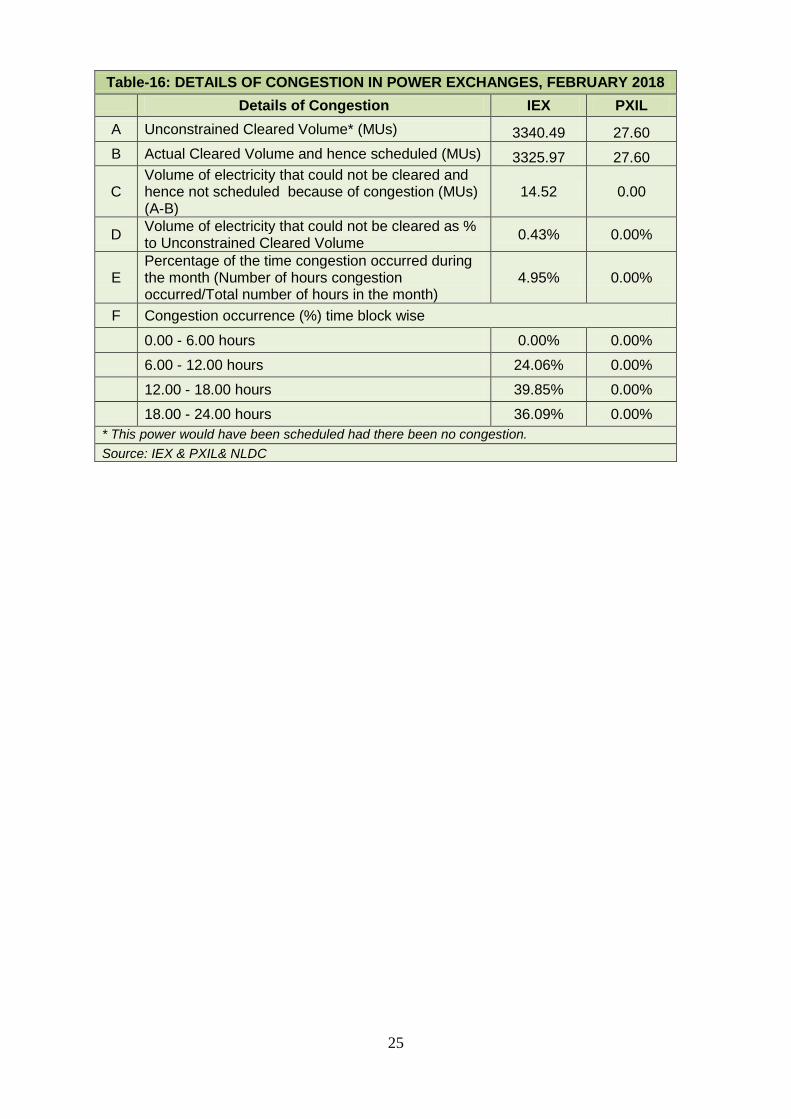
In the month of February 2018, congestion occurred only in IEX. The details of
congestion are shown in Table-16. The volume of electricity that could not be cleared due to
congestion and could not be transacted through power exchanges is the difference between
2 “Congestion” means a situation where the demand for transmission capacity exceeds the available
transfer capability
3“ Market Splitting” is a mechanism adopted by Power Exchange where the market is split in the
event of transmission congestion, into predetermined ( by NLDC) bid areas or zones, which are
cleared individually at their respective area prices such that the energy balance in every bid area is
reached based upon the demand and supply in individual bid areas and using the available
transmission corridor capacity between various bid areas simultaneously”
As a result of this market splitting the price of electricity in the importing region, where demand for
electricity is more than supply, becomes relatively higher than the price of electricity in the exporting
region.
5
unconstrained cleared volume (volume of electricity that would have been scheduled, had
there been no congestion) and actual cleared volume.
During the month, the volume of electricity that could not be cleared in IEX due to
congestion was 0.43% of the unconstrained cleared volume. In terms of time, congestion
occurred was 4.95% in IEX. There was no congestion in PXIL (Table-16).
V: Bilateral Contracts executed by Traders
The above sections covered an analysis on short-term transactions of electricity in
February, 2018. This section covers an analysis of bilateral contracts executed in March,
2018.
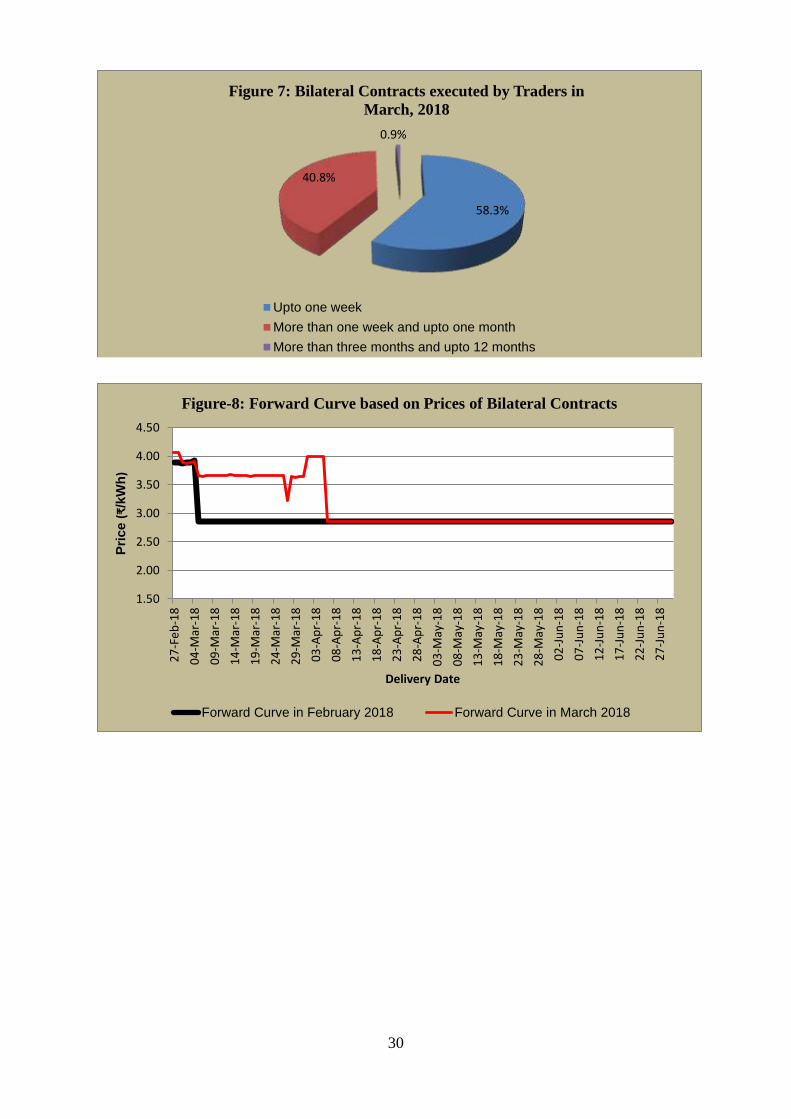
(i) Duration of bilateral contracts: During March, 2018, a total of 120 bilateral
contracts (excluding banking/swap contracts) have been executed by traders for the volume
of 3268.45 MUs. Figure-7 shows the percentage of contracts categorized according to the
period of power supply. It can be observed from the figure that 58.3% of the bilateral
contracts were executed for duration of up to one week, 40.8% of the contracts were executed
for duration of more than a week and up to one month, no contracts were executed for
duration of more than a month and up to three months, while 0.9% of the contracts were
executed for duration of more than three months and upto 12 months.
During the month, 26 banking/swapping bilateral contracts were also executed for the
volume of 1913.48 MUs.
(ii) Forward Curve based on price of bilateral contracts: A forward curve reflects
present day's expectation of prices for a future period. The forward curve of electricity prices
are based on sale prices of bilateral contracts executed by traders. The price of each contract
for each day is taken into consideration while constructing the forward curve. On the basis of
these prices, the weighted average price for each day is calculated using various sale prices of
contracts for delivery on that particular day.
Figure-8 represents the forward curve of electricity sale prices for the period from
27th
February, 2018 to 27th
June, 2018 based on the bilateral contracts4 executed till March,
4Excluding Banking/Swapping contracts
6
2018. Forward curves have been drawn for the contracts executed in February, 2018 and
March, 2018 for the purpose of comparison. It is observed that forward contract prices are
significantly higher (for the period from 27th
February to 1st March 2018 an 5
th March to 5
th
April 2018) for the contracts executed in March, 2018 compared to the contracts executed in
February, 2018, after which, the prices of contracts in February and March 2018 have been
moving together.
VI: Volume and Price of Renewable Energy Certificates (RECs)
The concept of Renewable Energy Certificates (RECs) seeks to address mismatch
between availability of renewable energy and the requirement of the obligated entities to
meet their renewable purchase obligation by purchasing green attributes of renewable energy
remotely located in the form of RECs. The REC mechanism is a market based instrument, to
promote renewable sources of energy and development of electricity market.
One REC is equivalent to 1 MWh electricity injected into the grid from renewable
energy sources. The REC is exchanged only in the power exchanges approved by CERC
within the band of a floor price and forbearance (ceiling) price as notified by CERC from
time to time. The first REC trading was held on power exchanges in February, 2011.
Trading in Renewable Energy Certificates (RECs) which was stayed by the Supreme
Court in May 2017 has been allowed since July, 2017. However, the order restricted the
trading of non-solar RECs on the condition to comply with the earlier prices.
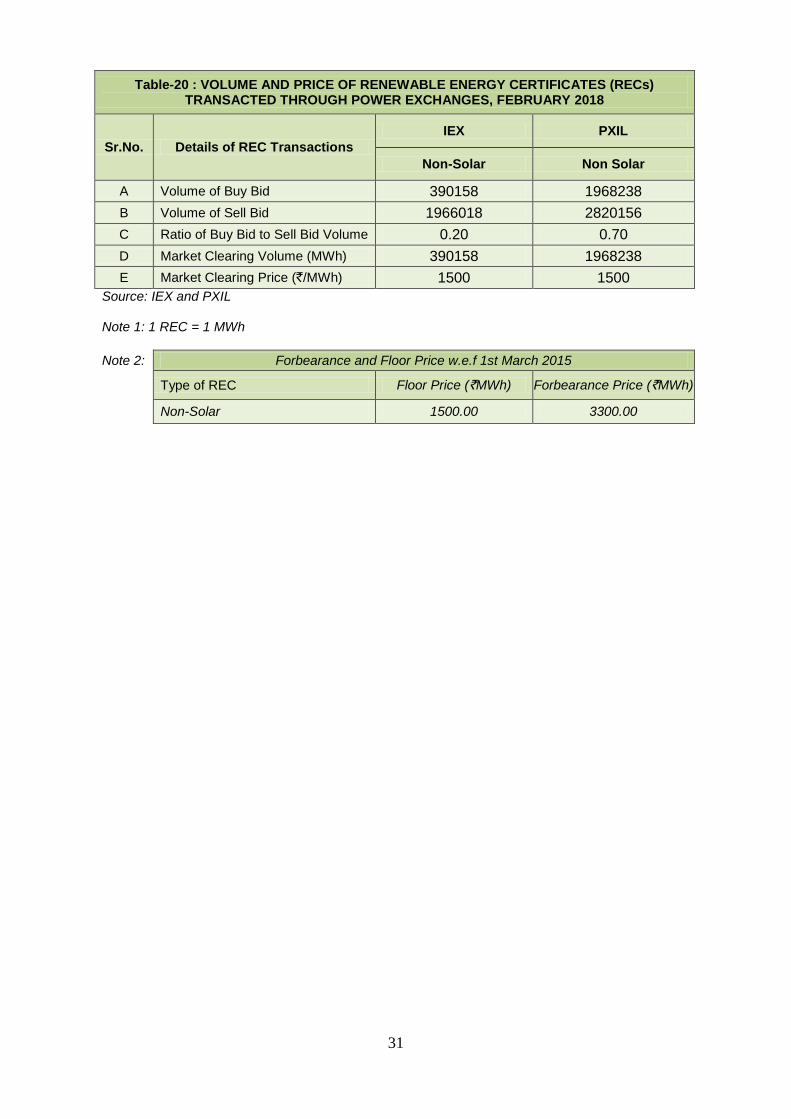
The details of REC transactions for the month of February, 2018 are shown in
Table-20. Market clearing volume of non-solar RECs transacted on IEX and PXIL were 3.90
lacs and 19.68 lacs respectively and the market clearing price of these RECs was
`1500/MWh on both the power exchanges.
The gap between the volume of buy and sell bids of RECs placed through power
exchanges shows about the variation in demand for non-solar RECs. For non-solar RECs, the
ratio of buy bids to sell bids was 0.20 and 0.70 in IEX and PXIL respectively.
7
VII: Inferences:
The percentage of short-term transactions of electricity to total electricity generation
was 10.28%.
Of the total short-term transactions, bilateral constitutes 48.05% (35.45% through
traders and term-ahead contracts on power exchanges and 12.60% directly between
distribution companies) followed by 35.62% through day ahead collective
transactions on power exchanges and 16.33% through DSM (Table-1 & Figure-1).
Top 5 trading licensees had a share of 77.99% in the total volume traded by all the
trading licensees.
The Herfindahl Hirschman Index computed for the volume of electricity traded by
trading licensees was 0.19, indicating moderate concentration of market power.
The weighted average price of electricity transacted through trading licensees was
`4.13/kWh. The weighted average prices of electricity transacted through IEX and
PXIL was `3.42/kWh and `2.12/kWh respectively.
The average price of electricity transacted through DSM was `2.18/kWh.
Top 5 electricity selling regional entities were Punjab, Sembcorp Gayatri Power Ltd.,
Delhi, Damodar Valley Corporation and Haryana. Top 5 electricity purchasing
regional entities were Gujarat, Tamil Nadu, Jammu & Kashmir, Karnataka and
Maharashtra.
During the month, the volume of electricity that could not be cleared in IEX due to
congestion was 0.43% of the unconstrained cleared volume. In terms of time,
congestion occurred was 4.95% in IEX. There was no congestion in PXIL.
In March, 2018, 58.3% of the bilateral contracts were executed for duration of up to
one week, 40.8% of the contracts were executed for duration of more than a week and
up to one month, no contracts were executed for duration of more than a month and
up to three months, while 0.9% of the contracts were executed for duration of more
than three months and upto 12 months.
8
The forward curve of electricity sale prices for the period from 27th
February, 2018 to
27th
June, 2018 based on the bilateral contracts executed till March, 2018 shows that
forward contract prices are significantly higher (for the period from 27th
February to
1st March 2018 and 5
th March to 5
th April 2018) for the contracts executed in March,
2018 compared to the contracts executed in February, 2018, after which, the prices of
contracts in February and March 2018 have been moving together.
Market clearing volume of non-solar RECs transacted on IEX and PXIL were 3.90
lacs and 19.68 lacs respectively and the market clearing price of these RECs was
`1500/MWh on both the power exchanges.
9
Table-1: VOLUME OF SHORT-TERM TRANSACTIONS OF ELECTRICITY (ALL INDIA), 7FEBRUARY 2018
Sr.No Short-term transactions Volume (MUs) % to Volume of short-term transactions
% to Total Generation
1 Bilateral 4523.60 48.05 4.94
(i) Through Traders and PXs 3337.25 35.45 3.64
(ii) Direct 1186.35 12.60 1.29
2 Through Power Exchanges 3353.57 35.62 3.66
(i) IEX 3325.97 35.33 3.63
(ii) PXIL 27.60 0.29 0.03
3 Through DSM 1537.58 16.33 1.68
Total 9414.76 - 10.28
Total Generation 91620.98 - -
Source: NLDC
48.05%
35.62%
16.33%
Figure-1: Volume of Short-term Transactions of Electricity,
February, 2018
Bilateral Power Exchanges DSM
89.72%
4.94%
3.66% 1.68%
Figure-2: Volume of Various Kinds of Electricity Transactions in
Total Electricity Generation, February 2018
Long-term Bilateral Through Power Exchanges Through DSM

10
0.00
20.00
40.00
60.00
80.00
100.00
120.00
140.00
160.00
180.00
200.00
1-F
eb-1
8
2-F
eb-1
8
3-F
eb-1
8
4-F
eb-1
8
5-F
eb-1
8
6-F
eb-1
8
7-F
eb-1
8
8-F
eb-1
8
9-F
eb-1
8
10
-Feb
-18
11
-Feb
-18
12
-Feb
-18
13
-Feb
-18
14
-Feb
-18
15
-Feb
-18
16
-Feb
-18
17
-Feb
-18
18
-Feb
-18
19
-Feb
-18
20
-Feb
-18
21
-Feb
-18
22
-Feb
-18
23
-Feb
-18
24
-Feb
-18
25
-Feb
-18
26
-Feb
-18
27
-Feb
-18
28
-Feb
-18
Vo
lum
e (
MU
s)
Figure-3: Volume of Short-term Transactions of Electricity,
February 2018 (Day-wise)
Bilateral Transactions PX Transactions DSM Transactions
11
Table-2: PERCENTAGE SHARE OF ELECTRICITY TRANSACTED BY TRADING LICENSEES, FEBRUARY 2018
Sr.No Name of the Trading Licensee % Share in total
Volume transacted by Trading Licensees
Herfindahl-Hirschman
Index
1 PTC India Ltd. 36.58 0.1338
2 NTPC Vidyut Vyapar Nigam Ltd. 12.87 0.0166
3 Manikaran Power Ltd. 11.12 0.0124
4 Mittal Processors (P) Ltd. 10.90 0.0119
5 Arunachal Pradesh Power Corporation (P) ltd 6.52 0.0043
6 GMR Energy Trading Ltd. 5.61 0.0032
7 Tata Power Trading Company (P) Ltd. 5.47 0.0030
8 Essar Electric Power Development Corp. Ltd. 2.87 0.0008
9 Jaiprakash Associates Ltd. 2.12 0.0004
10 Knowledge Infrastructure Systems (P) Ltd 1.28 0.0002
11 JSW Power Trading Company Ltd 1.13 0.0001
12 National Energy Trading & Services Ltd. 0.96 0.0001
13 RPG Power Trading Company Ltd. 0.69 0.0000
14 Adani Enterprises Ltd. 0.41 0.0000
15 Customized Energy Solutions India (P) Ltd. 0.38 0.0000
16 Instinct Infra & Power Ltd. 0.29 0.0000
17 Statkraft Markets Pvt. Ltd. 0.27 0.0000
18 My Home Power Private Ltd. 0.21 0.0000
19 Shree Cement Ltd. 0.19 0.0000
20 IPCL Power Trading Pvt. Ltd. 0.10 0.0000
21 Parshavanath Power Projects Private Limited 0.02 0.0000
22 Gita Power & Infrastructure Private Limited 0.01 0.0000
23 Phillip Commodities India (P) Ltd. 0.01 0.0000
TOTAL 100.00% 0.1868
Top 5 trading licensees 77.99% Note 1: Volume of electricity transacted by the trading licensees includes bilateral transactions (inter-state & intra-state) and the transactions undertaken through power exchanges.
Note 2: Volume of electricity transacted by Global Energy Ltd is not included.
Source: Information submitted by trading licensees
36.58
12.87 11.12
10.90
6.52
22.01
Figure 4: Percentage Share of Electricity Transacted by Trading
Licensees, February, 2018
PTC India Ltd.NTPC Vidyut Vyapar Nigam Ltd.Manikaran Power Ltd.Mittal Processors (P) Ltd.Arunachal Pradesh Power Corporation (P) ltdOthers
12
Table-3: PRICE OF ELECTRICITY TRANSACTED THROUGH TRADERS, FEBRUARY 2018
Sr.No Item Sale Price of Traders (`/kWh)
1 Minimum 2.19
2 Maximum 6.40
3 Weighted Average 4.13
Source: Information submitted by trading licensees
Table-4: PRICE OF ELECTRICITY TRANSACTED THROUGH TRADERS (TIME-WISE), FEBRUARY 2018
Sr.No Period of Trade Sale Price of Traders (`/kWh)
1 RTC 4.24
2 PEAK 0.00
3 OFF PEAK 4.02
Source: Information submitted by trading licensees
Table-5: PRICE OF ELECTRICITY TRANSACTED THROUGH POWER EXCHANGES, FEBRUARY 2018
Sr.No ACP Price in IEX (`/kWh) Price in PXIL (`/kWh)
1 Minimum 1.75 3.40
2 Maximum 11.29 3.75
3 Weighted Average 3.42 2.12
Source: Information submitted by IEX and PXIL
Table-6: VOLUME AND PRICE OF ELECTRICITY IN TERM AHEAD MARKET OF IEX,
FEBRUARY 2018
Sr.No Term ahead contracts Actual Scheduled
Volume (MUs) Weighted Average
Price (`/kWh)
1 Intra-Day Contracts 12.54 4.31
2 Day Ahead Contingency Contracts
5.41 3.78
Total 17.95 4.15
Source: IEX
Table-7: VOLUME AND PRICE OF ELECTRICITY IN TERM AHEAD MARKET OF PXIL,
FEBRUARY 2018
Sr.No Term ahead contracts Actual Scheduled
Volume (MUs) Weighted Average
Price (`/kWh)
1 Intra-Day Contracts 7.23 3.90
2 Weekly Contracts 112.80 3.37
Total 120.03 3.40
Source: PXIL
Table-8: PRICE OF ELECTRICITY TRANSACTED THROUGH DSM, FEBRUARY 2018
Sr.No Item Price in All India Grid (`/kWh)
1 Minimum 0.00
2 Maximum 6.36
3 Average 2.18
Source: NLDC
13
Note: There were transactions only on 23rd
, 24th
, 26th
, 27th
and 28th February, 2018 in PXIL.
4.13
3.42
2.12 2.18
0.00
1.00
2.00
3.00
4.00
5.00
Bilateral IEX PXIL DSM
Pri
ce (`/k
Wh
)
Type of Transactions
Figure-5: Price of Short-term Transactions of Electricity,
February 2018
0.00
0.50
1.00
1.50
2.00
2.50
3.00
3.50
4.00
4.50
5.00
5.50
6.00
1-F
eb-1
8
2-F
eb-1
8
3-F
eb-1
8
4-F
eb-1
8
5-F
eb-1
8
6-F
eb-1
8
7-F
eb-1
8
8-F
eb-1
8
9-F
eb-1
8
10
-Feb
-18
11
-Feb
-18
12
-Feb
-18
13
-Feb
-18
14
-Feb
-18
15
-Feb
-18
16
-Feb
-18
17
-Feb
-18
18
-Feb
-18
19
-Feb
-18
20
-Feb
-18
21
-Feb
-18
22
-Feb
-18
23
-Feb
-18
24
-Feb
-18
25
-Feb
-18
26
-Feb
-18
27
-Feb
-18
28
-Feb
-18
Pri
ce (`/k
Wh
)
Figure-6: Price of Short-term Transactions of Electricity,
February 2018 (Day-wise)
IEX PXIL DSM
14
Table-9: VOLUME OF ELECTRICITY SOLD THROUGH BILATERAL, FEBRUARY 2018
Name of the Entity Volume of Sale (MUs) % of Volume
PUNJAB 603.68 13.21
SEMBCORP 592.33 12.96
HARYANA 514.78 11.26
DELHI 489.16 10.70
GMR CHATTISGARH 263.00 5.75
WEST BENGAL 236.50 5.17
ILF&S 235.96 5.16
DVC 173.44 3.79
RAJASTHAN 136.15 2.98
JINDAL POWER 129.63 2.84
UTTAR PRADESH 125.84 2.75
MB POWER 98.28 2.15
SKS POWER 96.31 2.11
ADHUNIK POWER LTD 85.18 1.86
SHREE CEMENT 71.91 1.57
JITPL 60.92 1.33
SASAN UMPP 54.07 1.18
JINDAL STAGE-II 53.61 1.17
DB POWER 53.46 1.17
JAYPEE NIGRIE 53.11 1.16
ODISHA 52.37 1.15
ONGC PALATANA 43.68 0.96
GUJARAT 43.54 0.95
MP 43.35 0.95
TELANGANA 36.11 0.79
ANDHRA PRADESH 36.10 0.79
HIMACHAL PRADESH 24.59 0.54
THERMAL POWERTECH 18.38 0.40
SPECTRUM 17.93 0.39
DAGACHU 14.37 0.31
ACBIL 12.04 0.26
CHANDIGARH 11.76 0.26
ASSAM 11.33 0.25
MEGHALAYA 11.17 0.24
TRN ENERGY 10.78 0.24
MAHARASHTRA 9.31 0.20
TAMIL NADU 8.70 0.19
LANKO_AMK 8.26 0.18
JHABUA POWER_MP 7.03 0.15
MIZORAM 5.33 0.12
SIKKIM 5.17 0.11
KARNATAKA 5.16 0.11
J & K 4.38 0.10
GMR KAMALANGA 0.83 0.02
NTPC STATIONS-SR 0.83 0.02
KERALA 0.78 0.02
BIHAR 0.60 0.01
Total 4571.20 100.00
Volume Sold by top 5 Regional Entities 2462.95 53.88
15
Table-10: VOLUME OF ELECTRICITY PURCHASED THROUGH BILATERAL,
FEBRUARY 2018
Name of the Entity Volume of Purchase
(MUs) % of Volume
TAMIL NADU 770.47 17.03
TELANGANA 586.87 12.97
J & K 426.79 9.43
HIMACHAL PRADESH 403.35 8.92
GUJARAT 367.52 8.12
KARNATAKA 362.94 8.02
ANDHRA PRADESH 311.06 6.88
UTTARAKHAND 206.77 4.57
MP 126.63 2.80
BANGLADESH 111.93 2.47
CHHATTISGARH 108.55 2.40
ASSAM 98.94 2.19
JHARKHAND 85.18 1.88
MAHARASHTRA 81.42 1.80
BIHAR 79.36 1.75
NEPAL(NVVN) 69.96 1.55
RAJASTHAN 57.04 1.26
MEGHALAYA 53.41 1.18
ODISHA 37.24 0.82
MANIPUR 34.58 0.76
UTTAR PRADESH 30.31 0.67
KERALA 25.80 0.57
DADRA & NAGAR HAVELI 20.11 0.44
PUNJAB 19.00 0.42
DELHI 18.58 0.41
GOA 16.92 0.37
WEST BENGAL 11.41 0.25
ESSAR STEEL 0.87 0.02
HARYANA 0.56 0.01
TOTAL 4523.60 100.00
Volume Purchased by top 5 Regional Entities
2555.01 56.48
16
Table-11: VOLUME OF ELECTRICITY SOLD THROUGH POWER EXCHANGES, FEBRUARY 2018
Name of the Entity Volume of Sale (MUs) % of Volume
MP 342.27 10.21
DVC 276.68 8.25
TELANGANA 249.82 7.45
DB POWER 219.85 6.56
ESSAR POWER 169.95 5.07
DELHI 133.04 3.97
CHHATTISGARH 125.41 3.74
PUNJAB 121.73 3.63
NLC 120.32 3.59
TEESTA STG3 118.76 3.54
ANDHRA PRADESH 111.35 3.32
SEMBCORP 96.68 2.88
MB POWER 65.55 1.95
ODISHA 60.19 1.79
HIMACHAL PRADESH 56.23 1.68
TRIPURA 53.86 1.61
ASSAM 53.59 1.60
KARNATAKA 51.59 1.54
JINDAL STAGE-II 49.66 1.48
MAHARASHTRA 48.31 1.44
SKS POWER 47.53 1.42
NTPC STATIONS-WR 47.31 1.41
THERMAL POWERTECH 45.86 1.37
JITPL 43.66 1.30
ACBIL 41.10 1.23
RAJASTHAN 41.01 1.22
KERALA 36.58 1.09
J & K 36.05 1.08
HARYANA 34.90 1.04
JAYPEE NIGRIE 30.99 0.92
WEST BENGAL 29.74 0.89
GMR CHATTISGARH 28.72 0.86
SPECTRUM 28.47 0.85
GUJARAT 24.56 0.73
GOA 23.83 0.71
JINDAL POWER 23.72 0.71
BIHAR 23.09 0.69
TAMIL NADU 20.35 0.61
MANIPUR 16.43 0.49
UTTAR PRADESH 16.02 0.48
KARCHAM WANGTOO 15.44 0.46
MIZORAM 13.09 0.39
SHREE CEMENT 12.82 0.38
MEGHALAYA 12.79 0.38
TASHIDENG HEP 12.57 0.37
ILF&S 11.82 0.35
GMR KAMALANGA 10.90 0.32
JORETHANG 10.87 0.32
NTPC STATIONS-SR 9.88 0.29
JHABUA POWER_MP 9.67 0.29
17
SIKKIM 8.81 0.26
AD HYDRO 8.42 0.25
DADRA & NAGAR HAVELI 7.31 0.22
MARUTI COAL 7.20 0.21
SAINJ HEP 6.98 0.21
DIKCHU HEP 5.19 0.15
NJPC 3.88 0.12
NTPC STATIONS-NER 3.83 0.11
CHUZACHEN HEP 3.37 0.10
CHANDIGARH 3.17 0.09
COASTGEN 3.04 0.09
TRN ENERGY 2.92 0.09
DHARIWAL POWER 1.14 0.03
NTPC STATIONS-ER 1.00 0.03
UTTARAKHAND 0.80 0.02
NTPC STATIONS-NR 0.61 0.02
MALANA 0.52 0.02
LANCO BUDHIL 0.45 0.01
EMCO 0.36 0.01
Total 3353.57 100.00
Volume sold by top 5 Regional Entities 1258.58 37.53
18
Table-12: VOLUME OF ELECTRICITY PURCHASED THROUGH POWER EXCHANGES, FEBRUARY 2018
Name of the Entity Volume of Purchase
(MUs) % of Volume
GUJARAT 658.70 19.64
MAHARASHTRA 363.08 10.83
ESSAR STEEL 296.62 8.84
KARNATAKA 238.04 7.10
UTTARAKHAND 227.51 6.78
ODISHA 217.80 6.49
J & K 184.80 5.51
RAJASTHAN 178.27 5.32
BIHAR 174.59 5.21
UTTAR PRADESH 118.36 3.53
TELANGANA 116.05 3.46
ANDHRA PRADESH 111.01 3.31
WEST BENGAL 93.40 2.79
TAMIL NADU 90.16 2.69
ASSAM 57.70 1.72
HARYANA 53.95 1.61
DELHI 45.20 1.35
HIMACHAL PRADESH 30.29 0.90
DAMAN AND DIU 27.01 0.81
KERALA 20.49 0.61
MP 12.12 0.36
MEGHALAYA 10.80 0.32
GOA 9.63 0.29
PONDICHERRY 4.28 0.13
ARUNACHAL PRADESH 4.06 0.12
NAGALAND 3.89 0.12
DADRA & NAGAR HAVELI 2.67 0.08
CHHATTISGARH 2.53 0.08
MANIPUR 0.21 0.01
MEENAKSHI 0.19 0.01
CHANDIGARH 0.15 0.00
TOTAL 3353.57 100.00
Volume purchased by top 5 Regional Entities
1783.95 53.20
19
Table-13: VOLUME OF ELECTRICITY UNDER DRAWAL (EXPORTED) THROUGH DSM, FEBRUARY 2018
Name of the Entity Volume of Underdrawal
(MUs) % of Volume
NTPC STATIONS-WR 95.33 7.27
KARNATAKA 64.65 4.93
TELANGANA 64.60 4.93
NTPC STATIONS-NR 61.29 4.67
NLC 58.46 4.46
MP 56.59 4.32
ANDHRA PRADESH 50.86 3.88
MAHARASHTRA 48.13 3.67
TAMIL NADU 46.50 3.55
GUJARAT 45.14 3.44
PUNJAB 44.36 3.38
DVC 42.63 3.25
NTPC STATIONS-SR 41.14 3.14
UTTAR PRADESH 40.44 3.08
BIHAR 37.41 2.85
SASAN UMPP 36.76 2.80
J & K 34.95 2.67
UTTARAKHAND 34.69 2.65
CHHATTISGARH 33.55 2.56
RAJASTHAN 29.20 2.23
NTPC STATIONS-ER 21.52 1.64
DELHI 20.89 1.59
ESSAR STEEL 19.03 1.45
SEMBCORP 17.43 1.33
NEPAL(NVVN) 16.01 1.22
HIMACHAL PRADESH 13.83 1.05
LANKO_AMK 11.98 0.91
HARYANA 11.91 0.91
PONDICHERRY 9.29 0.71
NSPCL 9.24 0.70
ASSAM 7.99 0.61
GMR CHATTISGARH 7.80 0.59
TRIPURA 7.43 0.57
GOA 7.22 0.55
EMCO 6.47 0.49
MB POWER 5.87 0.45
JHARKHAND 5.85 0.45
JAYPEE NIGRIE 5.77 0.44
DB POWER 5.76 0.44
GMR KAMALANGA 5.67 0.43
NEEPCO STATIONS 5.21 0.40
TEESTA HEP 5.19 0.40
KARCHAM WANGTOO 5.08 0.39
MEGHALAYA 4.82 0.37
NJPC 4.59 0.35
JINDAL STAGE-II 4.58 0.35
CGPL 4.50 0.34
ACBIL 4.49 0.34
MANIPUR 4.48 0.34
MAITHON POWER LTD 4.28 0.33
20
WEST BENGAL 3.98 0.30
NAGALAND 3.65 0.28
JITPL 3.54 0.27
SKS POWER 3.52 0.27
BALCO 3.51 0.27
TRN ENERGY 3.47 0.26
THERMAL POWERTECH 3.37 0.26
BANGLADESH 2.94 0.22
NHPC STATIONS 2.94 0.22
DCPP 2.91 0.22
CHANDIGARH 2.90 0.22
JHABUA POWER_MP 2.89 0.22
MIZORAM 2.89 0.22
SIKKIM 2.68 0.20
ESSAR POWER 2.55 0.19
ILF&S 2.43 0.19
URI-2 2.40 0.18
ODISHA 2.33 0.18
JINDAL POWER 2.09 0.16
KSK MAHANADI 2.05 0.16
KERALA 1.84 0.14
RANGANADI HEP 1.81 0.14
TEESTA STG3 1.60 0.12
ADHUNIK POWER LTD 1.45 0.11
RGPPL (DABHOL) 1.43 0.11
DAMAN AND DIU 1.42 0.11
ARUNACHAL PRADESH 1.17 0.09
SHREE CEMENT 1.14 0.09
JORETHANG 1.12 0.09
RANGIT HEP 1.08 0.08
DADRA & NAGAR HAVELI 0.84 0.06
TASHIDENG HEP 0.81 0.06
NETCL VALLUR 0.78 0.06
DOYANG HEP 0.73 0.06
DHARIWAL POWER 0.73 0.06
AD HYDRO 0.69 0.05
COASTGEN 0.69 0.05
LOKTAK 0.64 0.05
RKM POWER 0.49 0.04
DIKCHU HEP 0.48 0.04
CHUZACHEN HEP 0.34 0.03
MALANA 0.03 0.00
KORBA WEST POWER 0.00 0.00
Total 1311.18 100.00
Volume Exported by top 5 Regional Entities
344.33 26.26
21
Table-14: VOLUME OF ELECTRICITY OVER DRAWAL (IMPORTED) THROUGH DSM, FEBRUARY 2018
Name of the Entity Volume of Over drawal
(MUs) % of Volume
TAMIL NADU 130.94 8.00
RAJASTHAN 130.79 7.99
ODISHA 112.59 6.88
HARYANA 85.64 5.23
UTTAR PRADESH 84.89 5.19
MAHARASHTRA 74.50 4.55
GUJARAT 65.36 3.99
WEST BENGAL 61.84 3.78
NEPAL(NVVN) 58.33 3.56
NTPC STATIONS-NR 51.12 3.12
NTPC STATIONS-WR 51.07 3.12
NTPC STATIONS-SR 43.93 2.68
MP 43.08 2.63
NTPC STATIONS-ER 34.73 2.12
JHARKHAND 32.68 2.00
KERALA 32.11 1.96
KARNATAKA 28.86 1.76
ANDHRA PRADESH 28.18 1.72
PUNJAB 26.90 1.64
HIMACHAL PRADESH 26.04 1.59
BIHAR 25.60 1.56
ESSAR STEEL 23.03 1.41
ASSAM 22.87 1.40
DADRA & NAGAR HAVELI 22.63 1.38
CGPL 20.73 1.27
TELANGANA 17.83 1.09
CHHATTISGARH 15.91 0.97
NETCL VALLUR 14.72 0.90
DAMAN AND DIU 12.81 0.78
J & K 12.73 0.78
ARUNACHAL PRADESH 11.70 0.72
DELHI 11.61 0.71
CHANDIGARH 11.61 0.71
DVC 11.50 0.70
THERMAL POWERTECH 11.33 0.69
UTTARAKHAND 11.31 0.69
GMR KAMALANGA 10.27 0.63
SEMBCORP 10.14 0.62
NHPC STATIONS 9.86 0.60
NLC 8.71 0.53
ILF&S 8.40 0.51
GOA 7.79 0.48
MB POWER 7.40 0.45
BALCO 7.36 0.45
JITPL 7.12 0.43
JHABUA POWER_MP 7.10 0.43
ESSAR POWER 6.32 0.39
TRIPURA 4.39 0.27
MIZORAM 3.94 0.24
SIKKIM 3.77 0.23
22
JINDAL STAGE-II 3.72 0.23
KARCHAM WANGTOO 3.32 0.20
TASHIDENG HEP 3.22 0.20
JORETHANG 3.10 0.19
DB POWER 3.08 0.19
BANGLADESH 3.01 0.18
NJPC 2.84 0.17
GMR CHATTISGARH 2.78 0.17
MEENAKSHI 2.65 0.16
SHREE CEMENT 2.59 0.16
NAGALAND 2.50 0.15
DAGACHU 2.49 0.15
MEGHALAYA 2.34 0.14
JINDAL POWER 2.18 0.13
RGPPL (DABHOL) 2.12 0.13
PONDICHERRY 2.12 0.13
EMCO 2.05 0.13
RKM POWER 1.97 0.12
ACBIL 1.81 0.11
SKS POWER 1.80 0.11
KSK MAHANADI 1.66 0.10
MANIPUR 1.64 0.10
SASAN UMPP 1.62 0.10
MAITHON POWER LTD 1.54 0.09
NSPCL 1.36 0.08
TEESTA STG3 1.30 0.08
COASTGEN 1.02 0.06
RANGANADI HEP 0.98 0.06
DGEN MEGA POWER 0.91 0.06
DCPP 0.83 0.05
NEEPCO STATIONS 0.81 0.05
TRN ENERGY 0.77 0.05
LANKO KONDAPALLI 0.68 0.04
SIMHAPURI 0.64 0.04
ADHUNIK POWER LTD 0.64 0.04
AD HYDRO 0.57 0.03
JAYPEE NIGRIE 0.48 0.03
KORBA WEST POWER 0.48 0.03
URI-2 0.46 0.03
LANCO BUDHIL 0.45 0.03
RANGIT HEP 0.39 0.02
CHUZACHEN HEP 0.29 0.02
TEESTA HEP 0.21 0.01
DHARIWAL POWER 0.19 0.01
LANKO_AMK 0.16 0.01
DOYANG HEP 0.16 0.01
MALANA 0.14 0.01
LOKTAK 0.14 0.01
TOTAL 1636.31 100.00
Volume Imported by top 5 Regional Entities
544.85 33.30
23
Table-15: TOTAL VOLUME OF NET SHORT-TERM TRANSACTIONS OF ELECTRICITY (REGIONAL ENTITY-WISE), FEBRUARY 2018
Sr.No. Name of the Entity Total volume of net short-term
transactions of electricity*
1 GUJARAT 978.34
2 TAMIL NADU 916.02
3 J & K 548.95
4 KARNATAKA 508.45
5 MAHARASHTRA 413.25
6 UTTARAKHAND 410.10
7 TELANGANA 370.22
8 HIMACHAL PRADESH 365.03
9 ESSAR STEEL 301.50
10 ODISHA 252.74
11 ANDHRA PRADESH 251.93
12 BIHAR 218.44
13 RAJASTHAN 159.75
14 NEPAL(NVVN) 112.28
15 JHARKHAND 112.02
16 BANGLADESH 112.00
17 ASSAM 106.60
18 UTTAR PRADESH 51.26
19 KERALA 39.20
20 DAMAN AND DIU 38.41
21 MEGHALAYA 37.77
22 DADRA & NAGAR HAVELI 37.26
23 CGPL 16.23
24 MANIPUR 15.53
25 ARUNACHAL PRADESH 14.59
26 NETCL VALLUR 13.95
27 NTPC STATIONS-ER 12.21
28 NHPC STATIONS 6.92
29 BALCO 3.86
30 GOA 3.30
31 MEENAKSHI 2.84
32 NAGALAND 2.74
33 RKM POWER 1.48
34 DGEN MEGA POWER 0.91
35 RGPPL (DABHOL) 0.69
36 LANKO KONDAPALLI 0.68
37 RANGIT HEP -0.69
38 RANGANADI HEP -0.84
39 DHARIWAL POWER -1.67
40 URI-2 -1.94
41 DCPP -2.08
42 COASTGEN -2.71
43 MAITHON POWER LTD -2.74
44 PONDICHERRY -2.89
45 CHUZACHEN HEP -3.41
46 NTPC STATIONS-NER -3.83
47 NEEPCO STATIONS -4.41
48 EMCO -4.78
49 TEESTA HEP -4.99
50 NJPC -5.63
24
51 DIKCHU HEP -5.66
52 CHANDIGARH -6.07
53 SAINJ HEP -6.98
54 GMR KAMALANGA -7.13
55 MARUTI COAL -7.20
56 NSPCL -7.88
57 NTPC STATIONS-SR -7.92
58 AD HYDRO -8.55
59 JORETHANG -8.89
60 TASHIDENG HEP -10.15
61 NTPC STATIONS-NR -10.78
62 DAGACHU -11.87
63 JHABUA POWER_MP -12.48
64 SIKKIM -12.89
65 TRN ENERGY -16.39
66 KARCHAM WANGTOO -17.19
67 MIZORAM -17.35
68 LANKO_AMK -20.09
69 CHHATTISGARH -31.98
70 ONGC PALATANA -43.68
71 SPECTRUM -46.39
72 ACBIL -55.81
73 THERMAL POWERTECH -56.28
74 TRIPURA -56.90
75 SHREE CEMENT -83.28
76 ADHUNIK POWER LTD -85.99
77 SASAN UMPP -89.22
78 JAYPEE NIGRIE -89.39
79 NTPC STATIONS-WR -91.57
80 JITPL -101.00
81 WEST BENGAL -103.57
82 JINDAL STAGE-II -104.12
83 TEESTA STG3 -119.07
84 SKS POWER -145.56
85 JINDAL POWER -153.27
86 MB POWER -162.29
87 ESSAR POWER -166.18
88 NLC -170.07
89 ILF&S -241.81
90 MP -260.39
91 DB POWER -275.99
92 GMR CHATTISGARH -296.74
93 HARYANA -421.43
94 DVC -481.25
95 DELHI -567.70
96 SEMBCORP -696.30
97 PUNJAB -723.87
* Total volume of net short-term transactions of electricity includes net of transactions of electricity through bilateral, power exchange and UI
(-) indicates sale and (+) indicates purchase
25
Table-16: DETAILS OF CONGESTION IN POWER EXCHANGES, FEBRUARY 2018
Details of Congestion IEX PXIL
A Unconstrained Cleared Volume* (MUs) 3340.49 27.60
B Actual Cleared Volume and hence scheduled (MUs) 3325.97 27.60
C Volume of electricity that could not be cleared and hence not scheduled because of congestion (MUs) (A-B)
14.52 0.00
D Volume of electricity that could not be cleared as % to Unconstrained Cleared Volume
0.43% 0.00%
E Percentage of the time congestion occurred during the month (Number of hours congestion occurred/Total number of hours in the month)
4.95% 0.00%
F Congestion occurrence (%) time block wise
0.00 - 6.00 hours 0.00% 0.00%
6.00 - 12.00 hours 24.06% 0.00%
12.00 - 18.00 hours 39.85% 0.00%
18.00 - 24.00 hours 36.09% 0.00%
* This power would have been scheduled had there been no congestion.
Source: IEX & PXIL& NLDC
26
Table-17: VOLUME OF SHORT-TERM TRANSACTIONS OF ELECTRICITY IN INDIA (DAY-WISE) (MUs), FEBRUARY 2018
Date
Bilateral
Power Exchange (Area Clearing
Volume# of Day Ahead Market)
Deviation Settlement
(Over Drawl+Under Generation)
Total Electricity Generation
(MU) as given at CEA
Website*
Through Traders
and PXs** Direct IEX PXIL
1-Feb-18 119.66 43.74 108.51 0.00 53.31 3268.05
2-Feb-18 118.21 40.92 113.22 0.00 53.59 3288.28
3-Feb-18 115.98 43.67 117.59 0.00 52.82 3252.96
4-Feb-18 120.31 43.17 103.32 0.00 56.61 3124.59
5-Feb-18 114.47 43.72 127.88 0.00 53.57 3235.92
6-Feb-18 117.07 43.77 121.65 0.00 52.38 3316.81
7-Feb-18 116.92 43.19 120.84 0.00 52.37 3355.95
8-Feb-18 124.24 48.34 119.36 0.00 57.74 3334.01
9-Feb-18 121.49 48.17 116.94 0.00 55.61 3364.08
10-Feb-18 120.81 48.05 115.38 0.00 52.54 3337.48
11-Feb-18 121.26 44.67 102.62 0.00 56.96 3112.44
12-Feb-18 121.76 47.77 116.01 0.00 65.97 3110.00
13-Feb-18 119.42 44.57 103.09 0.00 60.11 3144.16
14-Feb-18 123.18 45.75 104.57 0.00 69.26 3115.62
15-Feb-18 120.57 41.62 108.64 0.00 54.11 3166.59
16-Feb-18 123.68 37.95 106.38 0.00 48.12 3278.54
17-Feb-18 124.04 38.96 108.74 0.00 49.53 3293.04
18-Feb-18 117.45 40.95 110.13 0.00 50.45 3187.84
19-Feb-18 120.68 41.95 115.95 0.00 54.06 3259.16
20-Feb-18 116.81 39.59 126.98 0.00 53.38 3333.72
21-Feb-18 114.24 40.74 129.59 0.00 54.65 3345.90
22-Feb-18 119.09 38.50 129.39 0.00 56.82 3378.55
23-Feb-18 116.83 40.01 132.93 2.40 58.04 3358.53
24-Feb-18 118.65 39.27 139.67 7.20 53.31 3295.45
25-Feb-18 114.50 39.29 128.73 0.00 57.13 3194.29
26-Feb-18 119.63 40.10 132.38 7.20 50.63 3331.40
27-Feb-18 117.17 39.89 128.34 3.60 52.15 3385.78
28-Feb-18 119.16 38.05 137.16 7.20 52.39 3451.84
Total 3337.25 1186.35 3325.97 27.60 1537.58 91620.98 Source: NLDC
* Gross Electricity Generation excluding electricity generation from renewables and captive power plants.
** The volume of bilateral through PXs represents the volume through term-ahead contracts.
# Area Clearing Volume represents the scheduled volume of all the bid areas.
27
Table-18: PRICE OF SHORT-TERM TRANSACTIONS OF ELECTRICITY (DAY-WISE)(`/kWh), FEBRUARY 2018
Market Segment
Day ahead market of IEX Day ahead market of
PXIL Under Drawl/Over Drawl
from the Grid (DSM)
Date Mini-mum ACP
Maxi-mum ACP
Weighted Average
Price*
Mini-mum ACP
Maxi-mum ACP
Weighted Average Price*
All India Grid
Mini-mum Price
Maxi-mum Price
Average Price**
1-Feb-18 1.92 9.41 3.40 - - - - 3.45 1.79
2-Feb-18 1.75 11.29 3.24 - - - - 3.45 1.99
3-Feb-18 1.92 5.00 3.24 - - - - 3.45 2.11
4-Feb-18 2.00 4.01 2.94 - - - - 3.45 1.59
5-Feb-18 1.92 4.81 3.32 - - - - 3.45 1.74
6-Feb-18 2.01 4.41 3.19 - - - - 5.32 2.37
7-Feb-18 2.00 4.90 3.39 - - - - 5.32 2.24
8-Feb-18 2.01 5.30 3.56 - - - - 5.95 2.45
9-Feb-18 2.27 5.33 3.76 - - - - 5.32 2.57
10-Feb-18 2.25 5.50 3.76 - - - - 5.32 2.22
11-Feb-18 2.25 5.25 3.37 - - - - 3.45 1.56
12-Feb-18 2.00 5.25 3.45 - - - - 3.45 2.01
13-Feb-18 2.00 4.25 2.94 - - - - 3.45 2.06
14-Feb-18 1.90 3.90 2.77 - - - - 3.45 1.78
15-Feb-18 1.98 3.91 2.80 - - - 0.36 3.45 2.09
16-Feb-18 2.00 4.30 3.01 - - - - 4.91 2.13
17-Feb-18 2.09 4.74 3.20 - - - - 4.91 2.32
18-Feb-18 2.17 4.47 3.10 - - - - 3.45 1.92
19-Feb-18 2.24 5.28 3.65 - - - - 4.91 2.45
20-Feb-18 2.40 5.32 3.73 - - - 0.36 4.91 2.52
21-Feb-18 2.40 6.11 3.90 - - - - 5.95 2.45
22-Feb-18 2.25 5.00 3.57 - - - - 5.74 2.55
23-Feb-18 2.25 5.30 3.67 3.40 3.40 3.40 - 6.36 2.73
24-Feb-18 2.40 5.99 3.92 3.40 3.40 3.40 0.71 4.91 2.45
25-Feb-18 2.31 4.47 3.19 - - - - 3.45 1.76
26-Feb-18 2.16 5.80 3.72 3.40 3.40 3.40 - 3.45 1.96
27-Feb-18 2.09 5.77 3.63 3.75 3.75 3.75 - 5.11 2.41
28-Feb-18 2.31 5.58 3.64 3.48 3.48 3.48 1.07 5.32 2.78
1.75 11.29 3.42 0.00 3.75 2.12 0.00 6.36 2.18
Source: Data on price of PX transactions from IEX and PXIL and data on DSM Price from NLDC.
* Weighted average price computed based on Area Clearing Volume (ACV) and Area Clearing Price (ACP) for each hour of the day. Here, ACV and ACP represent the scheduled volume and weighted average price of all the bid areas of power exchanges.
** Simple average price of DSM of 96 time blocks of 15 minutes each in a day. DSM price includes Ceiling DSM Rate +40% additional DSM charge.
# Maximum/Minimum in the month
28
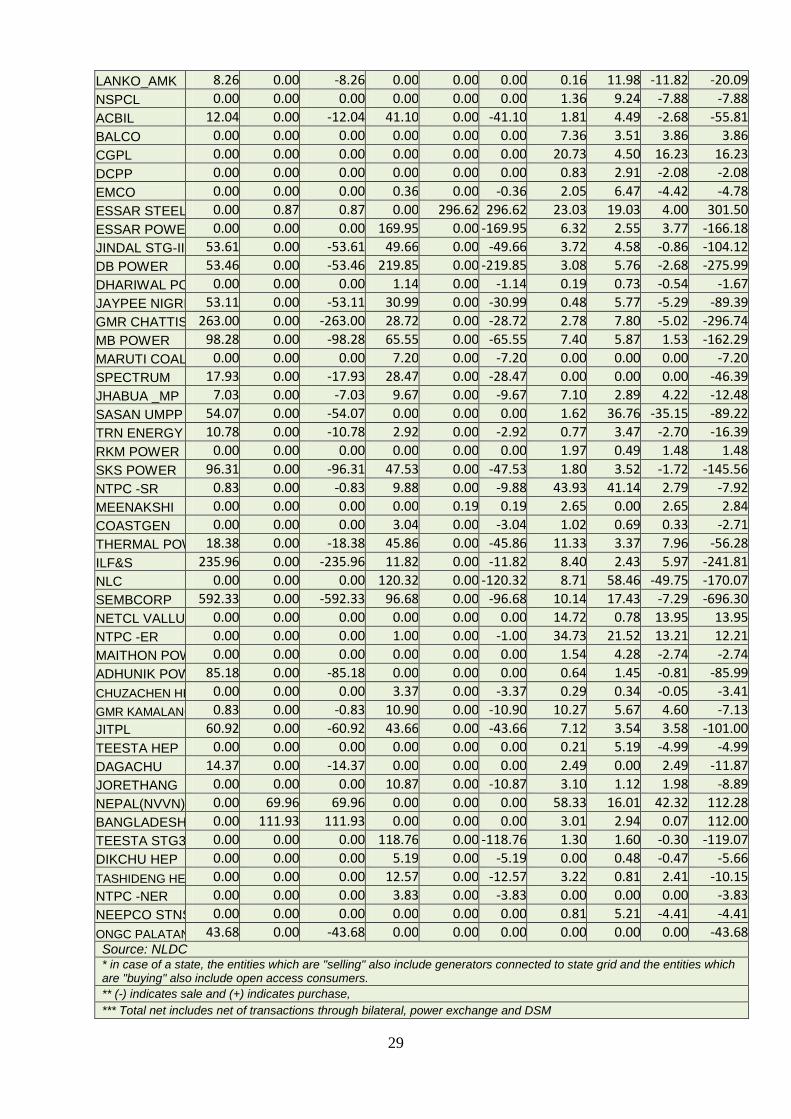
Table-19: VOLUME OF SHORT-TERM TRANSACTIONS OF ELECTRICITY (REGIONAL ENTITY*-WISE) (MUs), FEBRUARY 2018
Name of the Entity
Through Bilateral Through Power
Exchange Through DSM with
Regional Grid Total Net***
Sale Pur-
chase Net** Sale
Pur-chase
Net** Import (Over Drawl)
Export (Under Drawl)
Net**
PUNJAB 603.68 19.00 -584.68 121.73 0.00 -121.73 26.90 44.36 -17.46 -723.87
HARYANA 514.78 0.56 -514.21 34.90 53.95 19.05 85.64 11.91 73.73 -421.43
RAJASTHAN 136.15 57.04 -79.11 41.01 178.27 137.26 130.79 29.20 101.60 159.75
DELHI 489.16 18.58 -470.58 133.04 45.20 -87.84 11.61 20.89 -9.28 -567.70
UP 125.84 30.31 -95.53 16.02 118.36 102.34 84.89 40.44 44.45 51.26
UTTARAKHAND 0.00 206.77 206.77 0.80 227.51 226.71 11.31 34.69 -23.38 410.10
HP 24.59 403.35 378.77 56.23 30.29 -25.94 26.04 13.83 12.21 365.03
J & K 4.38 426.79 422.42 36.05 184.80 148.75 12.73 34.95 -22.22 548.95
CHANDIGARH 11.76 0.00 -11.76 3.17 0.15 -3.02 11.61 2.90 8.71 -6.07
MP 43.35 126.63 83.28 342.27 12.12 -330.16 43.08 56.59 -13.51 -260.39
MAHARASHTRA 9.31 81.42 72.11 48.31 363.08 314.77 74.50 48.13 26.37 413.25
GUJARAT 43.54 367.52 323.98 24.56 658.70 634.14 65.36 45.14 20.23 978.34
CHHATTISGARH 0.00 108.55 108.55 125.41 2.53 -122.88 15.91 33.55 -17.64 -31.98
GOA 0.00 16.92 16.92 23.83 9.63 -14.19 7.79 7.22 0.57 3.30
DAMAN DIU 0.00 0.00 0.00 0.00 27.01 27.01 12.81 1.42 11.40 38.41
D&N HAVELI 0.00 20.11 20.11 7.31 2.67 -4.64 22.63 0.84 21.79 37.26
ANDHRA P 36.10 311.06 274.96 111.35 111.01 -0.35 28.18 50.86 -22.68 251.93
KARNATAKA 5.16 362.94 357.78 51.59 238.04 186.46 28.86 64.65 -35.79 508.45
KERALA 0.78 25.80 25.02 36.58 20.49 -16.09 32.11 1.84 30.26 39.20
TAMIL NADU 8.70 770.47 761.77 20.35 90.16 69.81 130.94 46.50 84.44 916.02
PONDICHERRY 0.00 0.00 0.00 0.00 4.28 4.28 2.12 9.29 -7.17 -2.89
TELANGANA 36.11 586.87 550.76 249.82 116.05 -133.77 17.83 64.60 -46.76 370.22
WEST BENGAL 236.50 11.41 -225.09 29.74 93.40 63.67 61.84 3.98 57.86 -103.57
ODISHA 52.37 37.24 -15.13 60.19 217.80 157.61 112.59 2.33 110.26 252.74
BIHAR 0.60 79.36 78.76 23.09 174.59 151.50 25.60 37.41 -11.81 218.44
JHARKHAND 0.00 85.18 85.18 0.00 0.00 0.00 32.68 5.85 26.84 112.02
SIKKIM 5.17 0.00 -5.17 8.81 0.00 -8.81 3.77 2.68 1.09 -12.89
DVC 173.44 0.00 -173.44 276.68 0.00 -276.68 11.50 42.63 -31.13 -481.25
ARUNACHAL P 0.00 0.00 0.00 0.00 4.06 4.06 11.70 1.17 10.53 14.59
ASSAM 11.33 98.94 87.61 53.59 57.70 4.11 22.87 7.99 14.88 106.60
MANIPUR 0.00 34.58 34.58 16.43 0.21 -16.21 1.64 4.48 -2.84 15.53
MEGHALAYA 11.17 53.41 42.25 12.79 10.80 -1.99 2.34 4.82 -2.48 37.77
MIZORAM 5.33 0.00 -5.33 13.09 0.00 -13.09 3.94 2.89 1.06 -17.35
NAGALAND 0.00 0.00 0.00 0.00 3.89 3.89 2.50 3.65 -1.15 2.74
TRIPURA 0.00 0.00 0.00 53.86 0.00 -53.86 4.39 7.43 -3.04 -56.90
NTPC -NR 0.00 0.00 0.00 0.61 0.00 -0.61 51.12 61.29 -10.17 -10.78
NHPC STNS 0.00 0.00 0.00 0.00 0.00 0.00 9.86 2.94 6.92 6.92
NJPC 0.00 0.00 0.00 3.88 0.00 -3.88 2.84 4.59 -1.75 -5.63
AD HYDRO 0.00 0.00 0.00 8.42 0.00 -8.42 0.57 0.69 -0.12 -8.55
KARCHAM WAN 0.00 0.00 0.00 15.44 0.00 -15.44 3.32 5.08 -1.76 -17.19
SHREE CEME 71.91 0.00 -71.91 12.82 0.00 -12.82 2.59 1.14 1.45 -83.28
URI-2 0.00 0.00 0.00 0.00 0.00 0.00 0.46 2.40 -1.94 -1.94
SAINJ HEP 0.00 0.00 0.00 6.98 0.00 -6.98 0.00 0.00 0.00 -6.98
NTPC -WR 0.00 0.00 0.00 47.31 0.00 -47.31 51.07 95.33 -44.27 -91.57
JINDAL POWER 129.63 0.00 -129.63 23.72 0.00 -23.72 2.18 2.09 0.09 -153.27
29
LANKO_AMK 8.26 0.00 -8.26 0.00 0.00 0.00 0.16 11.98 -11.82 -20.09
NSPCL 0.00 0.00 0.00 0.00 0.00 0.00 1.36 9.24 -7.88 -7.88
ACBIL 12.04 0.00 -12.04 41.10 0.00 -41.10 1.81 4.49 -2.68 -55.81
BALCO 0.00 0.00 0.00 0.00 0.00 0.00 7.36 3.51 3.86 3.86
CGPL 0.00 0.00 0.00 0.00 0.00 0.00 20.73 4.50 16.23 16.23
DCPP 0.00 0.00 0.00 0.00 0.00 0.00 0.83 2.91 -2.08 -2.08
EMCO 0.00 0.00 0.00 0.36 0.00 -0.36 2.05 6.47 -4.42 -4.78
ESSAR STEEL 0.00 0.87 0.87 0.00 296.62 296.62 23.03 19.03 4.00 301.50
ESSAR POWER 0.00 0.00 0.00 169.95 0.00 -169.95 6.32 2.55 3.77 -166.18
JINDAL STG-II 53.61 0.00 -53.61 49.66 0.00 -49.66 3.72 4.58 -0.86 -104.12
DB POWER 53.46 0.00 -53.46 219.85 0.00 -219.85 3.08 5.76 -2.68 -275.99
DHARIWAL PO 0.00 0.00 0.00 1.14 0.00 -1.14 0.19 0.73 -0.54 -1.67
JAYPEE NIGRIE 53.11 0.00 -53.11 30.99 0.00 -30.99 0.48 5.77 -5.29 -89.39
GMR CHATTIS 263.00 0.00 -263.00 28.72 0.00 -28.72 2.78 7.80 -5.02 -296.74
MB POWER 98.28 0.00 -98.28 65.55 0.00 -65.55 7.40 5.87 1.53 -162.29
MARUTI COAL 0.00 0.00 0.00 7.20 0.00 -7.20 0.00 0.00 0.00 -7.20
SPECTRUM 17.93 0.00 -17.93 28.47 0.00 -28.47 0.00 0.00 0.00 -46.39
JHABUA _MP 7.03 0.00 -7.03 9.67 0.00 -9.67 7.10 2.89 4.22 -12.48
SASAN UMPP 54.07 0.00 -54.07 0.00 0.00 0.00 1.62 36.76 -35.15 -89.22
TRN ENERGY 10.78 0.00 -10.78 2.92 0.00 -2.92 0.77 3.47 -2.70 -16.39
RKM POWER 0.00 0.00 0.00 0.00 0.00 0.00 1.97 0.49 1.48 1.48
SKS POWER 96.31 0.00 -96.31 47.53 0.00 -47.53 1.80 3.52 -1.72 -145.56
NTPC -SR 0.83 0.00 -0.83 9.88 0.00 -9.88 43.93 41.14 2.79 -7.92
MEENAKSHI 0.00 0.00 0.00 0.00 0.19 0.19 2.65 0.00 2.65 2.84
COASTGEN 0.00 0.00 0.00 3.04 0.00 -3.04 1.02 0.69 0.33 -2.71
THERMAL POW 18.38 0.00 -18.38 45.86 0.00 -45.86 11.33 3.37 7.96 -56.28
ILF&S 235.96 0.00 -235.96 11.82 0.00 -11.82 8.40 2.43 5.97 -241.81
NLC 0.00 0.00 0.00 120.32 0.00 -120.32 8.71 58.46 -49.75 -170.07
SEMBCORP 592.33 0.00 -592.33 96.68 0.00 -96.68 10.14 17.43 -7.29 -696.30
NETCL VALLUR 0.00 0.00 0.00 0.00 0.00 0.00 14.72 0.78 13.95 13.95
NTPC -ER 0.00 0.00 0.00 1.00 0.00 -1.00 34.73 21.52 13.21 12.21
MAITHON POW 0.00 0.00 0.00 0.00 0.00 0.00 1.54 4.28 -2.74 -2.74
ADHUNIK POW 85.18 0.00 -85.18 0.00 0.00 0.00 0.64 1.45 -0.81 -85.99
CHUZACHEN HEP 0.00 0.00 0.00 3.37 0.00 -3.37 0.29 0.34 -0.05 -3.41
GMR KAMALANGA 0.83 0.00 -0.83 10.90 0.00 -10.90 10.27 5.67 4.60 -7.13
JITPL 60.92 0.00 -60.92 43.66 0.00 -43.66 7.12 3.54 3.58 -101.00
TEESTA HEP 0.00 0.00 0.00 0.00 0.00 0.00 0.21 5.19 -4.99 -4.99
DAGACHU 14.37 0.00 -14.37 0.00 0.00 0.00 2.49 0.00 2.49 -11.87
JORETHANG 0.00 0.00 0.00 10.87 0.00 -10.87 3.10 1.12 1.98 -8.89
NEPAL(NVVN) 0.00 69.96 69.96 0.00 0.00 0.00 58.33 16.01 42.32 112.28
BANGLADESH 0.00 111.93 111.93 0.00 0.00 0.00 3.01 2.94 0.07 112.00
TEESTA STG3 0.00 0.00 0.00 118.76 0.00 -118.76 1.30 1.60 -0.30 -119.07
DIKCHU HEP 0.00 0.00 0.00 5.19 0.00 -5.19 0.00 0.48 -0.47 -5.66
TASHIDENG HEP 0.00 0.00 0.00 12.57 0.00 -12.57 3.22 0.81 2.41 -10.15
NTPC -NER 0.00 0.00 0.00 3.83 0.00 -3.83 0.00 0.00 0.00 -3.83
NEEPCO STNS 0.00 0.00 0.00 0.00 0.00 0.00 0.81 5.21 -4.41 -4.41
ONGC PALATANA 43.68 0.00 -43.68 0.00 0.00 0.00 0.00 0.00 0.00 -43.68 Source: NLDC * in case of a state, the entities which are "selling" also include generators connected to state grid and the entities which are "buying" also include open access consumers.
** (-) indicates sale and (+) indicates purchase,
*** Total net includes net of transactions through bilateral, power exchange and DSM
30
58.3%
40.8%
0.9%
Figure 7: Bilateral Contracts executed by Traders in
March, 2018
Upto one week
More than one week and upto one month
More than three months and upto 12 months
1.50
2.00
2.50
3.00
3.50
4.00
4.50
27
-Fe
b-1
8
04
-Mar
-18
09
-Mar
-18
14
-Mar
-18
19
-Mar
-18
24
-Mar
-18
29
-Mar
-18
03
-Ap
r-1
8
08
-Ap
r-1
8
13
-Ap
r-1
8
18
-Ap
r-1
8
23
-Ap
r-1
8
28
-Ap
r-1
8
03
-May
-18
08
-May
-18
13
-May
-18
18
-May
-18
23
-May
-18
28
-May
-18
02
-Ju
n-1
8
07
-Ju
n-1
8
12
-Ju
n-1
8
17
-Ju
n-1
8
22
-Ju
n-1
8
27
-Ju
n-1
8
Pri
ce (₹/k
Wh
)
Delivery Date
Figure-8: Forward Curve based on Prices of Bilateral Contracts
Forward Curve in February 2018 Forward Curve in March 2018
31
Table-20 : VOLUME AND PRICE OF RENEWABLE ENERGY CERTIFICATES (RECs) TRANSACTED THROUGH POWER EXCHANGES, FEBRUARY 2018
Sr.No. Details of REC Transactions
IEX PXIL
Non-Solar Non Solar
A Volume of Buy Bid 390158 1968238
B Volume of Sell Bid 1966018 2820156
C Ratio of Buy Bid to Sell Bid Volume 0.20 0.70
D Market Clearing Volume (MWh) 390158 1968238
E Market Clearing Price (`/MWh) 1500 1500
Source: IEX and PXIL
Note 1: 1 REC = 1 MWh
Note 2: Forbearance and Floor Price w.e.f 1st March 2015
Type of REC Floor Price (`MWh) Forbearance Price (`MWh)
Non-Solar 1500.00 3300.00