monthly report on uk international sales compiled by webinterpret september 2015
TRANSCRIPT
15% to 20% of UK Sellers revenue comes from international
markets for retailers selling internationally.
In the first half of 2015 there was a slight decreasing trend of
between 1% and 2% in international revenue each month,
mainly caused by volatile exchange rates, GBP becoming
stronger compared to the Euro.
Sales into Germany, the number one top foreign market for
British retailers, grew by 4% during May and June. France and
Italy are growing again after a steady drop in March and April.
US has seen a decline over the last few months.
British Sellers generate the most sales in Vehicle Parts &
Accessories, Clothes, Shoes & Accessories and Home,
Furniture & DIY categories. However, looking at individual
retailers, the overall percentage of their international sales is
the highest in categories such as Mobile Phones &
Communication, Jewellery & Watches and Clothes, Shoes &
Accessories.
1
In Summary
Monthly report on UK international salescompiled by WebInterpretSeptember 2015

International sales in the first half of 2015 in the UK, DE and US
2Report on British international sales compiled by Webinterpret, September 2015
(international sales generated by British sellers in a given month) / (international sales + domestic sales generated by British sellers in the same given month) = % of international sales
Chart 1.Calculation method
UK Sellers Revenue generated by international buyers for British Sellers who sell internationally accounts for 15% to 20% of the total online
sales revenue for those retailers. Each month in the first half of 2015 has seen a slight decrease of between 1% and 2% in international revenue
for UK Sellers. This was mainly caused by the change in the exchange rate, GBP becoming stronger compared to EUR, increasing the price for
buyers in Euro countries like Italy and France. There has also been some impact from US buyers slowing in the last two months of the half.
German Sellers For German Sellers, international sales for the first half 2015 were stable and sometimes increasing, likely also due to the
currency fluctuations. The UK is the main International market for German Sellers on these platforms, the weak Euro making their products
more competitive.
USA Sellers American international online sellers are a few steps ahead when it comes to % their overall sales made internationally. This might
be caused by the buyer's trust in the quality of items imported from the United States.
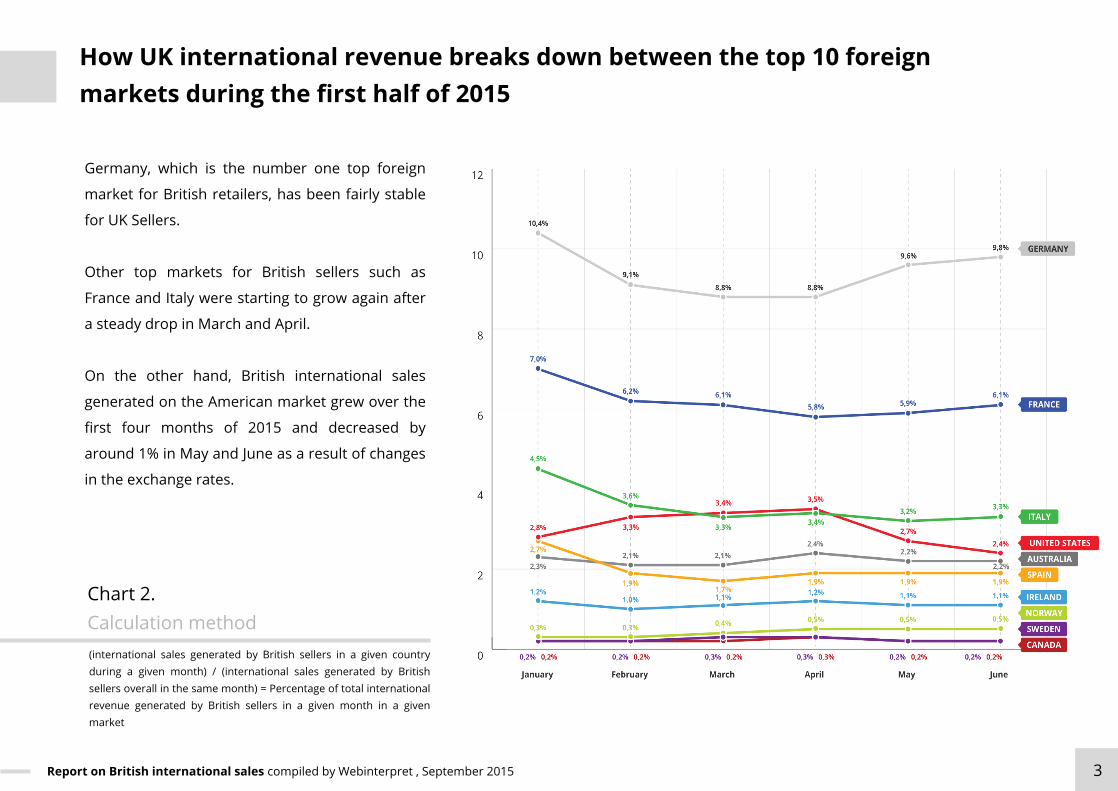
How UK international revenue breaks down between the top 10 foreign markets during the first half of 2015
3Report on British international sales compiled by Webinterpret , September 2015
(international sales generated by British sellers in a given country during a given month) / (international sales generated by British sellers overall in the same month) = Percentage of total international revenue generated by British sellers in a given month in a given market
Chart 2.Calculation method
Germany, which is the number one top foreign
market for British retailers, has been fairly stable
for UK Sellers.
Other top markets for British sellers such as
France and Italy were starting to grow again after
a steady drop in March and April.
On the other hand, British international sales
generated on the American market grew over the
first four months of 2015 and decreased by
around 1% in May and June as a result of changes
in the exchange rates.

International revenue of top 10 categories sold internationally by British sellers
4Report on British international sales compiled by Webinterpret, September 2015
(international sales of the top 10 categories sold internationally by British sellers are presented in percentages and were calculated by: (international sales of a given category in the time frame January - June 2015)/(international sales + domestic sales of the same given category in the same time frame) = % of international sales
Chart 3.Calculation method
The graph opposite lists the top 10 international
categories for British Sellers and the % of those
sellers revenue that is generated internationally.
Our analysis shows Sellers in the UK are
generating the highest international revenue in the
categories Vehicle Parts & Accessories, Clothes,
Shoes & Accessories and Home, Furniture & DIY
categories.
When looking at the amount of overall
transactions, UK Sellers are selling the most items
internationally in categories such as Mobile
Phones & Communication, Jewellery & Watches
and Clothes, Shoes & Accessories. This is a
reasonable indication that buyers from abroad
trust and like British items in these categories.

Position Country January February March April May June
1 Germany 10.4% 9.1% 8.8% 8.8% 9.6% 9.8%
2 United States
2.8% 3.3% 3.4% 3.5% 2.7% 2.4%
3 France 7.0% 6.2% 6.1% 5.8% 5.9% 6.1%
4 Italy 4.5% 3.6% 3.3% 3.4% 3.2% 3.3%
5 Australia 2.3% 2.1% 2.1% 2.4% 2.2% 2.2%
6 Spain 2.7% 1.9% 1.7% 1.9% 1.9% 1.9%
7 Ireland 1.2% 1.0% 1.1% 1.2% 1.1% 1.1%
8 Norway 0.3% 0.3% 0.4% 0.5% 0.5% 0.5%
9 Sweden 0.2% 0.2% 0.3% 0.3% 0.3% 0.3%
10 Canada 0.2% 0.2% 0.2% 0.3% 0.2% 0.2%
5Report on British international sales compiled by Webinterpret, September 2015
How British international revenue breaks down between the top 20 foreign markets during the first half of 2015
The same as in Chart 2.
Table 1.Calculation method
Ranking of the remaining top 20 foreign markets (1 - 10) for British sellers

Position Country January February March April May June
11 Denmark 0.2% 0.2% 0.2% 0.3% 0.2% 0.2%
12 Israel 0.2% 0.2% 0.2% 0.3% 0.2% 0.1%
13 Netherlands 0.2% 0.2% 0.2% 0.2% 0.2% 0.2%
14 Belgium 0.4% 0.3% 0.3% 0.3% 0.3% 0.3%
15 Finland 0.2% 0.2% 0.2% 0.2% 0.2% 0.2%
16 Portugal 0.2% 0.2% 0.1% 0.2% 0.1% 0.1%
17 Greece 0.2% 0.2% 0.1% 0.2% 0.1% 0.1%
18 Malta 0.2% 0.1% 0.1% 0.1% 0.1% 0.1%
19 Russia 0.0% 0.0% 0.1% 0.2% 0.1% 0.1%
20 Switzerland 0.2% 0.2% 0.1% 0.2% 0.2% 0.1%
6Report on British international sales compiled by Webinterpret, September 2015
How British international revenue breaks down between the top 20 foreign markets during the first half of 2015
The same as in Chart 2.
Table 1.Calculation method
Ranking of the remaining top 20 foreign markets (11 - 20) for British sellers
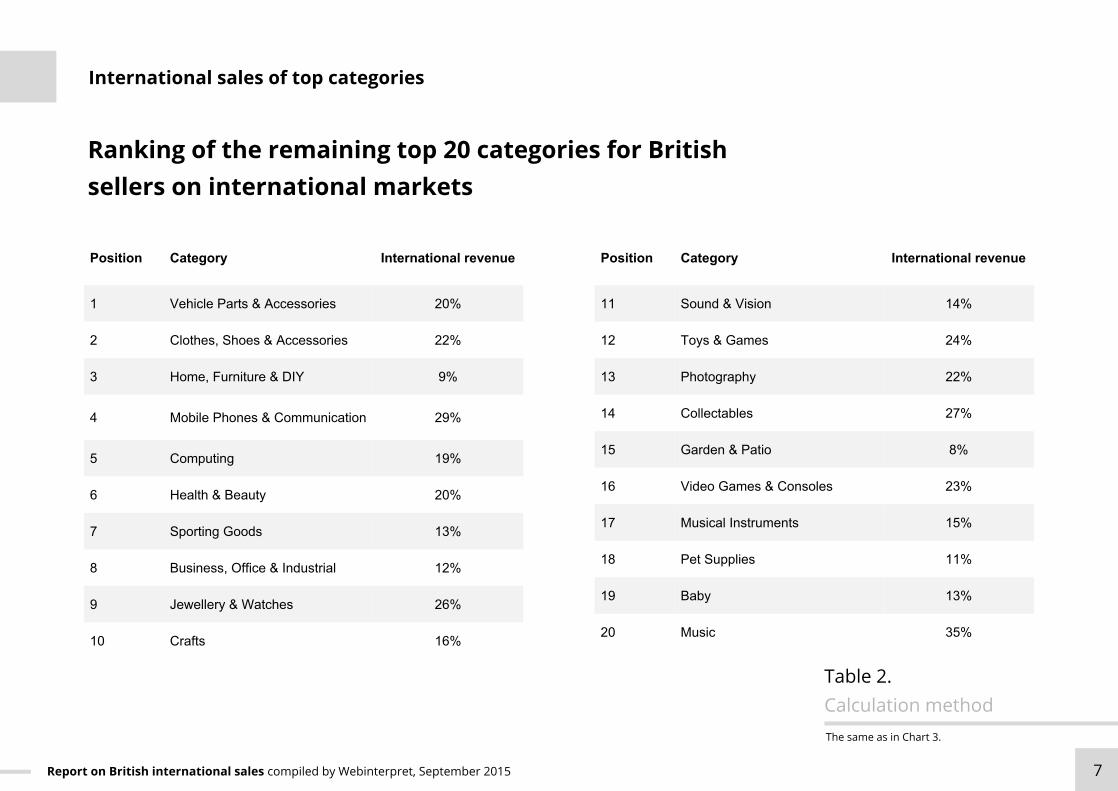
Position Category International revenue
11 Sound & Vision 14%
12 Toys & Games 24%
13 Photography 22%
14 Collectables 27%
15 Garden & Patio 8%
16 Video Games & Consoles 23%
17 Musical Instruments 15%
18 Pet Supplies 11%
19 Baby 13%
20 Music 35%
7Report on British international sales compiled by Webinterpret, September 2015
International sales of top categories
The same as in Chart 3.
Table 2.Calculation method
Ranking of the remaining top 20 categories for British sellers on international markets
Position Category International revenue
1 Vehicle Parts & Accessories 20%
2 Clothes, Shoes & Accessories 22%
3 Home, Furniture & DIY 9%
4 Mobile Phones & Communication 29%
5 Computing 19%
6 Health & Beauty 20%
7 Sporting Goods 13%
8 Business, Office & Industrial 12%
9 Jewellery & Watches 26%
10 Crafts 16%

PUBLISHED BY
WebInterpret, 6 Rue Soutrane,
06560 Valbonne, France
Copyright © 2015 WebInterpret. All rights
reserved. May be shared with copyright and
credit left intact.
WebInterpret
Full-stack cross border sales solution for
online retailers. Take your international sales
to the next level.
Stay in touch with WebInterpret