monthly summary – february 2016o general signup (#49) began accepting offers december 1 and ended...
TRANSCRIPT
MONTHLY SUMMARY – FEBRUARY 2016 Sign-up Type Contracts Farms Acres Annual Rental Payments a/ ($Million) ($/Acre) General 218,279 152,466 16,923,744 $867 $51.21 Continuous Non-CREP 338,606 201,297 5,234,693 $615 $117.43 CREP 68,778 45,773 1,163,951 $168 $144.50 Farmable Wetland 16,676 12,770 387,805 $47 $121.66 Total Continuous 424,060 245,256 b/ 6,786,448 $830 $122.30 Total CRP 642,339 360,902 b/ 23,709,982 $1,697 $71.56 a/ Approximates October 2016 payments, before adjustments for haying/grazing, non-compliance, terminations, part-year contracts, and contracts not yet recorded. b/ Number of farms not additive across sign-up types because farms may participate in multiple sign-up types.
--1--
U.S. Department of Agriculture, Farm Service Agency USDA is an equal opportunity provider and employer
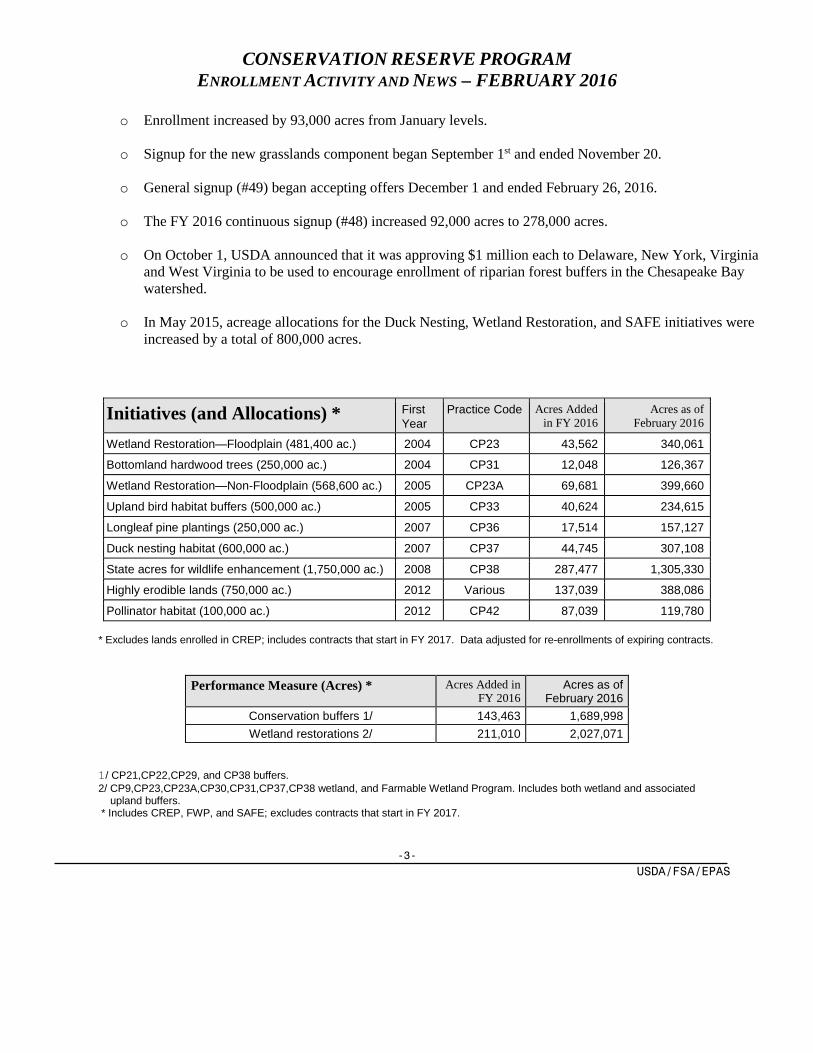
0100200300400500600700800900
1,00
0 Ac
res
Months Since Sign-ups Began (*may include contracts starting in FY 2017)
Continuous CRP Enrollment Progress Signups 44, 46, 47, and 48 *
#44 (FY 2013)
#46 (FY 2014)
#47 (FY 2015)
#48 (FY 2016)

CONTINUOUS CRP ENROLLMENT SINCE INCEPTION * THROUGH FEBRUARY 2016
1/ Contracts that exited 2007-2015 and were not re-enrolled or that dropped out before normal contract termination. * Includes contracts approved but not yet started.
-2- USDA/FSA/EPAS
1.15
1.98
1.06
0.51
0.54
0.44
1.66
2.52
1.50
0.00
0.50
1.00
1.50
2.00
2.50
3.00
2016 2017 2018
Expirations (Million Acres)
Continuous
General
Sign-up Non-CREP CREP FWP Total 1997 (#14) 554,842 0 0 554,8421998 (#17) 198,191 13,558 0 211,7491999 (#19) 217,063 44,301 0 261,3642000 (#21/22) 251,883 65,036 0 316,9192001 (#23) 291,680 139,543 25,852 457,0752002 (#24) 226,841 163,784 44,612 435,2372003 (#25/27) 293,532 118,264 26,966 438,7622004 (#28) 166,868 66,945 20,557 254,3702005 (#30) 227,228 151,515 18,907 397,6502006 (#31) 199,335 128,647 22,629 350,6112007 (#35) 380,703 142,844 16,005 539,5522008 (#36) 275,215 116,617 8,715 400,5472009 (#37) 413,481 41,487 17,766 472,7342010 (#38) 506,313 63,577 55,663 625,5532011 (#40) 383,022 67,939 45,048 496,0092012 (#42) 511,915 62,088 53,543 627,5452013 (#44) 477,401 49,702 7,691 534,7932014 (#46) 485,684 32,829 12,216 530,7292015 (#47) 791,715 39,129 31,747 862,5912016 (#48) 256,671 6,301 14,700 277,672Expirations 1/ -1,874,890 -350,155 -61,588 -2,286,633Current Enrollment 5,234,693 1,163,951 387,805 6,786,449
CONSERVATION RESERVE PROGRAM
ENROLLMENT ACTIVITY AND NEWS – FEBRUARY 2016
o Enrollment increased by 93,000 acres from January levels.
o Signup for the new grasslands component began September 1st and ended November 20.
o General signup (#49) began accepting offers December 1 and ended February 26, 2016.
o The FY 2016 continuous signup (#48) increased 92,000 acres to 278,000 acres.
o On October 1, USDA announced that it was approving $1 million each to Delaware, New York, Virginia and West Virginia to be used to encourage enrollment of riparian forest buffers in the Chesapeake Bay watershed.
o In May 2015, acreage allocations for the Duck Nesting, Wetland Restoration, and SAFE initiatives were increased by a total of 800,000 acres.
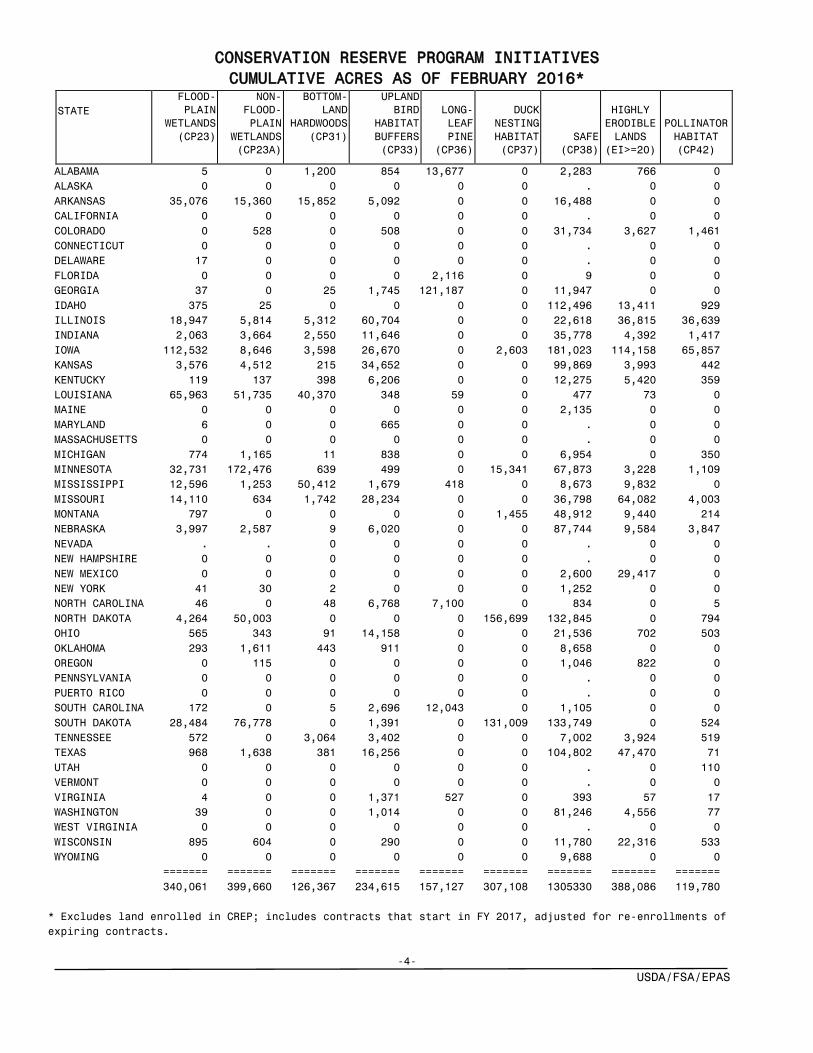
Initiatives (and Allocations) * First Year
Practice Code Acres Added in FY 2016
Acres as of February 2016
Wetland Restoration—Floodplain (481,400 ac.) 2004 CP23 43,562 340,061
Bottomland hardwood trees (250,000 ac.) 2004 CP31 12,048 126,367
Wetland Restoration—Non-Floodplain (568,600 ac.) 2005 CP23A 69,681 399,660
Upland bird habitat buffers (500,000 ac.) 2005 CP33 40,624 234,615
Longleaf pine plantings (250,000 ac.) 2007 CP36 17,514 157,127
Duck nesting habitat (600,000 ac.) 2007 CP37 44,745 307,108
State acres for wildlife enhancement (1,750,000 ac.) 2008 CP38 287,477 1,305,330
Highly erodible lands (750,000 ac.) 2012 Various 137,039 388,086
Pollinator habitat (100,000 ac.) 2012 CP42 87,039 119,780 * Excludes lands enrolled in CREP; includes contracts that start in FY 2017. Data adjusted for re-enrollments of expiring contracts.
Performance Measure (Acres) * Acres Added in
FY 2016 Acres as of
February 2016 Conservation buffers 1/ 143,463 1,689,998 Wetland restorations 2/ 211,010 2,027,071
1/ CP21,CP22,CP29, and CP38 buffers. 2/ CP9,CP23,CP23A,CP30,CP31,CP37,CP38 wetland, and Farmable Wetland Program. Includes both wetland and associated upland buffers. * Includes CREP, FWP, and SAFE; excludes contracts that start in FY 2017.
-3- USDA/FSA/EPAS
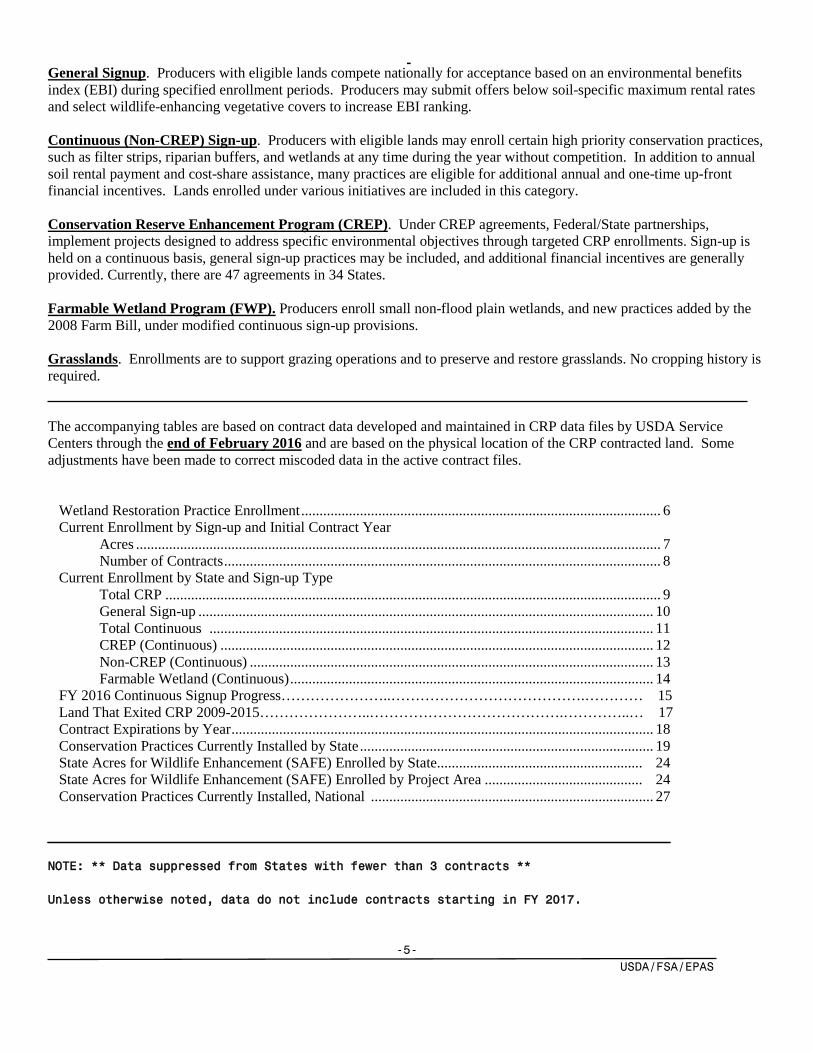
CONSERVATION RESERVE PROGRAM INITIATIVES CUMULATIVE ACRES AS OF FEBRUARY 2016*
STATE
FLOOD-PLAIN
WETLANDS (CP23)
NON- FLOOD-PLAIN
WETLANDS (CP23A)
BOTTOM-LAND
HARDWOODS (CP31)
UPLAND BIRD
HABITAT BUFFERS (CP33)
LONG-LEAF PINE
(CP36)
DUCK
NESTING HABITAT (CP37)
SAFE (CP38)
HIGHLY ERODIBLE LANDS
(EI>=20)
POLLINATOR HABITAT (CP42)
ALABAMA 5 0 1,200 854 13,677 0 2,283 766 0 ALASKA 0 0 0 0 0 0 . 0 0 ARKANSAS 35,076 15,360 15,852 5,092 0 0 16,488 0 0 CALIFORNIA 0 0 0 0 0 0 . 0 0 COLORADO 0 528 0 508 0 0 31,734 3,627 1,461 CONNECTICUT 0 0 0 0 0 0 . 0 0 DELAWARE 17 0 0 0 0 0 . 0 0 FLORIDA 0 0 0 0 2,116 0 9 0 0 GEORGIA 37 0 25 1,745 121,187 0 11,947 0 0 IDAHO 375 25 0 0 0 0 112,496 13,411 929 ILLINOIS 18,947 5,814 5,312 60,704 0 0 22,618 36,815 36,639 INDIANA 2,063 3,664 2,550 11,646 0 0 35,778 4,392 1,417 IOWA 112,532 8,646 3,598 26,670 0 2,603 181,023 114,158 65,857 KANSAS 3,576 4,512 215 34,652 0 0 99,869 3,993 442 KENTUCKY 119 137 398 6,206 0 0 12,275 5,420 359 LOUISIANA 65,963 51,735 40,370 348 59 0 477 73 0 MAINE 0 0 0 0 0 0 2,135 0 0 MARYLAND 6 0 0 665 0 0 . 0 0 MASSACHUSETTS 0 0 0 0 0 0 . 0 0 MICHIGAN 774 1,165 11 838 0 0 6,954 0 350 MINNESOTA 32,731 172,476 639 499 0 15,341 67,873 3,228 1,109 MISSISSIPPI 12,596 1,253 50,412 1,679 418 0 8,673 9,832 0 MISSOURI 14,110 634 1,742 28,234 0 0 36,798 64,082 4,003 MONTANA 797 0 0 0 0 1,455 48,912 9,440 214 NEBRASKA 3,997 2,587 9 6,020 0 0 87,744 9,584 3,847 NEVADA . . 0 0 0 0 . 0 0 NEW HAMPSHIRE 0 0 0 0 0 0 . 0 0 NEW MEXICO 0 0 0 0 0 0 2,600 29,417 0 NEW YORK 41 30 2 0 0 0 1,252 0 0 NORTH CAROLINA 46 0 48 6,768 7,100 0 834 0 5 NORTH DAKOTA 4,264 50,003 0 0 0 156,699 132,845 0 794 OHIO 565 343 91 14,158 0 0 21,536 702 503 OKLAHOMA 293 1,611 443 911 0 0 8,658 0 0 OREGON 0 115 0 0 0 0 1,046 822 0 PENNSYLVANIA 0 0 0 0 0 0 . 0 0 PUERTO RICO 0 0 0 0 0 0 . 0 0 SOUTH CAROLINA 172 0 5 2,696 12,043 0 1,105 0 0 SOUTH DAKOTA 28,484 76,778 0 1,391 0 131,009 133,749 0 524 TENNESSEE 572 0 3,064 3,402 0 0 7,002 3,924 519 TEXAS 968 1,638 381 16,256 0 0 104,802 47,470 71 UTAH 0 0 0 0 0 0 . 0 110 VERMONT 0 0 0 0 0 0 . 0 0 VIRGINIA 4 0 0 1,371 527 0 393 57 17 WASHINGTON 39 0 0 1,014 0 0 81,246 4,556 77 WEST VIRGINIA 0 0 0 0 0 0 . 0 0 WISCONSIN 895 604 0 290 0 0 11,780 22,316 533 WYOMING 0 0 0 0 0 0 9,688 0 0 ======= ======= ======= ======= ======= ======= ======= ======= ======= 340,061 399,660 126,367 234,615 157,127 307,108 1305330 388,086 119,780 * Excludes land enrolled in CREP; includes contracts that start in FY 2017, adjusted for re-enrollments of expiring contracts.
-4- USDA/FSA/EPAS
General Signup. Producers with eligible lands compete nationally for acceptance based on an environmental benefits index (EBI) during specified enrollment periods. Producers may submit offers below soil-specific maximum rental rates and select wildlife-enhancing vegetative covers to increase EBI ranking. Continuous (Non-CREP) Sign-up. Producers with eligible lands may enroll certain high priority conservation practices, such as filter strips, riparian buffers, and wetlands at any time during the year without competition. In addition to annual soil rental payment and cost-share assistance, many practices are eligible for additional annual and one-time up-front financial incentives. Lands enrolled under various initiatives are included in this category. Conservation Reserve Enhancement Program (CREP). Under CREP agreements, Federal/State partnerships, implement projects designed to address specific environmental objectives through targeted CRP enrollments. Sign-up is held on a continuous basis, general sign-up practices may be included, and additional financial incentives are generally provided. Currently, there are 47 agreements in 34 States. Farmable Wetland Program (FWP). Producers enroll small non-flood plain wetlands, and new practices added by the 2008 Farm Bill, under modified continuous sign-up provisions. Grasslands. Enrollments are to support grazing operations and to preserve and restore grasslands. No cropping history is required. The accompanying tables are based on contract data developed and maintained in CRP data files by USDA Service Centers through the end of February 2016 and are based on the physical location of the CRP contracted land. Some adjustments have been made to correct miscoded data in the active contract files. Wetland Restoration Practice Enrollment .................................................................................................. 6 Current Enrollment by Sign-up and Initial Contract Year Acres ............................................................................................................................................... 7 Number of Contracts ....................................................................................................................... 8 Current Enrollment by State and Sign-up Type Total CRP ....................................................................................................................................... 9 General Sign-up ............................................................................................................................ 10 Total Continuous ......................................................................................................................... 11 CREP (Continuous) ...................................................................................................................... 12 Non-CREP (Continuous) .............................................................................................................. 13 Farmable Wetland (Continuous) ................................................................................................... 14 FY 2016 Continuous Signup Progress…………………..………………………………….………… 15 Land That Exited CRP 2009-2015…………………..………………………………….…………..… 17 Contract Expirations by Year ................................................................................................................... 18 Conservation Practices Currently Installed by State ................................................................................ 19 State Acres for Wildlife Enhancement (SAFE) Enrolled by State ........................................................ 24 State Acres for Wildlife Enhancement (SAFE) Enrolled by Project Area ........................................... 24 Conservation Practices Currently Installed, National ............................................................................. 27 NOTE: ** Data suppressed from States with fewer than 3 contracts ** Unless otherwise noted, data do not include contracts starting in FY 2017.
-5- USDA/FSA/EPAS
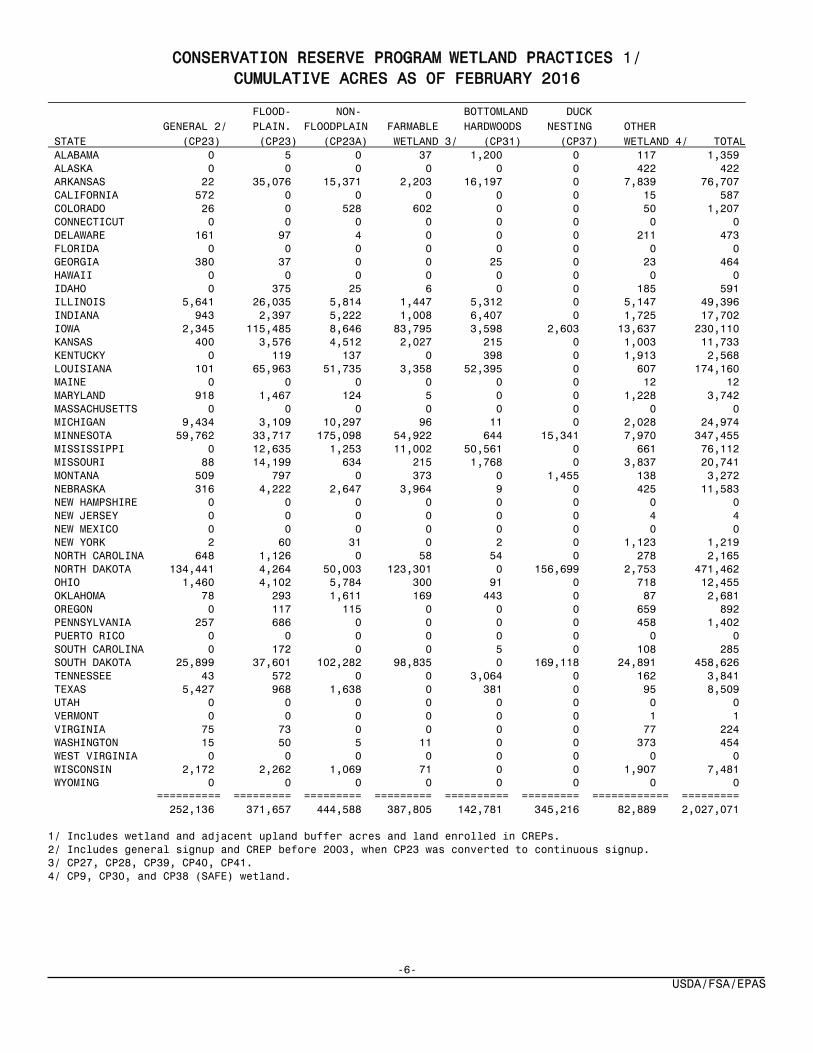
CONSERVATION RESERVE PROGRAM WETLAND PRACTICES 1/ CUMULATIVE ACRES AS OF FEBRUARY 2016
FLOOD- NON- BOTTOMLAND DUCK GENERAL 2/ PLAIN. FLOODPLAIN FARMABLE HARDWOODS NESTING OTHER STATE (CP23) (CP23) (CP23A) WETLAND 3/ (CP31) (CP37) WETLAND 4/ TOTAL ALABAMA 0 5 0 37 1,200 0 117 1,359 ALASKA 0 0 0 0 0 0 422 422 ARKANSAS 22 35,076 15,371 2,203 16,197 0 7,839 76,707 CALIFORNIA 572 0 0 0 0 0 15 587 COLORADO 26 0 528 602 0 0 50 1,207 CONNECTICUT 0 0 0 0 0 0 0 0 DELAWARE 161 97 4 0 0 0 211 473 FLORIDA 0 0 0 0 0 0 0 0 GEORGIA 380 37 0 0 25 0 23 464 HAWAII 0 0 0 0 0 0 0 0 IDAHO 0 375 25 6 0 0 185 591 ILLINOIS 5,641 26,035 5,814 1,447 5,312 0 5,147 49,396 INDIANA 943 2,397 5,222 1,008 6,407 0 1,725 17,702 IOWA 2,345 115,485 8,646 83,795 3,598 2,603 13,637 230,110 KANSAS 400 3,576 4,512 2,027 215 0 1,003 11,733 KENTUCKY 0 119 137 0 398 0 1,913 2,568 LOUISIANA 101 65,963 51,735 3,358 52,395 0 607 174,160 MAINE 0 0 0 0 0 0 12 12 MARYLAND 918 1,467 124 5 0 0 1,228 3,742 MASSACHUSETTS 0 0 0 0 0 0 0 0 MICHIGAN 9,434 3,109 10,297 96 11 0 2,028 24,974 MINNESOTA 59,762 33,717 175,098 54,922 644 15,341 7,970 347,455 MISSISSIPPI 0 12,635 1,253 11,002 50,561 0 661 76,112 MISSOURI 88 14,199 634 215 1,768 0 3,837 20,741 MONTANA 509 797 0 373 0 1,455 138 3,272 NEBRASKA 316 4,222 2,647 3,964 9 0 425 11,583 NEW HAMPSHIRE 0 0 0 0 0 0 0 0 NEW JERSEY 0 0 0 0 0 0 4 4 NEW MEXICO 0 0 0 0 0 0 0 0 NEW YORK 2 60 31 0 2 0 1,123 1,219 NORTH CAROLINA 648 1,126 0 58 54 0 278 2,165 NORTH DAKOTA 134,441 4,264 50,003 123,301 0 156,699 2,753 471,462 OHIO 1,460 4,102 5,784 300 91 0 718 12,455 OKLAHOMA 78 293 1,611 169 443 0 87 2,681 OREGON 0 117 115 0 0 0 659 892 PENNSYLVANIA 257 686 0 0 0 0 458 1,402 PUERTO RICO 0 0 0 0 0 0 0 0 SOUTH CAROLINA 0 172 0 0 5 0 108 285 SOUTH DAKOTA 25,899 37,601 102,282 98,835 0 169,118 24,891 458,626 TENNESSEE 43 572 0 0 3,064 0 162 3,841 TEXAS 5,427 968 1,638 0 381 0 95 8,509 UTAH 0 0 0 0 0 0 0 0 VERMONT 0 0 0 0 0 0 1 1 VIRGINIA 75 73 0 0 0 0 77 224 WASHINGTON 15 50 5 11 0 0 373 454 WEST VIRGINIA 0 0 0 0 0 0 0 0 WISCONSIN 2,172 2,262 1,069 71 0 0 1,907 7,481 WYOMING 0 0 0 0 0 0 0 0 ========== ========= ========= ========= ========== ========= ============ ========= 252,136 371,657 444,588 387,805 142,781 345,216 82,889 2,027,071 1/ Includes wetland and adjacent upland buffer acres and land enrolled in CREPs. 2/ Includes general signup and CREP before 2003, when CP23 was converted to continuous signup. 3/ CP27, CP28, CP39, CP40, CP41. 4/ CP9, CP30, and CP38 (SAFE) wetland.
-6- USDA/FSA/EPAS
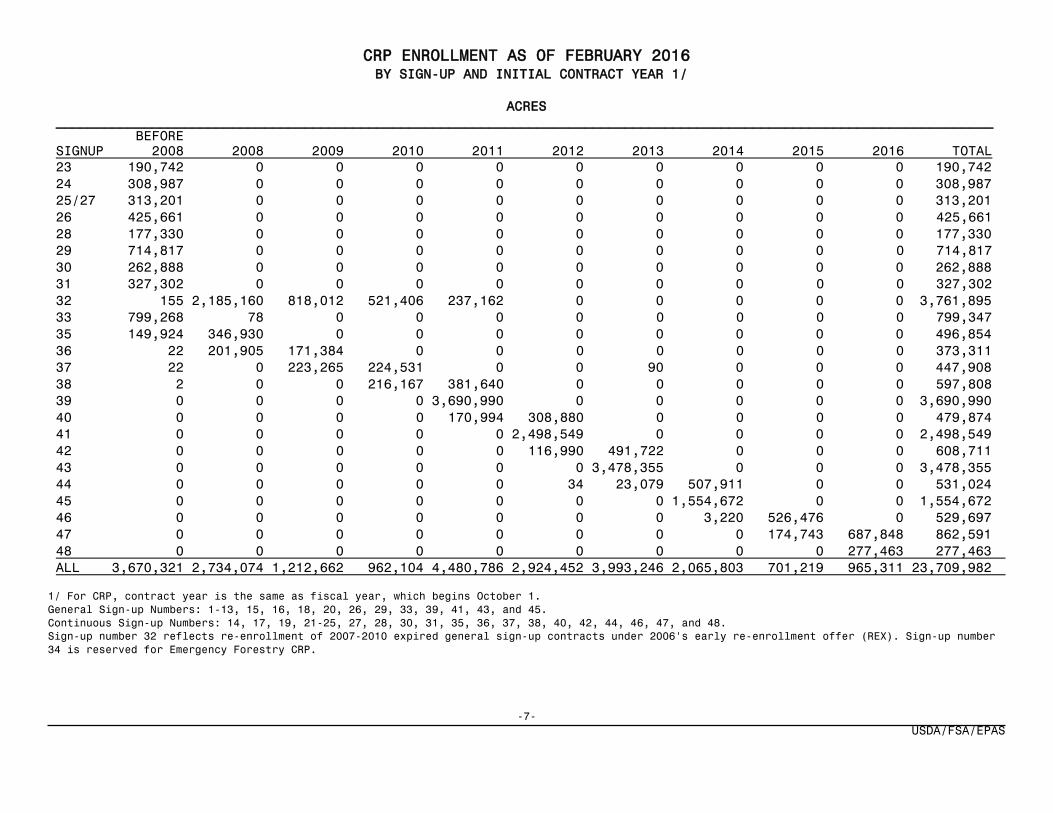
CRP ENROLLMENT AS OF FEBRUARY 2016 BY SIGN-UP AND INITIAL CONTRACT YEAR 1/
ACRES
_____________________________________________________________________________________________________________________ BEFORE SIGNUP 2008 2008 2009 2010 2011 2012 2013 2014 2015 2016 TOTAL 23 190,742 0 0 0 0 0 0 0 0 0 190,742 24 308,987 0 0 0 0 0 0 0 0 0 308,987 25/27 313,201 0 0 0 0 0 0 0 0 0 313,201 26 425,661 0 0 0 0 0 0 0 0 0 425,661 28 177,330 0 0 0 0 0 0 0 0 0 177,330 29 714,817 0 0 0 0 0 0 0 0 0 714,817 30 262,888 0 0 0 0 0 0 0 0 0 262,888 31 327,302 0 0 0 0 0 0 0 0 0 327,302 32 155 2,185,160 818,012 521,406 237,162 0 0 0 0 0 3,761,895 33 799,268 78 0 0 0 0 0 0 0 0 799,347 35 149,924 346,930 0 0 0 0 0 0 0 0 496,854 36 22 201,905 171,384 0 0 0 0 0 0 0 373,311 37 22 0 223,265 224,531 0 0 90 0 0 0 447,908 38 2 0 0 216,167 381,640 0 0 0 0 0 597,808 39 0 0 0 0 3,690,990 0 0 0 0 0 3,690,990 40 0 0 0 0 170,994 308,880 0 0 0 0 479,874 41 0 0 0 0 0 2,498,549 0 0 0 0 2,498,549 42 0 0 0 0 0 116,990 491,722 0 0 0 608,711 43 0 0 0 0 0 0 3,478,355 0 0 0 3,478,355 44 0 0 0 0 0 34 23,079 507,911 0 0 531,024 45 0 0 0 0 0 0 0 1,554,672 0 0 1,554,672 46 0 0 0 0 0 0 0 3,220 526,476 0 529,697 47 0 0 0 0 0 0 0 0 174,743 687,848 862,591 48 0 0 0 0 0 0 0 0 0 277,463 277,463 ALL 3,670,321 2,734,074 1,212,662 962,104 4,480,786 2,924,452 3,993,246 2,065,803 701,219 965,311 23,709,982 1/ For CRP, contract year is the same as fiscal year, which begins October 1. General Sign-up Numbers: 1-13, 15, 16, 18, 20, 26, 29, 33, 39, 41, 43, and 45. Continuous Sign-up Numbers: 14, 17, 19, 21-25, 27, 28, 30, 31, 35, 36, 37, 38, 40, 42, 44, 46, 47, and 48. Sign-up number 32 reflects re-enrollment of 2007-2010 expired general sign-up contracts under 2006's early re-enrollment offer (REX). Sign-up number 34 is reserved for Emergency Forestry CRP.
-7- USDA/FSA/EPAS

CRP ENROLLMENT AS OF FEBRUARY 2016 BY SIGN-UP AND INITIAL CONTRACT YEAR 1/
NUMBER OF CONTRACTS
______________________________________________________________________________________________________________________ BEFORE SIGNUP 2007 2007 2008 2009 2010 2011 2012 2013 2014 2015 TOTAL 23 14,338 0 0 0 0 0 0 0 0 0 14,338 24 25,511 0 0 0 0 0 0 0 0 0 25,511 25/27 22,170 0 0 0 0 0 0 0 0 0 22,170 26 9,270 0 0 0 0 0 0 0 0 0 9,270 28 14,106 0 0 0 0 0 0 0 0 0 14,106 29 11,545 0 0 0 0 0 0 0 0 0 11,545 30 16,849 0 0 0 0 0 0 0 0 0 16,849 31 29,614 0 0 0 0 0 0 0 0 0 29,614 32 4 27,727 13,104 7,998 4,998 0 0 0 0 0 53,831 33 15,423 2 0 0 0 0 0 0 0 0 15,425 35 13,551 20,389 0 0 0 0 0 0 0 0 33,940 36 2 15,452 11,941 0 0 0 0 0 0 0 27,395 37 1 0 15,657 13,913 0 0 2 0 0 0 29,573 38 1 0 0 13,627 18,984 0 0 0 0 0 32,612 39 0 0 0 0 40,176 0 0 0 0 0 40,176 40 0 0 0 0 10,373 20,431 0 0 0 0 30,804 41 0 0 0 0 0 26,900 0 0 0 0 26,900 42 0 0 0 0 0 7,195 27,479 0 0 0 34,674 43 0 0 0 0 0 0 38,304 0 0 0 38,304 44 0 0 0 0 0 1 947 28,411 0 0 29,359 45 0 0 0 0 0 0 0 22,831 0 0 22,831 46 0 0 0 0 0 0 0 214 26,185 0 26,399 47 0 0 0 0 0 0 0 0 8,598 38,502 47,100 48 0 0 0 0 0 0 0 0 0 9,611 9,611 ALL 172,385 63,570 40,702 35,538 74,531 54,527 66,732 51,456 34,783 48,113 642,337 1/ For CRP, contract year is the same as fiscal year, which begins October 1. General Sign-up Numbers: 1-13, 15, 16, 18, 20, 26, 29, 33, 39, 41, 43, and 45. Continuous Sign-up Numbers: 14, 17, 19, 21-25, 27, 28, 30, 31, 35, 36, 37, 38, 40, 42, 44, 46, 47, and 48. Sign-up number 32 reflects re-enrollment of 2007-2010 expired general sign-up contracts under 2006's early re-enrollment offer (REX). Sign-up number 34 is reserved for Emergency Forestry CRP.
-8- USDA/FSA/EPAS
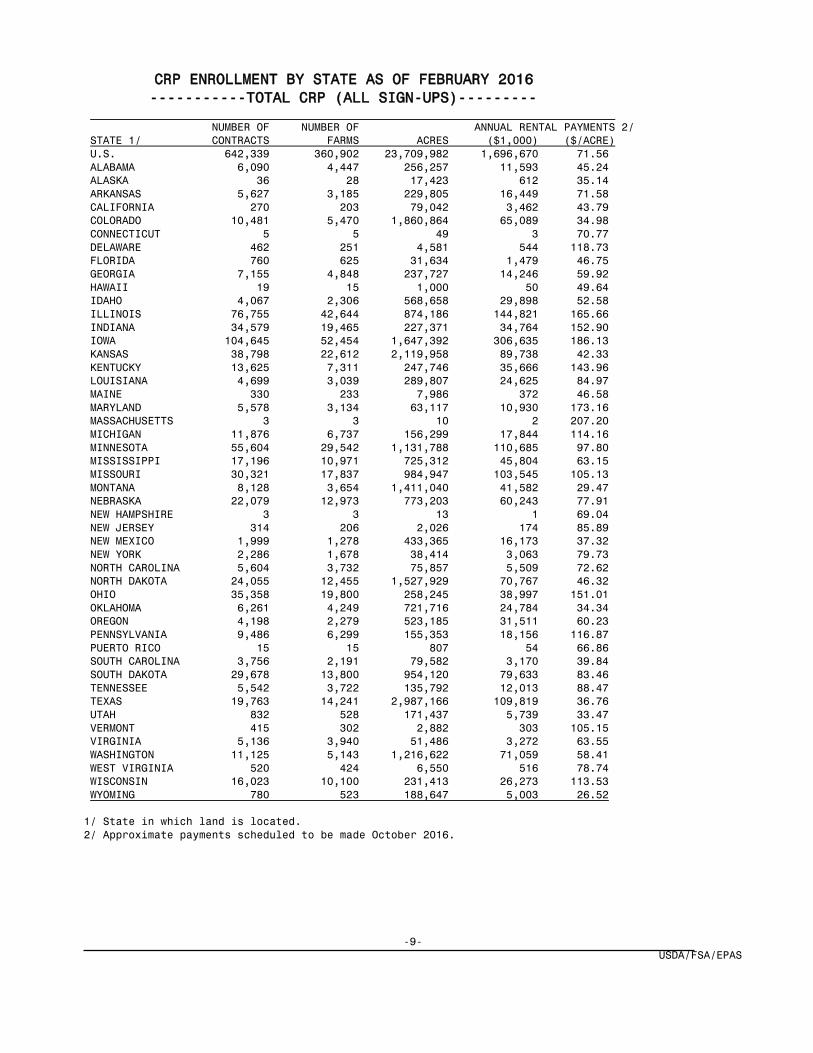
CRP ENROLLMENT BY STATE AS OF FEBRUARY 2016 -----------TOTAL CRP (ALL SIGN-UPS)--------- NUMBER OF NUMBER OF ANNUAL RENTAL PAYMENTS 2/ STATE 1/ CONTRACTS FARMS ACRES ($1,000) ($/ACRE) U.S. 642,339 360,902 23,709,982 1,696,670 71.56 ALABAMA 6,090 4,447 256,257 11,593 45.24 ALASKA 36 28 17,423 612 35.14 ARKANSAS 5,627 3,185 229,805 16,449 71.58 CALIFORNIA 270 203 79,042 3,462 43.79 COLORADO 10,481 5,470 1,860,864 65,089 34.98 CONNECTICUT 5 5 49 3 70.77 DELAWARE 462 251 4,581 544 118.73 FLORIDA 760 625 31,634 1,479 46.75 GEORGIA 7,155 4,848 237,727 14,246 59.92 HAWAII 19 15 1,000 50 49.64 IDAHO 4,067 2,306 568,658 29,898 52.58 ILLINOIS 76,755 42,644 874,186 144,821 165.66 INDIANA 34,579 19,465 227,371 34,764 152.90 IOWA 104,645 52,454 1,647,392 306,635 186.13 KANSAS 38,798 22,612 2,119,958 89,738 42.33 KENTUCKY 13,625 7,311 247,746 35,666 143.96 LOUISIANA 4,699 3,039 289,807 24,625 84.97 MAINE 330 233 7,986 372 46.58 MARYLAND 5,578 3,134 63,117 10,930 173.16 MASSACHUSETTS 3 3 10 2 207.20 MICHIGAN 11,876 6,737 156,299 17,844 114.16 MINNESOTA 55,604 29,542 1,131,788 110,685 97.80 MISSISSIPPI 17,196 10,971 725,312 45,804 63.15 MISSOURI 30,321 17,837 984,947 103,545 105.13 MONTANA 8,128 3,654 1,411,040 41,582 29.47 NEBRASKA 22,079 12,973 773,203 60,243 77.91 NEW HAMPSHIRE 3 3 13 1 69.04 NEW JERSEY 314 206 2,026 174 85.89 NEW MEXICO 1,999 1,278 433,365 16,173 37.32 NEW YORK 2,286 1,678 38,414 3,063 79.73 NORTH CAROLINA 5,604 3,732 75,857 5,509 72.62 NORTH DAKOTA 24,055 12,455 1,527,929 70,767 46.32 OHIO 35,358 19,800 258,245 38,997 151.01 OKLAHOMA 6,261 4,249 721,716 24,784 34.34 OREGON 4,198 2,279 523,185 31,511 60.23 PENNSYLVANIA 9,486 6,299 155,353 18,156 116.87 PUERTO RICO 15 15 807 54 66.86 SOUTH CAROLINA 3,756 2,191 79,582 3,170 39.84 SOUTH DAKOTA 29,678 13,800 954,120 79,633 83.46 TENNESSEE 5,542 3,722 135,792 12,013 88.47 TEXAS 19,763 14,241 2,987,166 109,819 36.76 UTAH 832 528 171,437 5,739 33.47 VERMONT 415 302 2,882 303 105.15 VIRGINIA 5,136 3,940 51,486 3,272 63.55 WASHINGTON 11,125 5,143 1,216,622 71,059 58.41 WEST VIRGINIA 520 424 6,550 516 78.74 WISCONSIN 16,023 10,100 231,413 26,273 113.53 WYOMING 780 523 188,647 5,003 26.52 1/ State in which land is located. 2/ Approximate payments scheduled to be made October 2016.
-9- USDA/FSA/EPAS

CRP ENROLLMENT BY STATE AS OF FEBRUARY 2016 ---------------GENERAL SIGN-UP------------- - NUMBER OF NUMBER OF ANNUAL RENTAL PAYMENTS 2/ STATE 1/ CONTRACTS FARMS ACRES ($1,000) ($/ACRE) U.S. 218,279 152,466 16,923,744 866,707 51.21 ALABAMA 4,459 3,349 205,392 8,984 43.74 ALASKA 31 23 16,951 581 34.28 ARKANSAS 1,280 943 69,197 4,158 60.09 CALIFORNIA 230 168 77,731 3,361 43.24 COLORADO 9,207 4,941 1,787,694 59,894 33.50 CONNECTICUT 4 4 47 3 70.88 DELAWARE 23 19 325 26 80.69 FLORIDA 696 580 29,445 1,350 45.84 GEORGIA 2,799 2,027 100,583 5,414 53.83 HAWAII 0 0 0 0 . IDAHO 2,979 1,785 418,678 20,978 50.11 ILLINOIS 16,700 12,263 364,140 42,107 115.63 INDIANA 4,255 3,437 83,191 8,735 105.00 IOWA 22,929 16,794 715,989 96,226 134.40 KANSAS 24,225 16,149 1,908,065 77,287 40.51 KENTUCKY 2,793 2,070 90,288 9,275 102.73 LOUISIANA 1,135 880 72,590 3,884 53.51 MAINE 177 130 5,667 212 37.45 MARYLAND 197 169 4,260 334 78.36 MASSACHUSETTS 0 0 0 0 . MICHIGAN 2,472 2,050 62,342 5,057 81.11 MINNESOTA 15,045 10,952 529,342 37,224 70.32 MISSISSIPPI 8,445 6,405 453,958 23,444 51.64 MISSOURI 15,183 10,835 733,946 73,942 100.75 MONTANA 6,622 3,105 1,241,555 35,899 28.91 NEBRASKA 8,093 5,743 537,135 31,048 57.80 NEW HAMPSHIRE 0 0 0 0 . NEW JERSEY 22 20 541 23 42.26 NEW MEXICO 1,789 1,162 396,247 14,858 37.50 NEW YORK 692 546 18,453 818 44.33 NORTH CAROLINA 1,968 1,552 36,612 1,878 51.29 NORTH DAKOTA 9,770 6,341 936,956 33,503 35.76 OHIO 3,624 3,007 75,670 6,620 87.49 OKLAHOMA 5,845 3,996 705,151 24,089 34.16 OREGON 2,262 1,323 469,063 27,053 57.67 PENNSYLVANIA 312 269 8,513 422 49.54 PUERTO RICO 10 10 341 26 76.23 SOUTH CAROLINA 1,542 1,126 50,366 1,709 33.94 SOUTH DAKOTA 3,752 2,545 303,786 15,362 50.57 TENNESSEE 3,140 2,461 103,994 8,767 84.30 TEXAS 17,516 12,750 2,774,914 101,253 36.49 UTAH 811 514 171,053 5,721 33.45 VERMONT 2 2 52 4 73.17 VIRGINIA 984 811 21,536 918 42.62 WASHINGTON 6,499 3,346 1,027,031 56,504 55.02 WEST VIRGINIA 8 7 325 13 40.53 WISCONSIN 7,133 5,449 141,423 13,245 93.65 WYOMING 618 407 173,059 4,498 25.99 1/ State in which land is located. 2/ Payments scheduled to be made October 2016.
-10- USDA/FSA/EPAS
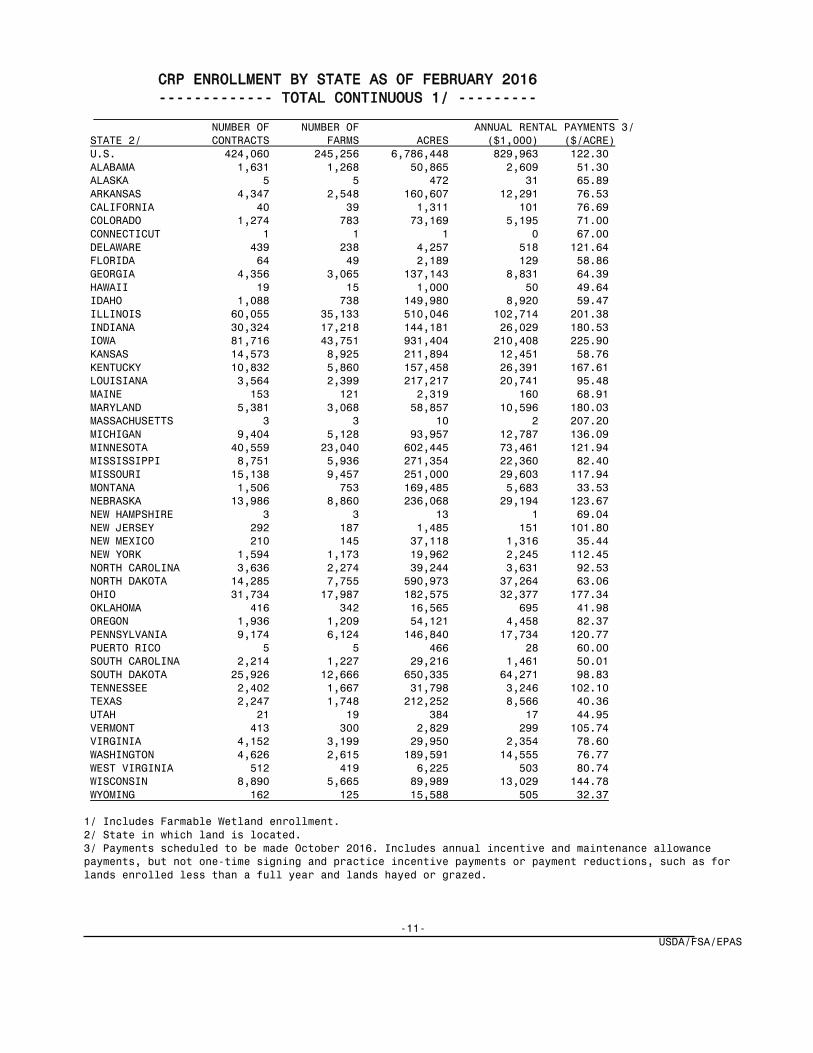
CRP ENROLLMENT BY STATE AS OF FEBRUARY 2016 ------------- TOTAL CONTINUOUS 1/ --------- NUMBER OF NUMBER OF ANNUAL RENTAL PAYMENTS 3/ STATE 2/ CONTRACTS FARMS ACRES ($1,000) ($/ACRE) U.S. 424,060 245,256 6,786,448 829,963 122.30 ALABAMA 1,631 1,268 50,865 2,609 51.30 ALASKA 5 5 472 31 65.89 ARKANSAS 4,347 2,548 160,607 12,291 76.53 CALIFORNIA 40 39 1,311 101 76.69 COLORADO 1,274 783 73,169 5,195 71.00 CONNECTICUT 1 1 1 0 67.00 DELAWARE 439 238 4,257 518 121.64 FLORIDA 64 49 2,189 129 58.86 GEORGIA 4,356 3,065 137,143 8,831 64.39 HAWAII 19 15 1,000 50 49.64 IDAHO 1,088 738 149,980 8,920 59.47 ILLINOIS 60,055 35,133 510,046 102,714 201.38 INDIANA 30,324 17,218 144,181 26,029 180.53 IOWA 81,716 43,751 931,404 210,408 225.90 KANSAS 14,573 8,925 211,894 12,451 58.76 KENTUCKY 10,832 5,860 157,458 26,391 167.61 LOUISIANA 3,564 2,399 217,217 20,741 95.48 MAINE 153 121 2,319 160 68.91 MARYLAND 5,381 3,068 58,857 10,596 180.03 MASSACHUSETTS 3 3 10 2 207.20 MICHIGAN 9,404 5,128 93,957 12,787 136.09 MINNESOTA 40,559 23,040 602,445 73,461 121.94 MISSISSIPPI 8,751 5,936 271,354 22,360 82.40 MISSOURI 15,138 9,457 251,000 29,603 117.94 MONTANA 1,506 753 169,485 5,683 33.53 NEBRASKA 13,986 8,860 236,068 29,194 123.67 NEW HAMPSHIRE 3 3 13 1 69.04 NEW JERSEY 292 187 1,485 151 101.80 NEW MEXICO 210 145 37,118 1,316 35.44 NEW YORK 1,594 1,173 19,962 2,245 112.45 NORTH CAROLINA 3,636 2,274 39,244 3,631 92.53 NORTH DAKOTA 14,285 7,755 590,973 37,264 63.06 OHIO 31,734 17,987 182,575 32,377 177.34 OKLAHOMA 416 342 16,565 695 41.98 OREGON 1,936 1,209 54,121 4,458 82.37 PENNSYLVANIA 9,174 6,124 146,840 17,734 120.77 PUERTO RICO 5 5 466 28 60.00 SOUTH CAROLINA 2,214 1,227 29,216 1,461 50.01 SOUTH DAKOTA 25,926 12,666 650,335 64,271 98.83 TENNESSEE 2,402 1,667 31,798 3,246 102.10 TEXAS 2,247 1,748 212,252 8,566 40.36 UTAH 21 19 384 17 44.95 VERMONT 413 300 2,829 299 105.74 VIRGINIA 4,152 3,199 29,950 2,354 78.60 WASHINGTON 4,626 2,615 189,591 14,555 76.77 WEST VIRGINIA 512 419 6,225 503 80.74 WISCONSIN 8,890 5,665 89,989 13,029 144.78 WYOMING 162 125 15,588 505 32.37 1/ Includes Farmable Wetland enrollment. 2/ State in which land is located. 3/ Payments scheduled to be made October 2016. Includes annual incentive and maintenance allowance payments, but not one-time signing and practice incentive payments or payment reductions, such as for lands enrolled less than a full year and lands hayed or grazed.
-11- USDA/FSA/EPAS

CRP ENROLLMENT BY STATE AS OF FEBRUARY 2016 -------------------CREP ONLY---------------- _ NUMBER OF NUMBER OF ANNUAL RENTAL PAYMENTS 2/ STATE 1/ CONTRACTS FARMS ACRES ($1,000) ($/ACRE) U.S. 68,778 45,773 1,163,951 168,188 144.50 ALABAMA 0 0 0 0 . ALASKA 0 0 0 0 . ARKANSAS 244 166 6,929 704 101.55 CALIFORNIA 6 6 393 43 110.14 COLORADO 197 139 28,276 3,438 121.59 CONNECTICUT 0 0 0 0 . DELAWARE 408 231 4,114 503 122.20 FLORIDA 0 0 0 0 . GEORGIA 0 0 0 0 . HAWAII 18 14 982 48 48.81 IDAHO 156 105 16,570 2,200 132.76 ILLINOIS 5,899 4,198 104,220 23,326 223.82 INDIANA 1,072 801 10,028 2,262 225.61 IOWA 113 105 3,056 813 265.92 KANSAS 95 68 17,292 2,083 120.48 KENTUCKY 3,065 1,567 98,131 18,235 185.82 LOUISIANA 723 533 48,515 3,844 79.24 MAINE 0 0 0 0 . MARYLAND 4,962 2,947 56,970 10,403 182.60 MASSACHUSETTS 0 0 0 0 . MICHIGAN 6,263 3,444 73,196 10,388 141.93 MINNESOTA 2,295 1,927 70,782 8,266 116.79 MISSISSIPPI 11 9 441 67 152.60 MISSOURI 1,068 782 36,263 3,508 96.75 MONTANA 104 46 9,612 719 74.85 NEBRASKA 2,469 1,857 62,628 7,154 114.22 NEW HAMPSHIRE 0 0 0 0 . NEW JERSEY 217 144 752 105 139.70 NEW MEXICO 0 0 0 0 . NEW YORK 1,140 823 13,612 1,909 140.21 NORTH CAROLINA 1,511 1,076 19,066 2,151 112.82 NORTH DAKOTA 82 61 1,616 57 35.54 OHIO 14,575 9,338 117,055 23,799 203.31 OKLAHOMA 73 61 668 42 62.97 OREGON 1,651 1,065 42,663 3,757 88.06 PENNSYLVANIA 9,007 6,005 146,389 17,709 120.97 PUERTO RICO 0 0 0 0 . SOUTH CAROLINA 0 0 0 0 . SOUTH DAKOTA 1,001 612 79,789 8,550 107.15 TENNESSEE 0 0 0 0 . TEXAS 0 0 0 0 . UTAH 0 0 0 0 . VERMONT 392 291 2,752 295 107.10 VIRGINIA 3,552 2,836 25,966 2,122 81.73 WASHINGTON 1,163 952 14,593 3,143 215.36 WEST VIRGINIA 495 405 6,100 496 81.39 WISCONSIN 4,751 3,159 44,535 6,048 135.81 WYOMING 0 0 0 0 . 1/ State in which land is located. 2/ Payments scheduled to be made October 2016. Includes annual incentive and maintenance allowance payments, but not one-time signing and practice incentive payments or payment reductions, such as for lands enrolled less than a full year and lands hayed or grazed.
-12-
USDA/FSA/EPAS
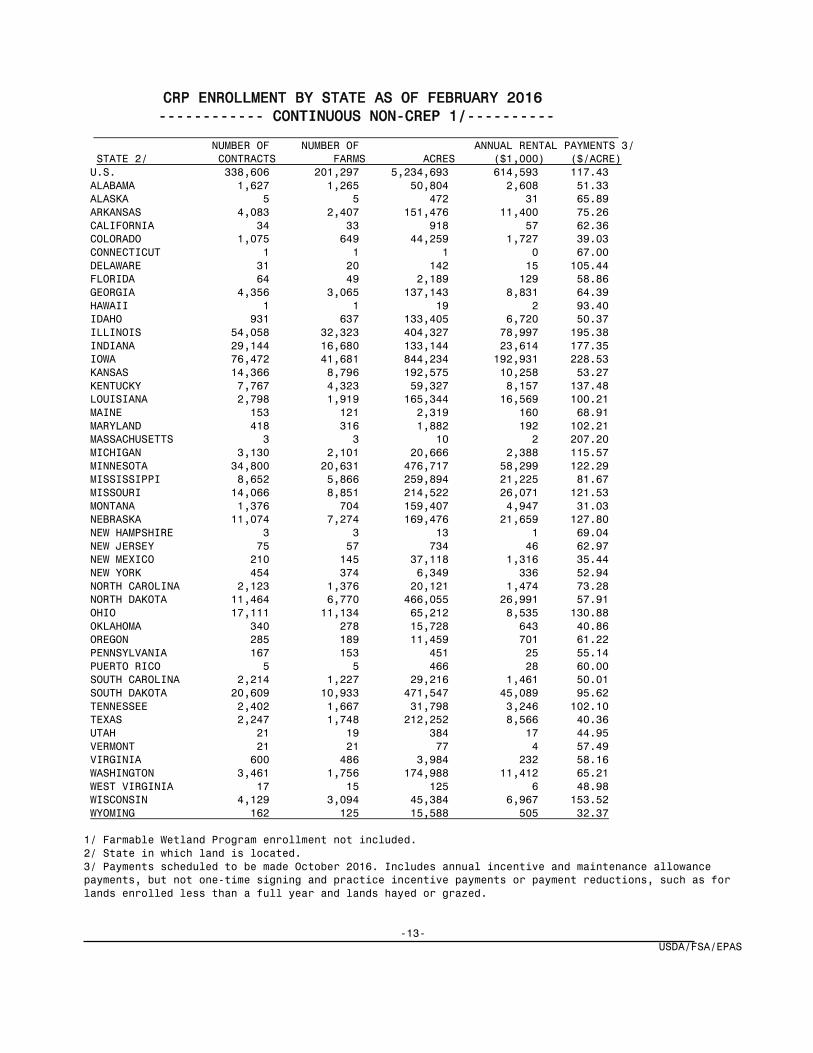
CRP ENROLLMENT BY STATE AS OF FEBRUARY 2016 ------------ CONTINUOUS NON-CREP 1/---------- NUMBER OF NUMBER OF ANNUAL RENTAL PAYMENTS 3/ STATE 2/ CONTRACTS FARMS ACRES ($1,000) ($/ACRE) U.S. 338,606 201,297 5,234,693 614,593 117.43 ALABAMA 1,627 1,265 50,804 2,608 51.33 ALASKA 5 5 472 31 65.89 ARKANSAS 4,083 2,407 151,476 11,400 75.26 CALIFORNIA 34 33 918 57 62.36 COLORADO 1,075 649 44,259 1,727 39.03 CONNECTICUT 1 1 1 0 67.00 DELAWARE 31 20 142 15 105.44 FLORIDA 64 49 2,189 129 58.86 GEORGIA 4,356 3,065 137,143 8,831 64.39 HAWAII 1 1 19 2 93.40 IDAHO 931 637 133,405 6,720 50.37 ILLINOIS 54,058 32,323 404,327 78,997 195.38 INDIANA 29,144 16,680 133,144 23,614 177.35 IOWA 76,472 41,681 844,234 192,931 228.53 KANSAS 14,366 8,796 192,575 10,258 53.27 KENTUCKY 7,767 4,323 59,327 8,157 137.48 LOUISIANA 2,798 1,919 165,344 16,569 100.21 MAINE 153 121 2,319 160 68.91 MARYLAND 418 316 1,882 192 102.21 MASSACHUSETTS 3 3 10 2 207.20 MICHIGAN 3,130 2,101 20,666 2,388 115.57 MINNESOTA 34,800 20,631 476,717 58,299 122.29 MISSISSIPPI 8,652 5,866 259,894 21,225 81.67 MISSOURI 14,066 8,851 214,522 26,071 121.53 MONTANA 1,376 704 159,407 4,947 31.03 NEBRASKA 11,074 7,274 169,476 21,659 127.80 NEW HAMPSHIRE 3 3 13 1 69.04 NEW JERSEY 75 57 734 46 62.97 NEW MEXICO 210 145 37,118 1,316 35.44 NEW YORK 454 374 6,349 336 52.94 NORTH CAROLINA 2,123 1,376 20,121 1,474 73.28 NORTH DAKOTA 11,464 6,770 466,055 26,991 57.91 OHIO 17,111 11,134 65,212 8,535 130.88 OKLAHOMA 340 278 15,728 643 40.86 OREGON 285 189 11,459 701 61.22 PENNSYLVANIA 167 153 451 25 55.14 PUERTO RICO 5 5 466 28 60.00 SOUTH CAROLINA 2,214 1,227 29,216 1,461 50.01 SOUTH DAKOTA 20,609 10,933 471,547 45,089 95.62 TENNESSEE 2,402 1,667 31,798 3,246 102.10 TEXAS 2,247 1,748 212,252 8,566 40.36 UTAH 21 19 384 17 44.95 VERMONT 21 21 77 4 57.49 VIRGINIA 600 486 3,984 232 58.16 WASHINGTON 3,461 1,756 174,988 11,412 65.21 WEST VIRGINIA 17 15 125 6 48.98 WISCONSIN 4,129 3,094 45,384 6,967 153.52 WYOMING 162 125 15,588 505 32.37 1/ Farmable Wetland Program enrollment not included. 2/ State in which land is located. 3/ Payments scheduled to be made October 2016. Includes annual incentive and maintenance allowance payments, but not one-time signing and practice incentive payments or payment reductions, such as for lands enrolled less than a full year and lands hayed or grazed.
-13- USDA/FSA/EPAS
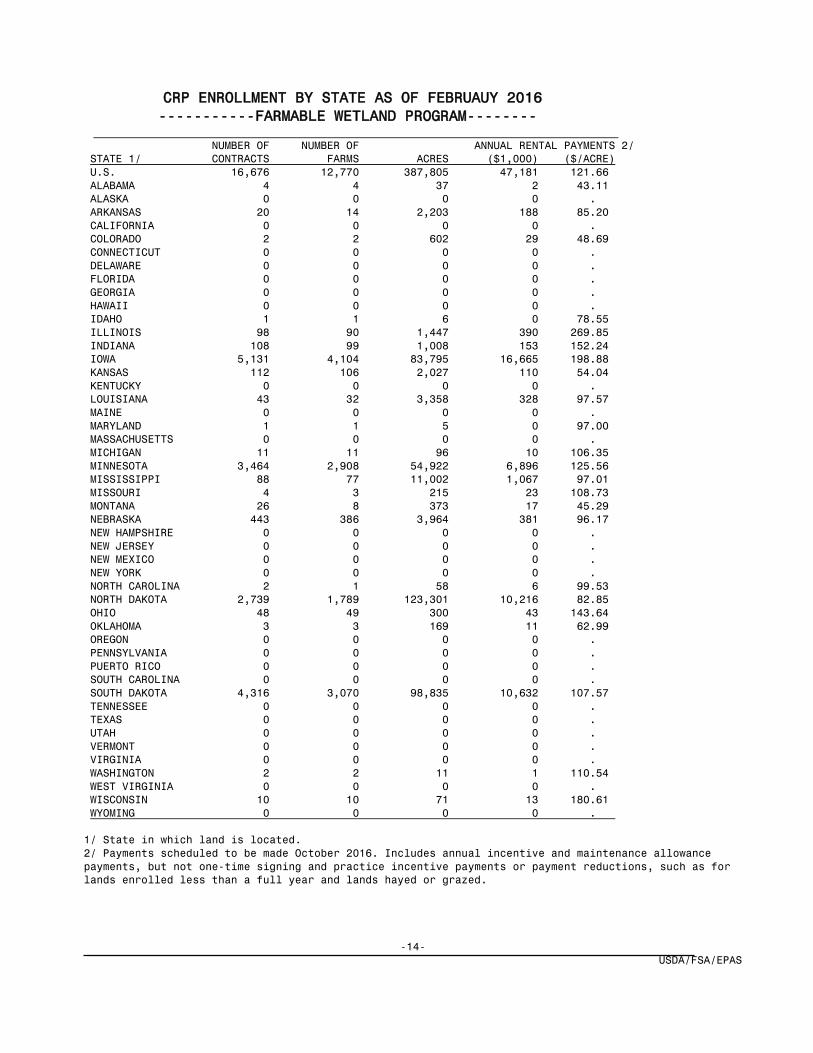
CRP ENROLLMENT BY STATE AS OF FEBRUAUY 2016 -----------FARMABLE WETLAND PROGRAM-------- NUMBER OF NUMBER OF ANNUAL RENTAL PAYMENTS 2/ STATE 1/ CONTRACTS FARMS ACRES ($1,000) ($/ACRE) U.S. 16,676 12,770 387,805 47,181 121.66 ALABAMA 4 4 37 2 43.11 ALASKA 0 0 0 0 . ARKANSAS 20 14 2,203 188 85.20 CALIFORNIA 0 0 0 0 . COLORADO 2 2 602 29 48.69 CONNECTICUT 0 0 0 0 . DELAWARE 0 0 0 0 . FLORIDA 0 0 0 0 . GEORGIA 0 0 0 0 . HAWAII 0 0 0 0 . IDAHO 1 1 6 0 78.55 ILLINOIS 98 90 1,447 390 269.85 INDIANA 108 99 1,008 153 152.24 IOWA 5,131 4,104 83,795 16,665 198.88 KANSAS 112 106 2,027 110 54.04 KENTUCKY 0 0 0 0 . LOUISIANA 43 32 3,358 328 97.57 MAINE 0 0 0 0 . MARYLAND 1 1 5 0 97.00 MASSACHUSETTS 0 0 0 0 . MICHIGAN 11 11 96 10 106.35 MINNESOTA 3,464 2,908 54,922 6,896 125.56 MISSISSIPPI 88 77 11,002 1,067 97.01 MISSOURI 4 3 215 23 108.73 MONTANA 26 8 373 17 45.29 NEBRASKA 443 386 3,964 381 96.17 NEW HAMPSHIRE 0 0 0 0 . NEW JERSEY 0 0 0 0 . NEW MEXICO 0 0 0 0 . NEW YORK 0 0 0 0 . NORTH CAROLINA 2 1 58 6 99.53 NORTH DAKOTA 2,739 1,789 123,301 10,216 82.85 OHIO 48 49 300 43 143.64 OKLAHOMA 3 3 169 11 62.99 OREGON 0 0 0 0 . PENNSYLVANIA 0 0 0 0 . PUERTO RICO 0 0 0 0 . SOUTH CAROLINA 0 0 0 0 . SOUTH DAKOTA 4,316 3,070 98,835 10,632 107.57 TENNESSEE 0 0 0 0 . TEXAS 0 0 0 0 . UTAH 0 0 0 0 . VERMONT 0 0 0 0 . VIRGINIA 0 0 0 0 . WASHINGTON 2 2 11 1 110.54 WEST VIRGINIA 0 0 0 0 . WISCONSIN 10 10 71 13 180.61 WYOMING 0 0 0 0 . 1/ State in which land is located. 2/ Payments scheduled to be made October 2016. Includes annual incentive and maintenance allowance payments, but not one-time signing and practice incentive payments or payment reductions, such as for lands enrolled less than a full year and lands hayed or grazed.
-14- USDA/FSA/EPAS
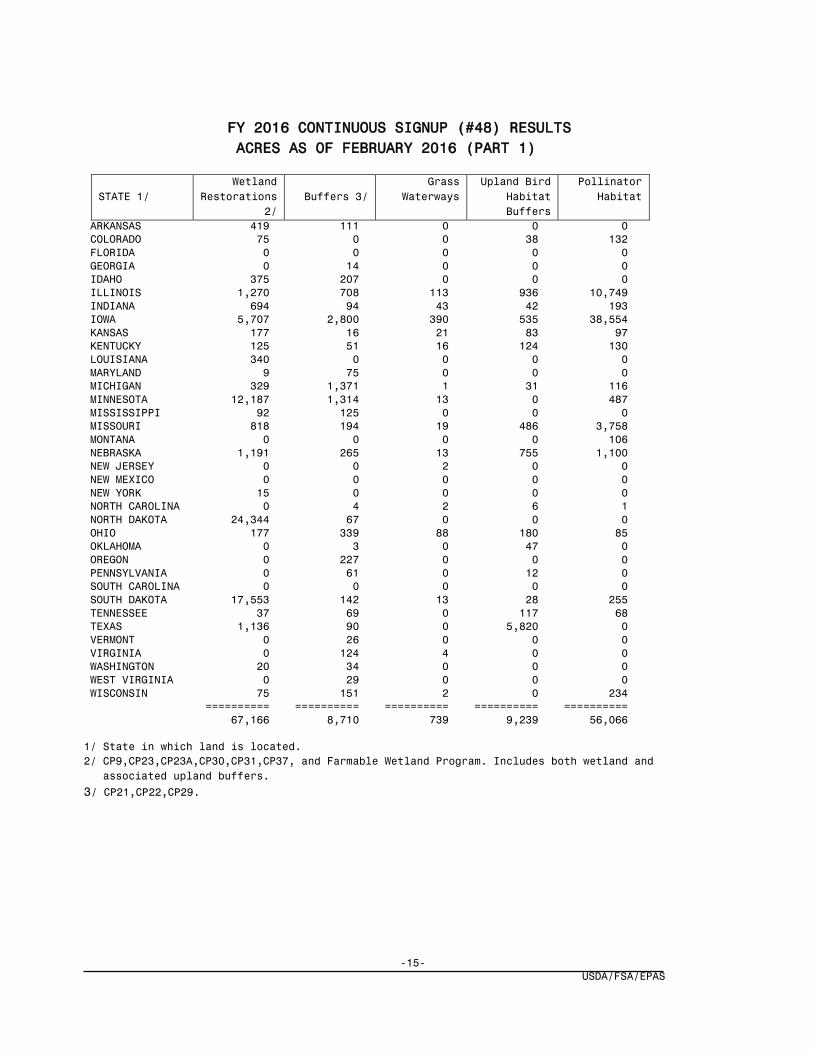
FY 2016 CONTINUOUS SIGNUP (#48) RESULTS ACRES AS OF FEBRUARY 2016 (PART 1)
STATE 1/
Wetland Restorations
2/
Buffers 3/
Grass Waterways
Upland Bird Habitat Buffers
Pollinator Habitat
ARKANSAS 419 111 0 0 0 COLORADO 75 0 0 38 132 FLORIDA 0 0 0 0 0 GEORGIA 0 14 0 0 0 IDAHO 375 207 0 0 0 ILLINOIS 1,270 708 113 936 10,749 INDIANA 694 94 43 42 193 IOWA 5,707 2,800 390 535 38,554 KANSAS 177 16 21 83 97 KENTUCKY 125 51 16 124 130 LOUISIANA 340 0 0 0 0 MARYLAND 9 75 0 0 0 MICHIGAN 329 1,371 1 31 116 MINNESOTA 12,187 1,314 13 0 487 MISSISSIPPI 92 125 0 0 0 MISSOURI 818 194 19 486 3,758 MONTANA 0 0 0 0 106 NEBRASKA 1,191 265 13 755 1,100 NEW JERSEY 0 0 2 0 0 NEW MEXICO 0 0 0 0 0 NEW YORK 15 0 0 0 0 NORTH CAROLINA 0 4 2 6 1 NORTH DAKOTA 24,344 67 0 0 0 OHIO 177 339 88 180 85 OKLAHOMA 0 3 0 47 0 OREGON 0 227 0 0 0 PENNSYLVANIA 0 61 0 12 0 SOUTH CAROLINA 0 0 0 0 0 SOUTH DAKOTA 17,553 142 13 28 255 TENNESSEE 37 69 0 117 68 TEXAS 1,136 90 0 5,820 0 VERMONT 0 26 0 0 0 VIRGINIA 0 124 4 0 0 WASHINGTON 20 34 0 0 0 WEST VIRGINIA 0 29 0 0 0 WISCONSIN 75 151 2 0 234 ========== ========== ========== ========== ========== 67,166 8,710 739 9,239 56,066 1/ State in which land is located. 2/ CP9,CP23,CP23A,CP30,CP31,CP37, and Farmable Wetland Program. Includes both wetland and associated upland buffers. 3/ CP21,CP22,CP29.
-15- USDA/FSA/EPAS

FY 2016 CONTINUOUS SIGNUP (#48) RESULTS ACRES AS OF FEBRUARY 2016 (PART 2)
State 1/
Wind Erosion
Practices 2/
SAFE
Other
Practices
Total
Conservation Reserve
Enhancement Program 3/
Highly Erodible
Lands Init. 3/
ARKANSAS 0 627 22 1,179 . . COLORADO 23 1,797 245 2,310 245 . FLORIDA 0 . 0 89 . . GEORGIA 0 . -0 643 . . IDAHO 0 509 565 1,656 . 565 ILLINOIS 19 214 1,641 15,651 . 1,641 INDIANA 14 2,869 3 3,952 402 3 IOWA 85 38,695 12,550 99,316 20 12,267 KANSAS 2 2,231 614 3,240 614 . KENTUCKY 0 15 210 671 . 210 LOUISIANA 0 . 0 340 . . MARYLAND 0 . 128 212 212 . MICHIGAN 22 399 720 2,988 2,200 . MINNESOTA 66 7,439 697 22,203 . 656 MISSISSIPPI 0 57 143 417 130 143 MISSOURI 0 359 8,757 14,392 . 8,757 MONTANA 0 4,908 91 5,105 . . NEBRASKA 67 10,629 1,137 15,157 10 1,127 NEW JERSEY 0 . 0 2 . . NEW MEXICO 0 . 972 972 . 972 NEW YORK 0 . 0 15 15 . NORTH CAROLINA 0 . 0 61 4 . NORTH DAKOTA 33 3,513 1,190 29,147 . . OHIO 10 724 192 1,796 595 28 OKLAHOMA 0 . 0 50 3 . OREGON 0 . -0 227 227 . PENNSYLVANIA 0 . 567 640 640 . SOUTH CAROLINA 0 . 0 8 . . SOUTH DAKOTA 358 11,798 270 30,417 . . TENNESSEE 0 539 727 1,557 . 727 TEXAS 0 8,596 936 16,579 . 936 VERMONT 0 . 0 26 26 . VIRGINIA 0 . 0 128 70 . WASHINGTON 0 . 377 432 55 377 WEST VIRGINIA 0 . 0 29 29 . WISCONSIN 0 988 4,619 6,069 805 4,031 ========== ========== ========== ========== ========== ========== 701 96,907 37,372 277,672 6,301 32,440 1/ State in which land is located. 2/ CP5, CP16, and CP17. 3/ Includes various practices.
-16- USDA/FSA/EPAS
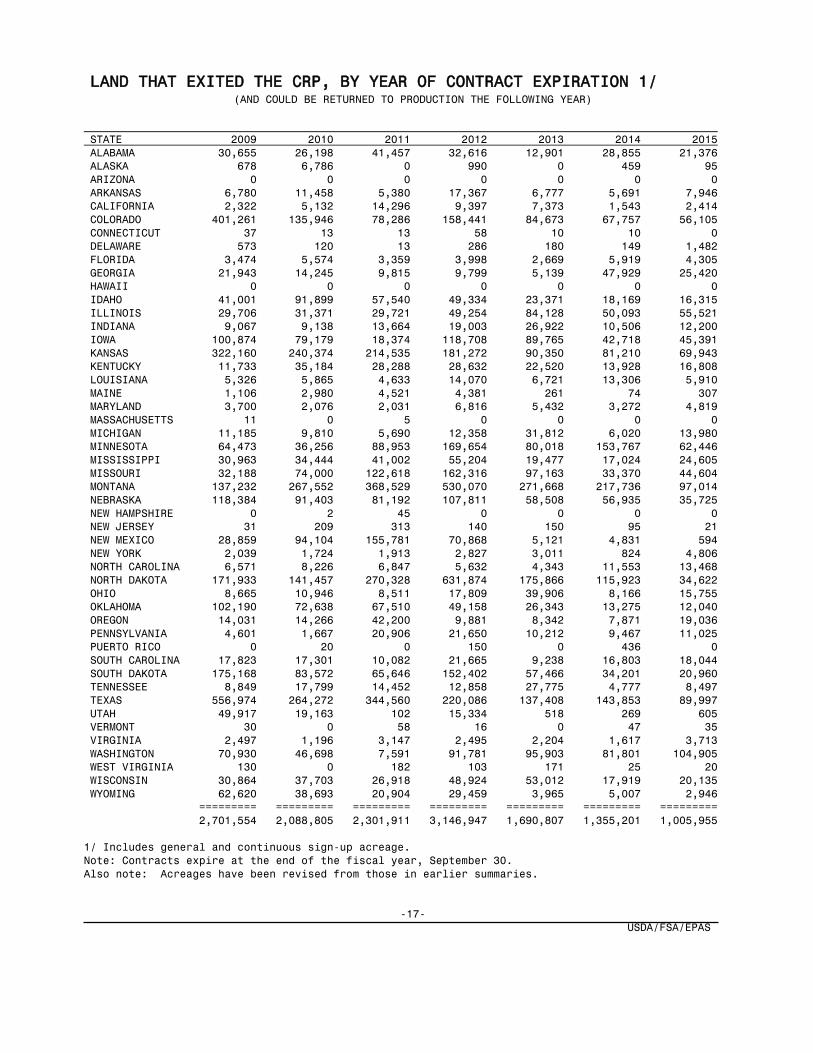
LAND THAT EXITED THE CRP, BY YEAR OF CONTRACT EXPIRATION 1/ (AND COULD BE RETURNED TO PRODUCTION THE FOLLOWING YEAR)
STATE 2009 2010 2011 2012 2013 2014 2015 ALABAMA 30,655 26,198 41,457 32,616 12,901 28,855 21,376 ALASKA 678 6,786 0 990 0 459 95 ARIZONA 0 0 0 0 0 0 0 ARKANSAS 6,780 11,458 5,380 17,367 6,777 5,691 7,946 CALIFORNIA 2,322 5,132 14,296 9,397 7,373 1,543 2,414 COLORADO 401,261 135,946 78,286 158,441 84,673 67,757 56,105 CONNECTICUT 37 13 13 58 10 10 0 DELAWARE 573 120 13 286 180 149 1,482 FLORIDA 3,474 5,574 3,359 3,998 2,669 5,919 4,305 GEORGIA 21,943 14,245 9,815 9,799 5,139 47,929 25,420 HAWAII 0 0 0 0 0 0 0 IDAHO 41,001 91,899 57,540 49,334 23,371 18,169 16,315 ILLINOIS 29,706 31,371 29,721 49,254 84,128 50,093 55,521 INDIANA 9,067 9,138 13,664 19,003 26,922 10,506 12,200 IOWA 100,874 79,179 18,374 118,708 89,765 42,718 45,391 KANSAS 322,160 240,374 214,535 181,272 90,350 81,210 69,943 KENTUCKY 11,733 35,184 28,288 28,632 22,520 13,928 16,808 LOUISIANA 5,326 5,865 4,633 14,070 6,721 13,306 5,910 MAINE 1,106 2,980 4,521 4,381 261 74 307 MARYLAND 3,700 2,076 2,031 6,816 5,432 3,272 4,819 MASSACHUSETTS 11 0 5 0 0 0 0 MICHIGAN 11,185 9,810 5,690 12,358 31,812 6,020 13,980 MINNESOTA 64,473 36,256 88,953 169,654 80,018 153,767 62,446 MISSISSIPPI 30,963 34,444 41,002 55,204 19,477 17,024 24,605 MISSOURI 32,188 74,000 122,618 162,316 97,163 33,370 44,604 MONTANA 137,232 267,552 368,529 530,070 271,668 217,736 97,014 NEBRASKA 118,384 91,403 81,192 107,811 58,508 56,935 35,725 NEW HAMPSHIRE 0 2 45 0 0 0 0 NEW JERSEY 31 209 313 140 150 95 21 NEW MEXICO 28,859 94,104 155,781 70,868 5,121 4,831 594 NEW YORK 2,039 1,724 1,913 2,827 3,011 824 4,806 NORTH CAROLINA 6,571 8,226 6,847 5,632 4,343 11,553 13,468 NORTH DAKOTA 171,933 141,457 270,328 631,874 175,866 115,923 34,622 OHIO 8,665 10,946 8,511 17,809 39,906 8,166 15,755 OKLAHOMA 102,190 72,638 67,510 49,158 26,343 13,275 12,040 OREGON 14,031 14,266 42,200 9,881 8,342 7,871 19,036 PENNSYLVANIA 4,601 1,667 20,906 21,650 10,212 9,467 11,025 PUERTO RICO 0 20 0 150 0 436 0 SOUTH CAROLINA 17,823 17,301 10,082 21,665 9,238 16,803 18,044 SOUTH DAKOTA 175,168 83,572 65,646 152,402 57,466 34,201 20,960 TENNESSEE 8,849 17,799 14,452 12,858 27,775 4,777 8,497 TEXAS 556,974 264,272 344,560 220,086 137,408 143,853 89,997 UTAH 49,917 19,163 102 15,334 518 269 605 VERMONT 30 0 58 16 0 47 35 VIRGINIA 2,497 1,196 3,147 2,495 2,204 1,617 3,713 WASHINGTON 70,930 46,698 7,591 91,781 95,903 81,801 104,905 WEST VIRGINIA 130 0 182 103 171 25 20 WISCONSIN 30,864 37,703 26,918 48,924 53,012 17,919 20,135 WYOMING 62,620 38,693 20,904 29,459 3,965 5,007 2,946 ========= ========= ========= ========= ========= ========= ========= 2,701,554 2,088,805 2,301,911 3,146,947 1,690,807 1,355,201 1,005,955 1/ Includes general and continuous sign-up acreage. Note: Contracts expire at the end of the fiscal year, September 30. Also note: Acreages have been revised from those in earlier summaries.
-17- USDA/FSA/EPAS
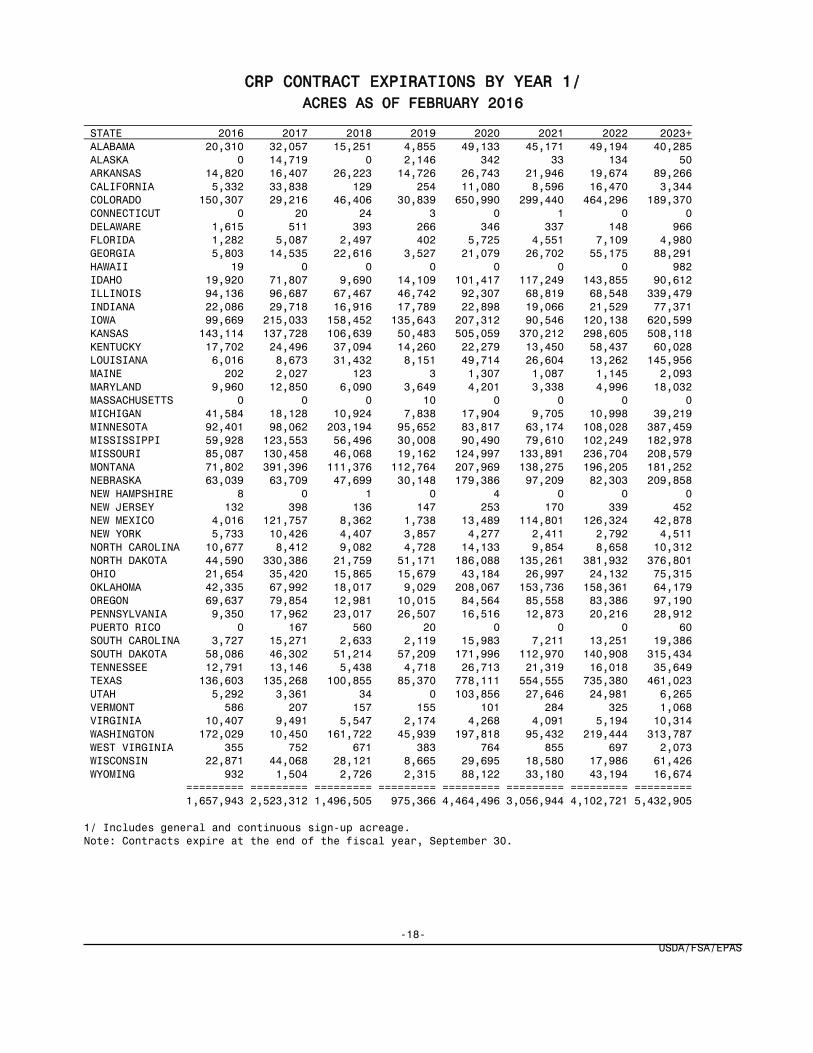
CRP CONTRACT EXPIRATIONS BY YEAR 1/ ACRES AS OF FEBRUARY 2016
STATE 2016 2017 2018 2019 2020 2021 2022 2023+ ALABAMA 20,310 32,057 15,251 4,855 49,133 45,171 49,194 40,285 ALASKA 0 14,719 0 2,146 342 33 134 50 ARKANSAS 14,820 16,407 26,223 14,726 26,743 21,946 19,674 89,266 CALIFORNIA 5,332 33,838 129 254 11,080 8,596 16,470 3,344 COLORADO 150,307 29,216 46,406 30,839 650,990 299,440 464,296 189,370 CONNECTICUT 0 20 24 3 0 1 0 0 DELAWARE 1,615 511 393 266 346 337 148 966 FLORIDA 1,282 5,087 2,497 402 5,725 4,551 7,109 4,980 GEORGIA 5,803 14,535 22,616 3,527 21,079 26,702 55,175 88,291 HAWAII 19 0 0 0 0 0 0 982 IDAHO 19,920 71,807 9,690 14,109 101,417 117,249 143,855 90,612 ILLINOIS 94,136 96,687 67,467 46,742 92,307 68,819 68,548 339,479 INDIANA 22,086 29,718 16,916 17,789 22,898 19,066 21,529 77,371 IOWA 99,669 215,033 158,452 135,643 207,312 90,546 120,138 620,599 KANSAS 143,114 137,728 106,639 50,483 505,059 370,212 298,605 508,118 KENTUCKY 17,702 24,496 37,094 14,260 22,279 13,450 58,437 60,028 LOUISIANA 6,016 8,673 31,432 8,151 49,714 26,604 13,262 145,956 MAINE 202 2,027 123 3 1,307 1,087 1,145 2,093 MARYLAND 9,960 12,850 6,090 3,649 4,201 3,338 4,996 18,032 MASSACHUSETTS 0 0 0 10 0 0 0 0 MICHIGAN 41,584 18,128 10,924 7,838 17,904 9,705 10,998 39,219 MINNESOTA 92,401 98,062 203,194 95,652 83,817 63,174 108,028 387,459 MISSISSIPPI 59,928 123,553 56,496 30,008 90,490 79,610 102,249 182,978 MISSOURI 85,087 130,458 46,068 19,162 124,997 133,891 236,704 208,579 MONTANA 71,802 391,396 111,376 112,764 207,969 138,275 196,205 181,252 NEBRASKA 63,039 63,709 47,699 30,148 179,386 97,209 82,303 209,858 NEW HAMPSHIRE 8 0 1 0 4 0 0 0 NEW JERSEY 132 398 136 147 253 170 339 452 NEW MEXICO 4,016 121,757 8,362 1,738 13,489 114,801 126,324 42,878 NEW YORK 5,733 10,426 4,407 3,857 4,277 2,411 2,792 4,511 NORTH CAROLINA 10,677 8,412 9,082 4,728 14,133 9,854 8,658 10,312 NORTH DAKOTA 44,590 330,386 21,759 51,171 186,088 135,261 381,932 376,801 OHIO 21,654 35,420 15,865 15,679 43,184 26,997 24,132 75,315 OKLAHOMA 42,335 67,992 18,017 9,029 208,067 153,736 158,361 64,179 OREGON 69,637 79,854 12,981 10,015 84,564 85,558 83,386 97,190 PENNSYLVANIA 9,350 17,962 23,017 26,507 16,516 12,873 20,216 28,912 PUERTO RICO 0 167 560 20 0 0 0 60 SOUTH CAROLINA 3,727 15,271 2,633 2,119 15,983 7,211 13,251 19,386 SOUTH DAKOTA 58,086 46,302 51,214 57,209 171,996 112,970 140,908 315,434 TENNESSEE 12,791 13,146 5,438 4,718 26,713 21,319 16,018 35,649 TEXAS 136,603 135,268 100,855 85,370 778,111 554,555 735,380 461,023 UTAH 5,292 3,361 34 0 103,856 27,646 24,981 6,265 VERMONT 586 207 157 155 101 284 325 1,068 VIRGINIA 10,407 9,491 5,547 2,174 4,268 4,091 5,194 10,314 WASHINGTON 172,029 10,450 161,722 45,939 197,818 95,432 219,444 313,787 WEST VIRGINIA 355 752 671 383 764 855 697 2,073 WISCONSIN 22,871 44,068 28,121 8,665 29,695 18,580 17,986 61,426 WYOMING 932 1,504 2,726 2,315 88,122 33,180 43,194 16,674 ========= ========= ========= ========= ========= ========= ========= ========= 1,657,943 2,523,312 1,496,505 975,366 4,464,496 3,056,944 4,102,721 5,432,905 1/ Includes general and continuous sign-up acreage. Note: Contracts expire at the end of the fiscal year, September 30.
-18- USDA/FSA/EPAS
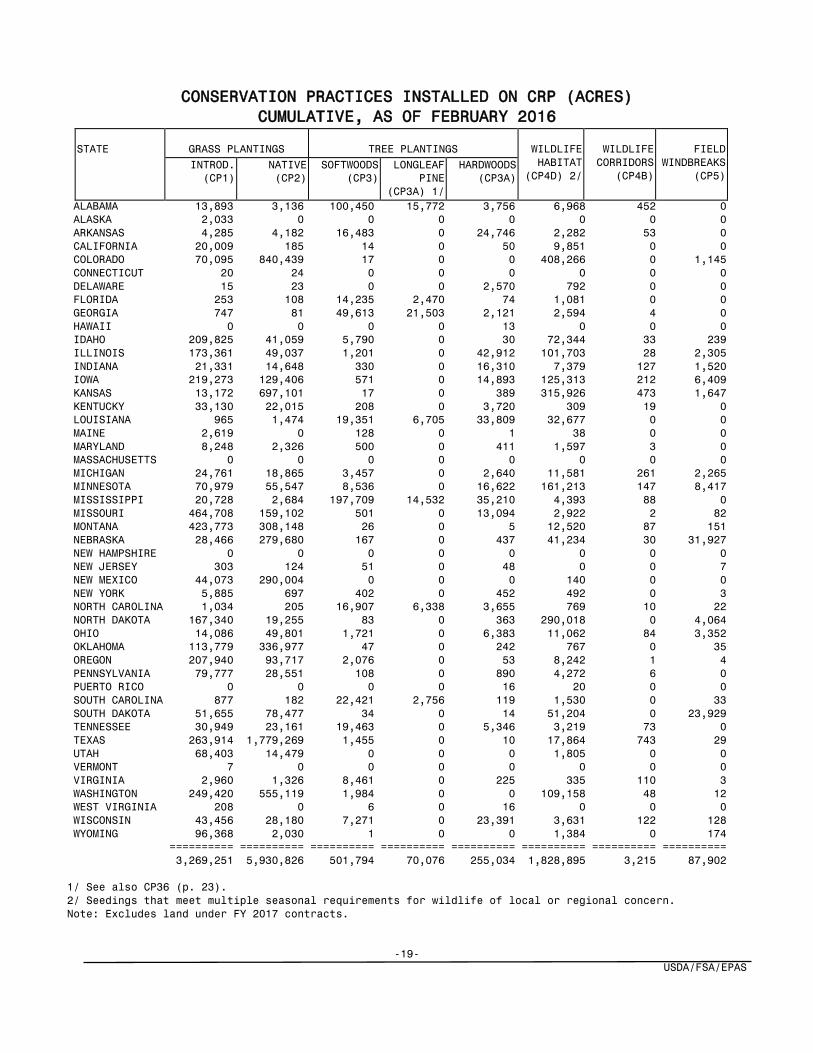
CONSERVATION PRACTICES INSTALLED ON CRP (ACRES)
CUMULATIVE, AS OF FEBRUARY 2016 STATE
GRASS PLANTINGS
TREE PLANTINGS
WILDLIFE HABITAT
(CP4D) 2/
WILDLIFE CORRIDORS
(CP4B)
FIELD
WINDBREAKS (CP5)
INTROD. (CP1)
NATIVE (CP2)
SOFTWOODS (CP3)
LONGLEAF PINE
(CP3A) 1/
HARDWOODS (CP3A)
ALABAMA 13,893 3,136 100,450 15,772 3,756 6,968 452 0 ALASKA 2,033 0 0 0 0 0 0 0 ARKANSAS 4,285 4,182 16,483 0 24,746 2,282 53 0 CALIFORNIA 20,009 185 14 0 50 9,851 0 0 COLORADO 70,095 840,439 17 0 0 408,266 0 1,145 CONNECTICUT 20 24 0 0 0 0 0 0 DELAWARE 15 23 0 0 2,570 792 0 0 FLORIDA 253 108 14,235 2,470 74 1,081 0 0 GEORGIA 747 81 49,613 21,503 2,121 2,594 4 0 HAWAII 0 0 0 0 13 0 0 0 IDAHO 209,825 41,059 5,790 0 30 72,344 33 239 ILLINOIS 173,361 49,037 1,201 0 42,912 101,703 28 2,305 INDIANA 21,331 14,648 330 0 16,310 7,379 127 1,520 IOWA 219,273 129,406 571 0 14,893 125,313 212 6,409 KANSAS 13,172 697,101 17 0 389 315,926 473 1,647 KENTUCKY 33,130 22,015 208 0 3,720 309 19 0 LOUISIANA 965 1,474 19,351 6,705 33,809 32,677 0 0 MAINE 2,619 0 128 0 1 38 0 0 MARYLAND 8,248 2,326 500 0 411 1,597 3 0 MASSACHUSETTS 0 0 0 0 0 0 0 0 MICHIGAN 24,761 18,865 3,457 0 2,640 11,581 261 2,265 MINNESOTA 70,979 55,547 8,536 0 16,622 161,213 147 8,417 MISSISSIPPI 20,728 2,684 197,709 14,532 35,210 4,393 88 0 MISSOURI 464,708 159,102 501 0 13,094 2,922 2 82 MONTANA 423,773 308,148 26 0 5 12,520 87 151 NEBRASKA 28,466 279,680 167 0 437 41,234 30 31,927 NEW HAMPSHIRE 0 0 0 0 0 0 0 0 NEW JERSEY 303 124 51 0 48 0 0 7 NEW MEXICO 44,073 290,004 0 0 0 140 0 0 NEW YORK 5,885 697 402 0 452 492 0 3 NORTH CAROLINA 1,034 205 16,907 6,338 3,655 769 10 22 NORTH DAKOTA 167,340 19,255 83 0 363 290,018 0 4,064 OHIO 14,086 49,801 1,721 0 6,383 11,062 84 3,352 OKLAHOMA 113,779 336,977 47 0 242 767 0 35 OREGON 207,940 93,717 2,076 0 53 8,242 1 4 PENNSYLVANIA 79,777 28,551 108 0 890 4,272 6 0 PUERTO RICO 0 0 0 0 16 20 0 0 SOUTH CAROLINA 877 182 22,421 2,756 119 1,530 0 33 SOUTH DAKOTA 51,655 78,477 34 0 14 51,204 0 23,929 TENNESSEE 30,949 23,161 19,463 0 5,346 3,219 73 0 TEXAS 263,914 1,779,269 1,455 0 10 17,864 743 29 UTAH 68,403 14,479 0 0 0 1,805 0 0 VERMONT 7 0 0 0 0 0 0 0 VIRGINIA 2,960 1,326 8,461 0 225 335 110 3 WASHINGTON 249,420 555,119 1,984 0 0 109,158 48 12 WEST VIRGINIA 208 0 6 0 16 0 0 0 WISCONSIN 43,456 28,180 7,271 0 23,391 3,631 122 128 WYOMING 96,368 2,030 1 0 0 1,384 0 174 ========== ========== ========== ========== ========== ========== ========== ========== 3,269,251 5,930,826 501,794 70,076 255,034 1,828,895 3,215 87,902 1/ See also CP36 (p. 23). 2/ Seedings that meet multiple seasonal requirements for wildlife of local or regional concern. Note: Excludes land under FY 2017 contracts.
-19- USDA/FSA/EPAS

CONSERVATION PRACTICES INSTALLED ON CRP (ACRES) CUMULATIVE, AS OF FEBRUARY 2016, CON’T
STATE
DIVERSIONS & EROSION CONTROL STRUCT.
(CP6&CP7)
GRASS WATERWAYS
(CP8)
SHALLOW
WATER FOR WILDLIFE
(CP9)
EXISTING GRASS (CP10)
EXISTING TREES (CP11)
WILDLIFE FOOD PLOTS
(CP12)
CONTOUR GRASS
STRIPS (CP15)
SHELTER- BELTS (CP16)
ALABAMA 0 1 117 21,750 38,709 954 11 0 ALASKA 0 0 0 14,919 0 0 0 0 ARKANSAS 0 5 533 4,416 12,258 300 0 0 CALIFORNIA 0 0 15 45,597 5 5 0 0 COLORADO 0 513 18 485,358 34 212 12 3,875 CONNECTICUT 0 0 0 4 0 0 0 0 DELAWARE 0 6 211 25 0 8 4 0 FLORIDA 0 0 0 86 11,115 23 0 0 GEORGIA 0 31 23 1,078 22,813 363 0 0 HAWAII 0 0 0 0 0 0 0 0 IDAHO 0 0 23 111,802 1,007 123 25 53 ILLINOIS 19 31,759 4,599 71,463 9,971 4,804 943 145 INDIANA 0 18,702 946 17,780 5,311 526 21 18 IOWA 5 36,388 10,227 177,241 5,643 4,152 12,328 2,127 KANSAS 0 8,163 1,003 201,983 202 3,267 3,295 713 KENTUCKY 0 4,496 1,844 8,404 624 575 30 0 LOUISIANA 0 5 431 1,214 11,805 629 0 0 MAINE 0 57 0 2,613 274 0 0 0 MARYLAND 0 246 1,079 1,703 289 36 1 0 MASSACHUSETTS 0 0 0 0 0 0 0 0 MICHIGAN 52 577 1,734 13,585 2,409 1,002 3 39 MINNESOTA 70 3,481 214 60,081 8,590 3,540 755 3,808 MISSISSIPPI 0 58 527 31,251 154,625 2,222 27 0 MISSOURI 6 1,959 1,816 127,009 6,096 3,153 855 57 MONTANA 0 83 11 425,515 432 1,418 0 189 NEBRASKA 0 1,274 187 90,968 601 554 324 1,908 NEW HAMPSHIRE 0 0 0 0 0 0 0 0 NEW JERSEY 0 152 0 14 0 2 0 0 NEW MEXICO 0 0 0 90,709 0 0 0 0 NEW YORK 0 39 3 13,870 734 75 3 0 NORTH CAROLINA 0 267 278 1,030 9,966 14 0 5 NORTH DAKOTA 0 88 1 313,245 332 2,256 1 4,624 OHIO 0 10,944 510 23,456 2,406 377 17 80 OKLAHOMA 0 157 79 229,053 151 932 0 21 OREGON 0 27 0 122,695 490 104 0 0 PENNSYLVANIA 0 309 33 12,418 296 1,076 60 0 PUERTO RICO 0 0 0 188 117 0 60 0 SOUTH CAROLINA 0 17 34 1,677 20,781 192 0 0 SOUTH DAKOTA 14 1,307 41 85,065 92 3,193 32 13,541 TENNESSEE 0 169 73 18,011 7,242 349 17 0 TEXAS 0 1,482 92 740,990 3,028 2,706 104 5 UTAH 0 14 0 85,696 0 14 40 0 VERMONT 0 16 0 45 0 0 0 0 VIRGINIA 0 85 57 2,942 5,161 27 4 0 WASHINGTON 0 372 51 110,604 740 462 43,234 8 WEST VIRGINIA 0 0 0 164 0 0 0 0 WISCONSIN 1 1,454 1,815 42,151 11,181 1,157 500 15 WYOMING 0 0 0 73,224 12 22 0 49 ========== ========== ========== ========== ========== ========== ========== ========== 165 124,703 28,627 3,883,089 355,543 40,825 62,707 31,278 Note: Excludes land under FY 2017 contracts.
-20- USDA/FSA/EPAS

CONSERVATION PRACTICES INSTALLED ON CRP (ACRES) CUMULATIVE, AS OF FEBRUARY 2016, CON’T
STATE
LIVING SNOW FENCES
(CP17)
SALINITY REDUCING
VEGETATION (CP18)
FILTER- STRIPS (CP21)
RIPARIAN BUFFERS
1/ (CP22)
WETLAND RESTORATION CROSS
WIND TRAP STRIPS (CP24)
(CP23) 2/ FLOODPLAIN (CP23) 3/
NON-FLOODPLAIN (CP23A) 3/
ALABAMA 0 0 409 31,179 0 5 0 3 ALASKA 0 0 0 50 0 0 0 0 ARKANSAS 0 0 5,285 59,981 22 35,076 15,371 0 CALIFORNIA 0 0 0 812 572 0 0 0 COLORADO 18 7 71 643 26 0 528 2 CONNECTICUT 0 0 0 1 0 0 0 0 DELAWARE 0 0 600 63 161 97 4 0 FLORIDA 0 0 0 64 0 0 0 0 GEORGIA 0 0 362 1,046 380 37 0 0 HAWAII 0 0 0 987 0 0 0 0 IDAHO 62 0 675 4,701 0 375 25 0 ILLINOIS 53 4 108,380 102,578 5,641 26,035 5,814 0 INDIANA 0 0 48,426 5,463 943 2,397 5,222 0 IOWA 654 0 192,438 50,412 2,345 115,485 8,646 0 KANSAS 67 875 24,595 2,895 400 3,576 4,512 75 KENTUCKY 0 0 20,541 22,025 0 119 137 0 LOUISIANA 0 0 423 5,205 101 65,963 51,735 0 MAINE 0 0 59 46 0 0 0 0 MARYLAND 0 0 28,669 13,168 918 1,467 124 0 MASSACHUSETTS 0 0 10 0 0 0 0 0 MICHIGAN 14 0 38,503 2,861 9,434 3,109 10,297 0 MINNESOTA 4,116 4,430 119,844 37,420 59,762 33,717 175,098 0 MISSISSIPPI 0 0 5,482 168,745 0 12,635 1,253 13 MISSOURI 0 0 30,379 27,637 88 14,199 634 0 MONTANA 39 95,009 195 2,760 509 797 0 0 NEBRASKA 118 541 15,879 2,068 316 4,222 2,647 0 NEW HAMPSHIRE 0 0 0 13 0 0 0 0 NEW JERSEY 0 0 354 267 0 0 0 0 NEW MEXICO 0 0 0 5,102 0 0 0 0 NEW YORK 0 0 421 10,355 2 60 31 0 NORTH CAROLINA 0 0 1,367 17,341 648 1,126 0 0 NORTH DAKOTA 578 102,125 7,830 365 134,441 4,264 50,003 0 OHIO 0 0 69,369 6,899 1,460 4,102 5,784 0 OKLAHOMA 0 1,862 638 1,674 78 293 1,611 0 OREGON 0 0 1,778 36,140 0 117 115 0 PENNSYLVANIA 0 0 1,047 23,891 257 686 0 0 PUERTO RICO 0 0 0 203 0 0 0 0 SOUTH CAROLINA 0 0 1,441 11,388 0 172 0 0 SOUTH DAKOTA 605 14,161 8,926 5,340 25,899 37,601 102,282 0 TENNESSEE 0 0 6,732 6,223 43 572 0 0 TEXAS 0 436 1,048 29,388 5,427 968 1,638 8 UTAH 0 0 38 72 0 0 0 0 VERMONT 0 0 215 2,598 0 0 0 0 VIRGINIA 0 0 3,830 22,785 75 73 0 0 WASHINGTON 0 24 34,308 23,075 15 50 5 0 WEST VIRGINIA 0 0 562 5,594 0 0 0 0 WISCONSIN 31 0 20,630 12,727 2,172 2,262 1,069 0 WYOMING 3 0 0 4,128 0 0 0 0 ========== ========== ========== ========== ========== ========== ========== ========== 6,360 219,474 801,760 768,404 252,136 371,657 444,588 101 1/ Includes cropland and marginal pasture. 2/ Acres enrolled under general sign-up and CREP through 2003. 3/ Acres enrolled under continuous CREP and non-CREP sign-up after 2003. Note: Excludes land under FY 2017 contracts.
-21- USDA/FSA/EPAS

CONSERVATION PRACTICES INSTALLED ON CRP (ACRES) CUMULATIVE, AS OF FEBRUARY 2016, CON’T
STATE
RARE AND DECLINING HABITAT (CP25)
FARMABLE WETLAND PROGRAM 1/
MARGINAL PASTURE BUFFERS
BOTTOMLAND HARDWOOD
TREES (CP31)
EXPIRED HARDWOOD
TREES (CP32)
UPLAND BIRD
HABITAT BUFFERS (CP33)
WETLAND (CP27)
BUFFER (CP28)
WILDLIFE (CP29)
WETLAND (CP30)
ALABAMA 393 0 0 229 0 1,200 0 854 ALASKA 0 0 0 0 422 0 0 0 ARKANSAS 0 0 0 512 3,389 16,197 614 5,092 CALIFORNIA 0 0 0 106 0 0 0 0 COLORADO 1,944 33 123 64 32 0 0 508 CONNECTICUT 0 0 0 0 0 0 0 0 DELAWARE 0 0 0 0 0 0 0 0 FLORIDA 0 0 0 0 0 0 0 0 GEORGIA 0 0 0 28 0 25 0 1,745 HAWAII 0 0 0 0 0 0 0 0 IDAHO 79 4 2 227 162 0 0 0 ILLINOIS 2,227 570 849 266 33 5,312 301 60,704 INDIANA 2,045 348 641 64 51 6,407 449 11,646 IOWA 155,187 24,513 58,897 9,691 2,161 3,598 1,398 26,670 KANSAS 696,748 705 1,317 12 0 215 0 34,652 KENTUCKY 38,491 0 0 71,453 5 398 187 6,206 LOUISIANA 0 0 0 0 176 52,395 731 348 MAINE 0 0 0 5 12 0 0 0 MARYLAND 468 1 4 1,021 149 0 0 667 MASSACHUSETTS 0 0 0 0 0 0 0 0 MICHIGAN 160 32 64 5 294 11 6 838 MINNESOTA 144,618 16,909 37,103 835 7,756 644 1,115 499 MISSISSIPPI 0 40 157 29 24 50,561 744 1,679 MISSOURI 47,068 4 5 1,250 2,021 1,768 475 33,245 MONTANA 83,557 194 179 98 0 0 0 0 NEBRASKA 162,581 1,564 2,400 1,306 238 9 0 6,020 NEW HAMPSHIRE 0 0 0 0 0 0 0 0 NEW JERSEY 0 0 0 0 0 0 0 0 NEW MEXICO 0 0 0 0 0 0 0 0 NEW YORK 0 0 0 2,492 1,120 2 0 0 NORTH CAROLINA 0 0 0 54 0 54 0 6,768 NORTH DAKOTA 11,625 24,853 58,753 35 0 0 0 0 OHIO 5,829 77 184 2,875 130 91 28 14,158 OKLAHOMA 22,932 47 122 6 9 443 52 911 OREGON 34,216 0 0 13,412 659 0 0 0 PENNSYLVANIA 0 0 0 1,202 425 0 0 49 PUERTO RICO 0 0 0 203 0 0 0 0 SOUTH CAROLINA 0 0 0 39 73 5 0 2,696 SOUTH DAKOTA 16,855 27,943 58,949 5,072 24,229 0 0 1,391 TENNESSEE 0 0 0 73 0 3,064 1 3,402 TEXAS 0 0 0 2,304 2 381 0 16,256 UTAH 0 0 0 0 0 0 0 0 VERMONT 0 0 0 0 1 0 0 0 VIRGINIA 0 0 0 723 20 0 0 1,371 WASHINGTON 1,166 2 8 1,091 323 0 0 1,014 WEST VIRGINIA 0 0 0 0 0 0 0 0 WISCONSIN 13,271 29 41 1,160 28 0 851 290 WYOMING 0 0 0 1,545 0 0 0 0 ========== ========== ========== ========== ========== ========== ========== ========== 1,441,459 97,869 219,799 119,490 43,943 142,781 6,954 239,677 1/ For more FWP see page 23 Note: Excludes land under FY 2017 contracts.
-22- USDA/FSA/EPAS
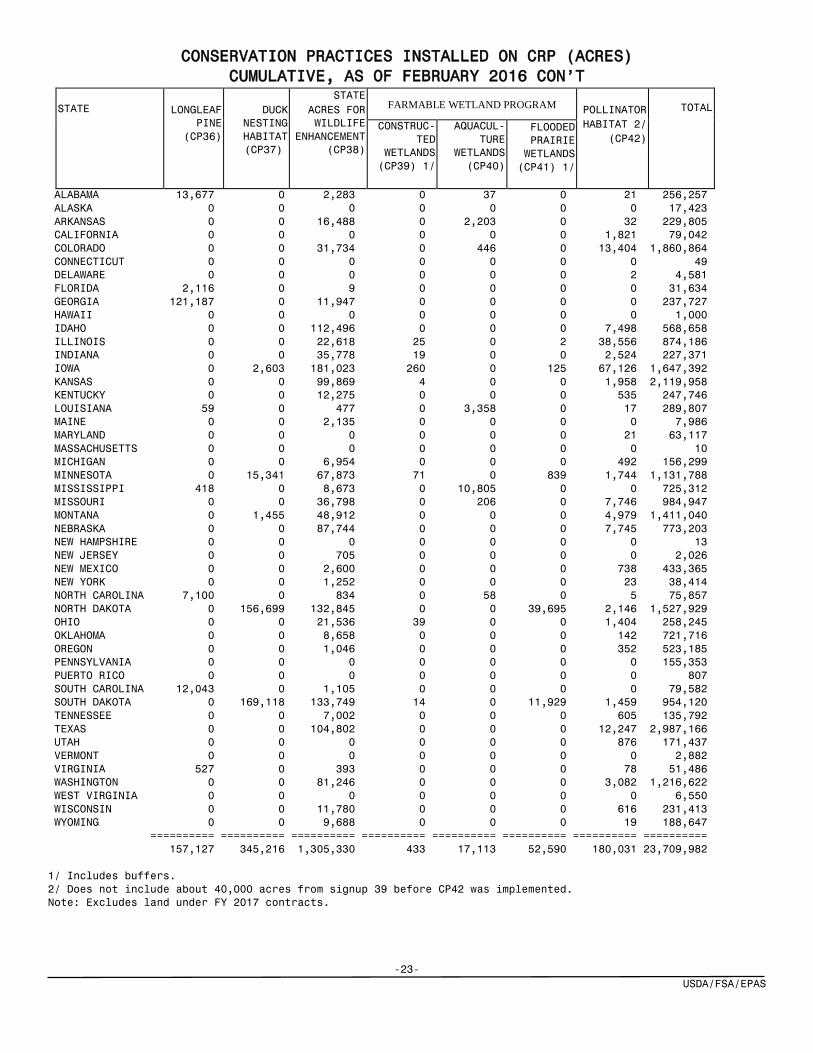
CONSERVATION PRACTICES INSTALLED ON CRP (ACRES) CUMULATIVE, AS OF FEBRUARY 2016 CON’T
STATE
LONGLEAF
PINE (CP36)
DUCK
NESTING HABITAT
(CP37)
STATE ACRES FOR WILDLIFE
ENHANCEMENT (CP38)
FARMABLE WETLAND PROGRAM
POLLINATOR HABITAT 2/
(CP42)
TOTAL
CONSTRUC-TED
WETLANDS (CP39) 1/
AQUACUL-TURE
WETLANDS (CP40)
FLOODED PRAIRIE WETLANDS (CP41) 1/
ALABAMA 13,677 0 2,283 0 37 0 21 256,257 ALASKA 0 0 0 0 0 0 0 17,423 ARKANSAS 0 0 16,488 0 2,203 0 32 229,805 CALIFORNIA 0 0 0 0 0 0 1,821 79,042 COLORADO 0 0 31,734 0 446 0 13,404 1,860,864 CONNECTICUT 0 0 0 0 0 0 0 49 DELAWARE 0 0 0 0 0 0 2 4,581 FLORIDA 2,116 0 9 0 0 0 0 31,634 GEORGIA 121,187 0 11,947 0 0 0 0 237,727 HAWAII 0 0 0 0 0 0 0 1,000 IDAHO 0 0 112,496 0 0 0 7,498 568,658 ILLINOIS 0 0 22,618 25 0 2 38,556 874,186 INDIANA 0 0 35,778 19 0 0 2,524 227,371 IOWA 0 2,603 181,023 260 0 125 67,126 1,647,392 KANSAS 0 0 99,869 4 0 0 1,958 2,119,958 KENTUCKY 0 0 12,275 0 0 0 535 247,746 LOUISIANA 59 0 477 0 3,358 0 17 289,807 MAINE 0 0 2,135 0 0 0 0 7,986 MARYLAND 0 0 0 0 0 0 21 63,117 MASSACHUSETTS 0 0 0 0 0 0 0 10 MICHIGAN 0 0 6,954 0 0 0 492 156,299 MINNESOTA 0 15,341 67,873 71 0 839 1,744 1,131,788 MISSISSIPPI 418 0 8,673 0 10,805 0 0 725,312 MISSOURI 0 0 36,798 0 206 0 7,746 984,947 MONTANA 0 1,455 48,912 0 0 0 4,979 1,411,040 NEBRASKA 0 0 87,744 0 0 0 7,745 773,203 NEW HAMPSHIRE 0 0 0 0 0 0 0 13 NEW JERSEY 0 0 705 0 0 0 0 2,026 NEW MEXICO 0 0 2,600 0 0 0 738 433,365 NEW YORK 0 0 1,252 0 0 0 23 38,414 NORTH CAROLINA 7,100 0 834 0 58 0 5 75,857 NORTH DAKOTA 0 156,699 132,845 0 0 39,695 2,146 1,527,929 OHIO 0 0 21,536 39 0 0 1,404 258,245 OKLAHOMA 0 0 8,658 0 0 0 142 721,716 OREGON 0 0 1,046 0 0 0 352 523,185 PENNSYLVANIA 0 0 0 0 0 0 0 155,353 PUERTO RICO 0 0 0 0 0 0 0 807 SOUTH CAROLINA 12,043 0 1,105 0 0 0 0 79,582 SOUTH DAKOTA 0 169,118 133,749 14 0 11,929 1,459 954,120 TENNESSEE 0 0 7,002 0 0 0 605 135,792 TEXAS 0 0 104,802 0 0 0 12,247 2,987,166 UTAH 0 0 0 0 0 0 876 171,437 VERMONT 0 0 0 0 0 0 0 2,882 VIRGINIA 527 0 393 0 0 0 78 51,486 WASHINGTON 0 0 81,246 0 0 0 3,082 1,216,622 WEST VIRGINIA 0 0 0 0 0 0 0 6,550 WISCONSIN 0 0 11,780 0 0 0 616 231,413 WYOMING 0 0 9,688 0 0 0 19 188,647 ========== ========== ========== ========== ========== ========== ========== ========== 157,127 345,216 1,305,330 433 17,113 52,590 180,031 23,709,982 1/ Includes buffers. 2/ Does not include about 40,000 acres from signup 39 before CP42 was implemented. Note: Excludes land under FY 2017 contracts.
-23- USDA/FSA/EPAS

Note: Includes land under FY 2017 contracts.
-24- USDA/FSA/EPAS
State Acres for Wildlife Enhancement (SAFE)Active Co ntra c ts a s o f Fe b rua ry 2016
State Allocation CP38A CP38B CP38C CP38D CP38E Total AcresBuffers Wetlands Trees Longleaf
PineGrass
Alabama 3,800 2,283.3 2,283.3Arkansas 18,900 2,174.2 5,002.4 9,311.6 16,488.2Colorado 71,050 31,734.2 31,734.2Georgia 17,800 11,946.7 9.7 11,956.4Idaho 162,300 155.7 1.0 112,339.7 112,496.4Illinois 26,000 515.1 91.3 22,011.8 22,618.2Indiana 52,950 178.0 4,331.9 31,268.5 35,778.3Iowa 184,550 1,132.9 1,018.0 178,872.5 181,023.4Kansas 164,300 99,869.1 99,869.1Kentucky 12,700 64.2 12,210.5 12,274.7Louisiana 1,700 261.3 215.4 476.7Maine 2,250 2,134.6 2,134.6Michigan 13,500 6,954.2 6,954.2Minnesota 72,000 67,872.7 67,872.7Mississippi 17,900 361.7 8,311.7 8,673.4Missouri 45,230 36,797.7 36,797.7Montana 51,500 126.9 48,785.6 48,912.5Nebraska 91,900 87,744.1 87,744.1Nevada 400New Jersey 1,750 4.2 701.0 705.2New Mexico 2,600 2,600.0 2,600.0New York 4,900 1,252.1 1,252.1North Carolina 2,600 834.0 834.0North Dakota 133,143 2,814.1 130,052.7 132,866.8Ohio 57,600 78.2 21.5 21,436.3 21,536.0Oklahoma 15,100 8,658.4 8,658.4Oregon 5,500 1,045.7 1,045.7Pennsylvania 2,600 0.0Puerto Rico 1,300 0.0South Carolina 2,300 1,104.8 1,104.8South Dakota 135,800 620.8 133,127.9 133,748.7Tennessee 12,200 39.2 49.8 6,913.0 7,002.0Texas 152,500 104,802.0 104,802.0Virginia 2,300 10.0 298.2 308.2Washington 115,100 189 81,057.0 81,246.2Wisconsin 22,250 64.3 11,716.2 11,780.5Wyoming 10,000 9,688.2 9,688.2Regular Reserve 47,027LPC Reserve 12,700Total: 1,750,000 344.8 7,747.9 23,159.7 298.2 1,273,716.2 1,305,266.9
SAFE Pra ctice Pra ctice T yp e Ap p lica b le CRP Pra ctice sCP38A Buffers CP8, CP21, CP22CP38B Wetlands CP9, CP23, CP23A, CP27, CP28, CP37CP38C TreesCP38D Longleaf Pine CP3A, CP36CP38E Grass
CP3, CP3A, CP16, CP17, CP25, CP31
CP1, CP2, CP4D, CP8, CP12, CP15, CP18, CP24, CP25, CP33
Note: Includes land under FY 2017 contracts.
-25- USDA/FSA/EPAS
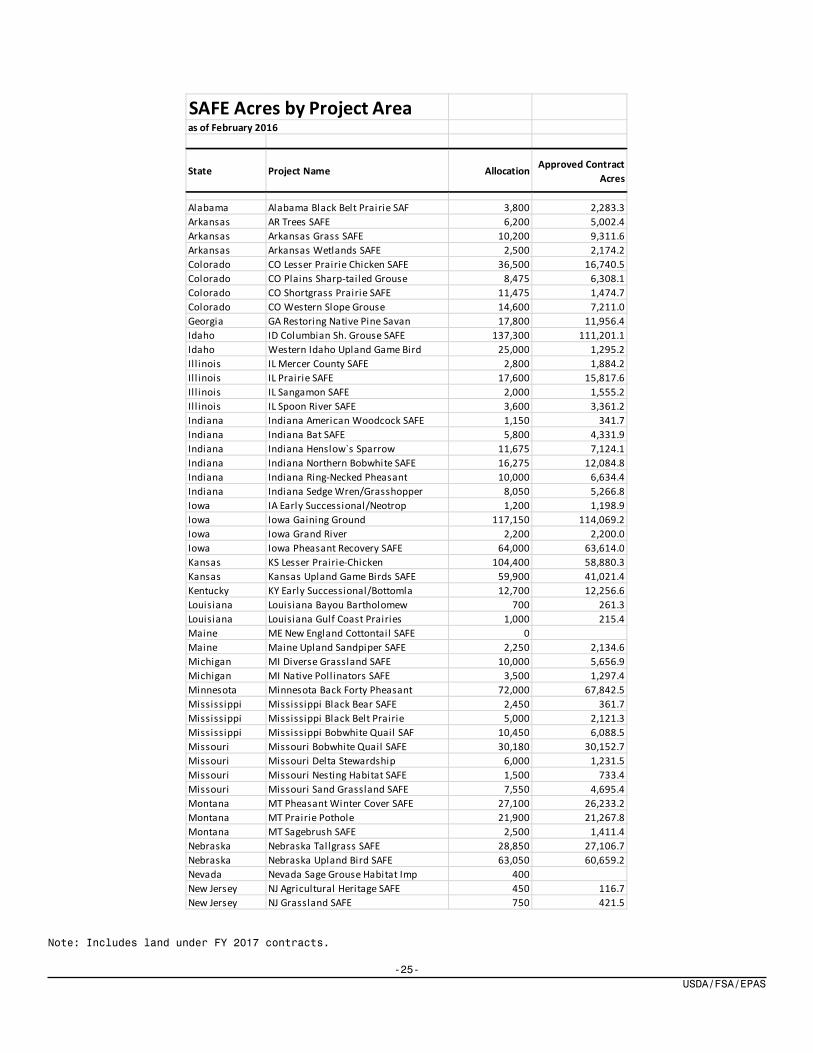
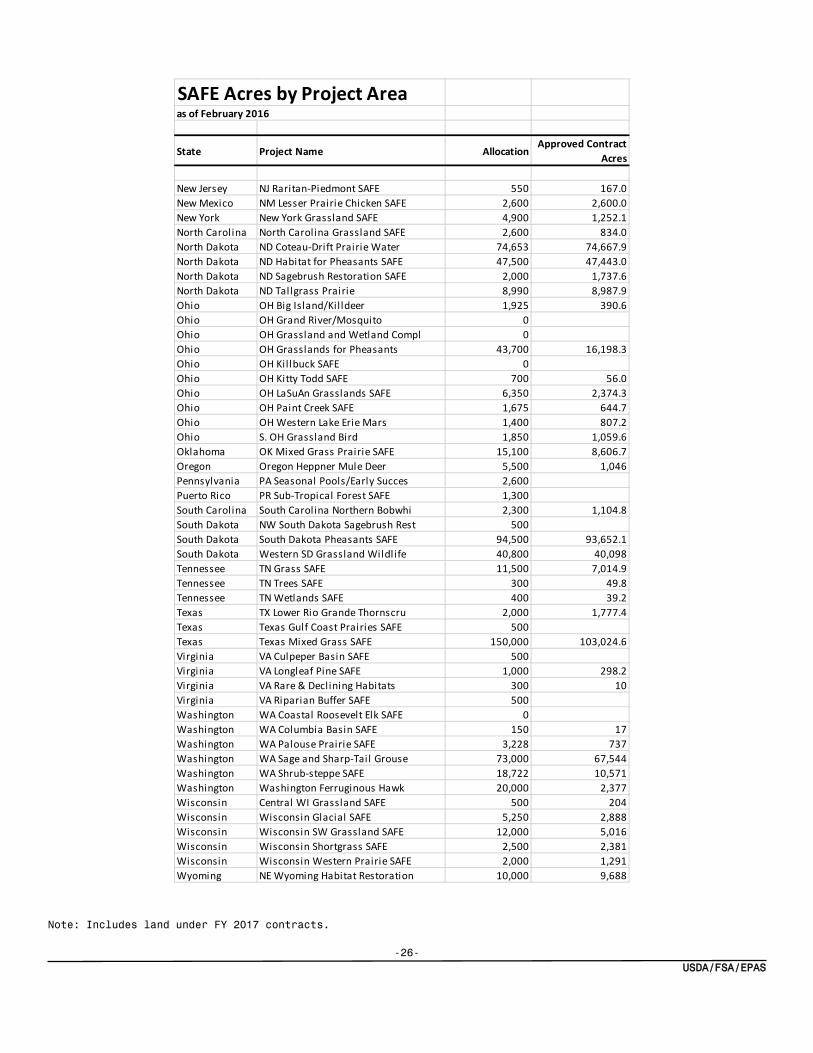
SAFE Acres by Project Areaas of February 2016
State Project Name Allocation Approved Contract Acres
Alabama Alabama Black Belt Prairie SAF 3,800 2,283.3Arkansas AR Trees SAFE 6,200 5,002.4Arkansas Arkansas Grass SAFE 10,200 9,311.6Arkansas Arkansas Wetlands SAFE 2,500 2,174.2Colorado CO Lesser Prairie Chicken SAFE 36,500 16,740.5Colorado CO Plains Sharp-tailed Grouse 8,475 6,308.1Colorado CO Shortgrass Prairie SAFE 11,475 1,474.7Colorado CO Western Slope Grouse 14,600 7,211.0Georgia GA Restoring Native Pine Savan 17,800 11,956.4Idaho ID Columbian Sh. Grouse SAFE 137,300 111,201.1Idaho Western Idaho Upland Game Bird 25,000 1,295.2Il l inois IL Mercer County SAFE 2,800 1,884.2Il l inois IL Prairie SAFE 17,600 15,817.6Il l inois IL Sangamon SAFE 2,000 1,555.2Il l inois IL Spoon River SAFE 3,600 3,361.2Indiana Indiana American Woodcock SAFE 1,150 341.7Indiana Indiana Bat SAFE 5,800 4,331.9Indiana Indiana Henslow`s Sparrow 11,675 7,124.1Indiana Indiana Northern Bobwhite SAFE 16,275 12,084.8Indiana Indiana Ring-Necked Pheasant 10,000 6,634.4Indiana Indiana Sedge Wren/Grasshopper 8,050 5,266.8Iowa IA Early Successional/Neotrop 1,200 1,198.9Iowa Iowa Gaining Ground 117,150 114,069.2Iowa Iowa Grand River 2,200 2,200.0Iowa Iowa Pheasant Recovery SAFE 64,000 63,614.0Kansas KS Lesser Prairie-Chicken 104,400 58,880.3Kansas Kansas Upland Game Birds SAFE 59,900 41,021.4Kentucky KY Early Successional/Bottomla 12,700 12,256.6Louisiana Louisiana Bayou Bartholomew 700 261.3Louisiana Louisiana Gulf Coast Prairies 1,000 215.4Maine ME New England Cottontail SAFE 0Maine Maine Upland Sandpiper SAFE 2,250 2,134.6Michigan MI Diverse Grassland SAFE 10,000 5,656.9Michigan MI Native Poll inators SAFE 3,500 1,297.4Minnesota Minnesota Back Forty Pheasant 72,000 67,842.5Mississippi Mississippi Black Bear SAFE 2,450 361.7Mississippi Mississippi Black Belt Prairie 5,000 2,121.3Mississippi Mississippi Bobwhite Quail SAF 10,450 6,088.5Missouri Missouri Bobwhite Quail SAFE 30,180 30,152.7Missouri Missouri Delta Stewardship 6,000 1,231.5Missouri Missouri Nesting Habitat SAFE 1,500 733.4Missouri Missouri Sand Grassland SAFE 7,550 4,695.4Montana MT Pheasant Winter Cover SAFE 27,100 26,233.2Montana MT Prairie Pothole 21,900 21,267.8Montana MT Sagebrush SAFE 2,500 1,411.4Nebraska Nebraska Tallgrass SAFE 28,850 27,106.7Nebraska Nebraska Upland Bird SAFE 63,050 60,659.2Nevada Nevada Sage Grouse Habitat Imp 400New Jersey NJ Agricultural Heritage SAFE 450 116.7New Jersey NJ Grassland SAFE 750 421.5
Note: Includes land under FY 2017 contracts.
-26- USDA/FSA/EPAS
SAFE Acres by Project Areaas of February 2016
State Project Name AllocationApproved Contract
Acres
New Jersey NJ Raritan-Piedmont SAFE 550 167.0New Mexico NM Lesser Prairie Chicken SAFE 2,600 2,600.0New York New York Grassland SAFE 4,900 1,252.1North Carolina North Carolina Grassland SAFE 2,600 834.0North Dakota ND Coteau-Drift Prairie Water 74,653 74,667.9North Dakota ND Habitat for Pheasants SAFE 47,500 47,443.0North Dakota ND Sagebrush Restoration SAFE 2,000 1,737.6North Dakota ND Tallgrass Prairie 8,990 8,987.9Ohio OH Big Island/Kil ldeer 1,925 390.6Ohio OH Grand River/Mosquito 0Ohio OH Grassland and Wetland Compl 0Ohio OH Grasslands for Pheasants 43,700 16,198.3Ohio OH Kil lbuck SAFE 0Ohio OH Kitty Todd SAFE 700 56.0Ohio OH LaSuAn Grasslands SAFE 6,350 2,374.3Ohio OH Paint Creek SAFE 1,675 644.7Ohio OH Western Lake Erie Mars 1,400 807.2Ohio S. OH Grassland Bird 1,850 1,059.6Oklahoma OK Mixed Grass Prairie SAFE 15,100 8,606.7Oregon Oregon Heppner Mule Deer 5,500 1,046Pennsylvania PA Seasonal Pools/Early Succes 2,600Puerto Rico PR Sub-Tropical Forest SAFE 1,300South Carolina South Carolina Northern Bobwhi 2,300 1,104.8South Dakota NW South Dakota Sagebrush Rest 500South Dakota South Dakota Pheasants SAFE 94,500 93,652.1South Dakota Western SD Grassland Wildlife 40,800 40,098Tennessee TN Grass SAFE 11,500 7,014.9Tennessee TN Trees SAFE 300 49.8Tennessee TN Wetlands SAFE 400 39.2Texas TX Lower Rio Grande Thornscru 2,000 1,777.4Texas Texas Gulf Coast Prairies SAFE 500Texas Texas Mixed Grass SAFE 150,000 103,024.6Virginia VA Culpeper Basin SAFE 500Virginia VA Longleaf Pine SAFE 1,000 298.2Virginia VA Rare & Declining Habitats 300 10Virginia VA Riparian Buffer SAFE 500Washington WA Coastal Roosevelt Elk SAFE 0Washington WA Columbia Basin SAFE 150 17Washington WA Palouse Prairie SAFE 3,228 737Washington WA Sage and Sharp-Tail Grouse 73,000 67,544Washington WA Shrub-steppe SAFE 18,722 10,571Washington Washington Ferruginous Hawk 20,000 2,377Wisconsin Central WI Grassland SAFE 500 204Wisconsin Wisconsin Glacial SAFE 5,250 2,888Wisconsin Wisconsin SW Grassland SAFE 12,000 5,016Wisconsin Wisconsin Shortgrass SAFE 2,500 2,381Wisconsin Wisconsin Western Prairie SAFE 2,000 1,291Wyoming NE Wyoming Habitat Restoration 10,000 9,688
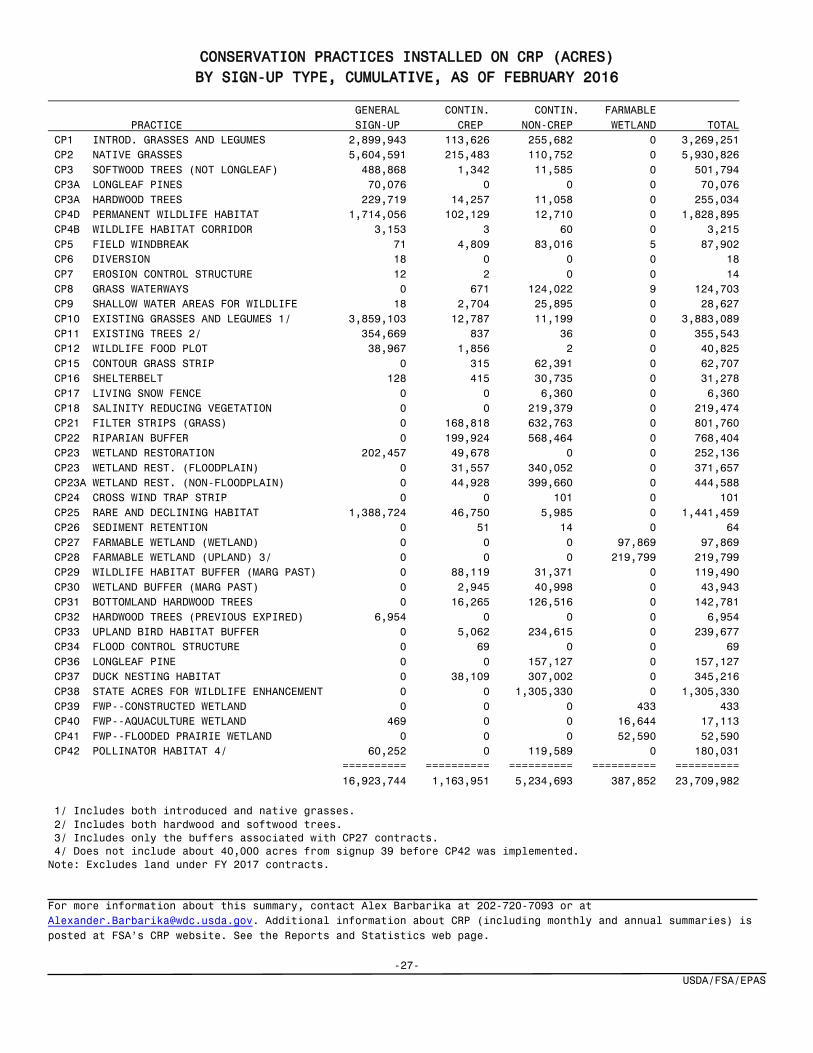
CONSERVATION PRACTICES INSTALLED ON CRP (ACRES) BY SIGN-UP TYPE, CUMULATIVE, AS OF FEBRUARY 2016
GENERAL CONTIN. CONTIN. FARMABLE PRACTICE SIGN-UP CREP NON-CREP WETLAND TOTAL CP1 INTROD. GRASSES AND LEGUMES 2,899,943 113,626 255,682 0 3,269,251 CP2 NATIVE GRASSES 5,604,591 215,483 110,752 0 5,930,826 CP3 SOFTWOOD TREES (NOT LONGLEAF) 488,868 1,342 11,585 0 501,794 CP3A LONGLEAF PINES 70,076 0 0 0 70,076 CP3A HARDWOOD TREES 229,719 14,257 11,058 0 255,034 CP4D PERMANENT WILDLIFE HABITAT 1,714,056 102,129 12,710 0 1,828,895 CP4B WILDLIFE HABITAT CORRIDOR 3,153 3 60 0 3,215 CP5 FIELD WINDBREAK 71 4,809 83,016 5 87,902 CP6 DIVERSION 18 0 0 0 18 CP7 EROSION CONTROL STRUCTURE 12 2 0 0 14 CP8 GRASS WATERWAYS 0 671 124,022 9 124,703 CP9 SHALLOW WATER AREAS FOR WILDLIFE 18 2,704 25,895 0 28,627 CP10 EXISTING GRASSES AND LEGUMES 1/ 3,859,103 12,787 11,199 0 3,883,089 CP11 EXISTING TREES 2/ 354,669 837 36 0 355,543 CP12 WILDLIFE FOOD PLOT 38,967 1,856 2 0 40,825 CP15 CONTOUR GRASS STRIP 0 315 62,391 0 62,707 CP16 SHELTERBELT 128 415 30,735 0 31,278 CP17 LIVING SNOW FENCE 0 0 6,360 0 6,360 CP18 SALINITY REDUCING VEGETATION 0 0 219,379 0 219,474 CP21 FILTER STRIPS (GRASS) 0 168,818 632,763 0 801,760 CP22 RIPARIAN BUFFER 0 199,924 568,464 0 768,404 CP23 WETLAND RESTORATION 202,457 49,678 0 0 252,136 CP23 WETLAND REST. (FLOODPLAIN) 0 31,557 340,052 0 371,657 CP23A WETLAND REST. (NON-FLOODPLAIN) 0 44,928 399,660 0 444,588 CP24 CROSS WIND TRAP STRIP 0 0 101 0 101 CP25 RARE AND DECLINING HABITAT 1,388,724 46,750 5,985 0 1,441,459 CP26 SEDIMENT RETENTION 0 51 14 0 64 CP27 FARMABLE WETLAND (WETLAND) 0 0 0 97,869 97,869 CP28 FARMABLE WETLAND (UPLAND) 3/ 0 0 0 219,799 219,799 CP29 WILDLIFE HABITAT BUFFER (MARG PAST) 0 88,119 31,371 0 119,490 CP30 WETLAND BUFFER (MARG PAST) 0 2,945 40,998 0 43,943 CP31 BOTTOMLAND HARDWOOD TREES 0 16,265 126,516 0 142,781 CP32 HARDWOOD TREES (PREVIOUS EXPIRED) 6,954 0 0 0 6,954 CP33 UPLAND BIRD HABITAT BUFFER 0 5,062 234,615 0 239,677 CP34 FLOOD CONTROL STRUCTURE 0 69 0 0 69 CP36 LONGLEAF PINE 0 0 157,127 0 157,127 CP37 DUCK NESTING HABITAT 0 38,109 307,002 0 345,216 CP38 STATE ACRES FOR WILDLIFE ENHANCEMENT 0 0 1,305,330 0 1,305,330 CP39 FWP--CONSTRUCTED WETLAND 0 0 0 433 433 CP40 FWP--AQUACULTURE WETLAND 469 0 0 16,644 17,113 CP41 FWP--FLOODED PRAIRIE WETLAND 0 0 0 52,590 52,590 CP42 POLLINATOR HABITAT 4/ 60,252 0 119,589 0 180,031 ========== ========== ========== ========== ========== 16,923,744 1,163,951 5,234,693 387,852 23,709,982 1/ Includes both introduced and native grasses. 2/ Includes both hardwood and softwood trees. 3/ Includes only the buffers associated with CP27 contracts. 4/ Does not include about 40,000 acres from signup 39 before CP42 was implemented. Note: Excludes land under FY 2017 contracts. For more information about this summary, contact Alex Barbarika at 202-720-7093 or at [email protected]. Additional information about CRP (including monthly and annual summaries) is posted at FSA’s CRP website. See the Reports and Statistics web page.
-27- USDA/FSA/EPAS