monthly update november 2015
TRANSCRIPT
MONTHLY UPDATE NOVEMBER 2015 Issued as at 11/12/2015

MACRO & STOCK MARKET UPDATE IN NOVEMBER 2015
Macro Review
Stock Market Update
FUND PERFORMANCE UPDATE
Vietnam Securities Investment Fund (VFMVF1)
Vietnam Blue-chip Fund (VFMVF4)
Vietnam Active Fund (VFMVFA)
Vietnam Bond Fund (VFMVFB)
VFMVN30 ETF Fund (E1VFVN30)
CONTENTS
DISCLAMER
This document is issued by VietFund Management (VFM). The information herein is deemed reliable sources by VFM, based on published sources and VFM isn’t responsible for
the accuracy of the information herein, except the information, data of Funds managed by VFM and provided in this document. This document reflects the views and
assessments of the author at the time of issue, for references only and may change without notice. This document is neither a prospectus nor an offer or any commitment of VFM
or Funds managed by VFM. VFM hasn’t obligation to update, revise this document in any form in the case of opinions, forecasts and estimations in this document changes or
becomes inaccurate.

THE ECONOMIC INDICATORS FY2015 AND PLAN FY2016
The economic data in November 2015 predicted a successful year of economic growth.
Forecast GDP growth reached 6.6% FY2015, higher than plan of 6.5%. The Congress has
approved the plan for 2016 with a higher growth rate at 6.7%. Vietnam's GDP growth rate
higher than in 2016 is also in forecast of World Bank, Asian Development Bank and
International Monetary Fund (IMF). The potential for growth in 2016 is very strong thanks
to the completion of negotiations on The Trans-Pacific Partnership (TPP) and other free
trade agreements (ASEAN, Vietnam - EU). Vietnam is attracting foreign direct investment
(FDI) and FDI is expected to rise sharply in 2016 to prepare for the effectiveness of TPP.
Vietnam's economy is facing the pressure of Vietnam dong devaluation against the US
dollar, budget deficit and trade deficit. However, the obstacles are minor compared with
the existing potential.
INFLATION TO BE HIGHER IN 2016
Core inflation FY2015 is expected to be lower than 2% and inflation lower than 1%.
Inflation in 2015 is very low since 2010 and brings concern about close-to-zero inflation.
But the increase of consumption showed that close-to-zero inflation has yet to be a
problem. The reason for the decline in inflation in 2015 can be explained by the price
reduction and no significant increase of the transportation group (due to lower oil prices)
and food. Inflation in 2016 is forecasted to rise again and to be higher than 2015 due to
the low base of 2015 inflation and the bounce back of oil prices. The low base of inflation
in 2015 and 2016 will strongly support for production and the State Bank of Vietnam in
conducting monetary market.
HIGH POSITIVE REAL DEPOSIT RATES Inflation has been controlled since 2012 and in 2015 inflation was very low. Deposit
interest rates and government bond yields have lowered in the 2012-2015 period.
However, the recent strong decrease of inflation has made the real deposit rates and bond
yields in 2015 the highest in 5 years. Positive real interest rates have supported the
deposits in the banking system and the difference between the deposit rate of VND and
USD has made the deposit of VND become more attractive. Estimated real interest rates
remain positive in the following year but will be lower than in 2015 due to the return of
inflation.
CREDIT GROWTH & A RETURN TO NORMAL INTEREST RATES
Credit growth in 11 months was 14.35% compared with the beginning of the year,
expected credit growth FY2015 could reach 17%, on track with the target. Credit growth is
consistent with the growth rate of the economy, but highly focused on real estate and
consumption lending. The interest rate has seen a sharp decline from 2011-2015 and
stabilizes in 2015, supporting the credit growth. The interest rate has stabilized with the 2-
year government bond yield higher than 12 months deposit rate on the market in 2015.
This sign shows that interest rates have become consistent with the borrowing capacity of
the economic sectors and brings the activities in the credit markets to return to stability.
The forecast for 2016 shows that lending rates may rise slightly, annual credit growth at
16% -17% consistent with GDP growth target of 6.7%-6.8%.
MACRO REVIEW IN NOVEMBER 2015
INDEX CHART
Unit 2013 2014 2015E Plan
2016
GDP Growth % 5,4 6,0 6,6 6,7(*)
Inflation % 6,0 1,8 0,7 <5(*)
Export Growth % 15,4 13,6 10 10(*)
Import Growth % 15,4 12,1 13,5 12
Trade balance bn $ 0,9 2,0 -4,0 -8
FDI disburse-ment
bn $ 11,5 12,4 14 15-16
Foreign ex-change reserves
bn $ 27,0 34,5 30 31
Social Invest-ment
%GDP 30,4 31 29-30 31
Average lending rate - Left Inflation - Right
INFLATION & REAL INTEREST RATE
YoY Inflation Real rate 2-year VGB yield
INFLATION & REAL INTEREST RATE
12 MONTH DEPOSIT RATE & 2-YEAR VGB YIELD
12 Month deposit rate

MONEY FOCUSED MORE ON SPECULATIVE STOCKS WHEREAS BLUE-CHIP
STOCKS FELL DOWN
Stock market was traded in negative sentiment in the whole month of November 2015. Money moved
to mid-cap and speculative stocks and ran away from big-cap stocks, especially from banking stocks.
Therefore, VN-Index which has a big contribution from banking stocks also retreated from the high
zone in October 2015. At the end of November 2015, VN-Index closed at 573,2 point, decreased by
34,17 point or 5.62 percent decrease MoM. Total trading volume equaled to 2.79 billion shares,
increased by 6.5 percent MoM and trading value achieved nearly VND48,000 billion, increased by 4.3
percent compared to October 2015 trading value.
Market had fifteen sessions ended with the close lower than the open, made VN-Index lost 9.86
percent and had only six sessions close with the close higher than the open, helped VN-Index recover
by 4.24 percent. VN-Index peaked at 617.93 point but the selling pressure of big-cap stocks made
market retreat and break through several supported points even though there were some recovered
sessions in the supported points. Money flow therefore looked for stocks of real estate development,
food & beverage sectors and avoided big-cap stocks. Some stocks helped VN-Index grow in
November 2015 are VNM (helped VN-Index increased by 0.6 percent), CTD (0.08 percent), HNG (0.06
percent), KDC (0.06 percent) and PNJ (0.06 percent). In contrast, stocks made VN-Index fall down are
VCB (made VN-Index decreased by 1.07 percent), BID (1.02 percent), GAS (0.88 percent), CTG (0.71
percent), VIC (0.41 percent).
WITHOUT SUPPORTED NEWS AND HIGHER VOLATILITY, FOREIGNERS TURNED
TO BE THE NET SELLERS
Vietnam stock market decreased strongly in November 2015 with contribution of net selling of
foreigners. In this month, foreigners sold VND496 billion in HOSE exchange but bought nearly
VND115 billion in HNX exchange. Some stocks they bought in this month are DLG (VND164 billion net
buying), VCB (VND104billion), CII (VND90 billion), HNG (VND80 billion), DPM (VND69 billion). They
also sold stocks such as (MSN (VND474 billion), HHS (VND194 billion), HAG VND150 billion), KDC
(VND128 billion), GAS (VND108 billion).
In the last eleven months of 2015, foreigners had seven months net buying and four months of net
selling with total net buy of VND4,100 billion.
Regarding to two foreign ETF funds, both ETF funds were redeemed with Market Vector Vietnam ETF
redemption of US$2 million and DB X-Tracker FTSE Vietnam Index ETF redemption of US$3 million.
This trend is similar to ETF trend in the emerging market when ETF funds were redeemed by US$99
million in November 2015.
MARKET CAN CONTINUE TO BE NEGATIVE WITH BAD NEWS FROM OUTSIDE AND
RECOVERY MAY NOT HAPPEN SOON
Market in November 2015 witnessed the volatility with strong selling of blue-chip stocks. Furthermore,
oil price fell down in the first days of December 2015 also made investor’s sentiment more negative
along with redemption of ETF funds. Market in December 2015 can be impacted by several factors
such as: i) Stock margin loan is still high and margin call can be happened when VN-Index fall down
further, ii) Rebalancing of both foreign ETF funds when they include some more new stocks and
reduce others which are the big-cap stocks, iii) Delay of increase of FOL, iv) some big IPOs (such as
ACV, etc.) can attract money from listed market.
From technical view, VN-Index broke several important support points such as short term and long
term MA in 590 point. Besides, trading volume in some first days of December is lower than average
volume in twenty sessions. Therefore, we worry about the recovery of market in December 2015. The
next support zone of VN-Index is from 550 to 560 point and the strong resistance of VN-Index is 590
point.
INDEX CHART
STOCK MARKET IN NOVEMBER 2015

VFMVF1 FUND Nov 2015
INVESTMENT OBJECTIVES
The objective of VFMVF1 is to seek long-term earnings from equity growth and income
through investing into a balanced and diversified portfolio, including equity, convertible
and debt securities in Vietnam.
The Fund normally invests approximately 80% of its NAV in equity and 20% in fixed
income and cash. The targeting investments are growth stocks among large and mid-
sized market capitalization stocks. The manager will apply a bottom-up approach to pick
stocks in consideration of business model, long-term earning, asset value, cash flow
potential and quality of management. The Fund may from time to time change the weight
of equity and fixed-income investments at around +/-10% NAV from the targeted
allocation to get an optimal asset mix in consideration of changes in economic market
conditions.
FUND PERFORMANCE
After reaching 615 points at the beginning of November, market has corrected, ending
November with a decrease of 4.4% MoM. This correction is resulted from strong selling
pressure from foreign investors and risk of force sell from high lending margin in market.
Due to strong market downturn, VF1 net returns slumped to -4.1%; however, the fund’s
loss is limited at less than the level of Benchmark reduction (at -4.4%). This
outperformance is attributed to the fact that we put less weight in Banking Industry
(10.8%NAV vs. 27% in VN-Index), while Banking sector was the worst performer in the
index. On top of that, our picks on VNM (+5% mom), KDH (+3.5%) and SKG (+3.5%)
have created a large positive contribution to the fund asset. Besides, other negative
contributors were Consumer Durables (TCM) and Real estate (DXG, KBC).
Accumulative from the beginning of 2015, NAV/unit of VF1 has advanced 11.9%, more
than double growth of its benchmark and the VN-Index (both at 5.1%)
NAV PERFORMANCE
Performance (%) NAV/Unit
(VND) &
Indices 1
month
3
months YTD
Trailing
12 months
Since
Inception
(20/5/2004)
VFMVF1 23,237.9 (4.1) 4.4 11.9 7.5 205.9 (*)
VF1 Benchmark 247.0 (4.4) 1.5 5.1 2.1 147.0
VN-Index 573.2 (5.6) 1.5 5.1 1.2 119.1
HNX-Index 80.6 (2.0) 4.8 (2.9) (7.8) n/a
-
100.0
200.0
300.0
400.0
500.0
600.0
5/2004 6/2005 6/2006 7/2007 7/2008 8/2009 8/2010 9/2011 9/2012 10/2013 10/2014 11/2015
VF1 VF1 Benchmark VN-Index
VFMVF1 PERFORMANCE (*) VS. INDEX 20/05/2004 = 100
FUND FACTS
Fund name Vietnam Securities Investment Fund
Fund Code VFMVF1
Fund Type Open-ended Fund
Currency VND
Inception date 20/05/2004
Conversion date 08/10/2013
Fund Manager VietFund Management (VFM)
Custodian Bank Standard Chartered Bank VN
Transfer Agency Vietnam Securities Depository (VSD)
Distributors
ABS, HSC, FPTS, KIS, MSBS,
SBS, SSI, VCBS, VSC, VCSC,
VDSC, VND, VFM
Management fee 1.95%
Subscription fee From 0.2% to 1% based on total subscribed amount (million VND)
Redemption fee From 0% to 1.5% based on holding period since subscription date (days)
Switching fee 0% based on total switched amount
Minimum subscription order 1 million VND
Minimum account balance 100 units
Trading cycle Everyday (T day)
Cut-off time 10:30am, T-1 day
Dividend Annually
(satisfied the requirements)
Total NAV (billion VND) 652.6
Number of fund unit 28,082,829.3
NAV/unit 12-month high 24,660.0
NAV/unit 12-month low 19,207.2
Expense Ratio (%) 2.3
12-month Turnover Ratio (%) 91.0
Ms. Luong Thi My Hanh - Fund Manager
Tel: +84 8 38251488 - Fax: +84 8 38251489
Email: [email protected]
(*) VF1 Benchmark = 80% VN-Index + 20% Bond Index 1Y
(**) Including dividends paid to investors

VietFund Management (VFM) | Unit 1701-04, 17th Floor, Me Linh Point Tower, 2 Ngo Duc Ke, Dist 1, Ho Chi Minh City, Vietnam | Tel: +84 8 3825 1488 | Fax: +84 8 3825 1489
TOP 10 HOLDINGS ASSET ALLOCATION BY ASSET SECTOR (% NAV)
DISCLAMER
This document is issued by VietFund Management (VFM). The information herein is deemed reliable sources by VFM, based on publ ished sources and VFM isn’t responsible for the accuracy of the
information herein, except the information, data of Funds managed by VFM and provided in this document. This document reflects the views and assessments of the author at the time of issue, for
references only and may change without notice. This document is neither a prospectus nor an offer or any commitment of VFM or Funds managed by VFM. VFM hasn’t obligation to update, revise this
document in any form in the case of opinions, forecasts and estimations in this document changes or becomes inaccurate.
75.0
7.3
12.0
5.7
HOSE
HNX
Certificate of Deposit
Cash
ASSET ALLOCATION BY ASSET CLASS (% NAV)
VF1 VN-Index
P/E (median) 11.2 9.2
P/E 10.8 11.1
P/B (median) 1.9 1.1
P/B 1.9 1.7
ROE (%) 23.6 15.8
Dividend Yield (%) 3.6 4.0
Number of holdings 23 309
FUNDAMENTAL STATISTICS
VF1 VN-Index
Beta 0.8 1.0
Standard Deviation (%) 17.0 17.3
Sharpe Ratio 0.1 (0.1)
RISK STATISTICS INVESTMENT RESTRICTIONS
Investment Assets Limit
Cash & cash equivalents 49% Total Asset
Assets issued by the same group of companies 30% Total Asset
Securities in circulation of an issuer 20% Total Asset
Securities in circulation of an issuer 10% Outstanding Shares
Shares/bonds to be listed or registered for trading 10% Total Asset
Holdings of 5% or more of total asset in aggregate 40% Total Asset
(Source: VFM và Bloomberg)
Stock Bourse % NAV Sector
VNM HOSE 14.5 Food Beverage & Tobacco
FPT HOSE 8.0 Technology Hardware & Equipment
BMP HOSE 4.6 Capital Goods
TCM HOSE 4.5 Consumer Durables & Apparel
SKG HOSE 4.5 Transportation
VCB Banks HOSE 4.2
VIC Real Estate HOSE 3.8
HPG Materials HOSE 3.6
KDH Real Estate HOSE 3.6
CII Transportation HOSE 3.4
17.6
13.1
10.8
10.0 9.1
8.0
6.2
4.5
1.7 1.4
12.0
5.7
Food Beverage & Tobacco
Real Estate
Banks
Transportation
Materials
Technology Hardware & Equipment
Capital Goods
Consumer Durables & Apparel
Diversified Financials
Utilities
Certificate of Deposit
Cash

VFMVF4 FUND Nov 2015
0
20
40
60
80
100
120
140
160
180
2/2008 10/2008 6/2009 1/2010 9/2010 5/2011 1/2012 8/2012 4/2013 12/2013 7/2014 3/2015 11/2015
VF4 VN-Index HNX-Index
INVESTMENT OBJECTIVES
The objective of VFMVF4 is to seek long-term earnings from equity growth and dividends
through investing in top-ranking enterprises operating in the essential sectors of Vietnam
economy. The target investments shall be the blue-chip stocks listed or pre-listed on
Vietnam stock markets. The Fund will deploy fundamental analysis as the principle for
equity investment to assess growth potential, sustainability and risks of investment
opportunities.
VFMVF4 could at anytime be fully-invested in equity. Additionally, to create flexibility in
seeking investing opportunities and bringing added value to cash available, VFMVF4
could invest into fixed-income securities. In the normal market condition, proportion of
assets other than equity such as cash, cash equivalents, and fixed income shall not
exceed 20% of total fund assets to optimize cash flow.
FUND PERFORMANCE
The market in November slightly fell 5.6% after reaching the short-term peak of 615
points at 6 November 2015. The net asset value of VF4 is also affected by the general
market and decreased by 3.8%, lower than the decrease of the index.
A few bright spots in the portfolio such as sectors of Real Estate (KDH, BCI),
Transportation (SKG), or F&B (VNM) with positive growth against the trend of the market
helped to pull back the decline of the equity portfolio. In addition, the biggest negative
influencer to the VN-Index is the Banking sector, representing more than 25% of market
share but VF4 holdings of Banks is relatively lower (10.4 % NAV only) so the negative
effects was also less.
We believe that when the market has short-term correction at the end of the year due to
the strong selling pressure from foreign investors when the Federal Reserve has signaled
to raise interest rates in December, it is the good time to reallocate assets, building the
target portfolio for growth in 2016 .
NAV PERFORMANCE
Performance (%) NAV/Unit
(VND) &
Indices 1 month 3 months YTD Trailing
12 months
Since
Inception
(28/2/2008)
VFMVF4 10,526.0 (3.8) 6.0 17.3 10.6 25.3 (*)
VN-Index 573.2 (5.6) 1.5 5.1 1.2 (13.6)
HNX-Index 80.6 (2.0) 4.8 (2.9) (7.8) (64.7)
VFMVF4 PERFORMANCE VS. INDEX 28/02/2008 = 100
FUND FACTS
Fund name Vietnam Blue-chips Fund
Fund Code VFMVF4
Fund Type Open-ended Fund
Currency VND
Inception date 28/02/2008
Conversion date 16/12/2013
Fund Manager VietFund Management (VFM)
Custodian Bank Standard Chartered Bank VN
Transfer Agency Vietnam Securities Depository (VSD)
Distributors
ABS, HSC, FPTS, KIS, MSBS,
SBS, SSI, VCBS, VCSC, VDSC,
VND, VFM
Management fee 1.93%
Subscription fee
From 0.2% to 1% based on
total subscribed amount (million
VND)
Redemption fee
From 0% to 1.5% based on
holding period since subscrip-
tion date (days)
Switching fee 0% based on total switched
amount
Minimum subscription order VND1 million
Minimum account balance 100 units
Trading cycle Everyday (T day)
Cut-off time 10:30am, T-1 day
Dividend Annually
Total NAV (billion VND) 294.3
Number of fund unit 27,961,271.1
NAV/unit 12-month high (VND) 11,074.4
NAV/unit 12-month low (VND) 8,737.4
Expense Ratio (%) 2.4
12-month Turnover Ratio (%) 111.5
Ms. Phan Thi Thu Thao - Fund Manager
Tel: +84 8 38251488 - Fax: +84 8 38251489
Email: [email protected]
(*) Including dividends paid to VFMVF4’s investors
VietFund Management (VFM) | Unit 1701-04, 17th Floor, Me Linh Point Tower, 2 Ngo Duc Ke, Dist 1, Ho Chi Minh City, Vietnam | Tel: +84 8 3825 1488 | Fax: +84 8 3825 1489
VF4 VN-Index
Beta 0.9 1.0
Standard Deviation (%) 16.4 17.3
Sharpe Ratio 0.3 (0.1)
Investment Assets Limit
Cash & cash equivalents 49% Total Asset
Assets issued by the same group of companies 30% Total Asset
Securities in circulation of an issuer 20% Total Asset
Securities in circulation of an issuer 10% Outstanding Shares
Shares/bonds to be listed or registered for trading 10% Total Asset
Holdings of 5% or more of total asset in aggregate 40% Total Asset
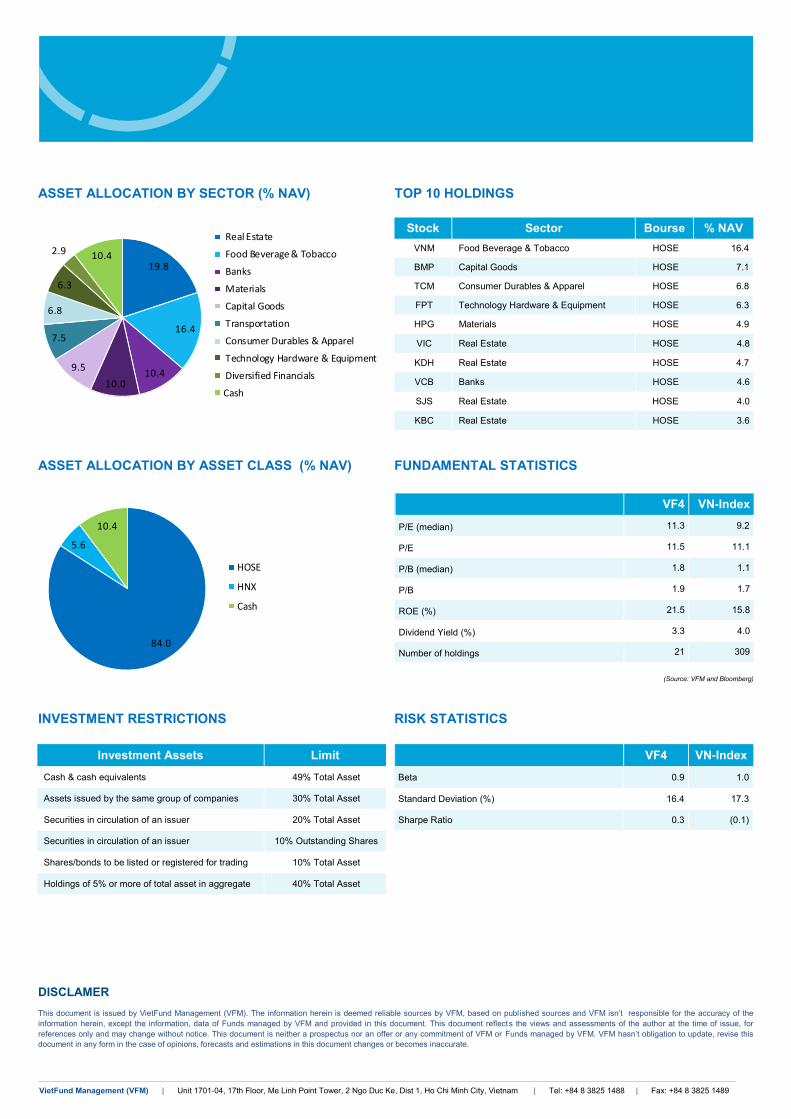
ASSET ALLOCATION BY SECTOR (% NAV)
ASSET ALLOCATION BY ASSET CLASS (% NAV) FUNDAMENTAL STATISTICS
RISK STATISTICS INVESTMENT RESTRICTIONS
(Source: VFM and Bloomberg)
DISCLAMER
This document is issued by VietFund Management (VFM). The information herein is deemed reliable sources by VFM, based on publ ished sources and VFM isn’t responsible for the accuracy of the
information herein, except the information, data of Funds managed by VFM and provided in this document. This document reflects the views and assessments of the author at the time of issue, for
references only and may change without notice. This document is neither a prospectus nor an offer or any commitment of VFM or Funds managed by VFM. VFM hasn’t obligation to update, revise this
document in any form in the case of opinions, forecasts and estimations in this document changes or becomes inaccurate.
TOP 10 HOLDINGS
VF4 VN-Index
P/E (median) 11.3 9.2
P/E 11.5 11.1
P/B (median) 1.8 1.1
P/B 1.9 1.7
ROE (%) 21.5 15.8
Dividend Yield (%) 3.3 4.0
Number of holdings 21 309
Stock Bourse % NAV Sector
VNM HOSE 16.4 Food Beverage & Tobacco
BMP HOSE 7.1 Capital Goods
TCM HOSE 6.8 Consumer Durables & Apparel
FPT HOSE 6.3 Technology Hardware & Equipment
HPG HOSE 4.9 Materials
VIC Real Estate HOSE 4.8
KDH Real Estate HOSE 4.7
VCB Banks HOSE 4.6
SJS Real Estate HOSE 4.0
KBC Real Estate HOSE 3.6
84.0
5.6
10.4
HOSE
HNX
Cash
19.8
16.4
10.410.0
9.5
7.5
6.8
6.3
2.9 10.4
Real Estate
Food Beverage & Tobacco
Banks
Materials
Capital Goods
Transportation
Consumer Durables & Apparel
Technology Hardware & Equipment
Diversified Financials
Cash

VFMVFA FUND Nov 2015
INVESTMENT OBJECTIVE
The main objective of VFMVFA would be to capture medium to long-term capital
appreciation on Vietnam market, accompanied by capital preservation during adverse
market conditions, based on the main strategy of trend-following which is one of
Quantitative Investment Models.
FUND PERFORMANCE
In November 2015, the Vietnam’s stock market dropped significantly while the VN-Index
plummeted 5.6% to close at 573.3 points as compared with the last month. In the
meantime, the VN30-Index included thirty stocks with largest market capitalization and
highest liquidity decreased 6.0% equivalent to VN-Index’s decline. The Energy and Banks
sectors were the largest decreases equivalent to –12.0% and –11.6%, respectively.
However, the Banks and Utilities sectors were the largest contributors in VN-Index about
–3.3% and –0.9%, respectively. As of November 30, 2015 VFMVFA’s NAV/unit was VND
7,293.5, an decrease of 2.3% compared to the last month.
Although the Vietnam’s stock market showed downtrend in November 2015, many stocks
went in the opposite direction such as Food, Berverage & Tobacco or Consumer Services
sectors. That is the reason VFMVFA’s trading was quite balanced. Therefore, the
allocation by asset class changed slightly when stock proportion accounted for 58.0%
NAV and risk-free assets accounted for 42.0% NAV.
VFMVFA PERFORMANCE VS. INDEX
02/04/2010=100
FUND FACTS
Fund name Vietnam Active Fund
Fund Code VFMVFA
Fund Type Open-ended Fund
Currency VND
Inception date 02/04/2010
Conversion date 18/4/2013
Fund Manager VietFund Management (VFM)
Custodian Bank Standard Chartered Bank (Vietnam)
Transfer Agency VSD
Distributors VFM, HSC, VCSC, KIS, VDSC, FPTS
Management fee Up to 2%
Subscription fee From 0.2% to 1% based on total subscribed amount (million VND)
Redemption fee From 0.5% to 1.5% based on holding period since sub-scription date (days)
Switching fee 0% total switched amount
Minimum subscription order 1 million VND
Minimum account balance 100 units
Trading cycle Every Friday (T day)
Cut-off time 10:30am, T-1 day
Dividend Annually
Total NAV (bil VND) 66.9
Number of fund unit 9,170,328.3
NAV/unit 12-month high (VND) 7,711.6
NAV/unit 12-month low (VND) 6,835.7
Expense ratio (12-month) (%) 2.9
Turnover ratio (12-month) (%) 205.1
Ms. Luong Thi My Hanh - Fund Manager
Tel: +84 8 38251488 - Fax: +84 8 38251489
Email: [email protected]
NAV PERFORMANCE
Performance (%)
NAV/Unit
(VND)
&Indices 1
month
3
months YTD
Trailing 12
months
Since in-
ception
(02/04/2010)
VFMVFA 7,293.5 (2.3) 2.3 (0.3) (1.5) (27.1)
VN-Index 573.2 (5.6) 1.5 5.1 1.2 12.3
HNX-Index 80.6 (2.0) 4.8 (2.9) (7.8) (50.9)
VN30-Index 581.9 (6.0) (0.7) (3.3) (4.8) 8.9
0
20
40
60
80
100
120
140 VFMVFA VN-Index HNX-Index

VietFund Management (VFM) | Unit 1701-04, 17th Floor, Me Linh Point Tower, 2 Ngo Duc Ke, Dist 1, Ho Chi Minh City, Vietnam | Tel: +84 8 3825 1488 | Fax: +84 8 3825 1489
DISCLAMER
This document is issued by VietFund Management (VFM). The information herein is deemed reliable sources by VFM, based on publ ished sources and VFM isn’t responsible for the accuracy of the
information herein, except the information, data of Funds managed by VFM and provided in this document. This document reflects the views and assessments of the author at the time of issue, for
references only and may change without notice. This document is neither a prospectus nor an offer or any commitment of VFM or Funds managed by VFM. VFM hasn’t obligation to update, revise this
document in any form in the case of opinions, forecasts and estimations in this document changes or becomes inaccurate.
ALLOCATION BY STRATEGY (%NAV) ALLOCATION BY ASSET CLASS (%NAV)
Investment Assets
INVESTMENT RESTRICTIONS
Limit
Deposits at commercial bank and money market instruments ... 49% TA
Assets issued by the same group of companies 30% TA
Securities in circulation of an issuer 20% TA
Securities in circulation of an issuer 10% OS
Stocks/bonds to be listed or registered for trading 10% TA
Holdings of 5% or more of TA in aggregate 40% TA
RISK STATISTICS
VN-Index VFA
Beta 0.5 1.0
Standard Deviation (%) 10.3 17.3
Sharpe Ratio (0.6) (0.1)
(TA: Total Asset of the Fund; OS: Outstanding shares)
29.7%
29.1%10.5%
30.7%
Stock - based MATF
High quality trading
High Velocity Trend Following 1.0
High Velocity Trend Following 1.1
58.0%
0.0%
0.0%
42.0%
HSX
HNX
Bond
Cash/Other assets

VFMVFB FUND Nov 2015
90.00
95.00
100.00
105.00
110.00
115.00
120.00
125.00
130.00
6/2013 9/2013 12/2013 4/2014 7/2014 10/2014 1/2015 5/2015 8/2015 11/2015
VFB Bond Index 1Y Bond Index 2Y
INVESTMENT OBJECTIVES
The objective of VFMVFB is to achieve income primarily from investments in fixed
income securities (including but not limited to Vietnamese Government bonds,
Government guaranteed bonds, municipal bonds, corporate bonds in accordance with
Vietnamese law, etc.), commercial notes and money market instruments.
FUND PERFORMANCE
Vietnam State Treasury continues to success in November 2015 in the primary issuance
of government bonds (VGB), value of issued bonds equals to 80.23% of total called
amount and winning rate for the reissued 3-year bond after having approval of National
Assembly is 100%. In November, the State Treasury raised 14.800 billion of 3-year bond
through 2 auctions with ratio of bidding values over called amount reach to 3.27 times
(see table on page 2). The sudden abundance of VND liquidity in the banking system is
the main reason for the successful issuance of short-term bonds.
Bond yields in November do not change compared to October 2015. At as 30/11/2015,
government bond yields are +/- 5 basis points compare to the 31/10/2015. 3-year bond
yield downs slightly. Trading on the secondary market decreased slightly compared with
October 2015 with a total transaction value is 37.328 billion (October 2015: 46.000
billion), average daily transaction value also decreases correspondingly to 1.778 billion/
session down from 2.091 billion/section in October 2015. Secondary trading of bonds
focuses on maturities of less than 3 years (74% of total trading value - See chart on page
2). The trading weight of short term bonds on the primary and secondary markets reflects
market sentiment which is reluctant to add risks given possible fluctuations of bonds
yields in 2016.
At 30/11/2015, NAV/unit of Vietnam Bonds Fund is 12.546,06 VND, an increase of
1,06% vs. last month and an increase of 5.73% YTD. Growth achieved in November is a
result of the decision to sell short term bond and invest in bond with remaining life of 3,7
years in October 2015. The investment is profitable thanks to the decrease of 3 year
bond yield in late November. In December, VFMVFB will continue to trade on its
currently holding assets in order to seek for profits.
NAV PERFORMANCE
NAV/Unit
(VND) &
Indices
Performance (%)
1 month 3 months YTD
Since
Inception
(10/06/2013)
VFMVFB 12,546.1 1.1 2.0 5.7 25.5
Bond-Index 1Y 205.6 0.5 1.5 4.4 14.5
Bond-Index 2Y 221.8 0.5 1.8 4.8 19.2
VFMVFB PERFORMANCE (*) VS. BOND_INDEX (**)
Left chart: Since inception ; Right chart: Year 2015
FUND FACTS
Fund name Vietnam Bond Fund
Fund Code VFMVFB
Fund Type Open-ended Fund
Currency VND
Inception date 10/06/2013
Fund Manager VietFund Management (VFM)
Custodian Bank Standard Chartered Bank VN
Transfer Agency Vietnam Securities Depository (VSD)
Distributors ABS, HSC, FPTS, KIS, MSBS,
VCSC, VDSC, VND, VFM
Management fee 0.9%/NAV/year
Subscription fee From 0.3% to 0.6% based on total subscribed amount (million VND)
Redemption fee 0% to 1% based on holding period since subscription date (days)
Switching fee 0.2% total switched amount
Minimum subscription order VND1 million
Minimum account balance 100 units
Trading cycle every Friday (T day)
Cut-off time 10:30am, T-1 day
Dividend Annually
(satisfied the requirements)
Total NAV (billion VND) 94.7
Number of fund unit 7,550,552.9
NAV/unit 12-month high (VND) 12,546.1
NAV/unit 12-month low (VND) 11,817.3
Annualized Turnover Ratio (%) 417.6
Mr. Tran Le Minh - Fund Manager
Tel: +84 4 39428168 - Fax: +84 4 394281699
Email: [email protected]
Notes
(*) NAV of VFMVFB showed abnormal volatility at 08/08/2013 and 26/09/2013 due to the occurrences of abnormal volatility in trading prices. The volatility was majorly due to the technical NAV calculation methodology and did not really
reflect accurately fund’ NAV at the dates. Under the NAV calculation methodology being applied before 01/10/2013, VFMVFB must valuate investment bond with the market traded price although the price may not correctly reflect the value of
bond. After 01/10/2013, NAV of VFMVFB will be no longer affected by such abnormal volatility.
(**) One and two-year bond indices are prepared by Dragon Capital Debt Management Limited. The copyright is belonged to Dragon Capital Group. VFM is using the indices with permission from Dragon Capital Group.
98.00
99.00
100.00
101.00
102.00
103.00
104.00
105.00
106.00
12/2014 2/2015 3/2015 4/2015 5/2015 6/2015 7/2015 8/2015 9/2015 10/2015 11/2015
VFB Bond Index 1Y Bond Index 2Y

VietFund Management (VFM) | Unit 1701-04, 17th Floor, Me Linh Point Tower, 2 Ngo Duc Ke, Dist 1, Ho Chi Minh City, Vietnam | Tel: +84 8 3825 1488 | Fax: +84 8 3825 1489
MOVEMENTS OF VGB BOND YIELDS
DISCLAMER
This document is issued by VietFund Management (VFM). The information herein is deemed reliable sources by VFM, based on publ ished sources and VFM isn’t responsible for the accuracy of the
information herein, except the information, data of Funds managed by VFM and provided in this document. This document reflects the views and assessments of the author at the time of issue, for
references only and may change without notice. This document is neither a prospectus nor an offer or any commitment of VFM or Funds managed by VFM. VFM hasn’t obligation to update, revise this
document in any form in the case of opinions, forecasts and estimations in this document changes or becomes inaccurate.
BOND YIELD CURVE
GENERAL MARKET INFORMATION
0
500
1000
1500
2000
2500
3000
3500
4000
4500
0
10000
20000
30000
40000
50000
60000
70000
80000
90000
Jan-15 Feb-15 Mar-15 Apr-15 May-15 Jun-15 Jul-15 Aug-15 Sep-15 Oct-15 Nov-15
Total Value Daily Average Value
BOND OUTRIGHTS TRADING VALUE FY2015
(bn VND)
4.50
5.00
5.50
6.00
6.50
7.00
7.50
1-year VGB 2-year VGB 3-year VGB 5-year VGB 7-year VGB 10-year VGB
31/12/2014(%) 30/10/2015 (%) 30/11/2015 (T Day) (%)
4.0
4.5
5.0
5.5
6.0
6.5
7.0
7.5
12
/31
/14
01
/16
/15
01
/30
/15
02
/13
/15
03
/10
/15
03
/24
/15
04
/07
/15
04
/21
/15
05
/11
/15
05
/25
/15
06
/08
/15
06
/22
/15
07
/06
/15
07
/20
/15
08
/03
/15
08
/17
/15
08
/31
/15
09
/15
/15
09
/29
/15
10
/13
/15
10
/27
/15
11
/10
/15
11
/24
/15
2Y 3Y 5Y 10Y
1-year VGB 2-year VGB 3-year VGB 5-year VGB 7-year VGB 10-year VGB
31/12/2014(%) 4.67 4.99 5.16 6.15 6.69 7.21
30/10/2015 (%) 4.91 5.32 5.87 6.63 6.76 7.13
16/11/2015 (%) 4.84 5.28 5.89 6.63 6.80 7.16
30/11/2015 (T Day) (%) 4.85 5.28 5.87 6.61 6.80 7.14
T Day -14 Change (Bp) 0.83 (0.50) (2.00) (2.00) 0.00 (1.66)
T Day -30 Change (Bp) (5.83) (4.17) 0.50 (1.67) 4.17 1.67
T Day - 31/12/2014 Change (Bp) 18.12 28.75 70.92 46.70 11.50 (6.33)
FLUCTUATIONS IN GOVERNMENT BOND YIELDS
VGB PRIMARY ISSUE (November 2015)
Bond Tennors Number of auctionsCalled amount
(VND bn)
Registered amount
(VND bn)
Winning amount
(VND bn)Yield (%)
Registered/Called
amount
3Y 2 14,800 48,484 14,800 5.88-5.9 327.59%
5Y 3 14,100 22,041 9,510 6.53-6.6 156.32%
10Y 2 1,500 30 10 6.95-6.95 2.00%
15Y 2 2,800 2,692 2,317 7.65-7.65 96.13%
Tổng cộng 33,200 73,246 26,637
BOND OUTRIGHTS TRADING VALUE BREAKDOWN
BY TENNORS (November 2015)
<=12 months
18%
2 years36%
3 years20%
3-5 years13%
> 5 years13%

VFMVN30 ETF Nov 2015
INVESTMENT OBJECTIVE
The objective of VFMVN30 ETF is to replicate the performance of VN30 Benchmark
Index as closest as possible after subtracting Fund’s expenses. VN30 Index is the price
index established and managed by Ho Chi Minh Stock Exchange. VFMVN30 ETF has
no foreign ownership limit.
VFMVN30 ETF implements a passive investing strategy to carry out its preset invest-
ment objectives. When the basket of securities of VN30 index changes, VFMVN30 ETF
will adjust the Fund’s portfolio to be consistent with the basket of VN30 index in terms of
structure and weighting of assets. The value of investment portfolio of the Fund is often
not less than 95% of the corresponding value of basket of securities of VN30 Benchmark
Index.
NAV PERFORMANCE
NAV/Unit
(VND)
&Indices
Performance (%)
1
month
3
months YTD
Trailing 12
months
Since IPO
14/08/2014
VFMVN30 ETF 9,282.0 (6.0) 0.5 (0.3) (2.0) (7.2)
VN30-Index 581.9 (6.0) (0.7) (3.3) (4.8) (10.5)
PERFORMANCE VS. INDEX 14/08/2014 = 100
AUM & OUTSTANDING SHARES
FUND FACTS
Fund name VFMVN30 ETF
Fund Code E1VFVN30
Bloomberg Ticker E1VFVN30 VN Equity
Listing Bourse HOSE
Fund Type Exchange Traded Fund
Benchmark Index VN30-Index
Currency VND
Fund Manager VietFund Management (VFM)
Custodian Bank Standard Chartered Bank VN
Transfer Agency Vietnam Securities Deposi-
tory (VSD)
Index Provider Ho Chi Minh Stock Ex-
change (HOSE)
Authorized Participants (AP) HSC, BVSC
Market Maker HSC
A Creation Unit Equal to 100,000 ETF fund
certificates
Exchange Trading Time Daily
Management Fee 0.65%/NAV/annually
Creation Fee Waived
Redemption Fee 0% to 0.15%
Dividend Distribution Annually
Total NAV (VND bil) 347.1
Outstanding units 37,400,000
NAV/unit 12-month high (VND) 10,331.2
NAV/unit 12-month low (VND) 8,531.4
Expense ratio (%) (annually) 1.07
Tracking error (%) 1.40
Ms. Luong Thi My Hanh - Fund Manager
Phone: +84 8 38251488 - Fax: +84 8 38251489
Email: [email protected]
80
85
90
95
100
105
110
VFMVN30 ETF VN30-Index
15
20
25
30
35
40
45
150
200
250
300
350
400
Outstanding Shares (Mil) (Right) AUM (VND Bil) (Left)
VietFund Management (VFM) | Unit 1701-04, 17th Floor, Me Linh Point Tower, 2 Ngo Duc Ke, Dist 1, Ho Chi Minh City, Vietnam | Tel: +84 8 3825 1488 | Fax: +84 8 3825 1489
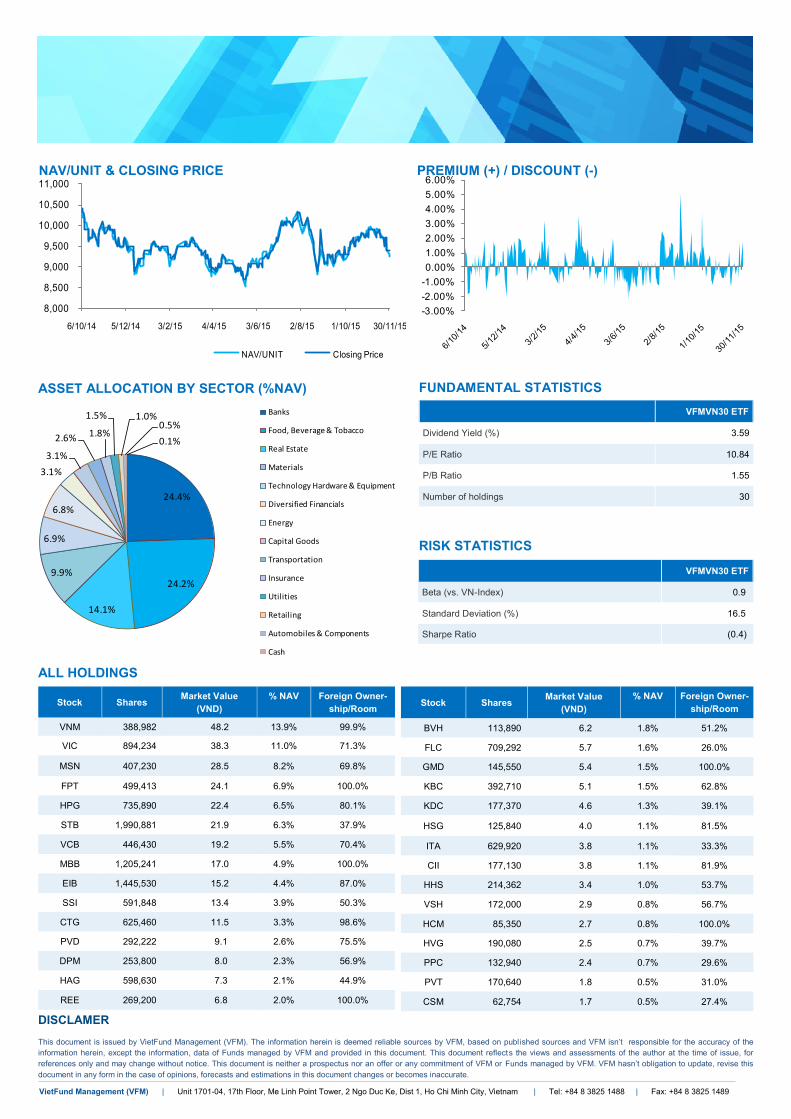
24.4%
24.2%
14.1%
9.9%
6.9%
6.8%
3.1%
3.1%
2.6% 1.8%
1.5% 1.0%0.5%
0.1%
Banks
Food, Beverage & Tobacco
Real Estate
Materials
Technology Hardware & Equipment
Diversified Financials
Energy
Capital Goods
Transportation
Insurance
Utilities
Retailing
Automobiles & Components
Cash
-3.00%
-2.00%
-1.00%
0.00%
1.00%
2.00%
3.00%
4.00%
5.00%
6.00%
DISCLAMER
This document is issued by VietFund Management (VFM). The information herein is deemed reliable sources by VFM, based on publ ished sources and VFM isn’t responsible for the accuracy of the
information herein, except the information, data of Funds managed by VFM and provided in this document. This document reflects the views and assessments of the author at the time of issue, for
references only and may change without notice. This document is neither a prospectus nor an offer or any commitment of VFM or Funds managed by VFM. VFM hasn’t obligation to update, revise this
document in any form in the case of opinions, forecasts and estimations in this document changes or becomes inaccurate.
ASSET ALLOCATION BY SECTOR (%NAV)
VFMVN30 ETF
Dividend Yield (%) 3.59
P/E Ratio 10.84
P/B Ratio 1.55
Number of holdings 30
FUNDAMENTAL STATISTICS
VFMVN30 ETF
Beta (vs. VN-Index) 0.9
Standard Deviation (%) 16.5
Sharpe Ratio (0.4)
RISK STATISTICS
Stock Market Value
(VND)
% NAV Shares
Foreign Owner-
ship/Room
VNM 48.2 13.9% 388,982 99.9%
VIC 38.3 11.0% 894,234 71.3%
MSN 28.5 8.2% 407,230 69.8%
FPT 24.1 6.9% 499,413 100.0%
HPG 22.4 6.5% 735,890 80.1%
STB 1,990,881 21.9 6.3% 37.9%
VCB 446,430 19.2 5.5% 70.4%
MBB 1,205,241 17.0 4.9% 100.0%
EIB 1,445,530 15.2 4.4% 87.0%
SSI 591,848 13.4 3.9% 50.3%
CTG 625,460 11.5 3.3% 98.6%
PVD 292,222 9.1 2.6% 75.5%
DPM 253,800 8.0 2.3% 56.9%
HAG 598,630 7.3 2.1% 44.9%
REE 269,200 6.8 2.0% 100.0%
ALL HOLDINGS
NAV/UNIT & CLOSING PRICE PREMIUM (+) / DISCOUNT (-)
Stock Market Value
(VND)
% NAV Shares
Foreign Owner-
ship/Room
BVH 6.2 1.8% 113,890 51.2%
FLC 5.7 1.6% 709,292 26.0%
GMD 5.4 1.5% 145,550 100.0%
KBC 5.1 1.5% 392,710 62.8%
KDC 4.6 1.3% 177,370 39.1%
HSG 125,840 4.0 1.1% 81.5%
ITA 629,920 3.8 1.1% 33.3%
CII 177,130 3.8 1.1% 81.9%
HHS 214,362 3.4 1.0% 53.7%
VSH 172,000 2.9 0.8% 56.7%
HCM 85,350 2.7 0.8% 100.0%
HVG 190,080 2.5 0.7% 39.7%
PPC 132,940 2.4 0.7% 29.6%
PVT 170,640 1.8 0.5% 31.0%
CSM 62,754 1.7 0.5% 27.4%
8,000
8,500
9,000
9,500
10,000
10,500
11,000
6/10/14 5/12/14 3/2/15 4/4/15 3/6/15 2/8/15 1/10/15 30/11/15
NAV/UNIT Closing Price

HEAD OFFICE
Suite 1701-04, 17th Floor, Melinh Point Tower
2 Ngo Duc Ke Street, District 1, Ho Chi Minh City
Tel: +84 8 3825 1488 | Fax: +84 8 3825 1489
Hotline. +84 8 3825 1480
BRANCH OFFICE IN HA NOI
Suite 903, 9th Floor, BIDV Office Building
194 Tran Quang Khai Street, Hoan Kiem District, Ha Noi
Tel: +84 4 3942 8168 | Fax: +84 4 3942 8169 www.vinafund.com