moody's weekly market outlook- us bond offerings to slow as risks rise (capital markets...
DESCRIPTION
reportTRANSCRIPT
WEEKLY MARKET OUTLOOK
JULY 23, 2015
CAPITAL MARKETS RESEARCH
Moody’s Analytics markets and distributes all Moody’s Capital Markets Research, Inc. materials. Moody’s Capital Markets Research, Inc is a subsidiary of Moody’s Corporation. Moody’s Analytics does not provide investment advisory services or products. For further detail, please see the last page.
US Bond Offerings to Slow As Risks Rise
Credit Markets Review and Outlook by John Lonski US Bond Offerings to Slow As Risks Rise.
» FULL STORY PAGE 2
The Week Ahead We preview economic reports and forecasts from the US, UK/Europe, and Asia/Pacific regions.
» FULL STORY PAGE 5
The Long View Check our chart here for forecast summaries of key credit market metrics. Full updated stories, “Weak second-quarter business sales should boost perceived default risk by enough to materially curb high-yield bond issuance,” begin on page 15.
» FULL STORY PAGE 15
Ratings Round-Up by Njundu Sanneh Slightly More Upgrades Than Downgrades.
» FULL STORY PAGE 18
Market Data Credit spreads, CDS movers, issuance.
» FULL STORY PAGE 20
Moody’s Capital Markets Research recent publications Links to commentaries on: UBS, WFC, C, MS, JPM, IP, Oaxaca, USB, Greek EDFs, risks, BAC, RSG, Russia, HON, Greece, SANTAN.
» FULL STORY PAGE 24
Credit Spreads
Investment Grade: Year-end 2015 spread to resemble its recent 151 bp. High Yield: Recent spread of 514 bp should approximate 500 bp by year-end 2015.
Defaults US HY default rate: June 2015, 2.0%; Moody’s Credit Policy Group forecasts 3.0% in 1H2016
Issuance For 2015, US$ IG bond offerings may grow by 20% to $1.357 trillion, while US$ HY bond issuance sinks by -7% to $391 billion. In 2014, US$ IG bond issuance rose by 0.9% to $1.129 trillion, while US$ HY bond issuance dropped by -2.3% to $421 billion.
Click here for Moody’s Credit Outlook, our sister publication containing Moody’s rating agency analysis of recent news events, summaries of recent rating changes, and summaries of recent research.
Moody’s Capital Markets Research, Inc.
Weekly Market Outlook Contributors: David W. Munves, CFA 1.212.553.2844 [email protected] John Lonski 1.212.553.7144 [email protected] Ben Garber 1.212.553.4732 [email protected] Njundu Sanneh 1.212.553.4036 [email protected] Yukyung Choi 1.212.553.0906 [email protected] Irina Baron 1.212.553.4307 [email protected] Franklin Kim 1.212.553.4419 [email protected] Xian (Peter) Li 1.212.553.1404 [email protected]
Moody's Analytics/Europe: Tomas Holinka 1.420 ( 221) 666-384 [email protected]
Moody's Analytics/Asia-Pacific: Alaistair Chan 1.612.9270.8148 Alaistair,chan @moodys.com Katrina Ell 1.612.9270.8144 [email protected]
Editor Dana Gordon 1.212.553.0398 [email protected]
CAPITAL MARKETS RESEARCH
2 JULY 23, 2015 CAPITAL MARKETS RESEARCH, INC. / MARKET OUTLOOK / MOODYS.COM
Credit Markets Review and Outlook
Credit Markets Review and Outlook By John Lonski, Chief Economist, Moody’s Capital Markets Research, Inc.
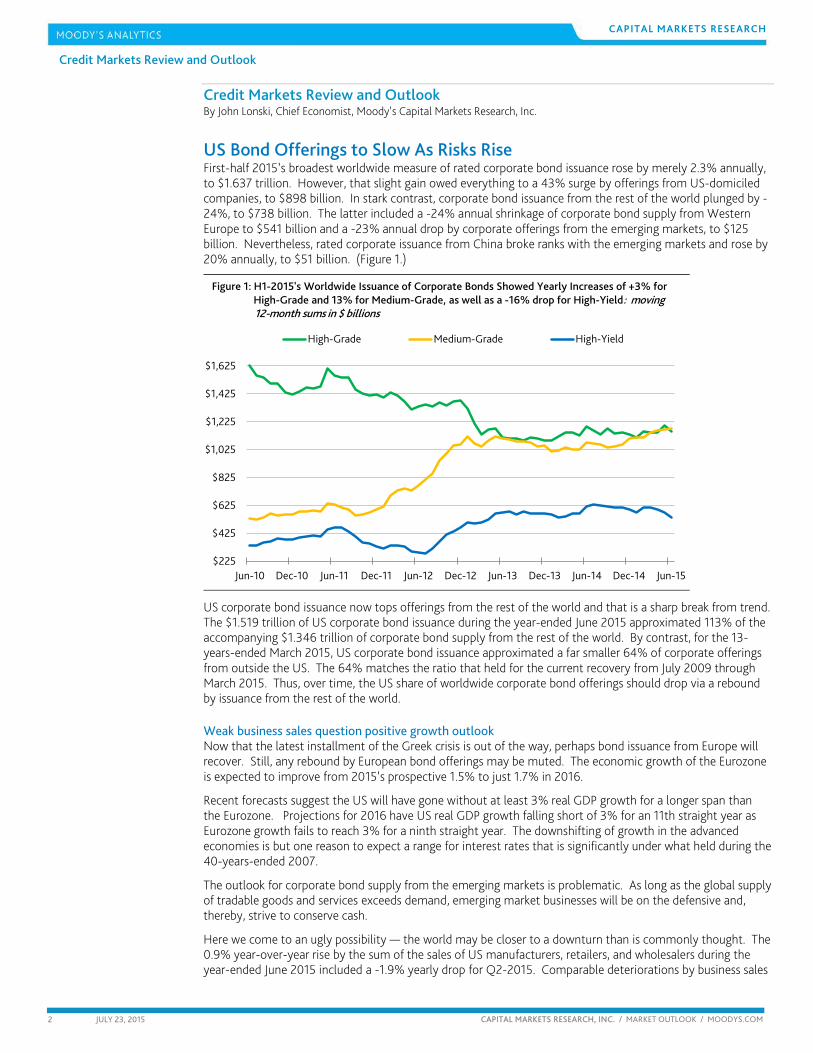
US Bond Offerings to Slow As Risks Rise First-half 2015’s broadest worldwide measure of rated corporate bond issuance rose by merely 2.3% annually, to $1.637 trillion. However, that slight gain owed everything to a 43% surge by offerings from US-domiciled companies, to $898 billion. In stark contrast, corporate bond issuance from the rest of the world plunged by -24%, to $738 billion. The latter included a -24% annual shrinkage of corporate bond supply from Western Europe to $541 billion and a -23% annual drop by corporate offerings from the emerging markets, to $125 billion. Nevertheless, rated corporate issuance from China broke ranks with the emerging markets and rose by 20% annually, to $51 billion. (Figure 1.)
$225
$425
$625
$825
$1,025
$1,225
$1,425
$1,625
Jun-10 Dec-10 Jun-11 Dec-11 Jun-12 Dec-12 Jun-13 Dec-13 Jun-14 Dec-14 Jun-15
High-Grade Medium-Grade High-Yield
Figure 1: H1-2015's Worldwide Issuance of Corporate Bonds Showed Yearly Increases of +3% for High- High-Grade and 13% for Medium-Grade, as well as a -16% drop for High-Yield: moving 12- 12-month sums in $ billions
US corporate bond issuance now tops offerings from the rest of the world and that is a sharp break from trend. The $1.519 trillion of US corporate bond issuance during the year-ended June 2015 approximated 113% of the accompanying $1.346 trillion of corporate bond supply from the rest of the world. By contrast, for the 13-years-ended March 2015, US corporate bond issuance approximated a far smaller 64% of corporate offerings from outside the US. The 64% matches the ratio that held for the current recovery from July 2009 through March 2015. Thus, over time, the US share of worldwide corporate bond offerings should drop via a rebound by issuance from the rest of the world.
Weak business sales question positive growth outlook Now that the latest installment of the Greek crisis is out of the way, perhaps bond issuance from Europe will recover. Still, any rebound by European bond offerings may be muted. The economic growth of the Eurozone is expected to improve from 2015’s prospective 1.5% to just 1.7% in 2016.
Recent forecasts suggest the US will have gone without at least 3% real GDP growth for a longer span than the Eurozone. Projections for 2016 have US real GDP growth falling short of 3% for an 11th straight year as Eurozone growth fails to reach 3% for a ninth straight year. The downshifting of growth in the advanced economies is but one reason to expect a range for interest rates that is significantly under what held during the 40-years-ended 2007.
The outlook for corporate bond supply from the emerging markets is problematic. As long as the global supply of tradable goods and services exceeds demand, emerging market businesses will be on the defensive and, thereby, strive to conserve cash.
Here we come to an ugly possibility — the world may be closer to a downturn than is commonly thought. The 0.9% year-over-year rise by the sum of the sales of US manufacturers, retailers, and wholesalers during the year-ended June 2015 included a -1.9% yearly drop for Q2-2015. Comparable deteriorations by business sales

CAPITAL MARKETS RESEARCH
3 JULY 23, 2015 CAPITAL MARKETS RESEARCH, INC. / MARKET OUTLOOK / MOODYS.COM
Credit Markets Review and Outlook
previously occurred in November 2008 through January 2009 and August 2001, where both incidents overlapped recessions. (Figure 2.)
100-22%-20%-18%-16%-14%-12%-10%-8%-6%-4%-2%0%2%4%6%8%
10%12%14%
Dec-93 Apr-96 Aug-98 Dec-00 Apr-03 Aug-05 Dec-07 Apr-10 Aug-12 Dec-14
Recessions are shaded Business Sales: 12-month average
Business Sales: 3-month average
Figure 2: Annual % Change by Business Sales Sinks from H2-2014's +3.5% to H1-2015's -1.5% 1.5%: yy % changes
Because of the limited scope for Fed interest rate cuts and US fiscal stimulus, the 10-year Treasury yield may need to drop to 1% or less in order to facilitate the next business cycle upturn. A new multi-decade low for the benchmark Treasury yield would trigger a wave of new corporate bond issues that refinance outstanding short- and long-term debt.
US business borrowing lags far behind record growth of M&A As derived from Bloomberg data, mergers and acquisitions (M&A) involving US-domiciled companies soared higher by 47% annually, to a record $3.1 trillion during the year-ended June 2015. According to the same serial comparison, the sum of investment- and speculative-grade bond offerings from US companies plus estimated leveraged loan drawdowns rose by 2% annually, to $2.3 trillion. (Figure 3.)
$50$300$550$800$1,050$1,300$1,550$1,800$2,050$2,300$2,550$2,800$3,050
$50$300$550$800
$1,050$1,300$1,550$1,800$2,050$2,300$2,550$2,800$3,050
88Q490Q492Q494Q496Q498Q400Q402Q404Q406Q408Q410Q412Q414Q4
Total Issuance: US-domiciled Corporate Bonds + Leveraged Loans
M & A: US Companies
Figure 3: Surge by US-related M&A Steadies Borrowing by US-Based Companies: moving 4 qtr qtr sums in $ billions; source: Dealogic, Bloomberg, Credit Suisse, MCMRG
The 74% ratio between the just mentioned gross business borrowing and M&A was the lowest since the 56% of the year-ended Q4-2000, which was a tad above Q1-2000’s record low 54%. The latter coincided with a cycle high of $1.75 trillion for M&A.
From year-end 1988 through 2014, this version of US business borrowing averaged 100% of M&A. Often, mergers and acquisitions are eventually refinanced with debt taking the place of equity. And that may help to explain why this version of business borrowing expanded by 33% annually in 2001 despite an accompanying -

CAPITAL MARKETS RESEARCH
4 JULY 23, 2015 CAPITAL MARKETS RESEARCH, INC. / MARKET OUTLOOK / MOODYS.COM
Credit Markets Review and Outlook
47% annual plunge by M&A. Combining 2000’s borrowing to M&A ratio of 56% with 2001’s ratio of 142% yielded an average ratio of 99% for 2000-2001 that nearly matched its long-term average of 100%.
Therefore, because of a now low ratio of gross business borrowing to M&A, bond offerings and leveraged loan drawdowns may grow even if M&A plunges after its next peak.
High-yield EDF metric sends ominous message Over the last 12 months, the average expected default frequency (EDF) metric of US/Canadian non-investment-grade companies has soared up from 2.1% to a recent 4.45%. Only three previous episodes show upswings by the high-yield EDF metric that are comparable to its recent year-to-year ascent of 239 bp. They occurred in April-May 2008, May-September 2000, and July-August 1998.
During the three-month spans following the conclusion of each of the three earlier incidents, the high-yield bond spread averaged 739 bp, which was well above its recent 514 bp. At this mature stage of the current recovery, both equities and business activity are likely to suffer if the high-yield bond spread swells above 600 bp. In fact, two of the three aforementioned ascents by the high-yield EDF metric occurred just prior to or during a recession.
During 2015’s first half, a -16% year-over-year drop by the worldwide issuance of high-yield bonds, to $302 billion, was split between a 26% annual advance by high-yield offerings from US-domiciled companies (to $195 billion) and a -47% plunge by supply from the rest of the world (to $107 billion). The financing of acquisitions rose considerably in terms of relative importance among the uses of funds obtained from dollar-denominated high-yield bond issuance.
First-half 2015’s new bank loan programs from high-yield issuers (most of which were US-domiciled) fell by -17% annually, to $224 billion. However, first-half results masked a Q1-2015 yearly plunge of -38% (to $91 billion) that differed substantially from a Q2-2015 increase of 8% (to $133 billion). For 2015’s first-half, the funding of acquisitions was cited in 60% of the new bank loan programs, which was up from M&A’s 47% share of 2014’s first half.
Looking ahead, the latest climb by the average high-yield EDF metric warns of a drop by high-yield borrowing. In terms of moving 12-month observations, the sum of dollar-denominated bond issuance plus bank loan programs from high-yield issuers revealed a relatively strong inverse correlation of -0.82 with the accompanying average for the high-yield EDF metric. At some point, a contraction by high-yield borrowing could degenerate into a broadly based diminution of systemic liquidity that might help to snuff out the current recovery. (Figure 4.)
$125
$225
$325
$425
$525
$625
$725
$825
$925
$1,025
1.0
2.0
3.0
4.0
5.0
6.0
7.0
8.0
9.0
10.0
Dec-02 Mar-04 Jun-05 Sep-06 Dec-07 Mar-09 Jun-10 Sep-11 Dec-12 Mar-14 Jun-15
Average Expected Default Frequency of US High-Yield Companies: average in %
Bank Loan Programs + $-denom Bond Issuance from High-Yield Issuers:sim in $ billions
Figure 4: Ongoing Climb by Average High-Yield EDF Metric Will Curb Sum of Bank Loan Programs and Bond Bond Offerings from High-Yield Issuers: yearlong observations

The Week Ahead
CAPITAL MARKETS RESEARCH
5 JULY 23, 2015 CAPITAL MARKETS RESEARCH, INC. / MARKET OUTLOOK / MOODYS.COM
The Week Ahead – US, Europe, Asia-Pacific
THE US By John Lonski and Ben Garber Moody’s Capital Markets Research Group Estimates are consensus views. Release times are US Eastern Daylight Time
FRIDAY, JULY 24
New Home Sales – June Time: 10:00 am Forecast: 548,000 After jumping to the seven-year high in May, June new home sales would do well by holding near the elevated results of the second quarter-to-date. New home sales rose 23% year-over-year in the three months ending May, as home sales and construction are seizing a consistent uptrend. Amid limited price gains, burgeoning demand for housing can be of great benefit to construction sector hiring and overall economic activity.
MONDAY, JULY 27
Durable Goods Orders – June Time: 8:30 am Forecast: 2.5% overall, 0.5% ex transportation Evidence of rising industrial sector demand can help lift June core durable goods orders for the third time in four months. West coast port disruptions and dollar strength have held back output, with core orders falling 2% year-over-year in the three months ending May. But with the ISM Manufacturing index new orders component rising to the six-month high in June, the US industrial sector is poised to move past the weakness in the first half of this year.
TUESDAY, JULY 28
S&P / Case-Shiller Home Price Index – May Time: 9:00 am Forecast: 5.7% yearly change of 20-city index Rising sales and tight supply will maintain a solid pace of home price growth in the May Case-Shiller Index. Inventory constraints are evident in the 2.1 million new and existing single-family homes available for sale in May—well under the historical average of 2.6 million. With single-family sales rising 11% year-over-year in the quarter ending May, prices are finding support from a housing sector that continues to progress toward normalization.
Conference Board Consumer Confidence – July Time: 10:00 am Forecast: 99.5 Confidence in the July Conference Board survey is forecast to dip from June’s five-month high as choppy retail sales warn of consumer caution. Sluggish wage growth has clipped both confidence and spending, with the 17.5% of consumers expecting rising incomes in June down 2% from this year’s high. Yet despite the uneven recent path for this survey, conditions remain far more positive than last year when the index averaged 86.9.
WEDNESDAY, JULY 29
Pending Home Sales Index – June Time: 10:00 am
The Week Ahead
CAPITAL MARKETS RESEARCH
6 JULY 23, 2015 CAPITAL MARKETS RESEARCH, INC. / MARKET OUTLOOK / MOODYS.COM
Forecast: 1.0% The Pending Home Sales Index is expected to reach a new cycle high in June as a growing mortgage market is expanding the pool of potential homebuyers. The latest four-week moving average of the MBA index of mortgage applications for home purchases rose 16% year-over-year, implying that banks have loosened up lending standards a bit. Yet with the Freddie Mac 30-year mortgage rate rising to the nine-month high of 4.09%, the housing rebound will be challenged by more expensive credit.
FOMC Rate Decision Time: 2:00 pm Forecast: 0-0.25% fed funds target Though no action on rates is likely at the July FOMC meeting, policymakers will look to set the stage for a potential September rate hike. Recent statements from Chairwoman Janet Yellen and other Fed officials all but assure a rate hike this year if their economic forecasts hold true. Persistent hiring and declines in several measures of labor market slack are a justification for concern about future inflation risk.
THURSDAY, JULY 30
GDP – Second Quarter Advance Estimate Time: 8:30 am Forecast: 2.5% Second quarter growth will likely rebound sharply from the first quarter contraction, yet the rate of expansion is not expected to be overly rapid. Poor April results for retail sales and consumer spending capped the upside for growth last quarter and damaged predictions that this year’s growth had the potential to run above 3% for a sustained period. With various measures of wages and compensation falling short of 3% annual growth, output will struggle to grow at a well above average pace.
FRIDAY, JULY 31
University of Michigan Consumer Sentiment – July Final Time: 10:00 am Forecast: 94.3 The final reading in the July Michigan sentiment survey can limit the initial decline recorded against June’s five-month high. The potential for renewed declines in gasoline prices can give consumer attitudes a lift. A supply glut and falling demand as weather in the US turns colder can give US consumers greater spending power on non-fuel items well into next year.
EUROPE By the Dismal (Europe) staff in London and Prague Release times are Greenwich Mean Time.
Focus: Migration quotas remain point of contention After the Greeks voted “no” to austerity measures in early July, the Greek government did an about-face by adopting these very measures to access the €86 billion rescue loan and remain in the euro zone. The first package, which includes value-added-tax hikes and enforcement of budget discipline, was passed thanks to opposition deputies. Now the Greek parliament has to pass another set of rules to deal with failed banks and speed up the justice system as a condition for receiving the loan. Even if all measures are passed, the odds of early elections in autumn are now more than 50% as hard-liners in the prime minister’s ruling Syriza party start to rebel.
The Week Ahead
CAPITAL MARKETS RESEARCH
7 JULY 23, 2015 CAPITAL MARKETS RESEARCH, INC. / MARKET OUTLOOK / MOODYS.COM
Discussions about the EU's migration quotas should continue in the coming week. No solution was reached at this week's meeting of EU ministers on how to redistribute nearly 40,000 mostly Syrian and Eritrean migrants from Italy and Greece. So far, the relocation of about 32,000 new arrivals has been agreed on, while a decision is needed soon on the remaining 8,000.
In the first quarter, Germany received 73,000 asylum applications, the most in the EU, while Hungary received 33,000, Italy and France around 15,000 each, and Sweden 11,000. These EU member states have welcomed 80% of all applicants. The issue is socially and economically sensitive. For countries with already-high unemployment and tight government finances, such as Italy, Portugal, Greece and Spain, mostly poor and uneducated migrants may pose an economic and social burden. On the other hand, for Germany, which faces an aging population, the migrants may increase the available workforce.
Employment and confidence indicators are due out. In France, the number of job seekers likely remained unchanged in June at 3.55 million on the back of slow recovery and persistent structural problems in the labor market. Meanwhile, the unemployment rate in the euro zone likely ticked down to 11% from 11.1% previously as the recovery is firming and the weaker euro enables companies to hire workers in export-oriented industries. The Ifo business climate index in Germany likely retreated again following a brief period of increased optimism. Economic and geopolitical developments are again weighing on business confidence. The July consumer and business confidence index in Italy likely increased modestly, while consumer confidence in the U.K. probably remained unchanged from the previous month.
FRIDAY, JULY 24
Spain – Producer Price Index – June Time: 8:05 a.m. BST Forecast: -1.2% y/y The decline in Spain's producer prices likely eased in June, after falling 1.4% y/y in May. Global crude oil prices have found a floor, easing downward pressure on producer prices. Producer price growth will remain subdued as a rebound in global oil prices is elusive and domestic demand is improving only modestly.
Italy – Bank Lending Survey – 2015Q2 Time: 10:00 a.m. BST Forecast: -25% Credit conditions continued to ease in Italy in the three months to June, while demand for loans from small and medium-size enterprises likely rose. A negative number in the survey indicates that more banks are easing than not. Both targeted loans to the banking system and asset purchases will likely inject credit into the economy in coming months. Of the banks that have disclosed participation in the first three tranches of cheap long-term loans, Italian banks have the largest share of the total €310 billion. Meanwhile, we expect the ECB will continue to buy around €12 billion in sovereign bonds per week and around €3 billion in covered bonds and other asset-backed securities, reaching its target of €60 billion a month through September 2016. This should avert a deflation threat through the weaker euro and kick-start corporate lending.
Russian Federation – Business Confidence – July Time: 1:30 PM BST Forecast: -5 Business confidence in Russian manufacturing will likely remain in negative territory in July, but probably less so than in June, at -5. The gradual upswing should be in line with improving consumer sentiment, which would help drive private demand.
MONDAY, JULY 27
Euro Zone – Monetary Aggregates – June Time: 9:00 a.m. BST Forecast: 5.2% The seasonally adjusted annual growth of the euro zone’s M3 money supply likely accelerated in June to 5.2% y/y, following a 5% increase in May. The European Central Bank’s program designed to provide additional stimulus to the economy and widen the bank’s balance sheet has been boosting money supply

The Week Ahead
CAPITAL MARKETS RESEARCH
8 JULY 23, 2015 CAPITAL MARKETS RESEARCH, INC. / MARKET OUTLOOK / MOODYS.COM
growth in recent months and will likely strengthen, as the bank started purchases of government bonds in March. Some downward pressure on the money supply will persist because of relatively tight credit conditions, only slowly rising consumer prices, subdued interbank activity, and uncertainties clouding the euro zone’s recovery.
Germany – Ifo Business Climate Index – July Time: 9:30 a.m. BST Forecast: 107 The German Ifo Business Climate Index dropped to 107.4 in June from 108.5 in the previous month. Sentiment fell for the second consecutive month, most likely because of slower than expected GDP growth at the start of this year and uncertainty over a Greek exit from the euro area. The ZEW indicator of economic sentiment fell to 29.7 from 31.5 in June, while the ZEW indicator for the current situation rose to 63.9 from 62.9. As the outlook for Europe remains uncertain, sentiment will likely remain subdued in the next few months. We expect the Ifo index retreated to 107 in July.
Euro Zone – Conference Board Leading Indicators – June Time: 2:30 p.m. BST Forecast: 106.5 Confidence in the euro zone likely improved marginally in June after rising in the previous month. However, the reading continues to signal slow growth in the short term. Prospects for the euro zone remain weak and uncertainty is still high. Still, stronger than expected results for the fourth quarter of 2014 should support sentiment somewhat in coming months. The euro zone’s real GDP growth accelerated to 0.4% q/q in the three months to March from a 0.3% gain in the previous quarter, putting it 1% higher than in the same quarter of 2014.
France – Job Seekers – June Time: 5:00 p.m. BST Forecast: 3.55 million The number of job seekers in France likely remained unchanged in June because of the slow recovery and persistent structural problems in the labor market. While the number of job seekers under age 25 probably stalled, the number of long-term job seekers and those age 50 and over likely rose. Weak public and private sector hiring is curbing job creation. Low profit margins and weak fixed investment also weigh on new jobs, and GDP growth remains too low for a real employment rebound.
TUESDAY, JULY 28
France – Consumer Confidence – July Time: 7:45 a.m. BST Forecast: 95 French consumer confidence probably increased in July, yet it remains weak amid concerns about low GDP growth and high unemployment. The economy is recovering only slowly, with a negligible effect on employment figures so far, while joblessness continues to climb. Confidence will likely remain subdued with only hints of improvement in the months ahead. The savings rate remains elevated.
United Kingdom – GDP Production Breakdown – 2015Q2 Time: 9:30 a.m. BST Forecast: 2.4% The first estimate of U.K. real GDP for the three months to June likely showed the pace of growth remained firm. By sector, the breakdown probably shows services remained the main growth driver. Yet weaker demand from the euro zone, which contains some of the U.K.’s top trading partners, probably weighed on demand for manufactured exports. The euro zone’s recovery remains weak, and the recent strengthening of the pound against the euro has made U.K. exports less competitive.
Italy – Consumer and Business Confidence – July Time: 10:00 a.m. BST Forecast: 104.5 Italy’s business confidence likely climbed to 104.5 in July from 104.3 in the previous month, in line with the improving economy. Although growth in manufacturing moderated slightly in June, according to the

The Week Ahead
CAPITAL MARKETS RESEARCH
9 JULY 23, 2015 CAPITAL MARKETS RESEARCH, INC. / MARKET OUTLOOK / MOODYS.COM
purchasing managers’ index, industrial production rose 0.9% m/m in May thanks to lower oil prices, the weaker euro, and improved investor optimism in the euro zone. Similarly, consumer confidence likely increased because households expect the employment situation will improve in coming months, and they predict milder deflation one year ahead. Therefore, we remain cautiously optimistic and predict the Italian economy will likely rebound in 2015, with real GDP increasing about 0.6%.
WEDNESDAY, JULY 29
Spain – Retail Sales – June Time: 8:05 a.m. BST Forecast: 2.2% Spanish retail trade likely improved in annual terms in June, after cooling in May to 1.7% y/y. Lower food sales have been dampening spending, but slower price growth should lift real purchasing power and spending in coming months. Ructions in Greece will drag on discretionary spending early into the September quarter.
United Kingdom – BoE Lending to Individuals – June Time: 9:30 a.m. BST Forecast: £3 billion Total net lending to individuals climbed by £3.1 billion in May, up from £2.9 billion in the previous month. The main driver was a larger rise in lending secured on dwellings. Total net lending to individuals should remain relatively solid for the rest of this year but come under pressure early next year as official interest rates start to rise. In the short run the end of political uncertainty following the Conservatives' unexpectedly winning a parliamentary majority in May’s general election could unleash pent-up demand for credit. Net lending likely increased by £3 billion in June.
Germany – Lending by Banks – June Time: 11:00 p.m. BST Forecast: -1% German bank lending to private enterprises fell in annual terms in May for a sixth consecutive month. According to the most recent bank lending survey, credit conditions for corporations were eased marginally in the second quarter and further easing was expected for the next period. Demand for corporate credit has increased marginally. Borrowing will be muted in coming months as conservative German businesses refrain from large investments. Lending to enterprises likely continued to contract in June at a relatively stable rate.
THURSDAY, JULY 30
Euro Zone – Business and Consumer Sentiment – July Time: 10:00 a.m. BST Forecast: 103.6 Business and consumer confidence in the euro zone probably improved mildly in July, following a slight deterioration in the previous month. This would keep sentiment close to a multiyear high reached earlier this year. The euro zone economy grew in the first quarter at the fastest pace in several years, supported by low oil prices and a weaker euro. However, oil prices rebounded from long-term lows and the euro has appreciated considerably in last two months. The biggest risk to sentiment comes from a Greek exit from euro zone, which became more likely in past weeks and which would increase uncertainty among European producers and consumers.
United Kingdom – Consumer Confidence – July Time: 12:05 a.m. BST Forecast: 7 U.K. consumer confidence was likely unchanged in July, but firmly positive. The low inflation rate and faster nominal wage growth should have boosted household disposable income, making consumers feel wealthier. Furthermore, the unemployment rate's recent fall to a six-year low should have made workers feel less concerned about job security. Yet renewed fears about the Greek government's ability to meet

The Week Ahead
CAPITAL MARKETS RESEARCH
10 JULY 23, 2015 CAPITAL MARKETS RESEARCH, INC. / MARKET OUTLOOK / MOODYS.COM
its financial obligations and implement prescribed structural reforms likely spooked consumers somewhat.
FRIDAY, JULY 31
France – Household Consumption Survey – June Time: 7:45 a.m. BST Forecast: 0.1% French household consumption likely increased 0.1% m/m and strengthened 1.6% y/y in June on the back of low oil prices and a slow, yet firming, recovery in the country. Still, although households are slightly more optimistic about the country's economic future, the savings rate is still high, as households remain under pressure from high and long-term unemployment, the number of temporary jobs, and tight credit. This particularly affects spending on durable goods.
France – Producer Price Index – June Time: 7:45 a.m. BST Forecast: -1.8% Year-on-year producer prices in France likely decreased again in June on the back of low energy prices, particularly oil and oil derivatives. In month-ago terms, domestic producer prices probably increased a little. Also, demand for industrial products in France remains subdued and creates no significant price pressures, although the weaker euro is raising prices of some imported goods outside of the euro zone.
Germany – Employment Situation – July Time: 9:00 a.m. BST Forecast: 6.4% unemployed German unemployment dropped by 1,000 in June, and the unemployment rate remained at 6.4%. Another decrease in the number of unemployed points to improved confidence in Germany’s further expansion despite worse than expected results for the economy at the start of this year. According to the June Markit composite PMI, employment continued to increase during the month, although the pace was marginal. The unemployment rate is forecast to remain at 6.4% in coming months.
Spain – Business Confidence – July Time: 9:00 a.m. BST Forecast: 0 Spain's business confidence likely eased in July from June. The debt dramas in Greece likely dampened sentiment in July as the ructions created widespread uncertainty and discontent throughout the euro zone. Yet, the index is at multiyear highs thanks to the strengthening economy, and forward economic indicators suggest ongoing strength.
Spain – Government Finance – June Time: 9:00 a.m. BST Forecast: -€8.3 billion Spain's fiscal deficit likely narrowed in June, from May's €9.8 billion deficit, not seasonally adjusted. Improved GDP growth is somewhat helping government finances, but they remain under pressure from high unemployment keeping a lid on income taxes, the largest source of Spanish government revenue.
Italy – Employment Situation – June Time: 9:00 a.m. BST Forecast: 12.3% unemployed Italy’s unemployment rate likely fell in June from 12.4% in May thanks to the improving economy. The economy emerged from recession in the three months to March, with real GDP rising 0.3% q/q. The purchasing managers’ index suggests that the recovery continued in the second quarter, supported by the weaker euro, low oil prices, and improved investor optimism in the euro zone. Nevertheless, we expect the unemployment rate will trend downward only gradually, as the weak outlook discourages companies from major hiring.
Euro Zone – Preliminary Consumer Price Index – July Time: 10:00 a.m. BST

The Week Ahead
CAPITAL MARKETS RESEARCH
11 JULY 23, 2015 CAPITAL MARKETS RESEARCH, INC. / MARKET OUTLOOK / MOODYS.COM
Forecast: 0.3% Euro zone inflation likely accelerated in July from a year earlier, with consumer prices increasing 0.3% y/y, following the 0.2% growth in the previous month. The improving economy, weaker euro, and higher oil prices should drive up inflation in coming months. To accelerate price growth the European Central Bank continues to buy assets and provide long-term liquidity. The five-year forward break-even inflation rate has risen around 30 basis points to 1.8% since mid-January, approaching the ECB’s 2% target.
Euro Zone – Unemployment – June Time: 10:00 a.m. BST Forecast: 11% unemployed The euro zone’s unemployment rate likely ticked down 0.1 percentage point in June after reaching a multiyear low the previous month. This reflects the region’s increased pace of recovery, which reached 0.4% in quarter-ago terms in the first quarter of 2015. All confidence indicators across the euro zone point towards gradually improving spirits, supported by the lower price of oil and euro and the quantitative easing policy initiated by the ECB. Nevertheless, the recovery is too weak to make a substantial dent in the elevated unemployment rate. The greatest risk to recovery comes from uncertainty surrounding the political situation in Greece, which could reignite the region's crisis.
Russian Federation – Monetary Policy – August Time: 10:30 a.m. BST Forecast: 10% We expect the Bank of Russia to continue cutting the policy rate, to 10%, as the current high price of borrowing does not bode well and there is a dire need to revive investment and domestic demand. The decision will arrive on the back of decelerating inflation and a likely second quarter of annual GDP decline.
Italy – Producer Price Index – June Time: 11:00 a.m. BST Forecast: -1.7% Italy’s producer price deflation likely eased further in June. Slowly recovering manufacturing and the weakening euro will likely contribute to higher inflation in coming months. According to the May PMIs, inflation pressures are returning, with input costs rising at the fastest rate since February 2012 in manufacturing and at the fastest rate in almost two years in services. Nevertheless, price growth will be moderate because of ongoing structural rigidities.
ASIA-PACIFIC By Katrina Ell and the Asia-Pacific Staff of Moody’s Analytics Release times are Greenwich Mean Time
Japan’s June data barrage likely shows weak domestic demand is a widespread drag on the economy Japan’s June data likely painted a mixed picture. We expect subdued domestic demand led industrial production to post its second straight monthly decline. Core inflation has weakened markedly since the base effects from the April 2014 tax hike have faded. Further monetary stimulus measures look necessary to reach the 2% inflation goal. In contrast, June retail trade likely accelerated in annual terms. Spring wage increases boosted sales of food, cars and household goods in the second quarter after consumers cut back in the first quarter. This is helping to offset the drag from lower oil prices, which are weighing on nominal fuel sales.
Elsewhere, Taiwan’s GDP growth likely slowed in the June quarter. Softer Chinese growth is dragging on the export-driven economy as manufacturing sentiment and exports orders fall.

The Week Ahead
CAPITAL MARKETS RESEARCH
12 JULY 23, 2015 CAPITAL MARKETS RESEARCH, INC. / MARKET OUTLOOK / MOODYS.COM
FRIDAY, JULY 24
South Korea – Consumer Sentiment Index – July Time: 9:00 p.m. GMT Forecast: 99 Korea’s consumer sentiment index likely held at 99 in July after plummeting 6 points in June. The MERS outbreak and the government’s poor initial response which hurt sentiment last month continues to linger. However, the June interest rate cut and recently announced fiscal stimulus should boost confidence in July. It will take some time for the economy to recover from the outbreak, and we expect consumer sentiment will remain subdued through the next few months.
New Zealand – Foreign Trade – June Time: 10:45 p.m. GMT Forecast: NZ$122 million New Zealand's monthly trade surplus likely narrowed in June, from May's NZ$350 million surplus. A downward adjustment for crude oil imports drove the relatively large surplus in May as dairy exports continued to struggle amid the sustained slump in prices. A near-term rebound is unlikely given soft Chinese growth, ensuring exports remain under pressure.
Singapore – Industrial Production – June Time: 5:00 a.m. GMT Forecast: 1% y/y Industrial production has been weighed down by the cyclical drop in pharmaceutical production, but there are signs that the cycle is turning. This, coupled with continued gains in electronics production thanks to recovering U.S. demand, likely drove a rebound in industrial output in June.
MONDAY, JULY 27
Hong Kong – Foreign Trade – June Time: 8:30 a.m. GMT Forecast: -HK$33 billion Hong Kong’s monthly trade deficit likely narrowed to HK$33 billion in June from May’s HK$40.1 billion shortfall. Hong Kong has been hit particularly hard by China’s slower income growth and crackdown on corruption, resulting in declining exports to the mainland. Imports are declining on account of lower global oil prices and subdued domestic trade. These trends are expected to continue in the near term.
WEDNESDAY, JULY 29
Japan – Retail Sales – June Time: 11:50 p.m. GMT Forecast: 3% y/y Retail sales likely increased at a slightly faster year-over-year pace in June, following May’s 2.7% gain. Spring wage increases boosted sales of food, cars and household goods in the second quarter, after consumers cut back in the first quarter. This is helping to offset the drag from lower oil prices, which are weighing on nominal fuel sales.
THURSDAY, JULY 30
Japan – Industrial Production – June Time: 11:50 p.m. GMT Forecast: -2% m/m Japan’s industrial production likely fell 2% on a month-ago basis in June, posting a second straight monthly decline. Leading surveys suggest subdued domestic demand is weighing on manufacturing orders. The boost

The Week Ahead
CAPITAL MARKETS RESEARCH
13 JULY 23, 2015 CAPITAL MARKETS RESEARCH, INC. / MARKET OUTLOOK / MOODYS.COM
from the weaker yen is starting to fade, while continued U.S. demand for Japanese manufactured wares is not enough to offset weaker shipments to China and Europe.
Singapore – Employment – 2015Q2 Time: 2:30 a.m. GMT Forecast: 1.9% Unemployed Singapore's unemployment rate remains historically low. Much of this is due to slower foreign and local workforce growth rather than to strong demand for labor. The housing slowdown has cut construction hiring. Flat electronics and pharmaceuticals output has hurt manufacturing hiring. Service industries such as transport and finance continue to make up the bulk of the gains.
FRIDAY, JULY 31
Thailand – Private Consumption – June Time: 7:30 a.m. GMT Forecast: -0.4% y/y Thailand's private consumption likely fell 0.4% y/y in June, as consumers across the nation continue to struggle. The spending impulse has evaporated in 2015, and the Bank of Thailand's interest rate cuts have not yet encouraged consumers to open their wallets. Political uncertainty still weighs on sentiment, as democratic elections aren't expected until 2016. Lower inflation and oil prices haven't helped much either, so it's up to the military junta government to induce spending by increasing fiscal stimulus measures.
Thailand – Foreign Trade – June Time: 7:30 a.m. GMT Forecast: US$2.6 billion Thailand's anemic export growth likely continued in June. The trade surplus likely narrowed to US$2.6 billion. Exports and imports continued to fall on a year-ago basis. Weak commodity prices are weighing on export receipts, as is the mixed global and regional demand. The import bill continues to decline on lower oil prices, but weak domestic demand is also playing its part. Without fiscal stimulus and an increase in investment, Thai industries will continue to struggle, and exports are likely to fall further.
Thailand – Industrial Production – June Time: 5:00 p.m. GMT Forecast: -4.3% y/y Thailand's industrial production likely fell 4.3% y/y in June, after decreasing more than 7% in May. The precipitous fall in production is worrying for the Thai economy. It shows that interest rate cuts have not spurred investment in manufacturing. Export-oriented manufacturers are struggling the most as a result of a lack of external competitiveness. The problem is exacerbated by structural problems in production, namely a lack of innovation across industries. Further fiscal stimulus is needed to encourage investment in Thai wares.
South Korea – Industrial Production – June Time: 11:00 p.m. GMT Forecast: -3% y/y Industrial production likely fell 3% year on year in June, after dropping 2.8% in May. Manufacturing sentiment slid to its lowest level since September 2012, with new orders continuing a downward trend. Tech production was likely a bright spot in the data, as new products came on line. Accommodative monetary policy and the recently announced fiscal stimulus package should bolster production in coming months, while a pickup in U.S. growth will lead to a rebound in late 2015.
Japan – Consumer Price Index – June Time: 11:30 p.m. GMT Forecast: 0% y/y Japan’s core inflation rate has weakened markedly as the effects of the April 2014 tax hike fade. June data probably showed that underlying inflation is flat from a year earlier. All in all, the Bank of Japan may need to ease monetary policy further to reach its 2% inflation goal by mid-2016.
Japan – Employment Situation – June Time: 11:30 p.m. GMT
The Week Ahead
CAPITAL MARKETS RESEARCH
14 JULY 23, 2015 CAPITAL MARKETS RESEARCH, INC. / MARKET OUTLOOK / MOODYS.COM
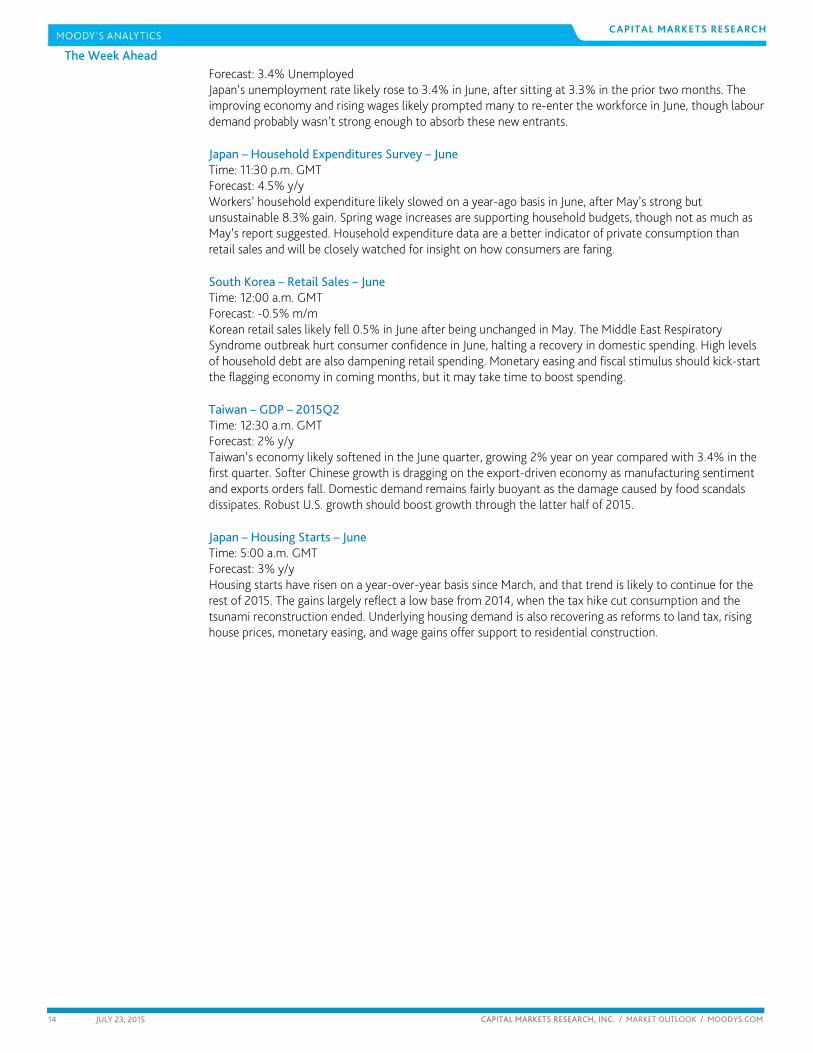
Forecast: 3.4% Unemployed Japan’s unemployment rate likely rose to 3.4% in June, after sitting at 3.3% in the prior two months. The improving economy and rising wages likely prompted many to re-enter the workforce in June, though labour demand probably wasn’t strong enough to absorb these new entrants.
Japan – Household Expenditures Survey – June Time: 11:30 p.m. GMT Forecast: 4.5% y/y Workers’ household expenditure likely slowed on a year-ago basis in June, after May’s strong but unsustainable 8.3% gain. Spring wage increases are supporting household budgets, though not as much as May’s report suggested. Household expenditure data are a better indicator of private consumption than retail sales and will be closely watched for insight on how consumers are faring.
South Korea – Retail Sales – June Time: 12:00 a.m. GMT Forecast: -0.5% m/m Korean retail sales likely fell 0.5% in June after being unchanged in May. The Middle East Respiratory Syndrome outbreak hurt consumer confidence in June, halting a recovery in domestic spending. High levels of household debt are also dampening retail spending. Monetary easing and fiscal stimulus should kick-start the flagging economy in coming months, but it may take time to boost spending.
Taiwan – GDP – 2015Q2 Time: 12:30 a.m. GMT Forecast: 2% y/y Taiwan’s economy likely softened in the June quarter, growing 2% year on year compared with 3.4% in the first quarter. Softer Chinese growth is dragging on the export-driven economy as manufacturing sentiment and exports orders fall. Domestic demand remains fairly buoyant as the damage caused by food scandals dissipates. Robust U.S. growth should boost growth through the latter half of 2015.
Japan – Housing Starts – June Time: 5:00 a.m. GMT Forecast: 3% y/y Housing starts have risen on a year-over-year basis since March, and that trend is likely to continue for the rest of 2015. The gains largely reflect a low base from 2014, when the tax hike cut consumption and the tsunami reconstruction ended. Underlying housing demand is also recovering as reforms to land tax, rising house prices, monetary easing, and wage gains offer support to residential construction.

The Week Ahead
CAPITAL MARKETS RESEARCH
15 JULY 23, 2015 CAPITAL MARKETS RESEARCH, INC. / MARKET OUTLOOK / MOODYS.COM
The Long View
The US: Weak second quarter business sales should boost perceived default risk by enough to materially curb high-yield bond issuance By John Lonski, Chief Economist, and Ben Garber, Economist, Moody’s Capital Markets Research Group, July 23, 2015
CREDIT SPREADS As measured by Moody's long-term average corporate bond yield, the recent investment grade corporate bond yield spread of 151 bp was above its 122-point mean of the two previous economic recoveries. Any narrowing by this spread may be limited by more cash- or debt-funded acquisitions, spin-offs, stock buybacks, and dividends. Subpar growth by business sales and profits will also add to credit risk, as will a rising risk of high-yield defaults.
The recent high-yield bond spread of 514 bp approximated what might be inferred from a forecasting model that employs the average high-yield expected default frequency metric, the Chicago Fed’s national activity index, and the VIX index. In view of how the investment-grade financial company bond yield spread widened from its 110 bp average of the 12-months-ended May 2015 to a recent 135 bp, the financial system may be slightly less willing to supply liquidity in the event of an adverse shock. Nevertheless, the implications for liquidity of regulatory changes merit above-average scrutiny.
DEFAULTS The US's trailing 12-month high-yield default rate was 2.0% in June 2015, which inched up from the 1.9% of both May 2015 and June 2014. The default rate is projected to approach 3% by December 2015.
Sufficient liquidity and core profits growth should rein in defaults for now.
US CORPORATE BOND ISSUANCE After advancing by 33% annually in 2012 to a record $1.134 trillion, 2013’s US$-denominated investment grade (IG) bond issuance dipped by -1.5% to $1.119 trillion. Following 2012’s 48% annual surge, US$-denominated high yield bond issuance advanced by 11% to a record $431 billion in 2013. Also, after gaining 5% in 2012, newly rated high yield bank loan programs increased by 38% annually to $579 billion in 2013.
In 2014, US$-denominated bond issuance edged up by 0.7% annually for IG, to $1.127 trillion and dropped by -2.7% to $419 billion for high yield. Also, newly rated bank loan programs from high yield issuers plunged by -17% in 2014 to $480 billion, which was far under 2007’s record $661 billion.
Second-quarter 2014’s worldwide corporate bond issuance posted year-over-year advances of 15% for IG and 53% for high-yield, wherein dollar-denominated bond offerings increased by 5% for IG and advanced by 32% for high-yield.
Q3-2014’s worldwide corporate bond issuance revealed annual decline of -10.2% for IG and a rise of 0.4% for high-yield that included setbacks for US$-denominated issuance of -15% for IG and -1% for high-yield.
Q4-2014’s worldwide corporate bond issuance showed annual percent changes of a 3.8% increase for IG and a -19.7% plunge for high-yield. At the same time, US$-denominated offerings advanced by 17% for IG and sank by -9% for high yield.
Q1-2015’s worldwide corporate bond issuance increased annually by 9.5% for investment-grade and by 12.1% for high-yield; US$-priced offerings the advances were 23% and 29%, respectively.
According to a preliminary estimate, Q2-2015’s worldwide offerings of corporate bonds showed annual percent changes of +5% for IG and -35% for high-yield, wherein US$-denominated supply soared higher by 31% for IG and plunged by -21% for high yield.
For yearlong 2015, worldwide corporate bond offerings are likely to rise by 4% annually for IG and fall by -14% for high yield.
Through the first 29 weeks of 2015, the year-over-year percent changes for corporate bond issuance were +19.9% for US$-denominated investment-grade, -3.6% for US$-denominated high-yield, -14.7% for euro-denominated investment-grade, and -45.9% for euro-denominated high-yield.
In 2015, a growing number of bond issues and newly-rated bank loan programs will fund acquisitions and shareholder compensation. Companies will resort to acquisitions and divestitures in order to better cope
The Long View The Long View

The Week Ahead
CAPITAL MARKETS RESEARCH
16 JULY 23, 2015 CAPITAL MARKETS RESEARCH, INC. / MARKET OUTLOOK / MOODYS.COM
with the US’s subpar recovery. To the degree companies fear significantly higher bond yields, pre-fundings will rise.
US ECONOMIC OUTLOOK Fed funds should finish 2015 no greater than 0.50%. In view of how persistently high unemployment will contain wages, low inflation should help to rein in Treasury bond yields. As long as labor is grossly underutilized and the global economy operates below trend, the 10-year Treasury yield may not remain above 2.25% for long. A fundamentally excessive climb by Treasury bond yields and a pronounced slowing by expenditures in dynamic emerging market countries are among the biggest threats to the adequacy of economic growth and credit spreads going forward.
EUROPE By Tomas Holinka of Moody’s Analytics July 23, 2015 The Eurozone’s economic recovery should pick up modestly this year. Moody’s Analytics expects the economy to grow 1.4% this year, up from around 1% in 2014. The European Central Bank is likely to keep monetary policy very loose for an extended period and maintain its bond purchases through its Expanded Asset Purchase Program, under which the bank buys €60 billion in assets per month. The program will continue until September 2016 or until inflation moves closer to target. The yield on Eurozone 10-year government bonds will remain low longer thanks to the ECB’s purchases. Meanwhile, the ECB will gradually start monetary policy normalization in the first quarter of 2018, pushing the euro zone’s 10-year government bond yield to 2.9% by late 2020. The annual inflation rate eased to 0.2% in June from 0.3% in the previous month. The improving economy, weaker euro, and higher oil prices should put upward pressure on inflation in coming months. The quantitative easing program has improved credit availability and continues to support the region’s economy. Although Greece and its creditors agreed to a new bailout deal, avoiding a Greek exit, political uncertainty in Greece remain the greatest threat to the outlook.
U.K. economic growth should moderate in 2015 but remain solid. The economy faces pressure from the weak recovery in the Eurozone — one of Britain's top export markets — and the recent strengthening of the pound against the euro making U.K. exports to the region less cost competitive. Moody’s Analytics expects the economy to grow about 2.4% in 2015, a little down from 3% last year. The Bank of England is likely to start raising interest rates in the first quarter of next year. Policymakers remain focused on domestic demand-driven pressures, particularly from the tightening labor market, because they consider that the downward cost-push pressure on inflation from the recent sharp fall in crude oil prices will be temporary. The central bankers expect inflation to rise and hit the BoE’s target of 2% within the next one to two years. The U.K. annual headline CPI held steady in June, after increasing 0.1% previously. The main risk to the outlook is the political uncertainty in Greece and also a threat from U.K. voters deciding to quit the European Union in the referendum due by the end of 2017.
ASIA PACIFIC By Alaistair Chan and the Asia-Pacific Staff of Moody’s Analytics July 23, 2015 China’s economy grew 7% y/y in the second quarter, which is a little higher than expected thanks to a large boost from greater financial services, led by a flurry of stock market activity. China has a volatile and fragile stock market, but a recovering underlying economy. The question is what will lead the other: either a falling stock market slows real investment and spending, or a recovering housing market boosts asset prices.
The Long View

The Week Ahead
CAPITAL MARKETS RESEARCH
17 JULY 23, 2015 CAPITAL MARKETS RESEARCH, INC. / MARKET OUTLOOK / MOODYS.COM
The Shanghai composite has risen about 14% from its trough in early July. Conditions remain fragile, and the government's restrictions, including a ban on short selling and a ban on company insiders selling stock remain on the books. Nevertheless there is reason to conclude that, for better or worse, the government's intervention in the stock market has been a limited success.
The good news is that the volatility in stocks seems to be contained. China's stock market is considered relatively unsophisticated, relative to the rest of the financial market. The yuan, for instance, has remained stable throughout the stock market’s ructions. Interbank lending rates such as SHIBOR have similarly been stable.
June data show some signs of the economy gaining momentum. Industrial production rose 6.8% y/y, accelerating from a 6.1% gain in May. Nominal GDP growth accelerated in the second quarter to 7.1% y/y, up from 5.8% in the first. China’s statistics agency was downbeat in the statement accompanying the GDP data, noting that domestic and external economic conditions are "still complicated", that the global economic recovery was "slow and tortuous", and that work on stabilizing the economy needed to be "further consolidated".

The Week Ahead
CAPITAL MARKETS RESEARCH
18 JULY 23, 2015 CAPITAL MARKETS RESEARCH, INC. / MARKET OUTLOOK / MOODYS.COM
Ratings Round-Up By Njundu Sanneh
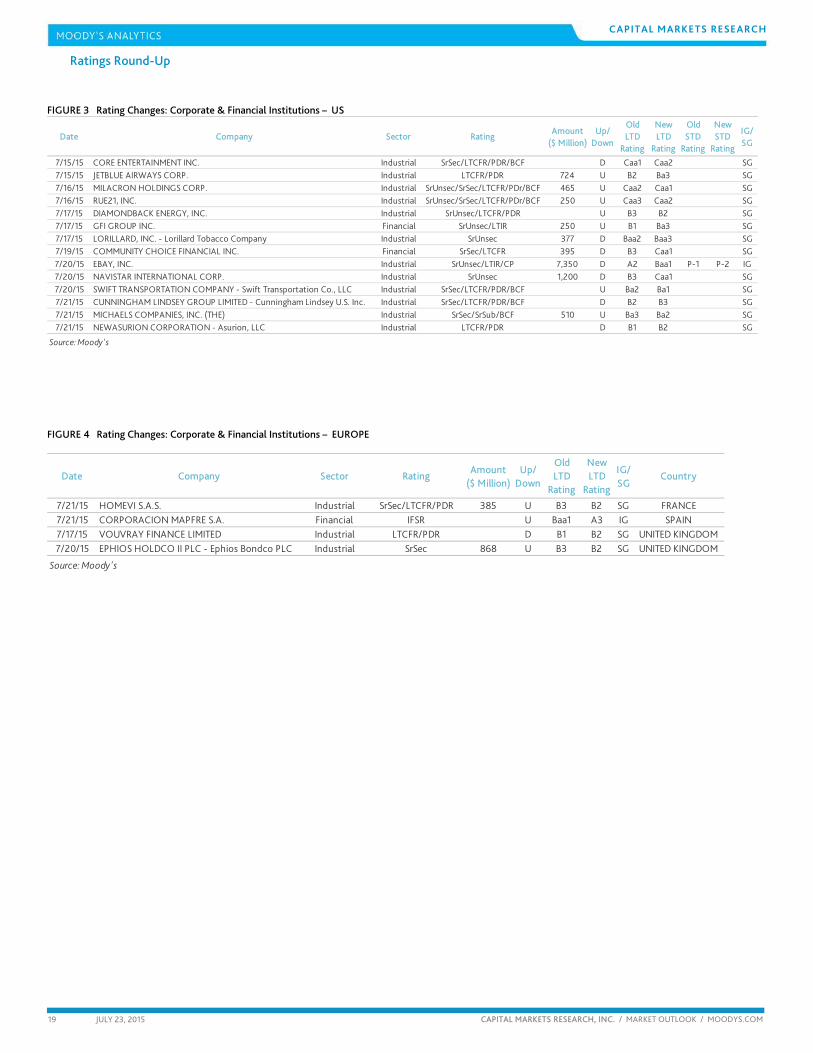
Slightly More Upgrades Than Downgrades The US ratio of upgrades to total rating changes, a gauge of corporate credit quality, measured at least 50% for the second week since the effects of the bank rating methodology review waned. The review skewed activity toward upgrades. Upgrades for the past week were 50% for the US and 75% for Europe, though Europe had only four changes. The US had fourteen, all but one speculative grade industrial companies. Jetblue Airways Corporation and The Michael Companies , Inc. were among the notable upgrades, with debts affected of $0.7 and $0.5 billion, respectively. On the downgrade side were Ebay, Inc. and Navistar International Corporation, with $7.4 and $1.2 billion in debts affected, respectively.
There is a paucity of rating change activity in Europe as only four rating changes were registered for the second week in a row with two out of the four rating changes coming from the UK. Upgrades were 75% in the past week compared to 25% the week earlier.
FIGURE 1 Rating Changes - US Corporate & Financial Institutions: Favorable as % of Total Actions
0.0
0.2
0.4
0.6
0.8
1.0
0.0
0.2
0.4
0.6
0.8
1.0
Jul03 Jun06 May09 Apr12 Mar15
By Count of Actions By Amount of Debt Affected
* Trailing 3-month average
Source: Moody's FIGURE 2 Rating Key
BCF Bank Credit Facility Rating MM Money-MarketCFR Corporate Family Rating MTN MTN Program RatingCP Commercial Paper Rating Notes NotesFSR Bank Financial Strength Rating PDR Probability of Default RatingIFS Insurance Financial Strength Rating PS Preferred Stock RatingIR Issuer Rating SGLR Speculative-Grade Liquidity Rating
JrSub Junior Subordinated Rating SLTD Short- and Long-Term Deposit RatingLGD Loss Given Default Rating SrSec Senior Secured Rating LTCF Long-Term Corporate Family Rating SrUnsec Senior Unsecured Rating LTD Long-Term Deposit Rating SrSub Senior SubordinatedLTIR Long-Term Issuer Rating STD Short-Term Deposit Rating
Ratings Round-Up
The Week Ahead
CAPITAL MARKETS RESEARCH
19 JULY 23, 2015 CAPITAL MARKETS RESEARCH, INC. / MARKET OUTLOOK / MOODYS.COM
FIGURE 3 Rating Changes: Corporate & Financial Institutions – US
Date Company Sector RatingAmount
($ Million)Up/
Down
Old LTD
Rating
New LTD
Rating
Old STD
Rating
New STD
Rating
IG/SG
7/15/15 CORE ENTERTAINMENT INC. Industrial SrSec/LTCFR/PDR/BCF D Caa1 Caa2 SG7/15/15 JETBLUE AIRWAYS CORP. Industrial LTCFR/PDR 724 U B2 Ba3 SG7/16/15 MILACRON HOLDINGS CORP. Industrial SrUnsec/SrSec/LTCFR/PDr/BCF 465 U Caa2 Caa1 SG7/16/15 RUE21, INC. Industrial SrUnsec/SrSec/LTCFR/PDr/BCF 250 U Caa3 Caa2 SG7/17/15 DIAMONDBACK ENERGY, INC. Industrial SrUnsec/LTCFR/PDR U B3 B2 SG7/17/15 GFI GROUP INC. Financial SrUnsec/LTIR 250 U B1 Ba3 SG7/17/15 LORILLARD, INC. - Lorillard Tobacco Company Industrial SrUnsec 377 D Baa2 Baa3 SG7/19/15 COMMUNITY CHOICE FINANCIAL INC. Financial SrSec/LTCFR 395 D B3 Caa1 SG7/20/15 EBAY, INC. Industrial SrUnsec/LTIR/CP 7,350 D A2 Baa1 P-1 P-2 IG7/20/15 NAVISTAR INTERNATIONAL CORP. Industrial SrUnsec 1,200 D B3 Caa1 SG7/20/15 SWIFT TRANSPORTATION COMPANY - Swift Transportation Co., LLC Industrial SrSec/LTCFR/PDR/BCF U Ba2 Ba1 SG7/21/15 CUNNINGHAM LINDSEY GROUP LIMITED - Cunningham Lindsey U.S. Inc. Industrial SrSec/LTCFR/PDR/BCF D B2 B3 SG7/21/15 MICHAELS COMPANIES, INC. (THE) Industrial SrSec/SrSub/BCF 510 U Ba3 Ba2 SG7/21/15 NEWASURION CORPORATION - Asurion, LLC Industrial LTCFR/PDR D B1 B2 SG
Source: Moody's FIGURE 4 Rating Changes: Corporate & Financial Institutions – EUROPE
Date Company Sector RatingAmount
($ Million)Up/
Down
Old LTD
Rating
New LTD
Rating
IG/SG
Country
7/21/15 HOMEVI S.A.S. Industrial SrSec/LTCFR/PDR 385 U B3 B2 SG FRANCE7/21/15 CORPORACION MAPFRE S.A. Financial IFSR U Baa1 A3 IG SPAIN7/17/15 VOUVRAY FINANCE LIMITED Industrial LTCFR/PDR D B1 B2 SG UNITED KINGDOM7/20/15 EPHIOS HOLDCO II PLC - Ephios Bondco PLC Industrial SrSec 868 U B3 B2 SG UNITED KINGDOM
Source: Moody's
Ratings Round-Up

CAPITAL MARKETS RESEARCH
20 JULY 23, 2015 CAPITAL MARKETS RESEARCH, INC. / MARKET OUTLOOK / MOODYS.COM
Market Data
0
200
400
600
800
0
200
400
600
800
2003 2004 2005 2006 2007 2008 2009 2010 2011 2012 2013 2014 2015
Spread (bp) Spread (bp) Aa2 A2 Baa2
Source: Moody'sSource: Moody's
Figure 1: 5-Year Median Spreads-Global Data (High Grade)
0
400
800
1,200
1,600
2,000
0
400
800
1,200
1,600
2,000
2003 2004 2005 2006 2007 2008 2009 2010 2011 2012 2013 2014 2015
Spread (bp) Spread (bp) Ba2 B2 Caa-C
Source: Moody's
Figure 2: 5-Year Median Spreads-Global Data (High Yield)
Spreads

CAPITAL MARKETS RESEARCH
21 JULY 23, 2015 CAPITAL MARKETS RESEARCH, INC. / MARKET OUTLOOK / MOODYS.COM
CDS Movers
CDS Implied Rating Rises
Issuer Jul. 22 Jul. 15 Senior RatingsBank of America, N.A. Baa1 Baa2 A1Pfizer Inc. Aa2 Aa3 A1UnitedHealth Group Incorporated A1 A2 A3General Electric Company A2 A3 A1First Data Corporation B2 B3 Caa1U.S. Bancorp A3 Baa1 A1Mondelez International, Inc. A1 A2 Baa1Simon Property Group, L.P. A2 A3 A2NiSource Finance Corporation A3 Baa1 Baa2Exelon Corporation A2 A3 Baa2
CDS Implied Rating DeclinesIssuer Jul. 22 Jul. 15 Senior RatingsNewmont Mining Corporation B1 Ba2 Baa2Advanced Micro Devices, Inc. Ca Caa2 Caa1Boeing Capital Corporation Aa2 Aaa A2United States of America, Government of Aa2 Aa1 AaaApple Inc. Aa3 Aa2 Aa1Merck & Co., Inc. Aa3 Aa2 A2Time Warner Cable, Inc. Ba1 Baa3 Baa2Roche Holdings Inc. A1 Aa3 A1United Technologies Corporation A2 A1 A23M Company Aa2 Aa1 Aa3
CDS Spread IncreasesIssuer Senior Ratings Jul. 22 Jul. 15 Spread DiffPeabody Energy Corporation Caa1 4,323 3,669 653Advanced Micro Devices, Inc. Caa1 1,490 1,009 481Arch Coal, Inc. Ca 6,252 5,836 416AK Steel Corporation Caa1 1,517 1,239 277iHeartCommunications, Inc. Ca 2,337 2,154 182Chesapeake Energy Corporation Ba1 724 542 181Windstream Services, LLC B1 831 713 118K. Hovnanian Enterprises, Inc. Caa1 929 815 113Toys 'R' US, Inc. Caa2 1,633 1,527 106United States Steel Corporation B1 745 642 103
CDS Spread DecreasesIssuer Senior Ratings Jul. 22 Jul. 15 Spread DiffNine West Holdings, Inc. Caa2 2,333 2,532 -199Sears Holdings Corp. Caa2 1,323 1,354 -31First Data Corporation Caa1 303 322 -19FCA US LLC B3 199 217 -18PolyOne Corporation Ba3 173 190 -17Hertz Corporation (The) B2 372 389 -16Health Net, Inc. Ba2 161 177 -16Genworth Holdings, Inc. Ba1 291 307 -15GenOn Energy, Inc. B3 737 752 -15Alcatel-Lucent USA, Inc. B3 157 171 -14
Source: Moody's, MarkIt
CDS Spreads
CDS Implied Ratings
CDS Implied Ratings
CDS Spreads
Figure 3. CDS Movers - US (July 15, 2015 – July 22, 2015)

CAPITAL MARKETS RESEARCH
22 JULY 23, 2015 CAPITAL MARKETS RESEARCH, INC. / MARKET OUTLOOK / MOODYS.COM
CDS Implied Rating Rises
Issuer Jul. 22 Jul. 15 Senior RatingsBelgium, Government of A1 A2 Aa3Svenska Handelsbanken AB A3 Baa1 Aa2Raiffeisen Bank International AG B1 B2 Baa2Erste Group Bank AG Ba1 Ba2 Baa2Orange A3 Baa1 Baa1Compagnie de Saint-Gobain SA A3 Baa1 Baa2Lafarge SA A2 A3 Ba1Caixa Geral de Depositos, S.A. Ba3 B1 B1Prudential Public Limited Company Baa1 Baa2 A2HeidelbergCement AG Baa2 Baa3 Ba2
CDS Implied Rating DeclinesIssuer Jul. 22 Jul. 15 Senior RatingsNetherlands, Government of Aa2 Aa1 AaaAbbey National Treasury Services plc A3 A2 A2SEB A3 A2 Aa3Banca Monte dei Paschi di Siena S.p.A. B1 Ba3 B3Banco Popular Espanol, S.A. Ba2 Ba1 Ba3Swedish Export Credit Corporation Aa1 Aaa Aa1Deutsche Bahn AG Aa2 Aa1 Aa1Banca Popolare di Milano S.C.a r.l. Ba2 Ba1 Ba3Ensco plc B3 B2 Baa1Anglo American plc B1 Ba3 Baa2
CDS Spread IncreasesIssuer Senior Ratings Jul. 22 Jul. 15 Spread DiffNorske Skogindustrier ASA Caa3 3,605 2,258 1,347Abengoa S.A. B2 1,345 1,088 258Ensco plc Baa1 335 302 33ArcelorMittal Ba1 303 272 31CMA CGM S.A. B3 546 518 29Portugal Telecom International Finance B.V. Ba2 482 455 28Stena AB B2 432 411 22Anglo American plc Baa2 211 190 21Iceland Bondco plc Caa1 578 566 12Banca Popolare di Milano S.C.a r.l. Ba3 145 138 8
CDS Spread DecreasesIssuer Senior Ratings Jul. 22 Jul. 15 Spread DiffNational Bank of Greece S.A. Caa3 2,771 6,969 -4,197Alpha Bank AE Caa3 1,847 3,942 -2,095Piraeus Bank S.A. Caa3 4,573 5,925 -1,353Eurobank Ergasias S.A. Caa3 3,750 4,860 -1,109Greece, Government of Caa3 1,936 2,354 -418Matalan Finance plc Caa1 604 650 -46DEPFA Bank plc Ba1 272 317 -45Raiffeisen Bank International AG Baa2 208 249 -41Galapagos Holding S.A. Caa1 458 497 -39Care UK Health & Social Care plc B3 487 525 -38
Source: Moody's, MarkIt
CDS Spreads
CDS Implied Ratings
CDS Implied Ratings
CDS Spreads
Figure 4. CDS Movers - Europe (July 15, 2015 – July 22, 2015)

CAPITAL MARKETS RESEARCH
23 JULY 23, 2015 CAPITAL MARKETS RESEARCH, INC. / MARKET OUTLOOK / MOODYS.COM
Issuance
0
300
600
900
1,200
1,500
1,800
0
300
600
900
1,200
1,500
1,800
Jan Feb Mar Apr May Jun Jul Aug Sep Oct Nov Dec
Issuance ($B) Issuance ($B)2012 2013 2014 2015
Source: Moody's / Dealogic
Figure 5. Market Cumulative Issuance - Corporate & Financial Institutions: USD Denominated
0
200
400
600
800
1,000
0
200
400
600
800
1,000
Jan Feb Mar Apr May Jun Jul Aug Sep Oct Nov Dec
Issuance ($B) Issuance ($B)2012 2013 2014 2015
Source: Moody's / Dealogic
Figure 6. Market Cumulative Issuance - Corporate & Financial Institutions: Euro Denominated
Investment-Grade High-Yield Total*Amount Amount Amount
$B $B $BWeekly 29.952 3.225 39.392
Year-to-Date 816.441 253.978 1,129.494
Investment-Grade High-Yield Total*Amount Amount Amount
$B $B $BWeekly 19.497 0.650 22.343
Year-to-Date 420.440 60.544 508.776* Difference represents issuance with pending ratings.Source: Moody's/ Dealogic
USD Denominated
Euro Denominated
Figure 7. Issuance: Corporate & Financial Institutions

CAPITAL MARKETS RESEARCH
24 JULY 23, 2015 CAPITAL MARKETS RESEARCH, INC. / MARKET OUTLOOK / MOODYS.COM
Moody’s Capital Markets Research recent publications
https://www.moodys.com/research/Market-Signals-Review-UBSs-Market-Implied-Ratings-All-Improve--PBM_1006874
https://www.moodys.com/research/Market-Signals-Review-Wells-Fargo-Companys-Market-Signals-Follow-Dissimilar--PBM_1006858
https://www.moodys.com/research/Market-Signals-Review-Citigroup-Inc-Two-Market-Implied-Ratings-Rally--PBM_1006826
https://www.moodys.com/research/Market-Signals-Review-Morgan-Stanley-Two-Market-Implied-Ratings-Improve--PBM_1006811
https://www.moodys.com/research/Market-Signals-Review-JPMs-Market-Implied-Ratings-Follow-Different-Paths--PBM_1006795
https://www.moodys.com/research/Market-Signals-Review-International-Paper-Co-Market-Implied-Ratings-Follow--PBC_1006750
https://www.moodys.com/research/Sub-sovereign-Oaxaca-State-of-Rising-Payroll-Costs-Dents-Oaxacas--PBC_1006389
https://www.moodys.com/research/Market-Signals-Review-US-Bancorps-CDS-Implied-Rating-Advances--PBC_1006724
https://www.moodys.com/research/Sovereign-Risk-Report-Greek-Sovereign-EDF-Measures-Decline-On-Bailout--PBC_1006730
https://www.moodys.com/research/Credit-Risks-Rise-as-Sales-Lag-Capacity-Capital-Markets-Research--PBC_183127
https://www.moodys.com/research/Market-Signals-Review-Bank-of-America-Corp-All-Three-Market--PBC_1006700
https://www.moodys.com/research/Market-Signals-Review-Republic-Services-Fixed-Income-Market-Implied-Ratings--PBC_1006608
https://www.moodys.com/research/Rail-Freight-Transportation-Services-Russia-Weak-Domestic-Economy-and-Railcar--PBC_1005955
https://www.moodys.com/research/Market-Signals-Review-Honeywell-Three-Market-Implied-Ratings-Follow-Different--PBC_1006572
https://www.moodys.com/research/Sovereign-Risk-Report-Markets-Anticipated-Greeces-Eleventh-Hour-Deal--PBC_1006558
https://www.moodys.com/research/Market-Signals-Review-Banco-Santander-SA-Two-Market-Implied-Ratings--PBM_1006527
https://www.moodys.com/research/Wobbly-World-Menaces-Credit-Quality-Capital-Markets-Research--PBC_182953
These and others are also available at: http://www.moodys.com/cmrg

CAPITAL MARKETS RESEARCH
25 JULY 23, 2015 CAPITAL MARKETS RESEARCH, INC. / MARKET OUTLOOK / MOODYS.COM
To order reprints of this report (100 copies minimum), please call 212.553.1658.
Report Number: 183308 Contact Us
Editor Dana Gordon
Americas : 1.212.553.4399
Europe: +44 (0) 20.7772.5588
Asia: 813.5408.4131
© 2015 Moody’s Corporation, Moody’s Investors Service, Inc., Moody’s Analytics, Inc. and/or their licensors and affiliates (collectively, “MOODY’S”). All rights reserved.
CREDIT RATINGS ISSUED BY MOODY'S INVESTORS SERVICE, INC. (“MIS”) AND ITS AFFILIATES ARE MOODY’S CURRENT OPINIONS OF THE RELATIVE FUTURE CREDIT RISK OF ENTITIES, CREDIT COMMITMENTS, OR DEBT OR DEBT-LIKE SECURITIES, AND CREDIT RATINGS AND RESEARCH PUBLICATIONS PUBLISHED BY MOODY’S (“MOODY’S PUBLICATIONS”) MAY INCLUDE MOODY’S CURRENT OPINIONS OF THE RELATIVE FUTURE CREDIT RISK OF ENTITIES, CREDIT COMMITMENTS, OR DEBT OR DEBT-LIKE SECURITIES. MOODY’S DEFINES CREDIT RISK AS THE RISK THAT AN ENTITY MAY NOT MEET ITS CONTRACTUAL, FINANCIAL OBLIGATIONS AS THEY COME DUE AND ANY ESTIMATED FINANCIAL LOSS IN THE EVENT OF DEFAULT. CREDIT RATINGS DO NOT ADDRESS ANY OTHER RISK, INCLUDING BUT NOT LIMITED TO: LIQUIDITY RISK, MARKET VALUE RISK, OR PRICE VOLATILITY. CREDIT RATINGS AND MOODY’S OPINIONS INCLUDED IN MOODY’S PUBLICATIONS ARE NOT STATEMENTS OF CURRENT OR HISTORICAL FACT. MOODY’S PUBLICATIONS MAY ALSO INCLUDE QUANTITATIVE MODEL-BASED ESTIMATES OF CREDIT RISK AND RELATED OPINIONS OR COMMENTARY PUBLISHED BY MOODY’S ANALYTICS, INC. CREDIT RATINGS AND MOODY’S PUBLICATIONS DO NOT CONSTITUTE OR PROVIDE INVESTMENT OR FINANCIAL ADVICE, AND CREDIT RATINGS AND MOODY’S PUBLICATIONS ARE NOT AND DO NOT PROVIDE RECOMMENDATIONS TO PURCHASE, SELL, OR HOLD PARTICULAR SECURITIES. NEITHER CREDIT RATINGS NOR MOODY’S PUBLICATIONS COMMENT ON THE SUITABILITY OF AN INVESTMENT FOR ANY PARTICULAR INVESTOR. MOODY’S ISSUES ITS CREDIT RATINGS AND PUBLISHES MOODY’S PUBLICATIONS WITH THE EXPECTATION AND UNDERSTANDING THAT EACH INVESTOR WILL, WITH DUE CARE, MAKE ITS OWN STUDY AND EVALUATION OF EACH SECURITY THAT IS UNDER CONSIDERATION FOR PURCHASE, HOLDING, OR SALE.
MOODY’S CREDIT RATINGS AND MOODY’S PUBLICATIONS ARE NOT INTENDED FOR USE BY RETAIL INVESTORS AND IT WOULD BE RECKLESS FOR RETAIL INVESTORS TO CONSIDER MOODY’S CREDIT RATINGS OR MOODY’S PUBLICATIONS IN MAKING ANY INVESTMENT DECISION. IF IN DOUBT YOU SHOULD CONTACT YOUR FINANCIAL OR OTHER PROFESSIONAL ADVISER.
ALL INFORMATION CONTAINED HEREIN IS PROTECTED BY LAW, INCLUDING BUT NOT LIMITED TO, COPYRIGHT LAW, AND NONE OF SUCH INFORMATION MAY BE COPIED OR OTHERWISE REPRODUCED, REPACKAGED, FURTHER TRANSMITTED, TRANSFERRED, DISSEMINATED, REDISTRIBUTED OR RESOLD, OR STORED FOR SUBSEQUENT USE FOR ANY SUCH PURPOSE, IN WHOLE OR IN PART, IN ANY FORM OR MANNER OR BY ANY MEANS WHATSOEVER, BY ANY PERSON WITHOUT MOODY’S PRIOR WRITTEN CONSENT.
All information contained herein is obtained by MOODY’S from sources believed by it to be accurate and reliable. Because of the possibility of human or mechanical error as well as other factors, however, all information contained herein is provided “AS IS” without warranty of any kind. MOODY'S adopts all necessary measures so that the information it uses in assigning a credit rating is of sufficient quality and from sources MOODY'S considers to be reliable including, when appropriate, independent third-party sources. However, MOODY’S is not an auditor and cannot in every instance independently verify or validate information received in the rating process or in preparing the Moody’s Publications.
To the extent permitted by law, MOODY’S and its directors, officers, employees, agents, representatives, licensors and suppliers disclaim liability to any person or entity for any indirect, special, consequential, or incidental losses or damages whatsoever arising from or in connection with the information contained herein or the use of or inability to use any such information, even if MOODY’S or any of its directors, officers, employees, agents, representatives, licensors or suppliers is advised in advance of the possibility of such losses or damages, including but not limited to: (a) any loss of present or prospective profits or (b) any loss or damage arising where the relevant financial instrument is not the subject of a particular credit rating assigned by MOODY’S.
To the extent permitted by law, MOODY’S and its directors, officers, employees, agents, representatives, licensors and suppliers disclaim liability for any direct or compensatory losses or damages caused to any person or entity, including but not limited to by any negligence (but excluding fraud, willful misconduct or any other type of liability that, for the avoidance of doubt, by law cannot be excluded) on the part of, or any contingency within or beyond the control of, MOODY’S or any of its directors, officers, employees, agents, representatives, licensors or suppliers, arising from or in connection with the information contained herein or the use of or inability to use any such information.
NO WARRANTY, EXPRESS OR IMPLIED, AS TO THE ACCURACY, TIMELINESS, COMPLETENESS, MERCHANTABILITY OR FITNESS FOR ANY PARTICULAR PURPOSE OF ANY SUCH RATING OR OTHER OPINION OR INFORMATION IS GIVEN OR MADE BY MOODY’S IN ANY FORM OR MANNER WHATSOEVER.
MIS, a wholly-owned credit rating agency subsidiary of Moody’s Corporation (“MCO”), hereby discloses that most issuers of debt securities (including corporate and municipal bonds, debentures, notes and commercial paper) and preferred stock rated by MIS have, prior to assignment of any rating, agreed to pay to MIS for appraisal and rating services rendered by it fees ranging from $1,500 to approximately $2,500,000. MCO and MIS also maintain policies and procedures to address the independence of MIS’s ratings and rating processes. Information regarding certain affiliations that may exist between directors of MCO and rated entities, and between entities who hold ratings from MIS and have also publicly reported to the SEC an ownership interest in MCO of more than 5%, is posted annually at www.moodys.com under the heading “Shareholder Relations — Corporate Governance — Director and Shareholder Affiliation Policy.”
For Australia only: Any publication into Australia of this document is pursuant to the Australian Financial Services License of MOODY’S affiliate, Moody’s Investors Service Pty Limited ABN 61 003 399 657AFSL 336969 and/or Moody’s Analytics Australia Pty Ltd ABN 94 105 136 972 AFSL 383569 (as applicable). This document is intended to be provided only to “wholesale clients” within the meaning of section 761G of the Corporations Act 2001. By continuing to access this document from within Australia, you represent to MOODY’S that you are, or are accessing the document as a representative of, a “wholesale client” and that neither you nor the entity you represent will directly or indirectly disseminate this document or its contents to “retail clients” within the meaning of section 761G of the Corporations Act 2001. MOODY’S credit rating is an opinion as to the creditworthiness of a debt obligation of the issuer, not on the equity securities of the issuer or any form of security that is available to retail clients. It would be dangerous for “retail clients” to make any investment decision based on MOODY’S credit rating. If in doubt you should contact your financial or other professional adviser.
For Publications Issued by Moody’s Capital Markets Research, Inc. only:
The statements contained in this research report are based solely upon the opinions of Moody’s Capital Markets Research, Inc. and the data and information available to the authors at the time of publication of this report. There is no assurance that any predicted results will actually occur. Past performance is no guarantee of future results.
The analysis in this report has not been made available to any issuer prior to publication.
When making an investment decision, investors should use additional sources of information and consult with their investment advisor. Investing in securities involves certain risks including possible fluctuations in investment return and loss of principal. Investing in bonds presents additional risks, including changes in interest rates and credit risk.
Moody's Capital Markets Research, Inc., is a subsidiary of MCO. Please note that Moody’s Analytics, Inc., an affiliate of Moody’s Capital Markets Research, Inc. and a subsidiary of MCO, provides a wide range of research and analytical products and services to corporations and participants in the financial markets. Customers of Moody’s Analytics, Inc. may include companies mentioned in this report. Please be advised that a conflict may exist and that any investment decisions you make are your own responsibility. The Moody’s Analytics logo is used on certain Moody’s Capital Markets Research, Inc. products for marketing purposes only. Moody’s Analytics, Inc. is a separate company from Moody’s Capital Markets Research, Inc.