moored current meter data from jasin 1978 - core · "meteor" forsch.-ergebnisse seite...
TRANSCRIPT

"Meteor" Forsch.-Ergebnisse Seite 5-24 Berlin · Stuttgart Mai 1983
Moored current meter data from JASIN 1978
by
Rolf H . KÄsE, Michaela KNüLL, Gerold SIEDLERand Walter ZENK
Institut für Meereskunde an der Universität Kiel
With 31 figures and 3 tables
Daten verankerter Strömungsmesser von JASIN 1978
Zusammenfassung
Nach einer kurzen Darstellung der mittleren hydrographischen Verhältnisse aus dem inneren Meßgebiet von JASIN (59° N, 12° 30' W) werden Daten aus Verankerungen K1, K2 und K3 in Form von Vektorzeitreihen, Zeitreihen der Komponenten als fortschreitende Vektordiagramme und in Häufigkeitsverteilungen dargestellt. K1 war eine Unterwasserverankerung mit 7 Aanderaa-Strömungsmessern in den oberen 1000 m. Bei K2 handelte es sich um eine doppelseitig verankerte formstabilisierte Oberflächenboje mit 6 VACM-Strömungsmessern und zusätzlichen Temperaturmeßgeräten im oberen Bereich der Sprungschicht. Zwei vertikal parallel angeordnete Thermistorketten im Tiefenbereich 2-82m bildeten das Herzstück der K3, welche ebenso wie K2 mit meteorologischen Sensoren ausgestattet war. Die V erankerungen haben während mehrerer Wochen im Sommer 1978 Beobachtungswerte aufgezeichnet.
Summary
After a short presentation of mean hydrographic conditions at the Fixed Intensive Array of JASIN(59° N, 12° 30' W) data from moarings K1, K2 and K3 are given as stick plots and component time series, progressive vector diagrammes, and frequency distributions. K1 was a subsurface moaring with 7 Aanderaa current meters in the upper 1000 m. K2 was equipped with a spar buoy carrying 6 VACMs and some additional temperature sensors in the upper thermocline. Two vertical and parallel thermistor chains in the depth range 2-82m were the main sensor arrays of K3, which , like K2, was also equipped with meteorological sensors. Data from these moarings were obtained during several weeks in the summer of 1978.
2 Meteor AlB, 24
1. Moorings
The international Joint Air-Sea Interaction Project JASIN 1978 included meteorological and oceanographic observations in the eastern North Atlantic west of Scotland . The main objectives of this programme and the field activities on research platforms from the Federal Republic of Germany were summarized by SIEDLER & ZENK (1980) .
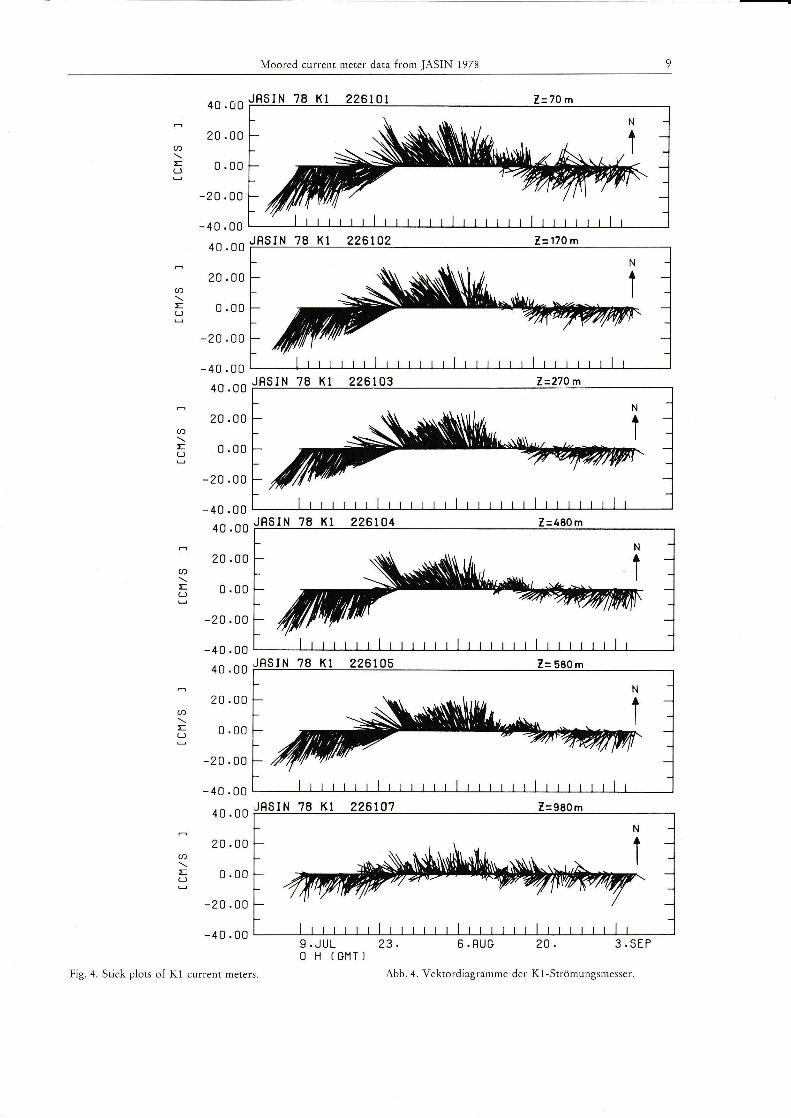
Three current meter moarings with self-recording instruments were deployed by the German participants in the Fixed Intensive Array (FIA). K1 was a singlepoint sub-surface moaring with 7 Aandera·a current meters and a small surface marker attached to the uppermost float. lt served studies of the vertical structure of the internal wave field in the water column below 100m. K2 included a spar buoy with 6 Vector Averaging Current Meters (V ACM) and 2 Aanderaa thermistor chains suspended below. The spar buoy was tethered to 2 surface moorings. It allowed observations of the current and temperature stratification in the upper 110 m needed for mixed layer structure and internal wave studies. K3 was a surface moaring with a Hshaped thermistor chain array with drogue attached, its purpose being the observation of temperature microstructure variability in the mixed layer. Both K2 and K3 carried an Aanderaa meteorological package on a surface buoy. Although the moarings were deployed for individual projects, the obtained data Supplement each other to some extent and will therefore be presented tagether in this paper. Analysis of the individual projects will be published separately at a later date.
Detailed figures of the 3 moarings were already · shown in SIEDLER & ZENK (1980) before, only simpli-
Address: R. H . KÄsE, M. KNüLL, G. SIEDLER & W. ZENK, Institut für Meereskunde an der Univ. Kiel, Düsternbrooker Weg 20, D-2300 Kiel, FRG.
0721-8761/83/0024-0005 $ 09.00 © by Gebrüder Bo rntraeger, Berlin, Stuttgart 1983

6 KÄSE, KNüLL, SIEDLER & ZENK
Table 1. Summary of ava ilable data from JASIN moarings K1, K2 and K3. Because of instrument displacements due to moaring motion caused by strong barotropic currents, data from the period before 10 August 1978 should be interpreted with caution .
JAS IN IFM DEPHT SENSOR REF. NO. REF. NO. TYPE llt
[m J [sec J
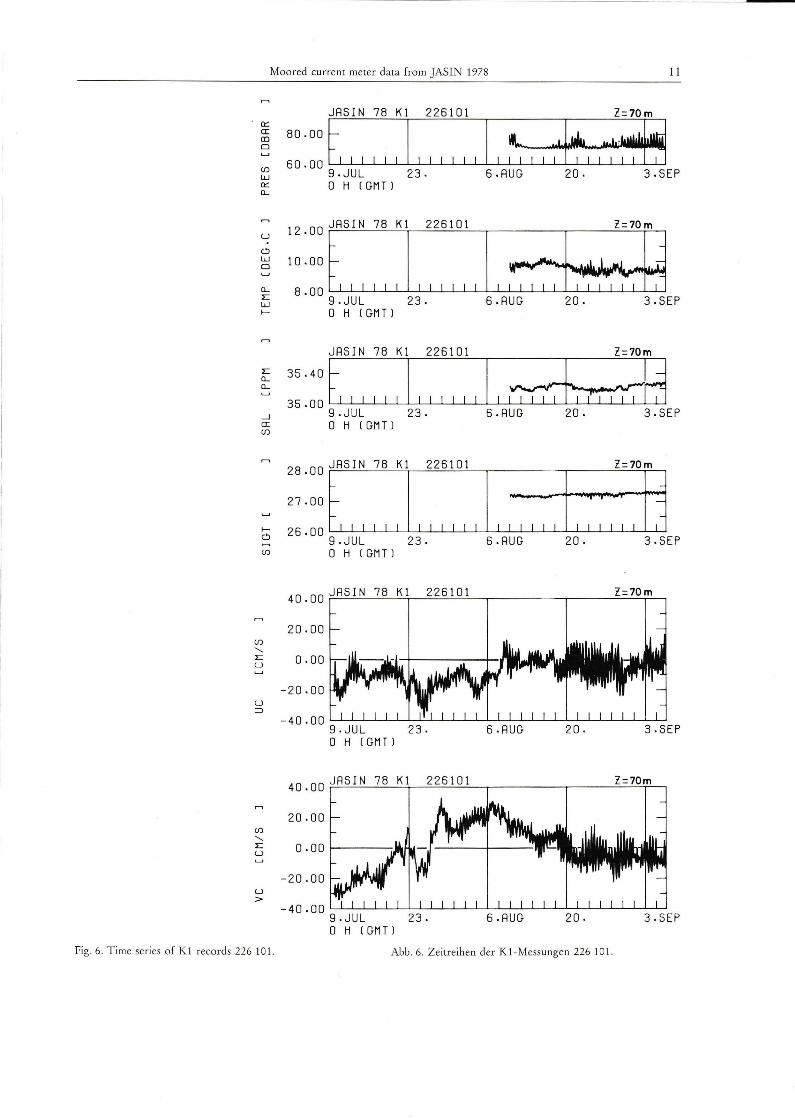
K I 226 101 70 V T c p 600
226 102 170 V T 600
226 103 270 V T c 600
226 104 480 V T c p 600
226 105 580 V T 600
226 106 780 T 600
226 107 980 V T 600 K2 ZZ7 201 20 V T 56.25
ZZ7 202 22.5 V T 56.25
ZZ7 203 60 V T 56 .25
ZZ7 204 41-61 11T 600
ZZ7 2G6 80 T 56.25
ZZ7 207 110 V T 56.25
ZZ7 208 110 1T 600
ZZ7 301 -4 1 p 300 - 8 V
ZZ7 302 1547- 1577 11T 600
K3 228 101 -2 V T p 300
ZZ8 102 30 T 300
228 202 30 T 56.25
228 301 30 V T 300
228 103 2-82 1ST 56.25
228 302 8-82 14T 56.25
I
Tabelle 1. Zusammenfassung aller verfügbarer Daten der JASIN-Verankerung K1, K2 und K3. W egen Geräteverlagerungen irrfolge von Verankerungseigenbewegungen, die durch starke barotrope Ströme hervorgerufen wurden, sollten die Daten aus dem Zeitraum vor dem 10. August 1978 mit Vorsicht ausgewertet werden .
COMMENT S 00.00 GMT I I 21 JUL 1978 10 AUG 30 AUG
T. C. P STARTING 10 AUG 78
T STARTING 10 AUG 78
T. C STARTING 10 AUG 78
T. C, P STARTING 10 AUG 78
T STARTING 10 AUG 78 1 S1ARTING 10 AUG 78
NO SPEED OATA
T STARTING 10 AUG 78
NO SPEED DAT A
T2-11 NO DATA
ROTOR LOST
ROTOR LO ST
A-CHAIN
8-CHAIN T 15 NO DATA rTTTTT1fTTTT Tl I I II I ITTTTTT1 I I rT TTTT rTTT rnT
202 JUL. DAYS zzz 242
fied schematics including the IfM reference numbers are therefore presented in Fig. 1. The avai lab le data and mooring positions are summarized in Tables 1 and 2, including some general comments on data quality.
Particular effort was made to calibrate the thermistor chains of mooring K3 before the experiment. Groups of 16 sensors were calibrated at 7 temperatures, with reference to a quartz thermometer. The data points were fitted by a spline procedure. The resolution obtained was ± 0.003 ° C. The data were recorded on Sea Data tape casettes and transferred to computer tape after automatic reading.
Data processing at the Institut für Meereskunde of Aanderaa and VACM instruments followed the Standard procedures like those described earlier by KÄSE et al. (1978).
2. D ata presentation
As an introduction to the mooring data in Figures 2-3 we present a selection of temperature, salinity and cr,-profiles, including their Standard deviations.
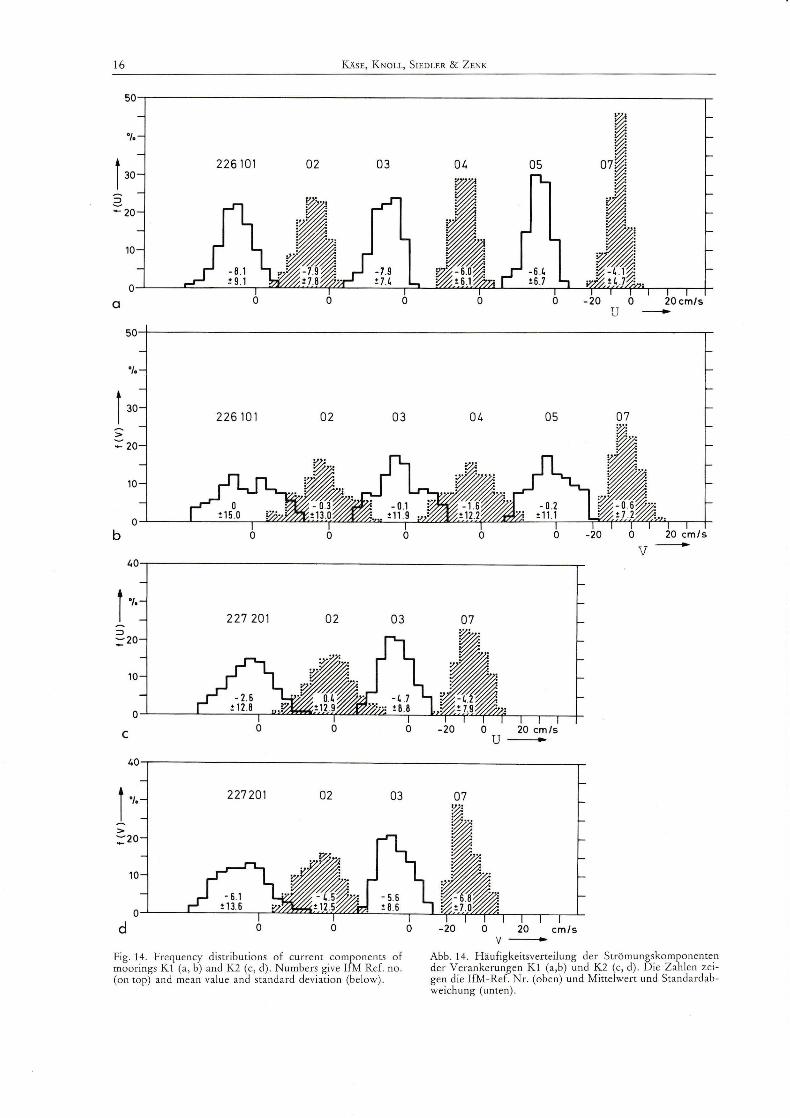
These CTD data originate from Multisonde and Bathysonde observations onboard R.V. "Meteor" and W.F.S. "Planet" . "Meteor" operated in the vicinity of our moorings wirhin the three JASIN phases : 8- 22 July (Phase 0), 23 July- 16 August (Phase 1) and 17 August - 16 September 1978 (Phase 2) . "Planet" was present during phase 2 only. For logistical details the reader may refer to SIEDLER & ZENK (1980) . Areport on all stratification data has been prepared by KNüLL (1983). Current meter data from moorings are structured into three groups : K1 figures 4-14b, K2 figures 14c- 24, 26, 30 and K3 figures 25, 27 - 29, 31. After the presentation of stick plot diagrammes, progressive vector diagrammes are shown. They are followed by grouped time series of current components and temperatures of the individual instruments and frequency distributions of selected temperature and current components.
Meteorological observations are summarized in Figures 30 and 31. A summary of the figure collection is given in Table 3.
I

Moared current meter data from JASIN 1978 7
Table 2. Moaringpositions Tabelle 2. Positionen der Verankerungen
JAS IN ref. no.
Kl K2 K3
IfM ref. no.
226 227 228
<p (N)
58° 59.7' 58° 59.0' 58° 59 .2'
A. (W)
12° 30.5' 12° 31.0' 12° 32.3'
Fig. 1. JASIN moarings Kl, K2 and K3. Pattern of instrument positio ns not to scale.
OEPTH m r 70 --ti-170 - -.t-270 - -Ii-• 480 - - Ii-• 580 --tt-
1 780 _J.
!
ITM REF. NO .
226101 226102 226 103 226104 226 105
226106
980 --ll- 226107
l NO OATA
I 8 77? / 15,60n7J~7777777.
OEPTH !FM RE F. HO ~~- 228101
2 -
HO OATA 30 -
228 102
-~ I •
!FM OEPTH REF. NO . mi 227 301 -':t_:-.... - ~~·---
~ 20 _. 227201
22 5 -1 227202
~~ =~ 80 ~-~: 110
111
1547
227 203 227 204 HO OATA 227 206 227 201 227 208
~ 227301 ~ @
7?'/77> J5ß2/777777 //7777/
_,_ -.-
• 228 301 228202
228302 •
Abb . 1. JASlN-Verankerungen K1, K2 und K3. Die Darstellung der Instrumentenanord nung ist nicht maßstabsgetreu.
81 - { 116103
f I @
', 1,57) l/7777777 77777 777777777777777777777 .
26.5 270 6t 275 I I I I I I I I I I I I
...... =
dbar
~ 400
~ 600
"METEOR"
a
35.0
TEMPERATURE-B °C 12
35.2 %. 35.4 SALINITV
PHASE 0
...... = = "" ""
dt 0.1 I I I I I I I TEMPERATURE 0 oc 0.5
0-+-+--'--'-"1.---l.__j
dbar ' ' '5Tr'OEV1ft
I
: I ~ 400
~ 'STp OEVr I
i /
600 l /STO OEVs
800--t-1---,-,---,-,rl 0 %. 0.05 SALINITV-
"METEOR" PHASE 0
Fig. 2. Mean stratification and Standard deviations (STD DEV) from Multisonde profiles taken from F.S. "Meteor" in Phase 0, 6 samples (a) and Phase I, 11 00 samples (b) .
26.5 27.0 dt 27.5 I I I I I I I I I I I I
...... = ~ c.n
~ dbar
+
35.0
"METEOR"
b
TEMPERATURE -B 'C 12
35 .2 '!.. 35.4 SALINITV
PHASE 7
...... = = c.n
t -+-.... ,....,.-..,..-,-,--,--ri
0
"METEOR"
0.05 '!.. 0.10 SALINITV
PHASE 7
Abb. 2. Mittle re Schichtung und Standardabweichungen (STD DEV) aus Profi len mit der Multisonde nach Messungen auf F. S. "Meteor" während der Phase 0, 6 Profile (a) und Phase 1, 11 00 Profile (b).

8 KÄSE, KNOLL, SIEDLER & ZENK
Acknowledgements
This work has been supported by the Deutsche Forschungsgemeinschaft, Bann. We would like to acknowledge the assistance of the crews of the research vessels "Meteor" and "Planet" and of the technical and data processing staff of the Marine Physics Group of the Institut für Meereskunde at Kiel University.
References KÄsE, R ., H. PETERS, G. SIEDLER & W. ZENK (1978): A com
pi lation of current, temperature and conductivity data from moarings F1 and F2 in the GATE C-area. -"Meteor" Forsch.-Ergebn. A, No. 20, 13 - 48 .
KNOLL, M. ( 1983): CTD and current profiler data from JASIN 1978. - "Meteor" Forsch.-Ergebn . AlB, No. 24, 25 - 40.
SIEDLER, G. & W. ZENK (1980): JAS IN 1978 Field activities on the research vessels "Meteor", "Planet", "Poseidon" and the research aircraft D-CMET. - "Meteor" Forsch.Ergebn. A, No. 21 , 25 - 48.
Received October 10, 1982
JASIN IfM mean freq . time
~ dbar ." ."
~
~ 100
26.5 2ZO Öt 2Z5 I I I I I I I I I I I I
TEMPERATURE-B °C 12
35.0 %. 35.4 SALINITV-
"PLANET " PHASE 2
..... = ~ dbar ..... = "-
~ 100
0 Öt 0.1 I I I I I I I I I TEMPERATURE-0 0.5 oc
0 0.05 %. SALINITV-
·pLANET" PHASE 2
Fig. 3. Mean stratification and Standard deviations (STD DEV) from 141 Bathysonde profiles taken from W.F.S. "Planet" in Phase 2.
Abb. 3. Mittlere Schichtung und Standardabweichungen (STD DEV) von 141 Profilen mit der Bathysonde nach Messungen auf W. F. S. "Planet" während der Phase 2.
progr. stick f ig . ref . no . ref.no . depth(m) distr. s e ries vector p1ot
Table 3. Summary of figures. Data presented are indicated by x or by the fo llowing identifiers:
4,5 226101 K1 4 , 5 02 4,5 03 4,5 04 4 , 5 05 4,5 07 6 01 7 02 8 03 9 04 10 05 11 06 12 07 13 226101 , K1
02 , 03, 04 , 05, 06 , 07
14a,b 226101, K1 02 , 03 , 04 , 05, 07
14c , d 22720 1, K2 02 , 03, 07
15,16 227201 K2 15,16 02 1 5 , 16 03 15 , 16 07
17 01 1 8 02 19 03 20 06 21 07 22 08 23 227302 K2
24 227204 K2 25 228103 K3 26 227301 K2
227201 , 04 , 08 227302
27 228301 K3 28 301 29 202 30 227301 K2 31 228101 K3
70 170 270 480 580 980
70 170 270 480 580 780 980
T
uv
uv 20 22 . 5 60
llO 20 22.5 60 80
llO llO
5,35 above bo ttarn
41,51 , 61 8,42 , 82
T
30 30 30
on buoy on buoy_
diagram X
X
X
X
X
X
PTSotUV TUV PTSotUV PTSotUV TUV T TUV
X
X
X
X
TUV TUV TUV T TUV T TT
TTT TTT
TUV T PTUV X
PTUV X
X
X
X
X
X
X
X
X
X
X
X
X
X
U, V = east, north current/ wind component~ f!:5Jm Aanderaa instruments, U, V from vector averaging current meters (VACM), T = temperature, P = pressure, S = salinity, cr, = density. Tabelle 3 . . Zusammenfassende Bildübersicht. Die dargestellten Daten sind durch x oder die folgenden Buchstaben gekennzeichnet: U, V, Ost-, Nord_;>t!:9mungs/Windkomponente, U, V wie zuvor von VACMStrommessern, P = Druck, T = Temperatur, S = Salzgehalt, cr, = Dichte.
Moared current meter data from JASIN 1978 9
40.00JASIN 78 K1 226101 Z=70m
20.00 (f)
' l:: o.oo u
-20 . 00
-40.00
40.00JASIN 78 K1 226102 l= 170m
20.00 (f)
' l:: o.oo u
-20 . 00
-40.00 40.00JASIN 78 K1 226103 l=270 m
20.00 (f)
' l:: o.oo u
-20.00
-40 . 00 40 . 00JASIN 78 K1 226104 Z=480m
20.00 (f)
' l:: o.oo u
-20.00
-40.00 40 .oo JAS IN 78 K1 226105 l= 580m
20.00 (f)
' l:: o.oo u
-20.00
-40.00
40.00JASIN 78 K1 226107 Z=980m
N
20.00
~,/ (f)
' l:: o.oo u
- 20.00
-40.00 9 . JUL 23. 6.RUG 20. 3 . SEP 0 H ( GMT l
Fig. 4. Stick plots of Kl current meters. Abb . 4. Vektordiagramme der K l-Strömungsmesser.

10 KÄSE, K NüLL, SI EDLER & ZENK
60 KM 69 CM /S Fig. 5. Progressive vector diagrammes of Kl current meters. T ick marks indicate beginning of each day.
10 JUL JR SIN 78 K1 226101
J AS IN 78 K1 22610 2
J RSIN 78 Kl 226 103
J RSIN 78 K1 22 6104
J RSI N 78 K1 22610 5
JRSIN 78 Kl 22610 7 N
I Abb. 5. Fonschreitende Vektordiagramme der K l -Strömungsmesser. Die Markierungen zeigen den Beginn der einzelnen Tage an.
Moared current meter data from JASIN 1978 11
a::: a: CD D
(f)
Ll.J a::: CL
u
0 Ll.J D
CL :r::: Ll.J f-
:r::: CL CL
_j
a: (f)
f--0
(f)
(f)
" :r::: u
u ::::J
(f)
" :r::: u
u >
Fig. 6. T ime series of K1 records 226 101.
JAS IN 78 K1 226101 Z=70m
80 .oo ~ 60. oo 1 1 I I I I I I I I I ~I ~~~~
9.JUL 23 . 6.AUG 20 . 3.SEP 0 H ( GMT l
::::: r!N 78 Kl
1
226101 Z=70m
I I~ I 8 . 00 _I I I I I I . I I 9.JUL 23. 6-AUG 20. 3-SEP 0 H ( GMT l
JA S IN 78 K1 226101 Z=?Om
35.40 ~ 35. oo 1 1 1 I I I I I I I,,~~
9.JUL 23. 6.AUG 20. 3.SE P 0 H ( GMT l
::::: [~ ~~ ~~I, ~ 2 6101 Z=?Om
9.JUL 23. 0 H ( GMTl
40.00 J AS IN 78 K1 226101 =10m
20.00
o.oo
-2 0 . 00
-40.00 g.JUL 23. 6-AUG 20 . 3.SEP 0 H ( GMT l
40 .OO JA S IN 78 K1
20.00
o.oo
- 20.00
-40 . 00 9.JUL 23. 6-AUG 20 . 3- SE P 0 H ( GMT l
Abb. 6. Zeitreihen der K1-Messungen 226 101.

u
Cl w 0
(L
L: w I-
({)
....... L: u
u :=J
({)
....... L: u
u >
1 O • O O J R S I N 7 8 K 1 2 2 6 1 0 2 l = 170 m
8.00
t,,,,,,l, 1 ,,,,I,,~ 9 . JUL 23. 6.AUG 20. 3.SEP 0 H ( GMT l
20 .oo J RSIN 78 K1 226102
o.oo
-20.00
-40 . 00 9 . J UL 23. 6.RUG 20. 3.S EP 0 H (GMTJ
40_00
JRSIN 78 K1 226102 Z=170m
20.00
0 . 0 0 1-----:-
-20.00
-40.00 9. JUL 23 . 6 . RUG 2 0 . 3-SEP 0 H ( GMT l
Fig. 7. Time series of K1 records 226 102.
Abb. 7. Zeitreihen der K1 -Messungen 226 102 .
Fig. 8. Time series of Kl records 226 103 .
Abb. 8. Zeitreihen der K 1-Messungen 226 103.
u
Cl w 0
(L
I: w I-
I: (L (L
_J
a: ({)
ICl
(J)
..
(J)
....... I: u
u :=J
(J)
....... L: u
u >
1 O O O J R S I N 7 8 K 1 2 2 6 1 0 3 l =270m
8:00t,,,,,,l,,,,,,l, ~ 9 .JUL 23. 6 .RUG 20. 3 .SEP 0 , H ( GMT J
JR SIN 78 K1 226103 Z=270m
::::: t I I I I I I I I I I I I I I :;a;;;.B 9.JUL 23. 6.RUG 20 . 3.SEP 0 H ( GMT l
28 OO JAS IN 78 K 1 226103 Z=270m
27:00 t I I I I I I I, I I I I I I, I I ,. I I I, I I I I I I d 9 . JUL 23. 6.RUG 20 . 3 . SEP 0 H (GM T J
2o.oo\.JI I V.&I'I 1\.J 1\ .L 226103
o.oo
-20.00
-40.00 g .JUL 23 . 6.RUG 20. 3 . SEP 0 H (GMTJ
40 .QO JRSIN 78 K1 226103 Z=270m
20.00
o.oo
- 20 . 00
-40 .oo I I I I I I I I I I I I I I I I I I I I I I I I I I I I I I I
9 .JUL 23. 6 . AUG 20 . 3 . SEP 0 H ( GMT J
N
9 "' S"
"' z 0 r-'
" Vl
'" 0 r-'
'" "' Ii? N
'" z ;>':

Moored current meter data from JASIN 1978
lk: a: CD 0
(f)
w lk: CL .--.
u
c..'J w 0
CL l:: w 1-
500 _00 JRSIN 78 K1 2 26104
480.oot' I I I I I I, I 9.JUL 23 . 0 H ( GMT J
10 OO JRSIN 78 K1 226104
8:00 t I I I I I I I, I 9. JUL 23. 0 H ( GMT J
JAS IN 78 K1 226104
I L'""'.,..l _,-"f'N":'
6.RUG
13
20. 3.SEP
Z=480m
l·t-"'1:"11 I J 20. 3 . SEP
Z=480m
l:: CL CL
35.40 ~ 3S. oo 1 1 1 I I I I I I l,~l I •; ·~·~ ; lj
...J a: (f)
1-c..'J
(f)
9.JUL 2 3. 0 H ( GMT J
28 OO JRSIN 78 K1 226104
27:00 t I I I I I I I, I 9. JUL 23. 0 H ( GMT J
20 . 00 JRSIN 78 K1 226104
~ 0 .oo l:: u
(f)
'-
-20.00
-40.00 9 .JUL 23 . 0 H (GMTJ
40_00
JRSIN 78 K1 226104
20.00
6-RUG
I I I 6-RUG
6.RUG
B o . oo~--------rj•l-------+---~·~~'
u >
- 20.00
-40.00 9 .JUL
0 H ( GMT J 23 . 6.RUG
20 .
I I 20.
20.
20.
3-SEP
3-SEP
Z=480m
3.SEP
Z=480m
3.SEP
Fig. 9. T ime series of K 1 records 226 104 . Abb. 9. Zeitreihen der K 1-Messungen 226 104.
3 Meteor AlB, 24

u
0 w Cl
0.... :I: w I-
(/) ...... :I: u
u ::J
UJ ...... :I: u
u >
1
:::: [~ 17
~ ~), ~2
16
~0
15
1 I I I :=I I t: I <~J] 9 .JUL 23. 6 .AUG 20. 3 .SEP 0 H ( GMT l
20 .OO JAS IN 78 K1 226105
o.oo
-20.00
-40.00 9.JUL 23. 6 .AUG 20. 3.SEP 0 H I GMT l
Z=580m
20.00
o.oo ·=-~
-20.00
-40.00 I I I I I I I I I I I I I I I I I I I I I I I I I I I I I I
9. JUL 23. t:i-AUG 20. 3-SEP 0 H ( GMT l
Fig. 10. T ime series of K1 records 226 105.
Abb. 10. Zeitreihen der K1-Messungen 226 105.
Fig. 12. T ime series of K 1 records 226 107.
Abb . 12. Zeitre ihen der K1-Messungen 226 107.
u
0 w Cl
0.... :I: w I-
Fig. 11. T ime series of K1 temperature record 226 1 06.
Abb. 11. Zeitreihen der K1-Temperaturmessung 226 106.
(/)
...... :I: u '-'
u ::J
(/)
...... :I: u
u >
u
0 w Cl
0.... :I: w I-
8 OO JASIN 78 Kl 226107 Z=980m
6:00f,,, I I I I, I I I I I I,~ 9.JUL 23. 6.AUG 20. 3-SEP 0 H ( GMT l
20.00 JAS IN Z= 980 m
o.oo
-20.00
-40.00 9.JUL 23. 6.AUG 20. 3-SEP 0 H ( GMT l
40 _00 JASIN 78 K1 226107 Z= 980m
20.00
o.oo
-20.00
-40.00 9.JUL 23. 6.RUG 20. 3-SEP 0 H ( GMT l
.j:>.
8 S" :;>:: z 0 r J" (/)
;;; 0 r
"' "' P:' N
"' z ~

40 226101 9 . 5~
~0 . 29
"lo
l 20 1-
10
0 9.0 10.0 oc
TEMPERATURE-
40 226104 8.47
~ (J.09
'/,
1 20 1-
10
0 8.2 8.4 8.6 °C 8.8 TEMPERATURE-
40 226107 7 01
! O.Ü
'/,
l 20 1-
10
0 6.6 7.0 °C 7.4
TEMPERATURE-
Moored current meter data from JASIN 1978
l 1-
....
l 1-
40 40 226102 8.95 226103 8.87
! 0.19 ! 0.17
"lo "lo
20 l 20 1-
10 10
0 0 8.6 9.0 9.4 °C 8.2 8.6 9.0 °C 9.4
TEMPERATURE- TEMPERATURE -
40 40 226105 8 06 226106 8.15
t O 0 7 !0.11
.,, .,,
20 l 20 1-
10 10
0 0 7.8 8.0 8.2 oc 7.8 8.0 8.2 8.4 °C
TEMPERATURE - TEMPERATURE-
Fig. 13. Frequency distributions of K l temperatu res . N umbers give IfM Ref. no. (upper left corner) and mean value and Standard deviation (upper right corner).
Abb. 13. H äufigkeitsverteilungen der Temperaturzeitreihen von Kl. Die Zahlen zeigen die IfM-Ref. N r. (oben links) und Mittelwert und Standardabweichung (oben rechts).
15
16 KÄSE, KNüLL, SIEDLER & ZENK
226101 02 03
0 b
f .,. 227 201 02 03
:::::> :;:-20
10
0
c 0 0
40
1 227 201 02 03
d 0 0
Fig. 14. Frequency distributions of current components of moarings Kl (a, b) and K2 (c, d). Numbers give IfM Ref. no. (on top) and mean valu e and Standard deviation (be low).
0
0
u -
04 05 07
V -07
-20 0 20 cm/s u -
07
-20 0 20 cm/s v -
Abb. 14. Häufigkeitsverteilung der Strömungskomponenten der Verankerungen Kl (a,b) und K2 (c, d). Die Zahlen zeigen die IfM-Ref. Nr. (oben) und Mittelwert und Standardabweichung (unten) .

Fig. 15. Stick plots of K2-current meters.
Abb. 15. Vektordiagramme der K2-Strömungsmesser.
(f)
'
40 . OO JAS IN 78 K2 227201 :Z:20m
20.00
o.oo
-20.00
-40 - 00L---J-~--~-L--L-~~--~-L--L--L~--~--~
40 . 00 JAS IN 78 K2 227202 :Z=22.5 m
20.00
B o .oo
-20.00
-40-00L---~~--~-L--~_L~ __ J__L __ L_-L~--J---~
l= 110m 20 . OO JAS IN 78 K2 227207
~1/~~t -20.00
o.oo
25.RUG 1978 0 H (GMTJ
30.
JASIN 78 K2 227202
JASIN 78 K2 227201
15 KM
Fig. 16. Progressive vector diagrammes of K2 current meters. T ick marks ind icate beginning of each day.
JRSIN 78 K2 227207
N
JRSIN 78 K2 227203 i 34 CM /S
Abb. 16. Fortschreitende Vektordiagramme der K2 -Strömungsmesser. Die Markierungen zeigen den Beginn de r einzelnen Tage an.

u
Cl w 0
CL :c w 1-
(J)
' :c u
u :::>
40 • OO JAS IN 78 K2 227201 Z=20m
20.00
0. 00 t-t-r-r-r-1
-20.00
-4o.oo~~~--~~~--~~~--~-L~~~
25 . AUG 1978 1 .SEP
(J)
' :c u
u >
0 H !GMTl
40 • OO JAS IN 78 K2 227201
20.00
o.oo
-20.00
-40
"00
25 . AUG 1978 0 H I GMT l
Fig. 17. Time series of K2 records 227 20 1.
Abb. 17. Zeitreihen der K2-Messungen 227 20 1.
1 .SEP
Z=20m
u
Cl w 0
CL :c w 1-
(J)
' :c u
u :::>
(J)
' :c u
u >
:::::~~ 10.00~
25.AUG 19 0 H !GMTl
40 • OO JAS IN 78 K2 22 7202
20.00
o.oo
-20.00
-40
"00
25 . AUG 1978 0 H I GMT l
40 • OO J AS IN 78 K2 22 7202
20.00
o.oo
-20.00
- 40.00 25.AUG 1978 0 H I GMT l
Z=22.5m
1 .SEP
Z=22.5m
1 .SEP
Fig. 18. Time series of K2 records 227 202.
Abb. 18. Zeitreihen der K2 -Messungen 227 202 .
...... 00
8 S"
~ z 0 r-'
" (/)
;;; 0 r-'
"' "' ~ N "' z "
-

u
c!l w 0
Q...
I: w f-
::::: L~-A~-'I-N----L7_8__,~_K_2_J_2_2..J.7_2_0.J...3_J._-L----L-.LZ_=6_JOLm----.l....J 8.00
25.AUG 1978 1 .SEP 0 H (GHTl
20 • OO J AS IN 78 K2 22 7203
~ 0 .oo I: u
-20.00
~ -40 . 00 2 S.AUG 1978
0 H ( GHT l
20.00 JASIN 78 K2
~ 0 .oo I: u
-20.00
~ -40.0025.AUG 1978 · 0 H ( GHT l
2 27203
Fig. 19. Time series of K2 records 227 203.
Abb. 19. Ze itreihen der K2-Messungen 227 203 .
Z=60m
Z=60m
u
c!l w 0
Q...
I: w f-
1 O OO JAS IN 78 K2 227206 Z= 80m
8:00 t 25.AUG 1978 1 .SEP 0 H ( GHT l
Fig. 20. Time series of K2 temperature record 227 206.
Abb. 20. Zeitre ihe der K2 -Temperaturmessung 227 206 .
u c!l w 0
Q...
I: w f-
(/) ...... I: u . ......
u =>
(/)
...... I: u
u >
10•00
JASIN 78 K2 227207 Z=110m
8 .oot~~ 25.AUG 1978 1 .SEP 0 H ( GHT l
20.00 JAS IN 78 K2 227207 Z=110m
o.oo
-20.00
2::::~~ -
20.0025.AUG 1978 1.SEP
0 H ( GMT l
Fig. 21. Time series of K2 records 227 207.
Abb . 21. Zeitreihen der K2-Messungen 227 207.
~ 0 0 ..., <1> 0... (") c: ::; <1> g a ~ <1> ..., 0... ".,
~ ::;'"' 0 a
'5:: (J) z -"' '.J 00
,__.
"'

20
u
D w Cl
a... :I: w 1-
u
D w Cl
a... :I: w 1-
u
D
,::::rlN ~8 ~, 22 7208
I 25.AUG 1978 29. 0 H ( GMT l
5 .oo JAS IN 78 K2 227302
4.50
4.00
22.RUG 1978 0 H ( GMT l
27.
13 . OO J ASIN 78 K2 227204
~ 11 . 00
a... :I: w 1-
u
D w Cl
a... :I: w 1-
12.00
10.00
8.00
JASIN 78 K3 A-CHAIN
22 .AUG 1978 26. 0 H !GMTl
KÄSE, KNüLL, SIEDLER & ZENK
Z=110m
I l 2.SEP 6.
Fig. 22. Legend see opposite p.
-- 5m ----35m
1 . SEP 6. Fig. 23. Legend see opposite p.
2.SEP 6. Fig. 24 . Legend see opposite p.
Sm
82 m
30. 3.SEP Fig. 25. Legend see opposite p.

,_
40-.----------------~ 227301 12.31
! 0.45
12 .0 14.0 °C TEMPERATURE-
40~---------------.
227204 (51m)
10 .23 ! 0.58
9.0 10.0 11.0 12.0 °C TEMPERATURE ~
TEMPERATURE ~
Moored current meter data from JASIN 1978 21
,_
40-.----------------~ 40-.---------------.
"!.
"!.
I 20 ,_
10
227201 12.38 ! 0.12
12.0 12 .4 °C 12.8
TEMPERATURE -
9.0 10.0 °C 11.0 TEMPERATURE ~
,_
"!.
10
227204 (41m)
11 .19 ! 0.68
0-T~-or-r-~.--r-r~
9.0 10.0 11.0 12.0 °C TEMPERATURE ~
40-.----------------,
'/,
10
227208 9.03 ! 0.11
8.8 9.0 9.2 °C
TEMPERATURE-
Fig. 26. Frequency distributions of selected K2 temperatures. Nul?b.ers give IfM Ref. no. (upper left corner) and mean va lue and Standard deviatton (upper right corner).
Abb . 26. Häufigkeitsverteilungen ausgewählter K2-Temperaturzeitreihen. Die Zahlen zeigen die IfM-Ref. N r. (oben links) und Mittelwert und Standardabweichung (oben rechts).
Fig. 22. T emperature time senes of K2 thermistor chain 227 208.
Abb. 22. Temperatur-Zeitreihe der K2-Thermistorkette 227 208.
Fig. 23. Selected temperature time series of the K2 near bottom thermistor chain 227 302. N umbers indicate clearence from bottom.
Fig. 24. Selected temperature time series of K2 thermistor chain 227 204 . Numbers ind icate sensor depths.
Fig. 25. Selected temperature time series of K3 thermistor chain 228 103. Numbers indicate sensor depths.
4 Meteor A/B, 24
Abb. 23. Ausgewählte Temperatur-Zeitreihen der K2-Thermistorkette 227 302, die in Bodennähe registriert hat. Die Zahlen beinhalten den Sensorabstand vom Boden.
Abb. 24. Ausgewählte Temperatur-Zeitreihen der K2 -Thermistorkette 227 204 . Die Zahlen beinhalten die Sensortiefen.
Abb. 25. Ausgewählte Temperatur-Zeitreihen der K3-Thermistorkette 228 I 03. Die Zahlen beinhalten die Sensortiefen.
(f)
'-
40 JASIN 78 K3 228301
20
B o
- 2 0
Z:30 m
-4 0 L---~-L--L-~~--L-~~--~-L~--~-L~--~-L----~
u
ö w Cl
0.... :E w I-
(f)
'-:E u '--'
u :::J
22. RUG 19 7 8 0 H (GMTJ
27.
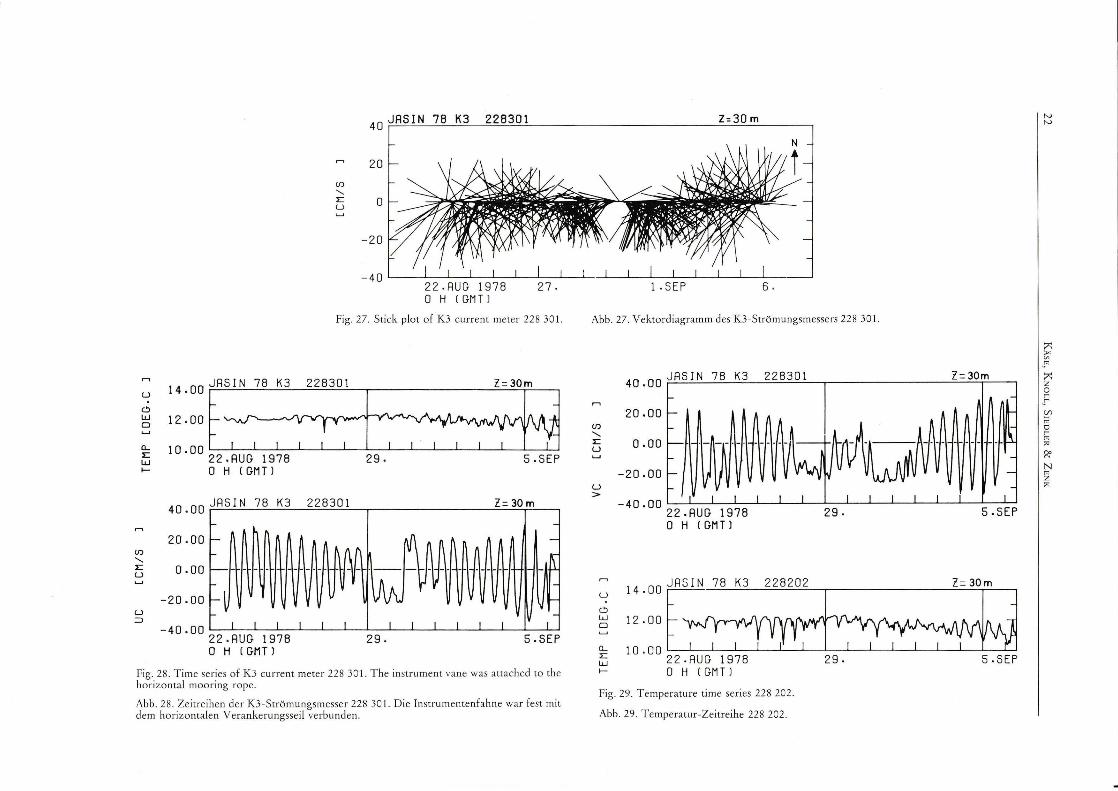
Fig. 27 . Stickplot of K3 current meter 228 30 1.
:::::r~ 22 . AUG 1978 29. 5 . SEP 0 H lGMT J
40 • OO J AS IN 78 K3 2 283 01
20 . 00
o.oo
-20.00
I I I - 4o.oo 22-RUG 1978
0 H ( GMT J
- -- -- -
I I I
Z= 30m
---
- ---
-I I I I I I I
29 . 5.SEP
Fig. 28. T ime series of K3 current meter 228 301. T he instrument vane was attached to the horizontal moaring rope.
Abb. 28. Zeitreihen der K3-Ström ungsmesser 228 301. Die Instrumentenfahne war fest mit dem horizontalen Verankerungsseil verbunden.
1 . SEP 6.
Abb . 27 . Vektordiagramm des K3-Strömungsmessers 228 301.
40•00
JRSIN 78 K3 22 8301 Z=30m
2
: ::: ~U-h~-~~-M-~-J~~-A~ .A~~~Mll ~~ (f)
'-:E u
u -20. oo 11 11 v 1n ~ v v u v n.~v~ · V WV' V ' I V ~ ~ ~ V I >
u
ö w Cl
a.... :E w I-
-40
"00
22.RUG 1978 29. 5. SEP 0 H ( GMT J
14.00
J AS IN 7 8 K3 22 82 02 Z=30m
: ::::~ 22 .RUG 197 8 29. 5 .S EP 0 H ( GMTJ
Fig. 29. Temperature time series 228 202.
Abb. 29. Temperatur-Zeitreihe 228 202.
N N
~ V>
"' I ~
0 r s-(/l
;;; 0 r
"' "' R' N
I ~

~ ~ .\l/( t ..i.J t 20 . OO fSIN 78 K2 22730 1 z- - Sm N ~
~ _,:::: I :: :-, ~ •: ·:: ,tr*~~'< 22 . RUG 197 8 27. 1- SEP
a 0 H (GMT l
b
c
JR SIN 78 K2 227301
~
1280 KM
1040.00 JRSIN 78 K2 227 301
a::: a:
1030 . 00
~ 1020.00
~ 1010.00 a::: Q._
1000 • 00 22 . RUG 1978
0 H (GMTl 29 .
' 3 SEP
29 M/S
Z = -Sm
N
I
16•00
JRSIN 78 K2 227301 Z= -4m .. u
Cl 14.00 w 0
12.00 Q._
:E w 10
• OO 22 . RUG 1978 f- 29. d 0 H (GMTl
_: : -::r~ (f)
....... :E
u - 40.00 ::::l 22 . RUG 1978 29.
0 H ( GMT l e
': :::F~ (f)
....... :E
-20.00 u 22. RUG 1978 29 · f > 0 H ( GMT l
Fig. 30 . Meteorological observations from K2 buoy: Stickplot (a), progressive vector diagramme (b), barometric pressure (c), air temperature (d), and wind speed components (e, f). Directions are given in oceanographic notatJon.
Abb. 30 . Meteorologische Beobachtungen von der K2-Boje : Vektordiagramm (a), fortschreiten des Vektordiagramm (b), Luftdruck (c), Lufttem peratur (d) sowie W indgeschwindigkeitskomponenten (e, f). Richtungen sind in ozeanographischer Bezeichnungsweise angegeben.
s;:: 0 0 ..., (1)
0-n c: ..., ...,
I ~ (1) ..., 0-~ ., ::::' 0 a
'--< > Vl z -"' '-J =
N \.;'
(fJ
' :E
20 . OO rSJN 78 K3 228101 z~ -2m N ~
00 ... '"K· ~ ..,~l~, ' -2::oo I :: :' ,-;•: •:: ~-=~"'~·I~ JRSIN 78 K3 228101
22 AUG 1978
22 .R UG 1978 27. 1 . SEP 6 . a 0 H ( GMT l
1040 • OO J AS IN 78 K3 2 28101 l= -2m
1030.00 a::: a: m 1020 . 00 :E '--'
(fJ 1010.00 w a::: a..
1000.00 22.AUG 1978 29. 5.SEP 0 H ( GMT l c
16 •00 J RSIN 78 K3 2 28 101 l= -2m ' '
u
c!l 14.00 w Cl
12.00 a.. :E w 10.00 I- 22.RUG 1978 29.
0 H !GMTl d 5.SEP
~ _::. :: r~...A_~.",LI_N---1"7_8---l".K_3 ...J_2_2...~.:_1_0..~..1_!,__-'-----1..-J",__...J...._..J.._Z.J...=_-_2~...m___.~.- _.~1 u 22 . RUG 1978 29. e 5.SEP ~ 0 H !GMTl
(fJ
' :E
u >
tiN J 960 KM b
_::: :: Ed:~...R_S...LI_N-L~-8-LK-3 -'--2-2...L8_1_0.J...1__JL-...L--~-L-!,__-'-----1..- _l.J...=_-...J2Lm......i._J 2 2 . RUG 1978 29. f 5 . SEP 0 H ! GMT l
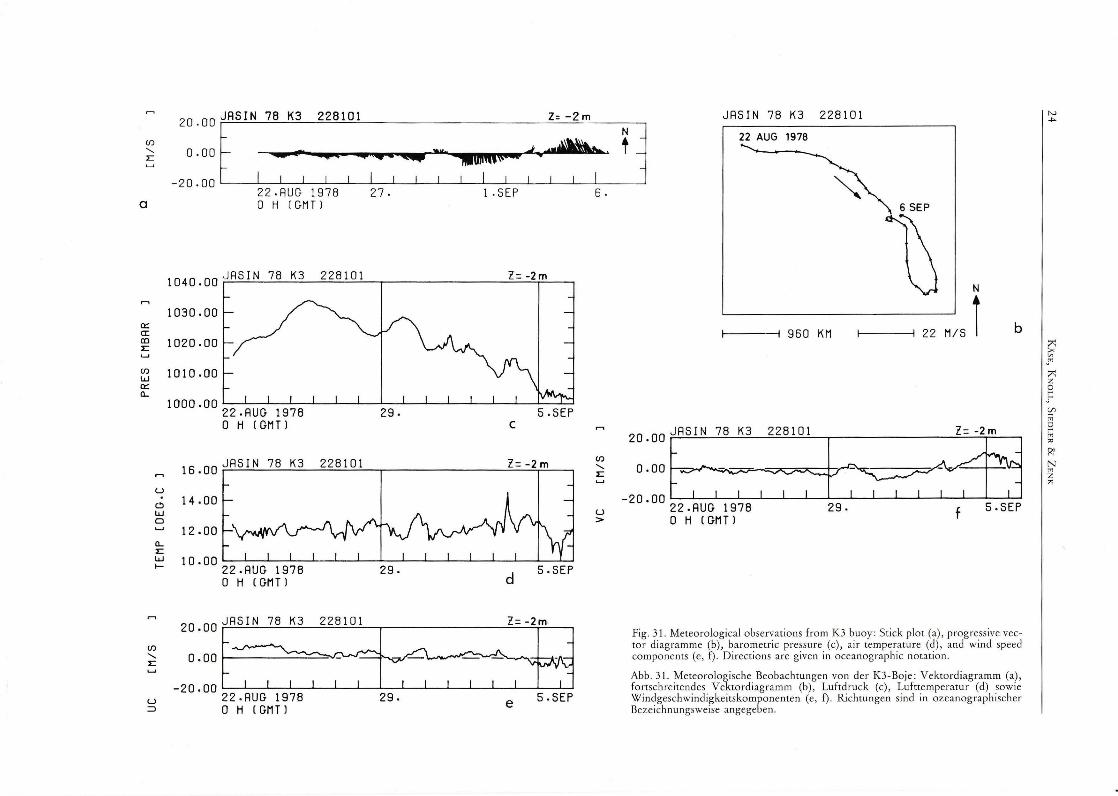
Fig. 31. Meteorological observations from K3 buoy: Stickplot (a), progressive vector diagramme (b), barometric pressure (c), air temperature (d), and wind speed components (e, f). Directions are given in oceanographic notation.
Abb. 31. Meteorologische Beobachtungen von der K3-Boje : Vektordiagramm (a), fortschreitendes Vektordiagramm (b), Luftdruck (c), Lufttemperatur (d) sowie Windgeschwindigkeitskomponenten (e, f). Richtungen sind in ozeanographischer Bezeichnungsweise angegeben.
N ..,.
~ S" ;;>:: z 0 r
" ~ '" 0 r
'" "' II? N
'" z ~