mooresville/lake norman area indicators of community need march 10, 2010 lncdc retreat prepared by:...
TRANSCRIPT

Mooresville/Lake Norman AreaIndicators of Community NeedMarch 10, 2010 LNCDC Retreat
Prepared by:
Janine Boudreau, Director of Community Impact & Evaluation, United Way of Central Carolinas

Education:Early Child Care & Education:

United Way of Central Carolinas 3
SITUATION OVERVIEWThere is a great need for quality early child care and education for children of working parents in our communities. More than 67,000 households in the Mecklenburg and Iredell Counties have children under the age of six and are either two-parent households with both parents working or are single-parent households with the parent working.
Source: American Fact Finder: American Community Survey; Table # B23008

United Way of Central Carolinas 4
TOTAL Number of Households with Children Under Age 6
IredellIredellIredellIredell
CabarrusCabarrusCabarrus Cabarrus
UnionUnionUnionUnion
Mec
klen
bu
rg
Mec
klen
bu
rg
Mec
klen
bu
rg
Mec
klen
bu
rg
0
20,000
40,000
60,000
80,000
100,000
120,000
140,000
Mecklenberg 76,093 75,777 80,712 85,341
Union 14,400 15,120 16,793 18,157
Cabarrus 13,046 12,791 14,800 14,017
Iredell 10,499 11,300 11,382 12,280
2005 2006 2007 2008
114,038
114,988123,687
129,795
Number of Households with Children Under Age 6 Where All Parent(s) in Household Work
IredellIredellIredell IredellCabarrus Cabarrus Cabarrus Cabarrus
Union UnionUnion Union
Mec
klen
bu
rg
Mec
klen
bu
rg
Mec
klen
bu
rg
Mec
klen
bu
rg
0
10,000
20,000
30,000
40,000
50,000
60,000
70,000
80,000
90,000
Mecklenberg 45,840 51,058 49,277 59,262
Union 8,750 8,170 10,033 11,410
Cabarrus 9,027 8,457 10,915 8,857
Iredell 5,316 6,500 7,945 7,886
2005 2006 2007 2008
68,93374,185
78,170
87,415
1 Year % Change
2007-08
3-Year% Change
2005-08
Cabarrus -18.9% -1.9%Iredell -0.7% 32.6%Mecklenberg 20.3% 22.6%Union 13.7% 23.3%Total 11.8% 21.1%
Trends - # Households with Children < 6 Years where All Parent(s) Work
Increase in Number of Households with Children < 6 Years: All Parents Work
Iredell: +2,570 households in 3 years
Mecklenberg: +13,422 households in 3 years
Source: American Fact Finder: American Community Survey; Table # B23008

United Way of Central Carolinas 5
2005 2006 2007 2008
1 Year% Change
2007-08
3 Year% Change
2005-08Cabarrus 69.2% 66.1% 73.8% 63.2% -10.6 -6.0Iredell 50.6% 57.5% 69.8% 64.2% -5.6 13.6Mecklenberg 60.2% 67.4% 61.1% 69.4% 8.4 9.2Union 60.8% 54.0% 59.7% 62.8% 3.1 2.1
Total 60.4% 64.5% 63.2% 67.3% 4.1 6.9
Percent of Households with Children Age 6 and Under Where All Parent(s) in the Household Work
Source: American Fact Finder: American Community Survey; Table # B23008
United Way of Central Carolinas 6
County FY 05-06 FY 06-07 FY 07-08 FY 08-091-Yr Change
Percentage Point3-Yr Change
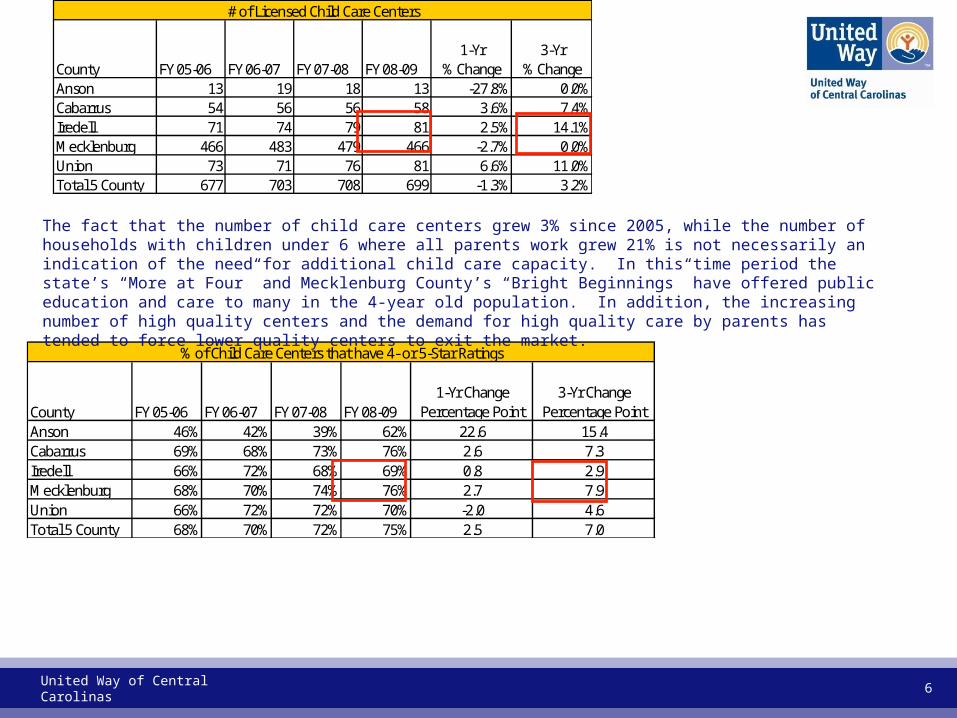
Percentage PointAnson 46% 42% 39% 62% 22.6 15.4Cabarrus 69% 68% 73% 76% 2.6 7.3Iredell 66% 72% 68% 69% 0.8 2.9Mecklenburg 68% 70% 74% 76% 2.7 7.9Union 66% 72% 72% 70% -2.0 4.6Total 5 County 68% 70% 72% 75% 2.5 7.0
% of Child Care Centers that have 4- or 5-Star Ratings
County FY 05-06 FY 06-07 FY 07-08 FY 08-091-Yr
% Change3-Yr
% ChangeAnson 13 19 18 13 -27.8% 0.0%Cabarrus 54 56 56 58 3.6% 7.4%Iredell 71 74 79 81 2.5% 14.1%Mecklenburg 466 483 479 466 -2.7% 0.0%Union 73 71 76 81 6.6% 11.0%Total 5 County 677 703 708 699 -1.3% 3.2%
# of Licensed Child Care Centers
The fact that the number of child care centers grew 3% since 2005, while the number of households with children under 6 where all parents work grew 21% is not necessarily an indication of the need for additional child care capacity. In this time period the state’s “More at Four” and Mecklenburg County’s “Bright Beginnings” have offered public education and care to many in the 4-year old population. In addition, the increasing number of high quality centers and the demand for high quality care by parents has tended to force lower quality centers to exit the market.

United Way of Central Carolinas 7
There has been a 17%, 3-year decrease in the number of licensed child care homes. While licensed child care homes traditionally account for only about 10% of children in day care, these homes tend to serve urban and poorer children, and are a critical element in addressing school readiness for economically disadvantaged children. The decrease in the number of licensed homes is again not necessarily an indication of diminished child care capacity. The difficulty of meeting licensing standards and the willingness to be evaluated may be issues for many child care homes that do not seek licensing.
An issue in some counties is the availability of training for providers of home child care. In some counties, Smart Start’s funding for training puts a priority on training at centers with their higher enrollment. United Way funds training for child care home providers in Mecklenburg and Union Counties.
County FY 05-06 FY 06-07 FY 07-08 FY 08-091-Yr Change
Percentage Point3-Yr Change
Percentage PointAnson 35% 41% 45% 50% 5.0 14.7Cabarrus 19% 14% 26% 27% 1.4 7.6Iredell 22% 25% 29% 25% -4.6 2.7Mecklenburg 33% 34% 43% 43% -0.1 9.7Union 44% 42% 44% 42% -2.0 -1.7Total 5 County 32% 33% 40% 40% -0.4 8.0
% of Family Child Care Homes with 4- or 5-Star Ratings
County FY 05-06 FY 06-07 FY 07-08 FY 08-091-Yr
% Change3-Yr
% ChangeAnson 51 44 40 38 -5.0% -25.5%Cabarrus 36 35 39 37 -5.1% 2.8%Iredell 55 55 48 53 10.4% -3.6%Mecklenburg 376 338 314 296 -5.7% -21.3%Union 34 36 36 33 -8.3% -2.9%Total 5 County 552 508 477 457 -4.2% -17.2%
# of Licensed Family Child Care Homes

EducationSchool Success Indicators:
Enrollment

United Way of Central Carolinas 9
Source: http://www.ncpublicschools.org/fbs/accounting/data/ -- 1st month of school year, revised
1-Yr Change 2 Yr ChangeSchool System 2006-2007 2007-2008 2008-2009 2007/08 - 2008/09 2006/07 - 2008/09ANSON COUNTY 4,165 4,037 3,960 -1.9% -4.9%CABARRUS COUNTY 25,473 27,026 27,639 2.3% 8.5%KANNAPOLIS CITY 4,823 4,949 5,115 3.4% 6.1%IREDELL-STATESVILLE 20,868 21,337 21,239 -0.5% 1.8%MOORESVILLE CITY 5,196 5,377 5,344 -0.6% 2.8%MECKLENBURG COUNTY 127,510 130,813 132,599 1.4% 4.0%UNION COUNTY 33,908 36,589 37,852 3.5% 11.6%
5-COUNTY REGION 211,924 219,802 223,289 1.6% 5.4%
Average Daily Membership

United Way of Central Carolinas 10
% of EnrollmentReceiving Free or Reduced Price Lunches
2008/09 School Year
73%
35%
73%
39%33%
49%
30%
44%
0%
20%
40%
60%
80%
100%
Anson CountySchools
Cabarrus CountySchools
Kannapolis CitySchools
Iredell-StatesvilleSchools
Mooresville City Charlotte-Mecklenburg
Schools
Union CountyPublic Schools
Total 5-CountyRegion
In the 5-County region, 44% of public school students receive free or reduced-price lunches. Anson County (73%), Kannapolis (73%) and Charlotte-Mecklenburg (49%) schools have rates that exceed the 5-county average.
NOTE: These figures may understate the percentages of economically disadvantaged students, as students in high school are more likely to refrain from applying for subsidized lunches due to concerns about embarrassment in front of their peers.
Source: Data provided by Scott Douglass, NC Department of Public Instruction.

EducationSchool Success Indicators:
Graduation Rates

United Way of Central Carolinas 12
Four-Year Cohort Graduation Rates - School System
60% Anson
63% Anson
75% Cabarrus
72% Cabarrus
68% Kannapolis70% Kannapolis
72% Iredell-Statsvl
81%Iredell-Statsvl
64% Mooresville
80% Mooresville
75% Mecklenburg
66% Mecklenburg
71% Union
81% Union
55%
60%
65%
70%
75%
80%
85%
ANSON 60.1% 64.7% 64.3% 63.4%
CABARRUS 71.6% 75.4% 72.9% 74.7%
KANNAPOLIS 68.4% 69.0% 69.3% 69.6%
IREDELL-STATSVL 71.6% 75.3% 80.7% 80.9%
MOORESVILLE 64.0% 76.5% 79.9% 79.6%
MECKLENBURG 74.6% 73.8% 66.6% 66.1%
UNION 71.3% 77.3% 77.2% 80.7%
2005-06 2006-07 2007-08 2008-09
Note: For Mecklenburg, audits were conducted after the 2006/07 year and subsequently, resulting in more accurate reporting. This increased scrutiny continues for the Charlotte Mecklenburg schools, currently even more detailed audits are underway
Source: http://www.ncpublicschools.org/fbs/accounting/data/ - Numbers of Graduates

United Way of Central Carolinas 13
Four-Year Cohort Graduation Rates - Economically Disadvantaged Students
65% Anson
39% Anson
66% Cabarrus
64% Cabarrus
68% Kannapolis
81% Kannapolis
70%Iredell-Statsvl
65% Iredell-Statsvl
70% Mooresville
55% Mooresville
52% Mecklenburg
59% Mecklenburg
72% Union
55% Union
35%
40%
45%
50%
55%
60%
65%
70%
75%
80%
85%
ANSON 38.9% 70.0% 59.8% 65.0%
CABARRUS 65.8% 66.7% 56.0% 63.8%
KANNAPOLIS 80.6% 70.3% 60.1% 67.7%
IREDELL-STATSVL 64.6% 69.6% 67.2% 69.9%
MOORESVILLE 54.5% 70.6% 67.3% 69.5%
MECKLENBURG 59.1% 64.5% 52.3% 52.0%
UNION 55.2% 68.3% 66.7% 71.5%
2005-06 2006-07 2007-08 2008-09
Note: For Mecklenburg, audits were conducted after the 2006/07 year and subsequently, resulting in more accurate reporting. This increased scrutiny continues for the Charlotte Mecklenburg schools, currently even more detailed audits are underway
Source: http://www.ncpublicschools.org/fbs/accounting/data/ - Numbers of Graduates

Education School Success Indicators:
Absentee RatesSuspension/Expulsion Rates
United Way of Central Carolinas 15
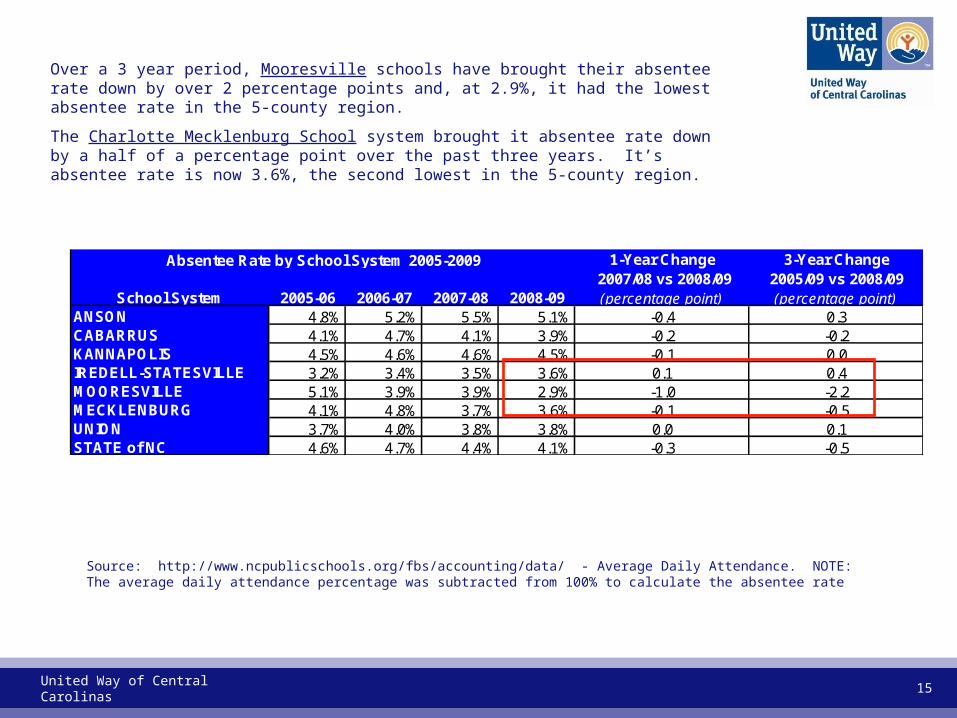
ANSON 4.8% 5.2% 5.5% 5.1% -0.4 0.3CABARRUS 4.1% 4.7% 4.1% 3.9% -0.2 -0.2KANNAPOLIS 4.5% 4.6% 4.6% 4.5% -0.1 0.0IREDELL-STATESVILLE 3.2% 3.4% 3.5% 3.6% 0.1 0.4MOORESVILLE 5.1% 3.9% 3.9% 2.9% -1.0 -2.2MECKLENBURG 4.1% 4.8% 3.7% 3.6% -0.1 -0.5UNION 3.7% 4.0% 3.8% 3.8% 0.0 0.1STATE of NC 4.6% 4.7% 4.4% 4.1% -0.3 -0.5
3-Year Change2005/09 vs 2008/09(percentage point)
Absentee Rate by School System 2005-2009 1-Year Change 2007/08 vs 2008/09(percentage point)School System 2005-06 2006-07 2007-08 2008-09
Source: http://www.ncpublicschools.org/fbs/accounting/data/ - Average Daily Attendance. NOTE: The average daily attendance percentage was subtracted from 100% to calculate the absentee rate
Over a 3 year period, Mooresville schools have brought their absentee rate down by over 2 percentage points and, at 2.9%, it had the lowest absentee rate in the 5-county region.
The Charlotte Mecklenburg School system brought it absentee rate down by a half of a percentage point over the past three years. It’s absentee rate is now 3.6%, the second lowest in the 5-county region.

EducationSchool Success Indicators:
Academic Progress in Reading & Math

United Way of Central Carolinas 17
% of All Students, Grades 3 through 8, Testing at or above Grade Level in Reading7
5%
89
%
82
%
89
%
91
%
83
% 89
%
85
%
76
%
88
%
83
% 89
%
89
%
84
% 90
%
86
%
38
%
61
%
47
%
63
%
65
%
56
%
66
%
56
%
50
%
73
%
62
%
74
%
76
%
68
%
78
%
67
%
0%
10%
20%
30%
40%
50%
60%
70%
80%
90%
100%
2005-06 74.7% 88.8% 81.7% 88.5% 90.6% 83.2% 89.1% 84.9%
2006-07 75.7% 88.1% 83.1% 89.1% 89.2% 83.9% 90.2% 85.5%
2007-08 38.2% 61.1% 47.0% 62.9% 64.9% 55.8% 66.4% 55.6%
2008-09 49.6% 72.7% 61.5% 73.9% 76.0% 67.7% 78.1% 67.4%
ANSON CABARRUS KANNAPOLIS IREDELL-
STATESVILLE MOORESVILLE MECKLENBURG UNION STATE
Source: http://ayp.ncpublicschools.org/
NOTE: During 2007/08 the reading test was re-standardized, resulting in reductions in pass rates statewide.
United Way of Central Carolinas 18
Source: http://ayp.ncpublicschools.org/
NOTE: During 2007/08 the reading test was re-standardized, resulting in reductions in pass rates statewide.
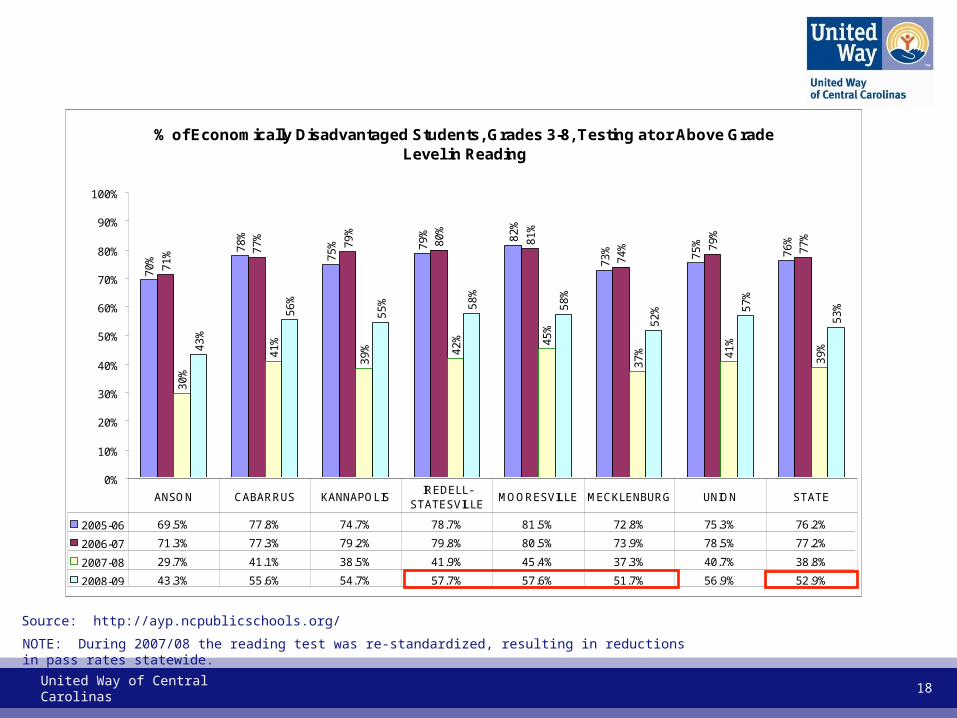
% of Economically Disadvantaged Students, Grades 3-8, Testing at or Above Grade Level in Reading
70
%
78
%
75
% 79
% 82
%
73
% 75
%
76
%
71
% 77
%
79
%
80
%
81
%
74
% 79
%
77
%
30
%
41
%
39
% 42
% 45
%
37
% 41
%
39
%43
%
56
%
55
% 58
%
58
%
52
% 57
%
53
%
0%
10%
20%
30%
40%
50%
60%
70%
80%
90%
100%
2005-06 69.5% 77.8% 74.7% 78.7% 81.5% 72.8% 75.3% 76.2%
2006-07 71.3% 77.3% 79.2% 79.8% 80.5% 73.9% 78.5% 77.2%
2007-08 29.7% 41.1% 38.5% 41.9% 45.4% 37.3% 40.7% 38.8%
2008-09 43.3% 55.6% 54.7% 57.7% 57.6% 51.7% 56.9% 52.9%
ANSON CABARRUS KANNAPOLIS IREDELL-
STATESVILLE MOORESVILLE MECKLENBURG UNION STATE

United Way of Central Carolinas 19
Source: http://ayp.ncpublicschools.org/
Percent of all Students, Grades 3-8, Testing at or Above Grade Level in Math4
7%
72
%
60
%
70
% 76
%
65
%
75
%
63
%
48
%
73
%
60
%
75
%
76
%
66
%
79
%
66
%
51
%
74
%
62
%
80
%
81
%
68
%
81
%
70
%
62
%
83
%
75
%
88
%
89
%
79
%
90
%
80
%
0%
10%
20%
30%
40%
50%
60%
70%
80%
90%
100%
2005-06 46.5% 71.7% 59.7% 70.4% 75.9% 64.8% 74.8% 63.4%
2006-07 47.6% 73.2% 59.7% 75.1% 76.1% 66.4% 79.4% 66.4%
2007-08 50.7% 74.1% 61.9% 79.7% 80.7% 68.4% 81.3% 69.9%
2008-09 61.9% 82.7% 74.8% 87.5% 88.6% 79.2% 89.9% 79.8%
ANSON CABARRUS KANNAPOLIS IREDELL-
STATESVILLE MOORESVILLE MECKLENBURG UNION STATE

United Way of Central Carolinas 20
Source: http://ayp.ncpublicschools.org/
% of Economically Disadvantaged Studends, Grades 3-8, Testing at or Above Grade Level in Math 3
7%
52
%
52
%
53
%
61
%
48
% 53
%
48
%
39
%
55
%
53
% 58
% 63
%
50
%
61
%
52
%
44
%
57
%
55
%
54
%
65
%
53
%
63
%
57
%
56
%
70
%
69
%
78
%
77
%
68
%
78
%
70
%
0%
10%
20%
30%
40%
50%
60%
70%
80%
90%
2005-06 37.4% 52.1% 51.5% 53.2% 61.1% 47.5% 53.4% 48.2%
2006-07 39.4% 55.1% 53.1% 58.4% 62.7% 49.6% 61.2% 52.1%
2007-08 43.7% 57.4% 55.1% 54.0% 65.1% 52.7% 62.7% 56.6%
2008-09 55.6% 69.7% 69.3% 78.4% 77.2% 68.1% 77.8% 70.0%
ANSON CABARRUS KANNAPOLIS IREDELL-
STATESVILLE MOORESVILLE MECKLENBURG UNION STATE

EducationProductive & Engaged Youth Indicators:
Households with School Age Children – All parents work

United Way of Central Carolinas 22
STIUATION OVERVIEWSchool-age children spend only 20% of their waking hours in school.[1] In the five counties served by United Way of Central Carolinas, 75% of school-age children live in households where all parents work. In North Carolina, only 10% of children in kindergarten through 12th grade (K-12) participate in after-school programs[2]. Twenty-two percent of North Carolina’s K-12 youth are responsible for taking care of themselves, and spend an average of more than seven hours per week unsupervised after school.2
[1] Calculation based on 180 school-days per year and an average of 8 hours of sleep per night.[2] American After 3PM, Household Survey on Afterschool, based on 2002-2003 school year, published by Afterschool Alliance

United Way of Central Carolinas 23
Total Households with Children Ages 6-17
124,605 125,896137,243 142,259
28,594 29,78032,165
33,597
28,88426,54526,28624,887
24,35524,16823,01222,969
0
50,000
100,000
150,000
200,000
250,000
2005 2006 2007 2008
Cabarrus Iredell Mecklenberg Union
201,055204,974
223,795 229,095
Number of Households with Children 6-17 Where All Parents in Household Work
17,568 17,631 20,784 22,467
18,78715,90815,272 14,951
103,69599,970
94,87489,241
19,942 18,98520,043
25,197
0
50,000
100,000
150,000
200,000
250,000
2005 2006 2007 2008
Cabarrus Iredell Mecklenberg Union
142,023
170,146159,478
146,441
County 2005 2006 2007 2008
Cabarrus 70.6% 67.1% 78.3% 77.8%Iredell 66.5% 65.0% 65.8% 77.1%Mecklenberg 71.6% 75.4% 72.8% 72.9%Union 69.7% 63.8% 62.3% 75.0%Total 70.6% 71.4% 71.3% 74.3%
Percent of Households with Children Ages 6-17 Where All Parent(s) in the Household Work
Source: Source: American Fact Finder: American Community Survey, Table B23008
Increase in Number of Households with Children 6-17 Years: All Parents Work
Iredell: +3,515 households in 3 years (+23%)
Mecklenberg: +14,454 households in 3 years (+16%)

EducationProductive & Engaged Youth Indicators
Overweight/Obese ChildrenPhysical Activity
Hours Spent Watching TV

United Way of Central Carolinas 25
Source: NC State Center for Health Statistics, CHAMP Survey Results, http://www.schs.state.nc.us/SCHS/champ/
NOTE: The determination for overweight/obese is made on Body Mass Index (BMI) using the 2000 CDC growth charts by AGE and SEX, as the standard for assessing BMI status.
In 2007, the age category breaks were different, so this year is not comparable to 2005, 2006 and 2008 data, and is not included in the chart.
•As measured by the BMI-for-Age (Body Mass Index), one-third of the youth in North Carolina are either overweight or obese.
•The highest proportion of overweight/obesity occurs in children age 10 through 11 years.
% of NC Children who are Overweight/Obese (ages 10-17)
32%30%
33%32%
26%
32%
28%31%
38%38%39%
29%
0%
5%
10%
15%
20%
25%
30%
35%
40%
45%
All Children 10-17 years 32% 30% 33%
10 through 11 years 39% 38% 38%
12 through 14 years 32% 26% 32%
15 through 17 years 28% 29% 31%
2005 2006 2008

United Way of Central Carolinas 26
% of NC Children who get less than 1 Hour of Physical Activity on a Typical Day (ages 2-17)
6%
36%
8%9%9%
22%
23%
13%
10%
12%
24%26% 24%
35%
42% 43%
0%
5%
10%
15%
20%
25%
30%
35%
40%
45%
50%
2 through 4 years 9% 9% 8% 6%
5 through 10 years 22% 23% 13% 10%
11 through 13 years 36% 26% 24% 12%
14 through 17 years 42% 43% 35% 24%
2005 2006 2007 2008
Source: NC State Center for Health Statistics, CHAMP Survey Results, http://www.schs.state.nc.us/SCHS/champ/
•According to their parents’ reports, as children in North Carolina grow older, they tend to get less physical activity.•Since 2005, parents report that all age groups of children are getting more exercise.•While it has improved dramatically since 2006, a quarter of North Carolina high school students get less than 1 hour of physical activity on a typical day.
United Way of Central Carolinas 27
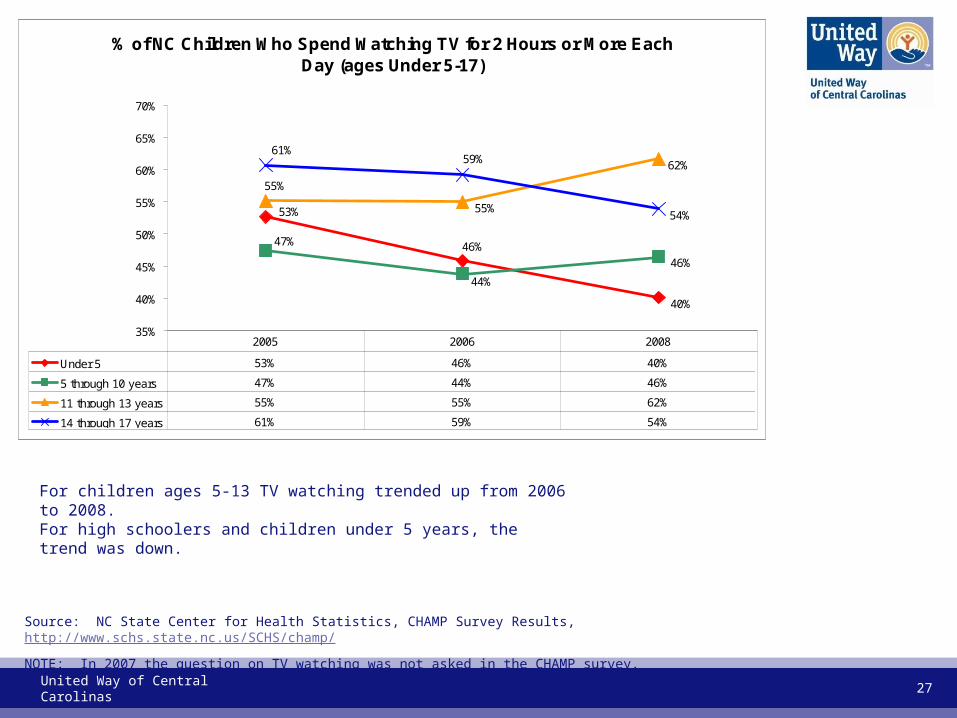
% of NC Children Who Spend Watching TV for 2 Hours or More Each Day (ages Under 5-17)
53%
46%
40%
46%
44%
47%
55%
55%
62%59%61%
54%
35%
40%
45%
50%
55%
60%
65%
70%
Under 5 53% 46% 40%
5 through 10 years 47% 44% 46%
11 through 13 years 55% 55% 62%
14 through 17 years 61% 59% 54%
2005 2006 2008
Source: NC State Center for Health Statistics, CHAMP Survey Results, http://www.schs.state.nc.us/SCHS/champ/
NOTE: In 2007 the question on TV watching was not asked in the CHAMP survey.
For children ages 5-13 TV watching trended up from 2006 to 2008.For high schoolers and children under 5 years, the trend was down.

Education Indicators: Youth Risk Behaviors

United Way of Central Carolinas 29
CMS NC CMS NCRode with a driver in a car or other vehicle who had been drinking alcohol in the past 30 days
25% 25% 22% 25%
Drove a car or other vehicle when they had been drinking alcohol in the past 30 days
8% 9% 7% 9%
Carried a weapon such as a gun, knife, club in the past 30 days 19% 22% 17% 21%Carried a weapon such as a gun, knife, club on school property in the past 30 days
5% 6% 4% 7%
Was in a physical fight in the past year 31% 30% 30% 30%Was in a physical fight on school property in the past year 10% 12% 9% 10%
2005 2007High School
Personal Safety
%
Among students who rode a bicycle, never or rarely wore a bicycle helmet 69%Never or rarely wore a seat belt as a passenger in the past 30 days 11%Rode with a driver in a car or other vehicle who had been drinking alcohol in the past 30 days
27%
Carried a weapon such as a gun, knife, club in the past 30 days 30%Was in a physical fight in the past year 62%Had property, such as their clothing, or books, stolen or deliberately damaged on school property one or more times in the past 12 months
32%
Charlotte-Mecklenburg Middle SchoolsPersonal Safety
2007

United Way of Central Carolinas 30
%
Smoked cigarettes on one or more days in the past 30 days 7%Ever had a drink of alcohol, other than a few sips 29%Ever used marijuana 11%Agree or strongly agree that illegal drugs are a problem at their school 33%
Charlotte-Mecklenburg Middle SchoolsSubstance Abuse
2007
CMS NC CMS NCSmoked cigarettes on one or more days in the past 30 days 20% 25% 15% 23%Had at least one drink of alcohol on one or more days in the past 30 days
39% 42% 34% 38%
Had five or more drinks of alcohol in a row, that is, within a couple of hours, on one or more days (binge drinking) in the past 30 days
20% 23% 16% 21%
Had at least one drink of alcohol on school property on one or more days in the past 30 days
4% 5% 6% 5%
Used marijuana one or more times in the past 30 days 23% 21% 20% 19%
2007High School
Substance Abuse2005

United Way of Central Carolinas 31
%
Have been harassed or bullied on school property one or more times during the past 12 months
26%
Have been the victim of teasing or name calling because of their weight, size, or physical appearance during the past 30 days
35%
Agree or strongly agree that harassment and bullying by other students is a problem at their school
53%
Charlotte-Mecklenburg Middle SchoolsBullying and Harassment
2007
CMS NC CMS NCHave been harassed or bullied on school property one or more times during the past 12 months
21% 26% 20% 22%
Have been the victim of teasing or name calling because of their weight, size, or physical appearance during the past 30 days
21% 21% 21% 20%
Have been the victim of teasing or name calling because of their race or ethnic background during the past 30 days
N/A N/A 14% N/A
Agree or strongly agree that harassment and bullying by other students is a problem at their school
28% 33% 40% 43%
High SchoolBullying and Harassment
2005 2007

United Way of Central Carolinas 32
%
Have ever been taught about abstaining from sexual activity 74%Parents or other adults in the students' family ever talked with the students about what they expect the students to do or not to do when it comes to sex
65%
Have ever been taught about chlamydia, gonorrhea, syphilis, human papillomavirus, or genital warts
47%
Had ever been taught in school about AIDS or HIV infection 79%
Charlotte-Mecklenburg Middle SchoolsSexual Behavior
2007
CMS NC CMS NCEver had sexual intercourse 51% 51% 47% 52%Had sexual intercourse for the first time before age 13 years 11% 8% 9% 8%Had sexual intercourse with one or more people in the past 30 days
37% 37% 33% 38%
Had sexual intercourse with four or more people during their lifetime
20% 17% 16% 16%
Among those who had sexual intercourse, used a condom during last sexual intercourse
69% 63% 67% 62%
High SchoolSexual Behavior
2005 2007

United Way of Central Carolinas 33
Teen Pregnancy Rates per 1,000 Population (ages 15-19)
40.0
50.0
60.0
70.0
80.0
90.0
100.0
Anson 84.4 78.8 95.2 63.9
Cabarrus 54.8 61.7 63.0 60.0
Iredell 59.4 56.4 57.6 56.2
Mecklenburg 57.5 67.2 62.4 60.1
Union 56.8 53.6 50.8 47.1
North Carolina 61.7 63.1 63.0 58.6
2005 2006 2007 2008
Source: NC State Center for Health Statistics, Reported Pregnancies: http://www.schs.state.nc.us/SCHS/data/pregnancies/2008/
Counties where Teen Pregnancy Rates have Dropped 2005 to 2008• Anson: 20.5 births per 1,000 population• Iredell: 3.2 births per 1,000 population• Union: 9.7 births per 1,000 population
Counties where Teen Pregnancy Rates have Increased 2005 to 2008• Cabarrus: 5.2 births per 1,000 population• Mecklenburg: 2.6 births per 1,000 population
From 2007 to 2008 Teen Pregnancy rates fell in all 5 counties and in the State of NC as a whole.

Income Indicators: # of Households with Income Below Poverty Level
# Households Receiving Food Stamps

United Way of Central Carolinas 35
Source: Jordan Institute for Families, UNC CH School of Social Work, http://ssw.unc.edu/ma/index.html
Dec-05 Dec-06 Dec-07 Dec-08 Dec-091 -yr
% Change3-Year
% ChangeIredell 9,391 10,020 10,420 12,370 15,078 21.9% 50.5%
Dec-05 Dec-06 Dec-07 Dec-08 Dec-091 -yr
% Change3-Year
% ChangeMecklenburg 76,364 78,220 84,067 96,746 122,578 26.7% 56.7%
Iredell County: Number of Individuals Receiving Food Stamps
Mecklenburg County: Number of Individuals Receiving Food Stamps
United Way of Central Carolinas 36
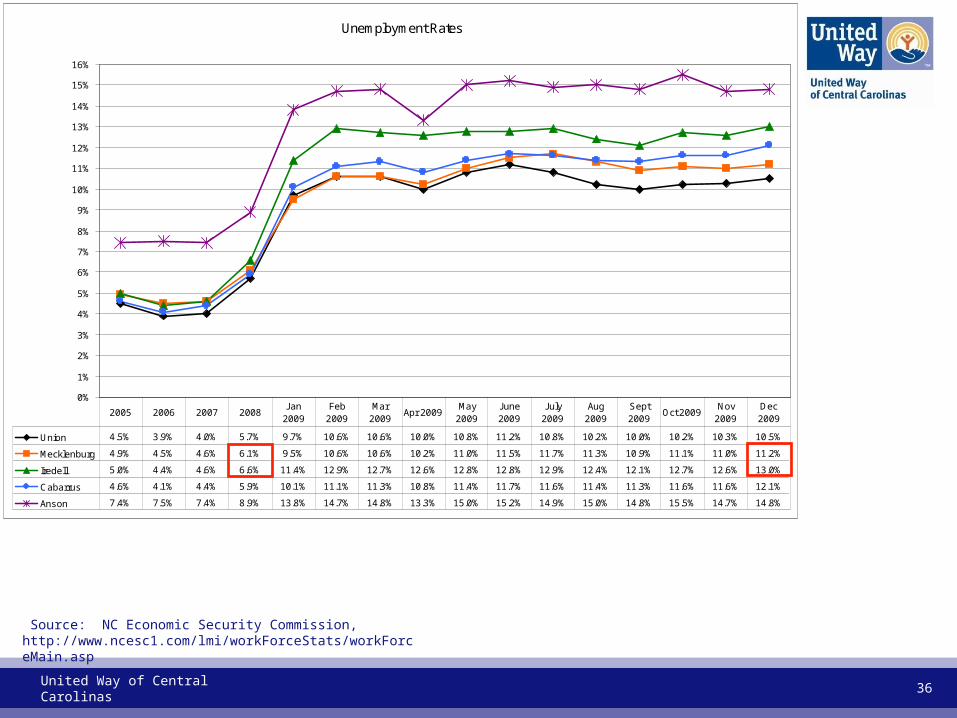
Source: NC Economic Security Commission, http://www.ncesc1.com/lmi/workForceStats/workForceMain.asp
Unemployment Rates
0%
1%
2%
3%
4%
5%
6%
7%
8%
9%
10%
11%
12%
13%
14%
15%
16%
Union 4.5% 3.9% 4.0% 5.7% 9.7% 10.6% 10.6% 10.0% 10.8% 11.2% 10.8% 10.2% 10.0% 10.2% 10.3% 10.5%
Mecklenburg 4.9% 4.5% 4.6% 6.1% 9.5% 10.6% 10.6% 10.2% 11.0% 11.5% 11.7% 11.3% 10.9% 11.1% 11.0% 11.2%
Iredell 5.0% 4.4% 4.6% 6.6% 11.4% 12.9% 12.7% 12.6% 12.8% 12.8% 12.9% 12.4% 12.1% 12.7% 12.6% 13.0%
Cabarrus 4.6% 4.1% 4.4% 5.9% 10.1% 11.1% 11.3% 10.8% 11.4% 11.7% 11.6% 11.4% 11.3% 11.6% 11.6% 12.1%
Anson 7.4% 7.5% 7.4% 8.9% 13.8% 14.7% 14.8% 13.3% 15.0% 15.2% 14.9% 15.0% 14.8% 15.5% 14.7% 14.8%
2005 2006 2007 2008Jan
2009Feb
2009Mar
2009Apr 2009
May 2009
June 2009
July 2009
Aug 2009
Sept 2009
Oct 2009Nov
2009Dec 2009

United Way of Central Carolinas 37
From December 31st 2008 through August 2009, the number of unemployed in the 5-county region increased by 35,377 – a 79% increase.
Source: NC Economic Security Commission, http://www.ncesc1.com/lmi/workForceStats/workForceMain.asp
Number Unemployed
Anson Anson Anson Anson AnsonUnionUnionUnionUnionUnion
Union Union Union
CabarrusCabarrus
CabarrusCabarrusCabarrusCabarrus
Cabarrus Cabarrus
IredellIredellIredell
IredellIredellIredellIredell
Iredell
MecklenburgMecklenburg
Mecklenburg Mecklenburg Mecklenburg
Mecklenburg
Mecklenburg Mecklenburg
0
10,000
20,000
30,000
40,000
50,000
60,000
70,000
80,000
90,000
Mecklenburg 21,212 19,901 20,758 28,573 50,259 51,508 50,708 51,160
Union 3,682 3,514 3,633 5,302 9,213 9,442 9,507 9,585
Iredell 3,652 3,359 3,674 5,153 9,780 10,158 10,044 10,308
Cabarrus 3,567 3,328 3,665 4,945 9,480 9,815 9,741 10,067
Anson 786 804 758 941 1,559 1,650 1,550 1,534
2005 2006 2007 2008 2009 -Sept 2009 -Oct 2009 -Nov 2009 -Dec
Anson Anson Anson
32,89930,906
32,488
44,914
80,291 82,573 81,55082,654

United Way of Central Carolinas 38
Source: U.S. Bankruptcy Court, Western District of NC, http://www.ncwb.uscourts.gov/courtInfo/stats/main.html
For the 12 months of 2009 there was a 30% increase in the number of personal bankruptcy filings in the 5-county region, as compared to the same period in 2008.
Personal Bankruptcy Filings (Chapter 7 + Chapter 13)
22 Anson35 Anson
112 Cabarrus
151 Cabarrus
606Union445
Union
644Iredell
494Iredell
2,220Mecklenburg
1,707Mecklenburg
0
500
1000
1500
2000
2500
3000
3500
4000
Jan-Dec 2008 Jan-Dec 2009
Mecklenburg
Iredell
Union
Cabarrus
Anson
2,780
3,656
Jan-Dec 2008 Jan-Dec 2009 % ChangeAnson 22 35 59%Cabarrus 112 151 35%Iredell 494 644 30%Mecklenburg 1,707 2,220 30%Union 445 606 36%TOTAL 5-COUNTIES 2,780 3,656 32%

United Way of Central Carolinas 39
The Need: Housing
Affordable housing is a problem in every community served by United Way of Central Carolinas. There are an estimated 542,713 households across the five counties served by United Way. Twenty-five percent (25%) of them, or 136,835 households, do not earn enough income to afford Fair Market Rent on a 2-bedroom apartment.
County
2009 Fair Market Rent
2-Bedbroom Apartment
Monthly Income Needed
to Afford Fair Market Rent
Number of Households Not
Earning Enough to Afford Fair Market
Rent
% of Households Not Earning
Enough to Afford Fair Market Rent
Anson County $577 $1,923 3,865 42%
Cabarrus County $757 $2,523 18,658 30%
Mecklenburg County $757 $2,523 85,417 24%
Iredell County $757 $2,523 15,722 27%
Union County $757 $2,523 13,173 21%
TOTAL - 5 Counties n/a n/a 136,835 25%
NOTE: This analysis was completed before the 2008 American Community Survey was released. It should be updated to reflect latest estimate on number of households and on income.

United Way of Central Carolinas 40
(DATA NOT VERIFIED) CIVIL VCAP SP CASES WITH A FORE-FORECLOSURE ISSUE TYPE BY DATE ISSUE ENTEREDFORECLOSURE CasesYear Issue Entered
County 1998 1999 2000 2001 2002 2003 2004 2005 2006 2007 2008 20091-yr change 2009-2010
3-year Change 2006 vs. 2009
North Carolina 16,661 18,385 20,841 25,991 35,661 44,339 42,905 42,876 45,465 49,684 53,958 63,312 17.3% 39.3%Iredell 235 249 284 405 557 853 887 830 895 930 978 1,186 21.3% 32.5%Mecklenburg 1,947 2,028 2,311 2,933 4,414 6,240 6,589 6,345 7,158 7,940 8,384 12,769 52.3% 78.4%
Source: NC Administrative Office of Courts
FORECLOSURES

Health Indicators
United Way of Central Carolinas 42
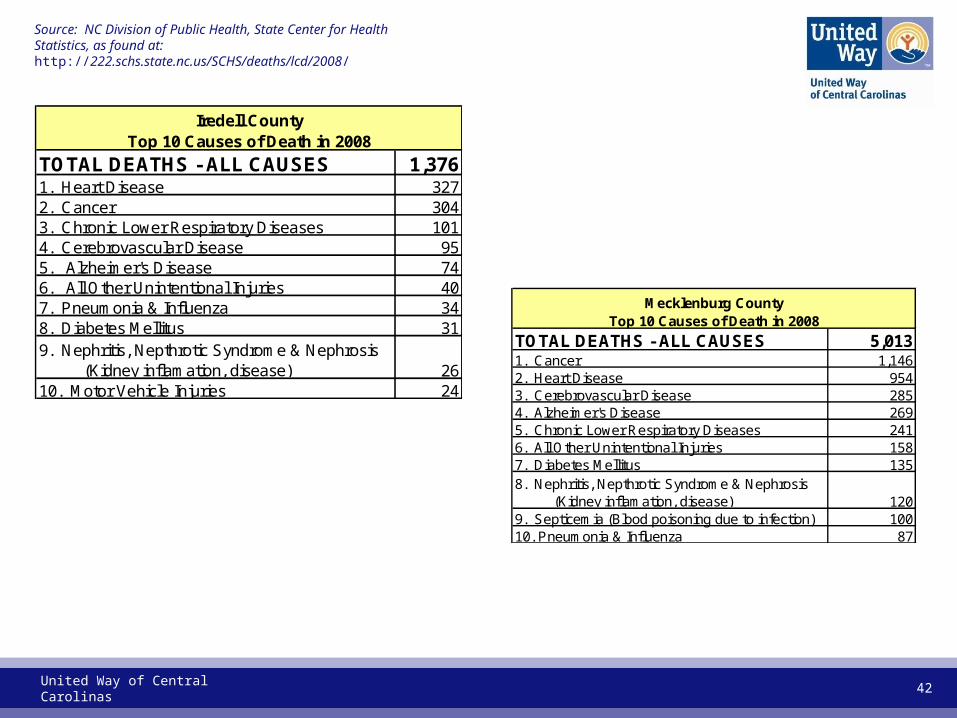
TOTAL DEATHS - ALL CAUSES 1,3761. Heart Disease 3272. Cancer 3043. Chronic Lower Respiratory Diseases 1014. Cerebrovascular Disease 955. Alzheimer's Disease 746. All Other Unintentional Injuries 407. Pneumonia & Influenza 348. Diabetes Mellitus 319. Nephritis, Nepthrotic Syndrome & Nephrosis (Kidney inflamation, disease) 2610. Motor Vehicle Injuries 24
Iredell CountyTop 10 Causes of Death in 2008
TOTAL DEATHS - ALL CAUSES 5,0131. Cancer 1,1462. Heart Disease 9543. Cerebrovascular Disease 2854. Alzheimer's Disease 2695. Chronic Lower Respiratory Diseases 2416. All Other Unintentional Injuries 1587. Diabetes Mellitus 1358. Nephritis, Nepthrotic Syndrome & Nephrosis (Kidney inflamation, disease) 1209. Septicemia (Blood poisoning due to infection) 10010. Pneumonia & Influenza 87
Mecklenburg CountyTop 10 Causes of Death in 2008
Source: NC Division of Public Health, State Center for Health Statistics, as found at: http://222.schs.state.nc.us/SCHS/deaths/lcd/2008/

United Way of Central Carolinas 43
Anson Cabarrus Iredell Mecklenburg UnionNorth
Carolina
TOTAL DEATHS - ALL CAUSES 996.4 884.0 899.5 777.9 811.8 861.4 Heart Disease 220.9 193.7 227.4 161.7 192.4 202.2 Cancer - All Sites 195.2 194.6 185.4 175.6 174.1 192.5 Cancer - Trachea, Bronchus & Lung 56.4 58.9 57.3 36.9 43.7 59.1 Cancer - Breast 30.5 24.4 27.7 24.9 17.3 25.0 Cancer - Prostate 32.4 29.5 25.0 10.1 8.3 27.3 Cancer - Colon, Rectum & Anus 17.2 16.0 16.5 16.0 17.7 17.3
Cerebrovascular Disease 86.9 48.9 57.7 48.7 49.5 54.4 Chronic Lower Respiratory Diseases 41.2 52.2 53.7 38.6 43.0 47.8 Alzheimer's Disease 17.5 36.1 49.0 45.2 58.3 28.7 All Other Unintentional Injuries 31.1 40.4 30.6 20.1 22.2 28.4 Diabetes Mellitus 39.0 18.3 25.5 19.3 20.6 25.2 Pneumonia & Influenza 23.2 27.7 26.4 15.5 16.3 20.3 Nephritis, Nepthrotic Syndrome & Nephrosis (Kidney inflamation, disease) 23.4 22.3 18.1 18.7 18.1 18.8 Motor Vehicle Injuries 31.0 16.6 19.6 11.0 18.7 18.6 Septicemia (Blood poisoning due to infection) 22.7 12.3 12.2 13.6 13.5 14.2 Suicide 10.9 10.9 11.9 8.5 9.8 11.9 Chronic Liver Disease & Cirrhosis 13.1 8.6 9.4 7.6 5.7 9.1 Homicide 13.7 5.3 5.2 9.7 5.6 7.2 HIV Disease 3.9 1.8 1.9 9.0 1.5 4.4# of Times This County had HIGHEST Death Rate In United Way's Service Area 10 3 2 1 2# of Times This County had LOWEST Death Rate in United Way's Service Area 1 2 3 9 6
AGE ADJUSTED DEATH RATES - 2004-2008(Resident Deaths per 100,000 Population)
(Deaths Expected if the Age Composition of State and Each County's Population is the Same)
Source: NC Division of Public Health, State Center for Health Statistics, as found at: http://222.schs.state.nc.us/SCHS/deaths/lcd/2008/

United Way of Central Carolinas 44
Healthy Iredell
2007 Community Needs Assessment
Top 10 Diseases & Conditions According to Statistics
1. Obesity/Overweight
2. Heart Disease
3. Lung Cancer
4. Diabetes
5. Asthma
6. Prostate Cancer
7. Dental Health
8. Mental Health Conditions
9. Cerebrovascular Disease/Stroke
10. Motor Vehicle Injuries
Healthy Iredell
2007 Community Needs Assessment
Top 10 Behavior/Life Circumstances - According to Statistics
1. Poverty
2. Lack of or inadequate health insurance
3. Unemployment/Low Wages
4. Drug Abuse – Lifestyle Drugs (alcohol & tobacco)
5. Lack of exercise/sedentary lifestyle
6. Poor eating habits
7. Drug Abuse: Street & Pharmaceutical Drugs
8. Lack of prenatal care
9. Lack of Medicaid accepting providers
10. Low Education/Drop Out

United Way of Central Carolinas 45
Healthy Mecklenburg
Priority Health Areas (as identified in Healthy Mecklenburg’s 2007 community priority setting meeting):
1. Preventing Chronic Disease(through improved nutrition, increased physical activity, and tobacco cessation) 2. Access to Healthcare 3. Mental Health 4. Environmental Health(Healthy places supporting healthy choices) 5. Substance Abuse Prevention 6. Injury Prevention 7. Responsible Sexual Behavior 8. Maternal and Child Health

United Way of Central Carolinas 46
AREA 2006 2007 2008
Change2006 vs. 2008
(Percentage Point)Cabarrus 63% 64% 56% -7.6Iredell 61% 64% 66% 5.6Mecklenburg 57% 60% 61% 3.4Union 58% 64% 61% 2.7STATE 63% 65% 66% 2.8
% of Residents, Age 18 or Older, with Body Mass Index (BMI) of 25 or greater(Overweight = BMI 25.0 to 29.9; Obese = BMI Greater than 30)
SOURCE: SOURCE: NC State Center for Health Statistics, Behavior Risk Factor Surveillance System (BRFSS) Survey. http://www.schs.state.nc.us/SCHS/brfss/
• According to the American Heart Association, obesity is recognized as a major risk factory for coronary heart disease, which can lead to heart attack.1
• Obesity raises blood cholesterol and triglyceride levels and lowers HDL “good” cholesterol, which is linked with lower heart disease and stroke risk. 1
• Obesity raises blood pressure levels. 1
• Obesity can induce diabetes and in some people, diabetes makes these other risk factors much worse. The danger of heart attack is especially high for these people. 1
• In North Carolina, two-thirds of adults age 18 or older are either overweight or obese.• In Iredell and Mecklenburg Counties, the percentage of adults who are overweight or obese has been increasing.
____________________________1American Heart Association, at: http://www.americanheart.org/presenter.jhtml?identifier=4639

United Way of Central Carolinas 47
2005 2006 2007 2008Anson 27.4% 26.1% N/A N/ACabarrus 24.7% 23.8% 30.3% 22.3%Iredell 23.3% 21.4% 29.4% 24.5%Mecklenburg 21.2% 16.5% 17.9% 19.4%Union 21.0% 20.2% 24.4% 21.8%North Carolina 25.6% 23.8% 24.3% 24.6%
Adults, 18 or Older, who did NOTParticipate in Any Exercises, Physical Activities, Other than Job, in Past Month
SOURCE: NC State Center for Health Statistics, Behavior Risk Factor Surveillance System (BRFSS) Survey. http://www.schs.state.nc.us/SCHS/brfss/

United Way of Central Carolinas 48
2008 - Number of 18-64 Year Olds, with and without Health Insurance
85,103 75,372
464,509
99,101
23,572 - 19%
113,326 - 20%
21,551 - 22%20,940 - 20%
0
100,000
200,000
300,000
400,000
500,000
600,000
No Insurance 20,940 21,551 113,326 23,572
With Insurance 85,103 75,372 464,509 99,101
Cabarrus Iredell Mecklenburg Union
SOURCE: U.S. Census Bureau. 2008 American Community Survey, Table B27001

United Way of Central Carolinas 49
SOURCE: NC State Center for Health Statistics, Behavior Risk Factor Surveillance System (BRFSS) Survey. http://www.schs.state.nc.us/SCHS/brfss/
NOTE: Due to sample sizes, detailed race data is not available by county.
2008% State of NC Residents, Age 18-64, Without Health Insurance: By Race
13%
24%
12%
32%
66%
0%
10%
20%
30%
40%
50%
60%
70%
White African American Asian Native American Other Minorities

United Way of Central Carolinas 50
2008% State of NC Residents, Age 18-64, Without Health Insurance: By Ethnicity
69%
33%
81%
16%
0%
10%
20%
30%
40%
50%
60%
70%
80%
90%
All Hispanic Hispanic - English Speaking Hispanic - Spanish Speaking Non-Hispanic
SOURCE: NC State Center for Health Statistics, Behavior Risk Factor Surveillance System (BRFSS) Survey. http://www.schs.state.nc.us/SCHS/brfss/
NOTE: Due to sample sizes, ethnicity data is not available by county.

United Way of Central Carolinas 51
2005 2006 2007 2008TOTAL 5.4% 6.1% 5.8% 6.6% White 4.8% 5.3% 4.4% 4.9% African American 6.5% 7.3% 7.9% 9.0% Hispanic 11.3% 9.9% 10.4% 11.2%
During the past year, was there any time your child was NOT covered by ANY health insurance?
(% Answering "Yes")
Source: NC State Center for Health Statistics, 2005 CHAMP Survey, http://www.schs.state.nc.us/SCHS/champ/
2008TOTAL 95% White 97% African American 96% Hispanic 84%
Does your child have any kind of health insurance?
(% Answering "Yes")
Source: NC State Center for Health Statistics, 2005 CHAMP Survey, http://www.schs.state.nc.us/SCHS/champ/
95% of the children in North Carolina have health insurance. The exception is Hispanic children. Undocumented Hispanic children are not eligible for Medicaid or state insurance programs for children.

United Way of Central Carolinas 52
The National Institute of Mental Health estimates that 26.2 percent of Americans age 18 and older – about one in four adults – suffer from a diagnosable mental disorder in a given year.[1]
[1] National Institute of Mental Health as reported on website: http://www.nimh.nih.gov/health/topics/statistics/index.shtml

United Way of Central Carolinas 53
Needs Assessment surveys, conducted by United Way of Central Carolinas and partner organizations, reveal that many families and individuals need, but are not receiving, counseling for problems they are experiencing. For instance, in the 2003 Mecklenburg County Needs Assessment, there were an estimated 22,200 households, (7% of all households in the county), in need of counseling for nerves or depression, but were unable to have the need met.
% of Households with Unmet Needs for Various Types of Counseling
Unmet Needs for Counseling in Areas:
AnsonCounty
Cabarrus County -
2008[1]
Mecklenburg County -
2003[2]
Mooresville-Lake Norman Area - 2002[3]
Union County -
2007[4]
Household Finances N/A 16% 7% 3% 9%
Nerves/Anxiety/Depression N/A 17% 8% 7% 10%
Stress of Raising a Family N/A 9% 6% N/A 5%
Serious Illness or Death N/A 5% 5% N/A 8%
Stress of Caring for an Older Person N/A 4% 4% N/A 4%
[1] 2008 Cabarrus Household Survey of Unmet Needs, sponsored by United Way of Central Carolinas, Healthy Cabarrus and Cabarrus Health Alliance.[2] 2003 Mecklenburg County Community Needs Survey, sponsored by United Way of Central Carolinas, City of Charlotte and Mecklenburg County[3] Between Exit 18 & Exit 42, The North Mecklenburg/South Iredell Assets and Needs Assessment Report, published by United Way of Central Carolinas, March 20, 2002[4] 2007 Union County Needs Assessment, prepared by the UNC Charlotte Urban Institute, Community Research and Services, September 2007

United Way of Central Carolinas 54
2005 2006 2007 2008Anson 10.7% 8.0% N/A N/ACabarrus 6.2% 7.9% 8.6% 5.8%Iredell 4.7% 6.7% 5.1% 6.2%Mecklenburg 6.7% 6.1% 9.1% 5.6%Union County 4.6% 7.3% 5.1% 8.4%North Carolina 7.4% 8.0% 7.9% 7.2%
How often do you get the social and emotional support you need?(% who answered "Rarely" or "Never")
Source: North Carolina State Center for Health Statistics, BRFSS Survey Results, http://www.schs.state.nc.us/SCHS/brfss/
United Way of Central Carolinas 55
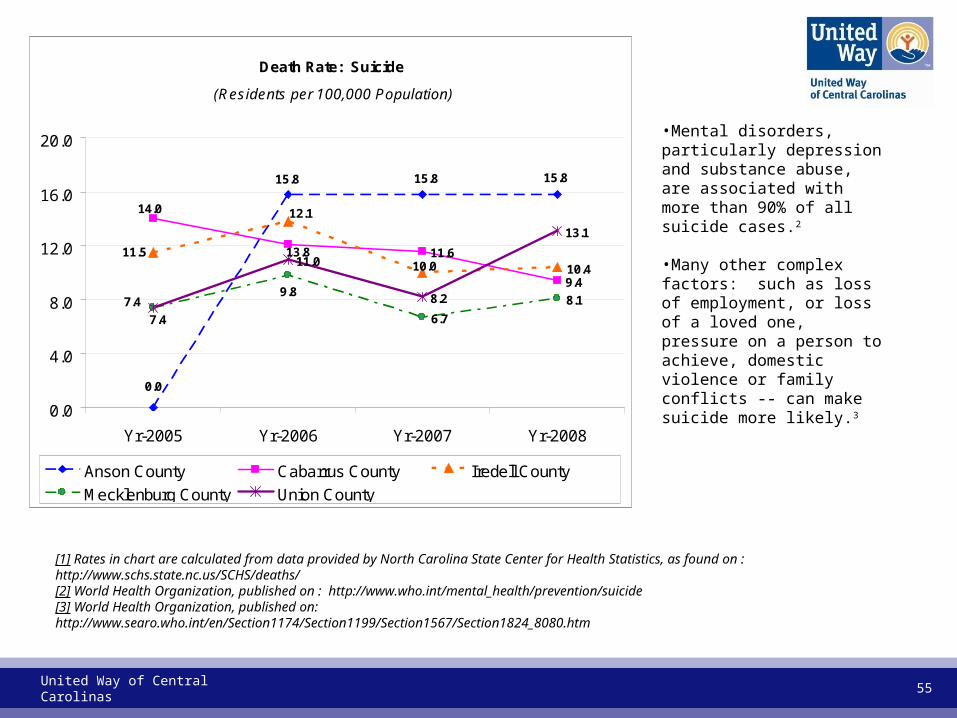
Death Rate: Suicide
(Residents per 100,000 Population)
11.6
9.410.4
6.7
8.1
11.0
8.2
13.1
15.815.8
0.0
15.8
14.0 12.1
10.011.5 13.8
7.49.8
7.4
0.0
4.0
8.0
12.0
16.0
20.0
Yr-2005 Yr-2006 Yr-2007 Yr-2008
Anson County Cabarrus County Iredell County
Mecklenburg County Union County
•Mental disorders, particularly depression and substance abuse, are associated with more than 90% of all suicide cases.2
•Many other complex factors: such as loss of employment, or loss of a loved one, pressure on a person to achieve, domestic violence or family conflicts -- can make suicide more likely.3
[1] Rates in chart are calculated from data provided by North Carolina State Center for Health Statistics, as found on : http://www.schs.state.nc.us/SCHS/deaths/[2] World Health Organization, published on : http://www.who.int/mental_health/prevention/suicide[3] World Health Organization, published on: http://www.searo.who.int/en/Section1174/Section1199/Section1567/Section1824_8080.htm

United Way of Central Carolinas 56
According to estimates from the NC Center for Health Statistics, 11% of the children in the state have a diagnosed emotional, behavioral or social skills problem. In addition, 2.9% of parents interviewed estimate that their child has an undiagnosed emotional, behavioral or social skills problem.
Of the children with a diagnosed problem, 63% have received services or support, which means that 37% of the children with a diagnosed emotional, behavioral or social skills problem did NOT receive services or support.
Of the children with a diagnosed problem, during the past year, 12% experienced a time when they needed help, but did not get it.
While Hispanic children have a low percentage of diagnosed emotional, behavioral or social skills problems, of those that are diagnosed there is a high proportion (1 out of every 5) who needed help in the past year, but did not get it.
% Answering YesTotal 11.0% Male 14.4% Female 7.6% White 11.5% African American 11.1% Hispanic 3.1%
% Answering YesTotal 62.7% Male 67.5% Female 53.1% White 61.1% African American 66.6% Hispanic 62.8%
% Answering YesTotal 11.9% Male 10.8% Female 14.1% White 12.8% African American 8.4% Hispanic 20.2%
% Answering YesTotal 2.9% Male 3.2% Female 2.6% White 2.6% African American 3.6% Hispanic 2.7%
Source: NC State Center for Health Statistics, 2005 CHAMP Survey, http://www.schs.state.nc.us/SCHS/champ/
Has a doctor, other health professional or school representative ever told you that your child has an emotional or behavioral disorder or problem with social skills such as depression, anxiety, ADHD, or ADD? (N=3,964)
(If "Yes" to first question: Has your child every received services or support for this emotional or behiaiorial problem? (N=453)
(If "Yes" to first question: During the past 12 months, was there any time when your child needed help for this problem, but did not get it? (N=454)
Do you think that your child has an emotional or behaviorial disorder or problem with social skills that has not been diagnosed? (N=3,471)

United Way of Central Carolinas 57
Infant Death Rates (All Races) (Per 1,000 Live Births)
0
2
4
6
8
10
12
14
16
18
North Carolina 8.8 8.1 8.5 8.2
ANSON 16.6 12.2 3.3 3.2
CABARRUS 4.6 6.8 4.6 3.3
IREDELL 6.5 8.5 5.5 4
MECKLENBURG 8.4 6.4 6.5 6.6
UNION 6.1 9.6 5.3 6.1
2005 2006 2007 2008
Source: NC State Center for Health Statistics, http://www.schs.state.nc.us/SCHS/data/vitalstats.cfm
All five counties served by United Way have lower infant mortality rates that the state of North Carolina as a whole. Anson County has marked improvement in infant mortality rages, declining from 16.6 to 3.2 deaths per 1,000 live births. Among the five counties, Mecklenburg and Union have the highest infant mortality rates.

United Way of Central Carolinas 58
Source: Infant Death Rate Chart: NC State Center for Health Statistics, http://www.schs.state.nc.us/SCHS/data/vitalstats.cfm
Source: Quote: “Racial Disparities in Birth Outcomes Increase with Maternal Age: Recent Data from North Carolina,” Statistical Brief No. 27, North Carolina Department of Health and Human Services, Division of Public Health, May 2005.
In 2008 infant mortality rates for Union County minorities was more than twice as high as for whites. A statistical brief published by the NC State Center for Health Statistics states:
“For infant mortality and low birth weight, African Americans have rates at least two times those for whites, and the gap has been increasing over time.”
AreaWhiteRate
MinorityRate
TotalRate
WhiteRate
MinorityRate
TotalRate
WhiteRate
MinorityRate
TotalRate
WhiteRate
MinorityRate
TotalRate
North Carolina 6.4 14.9 8.8 6 13.6 8.1 6.3 13.9 8.5 6 13.5 8.2ANSON 0 30.3 16.6 6.8 16.6 12.2 0 5.4 3.3 0 6.1 3.2CABARRUS 4 7.7 4.6 6.7 7 6.8 4.2 6.7 4.6 2.7 5.6 3.3IREDELL 5.4 11.6 6.5 4.9 24.9 8.5 6.7 0 5.5 4.3 2.8 4MECKLENBURG 5.6 13.5 8.4 4.1 10.5 6.4 4.7 9.5 6.5 4.4 10.1 6.6UNION 4.5 15.2 6.1 8.1 18.8 9.6 4.6 9.3 5.3 5.2 11.1 6.1
INFANT DEATH RATES(Per 1,000 Live Births)
2008200720062005
United Way of Central Carolinas 59
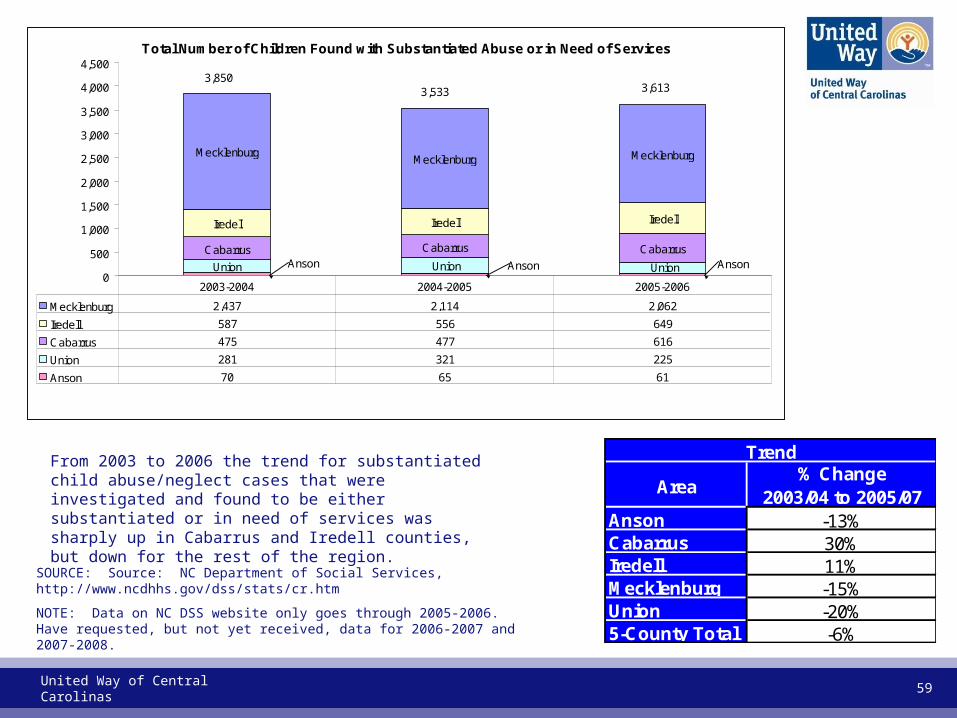
SOURCE: Source: NC Department of Social Services, http://www.ncdhhs.gov/dss/stats/cr.htm
NOTE: Data on NC DSS website only goes through 2005-2006. Have requested, but not yet received, data for 2006-2007 and 2007-2008.
Area% Change
2003/04 to 2005/07Anson -13%Cabarrus 30%Iredell 11%Mecklenburg -15%Union -20%5-County Total -6%
Trend
Total Number of Children Found with Substantiated Abuse or in Need of Services
AnsonAnsonAnson UnionUnionUnion
CabarrusCabarrusCabarrus
IredellIredellIredell
MecklenburgMecklenburgMecklenburg
0
500
1,000
1,500
2,000
2,500
3,000
3,500
4,000
4,500
Mecklenburg 2,437 2,114 2,062
Iredell 587 556 649
Cabarrus 475 477 616
Union 281 321 225
Anson 70 65 61
2003-2004 2004-2005 2005-2006
3,8503,6133,533
From 2003 to 2006 the trend for substantiated child abuse/neglect cases that were investigated and found to be either substantiated or in need of services was sharply up in Cabarrus and Iredell counties, but down for the rest of the region.

United Way of Central Carolinas 60
Rate of Children Found with Substantiated Abuse or in Need of Services (per 1,000 children in county)
0.0
5.0
10.0
15.0
20.0
25.0
Anson
Cabarrus
Iredell
Union
Anson 10.5 12.1 10.4
Cabarrus 11.3 14.1 11.5
Iredell 23.0 18.5 16.9
Union 9.7 8.6 5.4
2002-2003 2004-2005 2006-2007
SOURCE: Source: NC Department of Social Services, http://www.ncdhhs.gov/dss/stats/cr.htm
NOTE: Mecklenburg County data was missing from NC DSS website. This was reported to NC DSS on 11/4/09.
From 2004 through 2007, the rates of reported child abuse/neglect that were investigated and found to be substantiated or in need of services declined for the four counties above. The rate for Iredell was substantially higher than in the other counties. Union County had the lowest rate. (See note about unavailability of Mecklenburg County data on the state DSS website.)
United Way of Central Carolinas 61
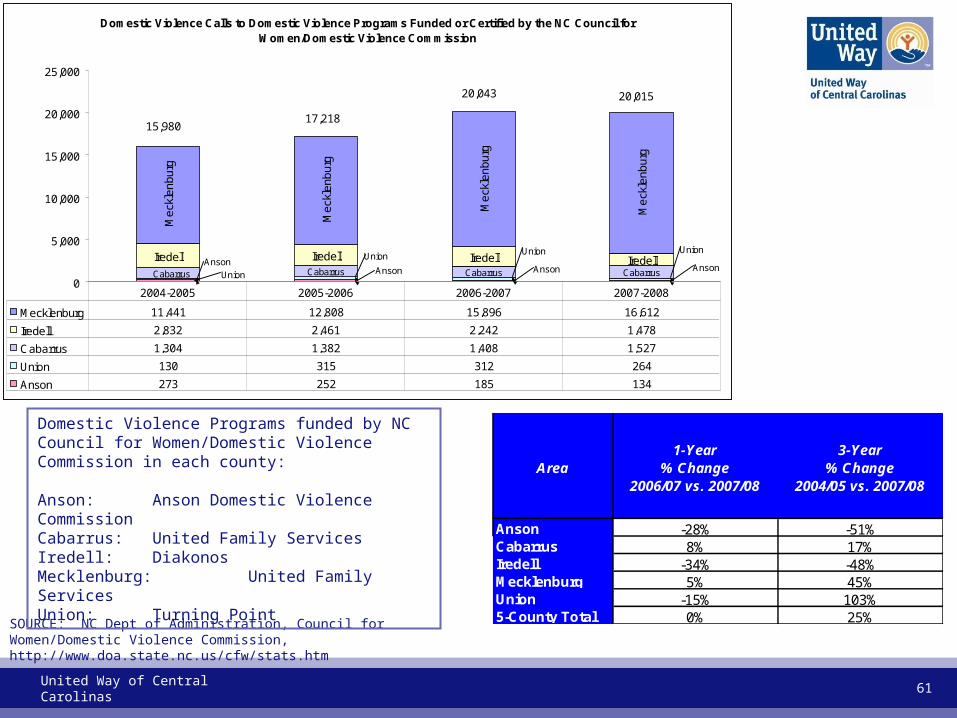
Domestic Violence Calls to Domestic Violence Programs Funded or Certified by the NC Council for Women/Domestic Violence Commission
AnsonAnsonAnsonAnson
UnionUnionUnion
Union CabarrusCabarrusCabarrusCabarrus
IredellIredellIredellIredell
Me
ckle
nb
urg
Me
ckle
nb
urg
Me
ckle
nb
urg
Me
ckle
nb
urg
0
5,000
10,000
15,000
20,000
25,000
Mecklenburg 11,441 12,808 15,896 16,612
Iredell 2,832 2,461 2,242 1,478
Cabarrus 1,304 1,382 1,408 1,527
Union 130 315 312 264
Anson 273 252 185 134
2004-2005 2005-2006 2006-2007 2007-2008
15,98017,218
20,043 20,015
SOURCE: NC Dept of Administration, Council for Women/Domestic Violence Commission, http://www.doa.state.nc.us/cfw/stats.htm
Area1-Year
% Change2006/07 vs. 2007/08
3-Year% Change
2004/05 vs. 2007/08
Anson -28% -51%Cabarrus 8% 17%Iredell -34% -48%Mecklenburg 5% 45%Union -15% 103%5-County Total 0% 25%
Domestic Violence Programs funded by NC Council for Women/Domestic Violence Commission in each county:
Anson: Anson Domestic Violence CommissionCabarrus: United Family ServicesIredell: DiakonosMecklenburg: United Family ServicesUnion: Turning Point

United Way of Central Carolinas 62
SOURCE: NC State Bureau of Investigation, http//sbi2.jus.state.nc.us/crp/public/Default.htm
Area3-Year % Change
2005 to 2008Anson 0.0%Cabarrus 29.0%Iredell 31.3%Mecklenburg -13.6%Union -31.6%5-County Area -8.6%
Number of Rape Crimes 5-County Area
Anson 12 Anson 9 Anson 9 Anson 12Union 26Union 28Union 16Union 38
Cabarrus 40Cabarrus 31Cabarrus 28
Cabarrus 40
Iredell 32Iredell 42
Iredell 34 Iredell 42
Mecklenburg 338
Mecklenburg 371 Mecklenburg
295
Mecklenburg 292
0
50
100
150
200
250
300
350
400
450
500
Mecklenburg 338 371 295 292
Iredell 32 42 34 42
Cabarrus 31 28 40 40
Union 38 16 28 26
Anson 12 9 9 12
2005 2006 2007 2008
451 466
406 412

United Way of Central Carolinas 63
SOURCE: NC Dept of Administration, Council for Women/Domestic Violence Commission, http://www.doa.state.nc.us/cfw/stats.htm
Area3-Year % Change
2005 to 2008Anson N/ACabarrus 23.2%Iredell -47.8%Mecklenburg -22.8%Union 39.5%5-County Area -36.2%
Sexual Assault Programs funded by NC Council for Women/Domestic Violence Commission in each county:
Anson: Anson Domestic Violence CommissionCabarrus: United Family ServicesIredell: DiakonosMecklenburg: United Family ServicesUnion: United Family Services
Number of Sexual Assault Calls to Programs FundedBy NC Council for Women/Domestic Violence Commission
Union, 328 Union, 290 Union, 265Anson, 52Cabarrus, 122Cabarrus, 157
Cabarrus, 103Cabarrus, 99Union, 190
Mecklenburg934
Mecklenburg914
Mecklenburg765
Mecklenburg721
Iredell1,478
Iredell2,832
Iredell2,461 Iredell
2,242
0
500
1,000
1,500
2,000
2,500
3,000
3,500
4,000
4,500
Iredell 2,832 2,461 2,242 1,478
Mecklenburg 934 914 765 721
Union 190 328 290 265
Cabarrus 99 103 157 122
Anson 0 0 52 0
FY 2004-05 FY 2005-06 FY 2006-07 FY 2007-08
4,055
3,806
3,506
2,586
NOTE: The decline in calls in Mecklenburg County may be a reflection of a new program opening at Carolinas HealthCare, whose statistics are not reported to the Women/Domestic Violence Commission.
Health IndicatorsPersons with Any Disabilities (2005-2007)
Persons with Self-Care Disability (2005-2007)Persons with Go-Outside Home Disability (2005-2007)
Persons with Independent Living Disability (2008)
Persons with Sensory Disability (2005-2007)Persons with Vision Disability (2008)
Persons with Hearing Disability (2008)

United Way of Central Carolinas 65
Note: The Census Bureau introduced a new set of disability questions in the 2008 American Community Survey questionnaire. Accordingly, the Census Bureau does not recommend comparisons of disability data from 2008 or later with data from prior years.
Source: U. S. Census Bureau, American Community Survey. 2005-2007 - Table B18002. 2008 - Table B18101
From 2005 – 2007 Mecklenburg experienced a 17% increase in the number of disabled people. Cabarrus County experienced a 2% increase. Union and Iredell counties experienced decreases in the number of disabled.
2-Year % Change2005-2007
Union -10.4%Cabarrus 1.8%Iredell -5.4%Mecklenburg 16.7%4-County Total 6.8%
Number of Persons, Aged 5 Years & Older, with Any Disability
Number of People, Age 5 years and older, With Any Disability 2005-2007
Union Union
Cabarrus Cabarrus
Iredell Iredell Iredell
Mecklenburg Mecklenburg
Union
Cabarrus
Mecklenburg
0
20,000
40,000
60,000
80,000
100,000
120,000
140,000
160,000
Mecklenburg 69,939 83,714 81,615
Iredell 21,105 20,695 19,973
Cabarrus 20,012 19,390 20,370
Union 19,433 18,556 17,410
2005 2006 2007
139,368142,355130,489
Number of People With Any Disability 2008 (All Ages)
Iredell
Union
Cabarrus
Mecklenburg
0
20,000
40,000
60,000
80,000
100,000
120,000
Mecklenburg 64,986
Iredell 15,432
Cabarrus 15,561
Union 15,210
2008
111,189

United Way of Central Carolinas 66
2-Year % Change2005-2007
Union 2.2%Iredell -0.6%Cabarrus 0.0%Mecklenburg 43.5%4-County Total 21.4%
Number of Persons, Aged 5 Years & Older, with a Self-Care Disability
Source: U. S. Census Bureau, American Community Survey. 2005-2007 - Table B18006
Note: The Census Bureau introduced a new set of disability questions in the 2008 American Community Survey questionnaire. Accordingly, the Census Bureau does not recommend comparisons of disability data from 2008 or later with data from prior years. For 2008, see slide on Independent Living Disability.
From 2005-2007, Mecklenburg County experienced a 44% increase in the number of individuals, age 5 or older, with a self-care disability. Union County experienced a 2% increase. Cabarrus County experienced no growth and Iredell County experienced a decrease of 1%.
Number of People, Age 5 or Older, With A Self-Care Disability
Union Union
IredellIredell
CabarrusCabarrus
Mecklenburg Mecklenburg
Union
Iredell
Cabarrus
Mecklenburg
0
5,000
10,000
15,000
20,000
25,000
30,000
Mecklenburg 10,455 13,821 15,000
Cabarrus 4,188 3,569 4,189
Iredell 3,863 4,956 3,841
Union 2,948 3,476 3,013
2005 2006 2007
21,454
25,822 26,043

United Way of Central Carolinas 67
Number of People, Age 16 or Older, With A Go-Outside-Home Disability
Union Union
IredellIredell
CabarrusCabarrus
MecklenburgMecklenburg
Union
Iredell
Cabarrus
Mecklenburg
0
5,000
10,000
15,000
20,000
25,000
30,000
35,000
40,000
Mecklenburg 17,766 21,368 22,545
Cabarrus 6,127 5,715 5,518
Iredell 5,942 5,607 5,141
Union 5,030 5,678 4,464
2005 2006 2007
34,865
38,368 37,668
2-Year % Change2005-2007
Union -11.3%Iredell -13.5%Cabarrus -9.9%Mecklenburg 26.9%4-County Total 8.0%
Number of Persons, Aged 16 Years & Older, with a Go-Outside-the-Home Disability
Source: U. S. Census Bureau, American Community Survey. 2005-2007 - Table B18007
Note: The Census Bureau introduced a new set of disability questions in the 2008 American Community Survey questionnaire. Accordingly, the Census Bureau does not recommend comparisons of disability data from 2008 or later with data from prior years. For 2008, see slide on Independent Living Disability.
From 2005-2007, Mecklenburg County experienced a 27% increase in the number of individuals, age 15 or older, with a go-outside-the-home disability. Cabarrus, Iredell and Union County experienced decreases in the numbers of people with a go-outside-the-home disability.
United Way of Central Carolinas 68
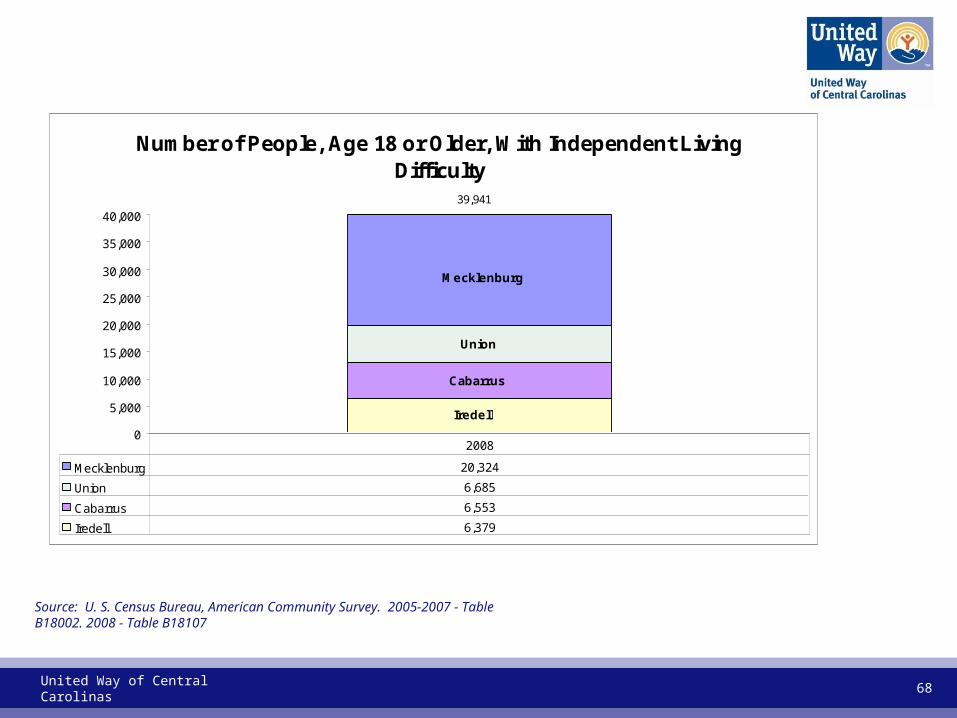
Number of People, Age 18 or Older, With Independent Living Difficulty
Iredell
Cabarrus
Union
Mecklenburg
0
5,000
10,000
15,000
20,000
25,000
30,000
35,000
40,000
Mecklenburg 20,324
Union 6,685
Cabarrus 6,553
Iredell 6,379
2008
39,941
Source: U. S. Census Bureau, American Community Survey. 2005-2007 - Table B18002. 2008 - Table B18107

United Way of Central Carolinas 69
SeniorsOtherAges
TotalDisabled Seniors
OtherAges
TotalDisabled Seniors
OtherAges
TotalDisabled Seniors
OtherAges
TotalDisabled
Cabarrus 7,039 12,973 20,012 6,386 13,004 19,390 7,620 12,754 20,374 8.3% -1.7% 1.8%Iredell 7,591 13,514 21,105 6,522 14,173 20,695 7,692 12,281 19,973 1.3% -9.1% -5.4%Meck 22,417 47,522 69,939 24,821 58,893 83,714 25,748 55,867 81,615 14.9% 17.6% 16.7%Union 5,402 14,031 19,433 5,032 13,524 18,556 6,842 10,568 17,410 26.7% -24.7% -10.4%TOTAL 5-COUNTY 42,449 88,040 130,489 42,761 99,594 142,355 47,902 91,470 139,372 12.8% 3.9% 6.8%
Number of People with Any Disability
County
Source: U.S. Census Bureau, American Community Survey, Table B18002
2005 2006 2007 % Change 2005-2007
SeniorsOtherAges
TotalDisabled Seniors
OtherAges
TotalDisabled Seniors
OtherAges
TotalDisabled Seniors
OtherAges
TotalDisabled
Cabarrus 1,073 3,115 4,188 2,003 1,566 3,569 1,650 2,539 4,189 53.8% -18.5% 0.0%Iredell 1,803 1,880 3,683 1,698 3,258 4,956 1,657 2,184 3,841 -8.1% 16.2% 4.3%Meck 4,623 5,832 10,455 5,084 8,737 13,821 6,388 8,612 15,000 38.2% 47.7% 43.5%Union 1,099 1,849 2,948 1,258 2,218 3,476 1,457 1,556 3,013 32.6% -15.8% 2.2%TOTAL 5-COUNTY 8,598 12,676 21,274 10,043 15,779 25,822 11,152 14,891 26,043 29.7% 17.5% 22.4%
County
Source: U.S. Census Bureau, American Community Survey, Table B18006
Number of People with a Self-Care Disability2005 2006 2007 % Change 2005-2007
In the 5-county region, from 2005 to 2007 there was a 7% increase in the number of people with any disability. Mecklenburg County accounted for most of this increase. It experienced a 15% increase in seniors with disabilities and a 25% increase in people less than 65 years with a disability.
In the same time period, for the 5-county region, there was a 22% increase in the number of people with a self-care disability. Mecklenburg and Iredell Counties accounted for this increase. The increase people with a self-care disability in Iredell was came from people less than 65 years. In Mecklenburg the 44% increase in the number of disabled came from both seniors and people less than 65 years.

United Way of Central Carolinas 70
Number of People, Age 5 or Older, With A Sensory Disability
Union Union
Cabarrus Cabarrus
Iredell
Iredell Iredell
MecklenburgMecklenburg
Union
Cabarrus
Mecklenburg
0
5,000
10,000
15,000
20,000
25,000
30,000
35,000
40,000
Mecklenburg 18,529 21,462 22,037
Iredell 7,279 6,104 6,497
Cabarrus 6,528 5,182 5,275
Union 5,523 4,149 4,957
2005 2006 2007
37,859 36,89738,766
2-Year % Change2005-2007
Union -10.2%Cabarrus -19.2%Iredell -10.7%Mecklenburg 18.9%4-County Total 2.4%
Number of Persons, Aged 5 Years & Older, with a Sensory Disability
Note: The Census Bureau introduced a new set of disability questions in the 2008 American Community Survey questionnaire. Accordingly, the Census Bureau does not recommend comparisons of disability data from 2008 or later with data from prior years. For 2008, see slides on Vision and Hearing Disabilities.
Source: U. S. Census Bureau, American Community Survey. 2005-2007 - Table B18003.
From 2005-2007, Mecklenburg County experienced a 19% increase in the number of individuals, age 5 or older, with a sensory disability. Cabarrus, Iredell and Union County experienced decreases in the numbers of people with sensory disabilities.

United Way of Central Carolinas 71
Number of People With A Vision Difficulty - 2008 (All Ages)
Iredell
Cabarrus
Union
Mecklenburg
0
5,000
10,000
15,000
20,000
25,000
Mecklenburg 13,434
Union 3,080
Cabarrus 2,738
Iredell 2,656
2008
21,908

United Way of Central Carolinas 72
Number of People With A Hearing Difficulty - 2008 (All Ages)
Iredell
Union
Cabarrus
Mecklenburg
0
5,000
10,000
15,000
20,000
25,000
30,000
Mecklenburg 15,355
Cabarrus 5,437
Union 5,106
Iredell 3,374
2008
29,272

Thank You
Appendix:Announced Closing/Layoffs

United Way of Central Carolinas 75
Date City Company ProductNumber Affected Reason Type
4/21/2009 WADESBOROAnson Shirt Co. (Polkton Manuf. Co.) U.S. Navy work shirts 69 Lost contract CLOSING
69
Date City Company ProductNumber Affected Reason Type
7/17/2009 WADESBORO N.C. DMV License plate agency Fraud investigation CLOSING
Unknown
ANSON COUNTYANNOUNCED BUSINESS LAYOFFS & PERMANENT CLOSINGS
Data Compired by Employment Security Commission of NC from Newspaper Announcements - Data NOT Comprehensive
2008 TOTAL
ANSON COUNTY 2009 - 1 Reported Closing
2009 TOTAL:ANSON COUNTY 2008 - 6 Reported Closings, 5 Layoffs
In 2009, the Anson Shirt Company lost its navy shirt contract and closed the plant, affecting 69 employees in Anson County.

United Way of Central Carolinas 76
Date City Company ProductNumber Affected Reason Type
8/1/2010 CONCORD Philip Morris, Inc. Cigarette mfg. 2,500 Production to Richmond, VA CLOSING2,500
Date City Company ProductNumber Affected Reason Type
3/31/2009 CONCORD Circuit City Stores, Inc. Electronics store 53 Liquidation CLOSING
3/6/2009 CONCORDKV Pharmaceutical Co./Ther-RX Corp. Pharmaceutical sales 7 Downsizing LAY OFF
5/22/2009 CONCORDS&K Menswear (Concord Mills) Clothing store 7 Economic conditions CLOSING
9/28/2009 KANNAPOLIS Ktown Furniture, Inc. Furniture store Economic conditions CLOSING9/28/2009 KANNAPOLIS Village Furniture House Furniture store 3 Economic conditions CLOSING9/28/2009 KANNAPOLIS Carolina Interiors Furniture store 11 Economic conditions CLOSING9/28/2009 KANNAPOLIS Furniture Mall Furniture store Economic conditions CLOSING
4/4/2009 CONCORD Wolf Camera (Carolina Mall) Camera store 6 Bankruptcy CLOSING4/24/2009 CONCORD Coldwell Banker United Realtors Consolidation CLOSING
5/22/2009 CONCORDReproductive Endocrinology Associates Fertility clinic Not stated CLOSING
9/3/2009 KANNAPOLISN.C. Research Campus (UNC-CH) Research 6 Budget cuts LAY OFF
93
Date City Company ProductNumber Affected Reason Type
11/19/2008 HARRISBURG Wood Brothers JTG Racing Auto racing/Car building 25 Not stated LAY OFF6/2/2008 CONCORD Jevic Transportation Motor freight transportation 120 Bankruptcy CLOSING
6/10/2008 CONCORD Goody's Family Clothing Clothing store 17 Bankruptcy CLOSING12/31/2008 CONCORD Linens 'n Things Home furnishings 25 Bankruptcy CLOSING12/12/2008 CONCORD KB Toys Toy store 10 Bankruptcy CLOSING12/12/2008 CONCORD LA Weight Loss Centers Diet center Economic conditions CLOSING
7/1/2008 CONCORD Chip Ganassi Racing NASCAR Sprint Cup team 70 Lack of sponsors LAY OFF11/12/2008 CONCORD Furniture Row Racing NASCAR team Downsizing LAY OFF12/11/2008 CONCORD Ganassi-Sabates Racing NASCAR team 71 Economic conditions LAY OFF12/18/2008 CONCORD KiS Golf (Concord Mills) Golf packages 18 Bankruptcy CLOSING
11/9/2008 CONCORD Roush Fenway Racing Racing management 50 Consolidation LAY OFF
406
2010 TOTAL AFFECTED TO DATE:
2008 TOTAL
CABARRUS COUNTY 2009 - 9 Reported Closings, 2 Lay Offs
CABARRUS COUNTY 2008 - 6 Reported Closings, 5 Layoffs2009 TOTAL:
CABARRUS COUNTYANNOUNCED BUSINESS LAYOFFS & PERMANENT CLOSINGS
Data Compired by Employment Security Commission of NC from Newspaper Announcements - Data NOT Comprehensive
CABARRUS COUNTY 2010 - 1 Reported Closing as of 10/15/09

United Way of Central Carolinas 77
Date City Company ProductNumber Affected Reason Type
3/20/2009 STATESVILLE Liberty Homes Inc. Modular homes 76 Slow sales/Housing slump CLOSING6/5/2009 MOORESVILLE UST Inc. Tobacco facility Not stated LAY OFF2/3/2009 MOORESVILLE Polymer Group, Inc. Nonwoven fabrics 2 Economic conditions LAY OFF
2/28/2009 TURNERSBURG Gulistan Carpet Carpet mfg. 120 Declining demand CLOSING
8/2/2009 STATESVILLEAdvanced Tubing Technology, Inc. Tubing Yamaha delays LAY OFF
7/1/2009 STATESVILLE CommScope, Inc. Cable 20 Declining demand LAY OFF2/9/2009 MOORESVILLE NGK Ceramics USA Inc. Ceramic auto parts 85 Auto industry downturn LAY OFF
7/13/2009 STATESVILLE FireFly Balloon Balloon mfg. Declining demand LAY OFF9/18/2009 STATESVILLE Farmhouse Bakery Inc. Bakery 5 Owner's decision CLOSING4/17/2009 STATESVILLE Byers Garage Auto repair Retirement CLOSING
6/2/2009 MOORESVILLE Boaters World Boating goods 9 Bankruptcy CLOSING3/15/2009 STATESVILLE Goody's Family Clothing Clothing store 14 Liquidation CLOSING
9/25/2009 STATESVILLEGracie Rae's Children Boutique Children's apparel Owner's decision CLOSING
1/13/2009 MOORESVILLE Savvy Chef Specialty kitchen gifts Slow sales CLOSING
8/22/2009 STATESVILLE Russell Stover Candies, Inc. Chocolate store 11 Not stated CLOSING6/8/2009 MOORESVILLE Red Horse Racing LLC Truck Series racing 28 Lost sponsorship CLOSING6/8/2009 STATESVILLE Richard Petty Motorsports Sprint Cup racing 9 Chrysler's bankruptcy LAY OFF
6/10/2009 STATESVILLE Ebenezer Elementary School School Merger/Northview CLOSING
6/23/2009 STATESVILLESuccess Institute Charter School Charter school Contract cutbacks LAY OFF
6/23/2009 STATESVILLEAmerican Renaissance Charter School Charter school Contract cutbacks LAY OFF
6/1/2009 STATESVILLE Iredell Public Library Library administration 15 Budget cuts/Part-time staffers LAY OFF
394
Date City Company ProductNumber Affected Reason Type
1/16/2008 STATESVILLE John Boyle Co. Technical fabrics Acquisition/Glen Raven CLOSING12/31/2008 STATESVILLE Kohler Co. (Canac) Kitchen cabinets 552 Economic conditions CLOSING
9/26/2008 MOORESVILLE Lumber Depot, Inc. Building supplies 18 Not stated CLOSING
6/19/2008 MOORESVILLETrident Beverage Corporation Distribution company 7 Relocation/Cherryville CLOSING
12/31/2008 MOORESVILLE Linens 'n Things Home furnishings 23 Bankruptcy CLOSING10/15/2008 MOORESVILLE Soiree Inc. Restaurant 31 Financial difficulty CLOSING
1/9/2008 MOORESVILLE Lake Norman Pet Cemetery Pet cemetery Not stated CLOSING12/12/2008 MOORESVILLE LA Weight Loss Centers Diet center Economic conditions CLOSING11/12/2008 MOORESVILLE Dale Earnhardt Inc. NASCAR team 116 Merger LAY OFF11/18/2008 MOORESVILLE Petty Enterprises LLC NASCAR team 30 Not stated LAY OFF
12/8/2008 MOORESVILLE Petty Enterprises NASCAR team 39 Economic conditions LAY OFF12/10/2008 MOORESVILLE Earnhardt Ganassi Racing NASCAR Nationwide team 7 Lost sponsor LAY OFF12/11/2008 MOORESVILLE JTG-Daugherty Racing NASCAR team 12 Economic conditions LAY OFF12/11/2008 MOORESVILLE Stewart-Haas Racing NASCAR team 16 Economic conditions LAY OFF
12/11/2008 MOORESVILLE Michael Waltrip Racing, Inc. NASCAR team 12 Economic conditions LAY OFF
12/17/2008 STATESVILLE Gillett Evernham Motorsports NASCAR Nationwide team 65 Economic conditions LAY OFF12/31/2008 MOORESVILLE Petty Enterprises NASCAR team 39 Merger with GEM CLOSING
3/28/2008 MOORESVILLEMooresville Human Serv. Center (Insight) Substance abuse treatment 10 Reimbursement issues CLOSING
3/28/2008 STATESVILLEStatesville Human Serv. Center (Insight) Substance abuse treatment 9 Reimbursement issues CLOSING
7/18/2008 STATESVILLE Open Door Dentistry Dental clinic Dentist resignation CLOSING
986
IREDELL COUNTYANNOUNCED BUSINESS LAYOFFS & PERMANENT CLOSINGS
Data Compired by Employment Security Commission of NC from Newspaper Announcements - Data NOT Comprehensive
2008 TOTAL
IREDELL COUNTY 2009 - 11 Reported Closings, 10 Lay Offs
2009 TOTAL:IREDELL COUNTY 2008 - 12 Reported Closings, 8 Layoffs
In 2008 and 2009, newspapers reported 23 closings and 18 layoffs among Iredell County employers, affecting a total of 1,380 employees. Particularly hard hit was the motor sports industry with 373 employees losing their jobs over the past 2 years.

United Way of Central Carolinas 78
Date City Company ProductNumber Affected Reason Type
7/27/2009 CHARLOTTE Wells Fargo & Co. Banking 373 Acquisition LAY OFF5/31/2009 CHARLOTTE Charlotte-Mecklenburg Schools School administration 304 Budget cuts/Teachers LAY OFF1/1/2009 CHARLOTTE Continental Tire North America, Inc. Tire mfg. 300 Relocation to SC CLOSING
4/18/2009 CHARLOTTE EquiFirst Mortgage Corp. Mortgage loans 275 Economic conditions LAY OFF1/16/2009 CHARLOTTE Wells Fargo & Co. Banking 175 Acquisition LAY OFF2/26/2009 CHARLOTTE C.P. Morgan Homes Inc. Home builder 150 Industry downturn CLOSING3/1/2009 CHARLOTTE Wachovia Corp. Banking security 150 Not stated LAY OFF
3/10/2009 CHARLOTTE Bank of America Corp. Financial advice 139 Economic conditions LAY OFF2/10/2009 CHARLOTTE Bank of America Corp. (Ballantyne) Banking 139 Merger LAY OFF4/13/2009 CHARLOTTE Carniceria La Mexicana (3 locations) Grocery store/Bakery 130 Economic conditions CLOSING3/16/2009 CHARLOTTE Office Depot Distribution center 128 Not stated CLOSING6/13/2009 CHARLOTTE EquiFirst Mortgage Corp. Mortgage loans 114 Economic conditions LAY OFF5/17/2009 CHARLOTTE Carolina Paperboard (Caraustar) Recycled cardboard 111 Economic conditions CLOSING4/1/2009 CHARLOTTE Harland Clarke Corp. Check printer 100 Efficiency evaluation CLOSING
1/26/2009 CHARLOTTE Home Depot Design Center (Midtown) Home center 95 Housing slump/Economy CLOSING4/4/2009 CHARLOTTE JP Morgan Chase & Co. Commercial lending 92 Acquisition CLOSING
6/14/2009 CHARLOTTE Sears (Eastland Mall) Department store 92 Underperformance CLOSING1/30/2009 CHARLOTTE C.M. Steel Inc. Steel-fabrication 85 Relocation to SC CLOSING3/23/2009 CHARLOTTE Charlotte Observer Newspaper 82 Ad sales decline LAY OFF3/31/2009 CHARLOTTE Charlotte-Mecklenburg Schools CMS Administration 82 Budget cuts LAY OFF1/1/2009 CHARLOTTE Federal Reserve Check processing 78 Consolidation LAY OFF7/6/2009 CHARLOTTE The Oceanaire Restaurant 75 Bankruptcy CLOSING
12/31/2009 CHARLOTTE Pro-Build East, LLC Building materials 65 Restructuring CLOSING
4/24/2009 CHARLOTTE Southern Steel Co. LLC Steel fabrication 65Declining demand/Economy CLOSING
5/23/2009 CHARLOTTE Ri-Ra's Irish Pub Restaurant 62 Fire CLOSING4/30/2009 HUNTERSVILLE AMN Healthcare Inc. (dba Nurse Rx) Travel nurse staffing 60 Restructuring CLOSING
5/31/2009 CHARLOTTE Charlotte-Mecklenburg Schools School administration 58Budget cuts/School guards LAY OFF
3/13/2009 CHARLOTTE Fuel Systems, Inc. Fuel systems 58 Financial difficulty CLOSING4/1/2009 CHARLOTTE Harper's Blue Ribbon BBQ Restaurant 55 Economic conditions CLOSING
10/31/2009 CHARLOTTE OneCare Co. (Esseplast USA) Housewares 55 Consolidation/GA CLOSING8/7/2009 CHARLOTTE Doosan Infracore International Construction equipment 54 Relocation/Atlanta CLOSING
3/31/2009 CHARLOTTE Circuit City Stores, Inc. (South Blvd.) Electronics store 52 Liquidation CLOSING10/31/2009 CHARLOTTE Federal Reserve Bank of Richmond Reserve banking 52 Restructuring LAY OFF6/29/2009 CHARLOTTE Wells Fargo & Co. Corporate jet hangar 50 Downsizing CLOSING7/30/2009 CHARLOTTE EquiFirst Mortgage Corp. Mortgage loans 47 Economic conditions LAY OFF3/31/2009 MATTHEWS Circuit City Stores, Inc. Electronics store 46 Liquidation CLOSING4/25/2009 CHARLOTTE Charlotte Area Transit System Mass transit administration 42 Funding decline LAY OFF7/1/2009 CHARLOTTE Stein Mart Inc. (Cotswold) Variety store 41 Declining sales CLOSING
4/14/2009 CHARLOTTE United Way of Central Carolinas Charitable agency 41 Cost cuts LAY OFF2/28/2009 CHARLOTTE Belk Inc. Department store 40 Outsourcing IT LAY OFF4/25/2009 CHARLOTTE Bi-Lo Inc. (Dilworth) Grocery store 40 Property redevelopment CLOSING1/3/2009 CHARLOTTE Morton's The Steakhouse (SouthPark) Restaurant 39 Slow sales CLOSING
5/14/2009 CHARLOTTE EquiFirst Mortgage Corp. Mortgage loans 36 Economic conditions LAY OFF8/29/2009 CHARLOTTE EquiFirst Mortgage Corp. Mortgage loans 35 Economic conditions LAY OFF2/24/2009 CHARLOTTE Stanford Group Co. (SouthPark) Stock brokerage 35 Legal problems CLOSING6/29/2009 CHARLOTTE EquiFirst Mortgage Corp. Mortgage loans 31 Economic conditions LAY OFF4/20/2009 CHARLOTTE Good Ol' Days Restaurant 31 Economic conditions CLOSING6/12/2009 CHARLOTTE Cans Bar & Canteen LLC Bar 29 Financial problem CLOSING3/31/2009 CHARLOTTE Belk Inc. Department store 27 Outsourcing LAY OFF1/10/2009 CHARLOTTE GW Fins Restaurant 27 Economic conditions CLOSING4/18/2009 CHARLOTTE McIntosh's Steak & Seafood LLC Restaurant 25 Economic conditions CLOSING7/7/2009 CHARLOTTE Sonny's Real Pit Bar-B-Q (Monroe Road) Restaurant 25 Underperformance CLOSING2/6/2009 CHARLOTTE Bank of America Corp. Quality and Productivity Div. 20 Merger LAY OFF
2/17/2009 CHARLOTTE Carolina Panthers Pro football team 20 Downsizing LAY OFF1/23/2009 CHARLOTTE Clear Channel Radio Radio station management 20 Slow ad sales LAY OFF6/27/2009 CHARLOTTE Il Posto (Phillips Place) Restaurant 20 Owner's decision CLOSING1/25/2009 CHARLOTTE The Coffee Cup Restaurant 20 Underperformance CLOSING
MECKLENBURG COUNTY 2008 - 64 Reported Closings, 43 Layoffs
In 2009, newspapers reported 64 closings and 43 layoffs in Mecklenburg County , affecting 5,093 people. This table shows announcements affecting 20 or more people. Among the companies with the largest numbers of affected employees:
• Wells Fargo/Wachovia
• Charlotte-Mecklenburg Schools
• Continental Tire
• EquiFirst Mortgage
• C. P. Morgan Homes
• Bank of America

United Way of Central Carolinas 79
Date City Company ProductNumber Affected Reason Type
5/31/2009 MONROE Bloomsburg Mills, Inc. Textiles 87 Import competition CLOSING5/31/2009 MONROE Bloomsburg Mills Inc. Dye plant 87 Import competition CLOSING
4/30/2009 MONROEMonarch Knitting Machinery (Vanguard) Textile machinery 123 Not stated LAY OFF
5/31/2009 INDIAN TRAIL Jeff Phillips Mitsubishi Auto sales 18 Not stated CLOSING
6/9/2009 MONROEBob Mayberry Chrysler Dodge Jeep Car dealer Lost contract LAY OFF
3/15/2009 MONROE Goody's Family Clothing Clothing store 20 Liquidation CLOSING1/23/2009 MONROE County of Union County government 40 Economic conditions LAY OFF12/1/2009 MONROE Union Correctional Center Prison Budget cuts CLOSING
375
Date City Company ProductNumber Affected Reason Type
5/5/2008 UNIONVILLESouthern Farm Equipment, Inc. Agricultural supplies 7 Fire CLOSING
7/21/2008 MONROE Island Spa Massage parlor 3 Legal problems CLOSING
10
UNION COUNTYANNOUNCED BUSINESS LAYOFFS & PERMANENT CLOSINGS
Data Compired by Employment Security Commission of NC from Newspaper Announcements - Data NOT Comprehensive
2008 TOTAL
UNION COUNTY 2009 - 5 Reported Closings, 3 Lay Offs
2009 TOTAL:UNION COUNTY 2008 - 2 Reported Closings
In 2009, newspapers reported 5 closings and 3 layoffs, affecting 375 people in Union County. They included 2 textile plants, 2 car dealerships and Union County government.

United Way of Central Carolinas 80

United Way of Central Carolinas 81

United Way of Central Carolinas 82

United Way of Central Carolinas 83
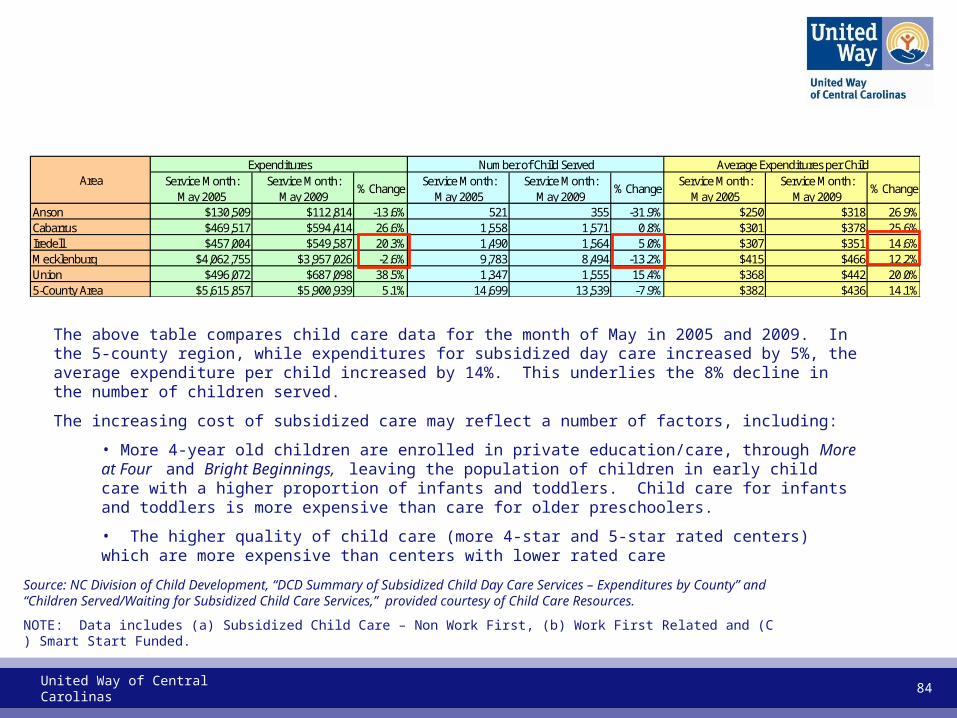
United Way of Central Carolinas 84
Service Month:May 2005
Service Month:May 2009
% ChangeService Month:
May 2005Service Month:
May 2009% Change
Service Month:May 2005
Service Month:May 2009
% Change
Anson $130,509 $112,814 -13.6% 521 355 -31.9% $250 $318 26.9%Cabarrus $469,517 $594,414 26.6% 1,558 1,571 0.8% $301 $378 25.6%Iredell $457,004 $549,587 20.3% 1,490 1,564 5.0% $307 $351 14.6%Mecklenburg $4,062,755 $3,957,026 -2.6% 9,783 8,494 -13.2% $415 $466 12.2%Union $496,072 $687,098 38.5% 1,347 1,555 15.4% $368 $442 20.0%5-County Area $5,615,857 $5,900,939 5.1% 14,699 13,539 -7.9% $382 $436 14.1%
AreaExpenditures Number of Child Served Average Expenditures per Child
Source: NC Division of Child Development, “DCD Summary of Subsidized Child Day Care Services – Expenditures by County” and “Children Served/Waiting for Subsidized Child Care Services,” provided courtesy of Child Care Resources.
NOTE: Data includes (a) Subsidized Child Care – Non Work First, (b) Work First Related and (C ) Smart Start Funded.
The above table compares child care data for the month of May in 2005 and 2009. In the 5-county region, while expenditures for subsidized day care increased by 5%, the average expenditure per child increased by 14%. This underlies the 8% decline in the number of children served.
The increasing cost of subsidized care may reflect a number of factors, including:
• More 4-year old children are enrolled in private education/care, through More at Four and Bright Beginnings, leaving the population of children in early child care with a higher proportion of infants and toddlers. Child care for infants and toddlers is more expensive than care for older preschoolers.
• The higher quality of child care (more 4-star and 5-star rated centers) which are more expensive than centers with lower rated care

United Way of Central Carolinas 85
# of Households with Income Below Poverty Level
Union Union Union Union
Cabarrus Cabarrus Cabarrus Cabarrus
Iredell Iredell IredellIredell
Mecklenburg MecklenburgMecklenburg
Mecklenburg
Anson Anson Anson
0
10,000
20,000
30,000
40,000
50,000
60,000
Mecklenburg 34,283 35,766 33,989 32,580
Iredell 7,411 7,150 5,689 7,875
Cabarrus 5,120 5,784 7,098 6,258
Union 6,365 5,080 4,499 6,200
Anson 1,716 1,716 1,617 1,617
2005 2006 2007 2008
54,895 55,49652,892 54,530
Source: U.S. Census Bureau, American Community Survey, Table C17017

United Way of Central Carolinas 86
% of Households with Income Below Poverty Level3-Year Trend: 2005 vs. 2008
20
%
9%
14
%
11
% 11
%
11
%
19
%
10
%
13
%
9% 1
0%
10
%
0%
5%
10%
15%
20%
25%
Anson Cabarrus Iredell Mecklenburg Union 5-County Area
2005 2008
Source: U.S. Census Bureau, American Community Survey, Table C17017

Income Indicators:Employment for People with
Disabilities
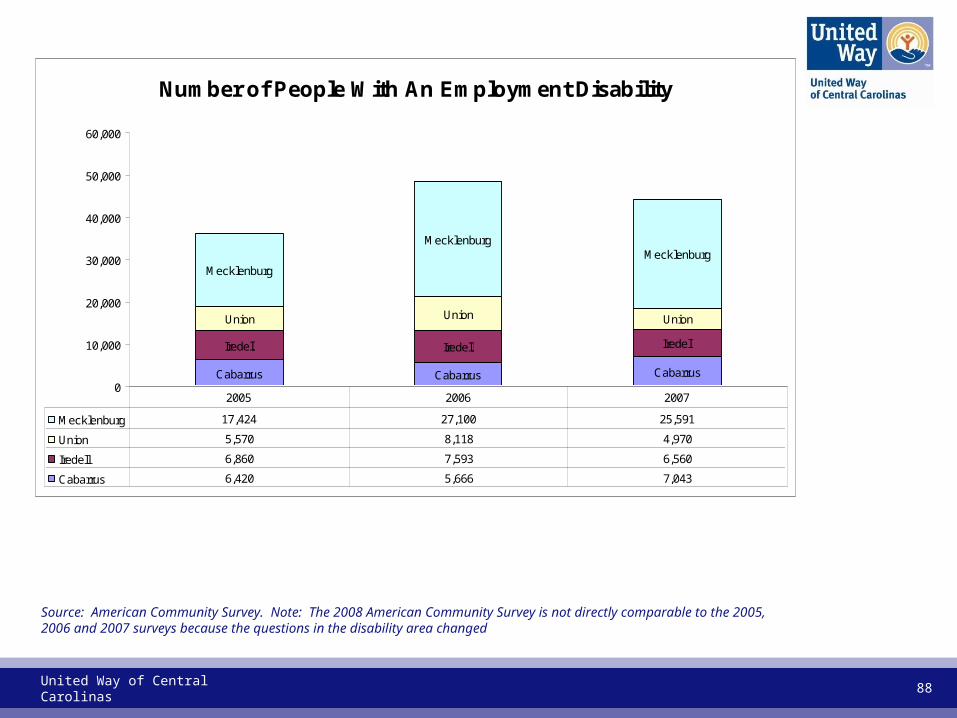
United Way of Central Carolinas 88
Number of People With An Employment Disability
Cabarrus Cabarrus Cabarrus
Iredell Iredell Iredell
Union Union Union
Mecklenburg
MecklenburgMecklenburg
0
10,000
20,000
30,000
40,000
50,000
60,000
Mecklenburg 17,424 27,100 25,591
Union 5,570 8,118 4,970
Iredell 6,860 7,593 6,560
Cabarrus 6,420 5,666 7,043
2005 2006 2007
Source: American Community Survey. Note: The 2008 American Community Survey is not directly comparable to the 2005, 2006 and 2007 surveys because the questions in the disability area changed

Income Indicators:Prison Population
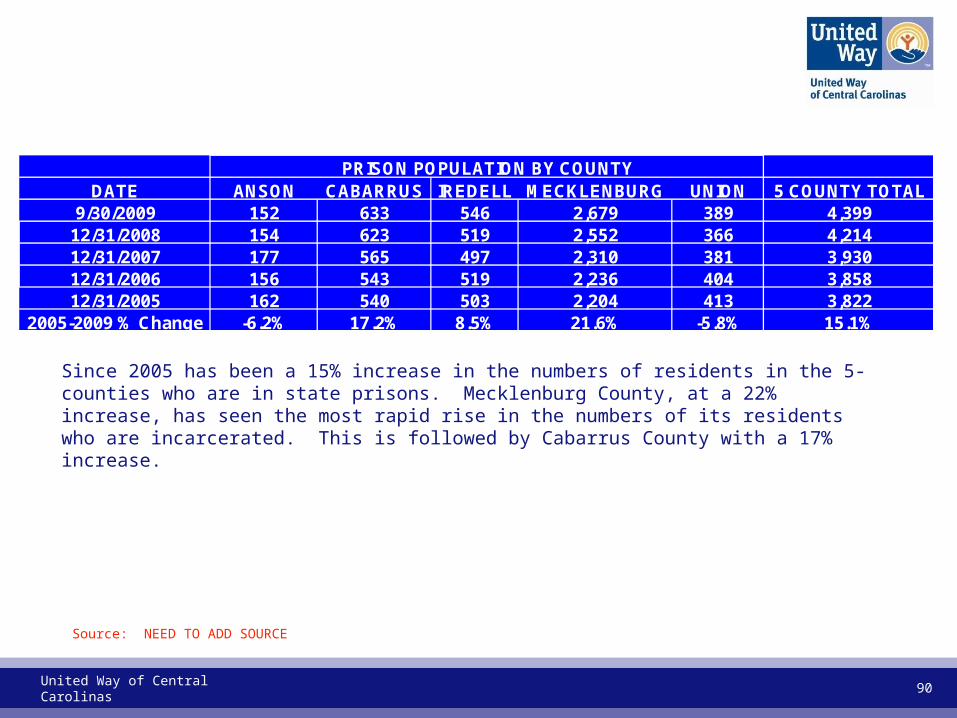
United Way of Central Carolinas 90
Source: NEED TO ADD SOURCE
DATE ANSON CABARRUS IREDELL MECKLENBURG UNION 5 COUNTY TOTAL9/30/2009 152 633 546 2,679 389 4,399
12/31/2008 154 623 519 2,552 366 4,21412/31/2007 177 565 497 2,310 381 3,93012/31/2006 156 543 519 2,236 404 3,85812/31/2005 162 540 503 2,204 413 3,822
2005-2009 % Change -6.2% 17.2% 8.5% 21.6% -5.8% 15.1%
PRISON POPULATION BY COUNTY
Since 2005 has been a 15% increase in the numbers of residents in the 5-counties who are in state prisons. Mecklenburg County, at a 22% increase, has seen the most rapid rise in the numbers of its residents who are incarcerated. This is followed by Cabarrus County with a 17% increase.
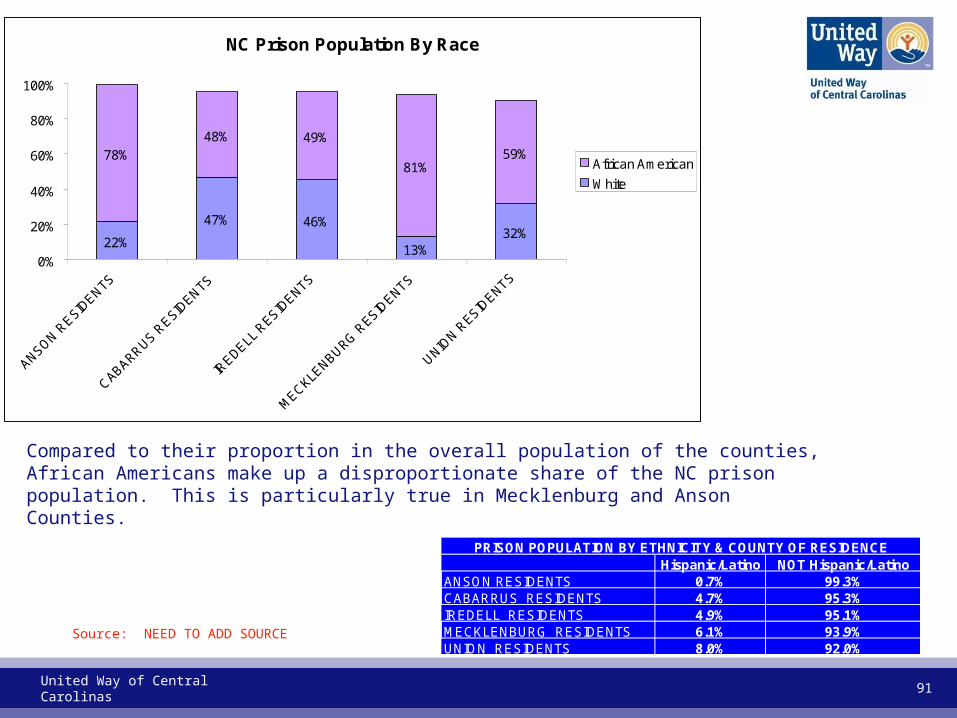
United Way of Central Carolinas 91
Source: NEED TO ADD SOURCE
Compared to their proportion in the overall population of the counties, African Americans make up a disproportionate share of the NC prison population. This is particularly true in Mecklenburg and Anson Counties.
Hispanic/Latino NOT Hispanic/LatinoANSON RESIDENTS 0.7% 99.3%CABARRUS RESIDENTS 4.7% 95.3%IREDELL RESIDENTS 4.9% 95.1%MECKLENBURG RESIDENTS 6.1% 93.9%UNION RESIDENTS 8.0% 92.0%
PRISON POPULATION BY ETHNICITY & COUNTY OF RESIDENCE
NC Prison Population By Race
22%
47% 46%
13%32%
78%48% 49%
81%59%
0%
20%
40%
60%
80%
100%
ANSON RESID
ENTS
CABARRUS RESID
ENTS
IREDELL
RESID
ENTS
MECKLE
NBURG R
ESIDENTS
UNION R
ESIDENTS
African American
White

United Way of Central Carolinas 92
% of Residents, Age 18-64, with NO Health Insurance
19
%
16
%
20
%
17
%
23
%
21
%
16
%
16
% 17
%
21
%
20
%
17
%
20
%
15
%
22
%
14
%
18
%
17
% 19
%
21
%
0%
5%
10%
15%
20%
25%
2005 18.7% 15.5% 20.3% 16.6% 22.5%
2006 21.4% 15.8% 15.6% 17.0% 20.9%
2007 20.1% 17.3% 20.1% 14.9% 22.1%
2008 13.5% 17.5% 17.1% 18.9% 21.0%
Cabarrus Iredell Mecklenburg Union STATE
SOURCE: NC State Center for Health Statistics, Behavior Risk Factor Surveillance System (BRFSS) Survey. http://www.schs.state.nc.us/SCHS/brfss/
NOTE: Due to sample sizes, year-to-year fluctuations in percentages are probably not significant. The 95% confidence intervals for cross tabulated data on this survey are typically 10 percentage points or more.
COMPARISON: In the 2008 American Community Survey (Table B27001) the percentages of non-insured 18-64 year olds was: Cabarrus: 19.7%, Iredell: 22.2%, Mecklenburg: 19.6% and Union: 19.2%.