moral hazard and adverse selection · moral hazard and adverse selection in the...
TRANSCRIPT

Moral Hazard and Adverse Selection
in the Originate-to-Distribute Model of Bank Credit∗†
Antje Berndt‡ Anurag Gupta§
Current Version: March 2009
Abstract
Bank credit has evolved from the traditional relationship banking model to anoriginate-to-distribute model. We show that the borrowers whose loans are soldin the secondary market underperform their peers by about 9% per year (risk-adjusted) over the three-year period following the initial sale of their loans. There-fore, either banks are originating and selling loans of lower quality borrowers basedon unobservable private information (adverse selection), and/or loan sales lead todiminished bank monitoring that affects borrowers negatively (moral hazard). Wepropose regulatory restrictions on loan sales, increased disclosure, and a loan trad-ing exchange/clearinghouse as mechanisms to alleviate these problems.
JEL Classifications: G12, G18, G21, G32
Keywords: Syndicated loans; Secondary loan market; Originate-to-distribute; Moral hazard;
Adverse selection∗We thank the Loan Pricing Corporation and the Loan Syndication and Trading Association for
providing us with the data for this study. We are grateful to Viral Acharya, Ed Altman, Mark Carey,Marvin Goodfriend, CNV Krishnan, Duane Seppi, and especially our discussant and referee Greg Duffeefor useful discussions and comments. We thank participants at the Carnegie-Rochester conference, andseminar participants at the Federal Reserve Board.
†Media coverage: a full article on our paper in the Wall Street Journal on November 19, 2008; authorinterviewed on CNBC squawk box on November 20, 2008; featured in NPR market place, Bloombergnews, Reuters, and others.
‡Tepper School of Business, Carnegie Mellon University. Email: [email protected].§Weatherhead School of Management, Case Western Reserve University. Email: [email protected].

1. Introduction
The historic credit crisis of 2007-8 brought an important question sharply into focus –
to what extent should bank credit be allowed to evolve from its traditional relationship
banking model to the transaction-oriented model that has largely emerged over the last
two decades? This fundamental shift in banking has been due to the explosive growth
in the secondary syndicated loan market.1 The presence of this market transforms bank
credit to an “originate-to-distribute” model, where banks can originate loans, earn their
fees, and then distribute them to other investors in a largely opaque manner.
This shift to the originate-to-distribute model of bank credit has important implica-
tions for all market participants, including the originating banks, the participating loan
investors, the borrowing firms and the regulators. The banks’ superior information about
their borrowers gives rise to concerns about adverse selection – are the banks selling off
loans about which they have negative private (unobservable) information? In a perfect
market, this should lead to a breakdown of the secondary loan market due to the classic
“lemons” problem. The issue of adverse selection is important from the perspective of
the participating loan investors as well – can they trust that the bank selling the loan is
doing so due to legitimate motives (like capital relief and risk management) rather than
due to negative private information? Alternatively, does it lead to moral hazard in terms
of an impairment in the monitoring function of banks, thereby having a negative effect
on the borrowers?
There are several policy questions that arise from this debate. Should the regulatory
authorities restrict the originate-to-distribute activities of banks? Should they enforce
enhanced disclosure of the banks’ activities in the loan sales market? How are the bor-
rowing firms being affected, in the long run, by banks moving from relationship banking
to the originate-to-distribute model of credit? Does this shift lead to value creation or
value reduction in the corporate sector? These questions are, ultimately, empirical ones.
Using extensive data from the syndicated loan market, this paper is the first empirical
investigation of these important but as yet unanswered questions.2
Banks could sell loans in the secondary market due to negative private information
1From 1997 to 2007, the secondary syndicated loan market has grown from $60b to $342b in annualtrading volume, fueled by securitization and the tremendous growth in Collateralized Debt Obligation(CDO) and Collateralized Loan Obligation (CLO) funds.
2The risk of these loans can also be distributed via the credit default swap (CDS) market. During oursample period, the CDS market was liquid primarily for investment-grade obligors, while more than 75%of the syndicated loan market activity has been concentrated in the speculative-grade segment. There-fore, the overlapping sample between the syndicated loan market and the CDS market is statisticallytoo small to analyze.
1

about the borrower, or for legitimate reasons such as capital relief, risk diversification,
improving balance-sheet liquidity, and reducing financing frictions and their cost of cap-
ital. The positive effects of loan sales on banks have led to a point of view that the
originate-to-distribute model of bank credit is “socially desirable”.3 There is also a vast
literature on banks being “special”, since they generate proprietary information about
the borrowers in the course of lending to them.4 The loan buyers who do not have a lend-
ing relationship with the borrowers are then likely to be at an information disadvantage
when buying a loan originated by a relationship bank. This could lead to moral hazard
and adverse selection problems (Gorton and Pennacchi (1988) and Pennacchi (1988)).
Banks that sell loans would have a reduced incentive to engage in costly screening and
monitoring of the borrowers. In addition, they would have an incentive to sell the loans
of the borrowers about whom they have negative private information. Duffee and Zhou
(2001) examine these issues in a theoretical setting with bank loans and the presence of
credit risk mitigation via the default swap market or the loan sales market.
From a borrower’s perspective, there are potentially positive as well as negative con-
sequences of their loans being sold in the secondary market. The positive effects include
a lower cost of capital (Gupta et al. (2008)), increased access to debt capital (Drucker
and Puri (2008)), and information effects (Gande and Saunders (2008)). The negative
effects include a breakdown of lending relationships, reduced monitoring which could
lead to suboptimal investment and operating decisions, harsher covenants (Drucker and
Puri (2008)), and difficulties in renegotiation (Carey et al. (1993)).5 Parlour and Plantin
(2008) present a theoretical model which embeds some of the bank and borrower in-
centives and effects outlined above. However, from an empirical standpoint, it is not
clear which of these effects dominate. Furthermore, if the originate-to-distribute model
of credit creates incentives for banks to originate bad loans and then sell them off in
the secondary market, such borrowers should underperform their peers in the long run.
Since theoretical arguments on this issue can go either way, it needs to be resolved em-
pirically. Our paper is the first one in the literature to empirically examine the long-run
performance of borrowers with and without an active secondary market for their loans.
The existing empirical literature has largely focused on the impact of bank loan an-
nouncements on the borrowers’ stock returns. Most studies have shown that loans are
3These concepts have been explored in prior literature, for example Stein (1998), Kashyap and Stein(2000), Greenspan (2004), Schuermann (2004), and Diamond and Rajan (2006).
4See Diamond (1984), Ramakrishnan and Thakor (1984), Fama (1985), Rajan (1992), and others.5Lending relationships have been shown to be valuable for borrowers since they enhance the availabil-
ity of credit, reduce the requirement for collateral, and reduce the costs of financial distress, as shownby Hoshi et al. (1990), Hoshi et al. (1991), Petersen and Rajan (1994), Berger and Udell (1995), etc.
2

“special” – their announcements elicit positive short-term abnormal returns for borrow-
ers, in contrast to the announcement effect of most other forms of corporate financing
such as common stock, preferred stock, straight debt and convertible debt.6 This result
has been somewhat reversed by Billett et al. (2006), who show that firms announcing
bank loans suffer negative abnormal returns in the long run. The literature on the effects
of loan sales on the borrower’s stock price is rather sparse. While Dahiya et al. (2003)
document a negative announcement effect of the sale of a borrower’s loans by its lending
bank, Gande and Saunders (2008) document the opposite (positive) announcement effect.
However, none of these studies has measured the long-run performance of the borrowers
whose loans trade in the secondary loan market.
We study a large sample of 1054 borrowers, the largest sample analyzed in this litera-
ture thus far. Our results show that borrowers with an active secondary market for loans
significantly underperform their peers by about 9% per year on a risk-adjusted basis over
the three-year period subsequent to their loans first being traded in the secondary mar-
ket. This result is robust to most techniques of measuring long-run abnormal returns.
The underperformance is stronger for small, high-leverage, speculative-grade borrowers,
which is intuitive since these are precisely the firms where moral hazard and adverse
selection problems may be more severe. For the borrowers that have an active secondary
loan market, using Tobin’s q we find a significant reduction in value (as a percentage of
total assets) of about 14% over three years when compared to their peers.
The significant long-run underperformance and value reduction of borrowers with
an active secondary loan market is a striking result, for which we offer two possible
explanations. First, banks may be cherry picking by preferentially selling loans of the
borrowers about whom they have negative private information that is unobservable to
outsiders. Alternatively, banks may be knowingly originating some lemons, primarily
to expand their origination fee based income, since they are able to sell these loans in
the secondary market to outside investors (mostly non-bank financial institutions and
hedge funds).7 In a perfect market, reputation concerns should prevent a bank from
cherry picking and/or selling lemons on a systematic basis. If it is still happening, it is
perhaps an indication of a market failure, where the investors have not (yet) recognized
the adverse selection that they are facing in the secondary syndicated loan market.
Our second explanation is based on the moral hazard argument. When borrowers lose
the discipline of bank monitoring, they may be more prone to making suboptimal invest-
6See, for example, James (1987), Lummer and McConnell (1989), Best and Zhang (1993), Billett etal. (1995), etc.
7This is similar to the recent events in the subprime mortgage crisis, where banks have been originatingmortgages of questionable quality just because there was an active secondary market for such loans.
3

ment and operating decisions, which may lead to a negative long-run performance and
value reduction.8 Based on our tests and results, it is not possible to clearly distinguish
which one of the two explanations dominates. It is likely that both these mechanisms
play some role in explaining our results. In addition, despite our extensive robustness
tests, there is always a possibility that some of the abnormal returns that we observe
may be partly due to inadequate risk adjustments.
While the borrowers with an active loan market underperform their peers, those
without an active loan market do not show any significant long-run underperformance.
Our findings refine the results of Billett et al. (2006), who claim that bank loans are
not special. This is especially interesting in light of the results of Gande and Saunders
(2008) who claim that banks are “special” even in the presence of a secondary market
for loans.9 Our paper shows that bank loans are still “special”, but only if the bankers do
not sell them.
Our results have important policy implications for regulators. Whether the under-
performance and value reduction of borrowers with an active secondary loan market is
due to banks originating and selling lemons, or due to diminished monitoring, it raises
serious questions about the extent to which the originate-to-distribute model of bank
credit is “socially desirable”. While there are clear benefits of enhancing the liquidity of
the secondary syndicated loan market, we demonstrate some of its long-term undesirable
consequences. It is likely that one of the major reasons for the latter is the highly dereg-
ulated nature of the secondary syndicated loan market. Should the regulators impose
restrictions on the sales of bank loans by originating banks? Perhaps. At the minimum,
they could require the originating banks to retain a certain proportion of the loans on
their balance sheet to limit the moral hazard and adverse selection problems. Also, there
must be additional disclosure requirements about the loans being traded in the secondary
market, along with disclosure about the market participants that are trading them. A
loan trading exchange with a clearinghouse could be a possible solution. It is certainly
clear that the originate-to-distribute model of bank credit needs to be modified, and the
8There is a large literature that has examined the special role that banks play in monitoring theirborrowers. These papers show that monitoring banks participate in the borrowers’ internal decisionmaking, limit their excessive risk taking, help enforce and renegotiate written and unwritten covenants,serve a corporate governance role, constrain managers’ opportunistic behaviors, etc., that leads topositive wealth effects for borrowers. See Diamond (1984), Fama (1985), Pennacchi (1988), Diamond(1991), Shleifer and Vishny (1997), Datta et al. (1999), Byers et al. (2008), Ahn and Choi (2009) andothers for these discussions.
9The differing results in Gande and Saunders (2008) are due to their inferences being based on theannouncement effect of bank loan sales, while our results are based on the long-run performance overthe subsequent three-year period. Our sample of 1054 borrowers is also significantly larger than thoseexamined in prior studies.
4

transactions made more transparent.
The rest of our paper is organized as follows. In Section 2, we provide information
about our data along with some descriptive statistics. In Section 3, we explain the
different methods used in this paper for examining the long-run performance of the
borrowing firms. We describe and interpret our results in Section 4. Section 5 concludes.
2. Data
The data for this study is drawn from all U.S. publicly listed firms that borrowed in
the syndicated loan market from January 1, 2000 until December 31, 2004.10 We obtain
the loan origination data from the DealScan database maintained by the Loan Pricing
Corporation. We focus on borrowers with syndicated term loans originated during this
period, excluding borrowers that only obtained other forms of financing such as revolvers
and lines of credit.11
To classify borrowers into the two groups, those with and without an active secondary
loan market, we rely on the secondary loan market database from the Loan Syndication
and Trading Association (LSTA). LSTA provides an independent, daily mark-to-market
pricing service on several thousand syndicated loans to numerous institutions that man-
age bank loan portfolios. LSTA receives bid and ask price quotes, every day, on nearly five
thousand syndicated loan tranches, from over 35 dealers that represent the loan trading
desks of virtually every major commercial and investment bank. Our conversations with
market participants indicate that these dealers and their quoted loans represent over 80%
of the secondary market trading in syndicated loans. Therefore, these loan price quotes
provide an adequate representation of the secondary syndicated loan market. LSTA ag-
gregates these price quotes and provides the average of all bids and all asks for all loans
that have at least two bid quotes. (Generally, about two-thirds of all loans quoted in
the market have at least two bid quotes.) They also provide the number of quotes on
the bid and the ask side. Many loans have quotes from three or more dealers, sometimes
from as many as 17 dealers. In addition, LSTA provides some identifying information
about the borrower and the loan tranche, which is used to hand-match this sample to
the loan origination data from DealScan. The hand-matching is necessary since there is
10We consider loans originated only until 2004 so that we can use stock-return data up to 2007 toanalyze the long-run performance of all borrowers over a three-year period.
11In the case of revolvers and lines of credit, only the drawn portion trades in the secondary market– the undrawn portion remains with the original lenders. Since we do not have any information on thedrawdown schedule of these lines of credit, the moral hazard and adverse selection issues are not clearwhen these lines of credit trade in the secondary market.
5

no common identifier between DealScan and the LSTA secondary pricing database.
Following Gupta et al. (2008), we classify borrowers into those that have loans with an
active secondary market (LIQ), and those without loans with an active secondary market
(no LIQ). If a borrower’s term loans are quoted in our secondary market database by
at least two dealers, and the first quoted bid price is greater than 98 (i.e., it is a “par”
loan), we classify the borrower as LIQ. If there were at least two dealers that quoted bid
prices for a loan, it is reasonable to infer that it was possible to trade the loan on that
day. Further, if the loan is first quoted at par, it implies that it was not a distress sale,
since the loan did not have to be discounted for it to be sold in the secondary market.
Therefore, we classify a borrower as LIQ only if its loans had an active interest from
secondary market dealers without initiating “fire sales” by discounting them. Our results
are robust to alternative ways of defining the two categories of firms. Nevertheless, any
errors due to misclassification will only bias our tests against finding any results.
Next, we match these loan databases to CRSP and Compustat, in order to obtain
firm-level stock return and accounting data. Again, there is no common identifier be-
tween the loan databases and CRSP/Compustat, so the borrowers have to be carefully
hand-matched. Our CRSP and Compustat data covers the period 2000-2007. How-
ever, following Cornett et al. (1998), we impose the requirement that all firms have
CRSP/Compustat data at least two years prior, i.e., from 1998 onwards, to avoid the
new listing bias. This leaves us with a large sample of 1054 borrowers.
Table 1 presents descriptive statistics for our sample of borrowers. Based on the
definition of LIQ, we find that 309 out of the 1054 borrowers have an active secondary
market for their syndicated term loans. The remaining 745 firms have syndicated term
loans originated during the 2000-2004 period, but they are never liquid as per our defi-
nition. Our total sample of 1054 borrowers represents a large proportion of firms in the
corporate universe – they have, in the aggregate, about $3.3 trillion in market capitaliza-
tion, $5.1 trillion in total assets, and over $800 billion in net sales. Average firm statistics
are fairly similar for the groups of borrowers with and without an active secondary loan
market. However, the distribution across market capitalization, total assets and net sales
is much wider for the latter group. The median size of the borrowers in the LIQ group is
about $1.1 billion in market capitalization, $1.9 billion in total assets, and $363 million
in net sales, while the median borrower in the no LIQ category is about one-third to one-
fourth in size on these parameters.12 This is not surprising, since there is more public
information (including greater analysts following) available for larger firms, which would
12Note that we only consider publicly listed borrowers with sufficient CRSP/Compustat data, so manyof the smaller syndicated loan borrowers are already excluded from our sample.
6

help investors in the secondary loan market in evaluating these borrowers. Prima facie,
one would expect this comparison to point to an indirect mechanism for loan investors
to guard against moral hazard and adverse selection issues, since smaller firms should
be more susceptible to these problems. Hence if we still find evidence of moral hazard
and adverse selection in the loan market, despite the fact that it is generally the larger
borrowers whose loans are actively traded, it would be an even more striking result.
We also observe that borrowers that have an active secondary loan market are more
levered and less profitable than those without actively traded loans. About 89% of
borrowers in the LIQ group are speculative grade (SG), while this percentage is lower
at 66% amongst the borrowers in the no LIQ category. Figure 1 provides more details
on the distribution of borrowers by credit rating. Most of the syndicated term loan
market is concentrated on BBB, BB, and B rated borrowers – higher rated borrowers
are able to issue equity, bond or commercial paper directly to investors, thus avoiding
the costs of intermediation. The lower-rated borrowers often do not have any choice
but to approach a financial institution for a loan. However, most of the actively traded
loans are concentrated within the BB and B rating categories, and there is very little
trading activity in the investment-grade (IG) segment. This is primarily due to demand-
side reasons. Loans originated by speculative-grade borrowers are high-yield credits with
spreads over LIBOR that are upwards of several hundred basis points. These are precisely
the loans that investors (including CDO/CLO hedge funds) are interested in buying due
to their higher expected returns. The return on investment-grade loans is generally not
high enough to entice loan investors to participate in this market.
3. Long-Run Performance and Valuation Analysis
The existing literature on measuring long-run abnormal performance dates back to Ritter
(1991) and often focuses on testing IPO and SEO performance.13 Adapting and suitably
modifying that methodology for firms with bank loans, we estimate the risk-adjusted
long-run abnormal stock returns for the two portfolios: borrowers with and without an
active secondary loan market.
There are two widely-used approaches for measuring long-term abnormal returns:
(i) calendar-time methods proposed by Fama (1998) and Brav et al. (2000) that allow
the simulation of investment strategies that could be implemented by a portfolio man-
13For recent applications see, for example, Kooli et al. (2004), Chan et al. (2008), and Ergungor et al.(2009).
7

ager, and (ii) event-time studies, recently applied in Cornett et al. (1998) and Ergungor
et al. (2009), that focus on the aftermarket performance of event firms. Fama (1998)
and Mitchell and Stafford (2000) point out that the event-time approach may overstate
the long-run performance since it can grow with the return horizon even when there is
no abnormal return after the first period. Moreover, since event-time measures are com-
puted over a long horizon, time-period overlap can introduce cross-sectional correlations.
This cross-sectional dependence in sample observations can lead to poorly specified test
statistics (see, for example, Fama (1998), Lyon et al. (1999), and Brav (2000)). We
therefore rely on the calendar-time analysis to measure long-run abnormal returns, and
use the event-time approach as a robustness check.
3.1. Calendar-Time Analysis
Our primary abnormal return measure is the alpha coefficient from the monthly time-
series regression of excess returns on the three Fama and French (1993) factors MKT ,
SMB and HML, and on the momentum factor, UMD, introduced by Jegadeesh and
Titman (1993):
Rj(t) − Rf (t) = α + βMKTMKT (t) + βSMBSMB(t) + βHMLHML(t)
+ βUMDUMD(t) + ε(t), j ∈ {LIQ, no LIQ}, (1)
where Rf is the one-month T-bill rate. RLIQ(t) denotes the monthly return on the
portfolio of borrowers whose loans first became liquid in the secondary market in the q
months prior to t, where q = 12, 24, or 36 months, depending on the long-run return
horizon being analyzed. Rno LIQ(t) denotes the monthly return on the portfolio of bor-
rowers that did not have an active secondary loan market in the q months prior to t.
We distinguish between equally-weighted and value-weighted portfolio returns Rj(t). If
in a particular calendar month t there are no firms in the portfolio, Lyon et al. (1999)
drop that month from estimating equation (1). Since the number of our test firms is
generally large enough, we are able to run the regressions under the stricter requirement
that portfolios need to consist of at least 30 firms for any month.14
We also compare the abnormal returns on the LIQ portfolio to that on the no LIQ
portfolio by replacing Rj(t) − Rf (t) in (1) with RnoLIQ(t) − RLIQ(t). Such a regression
yields the alpha estimate for a portfolio that is long in borrowers with no active loan
market and short in borrowers that have an active loan market. An estimate for alpha
14When stratifying the sample, we reduce that requirement to ten or more firms for large, IG orlow-leverage borrowers, and for all industry portfolios.
8

that is significantly less than zero is evidence of underperformance in the long run of
borrowers with an active loan market relative to those without an active loan market.
To understand if the performance of borrowers with and without an active secondary
loan market is uniform throughout the sample, or if there are certain types of firms that
exhibit a stronger or a weaker effect, we stratify borrowers along different dimensions.
We repeat the regression analysis in (1) after stratifying the set of all borrowers by size,
S&P long-term credit rating, book leverage, and industry. The cutoff point between
small and large firms, for example, is computed at the beginning of each month as the
median size of all NYSE-traded stocks in our reference set (firms that did not issue
bank loans between 2000 and 2004). Similarly, we distinguish between low-leverage
and high-leverage borrowers. The industry groups considered are consumer industries,
manufacturing, technology, healthcare, and other industries.15
An alternative calendar-time portfolio method computes mean calendar-time abnor-
mal returns (MCTARs). For each month t and borrower i, the calendar-time abnormal
return of firm i is calculated relative to the return on its reference portfolio, Ri,ref(t):
CTARi(t) = Ri(t) − Ri,ref(t), (2)
where Ri(t) denotes the return on firm i in month t.
We follow the procedure of Daniel et al. (1997), Cornett et al. (1998) and Lyon et
al. (1999) in constructing 125 reference portfolios based on size (market value of equity
(ME)), book-to-market ratio (B/M), and momentum characteristics. Our reference port-
folios include all firms listed on the NYSE, AMEX, and Nasdaq exchanges from 2000 to
2007, provided that the following three requirements are met: (i) Compustat data are
available for the firm at least two years prior to the inclusion of the firm into the portfo-
lio, (ii) the firm has market value data available in CRSP both one year and six months
prior to the inclusion, and (iii) in the twelve months prior to the inclusion, at least six
monthly returns are available in CRSP. Reference firms exclude firms that issued bank
loans between 2000 and 2004. This leaves us with a reference sample of 7324 firms.16
First, all NYSE firms in our reference sample are sorted into quintiles according
to their market value of equity, calculated at the beginning of each month. Within
15For more details, including the distribution of SIC codes across industries, see Kenneth French’swebsite at http://mba.tuck.dartmouth.edu/pages/faculty/ken.french/data library.html.
16The requirement to exclude all firms that issued bank loans between 2000 and 2004 from the referenceportfolios may introduce a small look-ahead bias in (2) that can be avoided by only excluding borroweri when computing Ri,ref (t). We have implemented this latter version as well. It yields similar results,which is not surprising given the large number of firms in our reference set.
9

each quintile, we further sort firms into five portfolios according to their book-to-market
ratios.17 Finally, for each size and book-to-market sorted portfolio, we sort the firms
into quintiles according to their preceding twelve-month return. This process gives us
a total of 125 NYSE-based portfolios to which any AMEX and Nasdaq firms in the
reference sample are added. For a particular month t, we match each borrower to a
benchmark portfolio according to its size, book-to-market ratio, and momentum rank at
the beginning of that month. The reference portfolio return is the equally-weighted or
the value-weighted return on the portfolio of reference stocks.
Each calendar month t, a weighted abnormal return across borrowers is calculated as
CTARj(t) =∑
i
wi(t) CTARi(t), j ∈ {LIQ, no LIQ}. (3)
CTARLIQ(t) denotes the weighted calendar-time abnormal return on the portfolio of
borrowers whose secondary loan market first became liquid in the q months prior to t,
where q = 12, 24, or 36 months. CTARno LIQ(t) denotes the return on the portfolio of
borrowers that had bank loans originated prior to time t, but did not have an active
secondary loan market in the q months prior to time t. The weights wi(t) are all equal
when reference portfolios and abnormal returns are equally weighted. When they are
value weighted, wi(t) is equal to the size of firm i at the beginning of month t relative to
the total size across all firms. A grand mean abnormal monthly return is calculated as
MCTARj =1
T
T∑t=1
CTARj(t), j ∈ {LIQ, no LIQ}. (4)
To directly compare the abnormal returns on the LIQ portfolio to those on the no LIQ
portfolio, we estimate the average difference in weighted calendar-time abnormal returns
by replacing CTARj(t) in (4) with CTARno LIQ(t) − CTARLIQ(t).
3.2. Event-Time Analysis
Our event-time tests examine the cumulative abnormal returns (CARs) and the buy-
and-hold abnormal returns (BHARs) for the portfolios of borrowers with and without
an active secondary loan market. The analysis of CARs answers the question whether
borrowers in one of these categories persistently earn abnormal monthly returns.
17Following Fama and French (1993), we do not use negative book equity values when calculatingthese cutoff points.
10

The weighted abnormal return at s months after the event is calculated as
ARj(s) =∑
i
wi(s)(Ri(s) − Ri,ref(s)
), j ∈ {LIQ, no LIQ}, (5)
where ARLIQ(s) denotes the weighted event-time abnormal return on the portfolio of
borrowers whose secondary loan market first became liquid s months ago, and ARno LIQ(s)
denotes the return on the portfolio of borrowers that do not have an active loan market.
For each borrower that does not have an active loan market during our sample period,
we randomly assign an “event month” on or after that firm’s first loan origination date.
We use 1000 simulations, and ARno LIQ(s) is stored for each. The weights wi(s) are all
equal when reference portfolios and abnormal returns are equally weighted. When they
are value weighted, wi(s) is equal to the size of firm i relative to the total size across all
firms. Reference portfolios are formed as in the previous section. We distinguish between
continuously rebalanced reference portfolios, and reference portfolios that are not allowed
to update.
The q-month cumulative abnormal portfolio return is calculated as
CARj =
q∑s=1
ARj(s), j ∈ {LIQ, no LIQ}, (6)
where q = 12, 24, or 36 months. To account for potential skewness in cumulative abnor-
mal returns, we rely on skewness-adjusted t-statistics as discussed in Barber and Lyon
(1997). We also report the median, across the 1000 simulations, of the difference in
cumulative abnormal returns between the portfolios of borrowers with and without an
active secondary loan market, as well as the median of the associated two-sample t-test
statistics with unpooled variances.
Another measure of long-run stock returns is the buy-and-hold abnormal return,
which represents the compounded returns that a long-horizon investor would earn (see,
for example, Barber and Lyon (1997) and Kothari and Warner (2007)). The weighted
abnormal return from a buy-and-hold strategy over a q-month period is computed as
BHARj =∑
i
wiBHARi, j ∈ {LIQ, no LIQ} (7)
11

where
BHARi =
(q∏
s=1
(1 + Ri(s)) −q∏
s=1
(1 + Ri,ref(s))
), (8)
for q = 12, 24, or 36 months. BHARLIQ denotes the weighted buy-and-hold abnormal
return on the portfolio of borrowers with an active secondary loan market, whereas
BHARno LIQ is the buy-and-hold abnormal return on the portfolio of borrowers with no
actively traded loans. Since long-run buy-and-hold abnormal returns are often positively
skewed, we use skewness-adjusted t-statistics as discussed in Barber and Lyon (1997).
As we did for CAR, for each borrower that does not have an active loan market during
our sample period, we randomly assign an “event month” on or after that firm’s first
loan origination date. We use 1000 simulations and report the median BHARnoLIQ.
As before, we distinguish between equal and value-weighting, and between reference
portfolios with continuous rebalancing and those without rebalancing.
We also compute the median, across the 1000 simulations, of the difference in the
buy-and-hold abnormal returns between the portfolios of borrowers with and without an
active secondary loan market, as well as the median of the associated two-sample t-test
statistics with unpooled variances.
3.3. Valuation Analysis
To complement our study of long-run stock returns, we examine a widely used measure
of long-run changes in borrower valuation, the Tobin’s q. It is defined as the ratio of the
sum of the market value of equity plus the book value of debt to total assets.18
Our measure of changes in Tobin’s q is match-adjusted: the long-run change in a
borrower’s valuation is measured relative to that of a matched sample of non-borrowers.
Using the methodology of Barber and Lyon (1996), for each borrower and a given month
t, we consider a list of two-digit SIC code and valuation-matched (Tobin’s q within 90%
and 110% of the issuer at beginning of month) firms that did not originate bank loans
between 2000 and 2004. For firms with an active secondary loan market, t denotes the
month during which the loan market first became liquid. For borrowers without an
active loan market, we randomly sample t from the months of or after the firm’s first
loan origination date. Note that we winsorize all firm valuation measures at the 1 percent
and 99 percent levels to avoid our results being driven by outliers.
18For a recent application, see Roll et al. (2008).
12

The reference 36-month-ahead Tobin’s q for borrower i, TQi,ref(t+36), is computed as
the median Tobin’s q at the end of month t+36, across all firms in borrower i’s reference
group. One drawback of using the level of the reference group’s firm valuation measure
is that it ignores the history of the borrower’s valuation measure relative to that of the
reference group. An alternative reference 36-month-ahead Tobin’s q for borrower i is
equal to its past valuation measure plus the change in the reference portfolio’s valuation
measure.
For borrower i, the 36-month-ahead difference in Tobin’s q relative to the reference
group firms using levels is defined as
I: TQi(t + 36) − TQi,ref(t + 36).
Similarly, the 36-month-ahead difference in Tobin’s q relative to the reference group firms
using changes in levels is given as
II: TQi(t + 36) − [TQi(t) +(TQi,ref(t + 36) − TQi,ref(t)
)].
We use both methods I and II to compute the average, across all borrowers with and
without an active secondary loan market, of the 36-month-ahead difference in Tobin’s
q relative to the reference group firms. For the latter set of borrowers, we report the
median across the 1000 simulations of event times.
4. Results
We now present the results from the calendar-time, event-time and valuation analysis.
4.1. Calendar-Time Analysis
In Table 2, we report the intercept terms (alphas) from regressing the portfolio returns
for borrowers with and without an active secondary loan market on the three Fama-French
and the momentum factors. Each alpha can be interpreted as the average abnormal
monthly return of its respective portfolio. We also report the alpha for a portfolio that is
long in borrowers with no active loan market and short in borrowers that have an active
loan market, which is indicative of the abnormal return of an admissible trading strategy
based on the liquidity of the borrowers’ loans in the secondary market.
The results show that the borrowers whose loans are sold in the secondary market
underperform their peers by an economically large magnitude of about 9% annually, on
13

a risk-adjusted basis, over the three-year period following the initial sale of their loans.
For borrowers with an active loan market, the abnormal monthly return is on average
about -0.75% (t=-2.79) using equally-weighted portfolios. The result is very similar
using value-weighted portfolios, with an estimated alpha of -0.74% (t=-1.93). On the
other hand, the borrowers that do not have an active loan market do not underperform
in the long run. The long-short portfolio performance indicates that the strategy would
yield an abnormal monthly return of 1.18% (t=3.81) using equally-weighted portfolios
and of 0.67% (t=1.79) using value-weighted portfolios.
This is clear evidence of underperformance of firms whose loans are sold in the sec-
ondary market. These results are somewhat different from, but intuitively consistent
with, those reported by Billett et al. (2006), who report that firms announcing bank
loans suffer negative abnormal stock returns over the subsequent three years. We find
this negative risk-adjusted excess return only for firms whose loans are sold. Borrowers
whose loans are not sold do not suffer negative abnormal returns. Perhaps the pooling of
these two types of firms with different long-run performance patterns gives rise to their
results. In fact, if we average the alphas for the two types of firms in our sample, we
obtain average alphas that are close to the ones these authors report. This distinction is
important – our results support prior studies that find bank loan financing to be “spe-
cial” and different from other forms of corporate financing such as IPOs, SEOs, public
and convertible debt, since it does not lead to a negative long-run performance of the
borrowers, except for firms whose loans are being sold by the lending banks.
As with all studies using risk-factor models, there is always a concern whether the
alphas simply represent a poor risk adjustment.19 The ideal experiment would be to
compare the stock returns of borrowers that are identical to outsiders, with one set
having actively traded loans and the other set with no actively traded loans. In this case,
there would be no need for a risk-factor adjustment. Unfortunately, given the median
firm characteristics reported in Table 1, this ideal experiment is nearly impossible to
conduct. A match on size, B/M, momentum and rating is feasible only for 20 borrowers
with actively traded loans. For this set of firms, however, the monthly MCTAR relative to
reference groups of borrowers without an active secondary loan market is still significantly
negative at -1.77% (t=-2.13). (The CAR and BHAR measures are also negative and of
economic significance, but are not statistically significant due to the small sample size.)
Since the matching exercise shows that it is not feasible to conduct the ideal experiment
in a statistically robust manner, we are forced to adopt the risk-factor adjustments.
To examine the robustness of our risk-factor adjustment, we expand the four-factor
19We thank our referee for diligently pressing us to refine our analysis on this point.
14

model to eight factors by including liquidity, term, default, and volatility factors. The
results for the full eight-factor model are reported in Table 3.20 The abnormal monthly
return for borrowers with an active loan market is -0.81% (t=-3.07) for equally-weighted
and -0.84% (t=-2.25) for value-weighted portfolios, reinforcing our inference regarding
the underperformance of this set of firms. In this table, we also report censored results
for the four-factor and eight-factor models where we remove the smallest quintile of firms,
in order to test whether any of our results are driven by the smallest firms in the sample.
Once again, we obtain negative abnormal returns of similar magnitude and significance
for the set of borrowers that have an active secondary loan market.21
To further assess the effectiveness of the four-factor risk-adjustment model during our
2000-2007 sample period, we compute alphas for the 25 Fama-French portfolios sorted on
size and book-to-market ratio. The alphas are significantly negative only for one portfolio
using value weighting and two portfolios using equal weighting, with magnitudes of half
or less of those found for the LIQ group. Therefore, our results do not appear to be
driven by the inadequacy of the four-factor risk-adjustment. Nevertheless, while we have
performed an extensive sensitivity analysis of our risk-adjustment model, we acknowledge
that the possibility remains that a portion of our abnormal returns may be due to some
other missing risk factor.22
Next, we drill down into our sample of borrowing firms to understand if the under-
performance of firms with an active secondary loan market is uniform throughout the
sample, or if there are some types of firms that exhibit a stronger or a weaker effect.
Table 4 reports the four-factor alphas for our sample stratified by size. We find that the
relative underperformance is present only in the smaller firms. The smaller firms with an
active loan market have an average abnormal monthly return of -0.53% (t=-2.37) using
equally-weighted portfolios and -0.42% (t=-1.57) using value-weighted portfolios, while
the alphas are insignificant for large firms. The smaller firms are more likely to be more
opaque, with less public information about them. In this case the private information
advantage of the bank is likely to be greater, resulting in a greater ability of the banks to
sell the loans of firms that they internally believe will perform poorly in the future. Al-
ternatively, the smaller firms are more likely to benefit from the discipline of the lending
20Results using various five, six, and seven-factor models are similar, but we do not report them dueto space constraints. We thank Viral Acharya for data on innovations in market illiquidity.
21We also perform the four-factor and eight-factor regressions after removing the lowest and the highestpercentile of return observations, and obtain similar results.
22The subset of actively traded syndicated loan borrowers has specific firm attributes. It does notrepresent the entire cross-section of firms in the corporate universe, since not all firms borrow in thesyndicated loan market, and only some of those borrowers have actively traded loans. These attributesmay be plausibly related to risk, hence a risk-based explanation for our alphas may be possible.
15

banks monitoring them closely, since they may not have sophisticated corporate gover-
nance systems in place, or as much public scrutiny as the larger firms. In this case, the
weakening of their relationship with their lenders could affect them negatively.
The second stratification is based on the credit rating of the borrowing firms. The
four-factor alphas for this stratification are reported in Table 5. The speculative-grade
firms with an active loan market have an average abnormal monthly return of -0.78%
(t=-2.64) using equally-weighted and -1.11% (t=-2.38) using value-weighted portfolios.
This is not surprising, since the speculative-grade firms are riskier firms where the lemons
problem is more likely to be present. These are also the firms that could benefit the most
from the discipline imposed by bank monitoring.
We next classify borrowers into high-leverage and low-leverage borrowers based on the
median book leverage of all NYSE traded stocks in our reference set of non-borrowers.
These results are presented in Table 6. The high-leverage firms with an active loan
market have an average abnormal monthly return of -0.89% (t=-3.34) using equally-
weighted and -0.97% (t=-2.46) using value-weighted portfolios. In light of our results
for stratifications by size and credit rating this is again intuitive, given that these two
variables are generally correlated with leverage.
Overall, our results lead to two important inferences. First, the borrowers whose
loans are sold in the secondary market suffer a negative abnormal return, on a risk-
adjusted basis, of about 9% per year over the three years following the initial sale of their
loans. These negative abnormal returns are concentrated within small, high-leverage,
speculative-grade firms.23 Second, we find that the borrowers that have no active sec-
ondary loan market do not have any negative abnormal returns over a three-year horizon,
which is different from the results of underperformance of firms raising capital through
other means such as equity or public debt issuance.
We next examine the MCTARs based on calendar-time portfolios, as an alternative to
the alphas obtained from factor regressions. The results for the full sample are presented
in Table 7. These results clearly show that the borrowing firms with actively traded loans
significantly underperform relative to their peers. Over a three-year horizon, the firms
with an active loan market experience an average abnormal monthly return of -0.85%
(t=-3.17) using equally-weighted and -0.73% (t=-2.50) using value-weighted portfolios,
which translates to an annual abnormal return between 8.8% and 10.2% over a three-year
period, very similar to the results obtained using the four-factor model. These results
are both economically and statistically significant. The stratifications by size, leverage
23Stratification on the five Fama-French industries shows negative abnormal returns for the “consumer”and “other” industries. The latter include firms in business services, entertainment, finance and hotels.
16

and credit rating yield results similar to those reported for the factor regressions earlier,
that this effect is mostly due to small, high-leverage, speculative-grade firms.
4.2. Event-Time Analysis
In Figure 2, we present the event-time CARs for borrowers with and without an active
loan market and their respective reference portfolios, both equally and value weighted,
for portfolios that are rebalanced as well as for those that are not rebalanced. Consistent
with prior results, the borrowers with an active loan market have the lowest CARs in all
four plots, as shown by the bottom graph line in these figures. Even visually, this group
of borrowers clearly and consistently underperforms the other borrowers as well as the
reference portfolio firms over the three-year period subsequent to the sale of their loans.
In Table 8 we present the CARs for firms with and without an active secondary loan
market, as well as for the long-short strategy. The first panel presents the results when
the reference portfolios are rebalanced every month, while the second panel presents the
results without rebalancing the reference portfolios. Our results show, using rebalanced
reference portfolios, that the borrowers with an active loan market have a three-year
CAR of -11.62% (t=-2.21) using equally-weighted portfolios and -7.36% (t=-1.95) using
value-weighted portfolios. These firms appear to be experiencing negative returns relative
to the returns on the reference portfolios matched based on size, book-to-market ratio
and momentum. On the other hand, the borrowers with no active loan market do not
underperform in the long run. As reported in the second panel, the results using reference
portfolios that are not rebalanced are similar (though not statistically significant in some
cases). These findings are consistent with our results in the previous subsection, which
show that borrowers whose loans are being sold appear to underperform their peers, and
that the magnitude of this underperformance is statistically and economically significant.
When we stratify our sample based on size, credit rating or leverage we get similar results
as before. However, we lose statistical significance in some of the tests due to the small
sample sizes in each of the strata.
In Table 9, we present the BHARs as an alternative measure of returns aggregated
based on event time. The sign of these abnormal returns is similar, but we do not find
statistical significance using this measure. In both panels, using reference portfolios that
are either rebalanced monthly or not rebalanced at all, we find that the borrowers with
an active secondary loan market have lower BHARs, and that the long-short strategy
has a positive BHAR, though they are not statistically significant. Stratification by size,
credit rating or leverage yields results similar to the ones reported before.
17

4.3. Borrower Valuation
One of the inferences of the literature on the loan sales market has been that it is
“socially desirable”, given all the benefits of loans sales that accrue to the borrowers as
well as the banks. Some papers (such as Arping (2004)) have even suggested that the
presence of this market could lead to “value creation” in the corporate sector. Our results
so far suggest that the borrowers whose loans are sold underperform their peers, over a
three-year period following the loan sale. What is the long-run impact of the loan sales
market on the valuation of such borrowers? We answer this question by analyzing the
changes in Tobin’s q, which is a widely used proxy for firm valuation.
In Table 10 we report the long-run changes in Tobin’s q for the two groups of borrowers
relative to their two-digit SIC code and valuation-matched reference group firms, as
recommended by Barber and Lyon (1996). We report the average and median differences
in 36-month-ahead Tobin’s q using two benchmarks for the “expected” Tobin’s q. The
first one uses the level of Tobin’s q for the reference group, and the second one relies
on the change in Tobin’s q for the reference group. As Barber and Lyon (1996) show,
these two models are the most reliable in detecting the differences between the test and
the reference portfolios. The results are striking – we find that, on average, borrowers
with an active secondary loan market lose between 11.5% and 14% of their value (as a
percentage of their total assets) when compared to their reference group firms, over the
three-year period subsequent to the initial sale of their loans. This result is significant
for both average and median long-run changes in Tobin’s q. In addition, the borrowers
without an active loan market do not show any abnormal changes in Tobin’s q, when
compared to their reference firms. This again reaffirms our earlier conclusion that bank
loan financing has no negative long-run effects on the borrowers, except for the ones
whose loans are being sold in the secondary market.
Perhaps the weakening of the bank-borrower relationship due to the sale of the loan
induces moral hazard on the part of the bank, leading to diminished monitoring of the
borrower. Syndicated loans are renegotiated quite often, the covenants are often ad-
justed, and unwritten covenants enforced in response to the borrowers’ actions. The lead
banks keep close tabs on the borrowers in whom they have substantial financial interest.
As shown in prior studies, they play an important corporate governance role, restrict ex-
cessive risk-taking and opportunistic managerial behavior on the part of the borrowers,
and thus have a positive wealth effect on them. It is possible that diminished monitoring
could cause value reduction due to an impairment of any of these roles of the lead banks.
However, it is equally plausible that this value loss is a result of adverse selection, not
moral hazard. Our empirical tests cannot distinguish between the two. Nevertheless,
18

it does not appear that, in the long run, the presence of an active secondary market
for syndicated loans is entirely “socially desirable”, at least from the perspective of the
borrowing firms.
5. Concluding Remarks
We investigate the effects of the transition in bank credit from the relationship bank-
ing model to the “originate-to-distribute” model, on a large sample of borrowers in the
syndicated loan market. This shift has mainly been due to the growth in the secondary
market for syndicated loans, which has allowed banks to sell loans to participating in-
vestors in a largely opaque manner. While the prior literature has documented several
benefits of the loan sales market for the banks as well as the borrowers, the long-run
effects of the existence of this market on the borrowing firms has never been examined.
This is precisely what we study in this paper.
When banks sell syndicated loans in the secondary market, it raises moral hazard
and adverse selection questions. Are the banks selling lemons, i.e., the loans of borrow-
ers about whom they have negative private information that is unobservable to outside
investors? Are they deliberately originating bad loans to enhance their fee income, just
because there is an active secondary market where they can sell these loans? How does
this affect the incentives of the bank to monitor their borrowers? Is the severance of their
lending relationship harmful for borrowers? What is the consequent impact on the long-
run valuation of the borrowers? Theory alone is insufficient to answer these questions, as
there are both positive and negative effects of the secondary market for syndicated loans.
Ultimately, these issues must be resolved empirically, which is the focus of our paper.
We find that borrowers with an active secondary market for their loans underperform
their peers by about 9% per year in terms of annual risk-adjusted abnormal returns, over
the three-year period subsequent to the initial sale of their loans. These abnormal returns
are largely concentrated amongst small, high-leverage, speculative-grade borrowers. In
addition, the borrowers with an active loan market suffer a valuation loss of about 11-14%
of the value of their total assets over a three-year period when compared to their peers.
We offer two explanations for our results. First, banks may indeed be selling lemons
based on their unobservable private information about the borrower. This would be an
indication of a market failure, since, in an efficient market, reputation concerns should
inhibit such actions on the part of banks. It bears a remarkable resemblance to the
events that have unfolded in the monumental subprime mortgage crisis that began in
19

2007. Second, borrowers might suffer due to their diminished relationship with banks,
since selling the loans removes the discipline of bank monitoring. This might diminish
firm value in the long run. Our tests cannot conclusively confirm one or the other
explanation. In addition, there is always the possibility that the abnormal returns that
we find in our paper are, at least partly, due to inadequate risk adjustment in our factor
models. We try and alleviate these concerns by estimating an array of alternative factor
models and abnormal return calculations. Our results are robust across the different
model specifications and approaches that we use in this paper.
We also find that the borrowers without an active secondary loan market do not
suffer any negative long-run effects after obtaining syndicated bank loans. This reaffirms
the inference that, for some borrowers, banks loans are indeed “special” when compared
to other forms of corporate financing such as equity or public debt, all of which result
in a negative long-run performance of the firms raising capital. Our results refine the
findings of Billett et al. (2006) who document a negative long-run performance for all
firms that borrow in the syndicated loan market. We show that this negative long-run
performance is limited to the borrowers that have an active secondary market for their
loans. This is especially interesting in light of the results in Gande and Saunders (2008),
who infer that banks continue to be special even in the presence of a secondary market for
loans. Gande and Saunders also suggest that secondary market loan trading is valuable
to equity investors. Their inferences are based just on the announcement effect of loan
sales on the borrowers’ stock price, whereas we examine the long-run performance of
the borrowing firms. Our results suggest that bank loans are “special”, but only for the
subset of borrowers that do not have secondary market trading in their loans.
We show that the originate-to-distribute model of bank credit may not entirely be
“socially desirable”, since we document some of the negative effects of this model on
the long-run performance and valuation of borrowers. Our results have important policy
implications for regulators. The highly deregulated nature of the secondary loan market
is perhaps one of the reasons for the moral hazard and adverse selection problems that
we detect. One solution could be to impose restrictions on the sale of the loans that the
banks originate, in terms of requiring them to hold at least a certain percentage of those
loans on their books. This would hinder banks from originating bad loans as well as
preserve some of the benefits of bank monitoring of borrowers. There should of course be
additional disclosure requirements on all participants in the loan sales market, in order
to reduce the occurrence of adverse selection. Lastly, the establishment of a loan trading
exchange with a clearinghouse could benefit all market participants by way of greater
transparency and regulatory oversight.
20

References
Acharya, V., Pedersen, L., 2005. Asset pricing with liquidity risk. Journal of Financial Eco-nomics 77, 375–410.
Ahn, S., Choi, W., 2009. The role of bank monitoring in corporate governance: Evidence fromborrowers’ earnings management behavior. Journal of Banking and Finance 33, 425–434.
Ang, A., Hodrick, R., Xing, Y., Zhang, X., 2006. The cross-section of volatility and expectedreturns. Journal of Finance 61, 259–299.
Arping, S., 2004. Credit protection and lending relationships. University of Amsterdam WP.
Barber, B., Lyon, J., 1996. Detecting long-run abnormal operating performance: The empiricalpower and specification of test statistics. Journal of Financial Economics 41, 359–399.
Barber, B., Lyon, J., 1997. Detecting long-run abnormal stock returns: The empirical powerand specification of test statistics. Journal of Financial Economics 43, 341–372.
Berger, A., Udell, G., 1995. Relationship lending and lines of credit in small firm finance.Journal of Business 68, 361–381.
Best, R., Zhang, H., 1993. Alternative information sources and the information content of bankloans. Journal of Finance 48, 1507–1522.
Billett, M., Flannery, M., Garfinkel, J., 1995. The effect of lender identity on a borrowing firm’sequity return. Journal of Finance 50, 699–718.
Billett, M., Flannery, M., Garfinkel, J., 2006. Are bank loans special? Evidence on the post-announcement performance of bank borrowers. Journal of Financial and Quantitative Anal-ysis 41, 733–751.
Brav, A., 2000. Inference in long-horizon event studies: A Bayesian approach with applicationto initial public offerings. Journal of Finance 55, 1979–2016.
Brav, A., Geczy, C., Gompers, P., 2000. Is the abnormal return following equity issuancesanomalous? Journal of Finance 56, 403–416.
Byers, S., Fields, L., Fraser, D., 2008. Are corporate governance and bank monitoring substi-tutes: Evidence from the perceived value of bank loans. Journal of Corporate Finance 14,475–483.
Carey, M., Prowse, S., Rea, J., Udell, G., 1993. The economics of the private placement market.Federal Reserve Board Staff Studies.
Chan, K., Cooney, J., Kim, J., Singh, A., 2008. The IPO derby: Are there consistent losers andwinners on this track? Financial Management 37, 45–79.
Cornett, M., Mehran, H., Tehranian, H., 1998. Are financial markets overly optimistic aboutthe prospects of firms that issue equity? Evidence from voluntary versus involuntary equityissuance by banks. Journal of Finance 53, 2139–2159.
Dahiya, S., Puri, M., Saunders, A., 2003. Bank borrowers and loan sales: New evidence on theuniqueness of bank loans. Journal of Business 76, 563–582.
21

Daniel, K., Grinblatt, M., Titman, S., Wermers, R., 1997. Measuring mutual fund performancewith characteristic-based benchmarks. Journal of Finance 52, 1035–1058.
Datta, S., Iskandar-Datta, M., Patel, A., 1999. Bank monitoring and the pricing of corporatepublic debt. Journal of Financial Economics 51, 435–449.
Diamond, D., 1984. Financial intermediation and delegated monitoring. Review of EconomicStudies 51, 393–414.
Diamond, D., 1991. Monitoring and reputation: The choice between bank loans and directlyplaced debt. Journal of Political Economy 99, 689–721.
Diamond, D., Rajan, R., 2006. Money in a theory of banking. American Economic Review 96,30–53.
Drucker, S., Puri, M., 2008. On loan sales, loan contracting, and lending relationships. forth-coming, Review of Financial Studies.
Duffee, G., Zhou, C., 2001. Credit derivatives in banking: Useful tools for managing risk?Journal of Monetary Economics 48, 25–54.
Ergungor, O., Krishnan, C., Laux, P., Singh, A., Zebedee, A., 2009. Examining bank SEOs:Are offers made by undercapitalized banks different? forthcoming, Journal of FinancialIntermediation.
Fama, E., 1985. What’s different about banks? Journal of Monetary Economics 15, 29–39.
Fama, E., 1998. Market efficiency, long-term returns, and behavioral finance. Journal of Finan-cial Economics 49, 283–306.
Fama, E., French, K., 1993. Common risk factors in the returns on stock and bonds. Journalof Financial Economics 33, 3–56.
Gande, A., Saunders, A., 2008. Are banks still special when there is a secondary market forloans? Vanderbilt University WP.
Gorton, G., Pennacchi, G., 1988. Banks and loan sales: Marketing non-marketable assets.Journal of Monetary Economics 35, 389–411.
Greenspan, A., 2004. Remarks at the American Bankers Association Annual Convention. NewYork, NY.
Gupta, A., Singh, A., Zebedee, A., 2008. Liquidity in the pricing of syndicated loans. Journalof Financial Markets 11, 339–376.
Hoshi, T., Kashyap, A., Scharfstein, D., 1990. The role of banks in reducing the costs of financialdistress in Japan. Journal of Financial Economics 27, 67–88.
Hoshi, T., Kashyap, A., Scharfstein, D., 1991. Corporate structure, liquidity, and investment:Evidence from Japanese industrial groups. Quarterly Journal of Economics 27, 33–60.
James, C., 1987. Some evidence on the uniqueness of bank loans. Journal of Financial Economics19, 217–236.
22

Jegadeesh, N., Titman, S., 1993. Returns to buying winners and selling losers: Implications forstock market efficiency. Journal of Finance 48, 65–91.
Kashyap, A., Stein, J., 2000. What do a million observations on banks say about the transmis-sion of monetary policy? American Economic Review 90, 407–428.
Kooli, M., L’Her, J., Suret, J., 2004. Do IPOs really underperform in the long run? Newevidence from the Canadian stock market. Journal of Private Equity 9, 48–58.
Kothari, S., Warner, J., 2007. Econometrics of event studies. In: Eckbo, E. (Ed.) Handbook ofEmpirical Corporate Finance. North-Holland, Amsterdam. pp. 3–36.
Lummer, S., McConnell, J., 1989. Further evidence on the bank lending process and the capitalmarket response to bank loan agreements. Journal of Financial Economics 25, 99–122.
Lyon, J., Barber, B., Tsai, C., 1999. Improved methods for test of long-run abnormal stockreturns. Journal of Finance 54, 165–201.
Mitchell, M., Stafford, E., 2000. Managerial decisions and long-term stock price performance.Journal of Business 73, 287–320.
Parlour, C., Plantin, G., 2008. Loan sales and relationship banking. Journal of Finance 63,1291–1314.
Pennacchi, G., 1988. Loan sales and the cost of bank capital. Journal of Finance 43, 375–395.
Petersen, M., Rajan, R., 1994. The benefits of lending relationships: Evidence from smallbusiness data. Journal of Finance 49, 3–37.
Rajan, R., 1992. Insiders and outsiders: The choice between informed and arm’s length debt.Journal of Finance 47, 1367–1400.
Ramakrishnan, R., Thakor, A., 1984. Information reliability and a theory of financial interme-diation. Review of Economic Studies 22, 425–432.
Ritter, J., 1991. The long-run performance of initial public offerings. Journal of Finance 46,3–27.
Roll, R., Schwartz, E., Subrahmanyam, A., 2008. Options trading activity and firm valuation.UCLA WP.
Schuermann, T., 2004. Why were banks better off in the 2001 recession? Federal Reserve Bankof New York: Current Issues in Economics and Finance 10, 1–7.
Shleifer, A., Vishny, R., 1997. A survey of corporate governance. Journal of Finance 52, 737–783.
Stein, J., 1998. An adverse-selection model of bank asset and liability management with impli-cations for the transmission of monetary policy. Rand Journal of Economics 29, 466–486.
23

Table 1: Descriptive Statistics This table presents the descriptive statistics for firms withbank loans originated between 2000 and 2004. The first two columns, identified as LIQ, refer tothe subset of borrowers with an active secondary loan market, columns three and four refer tothe subset of borrowers without an active secondary loan market, and the last two columns referto the set of all borrowers. We report the number of firms in each category; firm characteristicssuch as size (market value of equity), total assets, net sales, book leverage, the ratio of netincome to total assets (ROA) and the ratio of net income to revenue (profit margin); and thedistribution of borrowers across industry and median credit quality. All summary statistics arecomputed over the sample period from 2000 to 2007.
LIQ noLIQ All borrowers
Number of firms 309 745 1054
Mean Median Mean Median Mean MedianSize ($m) 3275.48 1130.11 3099.98 388.11 3148.33 579.71Total assets ($m) 5564.35 1944.32 4618.46 479.40 4878.49 793.81Sales ($m) 884.47 362.77 716.77 110.77 762.87 164.23Leverage 0.68 0.69 0.55 0.56 0.58 0.60ROA (%) 0.37 0.66 0.45 0.91 0.43 0.83Profit margin (%) -9.77 3.24 -5.47 3.63 -6.67 3.52
Distribution of borrowers across industry and credit qualityConsumer 0.19 0.27 0.24Manufacturing 0.26 0.22 0.23Technology 0.21 0.19 0.20Healthcare 0.08 0.09 0.09Other industries 0.26 0.24 0.25IG 0.11 0.34 0.24SG 0.89 0.66 0.76
24
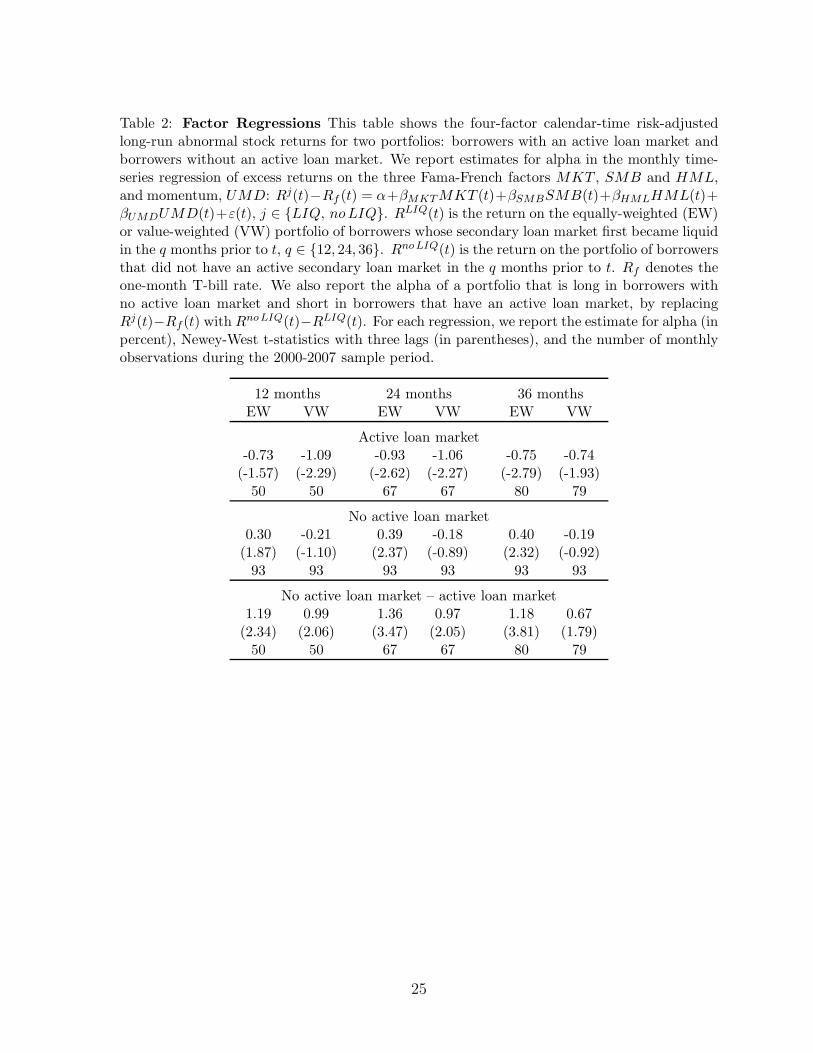
Table 2: Factor Regressions This table shows the four-factor calendar-time risk-adjustedlong-run abnormal stock returns for two portfolios: borrowers with an active loan market andborrowers without an active loan market. We report estimates for alpha in the monthly time-series regression of excess returns on the three Fama-French factors MKT , SMB and HML,and momentum, UMD: Rj(t)−Rf (t) = α+βMKT MKT (t)+βSMBSMB(t)+βHMLHML(t)+βUMDUMD(t)+ε(t), j ∈ {LIQ, noLIQ}. RLIQ(t) is the return on the equally-weighted (EW)or value-weighted (VW) portfolio of borrowers whose secondary loan market first became liquidin the q months prior to t, q ∈ {12, 24, 36}. RnoLIQ(t) is the return on the portfolio of borrowersthat did not have an active secondary loan market in the q months prior to t. Rf denotes theone-month T-bill rate. We also report the alpha of a portfolio that is long in borrowers withno active loan market and short in borrowers that have an active loan market, by replacingRj(t)−Rf (t) with RnoLIQ(t)−RLIQ(t). For each regression, we report the estimate for alpha (inpercent), Newey-West t-statistics with three lags (in parentheses), and the number of monthlyobservations during the 2000-2007 sample period.
12 months 24 months 36 monthsEW VW EW VW EW VW
Active loan market-0.73 -1.09 -0.93 -1.06 -0.75 -0.74
(-1.57) (-2.29) (-2.62) (-2.27) (-2.79) (-1.93)50 50 67 67 80 79
No active loan market0.30 -0.21 0.39 -0.18 0.40 -0.19
(1.87) (-1.10) (2.37) (-0.89) (2.32) (-0.92)93 93 93 93 93 93
No active loan market – active loan market1.19 0.99 1.36 0.97 1.18 0.67
(2.34) (2.06) (3.47) (2.05) (3.81) (1.79)50 50 67 67 80 79
25
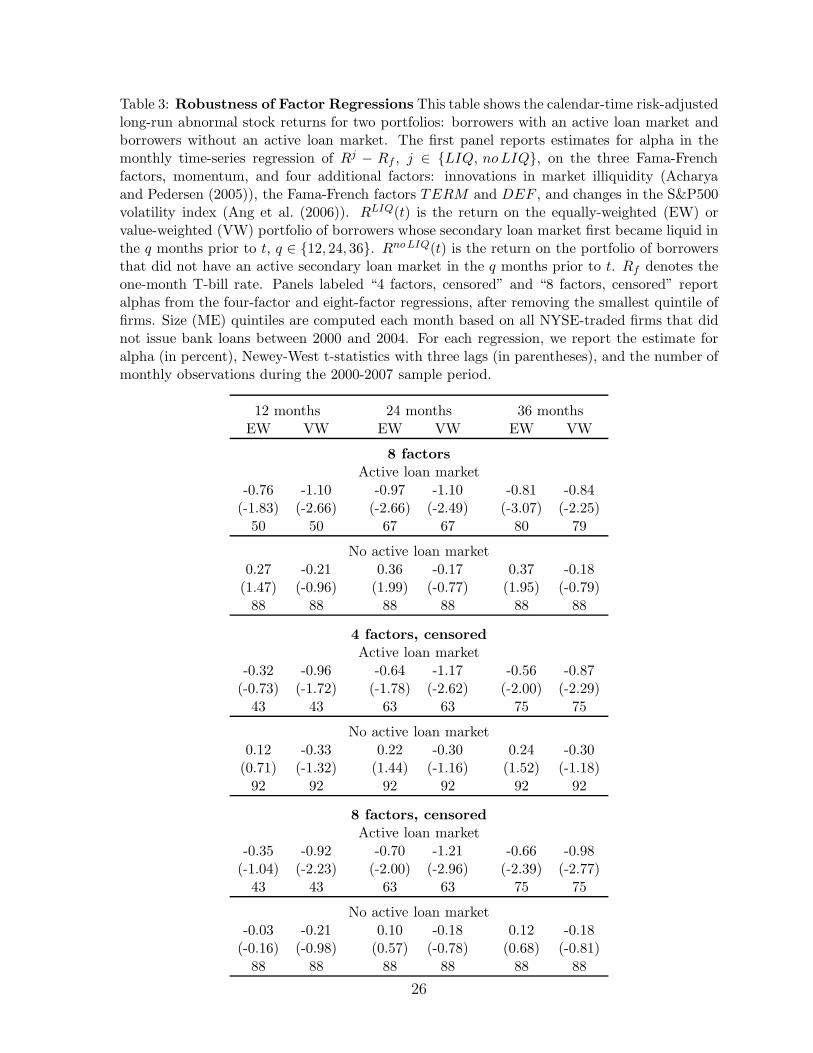
Table 3: Robustness of Factor Regressions This table shows the calendar-time risk-adjustedlong-run abnormal stock returns for two portfolios: borrowers with an active loan market andborrowers without an active loan market. The first panel reports estimates for alpha in themonthly time-series regression of Rj − Rf , j ∈ {LIQ, noLIQ}, on the three Fama-Frenchfactors, momentum, and four additional factors: innovations in market illiquidity (Acharyaand Pedersen (2005)), the Fama-French factors TERM and DEF , and changes in the S&P500volatility index (Ang et al. (2006)). RLIQ(t) is the return on the equally-weighted (EW) orvalue-weighted (VW) portfolio of borrowers whose secondary loan market first became liquid inthe q months prior to t, q ∈ {12, 24, 36}. RnoLIQ(t) is the return on the portfolio of borrowersthat did not have an active secondary loan market in the q months prior to t. Rf denotes theone-month T-bill rate. Panels labeled “4 factors, censored” and “8 factors, censored” reportalphas from the four-factor and eight-factor regressions, after removing the smallest quintile offirms. Size (ME) quintiles are computed each month based on all NYSE-traded firms that didnot issue bank loans between 2000 and 2004. For each regression, we report the estimate foralpha (in percent), Newey-West t-statistics with three lags (in parentheses), and the number ofmonthly observations during the 2000-2007 sample period.
12 months 24 months 36 monthsEW VW EW VW EW VW
8 factorsActive loan market
-0.76 -1.10 -0.97 -1.10 -0.81 -0.84(-1.83) (-2.66) (-2.66) (-2.49) (-3.07) (-2.25)
50 50 67 67 80 79
No active loan market0.27 -0.21 0.36 -0.17 0.37 -0.18
(1.47) (-0.96) (1.99) (-0.77) (1.95) (-0.79)88 88 88 88 88 88
4 factors, censoredActive loan market
-0.32 -0.96 -0.64 -1.17 -0.56 -0.87(-0.73) (-1.72) (-1.78) (-2.62) (-2.00) (-2.29)
43 43 63 63 75 75
No active loan market0.12 -0.33 0.22 -0.30 0.24 -0.30
(0.71) (-1.32) (1.44) (-1.16) (1.52) (-1.18)92 92 92 92 92 92
8 factors, censoredActive loan market
-0.35 -0.92 -0.70 -1.21 -0.66 -0.98(-1.04) (-2.23) (-2.00) (-2.96) (-2.39) (-2.77)
43 43 63 63 75 75
No active loan market-0.03 -0.21 0.10 -0.18 0.12 -0.18
(-0.16) (-0.98) (0.57) (-0.78) (0.68) (-0.81)88 88 88 88 88 88
26

Table 4: Factor Regressions by Size This table shows the four-factor calendar-time risk-adjusted long-run abnormal stock returns for two portfolios: small borrowers with an active loanmarket and small borrowers without an active loan market. We report estimates for alpha in themonthly time-series regression of excess returns on the three Fama-French factors MKT , SMBand HML, and momentum, UMD: Rj(t) − Rf (t) = α + βMKT MKT (t) + βSMBSMB(t) +βHMLHML(t) + βUMDUMD(t) + ε(t), j ∈ {LIQ, noLIQ}. RLIQ(t) is the return on theequally-weighted (EW) or value-weighted (VW) portfolio of borrowers whose secondary loanmarket first became liquid in the q months prior to t, q ∈ {12, 24, 36}. Rno LIQ(t) is the returnon the portfolio of borrowers that did not have an active secondary loan market in the q monthsprior to t. Rf denotes the one-month T-bill rate. For each regression, we report the estimate foralpha (in percent), Newey-West t-statistics with three lags (in parentheses), and the number ofmonthly observations during the 2000-2007 sample period. The second panel shows the resultsfor similar portfolios of large firms. The cutoff point between small and large firms is computedeach month as the median market value of equity of all NYSE-traded firms that did not issuebank loans between 2000 and 2004.
12 months 24 months 36 monthsEW VW EW VW EW VW
Small borrowersActive loan market
0.29 0.71 -0.65 -0.37 -0.53 -0.42(0.46) (1.24) (-1.91) (-0.98) (-2.37) (-1.57)
22 22 53 53 65 65
No active loan market0.36 0.31 0.44 0.43 0.45 0.45
(1.84) (1.08) (2.18) (1.52) (2.15) (1.57)93 93 93 93 93 93
Large borrowersActive loan market
– – 0.14 -0.04 0.29 -0.01(0.76) (-0.20) (1.54) (-0.03)
23 23 45 45
No active loan market-0.01 -0.17 0.10 -0.15 0.11 -0.16
(-0.08) (-0.96) (0.69) (-0.76) (0.81) (-0.81)88 88 88 88 88 88
27

Table 5: Factor Regressions by Rating This table shows the four-factor calendar-time risk-adjusted long-run abnormal stock returns for two portfolios: IG borrowers with an active loanmarket and IG borrowers without an active loan market. We report estimates for alpha in themonthly time-series regression of excess returns on the three Fama-French factors MKT , SMBand HML, and momentum, UMD: Rj(t) − Rf (t) = α + βMKT MKT (t) + βSMBSMB(t) +βHMLHML(t) + βUMDUMD(t) + ε(t), j ∈ {LIQ, noLIQ}. RLIQ(t) is the return on theequally-weighted (EW) or value-weighted (VW) portfolio of borrowers whose secondary loanmarket first became liquid in the q months prior to t, q ∈ {12, 24, 36}. Rno LIQ(t) is the returnon the portfolio of borrowers that did not have an active secondary loan market in the q monthsprior to t. Rf denotes the one-month T-bill rate. For each regression, we report the estimate foralpha (in percent), Newey-West t-statistics with three lags (in parentheses), and the number ofmonthly observations during the 2000-2007 sample period. The second panel shows the resultsfor similar portfolios of SG firms.
12 months 24 months 36 monthsEW VW EW VW EW VW
IG borrowersActive loan market
– – 0.24 -0.17 0.29 -0.28(0.49) (-0.31) (1.23) (-0.91)
25 25 52 52
No active loan market0.36 0.03 0.37 0.04 0.36 0.03
(2.63) (0.16) (2.75) (0.23) (2.62) (0.18)90 90 90 90 90 90
SG borrowersActive loan market
-0.12 -0.34 -0.92 -1.41 -0.78 -1.11(-0.17) (-0.53) (-2.30) (-2.47) (-2.64) (-2.38)
29 29 62 62 74 74
No active loan market-0.11 -0.38 0.17 -0.19 0.22 -0.18
(-0.54) (-1.18) (0.88) (-0.54) (0.97) (-0.48)84 84 82 82 82 82
28

Table 6: Factor Regressions by Leverage This table shows the four-factor calendar-time risk-adjusted long-run abnormal stock returns for two portfolios: low-leverage borrow-ers with an active loan market and low-leverage borrowers without an active loan mar-ket. We report estimates for alpha in the monthly time-series regression of excess re-turns on the three Fama-French factors MKT , SMB and HML, and momentum, UMD:Rj(t)−Rf (t) = α + βMKT MKT (t) + βSMBSMB(t) + βHMLHML(t) + βUMDUMD(t) + ε(t),j ∈ {LIQ, noLIQ}. RLIQ(t) is the return on the equally-weighted (EW) or value-weighted(VW) portfolio of borrowers whose secondary loan market first became liquid in the q monthsprior to t, q ∈ {12, 24, 36}. Rno LIQ(t) is the return on the portfolio of borrowers that did nothave an active secondary loan market in the q months prior to t. Rf denotes the one-monthT-bill rate. For each regression, we report the estimate for alpha (in percent), Newey-Westt-statistics with three lags (in parentheses), and the number of monthly observations duringthe 2000-2007 sample period. The second panel shows the results for similar portfolios of high-leverage firms. The cutoff point between low-leverage and high-leverage firms is computed eachmonth as the median book leverage of all NYSE-traded firms that did not issue bank loansbetween 2000 and 2004.
12 months 24 months 36 monthsEW VW EW VW EW VW
Low leverageActive loan market
0.29 -0.53 -0.25 -0.56 -0.01 -0.16(0.49) (-0.88) (-0.55) (-0.92) (-0.02) (-0.31)
33 33 67 67 78 78
No active loan market0.41 -0.32 0.45 -0.29 0.43 -0.32
(1.68) (-0.85) (1.84) (-0.76) (1.75) (-0.83)94 94 94 94 94 94
High leverageActive loan market
0.10 -0.22 -0.94 -1.12 -0.89 -0.97(0.24) (-0.49) (-3.05) (-2.41) (-3.34) (-2.46)
26 26 61 61 73 73
No active loan market0.28 -0.01 0.40 0.03 0.44 0.05
(1.44) (-0.03) (1.99) (0.15) (2.15) (0.21)92 92 92 92 92 92
29

Table 7: Mean Calendar-Time Abnormal Returns This table shows the long-run meancalendar-time abnormal stock returns (MCTARs) for two portfolios: borrowers with an ac-tive loan market and borrowers without an active loan market. For each calendar month,the abnormal return for each borrower is calculated relative to the returns on the 125 refer-ence portfolios based on size (market value of equity), book-to-market ratio, and momentum:CTARi(t) = Ri(t) − Ri,ref(t). The reference portfolio return is the equally-weighted (EW)or value-weighted (VW) return on the portfolio of reference stocks. Reference portfolio stocksmust have entered the Compustat database at least two years prior to the inclusion of the firminto the portfolio, and exclude firms that issued bank loans between 2000 and 2004. In each cal-endar month t, a weighted abnormal return is calculated as CTARj(t) =
∑i wi(t)CTARi(t),
j ∈ {LIQ, noLIQ}. CTARLIQ(t) denotes the weighted calendar-time abnormal return onthe portfolio of borrowers whose secondary loan market first became liquid in the q monthsprior to t, q ∈ {12, 24, 36}. CTARnoLIQ(t) is the return on the portfolio of borrowers thatdid not have an active secondary loan market in the q months prior to t. A grand meanabnormal monthly return is calculated as MCTARj = 1/T
∑Tt=1 CTARj(t). T-statistics (in
parentheses) and the number of monthly observations during the 2000-2007 sample period areprovided with each estimate. The last three rows report the results for the average differencein calendar-time abnormal returns between the portfolio of borrowers without an active loanmarket and the portfolio of borrowers that have an active loan market, by replacing CTARj(t)with CTARnoLIQ(t)−CTARLIQ(t).
12 months 24 months 36 monthsEW VW EW VW EW VW
Active loan market-0.85 -1.37 -0.87 -0.99 -0.85 -0.73
(-1.69) (-2.62) (-2.55) (-2.80) (-3.17) (-2.50)37 37 64 64 76 76
No active loan market-0.15 -0.07 -0.10 -0.05 -0.08 -0.06
(-0.95) (-0.26) (-0.63) (-0.20) (-0.50) (-0.21)93 93 93 93 93 93
No active loan market – active loan market0.47 1.16 0.67 0.91 0.76 0.70
(1.11) (2.71) (2.05) (2.67) (2.91) (2.46)37 37 64 64 76 76
30

Table 8: Cumulative Abnormal Returns This table shows the 12, 24 and 36-month cumu-lative abnormal stock returns (CARs) for two portfolios: borrowers with an active loan marketand borrowers without an active loan market. CAR is computed using the Lyon et al. (1999)reference portfolio method, with 125 reference portfolios based on size (market value of equity),book-to-market ratio, and momentum. The reference portfolio return is the equally-weighted(EW) or value-weighted (VW) return on the portfolio of reference stocks. Reference portfoliostocks must have entered the Compustat database at least two years prior to the inclusion ofthe firm into the portfolio, and exclude firms that issued bank loans between 2000 and 2004.The first panel reports results for continuously rebalanced reference portfolios, whereas in thesecond panel reference portfolios are not allowed to update. For each portfolio, we report theestimate for CAR (in percent), its skewness-adjusted t-statistic (in parenthesis) as discussedin Barber and Lyon (1997), and the number of firms in the portfolio. For borrowers without anactive loan market, we randomly draw 1000 samples of event dates on or after the firm’s firstloan origination date, and show the median of the statistics. The last two rows of each panelreport the median, across the 1000 simulations, of the difference in the cumulative abnormalreturns between the portfolios of borrowers without an active loan market and the portfolio ofborrowers that have an active loan market, as well as the median of the associated two-samplet-test statistics with unpooled variances.
12 months 24 months 36 monthsEW VW EW VW EW VW
Rebalanced reference portfoliosActive loan market
-4.70 -8.42 -8.89 -10.44 -11.62 -7.36(-1.30) (-3.22) (-1.93) (-3.23) (-2.21) (-1.95)
187 187 187 187 182 182
No active loan market-0.73 1.09 -0.64 2.43 0.50 3.80
(-0.39) (0.98) (-0.25) (1.60) (0.17) (2.09)507 507 515 515 524 524
No active loan market – active loan market3.97 9.51 8.25 12.87 12.12 11.15
(0.98) (3.35) (1.57) (3.60) (2.00) (2.67)
Reference portfolios not rebalancedActive loan market
-3.14 -5.53 -6.15 -7.74 -5.43 -4.44(-0.87) (-2.09) (-1.31) (-2.33) (-0.99) (-1.15)
187 187 187 187 182 182
No active loan market0.07 2.13 0.82 5.10 2.46 8.18
(0.04) (1.91) (0.31) (3.32) (0.80) (4.44)507 507 515 515 524 524
No active loan market – active loan market3.21 7.66 6.97 12.85 7.89 12.62
(0.79) (2.67) (1.30) (3.52) (1.26) (2.95)
31

Table 9: Buy-and-Hold Abnormal Returns This table shows the 12, 24 and 36-monthbuy-and-hold abnormal stock returns (BHARs) for two portfolios: borrowers with an activeloan market and borrowers without an active loan market. BHAR is computed using the Lyonet al. (1999) reference portfolio method, with 125 reference portfolios based on size (marketvalue of equity), book-to-market ratio, and momentum. The reference portfolio return is theequally-weighted (EW) or value-weighted (VW) return on the portfolio of reference stocks.Reference portfolio stocks must have entered the Compustat database at least two years priorto the inclusion of the firm into the portfolio, and exclude firms that issued bank loans between2000 and 2004. The first panel reports results for continuously rebalanced reference portfolios,whereas in the second panel reference portfolios are not allowed to update. For each portfolio,we report the estimate for BHAR (in percent), its skewness-adjusted t-statistic (in parenthesis)as discussed in Barber and Lyon (1997), and the number of firms in the portfolio. For borrowerswithout an active loan market, we randomly draw 1000 samples of event dates on or after thefirm’s first loan origination date, and show the median of the statistics. The last two rows ofeach panel report the median, across the 1000 simulations, of the difference in the buy-and-hold abnormal returns between the portfolio of borrowers without an active loan market andthe portfolio of borrowers with an active loan market, as well as the median of the associatedtwo-sample t-test statistics with unpooled variances.
12 months 24 months 36 monthsEW VW EW VW EW VW
Rebalanced reference portfoliosActive loan market
-3.60 -6.96 -3.92 -9.45 -13.63 -9.64(-0.93) (-0.60) (-0.65) (-0.64) (-1.34) (-0.39)
187 187 187 187 182 182
No active loan market-1.40 1.18 -3.40 2.89 -4.19 4.86
(-0.49) (0.32) (-0.69) (0.45) (-0.53) (0.53)507 507 515 515 524 524
No active loan market – active loan market2.20 8.14 0.52 12.34 9.44 14.50
(0.47) (0.84) (0.07) (0.92) (0.74) (0.71)
Reference portfolios not rebalancedActive loan market
-0.92 -2.79 2.82 -2.72 4.80 0.13(-0.25) (-0.17) (0.54) (-0.07) (0.63) (0.13)
187 187 187 187 182 182
No active loan market0.82 2.34 3.78 6.69 8.29 11.28
(0.35) (0.62) (0.94) (1.11) (1.40) (1.36)507 507 515 515 524 524
No active loan market – active loan market1.74 5.13 0.96 9.41 3.49 11.15
(0.40) (0.52) (0.14) (0.69) (0.33) (0.56)
32

Table 10: Valuation Analysis We report results for two models of long-run changes in firmvaluation: (I) the 36-month-ahead difference in Tobin’s q of borrowers relative to a referencegroup using levels of firm valuation, and (II) the 36-month-ahead difference in Tobin’s q ofborrowers relative to a reference group using changes in firm valuation. Besides 36 months, wealso report results for 12-month-ahead and 24-month-ahead differences. For both models, thereference group is two-digit SIC code and valuation matched. The table is divided into threepanels. The first panel shows results for firms with an active loan market, whereas the secondpanel reports the results for borrowers without an active loan market. For each of these twopanels, the first and second row show the average difference in 36-month-ahead Tobin’s q (inpercent) and the associated t-statistic, respectively. Rows three and four report the mediandifference in 36-month-ahead Tobin’s q (in percent) and the p-value of the associated Wilcoxonsigned rank test statistic. Row five reports the number of firms in the test sample. For thesecond panel, we report the median statistics over 1000 simulations of event dates on or afterthe firm’s first loan origination date. The third panel of the table reports the median, overthe 1000 simulations, of the difference between the abnormal valuation estimate for the no-active-loan-market group minus that of the active-loan-market group (in percent), as well asthe median of the associated two-sample t-test statistics with unpooled variances.
12 months 24 months 36 monthsI II I II I II
Active loan market-2.80 -2.98 -1.02 -1.43 -11.49 -14.02
(-1.01) (-0.88) (-0.25) (-0.35) (-2.50) (-2.84)-2.11 -3.83 -0.27 -2.17 -6.56 -7.43[0.09] [0.04] [0.89] [0.52] [0.02] [0.01]187 187 169 169 151 151
No active loan market2.07 0.86 2.45 1.28 3.06 1.63
(0.69) (0.29) (0.71) (0.37) (0.74) (0.38)-1.02 -1.13 -1.52 -1.93 -1.83 -2.32[0.54] [0.45] [0.55] [0.39] [0.53] [0.36]458 458 429 429 396 396
No active loan market – active loan market4.88 3.85 3.46 2.71 14.55 15.64
(1.20) (0.86) (0.66) (0.50) (2.35) (2.40)
33

AAA AA A BBB BB B CCC CC C0
25
50
Borrowers with an active loan market
Per
cent
age
of fi
rms
Median rating
AAA AA A BBB BB B CCC CC C0
25
50
Borrowers without an active loan market
Per
cent
age
of fi
rms
Median rating
AAA AA A BBB BB B CCC CC C0
25
50
All borrowers
Per
cent
age
of fi
rms
Median rating
Figure 1: Distribution of the median long-term S&P credit rating for borrowers with an activesecondary loan market (LIQ), for borrows without an active secondary loan market (noLIQ)and for all borrowers, over the sample period from 2000 to 2007.
34

0 12 24 36
0
0.1
0.2
0.3
0.4
0.5
0.6
Cum
ulat
ive
wei
ghte
d re
turn
(pe
rcen
t)
Months
EW, rebalanced
LIQRP (LIQ)no LIQRP (no LIQ)
0 12 24 36
0
0.1
0.2
0.3
0.4
0.5
0.6
Cum
ulat
ive
wei
ghte
d re
turn
(pe
rcen
t)
Months
EW, not rebalanced
LIQRP (LIQ)no LIQRP (no LIQ)
0 12 24 36
0
0.1
0.2
0.3
0.4
0.5
0.6
Cum
ulat
ive
wei
ghte
d re
turn
(pe
rcen
t)
Months
VW, rebalanced
LIQRP (LIQ)no LIQRP (no LIQ)
0 12 24 36
0
0.1
0.2
0.3
0.4
0.5
0.6
Cum
ulat
ive
wei
ghte
d re
turn
(pe
rcen
t)
Months
VW, not rebalanced
LIQRP (LIQ)no LIQRP (no LIQ)
Figure 2: Event-time cumulative weighted returns for borrowers with an active loan market(LIQ), their reference portfolios (RP (LIQ)), for borrowers without an active loan market(noLIQ), and their reference portfolios (RP (noLIQ)). The latter two are computed as themedian cumulative weighted returns across 1000 simulations of event dates on or after the firm’sfirst loan origination date.
35