morbidity and mortality weekly report · pdf filemorbidity and mortality weekly report ......
TRANSCRIPT

Morbidity and Mortality Weekly Report
Weekly July 21, 2006 / Vol. 55 / No. 28
depardepardepardepardepartment of health and human sertment of health and human sertment of health and human sertment of health and human sertment of health and human servicesvicesvicesvicesvicesCenters for Disease Control and PreventionCenters for Disease Control and PreventionCenters for Disease Control and PreventionCenters for Disease Control and PreventionCenters for Disease Control and Prevention
INSIDE
772 Progress Toward Poliomyelitis Eradication — India,January 2005–June 2006
776 Pseudomonas aeruginosa Infections Associated withTransrectal Ultrasound-Guided Prostate Biopsies —Georgia, 2005
777 West Nile Virus Activity — United States,January 1–July 18, 2006
778 Notices to Readers779 QuickStats
Trends in Strength Training — United States, 1998–2004Strength training is physical activity intended to increase
muscle strength and mass. Adults who engage in strength train-ing are less likely to experience loss of muscle mass (1), func-tional decline (2), and fall-related injuries than adults who donot strength train (3). Studies on strength-training interven-tions have indicated that inactive older adults who begin regu-lar strength training achieve substantial strength gains withina few months (4). Because certain health benefits are linkedto strength training, a national health objective for 2010 is toincrease to 30% the proportion of adults who perform physi-cal activities that enhance and maintain muscular strength andendurance on >2 days per week (objective 22-4) (5). Thisobjective is also recommended by the American College ofSports Medicine (6). CDC analyzed 1998–2004 data fromthe National Health Interview Survey (NHIS) (7) to deter-mine the annual prevalence of strength training among U.S.adults by age group and race/ethnicity. This report describesthe results of that analysis, which demonstrated that althoughthe national prevalence of strength training for U.S. adultsincreased slightly during 1998–2004, only 21.9% of men and17.5% of women (age adjusted) in 2004 reported strengthtraining two or more times per week. This is substantially lowerthan the national 2010 objective of 30% and underscores theneed for additional programs to increase strength trainingamong adults.
NHIS consists of face-to-face interviews regarding healthstatus, use of health-care services, and health behaviors of theU.S. civilian, noninstitutionalized population. Data onstrength training were collected every year during 1998–2004.The sample size ranged from 30,801 (1999) to 33,326 (2001),and the response rate ranged from 69.6% (1999) to 74.3%(2002) (7). Respondents were asked to report the frequencywith which they engaged in strength training by answeringthe following question: “How often do you do physicalactivities designed to strengthen your muscles, such as lifting
weights or doing calisthenics?” The same question was askedeach year and was available in Spanish for Spanish-speakingrespondents beginning in 1999. Respondents were categorizedas meeting the national strength training objective if theyengaged in strength training two or more times per week (5).Prevalence estimates by age and sex were weighted to accountfor nonresponse and were age adjusted to the 2000 U.S. stan-dard population (8). Statistical software was used to accountfor the complex sampling design of the survey. Pairwise com-parisons were performed to calculate t statistics, and differ-ences were considered significant at p<0.05. When multiplecomparisons were made, the Bonferroni adjustment was used(p<0.05 / number of comparisons). Only significant differ-ences are reported in the results.
The age-adjusted prevalence of reported strength trainingtwo or more times per week among all respondents increasedsignificantly, from 17.7% in 1998 to 19.6% in 2004. Thedifference between 1998 and 2004 was significant for womenbut not for men (Figure). In 2004, the age-adjusted preva-lence of those who met recommended levels of strength train-ing was significantly higher among men than women (21.9%versus 17.5%, respectively).
In 2004, strength training was least prevalent among thoseaged >65 years (14.1% among men; 10.7% among women).

770 MMWR July 21, 2006
Centers for Disease Control and PreventionJulie L. Gerberding, MD, MPH
DirectorTanja Popovic, MD, PhD
(Acting) Chief Science OfficerJames W. Stephens, PhD
(Acting) Associate Director for ScienceSteven L. Solomon, MD
Director, Coordinating Center for Health Information and ServiceJay M. Bernhardt, PhD, MPH
Director, National Center for Health MarketingJudith R. Aguilar
(Acting) Director, Division of Health Information Dissemination (Proposed)
Editorial and Production StaffFrederic E. Shaw, MD, JD
(Acting) Editor, MMWR SeriesSuzanne M. Hewitt, MPA
Managing Editor, MMWR SeriesDouglas W. Weatherwax
(Acting) Lead Technical Writer-EditorCatherine H. Bricker, MS
Jude C. RutledgeWriters-Editors
Beverly J. HollandLead Visual Information Specialist
Lynda G. CupellMalbea A. LaPete
Visual Information SpecialistsQuang M. Doan, MBA
Erica R. ShaverInformation Technology Specialists
Editorial BoardWilliam L. Roper, MD, MPH, Chapel Hill, NC, Chairman
Virginia A. Caine, MD, Indianapolis, INDavid W. Fleming, MD, Seattle, WA
William E. Halperin, MD, DrPH, MPH, Newark, NJMargaret A. Hamburg, MD, Washington, DC
King K. Holmes, MD, PhD, Seattle, WADeborah Holtzman, PhD, Atlanta, GA
John K. Iglehart, Bethesda, MDDennis G. Maki, MD, Madison, WI
Sue Mallonee, MPH, Oklahoma City, OKStanley A. Plotkin, MD, Doylestown, PA
Patricia Quinlisk, MD, MPH, Des Moines, IAPatrick L. Remington, MD, MPH, Madison, WI
Barbara K. Rimer, DrPH, Chapel Hill, NCJohn V. Rullan, MD, MPH, San Juan, PR
Anne Schuchat, MD, Atlanta, GADixie E. Snider, MD, MPH, Atlanta, GA
John W. Ward, MD, Atlanta, GA
The MMWR series of publications is published by the CoordinatingCenter for Health Information and Service, Centers for DiseaseControl and Prevention (CDC), U.S. Department of Health andHuman Services, Atlanta, GA 30333.
Suggested Citation: Centers for Disease Control and Prevention.[Article title]. MMWR 2006;55:[inclusive page numbers].
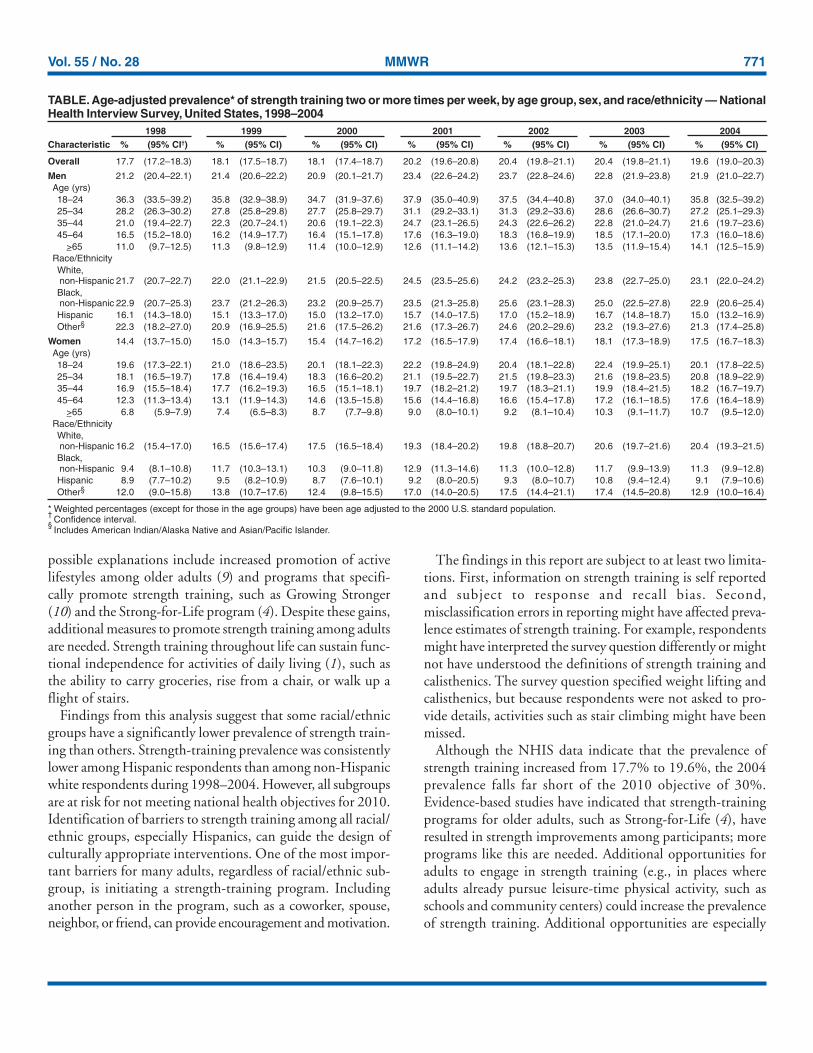
Prevalence of strength training among men and womendecreased significantly as age increased (p<0.001) (Table).However, men aged >65 years had a significant increase inprevalence during 1998–2004, and women aged 25–34, 45–64, and >65 years had significant increases during the sameperiod.
During 1998–2004, the prevalence of strength trainingincreased significantly among non-Hispanic white men andwomen. In 2004, the prevalence of strength training amongmen was similar for non-Hispanic whites (23.1%), non-Hispanic blacks (22.9%), and those classified as “other”(21.3%). Strength training was least prevalent among His-panic men (15.0%). In 2004, strength training among womenwas significantly higher among non-Hispanic whites (20.4%)than among non-Hispanic blacks (11.3%), Hispanics (9.1%),and those classified as “other” (12.9%).Reported by: J Kruger, PhD, S Carlson, MPH, H Kohl III, PhD, Divof Nutrition and Physical Activity, National Center for Chronic DiseasePrevention and Health Promotion, CDC.
Editorial Note: The findings in this report demonstrate thatthe national prevalence of strength training for U.S. adultsincreased slightly during 1998–2004. Nonetheless, only 21.9%of men and 17.5% of women (age adjusted) in 2004 reportedstrength training two or more times per week, which is sub-stantially lower than the national 2010 objective of 30%. Inaddition, the greatest yearly increase was from 2000 to 2001(p<0.001); however, since 2001, no further progress has beenmade. Although women experienced a significant increaseduring 1998–2004 and men did not, overall strength traininglevels among women remained lower than among men.
The prevalence of strength training was lowest amongrespondents aged >65 years; nonetheless, respondents in thisage group experienced the largest increase overall during 1998–2004. The factors that led to the increase in strength trainingin this group cannot be determined from this analysis, but
FIGURE. Age-adjusted prevalence* of strength training twoor more times per week, by sex and survey year — NationalHealth Interview Survey, United States, 1998–2004
0
10
20
30
40
1998 1999 2000 2001 2002 2003 2004
Year
Per
cent
age
OverallMenWomen2010 goal
* Weighted percentages have been age adjusted to the 2000 U.S. standard population.
Vol. 55 / No. 28 MMWR 771
possible explanations include increased promotion of activelifestyles among older adults (9) and programs that specifi-cally promote strength training, such as Growing Stronger(10) and the Strong-for-Life program (4). Despite these gains,additional measures to promote strength training among adultsare needed. Strength training throughout life can sustain func-tional independence for activities of daily living (1), such asthe ability to carry groceries, rise from a chair, or walk up aflight of stairs.
Findings from this analysis suggest that some racial/ethnicgroups have a significantly lower prevalence of strength train-ing than others. Strength-training prevalence was consistentlylower among Hispanic respondents than among non-Hispanicwhite respondents during 1998–2004. However, all subgroupsare at risk for not meeting national health objectives for 2010.Identification of barriers to strength training among all racial/ethnic groups, especially Hispanics, can guide the design ofculturally appropriate interventions. One of the most impor-tant barriers for many adults, regardless of racial/ethnic sub-group, is initiating a strength-training program. Includinganother person in the program, such as a coworker, spouse,neighbor, or friend, can provide encouragement and motivation.
The findings in this report are subject to at least two limita-tions. First, information on strength training is self reportedand subject to response and recall bias. Second,misclassification errors in reporting might have affected preva-lence estimates of strength training. For example, respondentsmight have interpreted the survey question differently or mightnot have understood the definitions of strength training andcalisthenics. The survey question specified weight lifting andcalisthenics, but because respondents were not asked to pro-vide details, activities such as stair climbing might have beenmissed.
Although the NHIS data indicate that the prevalence ofstrength training increased from 17.7% to 19.6%, the 2004prevalence falls far short of the 2010 objective of 30%.Evidence-based studies have indicated that strength-trainingprograms for older adults, such as Strong-for-Life (4), haveresulted in strength improvements among participants; moreprograms like this are needed. Additional opportunities foradults to engage in strength training (e.g., in places whereadults already pursue leisure-time physical activity, such asschools and community centers) could increase the prevalenceof strength training. Additional opportunities are especially
TABLE. Age-adjusted prevalence* of strength training two or more times per week, by age group, sex, and race/ethnicity — NationalHealth Interview Survey, United States, 1998–2004
1998 1999 2000 2001 2002 2003 2004Characteristic % (95% CI†) % (95% CI) % (95% CI) % (95% CI) % (95% CI) % (95% CI) % (95% CI)
Overall 17.7 (17.2–18.3) 18.1 (17.5–18.7) 18.1 (17.4–18.7) 20.2 (19.6–20.8) 20.4 (19.8–21.1) 20.4 (19.8–21.1) 19.6 (19.0–20.3)
Men 21.2 (20.4–22.1) 21.4 (20.6–22.2) 20.9 (20.1–21.7) 23.4 (22.6–24.2) 23.7 (22.8–24.6) 22.8 (21.9–23.8) 21.9 (21.0–22.7)Age (yrs)18–24 36.3 (33.5–39.2) 35.8 (32.9–38.9) 34.7 (31.9–37.6) 37.9 (35.0–40.9) 37.5 (34.4–40.8) 37.0 (34.0–40.1) 35.8 (32.5–39.2)25–34 28.2 (26.3–30.2) 27.8 (25.8–29.8) 27.7 (25.8–29.7) 31.1 (29.2–33.1) 31.3 (29.2–33.6) 28.6 (26.6–30.7) 27.2 (25.1–29.3)35–44 21.0 (19.4–22.7) 22.3 (20.7–24.1) 20.6 (19.1–22.3) 24.7 (23.1–26.5) 24.3 (22.6–26.2) 22.8 (21.0–24.7) 21.6 (19.7–23.6)45–64 16.5 (15.2–18.0) 16.2 (14.9–17.7) 16.4 (15.1–17.8) 17.6 (16.3–19.0) 18.3 (16.8–19.9) 18.5 (17.1–20.0) 17.3 (16.0–18.6)
>65 11.0 (9.7–12.5) 11.3 (9.8–12.9) 11.4 (10.0–12.9) 12.6 (11.1–14.2) 13.6 (12.1–15.3) 13.5 (11.9–15.4) 14.1 (12.5–15.9)Race/EthnicityWhite,non-Hispanic 21.7 (20.7–22.7) 22.0 (21.1–22.9) 21.5 (20.5–22.5) 24.5 (23.5–25.6) 24.2 (23.2–25.3) 23.8 (22.7–25.0) 23.1 (22.0–24.2)Black,non-Hispanic 22.9 (20.7–25.3) 23.7 (21.2–26.3) 23.2 (20.9–25.7) 23.5 (21.3–25.8) 25.6 (23.1–28.3) 25.0 (22.5–27.8) 22.9 (20.6–25.4)Hispanic 16.1 (14.3–18.0) 15.1 (13.3–17.0) 15.0 (13.2–17.0) 15.7 (14.0–17.5) 17.0 (15.2–18.9) 16.7 (14.8–18.7) 15.0 (13.2–16.9)Other§ 22.3 (18.2–27.0) 20.9 (16.9–25.5) 21.6 (17.5–26.2) 21.6 (17.3–26.7) 24.6 (20.2–29.6) 23.2 (19.3–27.6) 21.3 (17.4–25.8)
Women 14.4 (13.7–15.0) 15.0 (14.3–15.7) 15.4 (14.7–16.2) 17.2 (16.5–17.9) 17.4 (16.6–18.1) 18.1 (17.3–18.9) 17.5 (16.7–18.3)Age (yrs)18–24 19.6 (17.3–22.1) 21.0 (18.6–23.5) 20.1 (18.1–22.3) 22.2 (19.8–24.9) 20.4 (18.1–22.8) 22.4 (19.9–25.1) 20.1 (17.8–22.5)25–34 18.1 (16.5–19.7) 17.8 (16.4–19.4) 18.3 (16.6–20.2) 21.1 (19.5–22.7) 21.5 (19.8–23.3) 21.6 (19.8–23.5) 20.8 (18.9–22.9)35–44 16.9 (15.5–18.4) 17.7 (16.2–19.3) 16.5 (15.1–18.1) 19.7 (18.2–21.2) 19.7 (18.3–21.1) 19.9 (18.4–21.5) 18.2 (16.7–19.7)45–64 12.3 (11.3–13.4) 13.1 (11.9–14.3) 14.6 (13.5–15.8) 15.6 (14.4–16.8) 16.6 (15.4–17.8) 17.2 (16.1–18.5) 17.6 (16.4–18.9)
>65 6.8 (5.9–7.9) 7.4 (6.5–8.3) 8.7 (7.7–9.8) 9.0 (8.0–10.1) 9.2 (8.1–10.4) 10.3 (9.1–11.7) 10.7 (9.5–12.0)Race/EthnicityWhite,non-Hispanic 16.2 (15.4–17.0) 16.5 (15.6–17.4) 17.5 (16.5–18.4) 19.3 (18.4–20.2) 19.8 (18.8–20.7) 20.6 (19.7–21.6) 20.4 (19.3–21.5)Black,non-Hispanic 9.4 (8.1–10.8) 11.7 (10.3–13.1) 10.3 (9.0–11.8) 12.9 (11.3–14.6) 11.3 (10.0–12.8) 11.7 (9.9–13.9) 11.3 (9.9–12.8)Hispanic 8.9 (7.7–10.2) 9.5 (8.2–10.9) 8.7 (7.6–10.1) 9.2 (8.0–20.5) 9.3 (8.0–10.7) 10.8 (9.4–12.4) 9.1 (7.9–10.6)Other§ 12.0 (9.0–15.8) 13.8 (10.7–17.6) 12.4 (9.8–15.5) 17.0 (14.0–20.5) 17.5 (14.4–21.1) 17.4 (14.5–20.8) 12.9 (10.0–16.4)
* Weighted percentages (except for those in the age groups) have been age adjusted to the 2000 U.S. standard population.†
Confidence interval.§
Includes American Indian/Alaska Native and Asian/Pacific Islander.

772 MMWR July 21, 2006
important for racial/ethnic groups with lower prevalences (9).The findings in this report also underscore the need toincrease education on the benefits of strength training amongtargeted adult populations.References
1. Seguin R, Nelson ME. The benefits of strength training for older adults.Am Prev Med 2003;25(Suppl 2):S14–9.
2. Chandler JM, Duncan PW, Kochersberger G, Studenski S. Is lowerextremity strength gain associated with improvement in physical per-formance and disability in frail, community-dwelling elders? Arch PhyMed Rehabil 1998;79:24–30.
3. Butler M, Norton R, Lee-Joe T, Coggan C. Preventing falls and fall-related injuries among older people living in institutions: current prac-tice and future opportunities. NZ Med J 1998;111:359–61.
4. Jette A, Lachman M, Giorgetti M, et al. Exercise: it’s never too late:the strong-for-life program. Am J Public Health 1999;89:66–72.
5. US Department of Health and Human Services. Healthy people 2010,2nd ed. With understanding and improving health and objectives forimproving health. 2 vols. Washington, DC: US Government PrintingOffice; 2000.
6. American College of Sports Medicine. American College of SportsMedicine Position Stand. The recommended quantity and quality ofexercise for developing and maintaining cardiorespiratory and muscu-lar fitness, and flexibility in healthy adults. Med Sci Sports Exerc1998;30:975–91.
7. US Department of Health and Human Services. National HealthInterview Survey (NHIS): public use data release. Hyattsville, MD:US Department of Health and Human Services; 2006. Available athttp://www.cdc.gov/nchs/nhis.htm.
8. Klein RJ, Shoenborn CA. Age adjustment using the 2000 projectedU.S. population. Healthy people statistical notes, No. 20. Hyattsville,MD: National Center for Health Statistics; 2001.
9. Robert Wood Johnson Foundation. National blueprint: increasingphysical activity among adults age 50 and older. Princeton, NJ: RobertWood Johnson Foundation; 2001.
10. Seguin R, Epping J, Bloch R, Buchner D, Nelson M. Growing stron-ger: strength training for older adults. Washington, DC: Tufts Univer-sity; 2002. Available at http://www.cdc.gov/nccdphp/dnpa/physical/growing_stronger/growing_stronger.pdf.
Progress Toward PoliomyelitisEradication — India,
January 2005–June 2006The global eradication of poliomyelitis has reached a criti-
cal stage. The disease remains endemic in only four countries(Afghanistan, India, Nigeria, and Pakistan), which havereported most of the cases in 2006 (1). India is the most popu-lous of the polio-endemic countries. Beginning in 2005, theGovernment of India (GOI) and its partners intensified eradi-cation efforts by implementing additional immunization andsurveillance strategies, including introduction of monovalentoral poliovirus vaccine types 1 and 3 (mOPV1 and mOPV3,
respectively)* (2). The number of reported cases decreased from134 in 2004 to 66 in 2005. However, cases have resurged in2006; as of June 25, 2006, a total of 60 cases had been reported.Although intense local transmission continues in certainareas (i.e., western Uttar Pradesh [UP]), interruption of wildpoliovirus (WPV) transmission in India is feasible with con-tinued effective interventions. This report summarizes progresstoward polio eradication in India from January 2005 throughJune 2006.
Acute Flaccid Paralysis (AFP) SurveillanceAFP surveillance is essential to polio eradication. AFP sur-
veillance in India continues at high levels of sensitivity, withsurveillance indicators above current World Health Organi-zation (WHO) operational targets.† In UP and Bihar, the onlytwo Indian states where polio remains endemic, the annualnonpolio AFP rate was >10 cases per 100,000 population aged<15 years, and adequate stool specimen collection was above80% from January 2005 through June 2006.
Virologic testing of stool specimens from AFP patients inIndia is conducted at eight national laboratories, all of whichare accredited by WHO as part of the Global Polio Labora-tory Network (3). Despite an increased workload (55,535specimens tested in 2005 compared with 35,885 in 2004),the laboratories sustained high levels of performance. Resultsof primary virus isolation were communicated to India’sNational Polio Surveillance Project within 28 days of speci-men receipt at the laboratory for 99% of specimens tested in2005. The mean interval from receipt of primary cultureresults to final poliovirus categorization (i.e., wild or vaccinerelated) was 6 days.
WPV EpidemiologyIndia reported 66 polio cases from 35 districts with onset of
paralysis in 2005, of which 62 (94%) were WPV type 1(WPV1) and four (6%) were WPV type 3 (WPV3). All fourWPV3 cases occurred in UP.
* mOPV contains polio vaccine virus against either WPV type 1 or type 3 only;it does not provide protection against other WPV types. mOPV does providegreater immunity to the specific WPV type than does the same number ofdoses of trivalent OPV.
† The current WHO operational target for countries at high risk for poliotransmission is a nonpolio AFP rate of at least two cases per 100,000 populationaged <15 years and adequate stool specimen collection from >80% of AFPcases where two specimens are collected >24 hours apart, both within 14 daysof paralysis onset, and shipped on ice or frozen ice packs to a WHO-accreditedlaboratory.

Vol. 55 / No. 28 MMWR 773
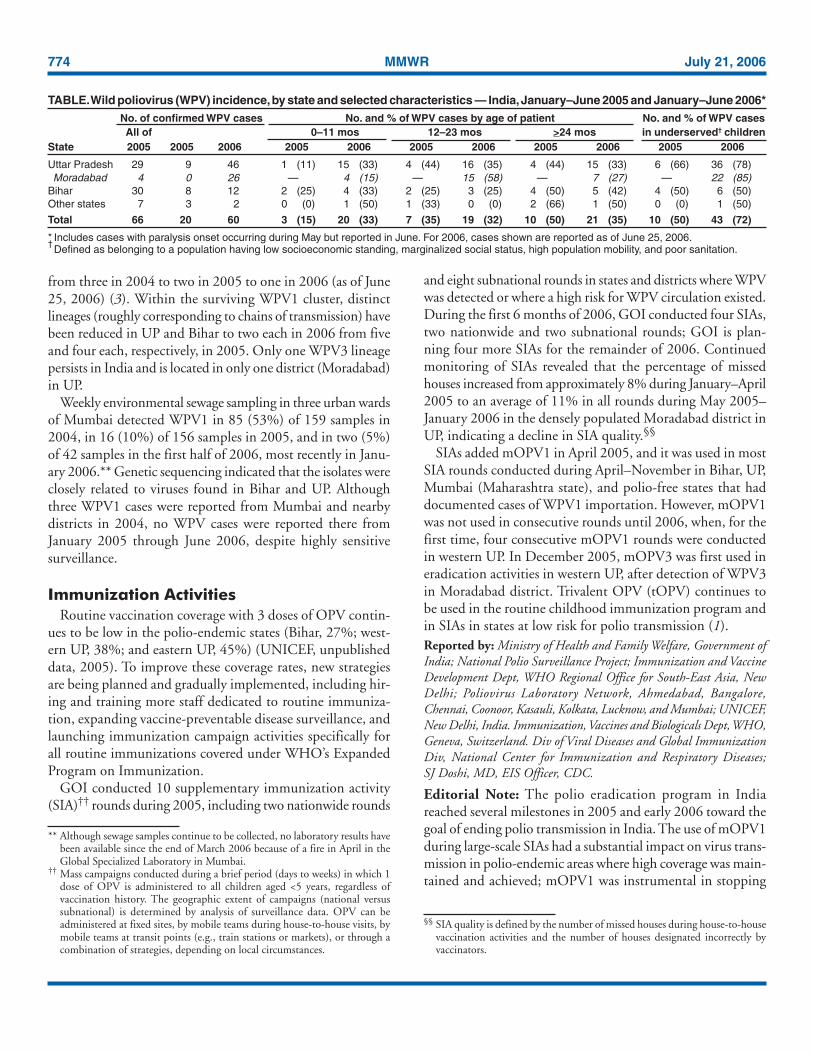
As of June 25, India had reported 60 polio cases (57 WPV1and three WPV3) in 2006 with onset of paralysis occurringthrough May 2006. These 60 cases came from 20 districts,compared with 20 cases from 18 districts for the same periodin 2005 (Figure). Of the cases reported in 2006, a total of 46were from UP state, 12 from Bihar state, one from MadhyaPradesh state bordering UP, and one from Jharkhand statebordering Bihar. Twenty-six (43%) cases, including all threeWPV3 cases, were reported from Moradabad district in UP.Forty-three (72%) of all cases reported in 2006 occurred inunderserved§ children, compared with 31 (47%) of all such
cases reported in 2005. In Moradabad district, >85% of casesin 2006 were in the underserved population. In India, themajority of 2006 cases have occurred in children aged <2 years;33% of 2006 cases have been reported in children aged<12 months, compared with only 15% in 2005. InMoradabad, >50% of 2006 cases have been reported inchildren aged 12–23 months (Table).
Genetic sequencing of WPVs isolated in India reveal thatthe number of distinct genetic clusters¶ of WPV1 decreased
FIGURE. Wild poliovirus (WPV)* cases — India, January–December 2005 and January–June 2006†
* Excludes viruses detected from environmental surveillance and vaccine-derived polioviruses.†As of June 25, 2006. Includes cases with paralysis onset occurring during May but reported in June.
§One WPV type 1 case in Gujarat state is not indicated on the map.
2005 cases(N = 66)§
2006 cases(N = 60)
WPV type 1
WPV type 3Gujarat
Delhi
Haryana
PunjabUttar Pradesh
Bihar
Jharkhand
§ Defined as belonging to a population having low socioeconomic standing,marginalized status, high population mobility, and poor sanitation.
¶ All WPVs isolated in India are sequenced across the interval encoding themajor capsid protein (VP1) (approximately 900 nucleotides), and results areanalyzed to determine the likely origin (by state and district) of the virus. Isolateswithin a cluster share >95% VP1 nucleotide sequence identity.
774 MMWR July 21, 2006
from three in 2004 to two in 2005 to one in 2006 (as of June25, 2006) (3). Within the surviving WPV1 cluster, distinctlineages (roughly corresponding to chains of transmission) havebeen reduced in UP and Bihar to two each in 2006 from fiveand four each, respectively, in 2005. Only one WPV3 lineagepersists in India and is located in only one district (Moradabad)in UP.
Weekly environmental sewage sampling in three urban wardsof Mumbai detected WPV1 in 85 (53%) of 159 samples in2004, in 16 (10%) of 156 samples in 2005, and in two (5%)of 42 samples in the first half of 2006, most recently in Janu-ary 2006.** Genetic sequencing indicated that the isolates wereclosely related to viruses found in Bihar and UP. Althoughthree WPV1 cases were reported from Mumbai and nearbydistricts in 2004, no WPV cases were reported there fromJanuary 2005 through June 2006, despite highly sensitivesurveillance.
Immunization ActivitiesRoutine vaccination coverage with 3 doses of OPV contin-
ues to be low in the polio-endemic states (Bihar, 27%; west-ern UP, 38%; and eastern UP, 45%) (UNICEF, unpublisheddata, 2005). To improve these coverage rates, new strategiesare being planned and gradually implemented, including hir-ing and training more staff dedicated to routine immuniza-tion, expanding vaccine-preventable disease surveillance, andlaunching immunization campaign activities specifically forall routine immunizations covered under WHO’s ExpandedProgram on Immunization.
GOI conducted 10 supplementary immunization activity(SIA)†† rounds during 2005, including two nationwide rounds
and eight subnational rounds in states and districts where WPVwas detected or where a high risk for WPV circulation existed.During the first 6 months of 2006, GOI conducted four SIAs,two nationwide and two subnational rounds; GOI is plan-ning four more SIAs for the remainder of 2006. Continuedmonitoring of SIAs revealed that the percentage of missedhouses increased from approximately 8% during January–April2005 to an average of 11% in all rounds during May 2005–January 2006 in the densely populated Moradabad district inUP, indicating a decline in SIA quality.§§
SIAs added mOPV1 in April 2005, and it was used in mostSIA rounds conducted during April–November in Bihar, UP,Mumbai (Maharashtra state), and polio-free states that haddocumented cases of WPV1 importation. However, mOPV1was not used in consecutive rounds until 2006, when, for thefirst time, four consecutive mOPV1 rounds were conductedin western UP. In December 2005, mOPV3 was first used ineradication activities in western UP, after detection of WPV3in Moradabad district. Trivalent OPV (tOPV) continues tobe used in the routine childhood immunization program andin SIAs in states at low risk for polio transmission (1).Reported by: Ministry of Health and Family Welfare, Government ofIndia; National Polio Surveillance Project; Immunization and VaccineDevelopment Dept, WHO Regional Office for South-East Asia, NewDelhi; Poliovirus Laboratory Network, Ahmedabad, Bangalore,Chennai, Coonoor, Kasauli, Kolkata, Lucknow, and Mumbai; UNICEF,New Delhi, India. Immunization, Vaccines and Biologicals Dept, WHO,Geneva, Switzerland. Div of Viral Diseases and Global ImmunizationDiv, National Center for Immunization and Respiratory Diseases;SJ Doshi, MD, EIS Officer, CDC.
Editorial Note: The polio eradication program in Indiareached several milestones in 2005 and early 2006 toward thegoal of ending polio transmission in India. The use of mOPV1during large-scale SIAs had a substantial impact on virus trans-mission in polio-endemic areas where high coverage was main-tained and achieved; mOPV1 was instrumental in stopping
TABLE. Wild poliovirus (WPV) incidence, by state and selected characteristics — India, January–June 2005 and January–June 2006*No. of confirmed WPV cases No. and % of WPV cases by age of patient No. and % of WPV casesAll of 0–11 mos 12–23 mos >24 mos in underserved† children
State 2005 2005 2006 2005 2006 2005 2006 2005 2006 2005 2006
Uttar Pradesh 29 9 46 1 (11) 15 (33) 4 (44) 16 (35) 4 (44) 15 (33) 6 (66) 36 (78)Moradabad 4 0 26 — 4 (15) — 15 (58) — 7 (27) — 22 (85)
Bihar 30 8 12 2 (25) 4 (33) 2 (25) 3 (25) 4 (50) 5 (42) 4 (50) 6 (50)Other states 7 3 2 0 (0) 1 (50) 1 (33) 0 (0) 2 (66) 1 (50) 0 (0) 1 (50)
Total 66 20 60 3 (15) 20 (33) 7 (35) 19 (32) 10 (50) 21 (35) 10 (50) 43 (72)
* Includes cases with paralysis onset occurring during May but reported in June. For 2006, cases shown are reported as of June 25, 2006.†
Defined as belonging to a population having low socioeconomic standing, marginalized social status, high population mobility, and poor sanitation.
** Although sewage samples continue to be collected, no laboratory results havebeen available since the end of March 2006 because of a fire in April in theGlobal Specialized Laboratory in Mumbai.
†† Mass campaigns conducted during a brief period (days to weeks) in which 1dose of OPV is administered to all children aged <5 years, regardless ofvaccination history. The geographic extent of campaigns (national versussubnational) is determined by analysis of surveillance data. OPV can beadministered at fixed sites, by mobile teams during house-to-house visits, bymobile teams at transit points (e.g., train stations or markets), or through acombination of strategies, depending on local circumstances.
§§ SIA quality is defined by the number of missed houses during house-to-housevaccination activities and the number of houses designated incorrectly byvaccinators.
Vol. 55 / No. 28 MMWR 775
local virus transmission in Mumbai, where sewage samplesindicated only imported viruses. The number of virus lineagespersisting in western UP decreased from five in 2005 to twoin 2006 after use of mOPV1. In Bihar, the use of mOPV1,combined with increased government support, led to a reduc-tion in lineages from four in 2005 to two in 2006.
Although three times as many cases were reported fromIndia during the first half of 2006 compared with the sameperiod in 2005, genetic-sequencing data indicate that trans-mission is now restricted to only one circulating WPV1genetic cluster, and over half of the chains of virus transmis-sion present in 2004 have been eliminated. The geographicdistribution of WPV1 circulation has contracted since 2005,with no WPV cases identified in the southern Indian states,West Bengal, or in the western states of Maharashtra orRajasthan. Delhi, which is adjacent to UP, has not reported aWPV case in 2006. Even in UP, the resurgence of cases isrestricted to a circumscribed area of a few districts of westernUP, centered on Moradabad district. Moreover, WPV3 hasbeen identified in only two administrative blocks in one dis-trict in western UP in 2006, compared with four administra-tive blocks in three districts in 2005.
The polio laboratory network remains a cornerstone ofIndia’s polio eradication program. By strengthening manage-ment techniques in 2005 and introducing new technologiesin early 2006, the laboratories continued to provide rapidresults. Genetic data generated by the Global Specialized Labo-ratory in Mumbai have been used to target immunizationefforts in the most critical areas. For example, during SIAs,vaccinators are now deployed along major train routes, aftergenetic data and epidemiologic investigations identified theseroutes as channels of virus transmission across districts andstates.
UP and Bihar remain the source of ongoing WPV trans-mission in India and exportation of WPV to other countries,including the polio-free countries of Angola (with spread tothe Democratic Republic of Congo and Namibia), Bangladesh,and Nepal (4,5). Data from UP and Bihar confirm that mostWPV circulation is occurring in areas with inadequate SIAquality, suggesting that the early 2006 resurgence of cases hasresulted from reduced community participation in vaccina-tion campaigns and decline in the quality of vaccine programimplementation. Western UP is a particularly challenging areafor interrupting polio because of high population density, alarge birth cohort, poor sanitation, and high populationmobility. These characteristics are especially evident in areassuch as Moradabad, where a large population resides with lowsocioeconomic standing, marginalized social status, and poorsanitation.
To improve SIA quality in areas at high risk for polio trans-mission, several strategies were used during 2005 and early2006 on the basis of recommendations from the India ExpertAdvisory Group on Polio Eradication (IEAG), including 1)development and licensure of mOPV1 and mOPV3 for usein SIAs, 2) deployment of additional personnel to areas athigh risk for polio transmission, 3) enhanced social mobiliza-tion efforts targeted to underserved population groups missedduring previous SIAs, 4) use of mobile teams to vaccinatechildren at transit points (e.g., train stations or markets), and5) increased engagement and accountability of GOI leadersand workers (2).
In May 2006, IEAG recommended increased emphasis onadministering a dose of mOPV1 to all infants at birth to 1)vaccinate infants before they are infected with competing en-teric pathogens that might reduce the efficacy of OPV and 2)help decrease the population immunity gap in areas of UP athigh risk for polio transmission. Improved surveillance andmaintenance of recent gains in SIA coverage in Bihar also wererecommended (6).
As a result of these new programmatic strategies, field moni-tors reported improvement of SIA quality in Bihar in all fourrounds in 2006, compared with the rounds held in the sec-ond half of 2005. Reports from Moradabad also indicate thatthe number of missed houses during vaccination activitiessteadily decreased, from 11% in January 2006 to 8% by April2006. Additional monitoring measures to identify and targetunderserved children and those in transit will help ensure thatall children are reached.
The decrease in genetic diversity and geographic spread ofthe virus suggests that India might be in the final stages ofpolio eradication. A resurgence of cases occurred in a local-ized area of western UP because of problems with immuniza-tion campaign quality. Improvements in SIA implementationin the remaining areas of virus transmission, effective socialmobilization and communication activities targeting theunderserved population, and enhanced community andpolitical commitments are needed to eradicate the disease inIndia.References1. CDC. Progress toward interruption of wild poliovirus transmission—
worldwide, January 2005–March 2006. MMWR 2006;55:458–62.2. India Expert Advisory Group. Conclusions and recommendations: the
twelfth meeting of the India Expert Advisory Group for Polio Eradica-tion, New Delhi, India, December 5–6, 2005. New Delhi, India:National Polio Surveillance Project; 2005. Available at http://www.npspindia.org/advisory.asp.
3. CDC. Progress toward poliomyelitis eradication—India, January 2004–May 2005. MMWR 2005;54:655–9.
4. CDC. Resurgence of wild poliovirus type 1 transmission and conse-quences of importation—21 countries, 2002–2005. MMWR2006;55:145–50.

776 MMWR July 21, 2006
5. Roberts L. Polio experts strive to understand a puzzling outbreak.Science 2006;312:1581.
6. India Expert Advisory Group. Conclusions and recommendations: thethirteenth meeting of the India Expert Advisory Group for Polio Eradi-cation, New Delhi, India, May 4–5, 2006. New Delhi, India: NationalPolio Surveillance Project; 2006. Available at http://www.npspindia.org/advisory.asp.
Pseudomonas aeruginosa InfectionsAssociated with TransrectalUltrasound-Guided ProstateBiopsies — Georgia, 2005
Transrectal ultrasound (TRUS)-guided prostate biopsies areamong the most common outpatient diagnostic proceduresperformed in urology clinics, with an estimated 624,000 per-formed annually in the United States (CDC, unpublished data,2006). The procedures generally are performed in follow-upto elevated levels of prostate-specific antigen or abnormal digi-tal rectal examinations (1). Septicemia has been reported as arare complication of the procedure (2). This report summa-rizes an investigation of four cases of Pseudomonas aeruginosainfection after TRUS-guided prostate biopsies in which con-tamination of the equipment was the likely source. The find-ings underscore the need to adhere to recommendations forthe cleaning and disinfection of TRUS-guided prostatebiopsy equipment.
On July 28, 2005, a urologist notified the Georgia Depart-ment of Human Resources, Division of Public Health (GDPH)regarding four patients who were hospitalized with P. aeruginosainfections within 6 days of outpatient TRUS-guided prostatebiopsies performed at a clinic. All procedures were halted at theclinic pending the investigation. The four patients were white,non-Hispanic men aged 57–71 years who had undergone thebiopsy procedure during July 20–26, 2005. They were the onlypatients who had TRUS-guided prostate biopsies at the clinicduring that period. Subsequently, all four experienced fever andchills and were admitted to the hospital 1–6 days (mean: 2.5days) after their procedures. Three patients were admitted withdiagnosed septicemia and the fourth with a diagnosis of infec-tion. P. aeruginosa was recovered from cultures of blood (onepatient), urine (two patients), or blood and urine specimens(one patient). The patients were treated successfully with a com-bination of intravenous and oral antimicrobial agents duringhospitalizations of 2–12 days (mean: 5.8 days).
All procedures had been performed in the clinic by the sameurologist and staff members using the following technique.Immediately before each procedure, a new finger cot was fit-ted over the distal tip of the ultrasound probe, filled with gel
to eliminate air bubbles, and secured with an O-ring. A stan-dard condom was then fitted over the finger cot and ultra-sound probe and filled with lubricant. Next, a steel,nondisposable needle guide was fitted over the ultrasoundprobe, finger cot, and first condom. A second condom wasfitted over these items and filled with lubricant. Once the ul-trasound probe was inserted into the rectum and positionedcorrectly, the urologist used a spring-loaded biopsy gun to firea sterile biopsy needle through the needle guide into the pros-tate, piercing the second condom, to obtain a core of tissuefor pathologic analysis. The same needle was withdrawn andreinserted through the needle guide approximately eight timesto obtain the needed tissue cores from each patient.
The clinic’s standard practice for perioperative prophylaxisincluded administration of 500 mg of levofloxacin orally thenight before the procedure, an enema per rectum 1 hourbefore the procedure, and 80 mg of gentamicin intramuscu-larly upon arrival at the clinic on the day of the biopsy. Afterthe procedure, patients were instructed to take 500 mg oflevofloxacin orally daily for 3 days.
After each procedure, the ultrasound probe was disinfectedby wiping it with a 3.2% glutaraldehyde solution. A syringewas used to flush the steel needle guide first with soap, thenwith tap water, and, finally, with orthophthaldehyde (OPA),a high-level disinfectant. The needle guide was then soaked inthe OPA for a minimum of 15 minutes and usually over-night. Before use, the needle guide was removed from the OPAand rinsed with tap water. A review of the manufacturer’s writ-ten instructions revealed that the recommended reprocessingmethod for the needle guide called for first cleaning biologicmaterial from the guide and then sterilizing the guide.
A total of 16 environmental samples were obtained fromsurfaces, supplies, equipment, and tap water in the clinic dur-ing August 5–10, 2005. One grew P. aeruginosa; this was asample obtained from the narrow lumen of the needle guideafter it was removed from OPA disinfectant. This specimenwas obtained by scraping the needle guide lumen with a ster-ile needle and then using the needle to inoculate a sterile swab.All four patient isolates and the isolate obtained from the needleguide had similar antimicrobial susceptibility patterns and wereresistant to gentamicin and levofloxacin, the agents used forperioperative prophylaxis. The needle-guide isolate and thethree available patient isolates were indistinguishable by pulsed-field gel electrophoresis.Reported by: J Gillespie, MPH, KE Arnold, MD, Georgia Dept ofHuman Resources, Div of Public Health. MA Kainer, MBBS, TennesseeDept of Health. J Noble-Wang, PhD, B Jensen, MMSc, M Arduino,PhD, J Hageman, MPH, A Srinivasan, MD, National Center forPreparedness, Detection, and Control of Infectious Diseases (proposed), CDC.

Vol. 55 / No. 28 MMWR 777
* Available at http://www.va.gov/ncps/alerts/b-kmedicaltransduceralert06-011.pdf.
Editorial Note: This report describes an investigation ofP. aeruginosa infections that were likely related to contamina-tion of TRUS prostate biopsy equipment that had not beenadequately cleaned (i.e., by brushing) or properly sterilizedand had been rinsed improperly with tap water after repro-cessing. The association between the equipment and theinfections was indicated by matching the strain of P. aeruginosafrom the lumen of the reprocessed needle guide with thosestrains recovered from the three available patient isolates.
Although infectious complications of TRUS-guided pros-tate biopsies have been reported (2), contamination of theneedle guide has not been previously implicated as the causeof infection. According to the Spaulding system for repro-cessing medical devices (3), prostate biopsy needle guides are“critical devices” because the needles that pass through thempenetrate sterile tissue. After adequate manual cleaning, criti-cal devices must be sterilized before reuse. Steam sterilizationis the preferred method for reprocessing heat-stable medicaldevices, including many prostate biopsy needle guides. Themanufacturers of these guides provide recommendations forsterilization methods that are compatible with the specificdevices, and users should review and follow theserecommendations.
Manual cleaning to remove biologic material is a necessaryfirst step in reprocessing any medical device; disinfection andsterilization protocols do not work effectively on visibly soiledsurfaces. Because the lumens of needle guides and needle-guidesupport channels and assemblies are long and narrow, manualcleaning is difficult without the use of special equipmentdesigned to clean the device. Manufacturers of reusable pros-tate needle guides recommend the use of special brushes toclean guides and support channels and assemblies. Thesebrushes must be purchased separately from the needle guides,and a new brush should be used each time the guide is cleaned.
Another recent investigation demonstrates that the failureto properly clean the lumen of a prostate needle guide has notbeen limited to the cases described in this report. In April2006, the Veterans Health Administration issued a PatientSafety Alert to all U.S. Department of Veterans Affairs (VA)hospitals stating that a routine environmental inspection at aurology clinic revealed that the lumen of a needle guide of areusable, reprocessed, TRUS transducer assembly was soiled.*The ensuing investigation determined that brushes were notbeing used to clean the lumen of the needle guide. All VAhospitals were instructed to review procedures for reprocess-ing this equipment, and other VA facilities also reported thatbrushes were not being used. The VA alert has prompted
reviews by non-VA health-care systems. In Tennessee, facili-ties contacted the state health department to report that brusheswere not being used to reprocess prostate biopsy needle guides.In response, the Tennessee Department of Health dissemi-nated recommendations from the Food and Drug Adminis-tration (FDA) on reprocessing TRUS equipment to hospitals,surgical centers, and urologists.
In the cases described in this report, the practice of rinsingthe needle guide in tap water after reprocessing might havecontributed to its contamination. P. aeruginosa is well knownto colonize tap water and has the ability to form biofilms onmedical devices that are difficult to remove. Because tap water isnot sterile, it should never be used to rinse medicalequipment after reprocessing.
In June 2006, in response to the recent reports of problemswith reprocessing prostate biopsy needle guides, FDA issueda Public Health Notification. This notification contains a sum-mary of the recommendations for the proper reprocessing ofreusable prostate biopsy equipment.† Health-care providersand their staffs should adhere to both the FDA recommenda-tions and the equipment manufacturer’s cleaning instructions.References1. Wareing M. Transrectal ultrasound and prostate biopsy clinic. Nurs Stand
2004;18:33–7.2. Crundwell MC, Cooke PW, Wallace DM. Patients’ tolerance of
transrectal ultrasound-guided prostatic biopsy: an audit of 104 cases.BJU Int 1999;83:792–5.
3. Spaulding EH. Chemical disinfection of medical and surgical materials[Chapter 32]. In: Lawrence CA, Block SS, eds. Disinfection, steriliza-tion and preservation. Philadelphia, PA: Lea & Febiger; 1968:517–31.
† Available at http://www.fda.gov/cdrh/safety/061906-ultrasoundtransducers.html.
West Nile Virus Activity — UnitedStates, January 1–July 18, 2006
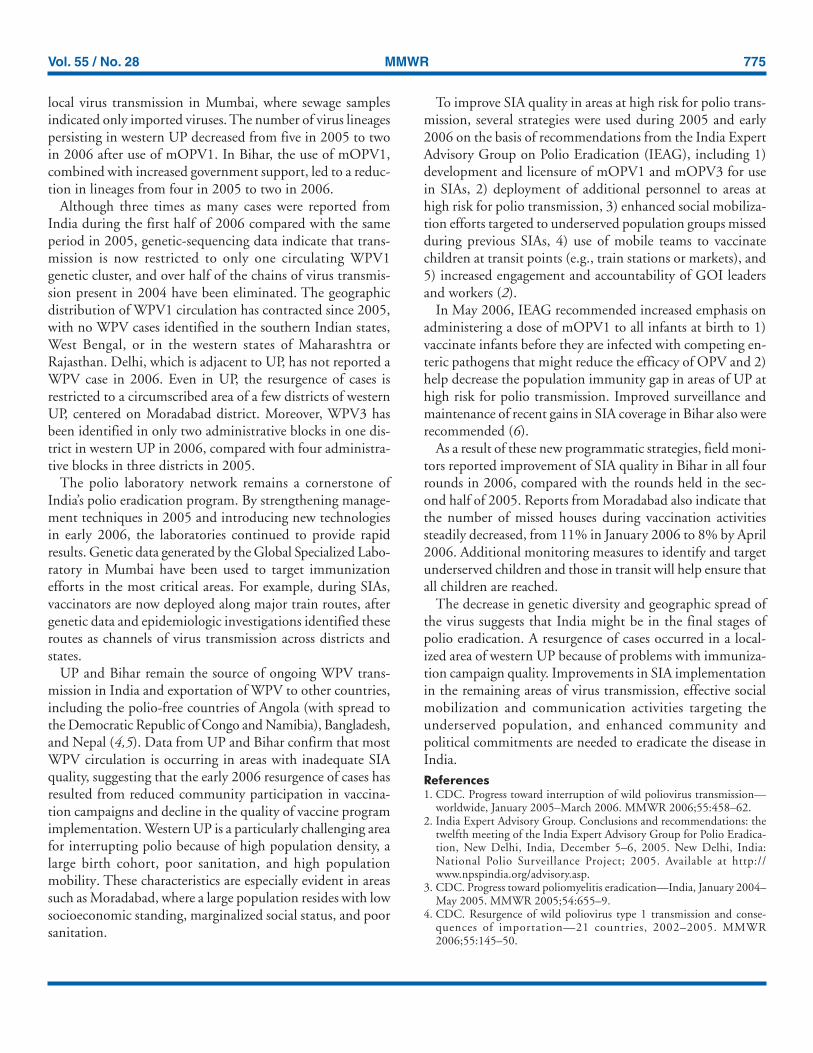
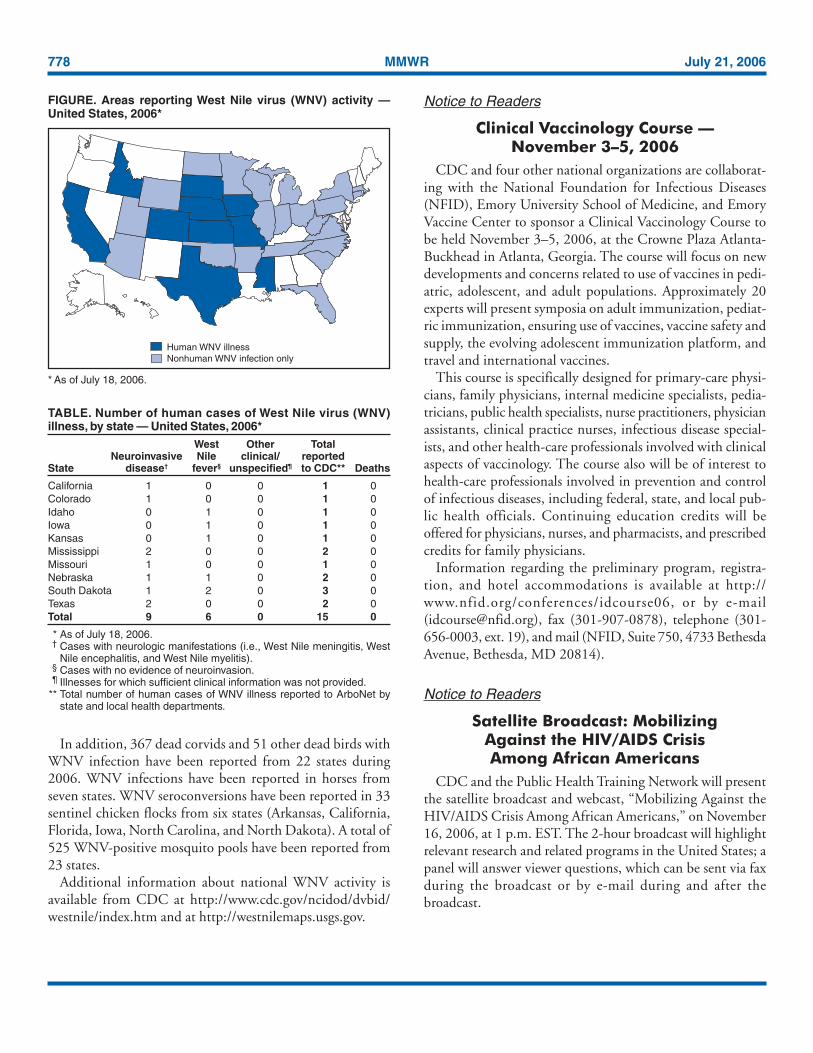
This report summarizes West Nile virus (WNV) surveil-lance data reported to CDC through ArboNET as of 3 a.m.Mountain Daylight Time, July 18, 2006. A total of 10 stateshad reported 15 cases of human WNV illness to CDC (Figure,Table). Nine (60%) cases for which such data were availableoccurred in males; median age of patients was 50 years (range:9–89 years). Date of illness onset ranged from January 6 toJuly 8; no deaths were reported.
A total of 11 presumptive West Nile viremic blood donors(PVDs) have been reported to ArboNET during 2006. Ofthese, two each were reported from Colorado, Kentucky, andNebraska and one each from Idaho, Iowa, Oklahoma, SouthDakota, and Texas.
778 MMWR July 21, 2006
In addition, 367 dead corvids and 51 other dead birds withWNV infection have been reported from 22 states during2006. WNV infections have been reported in horses fromseven states. WNV seroconversions have been reported in 33sentinel chicken flocks from six states (Arkansas, California,Florida, Iowa, North Carolina, and North Dakota). A total of525 WNV-positive mosquito pools have been reported from23 states.
Additional information about national WNV activity isavailable from CDC at http://www.cdc.gov/ncidod/dvbid/westnile/index.htm and at http://westnilemaps.usgs.gov.
Notice to Readers
Clinical Vaccinology Course —November 3–5, 2006
CDC and four other national organizations are collaborat-ing with the National Foundation for Infectious Diseases(NFID), Emory University School of Medicine, and EmoryVaccine Center to sponsor a Clinical Vaccinology Course tobe held November 3–5, 2006, at the Crowne Plaza Atlanta-Buckhead in Atlanta, Georgia. The course will focus on newdevelopments and concerns related to use of vaccines in pedi-atric, adolescent, and adult populations. Approximately 20experts will present symposia on adult immunization, pediat-ric immunization, ensuring use of vaccines, vaccine safety andsupply, the evolving adolescent immunization platform, andtravel and international vaccines.
This course is specifically designed for primary-care physi-cians, family physicians, internal medicine specialists, pedia-tricians, public health specialists, nurse practitioners, physicianassistants, clinical practice nurses, infectious disease special-ists, and other health-care professionals involved with clinicalaspects of vaccinology. The course also will be of interest tohealth-care professionals involved in prevention and controlof infectious diseases, including federal, state, and local pub-lic health officials. Continuing education credits will beoffered for physicians, nurses, and pharmacists, and prescribedcredits for family physicians.
Information regarding the preliminary program, registra-tion, and hotel accommodations is available at http://www.nfid.org/conferences/idcourse06, or by e-mail([email protected]), fax (301-907-0878), telephone (301-656-0003, ext. 19), and mail (NFID, Suite 750, 4733 BethesdaAvenue, Bethesda, MD 20814).
Notice to Readers
Satellite Broadcast: MobilizingAgainst the HIV/AIDS CrisisAmong African Americans
CDC and the Public Health Training Network will presentthe satellite broadcast and webcast, “Mobilizing Against theHIV/AIDS Crisis Among African Americans,” on November16, 2006, at 1 p.m. EST. The 2-hour broadcast will highlightrelevant research and related programs in the United States; apanel will answer viewer questions, which can be sent via faxduring the broadcast or by e-mail during and after thebroadcast.
TABLE. Number of human cases of West Nile virus (WNV)illness, by state — United States, 2006*
West Other TotalNeuroinvasive Nile clinical/ reported
State disease† fever§ unspecified¶ to CDC** Deaths
California 1 0 0 1 0Colorado 1 0 0 1 0Idaho 0 1 0 1 0Iowa 0 1 0 1 0Kansas 0 1 0 1 0Mississippi 2 0 0 2 0Missouri 1 0 0 1 0Nebraska 1 1 0 2 0South Dakota 1 2 0 3 0Texas 2 0 0 2 0Total 9 6 0 15 0
* As of July 18, 2006.† Cases with neurologic manifestations (i.e., West Nile meningitis, West
Nile encephalitis, and West Nile myelitis).§ Cases with no evidence of neuroinvasion.¶ Illnesses for which sufficient clinical information was not provided.
** Total number of human cases of WNV illness reported to ArboNet bystate and local health departments.
FIGURE. Areas reporting West Nile virus (WNV) activity —United States, 2006*
* As of July 18, 2006.
Human WNV illnessNonhuman WNV infection only

Vol. 55 / No. 28 MMWR 779
Additional information will be available after August 10 athttp://www.cdcnpin.org (see Satellite Broadcasts). Organiza-tions are responsible for setting up their own viewing loca-tions and are encouraged to register their locations as soon aspossible after August 17 so that persons who would like toview the broadcast can access information online. Directionsfor establishing and registering a viewing location are avail-able at http://www.cdcnpin.org. The broadcast will be avail-able on the Internet for 3 years (Windows Media Player®
required) at http://www.phppo.cdc.gov/phtn. Videotapes,DVDs, and video CD-ROMs of the broadcast can be orderedby telephone, 800-458-5231.
Erratum: Vol. 52, No. 54In “Summary of Notifiable Diseases — United States, 2003,”
on page 78, in Table 12, “Deaths from selected notifiable dis-eases — United States, 1996–2001,” in the first column,“Cause of death,” “Hepatitis B, acute” should read, Hepatitis B.
Errata: Vol. 55, No. 27In “QuickStats: Number of Emergency Department (ED)
Visits with Diagnostic Imaging Performed — United States,1995 and 2004,” page 753, the title should read “Number ofEmergency Department (ED) Visits with Diagnostic Imag-ing Ordered or Performed — United States, 1995 and 2004,”and the y-axis should read, “Number (in millions).”
QuickStatsfrom the national center for health statisticsfrom the national center for health statisticsfrom the national center for health statisticsfrom the national center for health statisticsfrom the national center for health statistics
Percentage of Older Adults Who Engaged in Regular Leisure-Time PhysicalActivity,* by Age Group and Sex — United States, 2000–2003†
* Defined as vigorous activity at least three times a week for >20 minutes or light-to-moderate activity at least five times a week for >30 minutes.
† Derived from the 2000–2003 National Health Interview Surveys. Estimates arebased on household interviews of 39,990 civilian, noninstitutionalized adultsaged >55 years.
During 2000–2003, men aged >55 years were more likely than women in the same age group toengage in regular leisure-time physical activity. For both men and women, prevalence of regularactivity was nearly the same for adults aged 55–64 and 65–74 years, declined among those aged75–84 years, and declined further among those aged >85 years. Among adults aged >85 years,approximately one in 10 men and one in 20 women engaged in regular leisure-time physical activity.
SOURCE: Schoenborn CA, Vickerie JL, Powell-Griner E. Health characteristics of adults 55 years and over:United States, 2000–2003. Advance data from vital and health statistics. No. 370. Hyattsville, MD: US Departmentof Health and Human Services, CDC, National Center for Health Statistics; 2006. Available at http://www.cdc.gov/nchs/data/ad/ad370.pdf.
0
5
10
15
20
25
30
35
Men Women
55–64 yrs65–74 yrs75–84 yrs>85 yrs
Per
cent
age
Sex

780 MMWR July 21, 2006
TABLE I. Provisional cases of infrequently reported notifiable diseases (<1,000 cases reported during the preceding year) — United States, weekending July 15, 2006 (28th Week)*
5-yearCurrent Cum weekly Total cases reported for previous years
Disease week 2006 average† 2005 2004 2003 2002 2001 States reporting cases during current week (No.)
Anthrax — 1 0 — — — 2 23Botulism:
foodborne — 3 1 19 16 20 28 39infant — 35 2 90 87 76 69 97other (wound & unspecified) 1 28 0 33 30 33 21 19 CA (1)
Brucellosis 3 54 2 122 114 104 125 136 KS (1), GA (1), CA (1)Chancroid — 18 1 17 30 54 67 38Cholera — 3 0 8 5 2 2 3Cyclosporiasis§ 6 45 10 734 171 75 156 147 FL (6)Diphtheria — — 0 — — 1 1 2Domestic arboviral diseases§,¶:
California serogroup — 1 4 78 112 108 164 128eastern equine — — 0 21 6 14 10 9Powassan — — 0 1 1 — 1 NSt. Louis — 1 0 10 12 41 28 79western equine — — — — — — — —
Ehrlichiosis§:human granulocytic 18 101 19 790 537 362 511 261 NY (9), MN (8), MO (1)human monocytic 16 100 11 522 338 321 216 142 NY (10), MO (1), NC (1), AR (4)human (other & unspecified) 1 27 3 122 59 44 23 6 VA (1)
Haemophilus influenzae,** invasive disease (age <5 yrs):
serotype b — 4 0 9 19 32 34 —nonserotype b 2 46 2 135 135 117 144 — NC (1), FL (1)unknown serotype — 98 2 217 177 227 153 —
Hansen disease§ 1 32 2 88 105 95 96 79 TX (1)Hantavirus pulmonary syndrome§ — 14 1 29 24 26 19 8Hemolytic uremic syndrome, postdiarrheal§ 3 68 5 221 200 178 216 202 CT (1), NY (1), CA (1)Hepatitis C viral, acute 7 417 31 771 713 1,102 1,835 3,976 NC (5), WA (1), CA (1)HIV infection, pediatric (age <13 yrs)§,†† — 52 7 380 436 504 420 543Influenza-associated pediatric mortality§,§§,¶¶ 1 39 1 49 — N N N NC (1)Listeriosis 9 259 18 892 753 696 665 613 NY (1), OH (1), MN (2), MD (1), VA (1), FL (1),
WA (1), CA (1)Measles —*** 22 2 66 37 56 44 116Meningococcal disease,††† invasive:
A, C, Y, & W-135 1 127 4 297 — — — — NY (1)serogroup B 1 85 3 157 — — — — TN (1)other serogroup 2 14 0 27 — — — — NC (2)
Mumps 25 5,249 4 314 258 231 270 266 NY (2), MI (2), IA (3), SD (7), KS (10), VA (1)Plague — 4 0 8 3 1 2 2Poliomyelitis, paralytic — — — 1 — — — —Psittacosis§ — 9 0 19 12 12 18 25Q fever§ 2 68 2 139 70 71 61 26 TN (1), CA (1)Rabies, human — 1 0 2 7 2 3 1Rubella — 4 0 11 10 7 18 23Rubella, congenital syndrome — 1 — 1 — 1 1 3SARS-CoV§,§§ — — — — — 8 N NSmallpox§ — — — — — — — —Streptococcal toxic-shock syndrome§ 1 64 1 129 132 161 118 77 NC (1)Streptococcus pneumoniae,§
invasive disease (age <5 yrs) 5 606 10 1,257 1,162 845 513 498 MA (1), NY (2), MN (1), KS (1)Syphilis, congenital (age <1 yr) 1 112 8 361 353 413 412 441 VA (1)Tetanus — 10 0 27 34 20 25 37Toxic-shock syndrome (other than streptococcal)§ 2 51 2 96 95 133 109 127 VT (1), NC (1)Trichinellosis 1 8 0 19 5 6 14 22 MN (1)Tularemia§ 4 33 4 154 134 129 90 129 ND (1), KS (1), AR (1), MT (1)Typhoid fever 8 127 7 324 322 356 321 368 OH (1), FL (1), CA (6)Vancomycin-intermediate Staphylococcus aureus§ — 2 — 2 — N N NVancomycin-resistant Staphylococcus aureus§ — — — 3 1 N N NYellow fever — — — — — — 1 —
—: No reported cases. N: Not notifiable. Cum: Cumulative year-to-date counts.* Incidence data for reporting years 2005 and 2006 are provisional, whereas data for 2001, 2002, 2003, and 2004 are finalized.† Calculated by summing the incidence counts for the current week, the two weeks preceding the current week, and the two weeks following the current week, for a total of 5
preceding years. Additional information is available at http://www.cdc.gov/epo/dphsi/phs/files/5yearweeklyaverage.pdf.§ Not notifiable in all states.¶ Includes both neuroinvasive and non-neuroinvasive. Updated weekly from reports to the Division of Vector-Borne Infectious Diseases, National Center for Infectious
Diseases (ArboNET Surveillance).** Data for H. influenzae (all ages, all serotypes) are available in Table II.†† Updated monthly from reports to the Division of HIV/AIDS Prevention, National Center for HIV/AIDS, STD and TB Prevention. Implementation of HIV reporting influences the
number of cases reported. Data for HIV/AIDS are available in Table IV quarterly.§§ Updated weekly from reports to the Division of Viral and Rickettsial Diseases, National Center for Infectious Diseases.¶¶ A total of 37 cases were reported for the 2005-06 flu season (October 2, 2005 [week 40]–May 20, 2006 [week 20]).
*** No measles cases were reported for the current week.††† Data for meningococcal disease (all serogroups and unknown serogroups) are available in Table II.

Vol. 55 / No. 28 MMWR 781
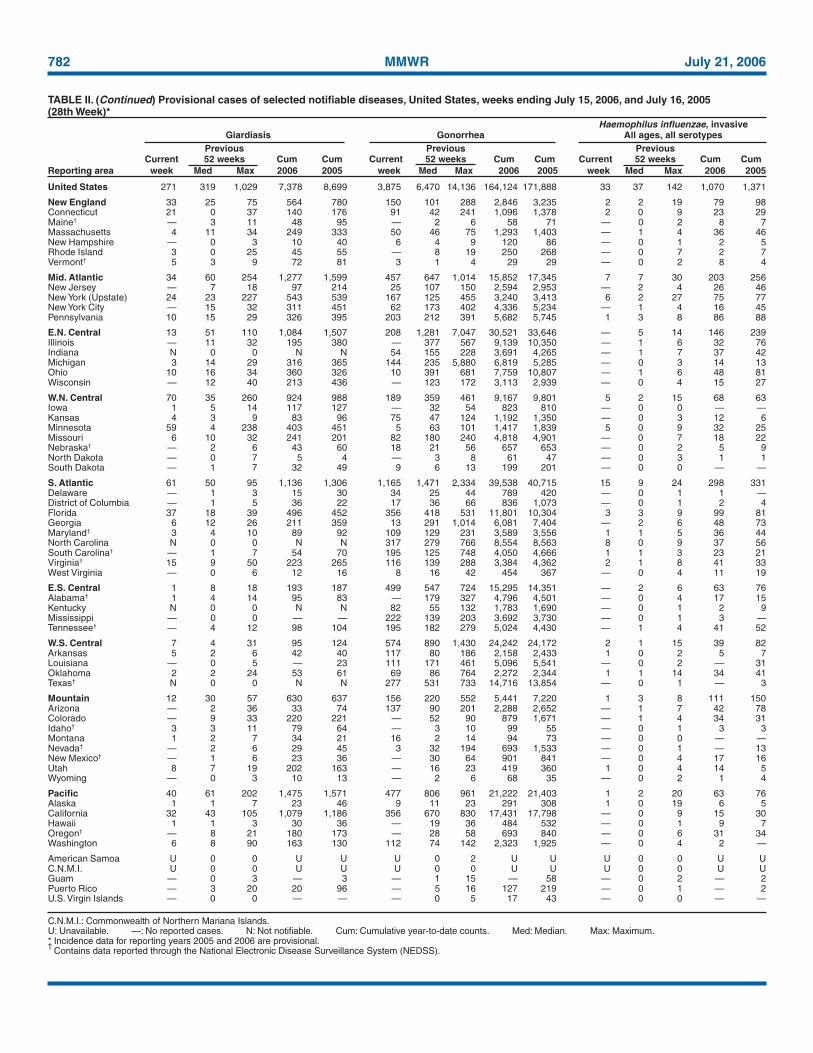
TABLE II. Provisional cases of selected notifiable diseases, United States, weeks ending July 15, 2006, and July 16, 2005 (28th Week)*
United States 11,186 18,728 35,170 486,249 513,069 75 126 1,643 3,765 2,131 31 63 860 1,263 1,237
New England 880 627 1,550 16,660 17,047 — 0 0 — — 2 4 35 71 71Connecticut 448 171 1,214 4,696 5,106 N 0 0 N N — 0 14 9 8Maine§ — 41 74 1,021 1,130 N 0 0 N N — 0 3 12 12Massachusetts 327 276 432 7,600 7,523 — 0 0 — — — 2 15 29 29New Hampshire 40 35 64 991 970 — 0 0 — — 1 1 3 12 9Rhode Island 43 66 99 1,777 1,796 — 0 0 — — 1 0 6 4 2Vermont§ 22 18 43 575 522 N 0 0 N N — 0 5 5 11
Mid. Atlantic 1,541 2,342 3,696 61,491 62,624 — 0 0 — — 4 10 597 188 165New Jersey 131 373 499 9,331 10,421 N 0 0 N N — 0 8 6 11New York (Upstate) 432 497 1,727 12,322 12,348 N 0 0 N N 1 3 561 54 43New York City 312 689 1,611 19,405 20,285 N 0 0 N N — 2 15 31 44Pennsylvania 666 717 1,073 20,433 19,570 N 0 0 N N 3 4 21 97 67
E.N. Central 706 3,125 12,578 76,558 85,560 — 0 3 24 5 7 14 162 275 271Illinois — 943 1,536 24,409 26,526 — 0 0 — — — 2 16 31 37Indiana 163 393 552 8,929 10,693 N 0 0 N N 2 1 13 29 17Michigan 492 560 9,888 16,839 13,962 — 0 3 20 5 2 2 7 49 37Ohio 51 774 1,445 16,866 23,571 — 0 1 4 — 3 5 109 106 79Wisconsin — 399 531 9,515 10,808 N 0 0 N N — 4 38 60 101
W.N. Central 611 1,135 1,448 29,933 31,350 — 0 12 — 3 6 10 52 220 200Iowa — 150 225 4,098 3,713 N 0 0 N N 2 1 11 26 55Kansas 251 153 269 4,281 3,882 N 0 0 N N — 1 5 27 15Minnesota — 233 315 5,734 6,569 — 0 12 — 3 1 3 22 82 46Missouri 213 429 525 10,860 12,136 — 0 1 — — 3 2 37 42 65Nebraska§ 89 95 176 2,676 2,761 N 0 1 N N — 1 4 15 6North Dakota 5 35 64 904 841 N 0 0 N N — 0 4 5 —South Dakota 53 52 117 1,380 1,448 N 0 0 N N — 0 4 23 13
S. Atlantic 2,550 3,334 4,913 92,531 95,221 — 0 1 2 — 6 14 54 308 233Delaware 59 68 92 1,893 1,729 N 0 0 N N — 0 2 1 —District of Columbia 20 59 102 1,360 2,045 — 0 0 — — — 0 3 8 2Florida 716 898 1,089 25,066 23,351 N 0 0 N N 4 6 28 132 106Georgia 26 611 2,142 13,629 16,423 — 0 0 — — — 3 9 84 55Maryland§ 359 355 519 9,439 9,648 — 0 1 2 — — 0 4 10 11North Carolina 425 569 1,772 17,639 17,485 N 0 0 N N 1 1 10 37 26South Carolina§ 368 276 1,306 9,131 10,550 N 0 0 N N — 0 4 16 10Virginia§ 533 427 840 12,561 12,605 N 0 0 N N 1 1 8 18 19West Virginia 44 56 226 1,813 1,385 N 0 0 N N — 0 3 2 4
E.S. Central 1,263 1,391 1,940 38,604 37,519 — 0 0 — — 3 3 29 55 34Alabama§ — 362 754 10,433 7,821 N 0 0 N N 2 0 5 26 12Kentucky 227 155 402 5,180 5,236 N 0 0 N N 1 1 25 13 13Mississippi 501 374 609 9,756 12,091 — 0 0 — — — 0 1 4 —Tennessee§ 535 489 614 13,235 12,371 N 0 0 N N — 1 4 12 9
W.S. Central 1,278 2,153 3,605 57,277 60,666 — 0 1 — — 2 3 30 64 38Arkansas 231 158 340 3,951 4,702 — 0 0 — — — 0 2 8 2Louisiana 157 281 761 8,561 10,431 — 0 1 — N — 0 21 — 3Oklahoma 151 234 2,159 6,226 5,725 N 0 0 N N 2 1 10 20 16Texas§ 739 1,394 1,800 38,539 39,808 N 0 0 N N — 2 19 36 17
Mountain 586 1,077 1,839 25,628 33,969 2 92 452 2,421 1,341 1 2 9 49 67Arizona 463 365 642 9,619 11,981 — 91 448 2,359 1,284 — 0 1 4 6Colorado — 204 482 2,970 7,838 N 0 0 N N — 1 3 16 22Idaho§ 6 52 168 1,744 1,346 N 0 0 N N — 0 2 5 5Montana 108 40 195 1,271 1,230 N 0 0 N N — 0 2 8 12Nevada§ 9 87 432 2,055 3,915 — 1 4 21 37 — 0 1 3 8New Mexico§ — 174 338 4,987 4,724 — 0 2 5 12 — 0 3 3 8Utah — 89 136 2,231 2,338 2 1 3 34 6 — 0 3 6 4Wyoming — 26 55 751 597 — 0 2 2 2 1 0 3 4 2
Pacific 1,771 3,276 5,079 87,567 89,113 73 34 1,179 1,318 782 — 3 52 33 158Alaska 51 85 152 2,249 2,172 — 0 0 — — — 0 2 2 —California 1,393 2,538 4,231 68,325 68,940 73 34 1,179 1,318 782 — 0 14 — 110Hawaii — 107 135 2,672 2,900 N 0 0 N N — 0 1 — —Oregon§ — 177 315 4,594 4,750 N 0 0 N N — 1 20 31 26Washington 327 356 604 9,727 10,351 N 0 0 N N — 0 38 — 22
American Samoa U 0 46 U U U 0 0 U U U 0 0 U UC.N.M.I. U 0 0 U U U 0 0 U U U 0 0 U UGuam — 18 37 — 410 — 0 0 — — — 0 0 — —Puerto Rico — 76 162 1,877 2,334 N 0 0 N N N 0 0 N NU.S. Virgin Islands — 2 12 83 173 — 0 0 — — — 0 0 — —
C.N.M.I.: Commonwealth of Northern Mariana Islands.U: Unavailable. —: No reported cases. N: Not notifiable. Cum: Cumulative year-to-date counts. Med: Median. Max: Maximum.* Incidence data for reporting years 2005 and 2006 are provisional.†
Chlamydia refers to genital infections caused by Chlamydia trachomatis.§
Contains data reported through the National Electronic Disease Surveillance System (NEDSS).
Chlamydia† Coccidioidomycosis CryptosporidiosisPrevious Previous Previous
Current 52 weeks Cum Cum Current 52 weeks Cum Cum Current 52 weeks Cum CumReporting area week Med Max 2006 2005 week Med Max 2006 2005 week Med Max 2006 2005
782 MMWR July 21, 2006
TABLE II. (Continued) Provisional cases of selected notifiable diseases, United States, weeks ending July 15, 2006, and July 16, 2005(28th Week)*
United States 271 319 1,029 7,378 8,699 3,875 6,470 14,136 164,124 171,888 33 37 142 1,070 1,371
New England 33 25 75 564 780 150 101 288 2,846 3,235 2 2 19 79 98Connecticut 21 0 37 140 176 91 42 241 1,096 1,378 2 0 9 23 29Maine† — 3 11 48 95 — 2 6 58 71 — 0 2 8 7Massachusetts 4 11 34 249 333 50 46 75 1,293 1,403 — 1 4 36 46New Hampshire — 0 3 10 40 6 4 9 120 86 — 0 1 2 5Rhode Island 3 0 25 45 55 — 8 19 250 268 — 0 7 2 7Vermont† 5 3 9 72 81 3 1 4 29 29 — 0 2 8 4
Mid. Atlantic 34 60 254 1,277 1,599 457 647 1,014 15,852 17,345 7 7 30 203 256New Jersey — 7 18 97 214 25 107 150 2,594 2,953 — 2 4 26 46New York (Upstate) 24 23 227 543 539 167 125 455 3,240 3,413 6 2 27 75 77New York City — 15 32 311 451 62 173 402 4,336 5,234 — 1 4 16 45Pennsylvania 10 15 29 326 395 203 212 391 5,682 5,745 1 3 8 86 88
E.N. Central 13 51 110 1,084 1,507 208 1,281 7,047 30,521 33,646 — 5 14 146 239Illinois — 11 32 195 380 — 377 567 9,139 10,350 — 1 6 32 76Indiana N 0 0 N N 54 155 228 3,691 4,265 — 1 7 37 42Michigan 3 14 29 316 365 144 235 5,880 6,819 5,285 — 0 3 14 13Ohio 10 16 34 360 326 10 391 681 7,759 10,807 — 1 6 48 81Wisconsin — 12 40 213 436 — 123 172 3,113 2,939 — 0 4 15 27
W.N. Central 70 35 260 924 988 189 359 461 9,167 9,801 5 2 15 68 63Iowa 1 5 14 117 127 — 32 54 823 810 — 0 0 — —Kansas 4 3 9 83 96 75 47 124 1,192 1,350 — 0 3 12 6Minnesota 59 4 238 403 451 5 63 101 1,417 1,839 5 0 9 32 25Missouri 6 10 32 241 201 82 180 240 4,818 4,901 — 0 7 18 22Nebraska† — 2 6 43 60 18 21 56 657 653 — 0 2 5 9North Dakota — 0 7 5 4 — 3 8 61 47 — 0 3 1 1South Dakota — 1 7 32 49 9 6 13 199 201 — 0 0 — —
S. Atlantic 61 50 95 1,136 1,306 1,165 1,471 2,334 39,538 40,715 15 9 24 298 331Delaware — 1 3 15 30 34 25 44 789 420 — 0 1 1 —District of Columbia — 1 5 36 22 17 36 66 836 1,073 — 0 1 2 4Florida 37 18 39 496 452 356 418 531 11,801 10,304 3 3 9 99 81Georgia 6 12 26 211 359 13 291 1,014 6,081 7,404 — 2 6 48 73Maryland† 3 4 10 89 92 109 129 231 3,589 3,556 1 1 5 36 44North Carolina N 0 0 N N 317 279 766 8,554 8,563 8 0 9 37 56South Carolina† — 1 7 54 70 195 125 748 4,050 4,666 1 1 3 23 21Virginia† 15 9 50 223 265 116 139 288 3,384 4,362 2 1 8 41 33West Virginia — 0 6 12 16 8 16 42 454 367 — 0 4 11 19
E.S. Central 1 8 18 193 187 499 547 724 15,295 14,351 — 2 6 63 76Alabama† 1 4 14 95 83 — 179 327 4,796 4,501 — 0 4 17 15Kentucky N 0 0 N N 82 55 132 1,783 1,690 — 0 1 2 9Mississippi — 0 0 — — 222 139 203 3,692 3,730 — 0 1 3 —Tennessee† — 4 12 98 104 195 182 279 5,024 4,430 — 1 4 41 52
W.S. Central 7 4 31 95 124 574 890 1,430 24,242 24,172 2 1 15 39 82Arkansas 5 2 6 42 40 117 80 186 2,158 2,433 1 0 2 5 7Louisiana — 0 5 — 23 111 171 461 5,096 5,541 — 0 2 — 31Oklahoma 2 2 24 53 61 69 86 764 2,272 2,344 1 1 14 34 41Texas† N 0 0 N N 277 531 733 14,716 13,854 — 0 1 — 3
Mountain 12 30 57 630 637 156 220 552 5,441 7,220 1 3 8 111 150Arizona — 2 36 33 74 137 90 201 2,288 2,652 — 1 7 42 78Colorado — 9 33 220 221 — 52 90 879 1,671 — 1 4 34 31Idaho† 3 3 11 79 64 — 3 10 99 55 — 0 1 3 3Montana 1 2 7 34 21 16 2 14 94 73 — 0 0 — —Nevada† — 2 6 29 45 3 32 194 693 1,533 — 0 1 — 13New Mexico† — 1 6 23 36 — 30 64 901 841 — 0 4 17 16Utah 8 7 19 202 163 — 16 23 419 360 1 0 4 14 5Wyoming — 0 3 10 13 — 2 6 68 35 — 0 2 1 4
Pacific 40 61 202 1,475 1,571 477 806 961 21,222 21,403 1 2 20 63 76Alaska 1 1 7 23 46 9 11 23 291 308 1 0 19 6 5California 32 43 105 1,079 1,186 356 670 830 17,431 17,798 — 0 9 15 30Hawaii 1 1 3 30 36 — 19 36 484 532 — 0 1 9 7Oregon† — 8 21 180 173 — 28 58 693 840 — 0 6 31 34Washington 6 8 90 163 130 112 74 142 2,323 1,925 — 0 4 2 —
American Samoa U 0 0 U U U 0 2 U U U 0 0 U UC.N.M.I. U 0 0 U U U 0 0 U U U 0 0 U UGuam — 0 3 — 3 — 1 15 — 58 — 0 2 — 2Puerto Rico — 3 20 20 96 — 5 16 127 219 — 0 1 — 2U.S. Virgin Islands — 0 0 — — — 0 5 17 43 — 0 0 — —
C.N.M.I.: Commonwealth of Northern Mariana Islands.U: Unavailable. —: No reported cases. N: Not notifiable. Cum: Cumulative year-to-date counts. Med: Median. Max: Maximum.* Incidence data for reporting years 2005 and 2006 are provisional.†
Contains data reported through the National Electronic Disease Surveillance System (NEDSS).
Haemophilus influenzae, invasiveGiardiasis Gonorrhea All ages, all serotypes
Previous Previous PreviousCurrent 52 weeks Cum Cum Current 52 weeks Cum Cum Current 52 weeks Cum Cum
Reporting area week Med Max 2006 2005 week Med Max 2006 2005 week Med Max 2006 2005
Vol. 55 / No. 28 MMWR 783
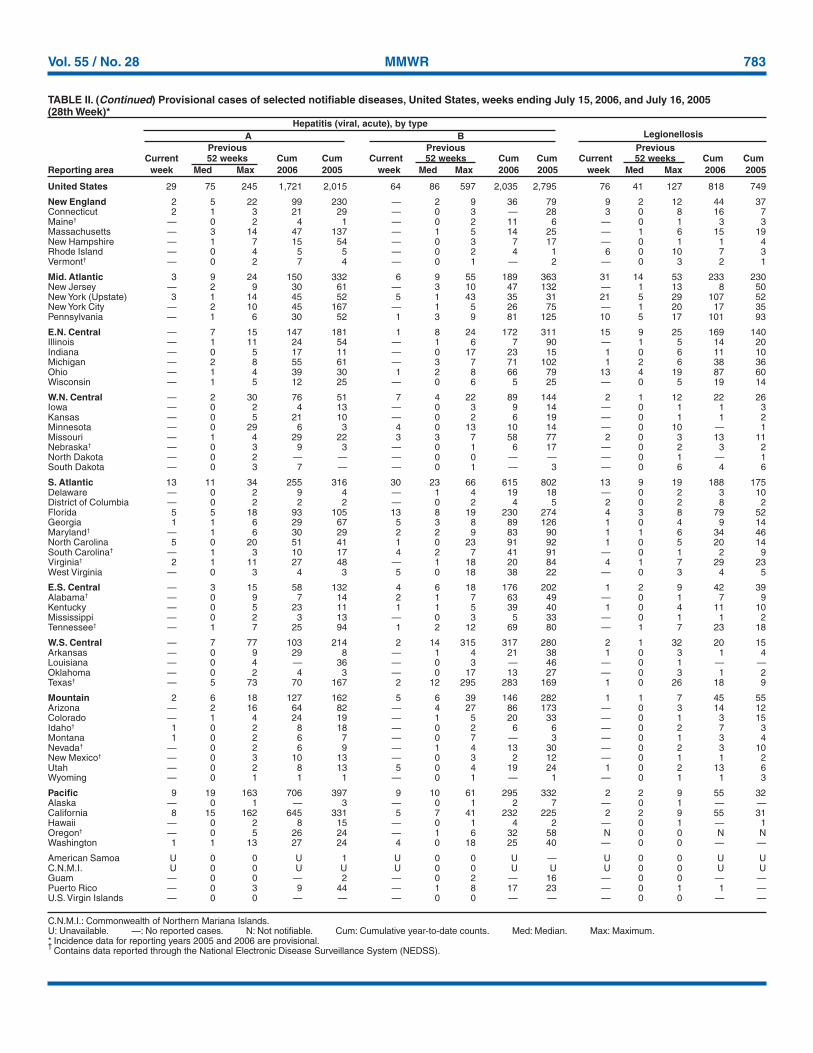
TABLE II. (Continued) Provisional cases of selected notifiable diseases, United States, weeks ending July 15, 2006, and July 16, 2005(28th Week)*
United States 29 75 245 1,721 2,015 64 86 597 2,035 2,795 76 41 127 818 749
New England 2 5 22 99 230 — 2 9 36 79 9 2 12 44 37Connecticut 2 1 3 21 29 — 0 3 — 28 3 0 8 16 7Maine† — 0 2 4 1 — 0 2 11 6 — 0 1 3 3Massachusetts — 3 14 47 137 — 1 5 14 25 — 1 6 15 19New Hampshire — 1 7 15 54 — 0 3 7 17 — 0 1 1 4Rhode Island — 0 4 5 5 — 0 2 4 1 6 0 10 7 3Vermont† — 0 2 7 4 — 0 1 — 2 — 0 3 2 1
Mid. Atlantic 3 9 24 150 332 6 9 55 189 363 31 14 53 233 230New Jersey — 2 9 30 61 — 3 10 47 132 — 1 13 8 50New York (Upstate) 3 1 14 45 52 5 1 43 35 31 21 5 29 107 52New York City — 2 10 45 167 — 1 5 26 75 — 1 20 17 35Pennsylvania — 1 6 30 52 1 3 9 81 125 10 5 17 101 93
E.N. Central — 7 15 147 181 1 8 24 172 311 15 9 25 169 140Illinois — 1 11 24 54 — 1 6 7 90 — 1 5 14 20Indiana — 0 5 17 11 — 0 17 23 15 1 0 6 11 10Michigan — 2 8 55 61 — 3 7 71 102 1 2 6 38 36Ohio — 1 4 39 30 1 2 8 66 79 13 4 19 87 60Wisconsin — 1 5 12 25 — 0 6 5 25 — 0 5 19 14
W.N. Central — 2 30 76 51 7 4 22 89 144 2 1 12 22 26Iowa — 0 2 4 13 — 0 3 9 14 — 0 1 1 3Kansas — 0 5 21 10 — 0 2 6 19 — 0 1 1 2Minnesota — 0 29 6 3 4 0 13 10 14 — 0 10 — 1Missouri — 1 4 29 22 3 3 7 58 77 2 0 3 13 11Nebraska† — 0 3 9 3 — 0 1 6 17 — 0 2 3 2North Dakota — 0 2 — — — 0 0 — — — 0 1 — 1South Dakota — 0 3 7 — — 0 1 — 3 — 0 6 4 6
S. Atlantic 13 11 34 255 316 30 23 66 615 802 13 9 19 188 175Delaware — 0 2 9 4 — 1 4 19 18 — 0 2 3 10District of Columbia — 0 2 2 2 — 0 2 4 5 2 0 2 8 2Florida 5 5 18 93 105 13 8 19 230 274 4 3 8 79 52Georgia 1 1 6 29 67 5 3 8 89 126 1 0 4 9 14Maryland† — 1 6 30 29 2 2 9 83 90 1 1 6 34 46North Carolina 5 0 20 51 41 1 0 23 91 92 1 0 5 20 14South Carolina† — 1 3 10 17 4 2 7 41 91 — 0 1 2 9Virginia† 2 1 11 27 48 — 1 18 20 84 4 1 7 29 23West Virginia — 0 3 4 3 5 0 18 38 22 — 0 3 4 5
E.S. Central — 3 15 58 132 4 6 18 176 202 1 2 9 42 39Alabama† — 0 9 7 14 2 1 7 63 49 — 0 1 7 9Kentucky — 0 5 23 11 1 1 5 39 40 1 0 4 11 10Mississippi — 0 2 3 13 — 0 3 5 33 — 0 1 1 2Tennessee† — 1 7 25 94 1 2 12 69 80 — 1 7 23 18
W.S. Central — 7 77 103 214 2 14 315 317 280 2 1 32 20 15Arkansas — 0 9 29 8 — 1 4 21 38 1 0 3 1 4Louisiana — 0 4 — 36 — 0 3 — 46 — 0 1 — —Oklahoma — 0 2 4 3 — 0 17 13 27 — 0 3 1 2Texas† — 5 73 70 167 2 12 295 283 169 1 0 26 18 9
Mountain 2 6 18 127 162 5 6 39 146 282 1 1 7 45 55Arizona — 2 16 64 82 — 4 27 86 173 — 0 3 14 12Colorado — 1 4 24 19 — 1 5 20 33 — 0 1 3 15Idaho† 1 0 2 8 18 — 0 2 6 6 — 0 2 7 3Montana 1 0 2 6 7 — 0 7 — 3 — 0 1 3 4Nevada† — 0 2 6 9 — 1 4 13 30 — 0 2 3 10New Mexico† — 0 3 10 13 — 0 3 2 12 — 0 1 1 2Utah — 0 2 8 13 5 0 4 19 24 1 0 2 13 6Wyoming — 0 1 1 1 — 0 1 — 1 — 0 1 1 3
Pacific 9 19 163 706 397 9 10 61 295 332 2 2 9 55 32Alaska — 0 1 — 3 — 0 1 2 7 — 0 1 — —California 8 15 162 645 331 5 7 41 232 225 2 2 9 55 31Hawaii — 0 2 8 15 — 0 1 4 2 — 0 1 — 1Oregon† — 0 5 26 24 — 1 6 32 58 N 0 0 N NWashington 1 1 13 27 24 4 0 18 25 40 — 0 0 — —
American Samoa U 0 0 U 1 U 0 0 U — U 0 0 U UC.N.M.I. U 0 0 U U U 0 0 U U U 0 0 U UGuam — 0 0 — 2 — 0 2 — 16 — 0 0 — —Puerto Rico — 0 3 9 44 — 1 8 17 23 — 0 1 1 —U.S. Virgin Islands — 0 0 — — — 0 0 — — — 0 0 — —
C.N.M.I.: Commonwealth of Northern Mariana Islands.U: Unavailable. —: No reported cases. N: Not notifiable. Cum: Cumulative year-to-date counts. Med: Median. Max: Maximum.* Incidence data for reporting years 2005 and 2006 are provisional.†
Contains data reported through the National Electronic Disease Surveillance System (NEDSS).
Hepatitis (viral, acute), by typeA B Legionellosis
Previous Previous PreviousCurrent 52 weeks Cum Cum Current 52 weeks Cum Cum Current 52 weeks Cum Cum
Reporting area week Med Max 2006 2005 week Med Max 2006 2005 week Med Max 2006 2005

784 MMWR July 21, 2006
TABLE II. (Continued) Provisional cases of selected notifiable diseases, United States, weeks ending July 15, 2006, and July 16, 2005(28th Week)*
Lyme disease MalariaPrevious Previous
Current 52 weeks Cum Cum Current 52 weeks Cum CumReporting area week Med Max 2006 2005 week Med Max 2006 2005
United States 358 236 2,153 4,652 8,408 11 24 125 552 658
New England 114 37 780 704 1,461 — 1 12 38 29Connecticut 96 8 753 540 129 — 0 10 10 —Maine† — 2 26 39 94 — 0 1 3 2Massachusetts — 3 205 26 1,163 — 0 3 17 20New Hampshire 18 5 21 84 62 — 0 3 7 4Rhode Island — 0 12 — 3 — 0 8 — 2Vermont† — 1 5 15 10 — 0 1 1 1
Mid. Atlantic 184 151 1,176 2,824 4,706 2 5 15 84 179New Jersey 4 23 271 588 2,067 — 1 7 13 42New York (Upstate) 148 76 1,150 1,314 821 1 1 11 18 24New York City — 1 33 1 190 — 2 8 37 93Pennsylvania 32 36 376 921 1,628 1 1 2 16 20
E.N. Central 2 11 152 245 1,015 1 2 8 49 76Illinois — 0 13 — 75 — 1 5 12 40Indiana — 0 4 6 11 — 0 3 6 3Michigan 2 1 7 19 9 — 0 2 8 15Ohio — 1 5 17 24 1 0 3 18 13Wisconsin — 9 139 203 896 — 0 3 5 5
W.N. Central 28 11 98 158 176 3 0 32 27 28Iowa — 1 8 28 48 — 0 1 1 4Kansas — 0 2 3 2 2 0 1 3 2Minnesota 28 6 96 111 120 — 0 30 14 11Missouri — 0 3 8 6 1 0 2 4 11Nebraska† — 0 2 7 — — 0 2 3 —North Dakota — 0 3 — — — 0 1 1 —South Dakota — 0 1 1 — — 0 1 1 —
S. Atlantic 22 28 124 579 937 3 7 16 167 136Delaware 3 9 37 235 357 — 0 1 5 2District of Columbia 2 0 2 11 4 — 0 2 2 3Florida — 1 5 14 12 1 1 6 27 22Georgia — 0 1 — 3 — 1 6 50 31Maryland† 11 13 87 239 457 1 1 9 36 48North Carolina — 0 5 15 26 — 0 8 13 15South Carolina† — 0 3 5 8 — 0 2 4 3Virginia† 6 3 22 57 67 1 1 9 29 11West Virginia — 0 44 3 3 — 0 2 1 1
E.S. Central 1 0 4 4 15 — 0 3 12 12Alabama† 1 0 1 1 — — 0 2 7 3Kentucky — 0 2 — 2 — 0 2 1 4Mississippi — 0 0 — — — 0 1 2 —Tennessee† — 0 4 3 13 — 0 2 2 5
W.S. Central — 0 5 3 47 — 2 31 33 50Arkansas — 0 1 — 3 — 0 2 1 3Louisiana — 0 0 — 3 — 0 1 — 2Oklahoma — 0 0 — — — 0 6 3 3Texas† — 0 5 3 41 — 1 29 29 42
Mountain 1 0 4 7 7 — 1 9 23 31Arizona — 0 4 2 — — 0 9 4 5Colorado — 0 1 1 — — 0 2 9 17Idaho† — 0 1 — 1 — 0 0 — —Montana — 0 0 — — — 0 1 1 —Nevada† — 0 1 — 2 — 0 1 1 2New Mexico† — 0 1 — 1 — 0 1 1 2Utah 1 0 1 4 1 — 0 2 7 4Wyoming — 0 1 — 2 — 0 1 — 1
Pacific 6 3 14 128 44 2 4 13 119 117Alaska 1 0 1 1 2 — 0 4 14 3California 5 3 14 126 27 1 3 10 82 88Hawaii N 0 0 N N — 0 1 1 11Oregon† — 0 2 1 13 — 0 2 7 4Washington — 0 3 — 2 1 0 5 15 11
American Samoa U 0 0 U U U 0 0 U UC.N.M.I. U 0 0 U U U 0 0 U UGuam — 0 0 — — — 0 0 — —Puerto Rico N 0 0 N N — 0 1 — 2U.S. Virgin Islands — 0 0 — — — 0 0 — —
C.N.M.I.: Commonwealth of Northern Mariana Islands.U: Unavailable. —: No reported cases. N: Not notifiable. Cum: Cumulative year-to-date counts. Med: Median. Max: Maximum.* Incidence data for reporting years 2005 and 2006 are provisional.†
Contains data reported through the National Electronic Disease Surveillance System (NEDSS).
Vol. 55 / No. 28 MMWR 785
United States 12 20 85 662 781 8 13 58 436 475 114 284 2,877 6,223 11,215
New England — 1 3 29 50 — 0 2 21 19 1 30 83 636 661Connecticut — 0 2 8 10 — 0 2 2 1 — 1 5 22 37Maine† — 0 1 3 2 — 0 1 3 2 — 1 5 23 16Massachusetts — 0 2 12 23 — 0 2 12 5 — 23 43 437 498New Hampshire — 0 2 4 9 — 0 2 4 9 — 2 36 77 32Rhode Island — 0 1 — 2 — 0 0 — — — 0 17 — 12Vermont† — 0 1 2 4 — 0 0 — 2 1 1 14 77 66
Mid. Atlantic 2 3 13 97 96 1 2 11 72 74 32 30 137 875 735New Jersey — 0 2 10 24 — 0 2 10 24 — 4 13 127 103New York (Upstate) 2 0 7 26 27 1 0 5 5 10 25 12 123 341 277New York City — 0 5 27 14 — 0 5 27 14 — 2 6 28 45Pennsylvania — 1 5 34 31 — 1 5 30 26 7 11 26 379 310
E.N. Central — 3 11 74 97 — 2 6 52 82 12 49 133 833 2,089Illinois — 0 4 17 23 — 0 4 17 23 — 9 35 99 484Indiana — 0 5 14 13 — 0 2 5 6 — 4 75 118 161Michigan — 1 3 16 16 — 0 3 9 10 1 6 23 203 123Ohio — 1 5 27 28 — 0 4 21 26 11 16 30 317 711Wisconsin — 0 2 — 17 — 0 2 — 17 — 9 41 96 610
W.N. Central 1 1 4 39 48 1 0 3 14 20 6 55 552 679 1,508Iowa — 0 2 9 12 — 0 1 3 1 — 12 63 152 397Kansas — 0 1 1 8 — 0 1 1 8 4 11 28 176 139Minnesota — 0 2 10 7 — 0 1 3 2 2 0 485 105 374Missouri 1 0 2 12 15 1 0 1 3 6 — 9 42 175 238Nebraska† — 0 2 5 4 — 0 1 3 3 — 4 15 58 160North Dakota — 0 1 1 — — 0 1 1 — — 0 26 4 76South Dakota — 0 1 1 2 — 0 0 — — — 1 8 9 124
S. Atlantic 4 3 14 117 145 2 1 7 49 58 15 23 92 517 760Delaware — 0 1 4 2 — 0 1 4 2 — 0 1 3 14District of Columbia — 0 1 — 4 — 0 1 — 3 — 0 3 3 4Florida — 1 6 45 55 — 1 5 18 17 8 4 14 119 95Georgia — 0 3 9 14 — 0 3 9 14 — 0 3 8 30Maryland† — 0 2 7 14 — 0 1 2 1 — 3 9 72 124North Carolina 2 0 11 22 21 — 0 3 5 4 4 0 21 105 61South Carolina† 1 0 2 13 12 1 0 1 5 8 3 4 22 78 235Virginia† 1 0 4 14 18 1 0 3 6 7 — 2 73 109 165West Virginia — 0 2 3 5 — 0 0 — 2 — 0 9 20 32
E.S. Central 1 1 4 26 37 — 1 4 21 28 10 7 22 151 312Alabama† — 0 1 4 4 — 0 1 4 3 1 1 7 38 44Kentucky — 0 2 7 14 — 0 2 7 14 — 1 7 22 86Mississippi — 0 1 1 4 — 0 1 1 4 — 0 4 15 38Tennessee† 1 0 2 14 15 — 0 2 9 7 9 2 10 76 144
W.S. Central — 1 23 35 81 — 0 6 12 19 1 22 360 302 1,165Arkansas — 0 3 6 10 — 0 2 4 2 1 2 21 40 175Louisiana — 0 1 — 25 — 0 1 — 4 — 0 3 — 33Oklahoma — 0 4 8 13 — 0 0 — 2 — 0 124 10 —Texas† — 1 16 21 33 — 0 4 8 11 — 21 215 252 957
Mountain — 1 4 39 62 — 0 4 17 16 28 65 230 1,599 2,331Arizona — 0 4 11 29 — 0 4 11 9 — 12 177 266 626Colorado — 0 2 14 13 — 0 1 2 — — 23 40 524 759Idaho† — 0 2 1 3 — 0 2 1 3 — 2 13 46 108Montana — 0 1 3 — — 0 1 1 — 6 3 19 75 438Nevada† — 0 2 2 6 — 0 1 — 1 — 0 9 35 35New Mexico† — 0 1 2 3 — 0 1 — 2 — 2 6 40 125Utah — 0 1 4 8 — 0 1 — 1 20 16 39 569 217Wyoming — 0 2 2 — — 0 2 2 — 2 1 8 44 23
Pacific 4 5 29 206 165 4 5 25 178 159 9 52 1,334 631 1,654Alaska — 0 1 1 1 — 0 1 1 1 — 2 15 36 23California 3 3 14 130 107 3 3 14 130 107 — 24 1,136 269 649Hawaii — 0 1 4 9 — 0 1 4 4 — 2 10 38 101Oregon† — 1 7 46 29 — 1 4 32 29 — 3 16 75 506Washington 1 0 25 25 19 1 0 11 11 18 9 10 195 213 375
American Samoa U 0 0 — — U 0 0 U U U 0 0 U UC.N.M.I. U 0 0 — — U 0 0 U U U 0 0 U UGuam — 0 1 — — — 0 1 — — — 0 0 — 2Puerto Rico — 0 1 4 6 — 0 1 4 6 — 0 1 — 4U.S. Virgin Islands — 0 0 — — — 0 0 — — — 0 0 — —
C.N.M.I.: Commonwealth of Northern Mariana Islands.U: Unavailable. —: No reported cases. N: Not notifiable. Cum: Cumulative year-to-date counts. Med: Median. Max: Maximum.* Incidence data for reporting years 2005 and 2006 are provisional.†
Contains data reported through the National Electronic Disease Surveillance System (NEDSS).
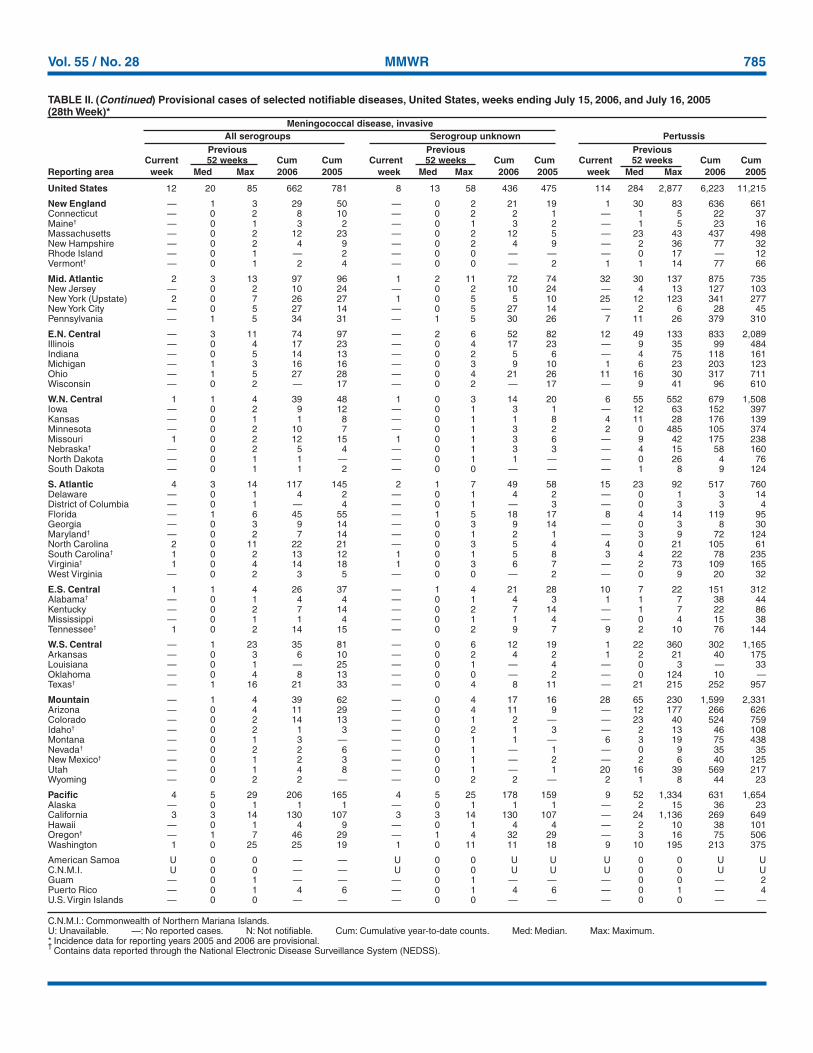
TABLE II. (Continued) Provisional cases of selected notifiable diseases, United States, weeks ending July 15, 2006, and July 16, 2005(28th Week)*
Meningococcal disease, invasive All serogroups Serogroup unknown PertussisPrevious Previous Previous
Current 52 weeks Cum Cum Current 52 weeks Cum Cum Current 52 weeks Cum CumReporting area week Med Max 2006 2005 week Med Max 2006 2005 week Med Max 2006 2005
786 MMWR July 21, 2006
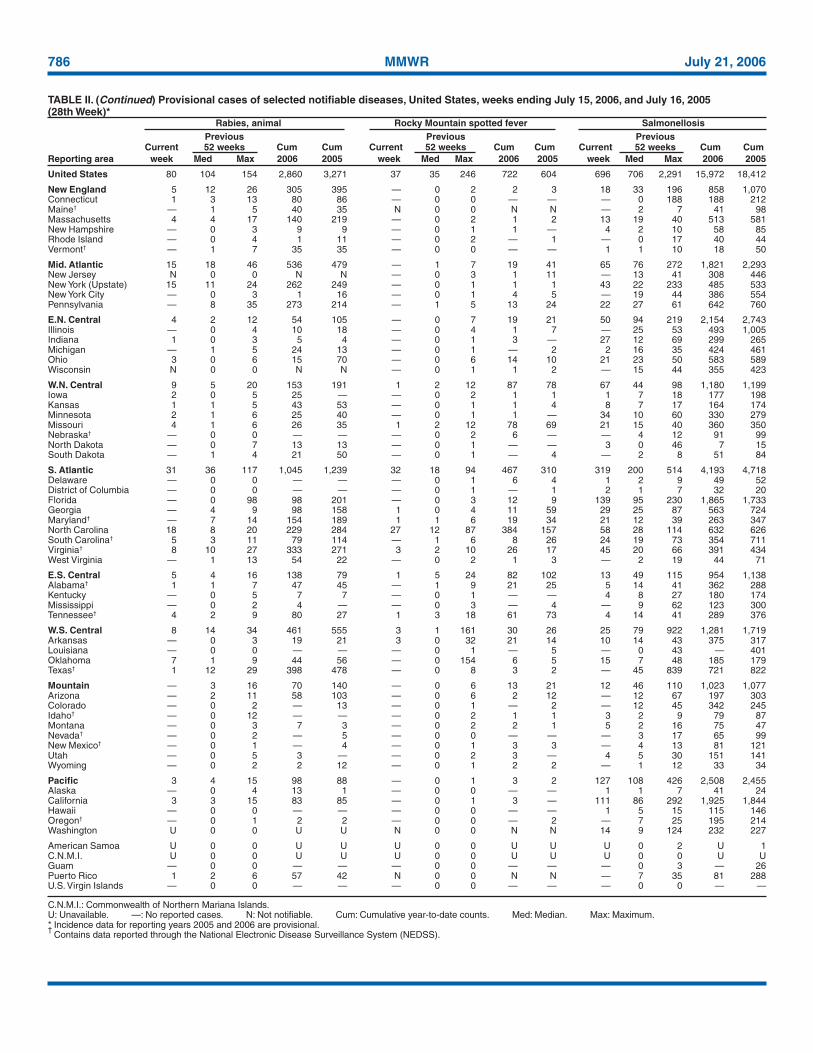
United States 80 104 154 2,860 3,271 37 35 246 722 604 696 706 2,291 15,972 18,412
New England 5 12 26 305 395 — 0 2 2 3 18 33 196 858 1,070Connecticut 1 3 13 80 86 — 0 0 — — — 0 188 188 212Maine† — 1 5 40 35 N 0 0 N N — 2 7 41 98Massachusetts 4 4 17 140 219 — 0 2 1 2 13 19 40 513 581New Hampshire — 0 3 9 9 — 0 1 1 — 4 2 10 58 85Rhode Island — 0 4 1 11 — 0 2 — 1 — 0 17 40 44Vermont† — 1 7 35 35 — 0 0 — — 1 1 10 18 50
Mid. Atlantic 15 18 46 536 479 — 1 7 19 41 65 76 272 1,821 2,293New Jersey N 0 0 N N — 0 3 1 11 — 13 41 308 446New York (Upstate) 15 11 24 262 249 — 0 1 1 1 43 22 233 485 533New York City — 0 3 1 16 — 0 1 4 5 — 19 44 386 554Pennsylvania — 8 35 273 214 — 1 5 13 24 22 27 61 642 760
E.N. Central 4 2 12 54 105 — 0 7 19 21 50 94 219 2,154 2,743Illinois — 0 4 10 18 — 0 4 1 7 — 25 53 493 1,005Indiana 1 0 3 5 4 — 0 1 3 — 27 12 69 299 265Michigan — 1 5 24 13 — 0 1 — 2 2 16 35 424 461Ohio 3 0 6 15 70 — 0 6 14 10 21 23 50 583 589Wisconsin N 0 0 N N — 0 1 1 2 — 15 44 355 423
W.N. Central 9 5 20 153 191 1 2 12 87 78 67 44 98 1,180 1,199Iowa 2 0 5 25 — — 0 2 1 1 1 7 18 177 198Kansas 1 1 5 43 53 — 0 1 1 4 8 7 17 164 174Minnesota 2 1 6 25 40 — 0 1 1 — 34 10 60 330 279Missouri 4 1 6 26 35 1 2 12 78 69 21 15 40 360 350Nebraska† — 0 0 — — — 0 2 6 — — 4 12 91 99North Dakota — 0 7 13 13 — 0 1 — — 3 0 46 7 15South Dakota — 1 4 21 50 — 0 1 — 4 — 2 8 51 84
S. Atlantic 31 36 117 1,045 1,239 32 18 94 467 310 319 200 514 4,193 4,718Delaware — 0 0 — — — 0 1 6 4 1 2 9 49 52District of Columbia — 0 0 — — — 0 1 — 1 2 1 7 32 20Florida — 0 98 98 201 — 0 3 12 9 139 95 230 1,865 1,733Georgia — 4 9 98 158 1 0 4 11 59 29 25 87 563 724Maryland† — 7 14 154 189 1 1 6 19 34 21 12 39 263 347North Carolina 18 8 20 229 284 27 12 87 384 157 58 28 114 632 626South Carolina† 5 3 11 79 114 — 1 6 8 26 24 19 73 354 711Virginia† 8 10 27 333 271 3 2 10 26 17 45 20 66 391 434West Virginia — 1 13 54 22 — 0 2 1 3 — 2 19 44 71
E.S. Central 5 4 16 138 79 1 5 24 82 102 13 49 115 954 1,138Alabama† 1 1 7 47 45 — 1 9 21 25 5 14 41 362 288Kentucky — 0 5 7 7 — 0 1 — — 4 8 27 180 174Mississippi — 0 2 4 — — 0 3 — 4 — 9 62 123 300Tennessee† 4 2 9 80 27 1 3 18 61 73 4 14 41 289 376
W.S. Central 8 14 34 461 555 3 1 161 30 26 25 79 922 1,281 1,719Arkansas — 0 3 19 21 3 0 32 21 14 10 14 43 375 317Louisiana — 0 0 — — — 0 1 — 5 — 0 43 — 401Oklahoma 7 1 9 44 56 — 0 154 6 5 15 7 48 185 179Texas† 1 12 29 398 478 — 0 8 3 2 — 45 839 721 822
Mountain — 3 16 70 140 — 0 6 13 21 12 46 110 1,023 1,077Arizona — 2 11 58 103 — 0 6 2 12 — 12 67 197 303Colorado — 0 2 — 13 — 0 1 — 2 — 12 45 342 245Idaho† — 0 12 — — — 0 2 1 1 3 2 9 79 87Montana — 0 3 7 3 — 0 2 2 1 5 2 16 75 47Nevada† — 0 2 — 5 — 0 0 — — — 3 17 65 99New Mexico† — 0 1 — 4 — 0 1 3 3 — 4 13 81 121Utah — 0 5 3 — — 0 2 3 — 4 5 30 151 141Wyoming — 0 2 2 12 — 0 1 2 2 — 1 12 33 34
Pacific 3 4 15 98 88 — 0 1 3 2 127 108 426 2,508 2,455Alaska — 0 4 13 1 — 0 0 — — 1 1 7 41 24California 3 3 15 83 85 — 0 1 3 — 111 86 292 1,925 1,844Hawaii — 0 0 — — — 0 0 — — 1 5 15 115 146Oregon† — 0 1 2 2 — 0 0 — 2 — 7 25 195 214Washington U 0 0 U U N 0 0 N N 14 9 124 232 227
American Samoa U 0 0 U U U 0 0 U U U 0 2 U 1C.N.M.I. U 0 0 U U U 0 0 U U U 0 0 U UGuam — 0 0 — — — 0 0 — — — 0 3 — 26Puerto Rico 1 2 6 57 42 N 0 0 N N — 7 35 81 288U.S. Virgin Islands — 0 0 — — — 0 0 — — — 0 0 — —
C.N.M.I.: Commonwealth of Northern Mariana Islands.U: Unavailable. —: No reported cases. N: Not notifiable. Cum: Cumulative year-to-date counts. Med: Median. Max: Maximum.* Incidence data for reporting years 2005 and 2006 are provisional.†
Contains data reported through the National Electronic Disease Surveillance System (NEDSS).
TABLE II. (Continued) Provisional cases of selected notifiable diseases, United States, weeks ending July 15, 2006, and July 16, 2005(28th Week)*
Rabies, animal Rocky Mountain spotted fever SalmonellosisPrevious Previous Previous
Current 52 weeks Cum Cum Current 52 weeks Cum Cum Current 52 weeks Cum CumReporting area week Med Max 2006 2005 week Med Max 2006 2005 week Med Max 2006 2005

Vol. 55 / No. 28 MMWR 787
United States 56 51 297 835 1,098 126 211 1,013 4,678 6,612 42 85 283 2,932 2,875
New England — 3 23 67 98 3 4 31 126 134 3 5 15 137 175Connecticut — 0 22 22 26 — 0 25 25 24 U 0 3 U 69Maine§ — 0 5 — 16 — 0 3 2 6 — 0 2 10 9Massachusetts — 1 7 34 36 3 4 11 86 85 1 3 6 84 72New Hampshire — 0 2 7 9 — 0 4 5 4 2 0 9 30 9Rhode Island — 0 2 2 2 — 0 6 5 9 — 0 3 4 7Vermont§ — 0 2 2 9 — 0 4 3 6 — 0 2 9 9
Mid. Atlantic 7 5 107 60 130 7 16 72 337 639 7 14 43 547 618New Jersey — 1 7 3 30 — 4 15 97 186 — 2 6 68 127New York (Upstate) — 1 103 19 52 5 4 60 115 148 5 4 32 210 180New York City — 0 3 9 7 — 4 14 81 253 — 2 10 65 122Pennsylvania — 0 8 — 41 2 2 48 44 52 2 5 13 204 189
E.N. Central 7 10 38 176 214 3 20 96 440 477 4 16 42 550 617Illinois — 1 10 20 58 — 7 26 123 122 — 4 10 111 207Indiana 2 1 6 27 26 — 2 56 73 44 2 1 11 80 59Michigan 1 1 8 31 40 1 3 10 92 136 1 3 11 148 153Ohio 4 3 14 62 48 2 3 11 90 45 1 4 19 175 131Wisconsin — 2 15 36 42 — 3 10 62 130 — 1 4 36 67
W.N. Central 8 7 35 141 161 22 42 78 712 615 1 5 57 222 178Iowa 2 1 10 53 37 2 1 7 36 45 N 0 0 N NKansas — 0 4 — 17 6 4 20 62 53 1 1 5 42 29Minnesota 5 3 19 71 26 7 2 8 51 34 — 0 52 106 64Missouri 5 2 9 77 45 7 20 70 456 422 — 1 5 42 46Nebraska§ 1 1 5 19 23 — 2 11 39 41 — 0 4 19 17North Dakota — 0 15 — 1 — 0 2 4 2 — 0 5 7 6South Dakota — 0 5 14 12 — 2 17 64 18 — 0 3 6 16
S. Atlantic 19 7 39 153 157 55 51 122 1,274 980 20 21 41 687 550Delaware — 0 2 1 2 — 0 2 2 8 — 0 2 7 1District of Columbia — 0 1 — — — 0 2 6 8 — 0 2 9 7Florida 5 1 29 47 60 31 25 66 612 479 8 5 12 158 145Georgia — 1 6 28 18 17 14 38 429 246 4 4 12 134 112Maryland§ 4 1 5 17 24 1 2 8 39 36 4 3 12 123 110North Carolina 4 1 11 39 19 3 1 22 95 95 1 0 26 106 81South Carolina§ — 0 2 4 3 — 1 9 59 53 — 0 6 43 27Virginia§ — 0 8 — 30 3 1 9 32 55 3 2 11 86 52West Virginia — 0 2 — 1 — 0 1 — — — 0 6 21 15
E.S. Central 5 2 11 50 61 4 14 35 330 769 3 3 11 133 120Alabama§ — 0 3 8 15 2 3 14 99 160 N 0 0 N NKentucky 1 1 8 17 19 1 6 23 146 130 — 0 5 28 25Mississippi — 0 2 — 2 — 1 6 28 46 — 0 0 — —Tennessee§ — 1 4 25 25 1 3 11 57 433 3 3 9 105 95
W.S. Central 1 1 52 11 48 2 29 596 387 1,809 3 6 58 223 181Arkansas — 0 2 4 7 1 1 7 42 32 — 0 5 18 11Louisiana — 0 2 — 14 — 0 11 — 78 — 0 1 — 4Oklahoma 1 0 8 7 12 1 4 286 54 405 1 2 14 67 72Texas§ — 1 44 32 15 — 24 308 291 1,294 2 4 43 138 94
Mountain — 4 15 70 117 2 17 47 298 328 — 10 78 379 378Arizona — 0 4 16 13 — 8 29 131 172 — 3 57 180 166Colorado — 1 6 30 28 — 3 18 63 49 — 3 8 92 124Idaho§ 2 1 7 25 17 — 0 4 6 5 — 0 2 8 2Montana — 0 2 — 7 — 0 1 4 5 — 0 0 — —Nevada§ — 0 3 7 12 — 1 8 28 29 — 0 6 — 1New Mexico§ — 0 3 4 14 — 2 9 35 48 — 1 7 46 48Utah 4 1 7 28 24 2 1 4 30 20 — 1 6 50 35Wyoming — 0 3 6 2 — 0 1 1 — — 0 1 3 2
Pacific 9 7 55 107 112 28 40 148 774 861 1 2 9 54 58Alaska — 0 2 — 6 — 0 2 7 10 — 0 0 — —California 6 4 18 70 48 27 32 104 605 746 — 0 0 — —Hawaii — 0 4 6 4 — 0 4 20 14 1 2 9 54 58Oregon§ — 2 47 30 36 — 2 31 71 43 N 0 0 N NWashington 3 2 32 31 18 1 2 43 71 48 N 0 0 N N
American Samoa U 0 0 U U U 0 2 U 3 U 0 0 U UC.N.M.I. U 0 0 U U U 0 0 U U U 0 0 U UGuam — 0 0 — — — 0 3 — 9 — 0 0 — —Puerto Rico — 0 1 — — — 0 2 4 2 N 0 0 N NU.S. Virgin Islands — 0 0 — — — 0 0 — — — 0 0 — —
C.N.M.I.: Commonwealth of Northern Mariana Islands.U: Unavailable. —: No reported cases. N: Not notifiable. Cum: Cumulative year-to-date counts. Med: Median. Max: Maximum.* Incidence data for reporting years 2005 and 2006 are provisional.†
Includes E. coli O157:H7; Shiga toxin positive, serogroup non-0157; and Shiga toxin positive, not serogrouped.§
Contains data reported through the National Electronic Disease Surveillance System (NEDSS).
TABLE II. (Continued) Provisional cases of selected notifiable diseases, United States, weeks ending July 15, 2006, and July 16, 2005(28th Week)*
Shiga toxin-producing E. coli (STEC)† Shigellosis Streptococcal disease, invasive, group APrevious Previous Previous
Current 52 weeks Cum Cum Current 52 weeks Cum Cum Current 52 weeks Cum CumReporting area week Med Max 2006 2005 week Med Max 2006 2005 week Med Max 2006 2005

788 MMWR July 21, 2006
United States 27 51 334 1,574 1,691 106 167 334 4,312 4,410 342 799 3,204 26,638 16,612
New England — 1 24 16 153 5 4 17 109 111 46 43 144 987 3,481Connecticut U 0 7 U 64 — 0 11 22 23 U 0 58 U 980Maine† N 0 0 N N — 0 2 8 1 — 5 20 151 208Massachusetts — 0 6 — 67 5 2 5 68 75 — 13 54 92 1,558New Hampshire — 0 0 — — — 0 2 6 7 43 5 30 260 198Rhode Island — 0 11 6 14 — 0 6 3 5 — 0 0 — —Vermont† — 0 2 10 8 — 0 1 2 — 3 12 50 484 537
Mid. Atlantic 1 3 15 102 151 11 21 35 580 541 40 103 183 3,051 3,062New Jersey N 0 0 N N — 2 7 81 74 — 0 0 — —New York (Upstate) 1 1 10 39 62 3 2 14 82 35 — 0 0 — —New York City U 0 0 U U 3 10 22 287 340 — 0 0 — —Pennsylvania — 2 9 63 89 5 5 9 130 92 40 103 183 3,051 3,062
E.N. Central 2 11 41 386 420 8 18 38 445 476 48 213 576 9,736 3,718Illinois — 1 3 12 17 — 9 23 214 260 — 1 5 12 59Indiana — 2 21 103 133 — 1 4 32 37 N 0 347 N 70Michigan — 0 4 15 28 6 2 19 62 40 9 102 174 2,976 2,356Ohio 2 6 32 256 242 2 4 11 114 119 39 82 420 6,328 943Wisconsin N 0 0 N N — 1 3 23 20 — 10 41 420 290
W.N. Central 2 1 191 31 28 2 4 9 130 147 3 22 84 983 241Iowa N 0 0 N N — 0 3 9 4 N 0 0 N NKansas N 0 0 N N — 0 2 12 12 — 0 0 — —Minnesota — 0 191 — — — 1 3 16 47 — 0 0 — —Missouri 2 1 3 31 22 2 3 8 92 81 3 16 82 926 153Nebraska† — 0 0 — 2 — 0 1 1 3 — 0 0 — —North Dakota — 0 1 — 1 — 0 1 — — — 0 25 25 12South Dakota — 0 0 — 3 — 0 1 — — — 1 12 32 76
S. Atlantic 19 24 53 841 683 28 43 186 1,007 1,027 16 90 860 2,830 1,266Delaware — 0 2 — 1 1 0 2 14 6 — 1 5 43 22District of Columbia 1 0 3 20 12 2 1 9 57 61 — 0 5 21 19Florida 14 13 36 458 360 16 14 29 382 382 — 0 0 — —Georgia 2 7 29 281 229 — 8 147 128 171 — 0 0 — —Maryland† — 0 0 — — 2 5 19 163 163 — 0 0 — —North Carolina N 0 0 N N 1 5 17 150 136 — 0 0 — —South Carolina† — 0 0 — — 1 1 7 39 31 2 16 53 726 346Virginia† N 0 0 N N 5 2 12 73 75 8 27 812 1,044 217West Virginia 2 1 14 82 81 — 0 1 1 2 6 26 70 996 662
E.S. Central — 3 13 122 122 9 11 21 326 244 3 0 70 65 7Alabama† N 0 0 N N — 3 12 124 89 3 0 70 65 7Kentucky — 0 5 23 22 2 1 8 35 19 N 0 0 N NMississippi — 0 0 — 1 — 0 6 31 28 — 0 0 — —Tennessee† — 2 13 99 99 7 4 12 136 108 N 0 0 N N
W.S. Central — 0 4 11 95 29 25 40 753 678 182 206 1,757 7,209 3,102Arkansas — 0 3 11 12 2 0 6 38 30 37 5 110 553 —Louisiana — 0 4 — 83 7 4 17 109 144 — 0 7 — 108Oklahoma N 0 0 N N 3 1 6 39 21 — 0 0 — —Texas† N 0 0 N N 17 18 29 567 483 145 202 1,647 6,656 2,994
Mountain 3 1 27 65 39 3 7 17 200 225 4 52 138 1,777 1,735Arizona N 0 0 N N 3 4 13 97 72 — 0 0 — —Colorado N 0 0 N N — 1 3 20 26 — 33 76 939 1,181Idaho† N 0 0 N N — 0 1 2 18 — 0 0 — —Montana — 0 1 — — — 0 1 1 5 — 0 0 — —Nevada† — 0 27 4 2 — 1 12 44 68 — 0 2 4 —New Mexico† — 0 1 1 — — 1 5 34 29 — 3 34 280 150Utah 2 0 8 28 17 — 0 1 2 7 4 10 55 526 359Wyoming 1 0 3 32 20 — 0 0 — — — 0 8 28 45
Pacific — 0 0 — — 11 33 49 762 961 — 0 0 — —Alaska — 0 0 — — — 0 4 5 5 — 0 0 — —California N 0 0 N N 3 27 42 628 869 — 0 0 — —Hawaii — 0 0 — — — 0 2 11 4 N 0 0 N NOregon† N 0 0 N N — 0 6 9 16 N 0 0 N NWashington N 0 0 N N 8 3 11 109 67 N 0 0 N N
American Samoa — 0 0 — — U 0 0 U U U 0 0 U UC.N.M.I. — 0 0 — — U 0 0 U U U 0 0 U UGuam — 0 0 — — — 0 0 — 3 — 2 12 — 373Puerto Rico N 0 0 N N — 3 16 54 126 — 8 47 178 443U.S. Virgin Islands — 0 0 — — — 0 0 — — — 0 0 — —
C.N.M.I.: Commonwealth of Northern Mariana Islands.U: Unavailable. —: No reported cases. N: Not notifiable. Cum: Cumulative year-to-date counts. Med: Median. Max: Maximum.* Incidence data for reporting years 2005 and 2006 are provisional.†
Contains data reported through the National Electronic Disease Surveillance System (NEDSS).
TABLE II. (Continued) Provisional cases of selected notifiable diseases, United States, weeks ending July 15, 2006, and July 16, 2005(28th Week)*
Streptococcus pneumoniae, invasive diseaseDrug resistant, all ages Syphilis, primary and secondary Varicella (chickenpox)
Previous Previous PreviousCurrent 52 weeks Cum Cum Current 52 weeks Cum Cum Current 52 weeks Cum Cum
Reporting area week Med Max 2006 2005 week Med Max 2006 2005 week Med Max 2006 2005

Vol. 55 / No. 28 MMWR 789
TABLE II. (Continued) Provisional cases of selected notifiable diseases, United States, weeks ending July 15, 2006, and July 16, 2005(28th Week)*
West Nile virus disease†
Neuroinvasive Non-neuroinvasivePrevious Previous
Current 52 weeks Cum Cum Current 52 weeks Cum CumReporting area week Med Max 2006 2005 week Med Max 2006 2005
United States — 1 155 9 75 — 0 203 5 159
New England — 0 3 — — — 0 2 — —Connecticut — 0 2 — — — 0 1 — —Maine§ — 0 0 — — — 0 0 — —Massachusetts — 0 3 — — — 0 1 — —New Hampshire — 0 0 — — — 0 0 — —Rhode Island — 0 1 — — — 0 0 — —Vermont§ — 0 0 — — — 0 0 — —
Mid. Atlantic — 0 10 — 1 — 0 4 — 2New Jersey — 0 1 — — — 0 2 — —New York (Upstate) — 0 7 — — — 0 2 — —New York City — 0 2 — — — 0 2 — —Pennsylvania — 0 3 — 1 — 0 2 — 2
E.N. Central — 0 39 — 6 — 0 18 — 1Illinois — 0 25 — 2 — 0 16 — —Indiana — 0 2 — 1 — 0 1 — —Michigan — 0 14 — — — 0 3 — —Ohio — 0 9 — 2 — 0 4 — —Wisconsin — 0 3 — 1 — 0 2 — 1
W.N. Central — 0 26 3 7 — 0 80 4 29Iowa — 0 3 — — — 0 5 1 —Kansas — 0 3 — 1 N 0 0 N NMinnesota — 0 5 — 2 — 0 5 — 3Missouri — 0 4 1 1 — 0 3 — —Nebraska§ — 0 9 1 1 — 0 24 1 4North Dakota — 0 4 — — — 0 15 — 4South Dakota — 0 7 1 2 — 0 33 2 18
S. Atlantic — 0 6 — 2 — 0 4 — 2Delaware — 0 1 — — — 0 0 — —District of Columbia — 0 1 — — — 0 1 — —Florida — 0 2 — 2 — 0 4 — 1Georgia — 0 3 — — — 0 3 — 1Maryland§ — 0 2 — — — 0 1 — —North Carolina — 0 1 — — — 0 1 — —South Carolina§ — 0 1 — — — 0 0 — —Virginia§ — 0 0 — — — 0 1 — —West Virginia — 0 0 — — N 0 0 N N
E.S. Central — 0 10 2 2 — 0 5 — 3Alabama§ — 0 1 — — — 0 2 — —Kentucky — 0 1 — — — 0 0 — —Mississippi — 0 9 2 2 — 0 5 — 3Tennessee§ — 0 3 — — — 0 1 — —
W.S. Central — 0 32 2 19 — 0 22 — 10Arkansas — 0 3 — — — 0 2 — 2Louisiana — 0 20 — 5 — 0 9 — 3Oklahoma — 0 6 — 1 — 0 3 — —Texas§ — 0 16 2 13 — 0 13 — 5
Mountain — 0 16 1 6 — 0 39 1 25Arizona — 0 8 — 4 — 0 8 — 10Colorado — 0 5 1 — — 0 13 — 11Idaho§ — 0 2 — — — 0 3 1 —Montana — 0 3 — — — 0 9 — —Nevada§ — 0 3 — 1 — 0 8 — 2New Mexico§ — 0 3 — 1 — 0 4 — 2Utah — 0 6 — — — 0 8 — —Wyoming — 0 2 — — — 0 1 — —
Pacific — 0 50 1 32 — 0 90 — 87Alaska — 0 0 — — — 0 0 — —California — 0 50 1 32 — 0 89 — 86Hawaii — 0 0 — — — 0 0 — —Oregon§ — 0 1 — — — 0 2 — 1Washington — 0 0 — — — 0 0 — —
American Samoa U 0 0 U U U 0 0 U UC.N.M.I. U 0 0 U U U 0 0 U UGuam — 0 0 — — — 0 0 — —Puerto Rico — 0 0 — — — 0 0 — —U.S. Virgin Islands — 0 0 — — — 0 0 — —
C.N.M.I.: Commonwealth of Northern Mariana Islands.U: Unavailable. —: No reported cases. N: Not notifiable. Cum: Cumulative year-to-date counts. Med: Median. Max: Maximum.* Incidence data for reporting years 2005 and 2006 are provisional.†
Updated weekly from reports to the Division of Vector-Borne Infectious Diseases, National Center for Infectious Diseases (ArboNet Surveillance).§
Contains data reported through the National Electronic Disease Surveillance System (NEDSS).
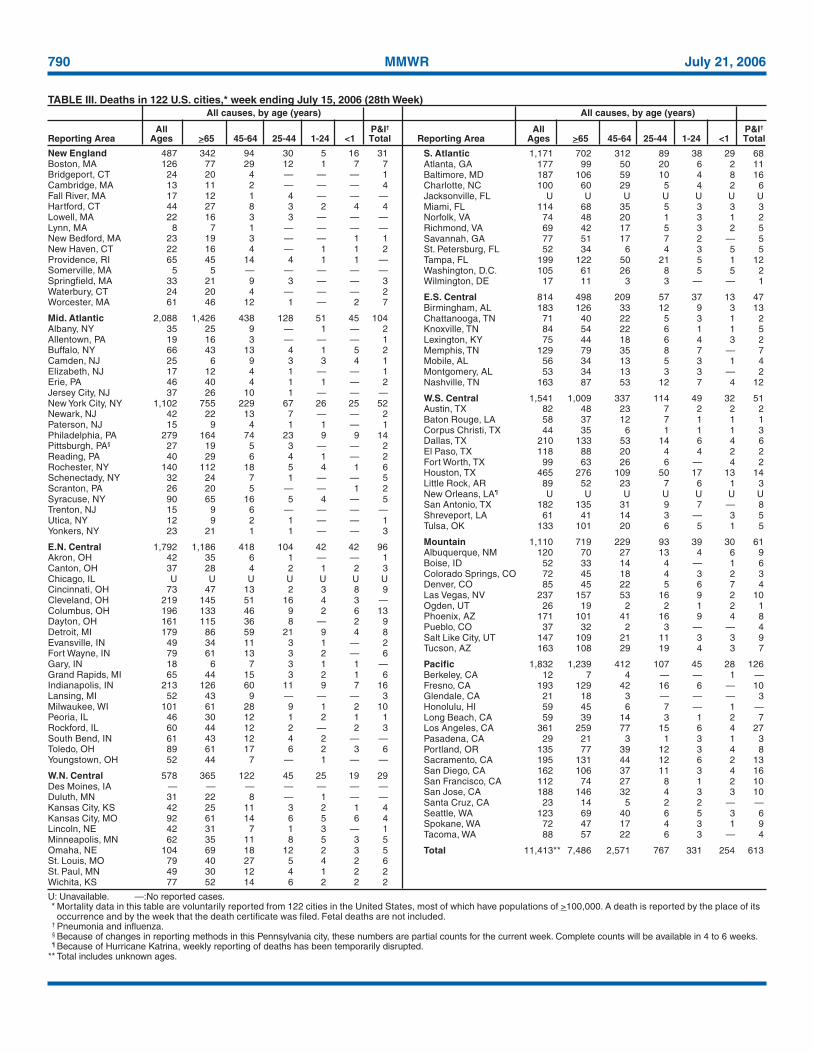
790 MMWR July 21, 2006
TABLE III. Deaths in 122 U.S. cities,* week ending July 15, 2006 (28th Week)All causes, by age (years) All causes, by age (years)
All P&I† All P&I†
Reporting Area Ages >65 45-64 25-44 1-24 <1 Total Reporting Area Ages >65 45-64 25-44 1-24 <1 Total
U: Unavailable. —:No reported cases.* Mortality data in this table are voluntarily reported from 122 cities in the United States, most of which have populations of >100,000. A death is reported by the place of its
occurrence and by the week that the death certificate was filed. Fetal deaths are not included.† Pneumonia and influenza.§ Because of changes in reporting methods in this Pennsylvania city, these numbers are partial counts for the current week. Complete counts will be available in 4 to 6 weeks.¶ Because of Hurricane Katrina, weekly reporting of deaths has been temporarily disrupted.
** Total includes unknown ages.
New England 487 342 94 30 5 16 31Boston, MA 126 77 29 12 1 7 7Bridgeport, CT 24 20 4 — — — 1Cambridge, MA 13 11 2 — — — 4Fall River, MA 17 12 1 4 — — —Hartford, CT 44 27 8 3 2 4 4Lowell, MA 22 16 3 3 — — —Lynn, MA 8 7 1 — — — —New Bedford, MA 23 19 3 — — 1 1New Haven, CT 22 16 4 — 1 1 2Providence, RI 65 45 14 4 1 1 —Somerville, MA 5 5 — — — — —Springfield, MA 33 21 9 3 — — 3Waterbury, CT 24 20 4 — — — 2Worcester, MA 61 46 12 1 — 2 7
Mid. Atlantic 2,088 1,426 438 128 51 45 104Albany, NY 35 25 9 — 1 — 2Allentown, PA 19 16 3 — — — 1Buffalo, NY 66 43 13 4 1 5 2Camden, NJ 25 6 9 3 3 4 1Elizabeth, NJ 17 12 4 1 — — 1Erie, PA 46 40 4 1 1 — 2Jersey City, NJ 37 26 10 1 — — —New York City, NY 1,102 755 229 67 26 25 52Newark, NJ 42 22 13 7 — — 2Paterson, NJ 15 9 4 1 1 — 1Philadelphia, PA 279 164 74 23 9 9 14Pittsburgh, PA§ 27 19 5 3 — — 2Reading, PA 40 29 6 4 1 — 2Rochester, NY 140 112 18 5 4 1 6Schenectady, NY 32 24 7 1 — — 5Scranton, PA 26 20 5 — — 1 2Syracuse, NY 90 65 16 5 4 — 5Trenton, NJ 15 9 6 — — — —Utica, NY 12 9 2 1 — — 1Yonkers, NY 23 21 1 1 — — 3
E.N. Central 1,792 1,186 418 104 42 42 96Akron, OH 42 35 6 1 — — 1Canton, OH 37 28 4 2 1 2 3Chicago, IL U U U U U U UCincinnati, OH 73 47 13 2 3 8 9Cleveland, OH 219 145 51 16 4 3 —Columbus, OH 196 133 46 9 2 6 13Dayton, OH 161 115 36 8 — 2 9Detroit, MI 179 86 59 21 9 4 8Evansville, IN 49 34 11 3 1 — 2Fort Wayne, IN 79 61 13 3 2 — 6Gary, IN 18 6 7 3 1 1 —Grand Rapids, MI 65 44 15 3 2 1 6Indianapolis, IN 213 126 60 11 9 7 16Lansing, MI 52 43 9 — — — 3Milwaukee, WI 101 61 28 9 1 2 10Peoria, IL 46 30 12 1 2 1 1Rockford, IL 60 44 12 2 — 2 3South Bend, IN 61 43 12 4 2 — —Toledo, OH 89 61 17 6 2 3 6Youngstown, OH 52 44 7 — 1 — —
W.N. Central 578 365 122 45 25 19 29Des Moines, IA — — — — — — —Duluth, MN 31 22 8 — 1 — —Kansas City, KS 42 25 11 3 2 1 4Kansas City, MO 92 61 14 6 5 6 4Lincoln, NE 42 31 7 1 3 — 1Minneapolis, MN 62 35 11 8 5 3 5Omaha, NE 104 69 18 12 2 3 5St. Louis, MO 79 40 27 5 4 2 6St. Paul, MN 49 30 12 4 1 2 2Wichita, KS 77 52 14 6 2 2 2
S. Atlantic 1,171 702 312 89 38 29 68Atlanta, GA 177 99 50 20 6 2 11Baltimore, MD 187 106 59 10 4 8 16Charlotte, NC 100 60 29 5 4 2 6Jacksonville, FL U U U U U U UMiami, FL 114 68 35 5 3 3 3Norfolk, VA 74 48 20 1 3 1 2Richmond, VA 69 42 17 5 3 2 5Savannah, GA 77 51 17 7 2 — 5St. Petersburg, FL 52 34 6 4 3 5 5Tampa, FL 199 122 50 21 5 1 12Washington, D.C. 105 61 26 8 5 5 2Wilmington, DE 17 11 3 3 — — 1
E.S. Central 814 498 209 57 37 13 47Birmingham, AL 183 126 33 12 9 3 13Chattanooga, TN 71 40 22 5 3 1 2Knoxville, TN 84 54 22 6 1 1 5Lexington, KY 75 44 18 6 4 3 2Memphis, TN 129 79 35 8 7 — 7Mobile, AL 56 34 13 5 3 1 4Montgomery, AL 53 34 13 3 3 — 2Nashville, TN 163 87 53 12 7 4 12
W.S. Central 1,541 1,009 337 114 49 32 51Austin, TX 82 48 23 7 2 2 2Baton Rouge, LA 58 37 12 7 1 1 1Corpus Christi, TX 44 35 6 1 1 1 3Dallas, TX 210 133 53 14 6 4 6El Paso, TX 118 88 20 4 4 2 2Fort Worth, TX 99 63 26 6 — 4 2Houston, TX 465 276 109 50 17 13 14Little Rock, AR 89 52 23 7 6 1 3New Orleans, LA¶ U U U U U U USan Antonio, TX 182 135 31 9 7 — 8Shreveport, LA 61 41 14 3 — 3 5Tulsa, OK 133 101 20 6 5 1 5
Mountain 1,110 719 229 93 39 30 61Albuquerque, NM 120 70 27 13 4 6 9Boise, ID 52 33 14 4 — 1 6Colorado Springs, CO 72 45 18 4 3 2 3Denver, CO 85 45 22 5 6 7 4Las Vegas, NV 237 157 53 16 9 2 10Ogden, UT 26 19 2 2 1 2 1Phoenix, AZ 171 101 41 16 9 4 8Pueblo, CO 37 32 2 3 — — 4Salt Like City, UT 147 109 21 11 3 3 9Tucson, AZ 163 108 29 19 4 3 7
Pacific 1,832 1,239 412 107 45 28 126Berkeley, CA 12 7 4 — — 1 —Fresno, CA 193 129 42 16 6 — 10Glendale, CA 21 18 3 — — — 3Honolulu, HI 59 45 6 7 — 1 —Long Beach, CA 59 39 14 3 1 2 7Los Angeles, CA 361 259 77 15 6 4 27Pasadena, CA 29 21 3 1 3 1 3Portland, OR 135 77 39 12 3 4 8Sacramento, CA 195 131 44 12 6 2 13San Diego, CA 162 106 37 11 3 4 16San Francisco, CA 112 74 27 8 1 2 10San Jose, CA 188 146 32 4 3 3 10Santa Cruz, CA 23 14 5 2 2 — —Seattle, WA 123 69 40 6 5 3 6Spokane, WA 72 47 17 4 3 1 9Tacoma, WA 88 57 22 6 3 — 4
Total 11,413** 7,486 2,571 767 331 254 613
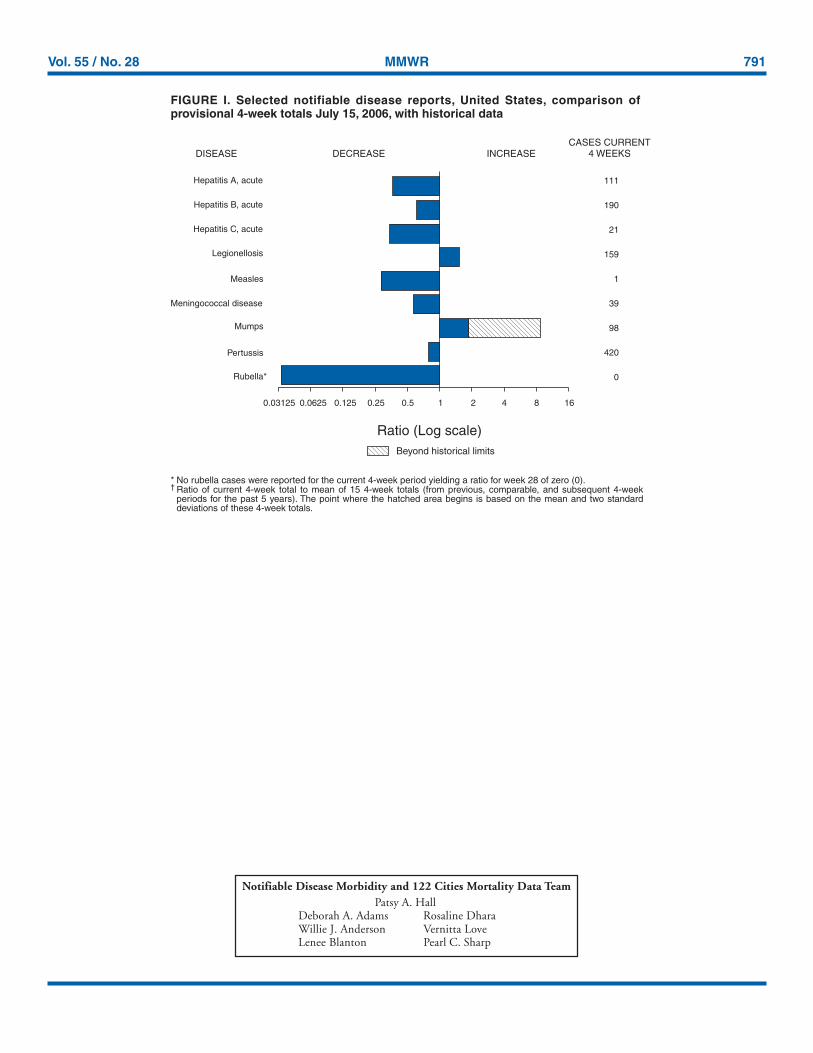
Vol. 55 / No. 28 MMWR 791
Notifiable Disease Morbidity and 122 Cities Mortality Data TeamPatsy A. Hall
Deborah A. Adams Rosaline DharaWillie J. Anderson Vernitta LoveLenee Blanton Pearl C. Sharp
* No rubella cases were reported for the current 4-week period yielding a ratio for week 28 of zero (0).† Ratio of current 4-week total to mean of 15 4-week totals (from previous, comparable, and subsequent 4-week
periods for the past 5 years). The point where the hatched area begins is based on the mean and two standarddeviations of these 4-week totals.
FIGURE I. Selected notifiable disease reports, United States, comparison ofprovisional 4-week totals July 15, 2006, with historical data
DISEASE DECREASE INCREASECASES CURRENT
4 WEEKS
Ratio (Log scale)Beyond historical limits
4210.50.250.125
111
190
21
159
1
39
98
420
0
Hepatitis A, acute
Hepatitis B, acute
Hepatitis C, acute
Legionellosis
Measles
Mumps
Pertussis
Rubella*
Meningococcal disease
0.06250.03125 8 16

MMWR
The Morbidity and Mortality Weekly Report (MMWR) Series is prepared by the Centers for Disease Control and Prevention (CDC) and is available free of chargein electronic format. To receive an electronic copy each week, send an e-mail message to [email protected]. The body content should read SUBscribe mmwr-toc. Electronic copy also is available from CDC’s Internet server at http://www.cdc.gov/mmwr or from CDC’s file transfer protocol server at ftp://ftp.cdc.gov/pub/publications/mmwr. Paper copy subscriptions are available through the Superintendent of Documents, U.S. Government Printing Office, Washington, DC20402; telephone 202-512-1800.
Data in the weekly MMWR are provisional, based on weekly reports to CDC by state health departments. The reporting week concludes at close of business onFriday; compiled data on a national basis are officially released to the public on the following Friday. Data are compiled in the National Center for Public HealthInformatics, Division of Integrated Surveillance Systems and Services. Address all inquiries about the MMWR Series, including material to be considered forpublication, to Editor, MMWR Series, Mailstop E-90, CDC, 1600 Clifton Rd., N.E., Atlanta, GA 30333 or to [email protected].
All material in the MMWR Series is in the public domain and may be used and reprinted without permission; citation as to source, however, is appreciated.
Use of trade names and commercial sources is for identification only and does not imply endorsement by the U.S. Department of Health and Human Services.
References to non-CDC sites on the Internet are provided as a service to MMWR readers and do not constitute or imply endorsement of these organizations ortheir programs by CDC or the U.S. Department of Health and Human Services. CDC is not responsible for the content of these sites. URL addresses listed inMMWR were current as of the date of publication.
✩U.S. Government Printing Office: 2006-523-056/40061 Region IV ISSN: 0149-2195
792 July 21, 2006