morbidity and mortality weekly report · morbidity and mortality weekly report 434 mmwr / may 17,...
TRANSCRIPT

Morbidity and Mortality Weekly ReportWeekly / Vol. 68 / No. 19 May 17, 2019
INSIDE439 Tuberculosis Screening, Testing, and Treatment of
U.S. Health Care Personnel: Recommendations from the National Tuberculosis Controllers Association and CDC, 2019
444 Notes from the Field: Measles Outbreaks from Imported Cases in Orthodox Jewish Communities — New York and New Jersey, 2018–2019
446 Notes from the Field: Community Outbreak of Measles — Clark County, Washington, 2018–2019
448 Notes from the Field: Acanthamoeba Keratitis Cases — Iowa, 2002–2017
450 QuickStats
Continuing Education examination available at https://www.cdc.gov/mmwr/cme/conted_info.html#weekly.
U.S. Department of Health and Human ServicesCenters for Disease Control and Prevention
Healthy and Safe Swimming Week — May 20–26, 2019
This year’s Healthy and Safe Swimming Week theme, “Pool Chemistry for Healthy and Safe Swimming,” focuses on prevent-ing pool chemical injuries. Pool chemicals prevent the spread of germs that cause illnesses and disease outbreaks; however, these same chemicals can cause injuries if mishandled. Each year, an estimated 3,000–5,000 emergency department visits caused by pool chemical injuries (e.g., poisonings from inhalation or inges-tion of pool chemicals and dermatitis or conjunctivitis from pool chemical splashes) occur in the United States.
This issue of MMWR includes a report focusing on pool chemical injuries leading to U.S. emergency department visits during 2008–2017 and a 2018 toxic chlorine gas inci-dent in New York (1). Following product label directions, wearing proper safety equipment (e.g., respirator or goggles) when handling chemicals, and keeping chemicals out of the reach of children and teens can help prevent these injuries.
CDC’s Model Aquatic Health Code (MAHC; https://www.cdc.gov/mahc) is a set of recommendations that can be voluntarily adopted by state and local jurisdictions to help prevent pool chemical injuries, disease outbreaks, and drowning associated with public treated recreational water venues (e.g., pools, hot tubs/spas, and water playgrounds at hotels and apartment complexes). Swimmers can help by showering before getting in the water, never urinating or defecating in the water, and taking young children on bathroom breaks or checking their diapers every hour.
CDC updates the MAHC every 3 years in coordination with the Council for the MAHC (https://www.cmahc.org/). CDC encourages public health officials to submit MAHC change requests to CMAHC by January 6, 2020, (https://www.cmahc.org/enter-change-request.php) to be considered for the 2021 MAHC (4th edition).
Reference1. Vanden Esschert K, Haileyesus T, Tarrier AL, et al. Pool chemical injuries
in public and residential settings—United States, 2008–2017, and New York, 2018. MMWR Morb Mortal Wkly Rep 2019;68:433–8.
Pool Chemical Injuries in Public and Residential Settings — United States,
2008–2017, and New York, 2018Kayla L. Vanden Esschert, MPH1,2; Tadesse Haileyesus, MS3; Amanda L. Tarrier, MPH4; Michelle A. Donovan5; Gary T. Garofalo5; Joseph P. Laco,
MS6; Vincent R. Hill, PhD1; Michele C. Hlavsa, MPH1
Pool chemicals are added to water in treated recreational water venues (e.g., pools, hot tubs/spas, and water play-grounds) primarily to protect public health. Pool chemicals inactivate pathogens (e.g., chlorine or bromine), optimize pH (e.g., muriatic acid), and increase water clarity, which helps prevent drowning by enabling detection of distressed swimmers underwater. However, pool chemicals can cause injuries if mishandled. To estimate the annual number of U.S. emergency department (ED) visits for pool chemical injuries, CDC analyzed 2008–2017 data from the National Electronic Injury Surveillance System (NEISS), operated by the U.S. Consumer Product Safety Commission (CPSC). During 2015–2017, pool chemical injuries led to an estimated 13,508 (95% confidence interval [CI] = 9,087–17,929) U.S.

Morbidity and Mortality Weekly Report
434 MMWR / May 17, 2019 / Vol. 68 / No. 19 US Department of Health and Human Services/Centers for Disease Control and Prevention
The MMWR series of publications is published by the Center for Surveillance, Epidemiology, and Laboratory Services, Centers for Disease Control and Prevention (CDC), U.S. Department of Health and Human Services, Atlanta, GA 30329-4027.Suggested citation: [Author names; first three, then et al., if more than six.] [Report title]. MMWR Morb Mortal Wkly Rep 2019;68:[inclusive page numbers].
Centers for Disease Control and PreventionRobert R. Redfield, MD, Director
Anne Schuchat, MD, Principal Deputy DirectorChesley L. Richards, MD, MPH, Deputy Director for Public Health Science and Surveillance
Rebecca Bunnell, PhD, MEd, Director, Office of ScienceBarbara Ellis, PhD, MS, Acting Director, Office of Science Quality, Office of Science
Michael F. Iademarco, MD, MPH, Director, Center for Surveillance, Epidemiology, and Laboratory Services
MMWR Editorial and Production Staff (Weekly)Charlotte K. Kent, PhD, MPH, Editor in Chief
Jacqueline Gindler, MD, EditorMary Dott, MD, MPH, Online Editor
Terisa F. Rutledge, Managing Editor Douglas W. Weatherwax, Lead Technical Writer-Editor
Glenn Damon, Soumya Dunworth, PhD, Teresa M. Hood, MS, Technical Writer-Editors
Martha F. Boyd, Lead Visual Information SpecialistMaureen A. Leahy, Julia C. Martinroe,
Stephen R. Spriggs, Tong Yang,Visual Information Specialists
Quang M. Doan, MBA, Phyllis H. King, Terraye M. Starr, Moua Yang,
Information Technology SpecialistsMMWR Editorial Board
Timothy F. Jones, MD, ChairmanMatthew L. Boulton, MD, MPH
Virginia A. Caine, MD Katherine Lyon Daniel, PhD
Jonathan E. Fielding, MD, MPH, MBADavid W. Fleming, MD
William E. Halperin, MD, DrPH, MPH
Robin Ikeda, MD, MPH Phyllis Meadows, PhD, MSN, RNJewel Mullen, MD, MPH, MPA
Jeff Niederdeppe, PhDPatricia Quinlisk, MD, MPH
Stephen C. Redd, MD Patrick L. Remington, MD, MPH
Carlos Roig, MS, MAWilliam Schaffner, MD
Morgan Bobb Swanson, BS
ED visits; 36.4% (estimated 4,917 [95% CI = 3,022–6,811]) of patients were aged <18 years. At least 56.3% (estimated 7,601 [95% CI = 4,587–10,615]) of injuries occurred at a residence. Two thirds of the injuries occurred during the period from Memorial Day weekend through Labor Day. This report also describes a toxic chlorine gas incident that occurred at a public pool in New York in 2018. Pool chemical injuries are preventable. CDC’s Model Aquatic Health Code (MAHC) is an important resource that operators of public treated recre-ational water venues (e.g., at hotels, apartment complexes, and waterparks) can use to prevent pool chemical injuries.
NEISS captures data on ED visits for injuries, including those associated with consumer products. NEISS records include data on consumer products (swimming pool chemical product code = 938); patient age, sex, and race/ethnicity; the most severe diagnosis; the most seriously injured body part; patient disposition; incident location; and two 71-character narrative fields to describe the incident leading to injury. These data are collected from a nationally representative probabil-ity sample of approximately 100 hospitals across the United States, and thus, can be used to calculate national estimates. Each case was weighted based on the inverse probability of hospital selection, and the weights were summed to produce national estimates; 95% CIs were calculated according to CPSC’s direct variance method, accounting for the complex sampling design (1). Rates per 100,000 population were calculated using weighted NEISS point estimates and U.S. Census Bureau population estimates (2). Descriptive analyses
of 2015–2017 data were conducted to characterize the most recent pool chemical injuries and increase national estimate stability. Data analyses were conducted using SAS (version 9.4; SAS Institute).
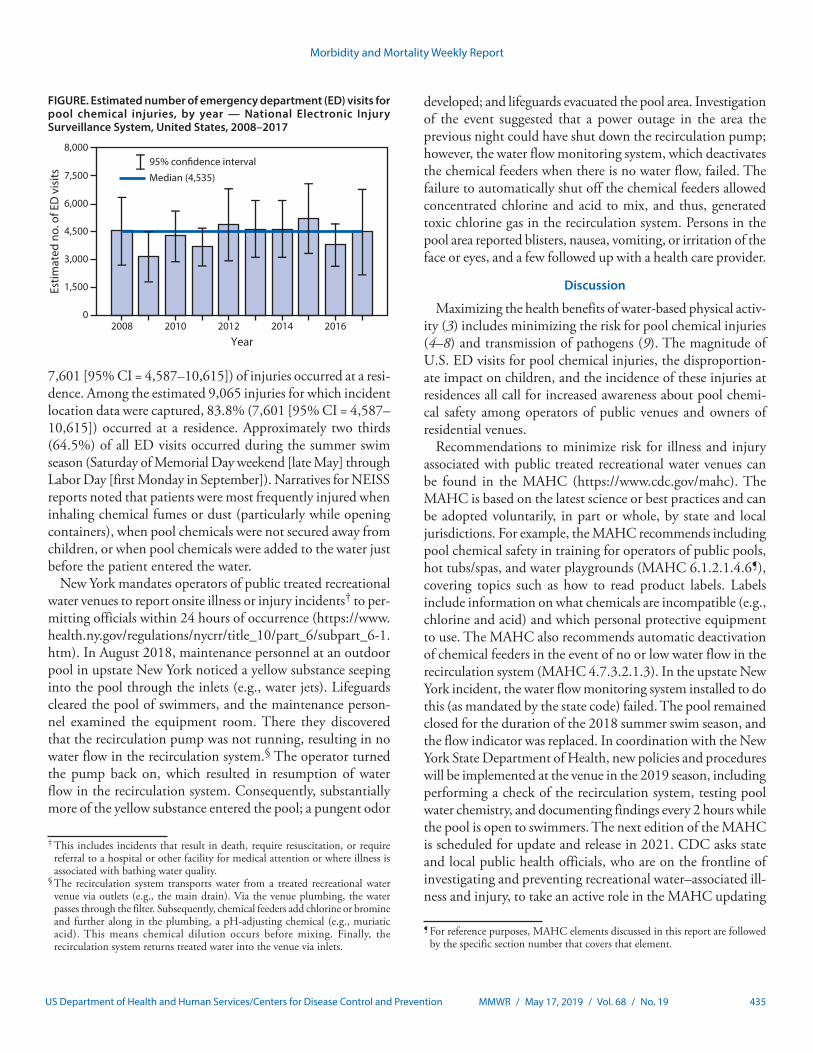
During 2008–2017, the median estimated annual num-ber of U.S. ED visits for pool chemical injuries was 4,535 (range = 3,151–5,215) (Figure). During 2015–2017, pool chemical injuries led to an estimated 13,508 total ED visits (95% CI = 9,087–17,929; rate = 1.4 per 100,000 population) (Table), with persons aged <18 years accounting for 36.4% of patients (estimated 4,917 [95% CI = 3,022–6,811]). An estimated 93.9% (95% CI = 8,480–16,899) of patients seeking care in an ED for pool chemical injuries were either treated in the ED and released or examined in the ED and released without treatment. An estimated 5,245 patients (95% CI = 3,135–7,355; rate 0.5 per 100,000 population) had their injury diagnosed as poisoning. NEISS report narratives indicated that approximately 90% of patients who received a diagnosis of poisoning were injured via inhalation rather than ingestion. The poisoning diagnosis contributed to “all parts of the body (>50% of the body)”* being the most affected body part. An estimated 3,745 injuries (95% CI = 2,497–4,994) were diagnosed as dermatitis or conjunctivitis, and an estimated 2,588 (95% CI = 644–4,533]) were diagnosed as chemical burn. No deaths were documented. At least 56.3% (estimated
* For a poisoning injury diagnosis, NEISS requires that affected body part be coded as “all parts of the body (>50% of the body).”
Morbidity and Mortality Weekly Report
MMWR / May 17, 2019 / Vol. 68 / No. 19 435US Department of Health and Human Services/Centers for Disease Control and Prevention
FIGURE. Estimated number of emergency department (ED) visits for pool chemical injuries, by year — National Electronic Injury Surveillance System, United States, 2008–2017
0
1,500
3,000
4,500
6,000
7,500
8,000
2008 2010 2012 2014 2016
Year
Estim
ated
no.
of E
D v
isits
95% con�dence interval
Median (4,535)
7,601 [95% CI = 4,587–10,615]) of injuries occurred at a resi-dence. Among the estimated 9,065 injuries for which incident location data were captured, 83.8% (7,601 [95% CI = 4,587–10,615]) occurred at a residence. Approximately two thirds (64.5%) of all ED visits occurred during the summer swim season (Saturday of Memorial Day weekend [late May] through Labor Day [first Monday in September]). Narratives for NEISS reports noted that patients were most frequently injured when inhaling chemical fumes or dust (particularly while opening containers), when pool chemicals were not secured away from children, or when pool chemicals were added to the water just before the patient entered the water.
New York mandates operators of public treated recreational water venues to report onsite illness or injury incidents† to per-mitting officials within 24 hours of occurrence (https://www.health.ny.gov/regulations/nycrr/title_10/part_6/subpart_6-1.htm). In August 2018, maintenance personnel at an outdoor pool in upstate New York noticed a yellow substance seeping into the pool through the inlets (e.g., water jets). Lifeguards cleared the pool of swimmers, and the maintenance person-nel examined the equipment room. There they discovered that the recirculation pump was not running, resulting in no water flow in the recirculation system.§ The operator turned the pump back on, which resulted in resumption of water flow in the recirculation system. Consequently, substantially more of the yellow substance entered the pool; a pungent odor
† This includes incidents that result in death, require resuscitation, or require referral to a hospital or other facility for medical attention or where illness is associated with bathing water quality.
§ The recirculation system transports water from a treated recreational water venue via outlets (e.g., the main drain). Via the venue plumbing, the water passes through the filter. Subsequently, chemical feeders add chlorine or bromine and further along in the plumbing, a pH-adjusting chemical (e.g., muriatic acid). This means chemical dilution occurs before mixing. Finally, the recirculation system returns treated water into the venue via inlets.
developed; and lifeguards evacuated the pool area. Investigation of the event suggested that a power outage in the area the previous night could have shut down the recirculation pump; however, the water flow monitoring system, which deactivates the chemical feeders when there is no water flow, failed. The failure to automatically shut off the chemical feeders allowed concentrated chlorine and acid to mix, and thus, generated toxic chlorine gas in the recirculation system. Persons in the pool area reported blisters, nausea, vomiting, or irritation of the face or eyes, and a few followed up with a health care provider.
Discussion
Maximizing the health benefits of water-based physical activ-ity (3) includes minimizing the risk for pool chemical injuries (4–8) and transmission of pathogens (9). The magnitude of U.S. ED visits for pool chemical injuries, the disproportion-ate impact on children, and the incidence of these injuries at residences all call for increased awareness about pool chemi-cal safety among operators of public venues and owners of residential venues.
Recommendations to minimize risk for illness and injury associated with public treated recreational water venues can be found in the MAHC (https://www.cdc.gov/mahc). The MAHC is based on the latest science or best practices and can be adopted voluntarily, in part or whole, by state and local jurisdictions. For example, the MAHC recommends including pool chemical safety in training for operators of public pools, hot tubs/spas, and water playgrounds (MAHC 6.1.2.1.4.6¶), covering topics such as how to read product labels. Labels include information on what chemicals are incompatible (e.g., chlorine and acid) and which personal protective equipment to use. The MAHC also recommends automatic deactivation of chemical feeders in the event of no or low water flow in the recirculation system (MAHC 4.7.3.2.1.3). In the upstate New York incident, the water flow monitoring system installed to do this (as mandated by the state code) failed. The pool remained closed for the duration of the 2018 summer swim season, and the flow indicator was replaced. In coordination with the New York State Department of Health, new policies and procedures will be implemented at the venue in the 2019 season, including performing a check of the recirculation system, testing pool water chemistry, and documenting findings every 2 hours while the pool is open to swimmers. The next edition of the MAHC is scheduled for update and release in 2021. CDC asks state and local public health officials, who are on the frontline of investigating and preventing recreational water–associated ill-ness and injury, to take an active role in the MAHC updating
¶ For reference purposes, MAHC elements discussed in this report are followed by the specific section number that covers that element.

Morbidity and Mortality Weekly Report
436 MMWR / May 17, 2019 / Vol. 68 / No. 19 US Department of Health and Human Services/Centers for Disease Control and Prevention
TABLE. Estimated number, percentage, and rate of pool chemical injuries treated in emergency departments — National Electronic Injury Surveillance System (NEISS), United States, 2015–2017
Characteristic Sample case count Weighted estimate* (95% CI) % Annual rate†
Total 298 13,508 (9,087–17,929) 100.0 1.4Patient age group (yrs)0–17 130 4,917 (3,022–6,811) 36.4 2.218–45 83 3,977 (2,505–5,448) 29.4 1.146–64 55 3,036 (1,855–4,218) 22.5 1.3≥65 30 1,579 (774–2,383) 11.7 1.1Patient sexMale 181 8,735 (5,372–12,098) 64.7 1.8Female 117 4,773 (3,369–6,177) 35.3 1.0Patient race/ethnicityWhite, non-Hispanic 127 6,545 (4,189–8,902) 48.5 —Black, non-Hispanic 25 1,008 (301–1,715) 7.5 —Hispanic 20 572 (107–1,036) 4.2 —Other (e.g., multiple race) 11 141 (0–343) 1.0 —Unknown 115 5,242 (822–9,663) 38.8 —Injury diagnosisPoisoning§ 117 5,245 (3,135–7,355) 38.8 0.5Dermatitis or conjunctivitis 85 3,745 (2,497–4,994) 27.7 0.4Chemical burns 49 2,588 (644–4,533) 19.2 —Other or not stated¶ 47 1,930 (1,187–2,673) 14.3 0.2Affected body partAll parts of the body (>50% of the body)** 140 6,371 (4,117–8,624) 47.2 0.7Eye 96 4,451 (2,561–6,342) 33.0 0.5Other†† 62 2,686 (1,726–3,646) 19.9 0.3Patient dispositionTreated and released or examined and released without treatment
270 12,690 (8,480–16,899) 93.9 1.3
Treated and admitted for hospitalization (within same facility) 16 593 (186–1,001) 4.4 —Other§§ 12 225 (24–426) 1.7 —Incident locationResidence 144 7,601 (4,587–10,615) 56.3 —Place of recreation or sports 50 891 (285–1,497) 6.6 —Other public property¶¶ 15 573 (202–945) 4.2 —Unknown 89 4,443 (2,458–6,428) 32.9 —
Abbreviation: CI = confidence interval. * Estimates might not sum to total because of rounding. † Rates per 100,000 population. If the sample count was <20, the estimate <1,200, or the coefficient of variation >30%, then the rate was potentially unstable and
not reported. Rates by incident location and race/ethnicity are not reported because of the high percentage of missing data. § Poisoning includes inhalation of vapors, fumes, or gases, as well as ingestion. ¶ Other diagnoses (sample case counts): other or not stated (N = 26), contusions or abrasions (six), submersion (three), fracture (two), laceration (two), anoxia (two),
radiation (two), internal organ injury (one), foreign body (one), aspiration (one), and thermal burn (one). ** For a poisoning injury diagnosis, NEISS requires that affected body part be coded as “all parts of the body (>50% of the body).” †† Other most commonly injured body parts (sample case counts): face (10), upper trunk (nine), hand (nine), lower arm (eight), and other (26). §§ Other dispositions (sample case counts): left without being seen (seven), held for observation (four), and transferred to another hospital (one). ¶¶ NEISS defines “other public property” as hotels/motels, stores, office buildings, etc.
process. This starts with submitting MAHC change requests based on findings from investigations and implementation of prevention measures. To be considered for the 2021 MAHC (4th edition), MAHC change requests can be submitted to the Council for the MAHC (CMAHC; https://www.cmahc.org/enter-change-request.php) by January 6, 2020.
The findings in this report are subject to at least five limita-tions. First, although NEISS data provide a snapshot of pool chemical injuries leading to ED visits, they do not characterize the epidemiology of pool chemical injuries that do not result in an ED visit. Second, understanding of pool chemical inju-ries is limited by minimal data (e.g., restricted text fields that
preclude detailed description of incidents leading to injury) and missing data (e.g., incident location). Third, because NEISS collects data on only the most severe diagnosis, some pool chemical injuries might have been missed. Fourth, in some injury reports, the injury-causing chemical could have been incorrectly identified. For example, the disinfection byproduct, chloramine (chlorine combined with nitrogenous compounds such as those found in urine, feces, sweat, and dirt) might have been the cause of ocular irritation rather than chlorine itself as was reported. Finally, water chemistry can change quickly, making it difficult to determine the etiology of and factors contributing to pool chemical injuries.

Morbidity and Mortality Weekly Report
MMWR / May 17, 2019 / Vol. 68 / No. 19 437US Department of Health and Human Services/Centers for Disease Control and Prevention
SummaryWhat is already known about this topic?
Pool chemicals are added to water in treated recreational water venues (e.g., pools, hot tubs/spas, and water playgrounds) to prevent illnesses and outbreaks; these same chemicals can cause injuries if mishandled.
What is added by this report?
During 2015–2017, pool chemical injuries led to an estimated 13,508 U.S. emergency department visits, approximately one third of which occurred in persons aged <18 years. Most injuries occurred at a residence, and two thirds occurred during the summer swimming season (Memorial Day weekend through Labor Day).
What are the implications for public health practice?
Pool chemical injuries are preventable. CDC’s Model Aquatic Health Code (https://www.cdc.gov/mahc), based on the latest science or best practices, is an important resource to prevent pool chemical injuries.
State and local jurisdiction over residential treated recreational water venues is limited compared with jurisdiction over public venues. However, to help prevent pool chemical injuries in the residential setting, state and local environmental health practitio-ners can be a resource for residential pool or hot tub/spa owners by offering them pool chemical safety training. Pool chemical safety recommendations (https://www.cdc.gov/healthywater/swimming/aquatics-professionals/preventing-pool-chemical-events.html) are generally the same for residential and public venues (Box). Swimmers and parents of young swimmers should understand basic water chemistry and how they can help opti-mize it before getting into a pool, hot tub/spa, or water play-ground. To help prevent the formation of chloramines, which cause ocular and respiratory irritation and consume chlorine that would otherwise be available to inactivate pathogens, swimmers should take a rinse shower before getting in the water, not urinate or defecate in the water, and take children on bathroom breaks or check diapers every hour. These steps help limit the amount of nitrogen compounds being introduced into the water. Healthy and Safe Swimming Week (the week before Memorial Day) is an ideal time to disseminate these messages.
Corresponding author: Michele Hlavsa, [email protected], 404-718-4695.
1Division of Foodborne, Waterborne, and Environmental Diseases, National Center for Emerging and Zoonotic Infectious Diseases, CDC; 2Oak Ridge Institute for Science and Education, Oak Ridge, Tennessee; 3Division of Analysis, Research and Practice Integration, National Center for Injury Prevention and Control, CDC; 4New York State Department of Health; 5Hornell District Office, New York State Department of Health; 6Division of Environmental Health Science and Practice, National Center for Environmental Health, CDC.
All authors have completed and submitted the ICMJE form for disclosure of potential conflicts of interest. No potential conflicts of interest were disclosed.
BOX. CDC recommendations to prevent pool chemical injuries*
Before using pool chemicals • Get trained in pool chemical safety (for example,
during operator training course)• Ask for help if you are not trained for specific tasks• Read entire product label or safety data sheet (SDS)
before using• Learn your pool’s Emergency Chemical Spill Response
Plan and practice steps (e.g., evacuation)
Using pool chemicals safely• Dress for safety by wearing appropriate safety
equipment (e.g., safety goggles, gloves, and mask)• Read chemical product label before each use
– Handle in a well-ventilated area – Open one product container at a time and close it before opening another
– Minimize dust, fumes, and splashes – Measure carefully – Never mix chlorine products with acid; this could create toxic gases
– Never mix different pool chemicals (e.g., different types of chlorine products) with each other or with any other substance
• Only predissolve pool chemicals when directed by product label
– If product label directs predissolving, add pool chemical to water; never add water to pool chemical because violent (potentially explosive) reaction can occur
* To order free laminated pool chemical safety posters (one on safe storage and one on safe use), go to https://wwwn.cdc.gov/pubs/CDCInfoOnDemand.aspx?ProgramID=93.
References1. Consumer Product Safety Commission. The NEISS sample (design and
implementation) 1997 to present; Bethesda, MD: Consumer Product Safety Commission; 2019. https://www.cpsc.gov/s3fs-public/pdfs/blk_media_2001d011-6b6.pdf
2. US Census Bureau. Annual estimates of the resident population by single year of age and sex for the United States: April 1, 2010 to July 1, 2017; 2017 population estimates. Washington, DC: US Department of Commerce, US Census Bureau; 2019. https://factfinder.census.gov/faces/tableservices/jsf/pages/productview.xhtml?pid=PEP_2017_PEPSYASEXN&prodType=table
3. CDC. Health benefits of water-based exercise. Atlanta, GA: US Department of Health and Human Services, CDC; 2019. https://www.cdc.gov/healthywater/swimming/swimmers/health_benefits_water_exercise.html
4. Wilken JA, DiMaggio M, Kaufmann M, et al. Inhalational chlorine injuries at public aquatic venues—California, 2008–2015. MMWR Morb Mortal Wkly Rep 2017;66:498–501. https://doi.org/10.15585/mmwr.mm6619a3
5. Hlavsa MC, Robinson TJ, Collier SA, Beach MJ. Pool chemical–associated health events in public and residential settings—United States, 2003–2012, and Minnesota, 2013. MMWR Morb Mortal Wkly Rep 2014;63:427–30.
Morbidity and Mortality Weekly Report
438 MMWR / May 17, 2019 / Vol. 68 / No. 19 US Department of Health and Human Services/Centers for Disease Control and Prevention
6. Anderson AR, Welles WL, Drew J, Orr MF. The distribution and public health consequences of releases of chemicals intended for pool use in 17 states, 2001–2009. J Environ Health 2014;76:10–5.
7. CDC. Acute illness and injury from swimming pool disinfectants and other chemicals—United States, 2002–2008. MMWR Morb Mortal Wkly Rep 2011;60:1343–7.
8. CDC. Pool chemical–associated health events in public and residential settings—United States, 1983–2007. MMWR Morb Mortal Wkly Rep 2009;58:489–93.
9. Hlavsa MC, Cikesh BL, Roberts VA, et al. Outbreaks associated with treated recreational water—United States, 2000–2014. MMWR Morb Mortal Wkly Rep 2018;67:547–51. https://doi.org/10.15585/mmwr.mm6719a3
Morbidity and Mortality Weekly Report
MMWR / May 17, 2019 / Vol. 68 / No. 19 439US Department of Health and Human Services/Centers for Disease Control and Prevention
Tuberculosis Screening, Testing, and Treatment of U.S. Health Care Personnel: Recommendations from the National Tuberculosis Controllers
Association and CDC, 2019Lynn E. Sosa, MD1,2; Gibril J. Njie, MPH3; Mark N. Lobato, MD2; Sapna Bamrah Morris, MD3; William Buchta, MD4,5; Megan L. Casey, MPH6; Neela D.
Goswami, MD3; MaryAnn Gruden, MSN7; Bobbi Jo Hurst7; Amera R. Khan, MPH3; David T. Kuhar, MD8; David M. Lewinsohn, MD, PhD9; Trini A. Mathew, MD10; Gerald H. Mazurek, MD3; Randall Reves, MD2,11; Lisa Paulos, MPH2,12; Wendy Thanassi, MD2,13; Lorna Will, MA2; Robert Belknap, MD2,11
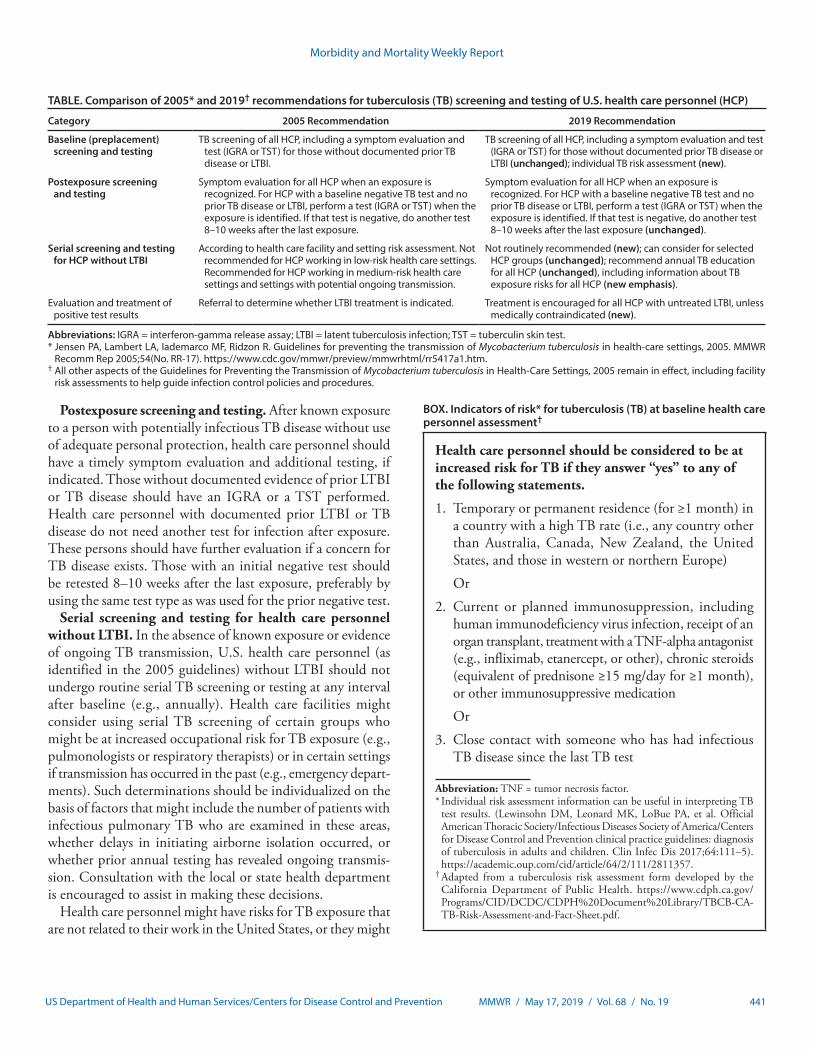
The 2005 CDC guidelines for preventing Mycobacterium tuberculosis transmission in health care settings include rec-ommendations for baseline tuberculosis (TB) screening of all U.S. health care personnel and annual testing for health care personnel working in medium-risk settings or settings with potential for ongoing transmission (1). Using evidence from a systematic review conducted by a National Tuberculosis Controllers Association (NTCA)-CDC work group, and following methods adapted from the Guide to Community Preventive Services (2,3), the 2005 CDC recommendations for testing U.S. health care personnel have been updated and now include 1) TB screening with an individual risk assessment and symptom evaluation at baseline (preplacement); 2) TB testing with an interferon-gamma release assay (IGRA) or a tuberculin skin test (TST) for persons without documented prior TB disease or latent TB infection (LTBI); 3) no routine serial TB testing at any interval after baseline in the absence of a known exposure or ongoing transmission; 4) encourage-ment of treatment for all health care personnel with untreated LTBI, unless treatment is contraindicated; 5) annual symptom screening for health care personnel with untreated LTBI; and 6) annual TB education of all health care personnel.
BackgroundHistorically, U.S. health care personnel were at increased risk
for LTBI and TB disease from occupational exposures; how-ever, recent data suggest that this might no longer be the case. TB rates in the United States have declined substantially; the annual national TB rate in 2017 (2.8 per 100,000 population) represents a 73% decrease from the rate in 1991 (10.4) and a 42% decrease from the rate in 2005 (4.8) (4,5). Surveillance data reported to CDC during 1995–2007 revealed that TB incidence rates among health care personnel were similar to those in the general population (6), raising questions about the cost-effectiveness of routine serial occupational testing (7). In addition, a recent retrospective cohort study of approximately 40,000 health care personnel at a tertiary U.S. medical center in a low TB-incidence state found an extremely low rate of TST conversion (0.3%) during 1998–2014, with a limited propor-tion attributable to occupational exposure (8). Moreover, IGRAs
and TSTs have well-documented limitations for serial testing of health care personnel at low risk for LTBI and TB disease (9,10).
MethodsIn 2015, an NTCA-CDC work group comprising experts in
TB, infection control, and occupational health was formed to discuss potential updates to recommendations for health care personnel TB screening and testing. The work group included representation from CDC, state and local public health depart-ments, academia, and occupational health associations. During 2015–2016, the work group met periodically to discuss where updates were needed to the 2005 CDC recommendations and to establish a plan for the review of evidence. In January 2017, the work group commenced a systematic literature review of the screening and testing of health care personnel for TB and discussed the findings during a web conference in September 2017. Updated recommendations were developed by the work group during a web conference in December 2017.
Systematic review methods and findings. A systematic review of evidence published after release of the 2005 guide-lines was conducted using methodology developed for the Guide to Community Preventive Services (2,3). The search included articles indexed in MEDLINE, EMBASE, and Scopus. The medical subject headings used for the search were “latent tuberculosis” and “tuberculosis”; search terms included “healthcare worker,” “healthcare personnel,” “health worker,” “occupational exposure,” and “occupational diseases.” English language articles were included that 1) were published during January 2006–November 2017; 2) described TB screening and testing in low-incidence (11), high-income countries (12); 3) employed study designs that were randomized controlled tri-als, prospective cohort, retrospective cohort, or cross-sectional studies; and 4) reported LTBI prevalence, test conversion or reversion, or TB transmission rates. Each study was indepen-dently abstracted and assessed for suitability of study design by two reviewers using a data abstraction form adapted from the Guide to Community Preventive Services (3).
This search identified 1,147 citations, of which 39 studies focused on TB screening and testing among health care per-sonnel; three studies (one that was an economic evaluation, one that focused only on test performance, and one of limited
Morbidity and Mortality Weekly Report
440 MMWR / May 17, 2019 / Vol. 68 / No. 19 US Department of Health and Human Services/Centers for Disease Control and Prevention
execution quality) were excluded, leaving 36 studies in the analysis (Supplementary Box, https://stacks.cdc.gov/view/cdc/77668). Sixteen (44%) of these had been conducted in the United States, with the remaining studies from Australia (one), Europe (17), Israel (one), and New Zealand (one). Thirty-four (94%) studies had been conducted in a hospital setting; most used either a retrospective cohort or cross-sectional design (14). Substantial unexplained heterogeneity existed for all outcomes examined, even when stratified by location or study design. An examination of the patterns of results did not indicate publication bias.
Five U.S. studies reported prior bacillus Calmette-Guérin vaccination by health care personnel (median percentage = 7%; range = 2.3%–93%). Eight of the 16 U.S. studies reported two-step TST testing at baseline. The remaining studies reported IGRA (six) or a combination of IGRA and TST (two) at base-line. Findings from the metaanalyses indicated that 5% and 3% of U.S. health care personnel tested positive at baseline by IGRA and TST, respectively, and that 4% and 0.7% converted from a negative to a positive during serial testing by IGRA and TST, respectively. Among U.S. health care personnel who had a baseline positive test and were retested by the same method during serial testing, the second test was negative in 48% of cases by IGRA and 62% by TST. No U.S. studies were found that evaluated the clinical implications of these discordant results. Among 63,975 U.S. health care personnel from eight studies reporting disease occurrence, none experienced TB disease. Based on expert opinion from the NTCA-CDC work group and findings from the systematic review indicating that a limited proportion of health care personnel test positive at baseline and convert during serial testing, recommendations were drafted for presentation to the Advisory Council on the Elimination of Tuberculosis (ACET) and the Healthcare Infection Control Practices Advisory Committee (HICPAC).
Expert consultation results. The draft NTCA-CDC recommendations were presented publicly at the April 2018 ACET meeting (13) and the May 2018 HICPAC meeting (14). Members of ACET and HICPAC were asked to provide feedback to CDC regarding the recommendations and their accuracy, practicability, clarity, and usefulness. Commenters during the ACET meeting noted that the recommendation encouraging treatment of health care personnel with LTBI could potentially generate cost savings and play an important role in the elimination of active TB disease in the United States. Commenters during the HICPAC meeting were supportive of the need to reduce TB testing for health care personnel; questions were raised about the evidence for, and feasibility of, implementing some of the proposed changes. Commenters during both meetings also encouraged the work group’s plan for a supplemental document to aid health care facilities in
implementing the updated recommendations. In addition, the recommendations were presented by NTCA at the National Tuberculosis Conference in May 2018 (15) for comment and feedback. Conference attendees supported the need for updated guidelines and the content of the recommendations that were presented.
In July 2018, the NTCA-CDC work group held another web conference to address feedback received from the ACET, HICPAC, and National Tuberculosis Conference meetings and finalized the updated recommendations. The work group requested that NTCA convene a new work group to develop the supplemental implementation guidance document sup-ported by ACET and HICPAC. The supplemental document is expected to be completed by NTCA in 2019.
Updated RecommendationsRecommendations from the 2005 CDC guidelines that
are outside the scope of health care personnel screening, test-ing, treatment, and education remain unchanged (Table); this includes continuing facility risk assessments for guiding infection control policies and procedures. Here, TB screen-ing is defined as a process that includes a TB risk assessment, symptom evaluation, TB testing for M. tuberculosis infection (by either IGRA or TST) for health care personnel without documented evidence of prior LTBI or TB disease, and addi-tional workup for TB disease for health care personnel with positive test results or symptoms compatible with TB disease. This update does not include recommendations for using an IGRA versus a TST for diagnosing LTBI, which have been published elsewhere (16).
Baseline (preplacement) screening and testing. All U.S. health care personnel should have baseline TB screening, including an individual risk assessment (Box), which is neces-sary for interpreting any test result. The 2005 guidelines state that baseline test results provide a basis for comparison in the event of a potential or known exposure to M. tuberculosis, facilitate detection and treatment of LTBI or TB disease in health care personnel before placement, and reduce the risk to patients and other health care personnel (1). The risk assess-ment and symptom evaluation help guide decisions when interpreting test results. For example, health care personnel with a positive test who are asymptomatic, unlikely to be infected with M. tuberculosis, and at low risk for progression on the basis of their risk assessment should have a second test (either an IGRA or a TST) as recommended in the 2017 TB diagnostic guidelines of the American Thoracic Society, Infectious Diseases Society of America, and CDC (16). In this example, the health care personnel should be considered infected with M. tuberculosis only if both the first and second tests are positive.
Morbidity and Mortality Weekly Report
MMWR / May 17, 2019 / Vol. 68 / No. 19 441US Department of Health and Human Services/Centers for Disease Control and Prevention
TABLE. Comparison of 2005* and 2019† recommendations for tuberculosis (TB) screening and testing of U.S. health care personnel (HCP)
Category 2005 Recommendation 2019 Recommendation
Baseline (preplacement) screening and testing
TB screening of all HCP, including a symptom evaluation and test (IGRA or TST) for those without documented prior TB disease or LTBI.
TB screening of all HCP, including a symptom evaluation and test (IGRA or TST) for those without documented prior TB disease or LTBI (unchanged); individual TB risk assessment (new).
Postexposure screening and testing
Symptom evaluation for all HCP when an exposure is recognized. For HCP with a baseline negative TB test and no prior TB disease or LTBI, perform a test (IGRA or TST) when the exposure is identified. If that test is negative, do another test 8–10 weeks after the last exposure.
Symptom evaluation for all HCP when an exposure is recognized. For HCP with a baseline negative TB test and no prior TB disease or LTBI, perform a test (IGRA or TST) when the exposure is identified. If that test is negative, do another test 8–10 weeks after the last exposure (unchanged).
Serial screening and testing for HCP without LTBI
According to health care facility and setting risk assessment. Not recommended for HCP working in low-risk health care settings. Recommended for HCP working in medium-risk health care settings and settings with potential ongoing transmission.
Not routinely recommended (new); can consider for selected HCP groups (unchanged); recommend annual TB education for all HCP (unchanged), including information about TB exposure risks for all HCP (new emphasis).
Evaluation and treatment of positive test results
Referral to determine whether LTBI treatment is indicated. Treatment is encouraged for all HCP with untreated LTBI, unless medically contraindicated (new).
Abbreviations: IGRA = interferon-gamma release assay; LTBI = latent tuberculosis infection; TST = tuberculin skin test.* Jensen PA, Lambert LA, Iademarco MF, Ridzon R. Guidelines for preventing the transmission of Mycobacterium tuberculosis in health-care settings, 2005. MMWR
Recomm Rep 2005;54(No. RR-17). https://www.cdc.gov/mmwr/preview/mmwrhtml/rr5417a1.htm.† All other aspects of the Guidelines for Preventing the Transmission of Mycobacterium tuberculosis in Health-Care Settings, 2005 remain in effect, including facility
risk assessments to help guide infection control policies and procedures.
Postexposure screening and testing. After known exposure to a person with potentially infectious TB disease without use of adequate personal protection, health care personnel should have a timely symptom evaluation and additional testing, if indicated. Those without documented evidence of prior LTBI or TB disease should have an IGRA or a TST performed. Health care personnel with documented prior LTBI or TB disease do not need another test for infection after exposure. These persons should have further evaluation if a concern for TB disease exists. Those with an initial negative test should be retested 8–10 weeks after the last exposure, preferably by using the same test type as was used for the prior negative test.
Serial screening and testing for health care personnel without LTBI. In the absence of known exposure or evidence of ongoing TB transmission, U.S. health care personnel (as identified in the 2005 guidelines) without LTBI should not undergo routine serial TB screening or testing at any interval after baseline (e.g., annually). Health care facilities might consider using serial TB screening of certain groups who might be at increased occupational risk for TB exposure (e.g., pulmonologists or respiratory therapists) or in certain settings if transmission has occurred in the past (e.g., emergency depart-ments). Such determinations should be individualized on the basis of factors that might include the number of patients with infectious pulmonary TB who are examined in these areas, whether delays in initiating airborne isolation occurred, or whether prior annual testing has revealed ongoing transmis-sion. Consultation with the local or state health department is encouraged to assist in making these decisions.
Health care personnel might have risks for TB exposure that are not related to their work in the United States, or they might
BOX. Indicators of risk* for tuberculosis (TB) at baseline health care personnel assessment†
Health care personnel should be considered to be at increased risk for TB if they answer “yes” to any of the following statements.
1. Temporary or permanent residence (for ≥1 month) in a country with a high TB rate (i.e., any country other than Australia, Canada, New Zealand, the United States, and those in western or northern Europe)
Or
2. Current or planned immunosuppression, including human immunodeficiency virus infection, receipt of an organ transplant, treatment with a TNF-alpha antagonist (e.g., infliximab, etanercept, or other), chronic steroids (equivalent of prednisone ≥15 mg/day for ≥1 month), or other immunosuppressive medication
Or
3. Close contact with someone who has had infectious TB disease since the last TB test
Abbreviation: TNF = tumor necrosis factor.* Individual risk assessment information can be useful in interpreting TB
test results. (Lewinsohn DM, Leonard MK, LoBue PA, et al. Official American Thoracic Society/Infectious Diseases Society of America/Centers for Disease Control and Prevention clinical practice guidelines: diagnosis of tuberculosis in adults and children. Clin Infec Dis 2017;64:111–5). https://academic.oup.com/cid/article/64/2/111/2811357.
† Adapted from a tuberculosis risk assessment form developed by the California Department of Public Health. https://www.cdph.ca.gov/Programs/CID/DCDC/CDPH%20Document%20Library/TBCB-CA-TB-Risk-Assessment-and-Fact-Sheet.pdf.

Morbidity and Mortality Weekly Report
442 MMWR / May 17, 2019 / Vol. 68 / No. 19 US Department of Health and Human Services/Centers for Disease Control and Prevention
SummaryWhat is already known about this topic?
Since 1991, U.S. tuberculosis (TB) rates have declined, including among health care personnel (HCP). Serial TB testing has limitations in populations at low risk.
What is added by this report?
A systematic review found a low percentage of HCP have a positive TB test at baseline and upon serial testing. Updated recommendations for screening and testing HCP include an individual baseline (preplacement) risk assessment, symptom evaluation and testing of persons without prior TB or latent TB infection (LTBI), no routine serial testing in the absence of exposure or ongoing transmission, treatment for HCP diag-nosed with LTBI, annual symptom screening for persons with untreated LTBI, and annual TB education of all HCP.
What are the implications for public health practice?
Increasing LTBI treatment among HCP might further decrease TB transmission in health care settings.
have risks for TB progression after baseline testing that necessi-tate special consideration. If these risks are unrecognized, these health care personnel might experience TB disease and transmit TB to patients, coworkers, or other contacts. Therefore, health care facilities should educate all health care personnel annually about TB, including risk factors, signs, and symptoms; facili-ties also should encourage health care personnel to discuss any potential occupational or nonoccupational TB exposure with their primary care provider and occupational health clinician. The decision to perform TB testing after baseline should be based on the person’s risk for TB exposure at work or elsewhere since that person’s last test.
Evaluation and treatment of health care personnel with positive test results. Health care personnel with a newly posi-tive test result (with confirmation for those persons at low risk as described previously) should undergo a symptom evalua-tion and chest radiograph to assess for TB disease. Additional workup might be indicated on the basis of those results. Health care personnel with a prior positive TB test and documented normal chest radiograph do not require a repeat radiograph unless they are symptomatic or starting LTBI treatment (16). The local public health department should be notified imme-diately if TB disease is suspected.
Health care personnel with LTBI and no prior treatment should be offered, and strongly encouraged to complete, treat-ment with a recommended regimen, including short-course treatments, unless a contraindication exists (17,18). Health care personnel who do not complete LTBI treatment should be monitored with annual symptom evaluation to detect early evidence of TB disease and to reevaluate the risks and benefits of LTBI treatment. These health care personnel also should
be educated about the signs and symptoms of TB disease that should prompt an immediate evaluation between screenings.
Health care facilities should aim to identify LTBI among health care personnel and encourage LTBI treatment. Health care facilities are urged to collaborate with public health agen-cies to assist in achieving this goal. Public health agencies can serve as a source for technical assistance, medical consultation regarding diagnosis and treatment of LTBI, and clarification of state or local regulations, surveillance requirements, and guidelines. Sharing information and experiences with public health agencies is necessary for understanding the impact of these recommendations on the overall incidence of TB and LTBI in the United States and the need to revise future recom-mendations for health care personnel.
Corresponding author: Gibril J. Njie, [email protected], 404-639-3219.
1Connecticut Department of Public Health; 2National Tuberculosis Controllers Association, Smyrna, Georgia; 3Division of Tuberculosis Elimination, National Center for HIV/AIDS, Viral Hepatitis, STD, and TB Prevention, CDC; 4Logistics Health Incorporated, La Crosse, Wisconsin; 5American College of Occupational and Environmental Medicine, Elk Grove Village, Illinois; 6Respiratory Health Division, National Institute for Occupational Safety and Health, CDC; 7Association of Occupational Health Professionals in Healthcare, Warrendale, Pennsylvania; 8Division of Healthcare Quality Promotion, National Center for Emerging and Zoonotic Infectious Diseases, CDC; 9Oregon Health & Science University, Portland; 10Beaumont Hospital, Royal Oak, Michigan; 11Denver Health and Hospital Authority, Denver Public Health, Denver, Colorado; 12Maryland Department of Health; 13Veterans Administration Palo Alto Healthcare System, Palo Alto, California.
All authors have completed and submitted the ICMJE form for disclosure of potential conflicts of interest. Wendy Thanassi reports a grant from Qiagen Inc. outside the submitted work. Lorna Will reports personal fees from the National Tuberculosis Controllers Association during the conduct of the study. MaryAnn Gruden reports personal fees from the Allegheny Health Network, Association of Occupational Health Professionals in Healthcare, and National Institute for Occupational Safety and Health Board of Scientific Counselors outside the submitted work. No other potential conflicts of interest were disclosed.
References 1. Jensen PA, Lambert LA, Iademarco MF, Ridzon R. Guidelines for
preventing the transmission of Mycobacterium tuberculosis in health-care settings, 2005. MMWR Recomm Rep 2005;54(No. RR-17).
2. Briss PA, Zaza S, Pappaioanou M, et al.; Task Force on Community Preventive Services. Developing an evidence-based Guide to Community Preventive Services—methods. Am J Prev Med 2000;18(Suppl):35–43. https://doi.org/10.1016/S0749-3797(99)00119-1
3. Zaza S, Wright-De Agüero LK, Briss PA, et al.; Task Force on Community Preventive Services. Data collection instrument and procedure for systematic reviews in the Guide to Community Preventive Services. Am J Prev Med 2000;18(Suppl):44–74. https://doi.org/10.1016/S0749-3797(99)00122-1
4. CDC. Reported tuberculosis in the United States, 2016. Atlanta, GA: US Department of Health and Human Services, CDC; 2017. https://www.cdc.gov/tb/statistics/reports/2016/pdfs/2016_Surveillance_FullReport.pdf
Morbidity and Mortality Weekly Report
MMWR / May 17, 2019 / Vol. 68 / No. 19 443US Department of Health and Human Services/Centers for Disease Control and Prevention
5. Stewart RJ, Tsang CA, Pratt RH, Price SF, Langer AJ. Tuberculosis—United States, 2017. MMWR Morb Mortal Wkly Rep 2018;67:317–23. https://doi.org/10.15585/mmwr.mm6711a2
6. Lambert LA, Pratt RH, Armstrong LR, Haddad MB. Tuberculosis among healthcare workers, United States, 1995–2007. Infect Control Hosp Epidemiol 2012;33:1126–32. https://doi.org/10.1086/668016
7. Mullie GA, Schwartzman K, Zwerling A, N’Diaye DS. Revisiting annual screening for latent tuberculosis infection in healthcare workers: a cost-effectiveness analysis. BMC Med 2017;15:104. https://doi.org/10.1186/s12916-017-0865-x
8. Dobler CC, Farah WH, Alsawas M, et al. Tuberculin skin test conversions and occupational exposure risk in US healthcare workers. Clin Infect Dis 2018;66:706–11. https://doi.org/10.1093/cid/cix861
9. Zwerling A, van den Hof S, Scholten J, Cobelens F, Menzies D, Pai M. Interferon-gamma release assays for tuberculosis screening of healthcare workers: a systematic review. Thorax 2012;67:62–70. https://doi.org/10.1136/thx.2010.143180
10. Dorman SE, Belknap R, Graviss EA, et al.; Tuberculosis Epidemiologic Studies Consortium. Interferon-g release assays and tuberculin skin testing for diagnosis of latent tuberculosis infection in healthcare workers in the United States. Am J Respir Crit Care Med 2014;189:77–87.
11. World Health Organization. Framework towards tuberculosis elimination in low-incidence countries: methods. Geneva, Switzerland: World Health Organization; 2014. https://www.ncbi.nlm.nih.gov/books/NBK254259/
12. The World Bank. World Bank country and lending groups. Washington, DC: The World Bank; 2019. https://datahelpdesk.worldbank.org/knowledgebase/articles/906519
13. CDC. Advisory Committee for the Elimination of Tuberculosis record of the proceedings: April 17, 2018. Atlanta, GA: US Department of Health and Human Services, CDC; 2018. https://www.cdc.gov/maso/facm/pdfs/acet/FINAL508cACETMinutesApril172018.pdf
14. CDC. Health Infection Control Practices Advisory Committee record of the proceedings: May 17– 18, 2018. Atlanta, GA: US Department of Health and Human Services, CDC; 2018. https://www.cdc.gov/hicpac/pdf/2018-May-HICPAC-Summary-508.pdf
15. National Tuberculosis Controllers Association; California Tuberculosis Controllers Association. National tuberculosis conference agenda. Palm Springs, CA; May 21–24, 2018. http://www.tbcontrollers.org/docs/conference/2018/NTC_Conference2018_Agenda_final.pdf
16. Lewinsohn DM, Leonard MK, LoBue PA, et al. Official American Thoracic Society/Infectious Diseases Society of America/Centers for Disease Control and Prevention clinical practice guidelines: diagnosis of tuberculosis in adults and children. Clin Infect Dis 2017;64:111–5. https://doi.org/10.1093/cid/ciw778
17. CDC. Treatment regimens for latent TB infection (LTBI). Atlanta, GA: US Department of Health and Human Services, CDC; 2017. https://www.cdc.gov/tb/topic/treatment/ltbi.htm
18. LoBue PA, Mermin JH. Latent tuberculosis infection: the final frontier of tuberculosis elimination in the USA. Lancet Infect Dis 2017;17:e327–33. https://doi.org/10.1016/S14733099(17)30248-7
Morbidity and Mortality Weekly Report
444 MMWR / May 17, 2019 / Vol. 68 / No. 19 US Department of Health and Human Services/Centers for Disease Control and Prevention
Notes from the Field
Measles Outbreaks from Imported Cases in Orthodox Jewish Communities — New York and New Jersey, 2018–2019Robert McDonald, MD1,2; Patricia Schnabel Ruppert, DO3; Maria Souto,
MPH3; Dylan E. Johns, MS2; Kevin McKay, MPH3; Noelle Bessette, MPH4; Lissette X. McNulty5; Jennifer E. Crawford, MPH6; Patrick
Bryant, PhD7; Maria Cecilia Mosquera, MD3; Sonya Frontin, MPH8; Tatiana Deluna-Evans3; Daniel E. Regenye, MHA6; Elizabeth F. Zaremski, MPH4; Vanessa J. Landis, MPH8; Bonnie Sullivan3; Brian E. Rumpf, JD6; Judi Doherty3; Kathryn Sen2; Eric Adler, MPH4; Lisa DiFedele, MPH4;
Stephanie Ostrowski, PhD2; Christine Compton, MD2; Elizabeth Rausch-Phung, MD2; Irina Gelman, DPM5; Barbara Montana, MD4; Debra Blog,
MD2; Bradley J. Hutton, MPH2; Howard A. Zucker, MD2
On October 1, 2018, the Rockland County (New York) Department of Health (RCDOH) alerted the New York State Department of Health (NYSDOH) of an unvaccinated teen-aged traveler with diagnosed measles. During the next 17 days, RCDOH learned of an additional six unvaccinated travelers with measles. On October 24, 2018, the Ocean County (New Jersey) Health Department alerted the New Jersey Department of Health (NJDOH) of a case of measles in an international traveler, with rash onset October 17. The unvaccinated travelers reported recent travel in Israel, where an outbreak of approximately 3,150 cases of measles is ongoing (1). Investigations during October 1, 2018–April 30, 2019, identified 242 laboratory-confirmed and epidemiologically linked measles cases in New York, excluding New York City, and during October 17, 2018–November 30, 2018, identified 33 in New Jersey (Figure). The cases of measles were primarily in members of orthodox Jewish communities.
New YorkThe 242 cases in New York (excluding New York City)
included 206 in Rockland County and 36 in nearby counties. Most patients resided in orthodox Jewish neighborhoods with low school immunization rates. The median patient age was 5 years (range = 0 days* to 63 years). The 2017–2018 New York State School Immunization Survey measles vaccination rate for students in prekindergarten through grade 12 was 98%; however, documented measles vaccination coverage in schools in the out-break area was only 77%. To prevent disease spread in schools, Rockland County and neighboring Orange County have excluded unvaccinated students from school for 21 days after a measles exposure. To further control spread after school exposures, in areas of Rockland County with measles cases, exclusions from school were expanded to include all nonimmune students at schools that
* A newborn infant tested positive for measles following birth to a mother who had measles during pregnancy.
had measles immunity rates of <95% as documented by 2 valid doses of measles-mumps-rubella vaccine (MMR) or serologic evidence of immunity. To provide opportunities for vaccination, approximately 20 community vaccination events open to all ages were held in Rockland County and two in Orange County.
During October 1, 2018–April 30, 2019, Rockland County administered 19,661 MMR doses. NYSDOH, RCDOH, and private medical providers held nine informational events and distributed educational materials focused on measles prevention to 45,000 homes. A culturally appropriate and detailed vaccine education book was distributed to 15,000 Rockland County and 10,000 Orange County homes and medical providers. Orthodox Jewish leaders were engaged in the outbreak response, with rabbinical leaders supporting vaccination efforts and com-munity groups advocating for vaccination. As of April 30, 2019, transmission was ongoing. This has been the largest measles outbreak in New York (outside New York City) since 1992 and, at 7 months, the longest documented outbreak in the United States since endemic measles was eliminated in 2000 (2).
New JerseyDuring October 17–November 30, 2018, 33 measles cases
were confirmed in New Jersey, primarily in members of the orthodox Jewish community in Ocean County. The median patient age was 10 years (range = 6 months–59 years). In Ocean County, unvaccinated students were excluded from school for 21 days after a measles exposure. Some private schools excluded unvaccinated students for the duration of the New Jersey outbreak. NJDOH worked with local health officials and providers to facilitate delivery of >12,500 outbreak response doses of MMR vaccine to Ocean County medical providers. This outbreak was declared over on January 16, 2019. A second outbreak occurred in the same community in March 2019, with no identified connection to the first outbreak.
In the New York outbreak, low community vaccination rates facilitated widespread measles transmission after introduction of imported measles in unvaccinated travelers. Educational efforts regarding risks associated with undervaccination should be increased in communities with low vaccination rates. Health departments and clinicians should be aware of multiple ongoing measles outbreaks globally, and travelers should have evidence of measles immunity.† All U.S. communities should
† Documentation of age-appropriate vaccination with a live measles virus-containing vaccine (1 dose for infants aged 6–11 months; 2 doses for persons aged ≥12 months, with the first dose administered at age ≥12 months and the second dose ≥28 days after the first dose); or laboratory evidence of immunity; or laboratory confirmation of measles disease; or birth before 1957.

Morbidity and Mortality Weekly Report
MMWR / May 17, 2019 / Vol. 68 / No. 19 445US Department of Health and Human Services/Centers for Disease Control and Prevention
FIGURE. Number of measles cases, by date of rash onset — New York (n = 242)* October 1, 2018–April 30, 2019, and New Jersey (n = 33) October 17, 2018–November 30, 2018
0
1
2
3
4
5
6
7
8
9
10
No.
of c
ases
Date of rash onset
New YorkNew Jersey
1 7 13 19 25 31 6 12 18 24 1 7 13 19 25 31 6 12 18 24 30 5 11 17 23 1 7 13 19 25 31 6 12 18 24 30Oct Nov Dec Jan Feb Mar Apr
* Excludes New York City.
maintain ≥95% levels of age-appropriate vaccination coverage with 2 doses of MMR vaccine to ensure herd immunity (3).
Acknowledgments
Chanie Sternberg, Corinna Manini, Michael Kaplan, Refuah Health Center; Michael Gronostaj, CDC.
Corresponding author: Robert McDonald, [email protected], 518-402-5901.
1Epidemic Intelligence Service, CDC; 2New York State Department of Health; 3Rockland County Department of Health, New York; 4New Jersey Department of Health; 5Orange County Department of Health, New York; 6Ocean County Health Department, Toms River, New Jersey; 7New York State Department of Health, Wadsworth Center; 8Metropolitan Area Regional Office, New York State Department of Health.
All authors have completed and submitted the ICMJE form for disclosure of potential conflicts of interest. No potential conflicts of interest were disclosed.
References1. State of Israel Ministry of Health. Measles. Jerusalem, Israel: State of Israel
Ministry of Health; 2019. https://www.health.gov.il/English/Topics/Pregnancy/Vaccination_of_infants/Pages/measles.aspx
2. Gastañaduy PA, Budd J, Fisher N, et al. A measles outbreak in an underimmunized Amish community in Ohio. N Engl J Med 2016;375:1343–54. https://doi.org/10.1056/NEJMoa1602295
3. McLean HQ, Fiebelkorn AP, Temte JL, Wallace GS; CDC. Prevention of measles, rubella, congenital rubella syndrome, and mumps, 2013: summary recommendations of the Advisory Committee on Immunization Practices (ACIP). MMWR Recomm Rep 2013;62(No. RR-04).

Morbidity and Mortality Weekly Report
446 MMWR / May 17, 2019 / Vol. 68 / No. 19 US Department of Health and Human Services/Centers for Disease Control and Prevention
Notes from the Field
Community Outbreak of Measles — Clark County, Washington, 2018–2019
Alyssa Carlson, MPH1; Madison Riethman, MPH1; Paul Gastañaduy, MD2; Adria Lee, MSPH2; Jessica Leung, MPH2; Michelle Holshue,
MPH3; Chas DeBolt, MPH4; Alan Melnick, MD1
On December 31, 2018, Clark County Public Health (CCPH) in Washington was notified of a suspected case of measles in an unvaccinated child, aged 10 years, who had recently arrived from Ukraine. The patient was evaluated at an urgent care clinic for fever, cough, and a maculopapular rash. CCPH launched a case investigation, conducted contact tracing, and facilitated specimen collection and shipment to the Washington State Department of Health Public Health Laboratories. On January 3, 2019, measles virus was detected in the patient’s urine and nasopharyngeal specimens by reverse transcription–polymerase chain reaction (RT-PCR). By January 16, among 12 patients with suspected measles reported to CCPH during January 11–14, all had laboratory-confirmed measles by RT-PCR. In response to these confirmed cases and additional suspected cases, CCPH’s Incident Management Team was activated on January 15. Approximately 200 per-sons participated in the multiagency response, which included CCPH, the Washington State Department of Health, and CDC. As of March 28, 2019, measles had been confirmed among 71 Clark County residents, with rash onsets from December 30, 2018, to March 13, 2019.
Persons with suspected measles were investigated through patient interviews, electronic medical records review, and consultation with health care providers; specimens were col-lected in accordance with recommendations (1). To increase awareness of measles circulation, regional provider advisories were issued, and press releases were distributed to notify citi-zens of exposures in large settings. Outbreak control measures included identifying exposed persons and assessment of their presumptive immunity to measles,* recommending vaccina-tion of persons lacking presumptive evidence of immunity, administering postexposure prophylaxis with measles, mumps, rubella vaccine or immunoglobulin for eligible persons, and implementing social distancing strategies (e.g., isolation of patients and home quarantine of exposed persons without presumptive evidence of immunity) (2).
Among the 71 patients with confirmed measles, all of whom met the clinical case definition for measles,† 41 cases
* Acceptable presumptive evidence of immunity to measles includes written documentation of age-appropriate vaccination, laboratory evidence of immunity, laboratory confirmation of disease, or birth before 1957.
† Fever; maculopapular rash; and cough, coryza, or conjunctivitis.
were laboratory-confirmed and 30 were epidemiologically linked to confirmed cases (3). Patients were aged 1–39 years (median = 8 years); 52 (73%) were children aged ≤10 years. Sixty-one (86%) were unvaccinated, three (4%) had received 1 dose of measles, mumps, rubella vaccine before measles exposure, and vaccination status was unknown for seven (10%). Genotype D8, which is currently circulating in Eastern Europe, was identified in all 18 specimens tested (4). No new confirmed cases have been identified since March 13, 2019.
Approximately 3,800 named contacts of the 71 patients were identified from 46 known exposures at Clark County health care facilities, workplaces, churches, schools, and child care centers, as well as social gatherings and home settings. Among these contacts, 22% lacked acceptable presumptive evidence of measles immunity.
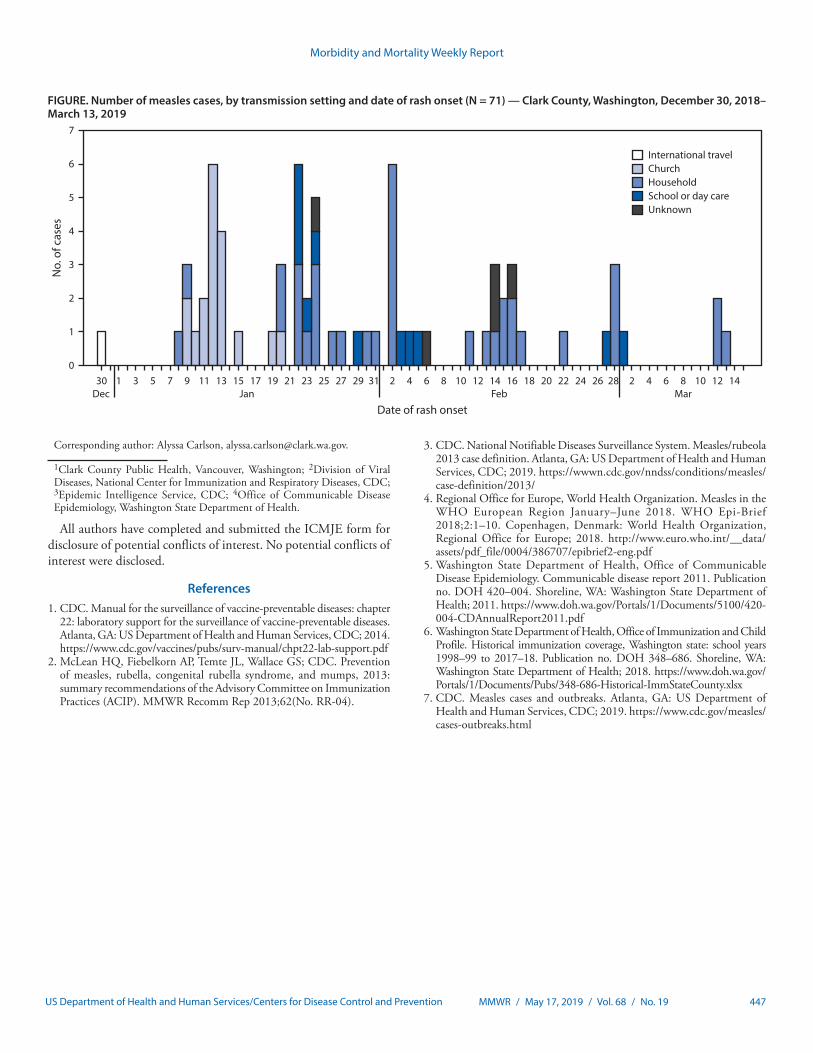
Households and churches were the predominant settings for transmission, associated with 36 (51%) and 18 (25%) of the 71 patients, respectively (Figure). Public exposures (i.e., church, school, and child care centers) most commonly occurred dur-ing the first 4 weeks of the outbreak, and decreased following communitywide implementation of CCPH-recommended outbreak control measures. Among the 30 patients identified after February 1, 26 (87%) were known contacts in quarantine and under active surveillance, decreasing public exposures by implementing effective social distancing strategies.
Clark County had not experienced a measles outbreak since 2011, when three cases were confirmed (5). Since 2013, county vaccination rates have remained 10%–14% lower than the statewide average (88%) (6). Additional U.S. jurisdictions are experiencing concurrent, unrelated measles outbreaks (7). As of May 10, 2019, the 839 measles cases identified in 23 states nationwide had surpassed the case counts observed dur-ing the same period every year since 2000, when measles was declared eliminated in the United States (range = 6–164; CDC, unpublished data). The current U.S. outbreaks underscore the importance of maintaining 2-dose measles vaccination cover-age of ≥95% and of rapid public health responses in an era of increasing measles exposure threat, both in the United States and around the world.
Acknowledgments
Clark County and Washington State Measles Response Incident Management Teams; Monica Czapla, Clark County Public Health; Washington State Public Health Laboratory; Oregon State Public Health Laboratory; Washington State Department of Health; Manisha Patel, Rebecca McNall, Carole Hickman, Paul Rota, Mary Ann Hall, CDC.
Morbidity and Mortality Weekly Report
MMWR / May 17, 2019 / Vol. 68 / No. 19 447US Department of Health and Human Services/Centers for Disease Control and Prevention
FIGURE. Number of measles cases, by transmission setting and date of rash onset (N = 71) — Clark County, Washington, December 30, 2018–March 13, 2019
0
1
2
3
4
5
6
7
International travelChurchHouseholdSchool or day careUnknown
No.
of c
ases
30 1 3 5 7 9 11 13 15 17 19 21 23 25 27 29 31 2 4 6 8 10 12 14 16 18 20 22 24 26 28 2 4 6 8 10 12 14Dec Jan Feb Mar
Date of rash onset
Corresponding author: Alyssa Carlson, [email protected].
1Clark County Public Health, Vancouver, Washington; 2Division of Viral Diseases, National Center for Immunization and Respiratory Diseases, CDC; 3Epidemic Intelligence Service, CDC; 4Office of Communicable Disease Epidemiology, Washington State Department of Health.
All authors have completed and submitted the ICMJE form for disclosure of potential conflicts of interest. No potential conflicts of interest were disclosed.
References1. CDC. Manual for the surveillance of vaccine-preventable diseases: chapter
22: laboratory support for the surveillance of vaccine-preventable diseases. Atlanta, GA: US Department of Health and Human Services, CDC; 2014. https://www.cdc.gov/vaccines/pubs/surv-manual/chpt22-lab-support.pdf
2. McLean HQ, Fiebelkorn AP, Temte JL, Wallace GS; CDC. Prevention of measles, rubella, congenital rubella syndrome, and mumps, 2013: summary recommendations of the Advisory Committee on Immunization Practices (ACIP). MMWR Recomm Rep 2013;62(No. RR-04).
3. CDC. National Notifiable Diseases Surveillance System. Measles/rubeola 2013 case definition. Atlanta, GA: US Department of Health and Human Services, CDC; 2019. https://wwwn.cdc.gov/nndss/conditions/measles/case-definition/2013/
4. Regional Office for Europe, World Health Organization. Measles in the WHO European Region January–June 2018. WHO Epi-Brief 2018;2:1–10. Copenhagen, Denmark: World Health Organization, Regional Office for Europe; 2018. http://www.euro.who.int/__data/assets/pdf_file/0004/386707/epibrief2-eng.pdf
5. Washington State Department of Health, Office of Communicable Disease Epidemiology. Communicable disease report 2011. Publication no. DOH 420–004. Shoreline, WA: Washington State Department of Health; 2011. https://www.doh.wa.gov/Portals/1/Documents/5100/420-004-CDAnnualReport2011.pdf
6. Washington State Department of Health, Office of Immunization and Child Profile. Historical immunization coverage, Washington state: school years 1998–99 to 2017–18. Publication no. DOH 348–686. Shoreline, WA: Washington State Department of Health; 2018. https://www.doh.wa.gov/Portals/1/Documents/Pubs/348-686-Historical-ImmStateCounty.xlsx
7. CDC. Measles cases and outbreaks. Atlanta, GA: US Department of Health and Human Services, CDC; 2019. https://www.cdc.gov/measles/cases-outbreaks.html
Morbidity and Mortality Weekly Report
448 MMWR / May 17, 2019 / Vol. 68 / No. 19 US Department of Health and Human Services/Centers for Disease Control and Prevention
Notes from the Field
Acanthamoeba Keratitis Cases — Iowa, 2002–2017
Brittni A. Scruggs, MD, PhD1; Tyler S. Quist, MD1; Jorge L. Salinas, MD2; Mark A. Greiner, MD1,3
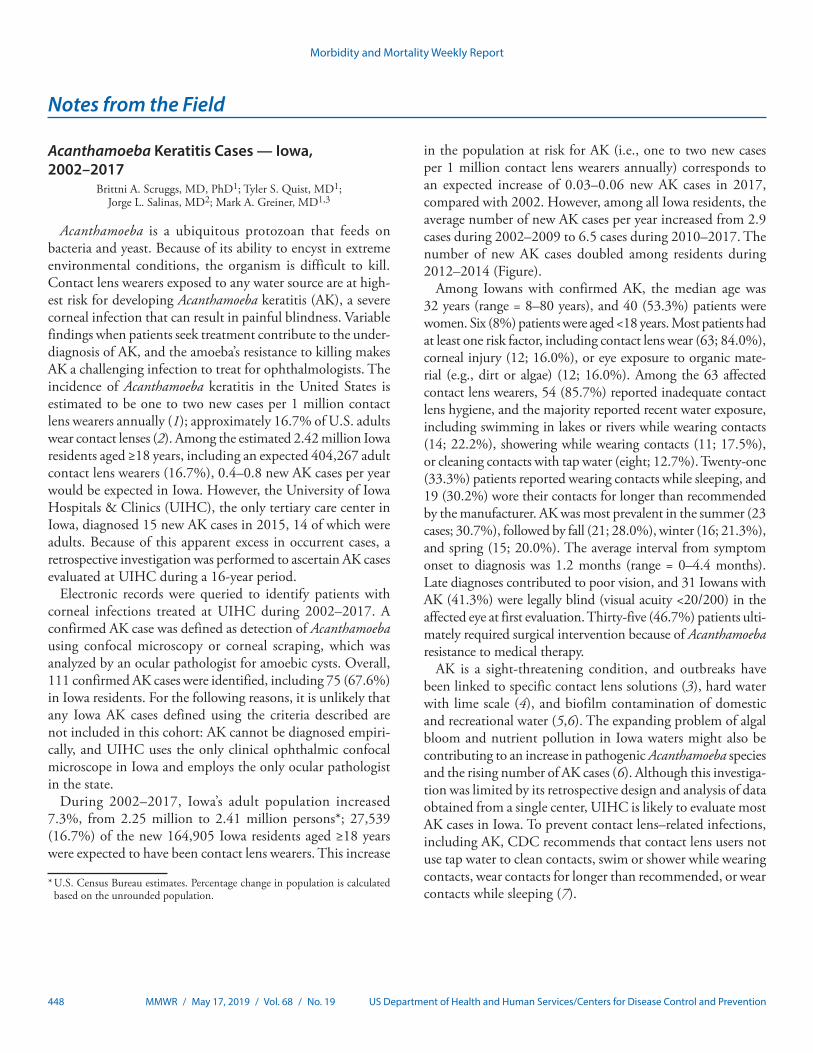
Acanthamoeba is a ubiquitous protozoan that feeds on bacteria and yeast. Because of its ability to encyst in extreme environmental conditions, the organism is difficult to kill. Contact lens wearers exposed to any water source are at high-est risk for developing Acanthamoeba keratitis (AK), a severe corneal infection that can result in painful blindness. Variable findings when patients seek treatment contribute to the under-diagnosis of AK, and the amoeba’s resistance to killing makes AK a challenging infection to treat for ophthalmologists. The incidence of Acanthamoeba keratitis in the United States is estimated to be one to two new cases per 1 million contact lens wearers annually (1); approximately 16.7% of U.S. adults wear contact lenses (2). Among the estimated 2.42 million Iowa residents aged ≥18 years, including an expected 404,267 adult contact lens wearers (16.7%), 0.4–0.8 new AK cases per year would be expected in Iowa. However, the University of Iowa Hospitals & Clinics (UIHC), the only tertiary care center in Iowa, diagnosed 15 new AK cases in 2015, 14 of which were adults. Because of this apparent excess in occurrent cases, a retrospective investigation was performed to ascertain AK cases evaluated at UIHC during a 16-year period.
Electronic records were queried to identify patients with corneal infections treated at UIHC during 2002–2017. A confirmed AK case was defined as detection of Acanthamoeba using confocal microscopy or corneal scraping, which was analyzed by an ocular pathologist for amoebic cysts. Overall, 111 confirmed AK cases were identified, including 75 (67.6%) in Iowa residents. For the following reasons, it is unlikely that any Iowa AK cases defined using the criteria described are not included in this cohort: AK cannot be diagnosed empiri-cally, and UIHC uses the only clinical ophthalmic confocal microscope in Iowa and employs the only ocular pathologist in the state.
During 2002–2017, Iowa’s adult population increased 7.3%, from 2.25 million to 2.41 million persons*; 27,539 (16.7%) of the new 164,905 Iowa residents aged ≥18 years were expected to have been contact lens wearers. This increase
* U.S. Census Bureau estimates. Percentage change in population is calculated based on the unrounded population.
in the population at risk for AK (i.e., one to two new cases per 1 million contact lens wearers annually) corresponds to an expected increase of 0.03–0.06 new AK cases in 2017, compared with 2002. However, among all Iowa residents, the average number of new AK cases per year increased from 2.9 cases during 2002–2009 to 6.5 cases during 2010–2017. The number of new AK cases doubled among residents during 2012–2014 (Figure).
Among Iowans with confirmed AK, the median age was 32 years (range = 8–80 years), and 40 (53.3%) patients were women. Six (8%) patients were aged <18 years. Most patients had at least one risk factor, including contact lens wear (63; 84.0%), corneal injury (12; 16.0%), or eye exposure to organic mate-rial (e.g., dirt or algae) (12; 16.0%). Among the 63 affected contact lens wearers, 54 (85.7%) reported inadequate contact lens hygiene, and the majority reported recent water exposure, including swimming in lakes or rivers while wearing contacts (14; 22.2%), showering while wearing contacts (11; 17.5%), or cleaning contacts with tap water (eight; 12.7%). Twenty-one (33.3%) patients reported wearing contacts while sleeping, and 19 (30.2%) wore their contacts for longer than recommended by the manufacturer. AK was most prevalent in the summer (23 cases; 30.7%), followed by fall (21; 28.0%), winter (16; 21.3%), and spring (15; 20.0%). The average interval from symptom onset to diagnosis was 1.2 months (range = 0–4.4 months). Late diagnoses contributed to poor vision, and 31 Iowans with AK (41.3%) were legally blind (visual acuity <20/200) in the affected eye at first evaluation. Thirty-five (46.7%) patients ulti-mately required surgical intervention because of Acanthamoeba resistance to medical therapy.
AK is a sight-threatening condition, and outbreaks have been linked to specific contact lens solutions (3), hard water with lime scale (4), and biofilm contamination of domestic and recreational water (5,6). The expanding problem of algal bloom and nutrient pollution in Iowa waters might also be contributing to an increase in pathogenic Acanthamoeba species and the rising number of AK cases (6). Although this investiga-tion was limited by its retrospective design and analysis of data obtained from a single center, UIHC is likely to evaluate most AK cases in Iowa. To prevent contact lens–related infections, including AK, CDC recommends that contact lens users not use tap water to clean contacts, swim or shower while wearing contacts, wear contacts for longer than recommended, or wear contacts while sleeping (7).

Morbidity and Mortality Weekly Report
MMWR / May 17, 2019 / Vol. 68 / No. 19 449US Department of Health and Human Services/Centers for Disease Control and Prevention
FIGURE. Confirmed cases* (N = 75) of Acanthamoeba keratitis diagnosed in Iowa residents, by year of diagnosis — University of Iowa Hospitals & Clinics, 2002–2017
0
1
2
3
4
5
6
7
8
9
10
2002 2003 2004 2005 2006 2007 2008 2009 2010 2011 2012 2013 2014 2015 2016 2017
No.
of A
cant
ham
oeba
ker
atiti
s ca
ses
Year of diagnosis
* Detection of Acanthamoeba by confocal microscopy or corneal scraping among patients with corneal infection treated at University of Iowa Hospitals & Clinics during 2002–2017.
Acknowledgments
Patricia Quinlisk, Caitlin S. Pedati, Iowa Department of Public Health.
Corresponding author: Mark A. Greiner, [email protected], 319-356-2861.
1Department of Ophthalmology and Visual Sciences, Carver College of Medicine, University of Iowa, Iowa City; 2Division of Infectious Diseases, Department of Internal Medicine, Carver College of Medicine, University of Iowa, Iowa City; 3Iowa Lions Eye Bank, Coralville, Iowa.
All authors have completed and submitted the ICMJE form for disclosure of potential conflicts of interest. No potential conflicts of interest were disclosed.
References1. Schaumberg DA, Snow KK, Dana MR. The epidemic of Acanthamoeba
keratitis: where do we stand? Cornea 1998;17:3–10. https://doi.org/10.1097/00003226-199801000-00001
2. Cope JR, Collier SA, Rao MM, et al. Contact lens wearer demographics and risk behaviors for contact lens-related eye infections—United States, 2014. MMWR Morb Mortal Wkly Rep 2015;64:865–70. https://doi.org/10.15585/mmwr.mm6432a2
3. Imayasu M, Tchedre KT, Cavanagh HD. Effects of multipurpose solutions on the viability and encystment of Acanthamoeba determined by flow cytometry. Eye Contact Lens 2013;39:228–33. https://doi.org/10.1097/ICL.0b013e31828af147
4. Seal D, Stapleton F, Dart J. Possible environmental sources of Acanthamoeba spp in contact lens wearers. Br J Ophthalmol 1992;76:424–7. https://doi.org/10.1136/bjo.76.7.424
5. Kilvington S, Gray T, Dart J, et al. Acanthamoeba keratitis: the role of domestic tap water contamination in the United Kingdom. Invest Ophthalmol Vis Sci 2004;45:165–9. https://doi.org/10.1167/iovs.03-0559
6. Abdul Majid MA, Mahboob T, Mong BG, et al. Pathogenic waterborne free-living amoebae: an update from selected Southeast Asian countries. PLoS One 2017;12:e0169448. https://doi.org/10.1371/journal.pone.0169448
7. Cope JR, Konne NM, Jacobs DS, et al. Corneal infections associated with sleeping in contact lenses—six cases, United States, 2016–2018. MMWR Morb Mortal Wkly Rep 2018;67:877–81. https://doi.org/10.15585/mmwr.mm6732a2
Morbidity and Mortality Weekly Report
450 MMWR / May 17, 2019 / Vol. 68 / No. 19 US Department of Health and Human Services/Centers for Disease Control and Prevention
QuickStats
FROM THE NATIONAL CENTER FOR HEALTH STATISTICS
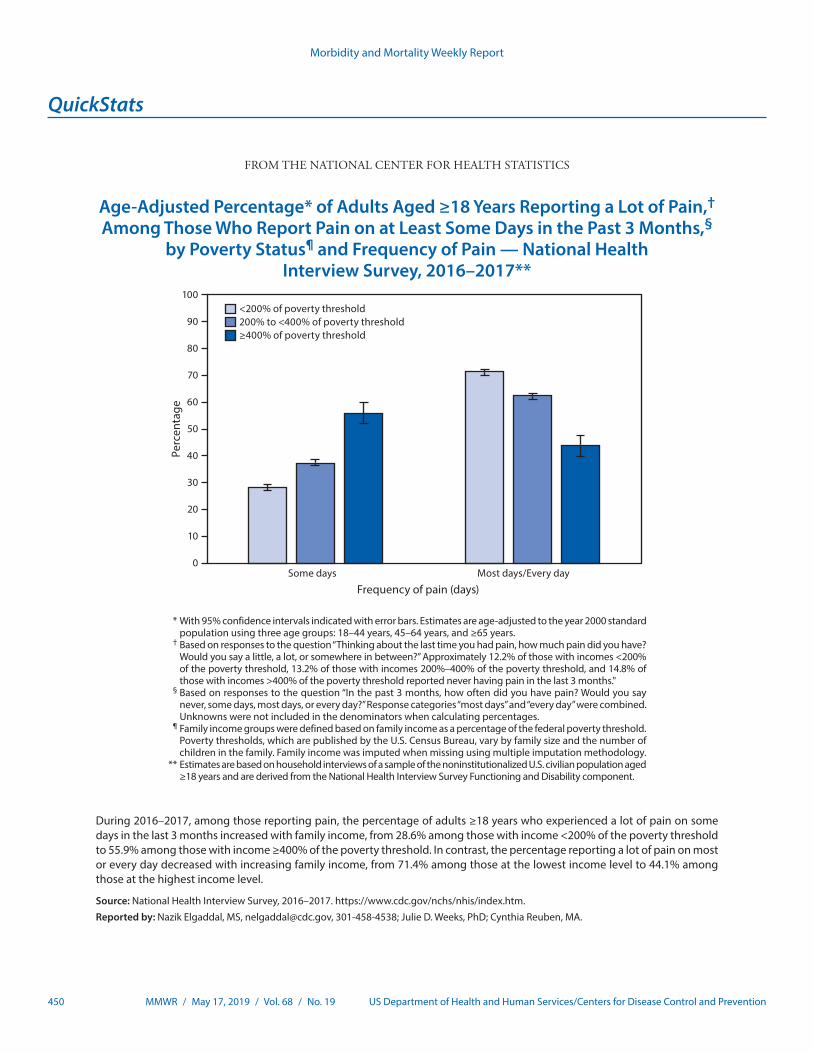
Age-Adjusted Percentage* of Adults Aged ≥18 Years Reporting a Lot of Pain,† Among Those Who Report Pain on at Least Some Days in the Past 3 Months,§
by Poverty Status¶ and Frequency of Pain — National Health Interview Survey, 2016–2017**
0
10
20
30
40
50
60
70
80
90
100
Some days Most days/Every day
Perc
enta
ge
Frequency of pain (days)
<200% of poverty threshold200% to <400% of poverty threshold≥400% of poverty threshold
* With 95% confidence intervals indicated with error bars. Estimates are age-adjusted to the year 2000 standard population using three age groups: 18–44 years, 45–64 years, and ≥65 years.
† Based on responses to the question “Thinking about the last time you had pain, how much pain did you have? Would you say a little, a lot, or somewhere in between?” Approximately 12.2% of those with incomes <200% of the poverty threshold, 13.2% of those with incomes 200%–400% of the poverty threshold, and 14.8% of those with incomes >400% of the poverty threshold reported never having pain in the last 3 months."
§ Based on responses to the question “In the past 3 months, how often did you have pain? Would you say never, some days, most days, or every day?” Response categories “most days” and “every day” were combined. Unknowns were not included in the denominators when calculating percentages.
¶ Family income groups were defined based on family income as a percentage of the federal poverty threshold. Poverty thresholds, which are published by the U.S. Census Bureau, vary by family size and the number of children in the family. Family income was imputed when missing using multiple imputation methodology.
** Estimates are based on household interviews of a sample of the noninstitutionalized U.S. civilian population aged ≥18 years and are derived from the National Health Interview Survey Functioning and Disability component.
During 2016–2017, among those reporting pain, the percentage of adults ≥18 years who experienced a lot of pain on some days in the last 3 months increased with family income, from 28.6% among those with income <200% of the poverty threshold to 55.9% among those with income ≥400% of the poverty threshold. In contrast, the percentage reporting a lot of pain on most or every day decreased with increasing family income, from 71.4% among those at the lowest income level to 44.1% among those at the highest income level.
Source: National Health Interview Survey, 2016–2017. https://www.cdc.gov/nchs/nhis/index.htm.
Reported by: Nazik Elgaddal, MS, [email protected], 301-458-4538; Julie D. Weeks, PhD; Cynthia Reuben, MA.


Morbidity and Mortality Weekly Report
ISSN: 0149-2195 (Print)
The Morbidity and Mortality Weekly Report (MMWR) Series is prepared by the Centers for Disease Control and Prevention (CDC) and is available free of charge in electronic format. To receive an electronic copy each week, visit MMWR at https://www.cdc.gov/mmwr/index.html.
Readers who have difficulty accessing this PDF file may access the HTML file at https://www.cdc.gov/mmwr/index2019.html. Address all inquiries about the MMWR Series, including material to be considered for publication, to Executive Editor, MMWR Series, Mailstop E-90, CDC, 1600 Clifton Rd., N.E., Atlanta, GA 30329-4027 or to [email protected].
All material in the MMWR Series is in the public domain and may be used and reprinted without permission; citation as to source, however, is appreciated.
MMWR and Morbidity and Mortality Weekly Report are service marks of the U.S. Department of Health and Human Services.
Use of trade names and commercial sources is for identification only and does not imply endorsement by the U.S. Department of Health and Human Services.
References to non-CDC sites on the Internet are provided as a service to MMWR readers and do not constitute or imply endorsement of these organizations or their programs by CDC or the U.S. Department of Health and Human Services. CDC is not responsible for the content of these sites. URL addresses listed in MMWR were current as of the date of publication.