more details can be found in the “ course objectives and content ” handout on the course webpage
DESCRIPTION
If your several predictors are categorical, MRA is identical to ANOVA. If your sole predictor is continuous, MRA is identical to correlational analysis. If your sole predictor is dichotomous, MRA is identical to a t-test. Do your residuals meet the required assumptions ?. - PowerPoint PPT PresentationTRANSCRIPT

More details can be found in the “Course Objectives and Content” handout on the course webpage.More details can be found in the “Course Objectives and Content” handout on the course webpage.
Multiple RegressionAnalysis (MRA)
Multiple RegressionAnalysis (MRA) iiii XXY 22110
Do your residuals meet the required assumptions?
Test for residual
normality
Use influence statistics to
detect atypical datapoints
If your residuals are not independent,
replace OLS by GLS regression analysis
Use Individual
growth modeling
Specify a multi-level
model
If your sole predictor is continuous, MRA is
identical to correlational analysis
If your sole predictor is dichotomous, MRA is
identical to a t-test
If your several predictors are
categorical, MRA is identical to ANOVA
If time is a predictor, you need discrete-
time survival analysis…
If your outcome is categorical, you need to
use…
Binomial logistic
regression analysis
(dichotomous outcome)
Multinomial logistic
regression analysis
(polytomous outcome)
If you have more predictors than you
can deal with,
Create taxonomies of fitted models and compare them.
Form composites of the indicators of any common
construct.
Conduct a principal components analysis
Use cluster analysis
Use non-linear regression analysis.
Transform the outcome or predictor
If your outcome vs. predictor relationship
is non-linear,
Use factor analysis:EFA or CFA?
© Willett, Harvard University Graduate School of Education, 04/19/2023
S052/III.3(a) – Slide 1
S052/III.3(a): Applied Data AnalysisWhere Does Today’s Topic Area Fall, Within The Overall Roadmap of the Course?
S052/III.3(a): Applied Data AnalysisWhere Does Today’s Topic Area Fall, Within The Overall Roadmap of the Course?
Today’s Topic Area

© Willett, Harvard University Graduate School of Education, 04/19/2023
S052/III.3(a) – Slide 2
Please check inter-connections among the Roadmap, the Daily Topic Area, the Printed Syllabus, and the content of today’s class when you pre-read the day’s materials.
Please check inter-connections among the Roadmap, the Daily Topic Area, the Printed Syllabus, and the content of today’s class when you pre-read the day’s materials.
S052/III.3(a): Applied Data AnalysisHow Does Today’s Topic Map Onto The Printed Syllabus?
S052/III.3(a): Applied Data AnalysisHow Does Today’s Topic Map Onto The Printed Syllabus?
If you had an infinite number of monkeys …
Measuring Teacher Professional Defensiveness(Slides 4-6).
Contrasting Principal Components Analysis and Factor Analysis
(Slide 8-9).
How Ridiculous Is Exploratory Factor Analysis?(Slide 11).
How Sensible is Confirmatory Factor Analysis?
(Slide 13-17).

© Willett, Harvard University Graduate School of Education, 04/19/2023
S052/III.3(a) – Slide 3
Please check inter-connections among the Roadmap, the Daily Topic Area, the Printed Syllabus, and the content of today’s class when you pre-read the day’s materials.
Please check inter-connections among the Roadmap, the Daily Topic Area, the Printed Syllabus, and the content of today’s class when you pre-read the day’s materials.
S052/III.3(a): Applied Data Analysis How Does Today’s Topic Map Onto The Printed Syllabus?
S052/III.3(a): Applied Data Analysis How Does Today’s Topic Map Onto The Printed Syllabus?
If you had an infinite number of monkeys …
Measuring Teacher Professional Defensiveness(Slides 4-6).

© Willett, Harvard University Graduate School of Education, 04/19/2023
S052/III.3(a) – Slide 4
S052/III.3(a): Applied Data Analysis Measuring Teacher Professional Defensiveness
S052/III.3(a): Applied Data Analysis Measuring Teacher Professional Defensiveness
Dataset FOWLER.txt
Overview
In this study, which was her qualifying paper, Amy Fowler reports on the piloting and construct validation of a self-designed survey instrument to measure teachers’ professional defensiveness within the context of a professional relationship with a peer. The dataset contains responses from teachers on this Teacher Professional Defensiveness Scale (TPDS), and on two other published scales – the Specific Interpersonal Trust Scale (SITS) and the Fear of Negative Evaluation Scale (FNES) (Robinson et al., 1991).
Source
Fowler, A.M. (2009). Measuring Teacher Defensiveness: An Instrument Validation Study. Unpublished Qualifying Paper, Harvard Graduate School of Education.
Robinson, J. P., Shaver, P. R., Wrightsman, L. S., & Andrews, F. M. (1991). Measures Of Personality And Social Psychological Attitudes. San Diego: Academic Press.
Additional Info
The three instruments are described more fully in Fowler (2009), but briefly are:· Specific Interpersonal Trust Scale (SITS): The SITS scale assesses the level of
trust one individual places in another. Participants choose a response that reflects their feelings towards a referent peer, on a five-point scale (see Metric below). There are 8 items, 3 of which must be reverse coded when totaling the responses and then larger total scores represent a higher level of respondents’ trust in their selected peers.
· Teacher Professional Defensiveness Scale (TPDS): The TPDS Scale was designed by the investigator to assess teacher sensitivity to peer feedback. Respondents are directed to imagine their referent peer making a series of comments regarding the respondent’s teaching practice and are then asked to respond to these comments on a seven-point scale (see Metric below). The scale contains 21 items presented in random order; statement stems are alternately complimentary,neutral or critical.
· Fear of Negative Evaluation Scale (FNES): The FNES scale assesses the degree of fear respondents have regarding negative evaluation from others. Respondents are asked to assess how characteristic each statement is of their own feelings, on a five-point scale (see Metric below). There are 12 items, including 4 for which responses must be reverse coded when totaling the responses and then larger total scores indicate higher levels of fear towards negative evaluation.
Sample size
411 Teachers
Construct Validation:A New Instrument to Measure
Teacher Professional Defensiveness
Three Sub-Scales, each with 7 items:• “Criticisms”• “Compliments”• “Neutral”
Research Objective:• Check that three sub-scales of TPDS
are each separately uni-dimensional.• Check that the constructs measured by
each sub-scale are distinct from each other (but perhaps correlated).
• Validate the TPD sub-scales against other accepted measures (SITS, FNES).

Col#
VarName
Variable Description Variable Metric/Labels
1 TID Teacher identification code? Integer
2 SID School identification code? Integer
Teacher Professional Defensiveness Scale (TPDS):
16 D1I like the tone of your room; it is friendly but serious about school at the same time.
1 = High Criticism2 = Criticism3 = Mild Criticism4 = Neither5 = Mild Compliment6 = Compliment7 = High Compliment
17 D2I think you underestimated student’s prior knowledge of today’s topic.
20 D5 I’m not clear how today’s lesson related to the curriculum standards.
21 D6The examples you used to explain the main concept helped students to understand the big ideas.
25 D10I’m not sure the task you had kids do required kids to achieve the objective you had on the board.
26 D11 It seems like you worry about whether or not the students like you.
28 D13I can tell by the way you talk to the students that you believe they can learn this material.
29 D14I wonder if the students learned the concept you wanted them to learn through that hands-on lesson.
31 D16I wonder if students in the class understand your sarcasm in the same way you mean it.
33 D18 Students seem to follow the classroom rules.
36 D21The way you started the class with students’ interests got them involved and attentive to the lesson.
© Willett, Harvard University Graduate School of Education, 04/19/2023
S052/III.3(a) – Slide 5
S052/III.3(a): Applied Data Analysis Measuring Teacher Professional Defensiveness
S052/III.3(a): Applied Data Analysis Measuring Teacher Professional Defensiveness
Indicators ofTeacher Professional
Defensiveness:“Criticisms” Sub-Scale
Indicators ofTeacher Professional
Defensiveness:“Compliments ” Sub-
Scale
© Willett, Harvard University Graduate School of Education, 04/19/2023
S052/III.3(a) – Slide 6
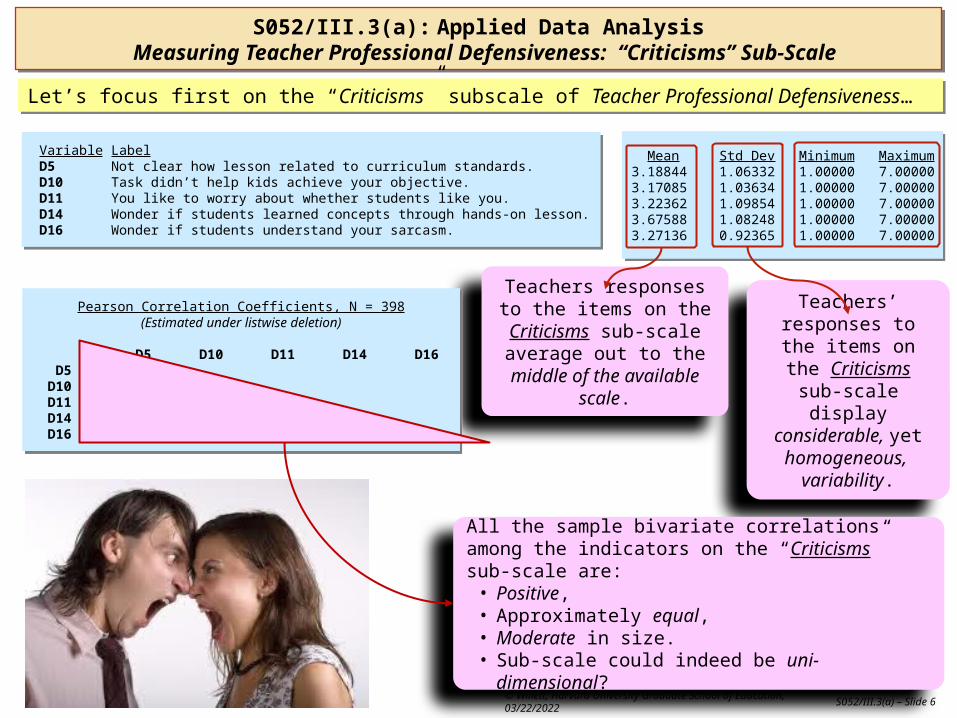
Mean Std Dev Minimum Maximum3.18844 1.06332 1.00000 7.000003.17085 1.03634 1.00000 7.000003.22362 1.09854 1.00000 7.000003.67588 1.08248 1.00000 7.000003.27136 0.92365 1.00000 7.00000
Mean Std Dev Minimum Maximum3.18844 1.06332 1.00000 7.000003.17085 1.03634 1.00000 7.000003.22362 1.09854 1.00000 7.000003.67588 1.08248 1.00000 7.000003.27136 0.92365 1.00000 7.00000
Teachers’ responses to the items on the
Criticisms sub-scale display considerable,
yet homogeneous, variability.
S052/III.3(a): Applied Data Analysis Measuring Teacher Professional Defensiveness: “Criticisms” Sub-Scale
S052/III.3(a): Applied Data Analysis Measuring Teacher Professional Defensiveness: “Criticisms” Sub-Scale
Variable Label D5 Not clear how lesson related to curriculum standards. D10 Task didn’t help kids achieve your objective. D11 You like to worry about whether students like you. D14 Wonder if students learned concepts through hands-on lesson. D16 Wonder if students understand your sarcasm.
Variable Label D5 Not clear how lesson related to curriculum standards. D10 Task didn’t help kids achieve your objective. D11 You like to worry about whether students like you. D14 Wonder if students learned concepts through hands-on lesson. D16 Wonder if students understand your sarcasm.
Let’s focus first on the “Criticisms” subscale of Teacher Professional Defensiveness…Let’s focus first on the “Criticisms” subscale of Teacher Professional Defensiveness…
Teachers responses to the items on the Criticisms sub-
scale average out to the middle of the available scale.
Pearson Correlation Coefficients, N = 398(Estimated under listwise deletion)
D5 D10 D11 D14 D16 D5 1.000 D10 0.538 1.000 D11 0.372 0.477 1.000 D14 0.386 0.555 0.328 1.000 D16 0.356 0.483 0.342 0.436 1.000
Pearson Correlation Coefficients, N = 398(Estimated under listwise deletion)
D5 D10 D11 D14 D16 D5 1.000 D10 0.538 1.000 D11 0.372 0.477 1.000 D14 0.386 0.555 0.328 1.000 D16 0.356 0.483 0.342 0.436 1.000
All the sample bivariate correlations among the indicators on the “Criticisms” sub-scale are:• Positive, • Approximately equal,• Moderate in size.• Sub-scale could indeed be uni-dimensional?

© Willett, Harvard University Graduate School of Education, 04/19/2023
S052/III.3(a) – Slide 7
Please check inter-connections among the Roadmap, the Daily Topic Area, the Printed Syllabus, and the content of today’s class when you pre-read the day’s materials.
Please check inter-connections among the Roadmap, the Daily Topic Area, the Printed Syllabus, and the content of today’s class when you pre-read the day’s materials.
S052/III.3(a): Applied Data AnalysisHow Does Today’s Topic Map Onto The Printed Syllabus?
S052/III.3(a): Applied Data AnalysisHow Does Today’s Topic Map Onto The Printed Syllabus?
If you had an infinite number of monkeys …
Contrasting Principal Components Analysis and Factor Analysis
(Slide 8-9).

© Willett, Harvard University Graduate School of Education, 04/19/2023
S052/III.3(a) – Slide 8
Research Question?
S052/III.3(a): Applied Data Analysis Contrasting PCA and Factor Analysis?S052/III.3(a): Applied Data Analysis
Contrasting PCA and Factor Analysis?
We could ask … “Are there A number of unseen (latent) factors (constructs) that act “beneath” these indicators
to determine their observed values?”
Instead, we would need …Factor Analysis (CFA or EFA)
Path Model of Factor AnalysisPath Model of Factor Analysis
D5i
D10i
D11i
D14i
D16i
5i
10i
11i
14i
16i
1i
2i
Rather than asking … “Can we forge these several indicators together into a smaller number of
composites with defined statistical properties?”
Then, we would need …Principal Components Analysis (PCA)
Path Model of Principal Components AnalysisPath Model of Principal Components Analysis
C1i
C2i
D5i
D10i
D11i
D14i
D16i
C3i
C4i
C5i
C6i
© Willett, Harvard University Graduate School of Education, 04/19/2023
S052/III.3(a) – Slide 9
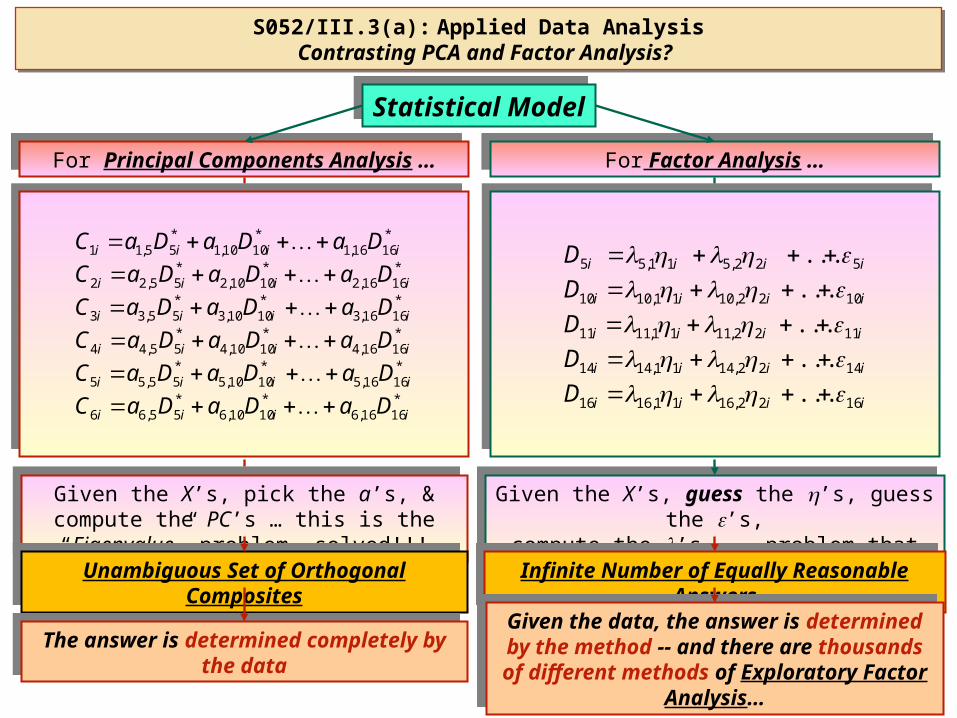
Statistical ModelStatistical Model
For Factor Analysis …For Factor Analysis …
iiii
iiii
iiii
iiii
iiii
D
D
D
D
D
1622,1611,1616
1422,1411,1414
1122,1111,1111
1022,1011,1010
522,511,55
...
...
...
...
...
Given the X’s, guess the ’s, guess the ’s,compute the ’s ... problem that can’t be solved!!!
Given the X’s, guess the ’s, guess the ’s,compute the ’s ... problem that can’t be solved!!!
S052/III.3(a): Applied Data Analysis Contrasting PCA and Factor Analysis?S052/III.3(a): Applied Data Analysis
Contrasting PCA and Factor Analysis?
For Principal Components Analysis …For Principal Components Analysis …
*1616,6
*1010,6
*55,66
*1616,5
*1010,5
*55,55
*1616,4
*1010,4
*55,44
*1616,3
*1010,3
*55,33
*1616,2
*1010,2
*55,22
*1616,1
*1010,1
*55,11
iiii
iiii
iiii
iiii
iiii
iiii
DaDaDaC
DaDaDaC
DaDaDaC
DaDaDaC
DaDaDaC
DaDaDaC
Given the X’s, pick the a’s, & compute the PC’s … this is the “Eigenvalue” problem, solved!!!Given the X’s, pick the a’s, & compute the PC’s … this is the “Eigenvalue” problem, solved!!!
Unambiguous Set of Orthogonal CompositesUnambiguous Set of Orthogonal Composites
The answer is determined completely by the dataThe answer is determined completely by the data
Infinite Number of Equally Reasonable AnswersInfinite Number of Equally Reasonable Answers
Given the data, the answer is determined by the method -- and there are thousands of different
methods of Exploratory Factor Analysis…
Given the data, the answer is determined by the method -- and there are thousands of different
methods of Exploratory Factor Analysis…

© Willett, Harvard University Graduate School of Education, 04/19/2023
S052/III.3(a) – Slide 10
Please check inter-connections among the Roadmap, the Daily Topic Area, the Printed Syllabus, and the content of today’s class when you pre-read the day’s materials.
Please check inter-connections among the Roadmap, the Daily Topic Area, the Printed Syllabus, and the content of today’s class when you pre-read the day’s materials.
S052/III.3(a): Applied Data Analysis How Does Today’s Topic Map Onto The Printed Syllabus?
S052/III.3(a): Applied Data Analysis How Does Today’s Topic Map Onto The Printed Syllabus?
If you had an infinite number of monkeys …
How Ridiculous Is Exploratory Factor Analysis?(Slide 11).

*-----------------------------------------------------------------------* Exploratory factor analysis of TPD "Criticisms" sub-scale, on its own*----------------------------------------------------------------------- factor D5 D10 D11 D14 D16, pf mineigen(1) factor D5 D10 D11 D14 D16, pcf mineigen(1) factor D5 D10 D11 D14 D16, ipf mineigen(1) factor D5 D10 D11 D14 D16, ml mineigen(1)
© Willett, Harvard University Graduate School of Education, 04/19/2023
S052/III.3(a) – Slide 11
And, if you don’t believe me … look at the options you could face when conducting an Exploratory Factory Analysis …And, if you don’t believe me … look at the options you could face when conducting an Exploratory Factory Analysis …
Ways of Obtaining an “Initial” Factor Solution (of either the covariance or the correlation matrix):• Alpha factor analysis,• Harris component analysis,• Image component analysis,• ML factor analysis,• Principal axis factoring,• Pattern, specified by user,• Prinit factor analysis,• Unweighted least-squares
factor analysis.
Ways Of Obtaining Initial Estimates Of The Measurement Error Variances:• Absolute SMC,• Input from external file,• Maximum absolute correlation,• Set to One,• Set to Random,• SMC.
Ways Of Rotating To A Final Factor Solution :• Biquartimax• Equamax,• None,• Orthogonal Crawford-Ferguson,• Generalized Crawford-Ferguson,• Orthomax,• Parsimax,• Quartimax,• Varimax.• Biquartimin,• Covarimin,• Harris-Kaiser Ortho-Oblique,• Oblique Biquartimax,• Oblique Equamax,• Oblique Crawford-Ferguson,• Oblique Generalized Crawford-Ferguson,• Oblimin,• Oblique Quartimax,• Oblique Varimax• Procrustes,• Promax, • Quartimin, … etc.
62 22 )7(#of Methods of EFA …at least = 1848=
S052/III.3(a): Applied Data Analysis How Ridiculous Is Exploratory Factor Analysis?
S052/III.3(a): Applied Data Analysis How Ridiculous Is Exploratory Factor Analysis?

© Willett, Harvard University Graduate School of Education, 04/19/2023
S052/III.3(a) – Slide 12
Please check inter-connections among the Roadmap, the Daily Topic Area, the Printed Syllabus, and the content of today’s class when you pre-read the day’s materials.
Please check inter-connections among the Roadmap, the Daily Topic Area, the Printed Syllabus, and the content of today’s class when you pre-read the day’s materials.
S052/III.3(a): Applied Data Analysis How Does Today’s Topic Map Onto The Printed Syllabus?
S052/III.3(a): Applied Data Analysis How Does Today’s Topic Map Onto The Printed Syllabus?
If you had an infinite number of monkeys …
How Reasonable Is Confirmatory Factor Analysis?
(Slide 13-17).

*----------------------------------------------------------------------* Confirmatory factor analysis of TPD "Criticisms" sub-scale*----------------------------------------------------------------------* Inspect values of Criticisms for first 35 teachers in dataset: list D5 D10 D11 D14 D16 in 1/30, nolabel* Univariate descriptive statistics on teacher satisfaction indicators: tabstat D5 D10 D11 D14 D16, ///
stats(mean sd n) col(statistics) casewise format(%6.0g)* Bivariate relationships among items on "Criticisms" sub-scale; pwcorr D5 D10 D11 D14 D16, casewise sig obs
* CFA of "Criticisms" sub-scale: Testing a uni-dimensional hypothesis: confa (ETA1: D5 D10 D11 D14 D16), from(smart)
© Willett, Harvard University Graduate School of Education, 04/19/2023
S052/III.3(b) – Slide 13
A better approach – rather than sifting among millions of equally likely solutions with EFA … … is to make a reasonable hypothesis about the underlying factor structure and test whether it fits the data!A better approach – rather than sifting among millions of equally likely solutions with EFA … … is to make a reasonable hypothesis about the underlying factor structure and test whether it fits the data!
S052/III.3(b): Applied Data Analysis How Reasonable Is Confirmatory Factor Analysis?
S052/III.3(b): Applied Data Analysis How Reasonable Is Confirmatory Factor Analysis?
iii
iii
iii
iii
iii
D
D
D
D
D
1611,16*16
1411,14*14
1111,11*11
1011,10*10
511,5*5
See Data-Analytic Handout III.3(b).1See Data-Analytic Handout III.3(b).1
H0: Indicators of the “Criticisms” Sub-Scale Have a “Uni-Dimensional” Factor Structure, In The Population.
Hypothesized Uni-Dimensional Factor Structure for the “Criticisms” Sub-Scale…Hypothesized Uni-Dimensional Factor Structure for the “Criticisms” Sub-Scale…
D5i
D10i
D11i
D14i
D16i
5i
10i
11i
14i
16i
1i

© Willett, Harvard University Graduate School of Education, 04/19/2023
S052/III.3(b) – Slide 14
And, you know what? … it fits!!!And, you know what? … it fits!!!
S052/III.3(b): Applied Data Analysis How Reasonable Is Confirmatory Factor Analysis?
S052/III.3(b): Applied Data Analysis How Reasonable Is Confirmatory Factor Analysis?
Chi-Square Statistic 9.3383 Chi-Square DF 5 Pr > Chi-Square 0.0947
iii
iii
iii
iii
iii
DDDDD
16116
14114
11111
10110
515
82.006.192.034.100.1
H0: Indicators of the “Criticisms” Sub-Scale Have a “Uni-Dimensional” Factor Structure, In The Population.
2 statistic for testing the null hypothesis of
fit.
Degrees of freedom for the test.
p-value for the test.
Since the p-value is greater than .05, do not reject H0 … we conclude that
the data are consistent with hypothesized path model.
Fitted Uni-Dimensional Factor Structure for the “Criticisms” Sub-Scale…Fitted Uni-Dimensional Factor Structure for the “Criticisms” Sub-Scale…
D5i
D10i
D11i
D14i
D16i
0.64
0.26
0.81
0.70
0.57
1i
1.00
1.34
0.92
1.06
0.82Note:These are the estimated error variances.

© Willett, Harvard University Graduate School of Education, 04/19/2023
S052/III.3(a) – Slide 15
For “Compliments” Sub-Scale too!!!!For “Compliments” Sub-Scale too!!!!
S052/III.3(b): Applied Data Analysis How Reasonable Is Confirmatory Factor Analysis?
S052/III.3(b): Applied Data Analysis How Reasonable Is Confirmatory Factor Analysis?
Chi-Square Statistic 8.361 Chi-Square DF 2 Pr > Chi-Square 0.0153
iii
iii
iii
iii
DDDD
21221
18218
13213
626
04.191.001.100.1
H0: Indicators of the “Compliments” Sub-Scale Have a “Uni-Dimensional” Factor Structure, In The Population.
Since the p-value is greater than .01 (!!!), do not reject H0 … we conclude that the
data are consistent with hypothesized path model.
Fitted Uni-Dimensional Factor Structure for the “Compliments” Sub-Scale…Fitted Uni-Dimensional Factor Structure for the “Compliments” Sub-Scale…
D6i
D13i
D18i
D21i
0.30
0.52
0.72
0.27
2i
1.00
1.01
0.91
1.04
Note:These are the estimated error variances.
Statistics for testing the null hypothesis of fit.

© Willett, Harvard University Graduate School of Education, 04/19/2023
S052/III.3(b) – Slide 16
It doesn’t work quite so well, when you try to fit a two-factor (oblique) structure to all the indicators together!!! It doesn’t work quite so well, when you try to fit a two-factor (oblique) structure to all the indicators together!!!
S052/III.3(b): Applied Data Analysis How Reasonable Is Confirmatory Factor Analysis?
S052/III.3(b): Applied Data Analysis How Reasonable Is Confirmatory Factor Analysis?
Chi-Square Statistic 59.638 Chi-Square DF 26 Pr > Chi-Square 0.0002
H0: Indicators of the “Criticisms” & “Compliments” Sub-Scales Have an Oblique Two-Factor Structure, In The
Population.
Since the p-value is less than .05, reject H0 … we conclude that the data are not consistent with hypothesized
oblique two-factor structure.
Hypothesized Oblique Two Factor Structure…Hypothesized Oblique Two Factor Structure…
D6i
D13i
D18i
D21i
2i
D5i
D10i
D11i
D14i
D16i
5i
10i
11i
14i
16i
1i
5i
10i
11i
14i
iii
iii
iii
iii
iii
iii
iii
iii
iii
D
D
D
D
D
D
D
D
D
2122,21*21
1822,18*18
1322,13*13
622,6*6
1611,16*16
1411,14*14
1111,11*11
1011,10*10
511,5*5
Statistics for testing the null hypothesis of fit.

© Willett, Harvard University Graduate School of Education, 04/19/2023
S052/III.3(b) – Slide 17
Why? Because some of the indicators wants to load on the other factor, too … Why? Because some of the indicators wants to load on the other factor, too …
S052/III.3(b): Applied Data Analysis How Reasonable Is Confirmatory Factor Analysis?
S052/III.3(b): Applied Data Analysis How Reasonable Is Confirmatory Factor Analysis?
Chi-Square Statistic 48.833 Chi-Square DF 23 Pr > Chi-Square 0.0013
H0: Indicators of the “Criticisms” & “Compliments” Sub-Scales Have an Oblique Two-Factor Structure, In The
Population, But Each Measures Both Factors.
Statistics for testing the null hypothesis of fit.
Since the p-value is less than .05, reject H0 … we
conclude that the data are not consistent with hypothesized
oblique two-factor structure, in the path model at the left … what
next?
iii
iii
iii
iii
iiii
iiii
iiii
iiii
iiii
D
D
D
D
D
D
D
D
D
2122,21*21
1822,18*18
1322,13*13
622,6*6
1622,1611,16*16
1422,1411,14*14
1122,1111,11*11
1022,1011,10*10
522,511,5*5
Hypothesized Oblique Two Factor Structure…Hypothesized Oblique Two Factor Structure…
D6i
D13i
D18i
D21i
2i
D5i
D10i
D11i
D14i
D16i
5i
10i
11i
14i
16i
1i
5i
10i
11i
14i

© Willett, Harvard University Graduate School of Education, 04/19/2023
S052/III.3(a) – Slide 18
More details can be found in the “Course Objectives and Content” handout on the course webpage.More details can be found in the “Course Objectives and Content” handout on the course webpage.
Multiple RegressionAnalysis (MRA)
Multiple RegressionAnalysis (MRA) iiii XXY 22110
Do your residuals meet the required assumptions?
Test for residual
normality
Use influence statistics to
detect atypical datapoints
If your residuals are not independent,
replace OLS by GLS regression analysis
Use Individual
growth modeling
Specify a Multi-level
Model
If your sole predictor is continuous, MRA is
identical to correlational analysis
If your sole predictor is dichotomous, MRA is identical to a t-test
If your several predictors are
categorical, MRA is identical to ANOVA
If time is a predictor, you need discrete-
time survival analysis…
If your outcome is categorical, you need to
use…
Binomial logistic
regression analysis
(dichotomous outcome)
Multinomial logistic
regression analysis
(polytomous outcome)
If you have more predictors than you
can deal with,
Create taxonomies of fitted models and compare
them.
Form composites of the indicators of any common
construct.
Conduct a Principal Components Analysis
Use Cluster Analysis
Use non-linear regression analysis.
Transform the outcome or predictor
If your outcome vs. predictor relationship
is non-linear,
Use Factor Analysis:EFA or CFA?
S052/III.3(a): Applied Data Analysis It’s Not The Destination, Grasshopper, It’s The Journey!!!
S052/III.3(a): Applied Data Analysis It’s Not The Destination, Grasshopper, It’s The Journey!!!
(It’s Getting Very Near)
The End(We Hope You Have Enjoyed The Show)