more information from trl · 2016-10-02 · more information from trl trl has publishedthe...
TRANSCRIPT

MORE INFORMATION FROM TRLTRL has publishedthe followingother reportson this area of research:
R~9 Long term disabilityfollowingrcladtraffic accidents,C S B Gdasko, P Murray,M HodSon,R J Tunbridgeand J T Everest Price Code B
CR212 The cost of long term disabilityresultingfromroad tr~lc accidents:interim report byR J Tunbridge,TRRL andP A Murray,A M Knsella and C S B Galasko,UniversityofManchester,Price Code B
CR340 The cost of long-termdisabilityresultingfromroad traff]caccidents:2 year follow-uprepo~ P A Murray,M Pitcher md C S B Gdasko, Priw Code H
RR378 Revaluationof the wst of road accidentcasualties 1992.revision,J HopkinandD OReilly,Price Code H
Ifyouwouldtikecopies,photocopyandfillin theslipbelow.mere is a20% discountifyoutake dl therepomlisted above.Prices includepostageand are correctat the time of publication.Please see the enclosedletterforcurrentpriucode valuesandhandlingcharge.EnquiriestoTRLLibraryServi~s,OW ~707830r770784..........................................................................................................................................................................
To: PublicationSales,TRL Library,PO Box :!04,Wokingham,Berkshire,RG11 6YU.Please send me the following TRL reports (state report Nos and quantity)
....................................................................................................................................... ........................... .......
....................................................................................................................................................... .............. ....
....................................................................................................................................... ........................... .......
......................................................................................................................................... ............. .............. .....
Name..............................................!................!......... PAY~~
Address................................................................... ● I enclosea cheque for f .....................................
................................................................................. payableto TransportResearchLaboratory
................................................................................. ● Please debit my DepositAccount
Postcode................................................................,.. no .........................................................................
Telephone .............................................................. ● Pleasedebit my Credit Card by f ................
........................................................................ ......... ● Credit card no ....................................................
Credit card address(if differentfrom above) ......... Expi~date ...........................................................

final report
by P A Murray, M Pitcher and C S B Galsako(University of Manchester)
Project Report 450— Anexecutke agen~ of
giTHE DEPARTMENT -,OF TRANSPORT s2/2c

The Transport Research Laboratoryis an executive agency of the Department ofTransport. It provides technicall help and advice based on research to enable theGovernment to set standards for highway and vehicle design, to formulatepolicies on road safety, transport and the environment, and to encourage goodtraffic engineering practice.
TRL also sells its services, acting as contractor, consultant or providing facilitiesand staff ona fee-paying basis forcustomers in the private sector.
TRUs expertise ranges from the construction of highways, bridges andtunnels, toall forms of road safety, traffic control and driver behaviour.
For instance, highways and structures research at TRL develops improvedmaterials and methods which enable earthworks, roads and bridges to bedesigned, built and maintained more cost-effectively. New ways of reinforcingearth can cut construction costs, while bridges can be modified to reducecorrosion. Road surfaces developed at TRL can reduce noise and cut wet-weatherroad spray from lorries by 90 pe:r cent.
Safety research varies from monitoring the incidence of drinking and driving anddevising ways of reducing it, to improving junction designs and cooperating withEuropean partners on new standards for improved impact protection in vehicles.
Traffic research seeks to make the most of existing roads by, for instance,improving traffic signal coordination and devising systems which help driversavoid congestion. Other research looks at the effectiveness of parking controlsand improved crossings for pedestrians.
TRL research informs Government transport policy by studying, for example, theeffects of bus deregulation and how land use interacts with the road and railtransport system.
TRL employs around 600 scientists, engineers and support staff and is headed by aChief Executive. Its headquarte]~s are at Crowthorne, Berkshire where its facilitiesinclude a 3.8km test track, a separate self-contained road network, a structures hallwhere bridge structures can be stressed to breaking point, a facility for carrying outaccelerated tests on road structures and advanced computer systems which areused to develop sophisticated traffic control programs. A Scottish section inLivingston provides advice to highway authorities on local problems such as rockengineering, bridges, road construction and maintenance.
A large proportion of the research is sub-contracted to industry, consultants anduniversities. The Laboratory a;lso collaborates with local authorities and otherorganisations within Europe and elsewhere. In addition, TRL expertise isprovided to developing countri(:s as part of Britain’s overseas aid programme.
For more information: TRL Public Relations, 0344770587
\,

TRANSPORT RESEARCH LABORATORYAn Executive Agency of the Depatiment of Transpoti ~~~~
PROJECT REPORT 45
THE COST OF LONG TERM DISABILITY FROM ROAD TRAFFICACCIDENTS FOUR YEAR STUDY - FINAL REPORT
by P A Murray, M Pitcher and C S B Galsako(University of Manchester)
Prepared for: Project Record: SW2C Clinical Effect of RoadAccident Injuries
Customer: Road Safety Division, DOT (Mrs C McMahon)
@yright Controller of HMSO 1993. The views expressed in this publtition are not n=essari~ those of theDepatiment of Transport. The wok de=ribed in this paper forms pafl of a Transport Research Wratorymanaged reseamh programme mndmted by the Untiersfiy of Mamhester.
Safety Resource CentreTranspofl Research LaboratoryCroMhorne, Berkshire, RG11 6AU1993
ISSN 0968-4093

CONTENTS
E~CUTMSU~Y . . . . . . . . . . . . . . . . . . . . . . . . . . . . . . . . . . . . . . . . 1
ABSTMCT . . . . . . . . . . . . . . . . . . . . . . . . . . . . . . . . . . . . . . . . . . . . . . . . . . . 3
1. INTRODUCTION . . . . . . . . . . . . . . . . . . . . . . . . . . . . . . . . . . . . . . . . . 4
2. ~THODOLOGY . . . . . . . . . . . . . . . . . . . . . . . . . . . . . . . . . . . . . . . . . 5
3. POPUMTION C~CTEWSTICS . . . . . . . . . . . . . . . . . . . . . . . . . . . 6
3.1 Injury ByRoad User Type . . . . .. . . ... . . . .. . . .. . . . . . . . . . . . . . 6
3.2 Injury ByAge . . . . . . . . . . . . . . . . . . . . . . . . . . . . . . . . . . . . . . . 7
3.3 Protective Equipment By Vehicle Occupant . . . . . . . . . . . . . . . . . . 8
3.4 Disability Rate At StiMonth Intervak . . . . . . . . . . . . . . . . . . . . 10
3.5 Time Off Work . . . . . . . . . . . . . . . . . . . . . . . . . . . . . . . . . . . . . 18
4. COSTS . . . . . . . . . . . . . . . . . . . . . . . . . . . . . . . . . . . . . . . . . . . . . . . . 20
4.1 Health Service Costs . . . . . . . . . . . . . . . . . . . . . . . . . . . . . . . . . 20
4.1.1 Accident AndEmergency Costs . . . . . . . . . . . . . . . . . . . . . 21
4.1.2 In-patient Cos& . . . . . . . . . . . . . . . . . . . . . . . . . . . . . . . . ’23
4.1.3 Out-patient Cos& . . . . . . . . . . . . . . . . . . . . . . . . . . . . . . . 27
4.1.4 Physiotherapy CosB . . . . . . . . . . . . . . . . . . . . . . . . . . . . . 32
4.1.5 Cost OfAppliances (Orthoses) . . . . . . . . . . . . . . . . . . . . . . 37
4.1.6 Cost OfAmbulance Trips . . . . . . . . . . . . . . . . . . . . . . . . . . 37
4.1.7 Summa~OfHealth Service Cos& . . . . . . . . . . . . . . . . . . 39
4.2 SocialSecurity Co~ . . . . . . . . . . . . . . . . . . . . . . . . . . . . . . . . . 42
4.3 Pemonal Cos& . . . . . . . . . . . . . . . . . . . . . . . . . . . . . . . . . . . . . . 46
5. DISCUSSION . . . . . . . . . . . . . . . . . . . . . . . . . . . . . . . . . . . . . . . . . . . 47
5.1 Population Characteristics . . . . . . . . . . . . . . . . . . . . . . . . . . . . . 47
5.2 Health Service Costi . . . . . . . . . . . . . . . . . . . . . . . . . . . . . . . . . 48
5.3 Soctil Security Costs . . . . . . . . . . . . . . . . . . . . . . . . . . . . . . . . . 50
5.4 LocalAuthority Cos& . . . . . . . . . . . . . . . . . . . . . . . . . . . . . . . . . 51
5.5 Pemona[ Costs . . . . . . . . . . . . . . . . . . . . . . . . . . . . . . . . . . . . . . 51
6. SU~Y- CONCLUSIONS . . . . . . . . . . . . . . . . . . . . . . . . . . . . . . . 52
7. RE~~NCES . . . . . . . . . . . . . . . . . . . . . . . . . . . . . . . . . . . . . . . . . . 58
APPE~~ A: DIMILITY SCO~G ~THODOLOGY . . . . . . . . . . . . . . . 59
AC~OMEDG~~S . . . . . . . . . . . . . . . . . . . . . . . . . . . . . . . . . . . . . . . . 62

--
MB=~TIONS
z . . . . . . . . . . . . . . . . . . . ..~.,...,,..
Disc, . . . . . . . . . . . . . . . . . . .. . . . . . . . .
L.O.S. . . . . . . . . . . . . . . . . . .. . . . . . . .
Pts; . . . . . . . . . . . . . . . . . . . .. . . . . $...
R.T.A. . . . . . . . . . . . . . . . . . . . . . . . . . . .
S.S.P. . . . . . . . . . . . . . . . . . . . . . . . . . . .
T.R,L. . . . . . . . . . . . . . . . . . . . . . . . . . . .
T.R.R.L. . . . . . . . . . . . . . . . . . . . . . . . .
. . . . . . . . . . . . . . . . . . . . . . .
. . . . . . . . . . . . . Discontinued
. . Mean
@atients)
. . . . . . . . . . . . . . . . . . Len@ Of Stay
. . . . . . . . . . . . . . . . . . . . . . . Patients
~~RoadTTtilcAccident. . . . . . . . . . . . .
. . . . . . . . . . . . . . . . Statutory Sick Pay
. . . . . . .
Transport
Transport
And Road
Resear~
Research
Laboratory
Laboratory
The TRLProj=t Officer for this work was Ja Hopkin, Safety Resource Centre.

E~CUTWE SUMMY
The Department of Transport @OT) is finding a prograrnme of reswch into the cost ofroad accidents, with a view to re-vduing the costs of accidents and casualties for apprai~of road and safety schemes. The progmme includes work on the long term effects of twotypes of road accident injury which pfiot studies had shown to bearnongst the most disabhng:fractures of the lower timbs (classifiti by DOT as ‘serious’) and soft tissue injury to theewid spine, or’ whiplash’ (classifid by DOT as ‘slight’). The long term consequences ofthese injuries result in costs to society which have not previously been taken into account inresting road accidents in Gr=t Britain.
A detaild study of samples of road accident audties with these two types of injuries wastied out under contract to ~ by the Department of Orthopedic Surgery, ManchesterUniversity. Wdom samples of patients with these injuries were recruited during 1987 and1988, from patients attending the Accident and Emergency Department of me of threehospitis in the Greater Manchester ara. h toti, 413 ‘whiplash’ patients were recruitd, 117‘fracture’ patients and 9 patients who had both ‘whiplash’ and fracture injuries. Thecasualties were interviewed a few days after the accident, md then at six monthly intervalsfor a period of four yas, unless they had fu~y recovered before then.
Each interview coverd use of hospiti in-patient and out-patient semices, ambulances,Gened Practitioner and District Nurse; the amount of time off work was recorded, andeffects on other daily activities were investigated, and changes in income, claims forcompensation and payments of Social Security benefits were identifid.
Information from the lo~ hdth authority was usd to assign unit costs to the semices usdby patients, and estimates of the average cost per patient to the National Hdth Service, theDepartment of Social Security, and to the individud, were derived for each of the first foury=s foflowing the road accident.
The level of disability experiend by the mudtiesrecovery, levels of residud disability and an averageover the four y= period fo~owing the accident.
was summaristi in terms of rates ofdisability score at six month intervals
The main results can be summarisd as follows.
1. Over the four yw period, the cost to the nation in terms of Hdth and SocialSecurity services amounted to about f650 per ‘whiplash’ patient and f4,850 per fracturepatient (in June 1991 prices). Herdth Service costs were incurrd largely in the first year afterthe accident, but mntinu~overbfour ym~riod.. ~e-Socid Smurity costs were dsogr=ter in the fist y= than in subsquent years, but taperd off more slowly.
2. The proportion of patients who had not recoverd from their injuries gradudlydecr=sd over time but after four y-s, over 8 per cent of patients had not recovered andsufferd residti disabfity: 8 per cent of’ whiplash’ patients, 7 per cent of fracture patientsand 22 per cent of ‘whipiash’ and fracture patients; in addition 13 per cent of patientsa residurd problem which had stabtiised before the end of tie four y= period.
had
1

3. The average number of working days lost as a result of the injuries over the four yearperiod was 39 for those with ‘whiplash’, 91 for fracture and 172 for ‘whiplash’ and fractureinjuries. The amount of time off work was highest in the first ym but continued over thefour yms. Time off work meant personal losses to the individuals involved; income lost asa result of the accident averaged f770 per patient with ‘whiplash’ injuries, and f 1,650 perfracture patient (June 1991 prices). Time off work dso mas a loss to the whole monomy.
4. For fracture injuries, the largest single cost to the H4th Service was in-patienttratment, averaging almost i3,000 per patient; most in-patient tratment was during the first6 months after the accident. The next largest item for fracture patients was physiotherapy,at f360 per patient. For ‘whiplash’ patients physiotherapy-was -the largest single cost to theHdth Service, averaging f 170 per patient. The other main costs were fracture clinicattendance, ambulance joumey:s and Accident and Emergency treatment. Out-patienttrmtment was more common in tile fwst year after the accident thm in subs~uent yas, butcontinual, at a dectining rate, during the four y=s.
5. Other costs to the Hdth Service included GeneA Practitioner consultations, DistrictNurse attendance and appliances. The average cost per patient of the latter two services wasless than f 15. On average, both fracture patients and ‘whiplash’ patients consultd GPs 3times. Unfortunately it was not possible to estimate rests for GP visits.
6. Costs to the Department of Social Smurity comprised Statutory Sick Pay (SSP, whichis paid for sickness absences less than 28 w=ks), and a range of additiond benefits whichtend to cover longer term illness and disability. In June 1991 prices, payments to ‘whiplash’patients averagd f200 (SSP) ad f 150 (other benefits); payments to fracture patientsaveraged f360 (SSP) md f820 (additiond benefits). Payments continued through the fouryears studid, reflecting the continuing level of disability; some payments will continue intothe future as Severe Disabtity ~ld Invtidity Allowances are payable on a long term basis.
7. Over hdf of the patients with ‘whiplash’ injuries and over two-thirds of those withfractures claimd compensation for their injuries. By the end of the study, two-thirds ofclaims had been setied; averagrd over dl patients in the study these amountd to aboutf 1,200 in tie me of ‘whiplash’ ad f 1,300 in the =se of fracture patients. A few patientschmged to higher paid jobs when their injuries prevented them from continuing theirprevious employment; the average income gain was f 1 per person over dl ‘whiplash’ patientsand f 150 averagd over dl fracture patients.
8. Mny of the costs to the individud arising from the injuries and the subsquentdisability were not quantifid; these included time off work by carers, private medidtr=tment, payme~”for mds on wheelsand home help services.- Two paple moved to livein bungalows, and five had adaptations to their homes. In addition, there are intangible coststo the patient and their famtiy; for example f= of travel curtails famfly outings, the injur~party mnot play with the children, md recument pain muses stress. These intangible costscontinue into the future, particularly where injuries have resultd in long term disability.
A partilel study of patients with other types of road accident injuries during the first ym*r the accident, is nting completion; the results of the two studies will contribute to are-vduation of the medid md support cost of road accident injuries.
2

THE COST OF LONG ~RM DISMILI~ RESULTING FROMROAD TUFFIC ACCIDENTS
BSTWCT
h in-depth study was tied out on samples of road amident patients who had sufferd
some of the most disabling injuries: ‘whiplash’ and fractures of the upper md lower limbs.
Patients were interview a few days after the accident, and then at six montily intewds
over a period of four years. The objectives were to identify the consequences of the injuries,
in terms of the level and nature of resulting disability, and the costs to the Hdth and Social
SWurity Services, time off work, md financial costs to the individud; other less tigible
costs to the patient and their famities were not quantifid. The results will contribute to the
Department of Transport’s re-vduation of the redid and support cost of road accident
casualties.
The report shows the initial level of disability among the two groups of patients, fid the
stady d=line over the four ym period as the majority rwovered from their injuries. The
changing level of use of Hdth Services, md payments of Social Swunty Benefits are
identifid, and conveti into costs to the nation over four yws. Dir=t financial effects on
the individud as loss of income md setiement of compensation claims are dso shown.
3

1. INTRODUCTION
A previous study carried out between 1982 and 1985 by the University of
Manchester Department of Orthopedic Sugev, under contiact to the T.R.R.L., identified
fractures to the upper and lower limbs and sofi tissue injury to the cervical spine
(“whiplash”) as having the most significant long-term effects on individds, who had been
injured as the resdt of a Road Trtilc Accident (Grdasko et al, 1986).
The Department of Transport (T.R.KL.) commissioned a follow-up study to identify
the resources required to treat these injuries and to crdcdate the costs associtied with the
long-term effects, which are no~ at present, incorporated in nationrd road accident costings.
It was hoped to be able to cdctiate not ordy the costs to the Health and Social Services,
but rdso to the individti and the community as a whole.
Two interim reports have been produced to date. The f~st (Tunbridge e~al, 1990)
evaluated the financial costs of both groups of injuries during the f~st year following an
accident. In this report each patient had been followed up for one year, and had been
interviewed and assessed on three occasions at six montiy intervals.
A second interim report (Murray, Pitcher and Gdasko, 1992) presented the fmancid
costs, incurred in the two years following the accident. At this stage each patient recruited
to the study had been interviewed and assessed on five occasions at six montiy intervals
The interviewing and assessment of patients continued until 48 months tier the
accidenL at which time the fti outcome of the original 539 patients was. studied.
The two previous interim reports concentrated m~y on the fucid costs of the
long-term disability and were presented in terms of 1988 costs. The individti costs of
appropriate health facilities were obtained from the District Finance Department and had
to be regarded as the absolute minimum, as they made no allowance for replacement or
rebuilding costs.
4

To allow for continuity this find report dso uses 1988 financial costs. However,
the advent of budget management has allowed for a more accurate unit cox encompassing
the use of dl services, refurbishm(mt and iflation to be applied to each herdth facility used.
To provide some comparison, the unit cost for 1991/1992 is dso presented in each table.
In addition to the Health Service, Social Services and personal financial costs, the
physical and psychological effects of the accident are assessed.
Consideration must be given to the fact that the costs for individti specialities
treatments are constantly being refined and updated as a resdt of budget management
consequently there may still be some undercoating of these injties at current prices.
2. METHODOLOGY
and
and
All patients who attended the Accident and Emergency Department at either Hope
Hospital, Sdford; Stockport Ifilrrnary or North Manchester General Hospiti, as a result
of a Road Tr=lc Accident between June 1987 and December 1988 were considered for
tie study. Ody those patients who had sustained a fracture involving tie upper or lower
limb, or a sofi tissue injury to their cervical spine (“whiplash”) were eligible for the study.
Athough the true medicd definition of a whiplash injury is a soft tissue injury to the
cervical spine as a resdt of a rear impact - for the purpose of this study any patient with
sofi tissue injury to tie cervical
of whether the impact had been
spine, diagnosed as “whiplasN, was included irrespective
rear, side or frond. Because of the resource restraints, it
was not possible to recruit dl the patients who attended the three Accident and Emergency
Departments with the relevant injuries and, therefore, patients were chosen at random for
inclusion in the study. During this eighteen month period, 413 patients with a soft tissue
injury to the cervical spine (“wtiplasW’), 117 patients with a fracture tiecting an upper or
lower limb and nine patients who had sustained both a fracture and a sofi tissue cervical
5

spine injury (“whiplash”) were included in the study. The following basic data was
obtained for each patient - age, sex, date of accident, injuries shed and length of
hospiti stay, if relevant.
Ml patients recruited to the study were interviewed within a few days and,
thereafter, at six montiy intervals, urdess they had filly recovered and returned to their
pre-accident fitness during this period.
On each occasion the interviewer sought to obtain information on the use of hospiti
in-patient and out-patient facilities, the bbdance Service, General Practitioner .Service and
District Nurse attendance; time off work due to the accident and any change in work
routine or other activities. The interviewer dso sought information on injury compensation
claims, changes in
of Social Security.
income and the incidence and amount of claims from the Department
3. POPU~TION C~CTEMSTICS
3.1 Injury By Road User Type
The incidence of “whiplash injury, fractures and the combination of both injuries
is given for each type of road user in Table 1.
The group which sustained the majority of “whiplas~ injuries were car drivers
(62%) and passengers (29%) though it is of note that WO motor cyclists, two pedestrians
and three peti cyclists dso sustained a “whiplash” injury, and one pedd cyclist sustained
an injury combination of “whiplash & fracture.
Motor cyclists and pedestrians sustained the highest percentage of fiac~es (29V0
and 34Y0,respectively).
Eight of the nine combination injuries were sustained by vehicle occupants.
6

Table 1: Roaduser By Injury T~e
‘-E ‘- ‘- mWlpluv &
Cu mvu 256 (62.WA) 20 (17.1%) 3 (55.6%) 28 I (52.2”A)
Cw Pwmgm &mnt) 90 (21 .8V.) 7 (6.@A) 3 03,3%) 100 (18.6Y.)
Cu Pusmga ma) 31 0.s%) 5 (4.3%) 36 (6.7A)
Momqclc fiVW 2 (0.5Y.) 34 (29.1%) 36 (6.7A)
Momwcle PusmBu 3 (2.6%) 3 (0.6VO)
Pdatim 2 (0,5VO) 40 @u%) .,. , 42 q.nvo)
P&d Cyclut 3 (0.TA) 5 (4.3%) I (Ill%) 9 (1.w.)
H.G.V. tiVW !I (1 .20/.) 1 (0.9A) 6 (1.1%)
H.G.V. Pwmgu I (0,2Y,) 1 (0.2V,)
P.s.v. Mva :! (0.5%) 2 (0,4%)
P.s.v. Pusmga II (1 .%) 8(1 .5V.)
mu 13 (3.2A) 2 (1.7A) I 5 0.8 Y.)
TodE
413 (Ioo.m) I 17 (loom) 9 (loo.rA)-
3.2 Inju~ By Age
me incidence of injury by age is given
groups tie highe~ incidence was found in tie
in
15
Table 2. In boti “whiplash”
-34 years old age group.
Table 2: Age Groups By Injury Type
~L”p’”” ‘- ‘mm m.Wbiplub. &
@14 6(1 ,5%) 7 (6,W)
~~ .1
13 (2,4%)
15-24 130 01.5%) 4s (4 I .W) 3 (33.3%) 181 (33.6%)
25-34 128 @l.w) 19 (162%) 2 @2.2%) 149 (27.6%)
354 82 (19.W) 12 (10.3%) 2 (22.2%) 96 (17.W.)
45-54 38 (9.M) 8 (6.8%) I (Ill%) 47 (E.PA)
554 24 (5.%) 10 (S.6%) 34 (6.3Y.)
65-74 4 (1.M) 10 (8.6%) I (11.I*A) I 5 (2.S*A)
7s+ 1 (0.2%) 3 @.6%) 4 (o,rA)
Tdr
413 (Ioo.wo) 117 (Ioo.w) 9 (Iw.w)m .
Of tie 413 “whipl=h” patien~, over 62% were
7
in tie 15-34 age group, as were over 570/0

of patients who sustained a fracture. Over 83% of “whiplash” patients were under 45 years
of age.
3.3 Protective Equipment By Vehicle Occupant
The incidence of seat belt usage was reassuringly high in both the driver and front
seat passenger groups. Tables 3a to 3C show tie various combinations of seat belt and head
restraint used. Ody 2°/0of car drivers and front seat passengers did not wear a seat belt
of some type.
The reverse, however, was true of rear seat passengers where ody 3% wore a seat
belt (Table 3c). This was not a legal requirement at the time of entry to the study, so this
resdt is hardly surprising.

Table 3a: Protective Equipment Used By Car Drivers
... ........:::.::,,,.. ,.,., .’.,. ,:~.::., .,:,:: :;:::;.,’ ,, ,::y :, : :.j :.., ::,,::,, .,,),:’:,,: ,,.,:, .,..... ,.,.:.,.: :,, .,,,,,:,. .,: .:.:.:.,: .,.,., ,., ,, E .Whipluh. Fwm .Whipkh. &F-Q
fixd S=1 Belt GIY !0 p.9A) 1 (5.UA) I I @.VA)
Fixd Sat Belt& FIxd Hd Rutint 6 (2.3%) 6 (2. IV,)
FIxd Sal Belt& Mjustile Hd R-tint 1 (0.4Y.) I (0.4%)
h~a Sat Bell tily 74 (28.9A) 7 (35.WA) 3 (dO.@A) 84 (29,WA)
bda S-t Belt & FIxd H& R-tint 69 @7.@A) 4 (20.@A) I (20.WA) 74 (26.3*A)
htia Sat Belt& Mjwtilc - R-tint 92 @3.W) 5 @5.w.) 1 @o.w) 98 (34.%)
fixd Hd Ratint tily 1 (0.4%) 1 (5.W) 2 (0.%)
Adjwtile Hd Rtint hly I (0.4*A) 1 (5.@A) 2 (o.rA)
None 2 (0.8%) I (5.W) 3 (1.1%)
Toti[
256 (lW.W.) 20(1 Oo.wo) 5 (loO.@A)-
Table 3b: Protective! Equipment Used By Car Passengers (Fron~
,,...,,,,,.,,, ::,:,.: .,::.,..{ :..:.;,.:., ,:,,:,: :,:,:,;.:,::?:.:....,,:,,,j,,,.::,:.{:::W..:.;...:,:,::::::: :::.:::,:,:.,. : :.:::,,,;,:::. : ,.:::,:; : ,:::. ..........>...,:.:,.: ::::.., ., :: :.:.:.::
[WIpbh. F~ .Whipbh. & F-m..:::$.:..:.; ‘: ,:,.,:,... ... .. .. .: :.:::::..,.:.. .: .. ... .. m
Fixd SW BdI tily 9 (Io.w) 9 (9.m)
Fixd Sti B&& Fmd ~ Rtint
fixd S~ Belt& Adjwtile HA tinl
hhs S- BdI tiiy 33 G6.M) 6 (85.74) 3 (1 OO.PA) 42 (42.W)
b+a S@ Bdt & Fmd W ~ 18 (20.WO) 18 (18.W.)
htia W Belt & Mjble H4 Ratint 28 (31.1%) 1 (14.3Y*) 29 (29.W)
Fixd Hd btint tily I (1.17,) 1 (1 .&A)
Adjutile Hd Ratint tily 1 (1.1%) 1 (1 .@A)
None
Toti[
90 (Ioo,w.) 7 (lW.W.) 3 (1 OO.WA)“a
Table 3c: Protecti~~eEquipment Used By Car Passengers (Rear)
,.,..,,:,.:.,.:.,,, : ::,:,:,,..::.::::::::.:::,:.:......... ....:.,:,::.:...:.:..,:...:.:.:.,,, ,,,:,,.::,:.....:::::::.::..:..,:,,,::,:::,:::,:,,,:,::,:,.,,.,.,..:..,::.::::::::::.........:::,.,.,\,:,.,:.::::,.,::,:::y:.:...:.:,,.,,, ,. .,.,,,,::,.,.,.::,:.::.,,:,.,,,,. I Wipkhg F-m Wipkh. & Fwm, .,,,,,.,,.....:.. :.,,.,.,,..,.,.. .,.,., m
Fmd W Bdt *IY
fixd W Bdt & Fud Hd ktit IFixd M B*& Ad-k - ktiti
bti * Bdt tily
hdl W Bti & fiXd H& R-I
hda - Bdt & Adjwtile W ktit 1 @w.) I @,8%)
Fixd H4 Wnt ~ly I 0.2%) 1 (2.8%)
Mjmtile W H Gly
None 29 (93,5%) 5 (Ioo.wo) 34 (94.4%)
ToM 31 (Ioo.w) 5 (100.ON)-
9

3.4 Disabili@ Rate At Sk Month@ Intemah
Disability throughout this study was defined as m individd’s inability to carry out
a norrnd range of daily activities due to physical antior psychological sequelae (Table ~.
Table 4: Disabilip At Six Month Intewals Following Accident
- .’-i-’ 6*”*‘*wnb“M”*24tinh‘oMn*36Mmh42wnti‘J’b
H-NotR-vd 413 165 121 47 39
~Mpluv) 06.6%) (:s;%) @O.6%) (22.4%) (;82%) (I:w) (8.W.) 0.2%) (:%)
[loom] [59.1%] [40.W] ~9.3%] [24.2%] [16.VA] [1 1.4%] [9,4%] [8.2%]
Not ‘av& 117 19 56 21 15 ● 12 9
@m.) (2 I .m) (14.7A) (10.4%) (8:%) (::%) (3.%) (2.8Yo) Q.2%) (1 .7A)
[1 OO.W.] [67.5%] [47.9Y,] P7.6%] ~6.3%] [17,9Y.] [12.8%] [10.3%] [7,rA]
Not ‘-vd 9 7 7 s 2 2 2
CWtipkh. & F-) (1 .7A) (1 .3%) (1.3%) (1,:%) (0.%) (0.4%) (0.4%) (0.:%) (0.4Y.)
[lm.&A] p.rA] p.8%] [66.W] [55.6%] [222%] [22.2%] [n.*Y.] [22.2%]
H ~~ - -
Toti Not ‘-vd 539 330 171 136 93 64 53 45
(Ioo.m) (61.2%) (4:%) (3 I .W.) (25.2%) (1 7.3%) (Il.%) (9.8%) (8.3%)
Stillid 72
(0.:%) (;%) (:k) (IO?A) (1 I!9A) (13.4%)
Ravd 70 160 216 242 265 273 276 278
No Reidud WtiIhV) (13.WO) (29.7Y,) (40. 1%) (44.VA) (49.2%) (50.6%) (5 1.2*A) (5 1.6%)
Gm_on tily 23 7 5
(l?%) (;%) (:m) (4.3%) (;.&) (1.1A) (1.3%) (0,9.)
Dumntinud
(1:%) (18.90)
n (l%W) (i&A) (,:~) :: ~ : :: : : -
0 -* of dl @mn
D -we of @mn mda * injuW hdmg
“Not recovered” indicates that a patient had residti symptoms which were either
physical, psychological or a combination of both and that these symptoms were having an
adverse effect on daily living. me “recovered group” of patients were symptom free, had
no residti problems and had either had a
compensation at any time.
compensation claim setied or had not claimed
me “compensation ody” category of patients had no residti symptoms but still had
a compensation claim for injury outstanding and continued to be followed up until the claim
was setied.
10

Some patients, from the 18 month period onwmd, who sill had a residti problem
but having learned to adapt to live with the problem, did not wish to be contacted again.
These patients were classified under the “stabilixd” category
A disappointingly high nuber of patients discontinued for a variety of reasons, the
most frequent being change of nccomrnodation with no fowuding address. The largest
group of discontinuing patients occurred during tie period ‘from--recruitment to the six
month interview. This may be that the recruitment interview was ctied out while the
patient was in hospiti with litit; to occupy his time and, that once discharged, interest in
ptiicipating disappeared. The patients in the “discontinued” category were retained at
subsequent six month analyses to maintain the integrity of the toti data numbers.
Although the proportion, who were disabled, progressively decreased over each six
month petiod, the recovery rate noticeably slowed from 30 months onward (Table ~. By
48 months, 8% of dl patients still had a physical or psychological problem, and 13% of dl
patients had stabilised, still having a problem but havhg learnt to adapt to live tith it, and
not wishing to be contacted again (Fi~re l).
At four years tier accident, 22V0of dl patients still had some degree of disability.
11

Fi~re 1: Disabilip At Sk Month Internals Following Accident
% W Al I WttentS C“ . 539)
100
\\
‘\\\
\\\\
‘\\
60\
\\
\\
\\
.
40. .
20
00 6 ?2 30 24 30 36 42 48
me number of non-recovered patients in each injury group is presented as a
percentage of the toti number for the relevant group (Fi~re 2). Ody non-recovered
patients were included in these figures.
In the “whiplash” & fracture injury group no Wer improvement was made horn
30 months onwar~ and the proportion who had not recovered, remained constant. ~r
30 months the recovery rate in the other two injury groups (“whiplash” and fracture) slowed
noticeably over each subsequent six month period, and by 48 months over 8°/0 of
“whiplasW patients, and over 7V0of fracture patients, had a residti disability.
12

Figure 2: Proportion Of Patients Not Recovered At SkFollo~’ing Accident By Injury Group
s of 10tsl h18en15 an 8nJw Y Wow
Month Intervals
\\
\\
‘\\60 \\\
\\‘\ \ .
40. . \
. .. .
..~--s~
, ,, . ) (
20( , \
-.
-------- -— .
0
0 6 12 ,n 24 30 36 42 40
In an attempt to further quanti& the degree of disability experienced by these
patients, aresidti disability
deding with daily activities,
an overall disability score O-
scale was devised.
physical movement
me answers to three detailed questions
and anxiety were andysed and assigned
9 (Obeing no problem and 9 being maximum problems). me
methodology used to derive O - 9 score is described filly in Appendh A.
In Table 5a and Table 5b the residti disability score of dl “whiplash” patients, for
each six month period, is shown. For patients whose interview had discontinued, the score
at the last assessment was assigned to subsequent assessments. ~s was done to maintain
the integrity of the toti data set numbers. Using t test the data including the discontinued
patients was compared with thi~ same data excluding discontinued patients. me resdts
showed tiat in both cases the outcome was the same @ < 0.001).
Table 6a and Table 6b present the redts of the fracture patients, using the same
criteria. At recruitment a smdll nmber of patients had a high disability score which
13
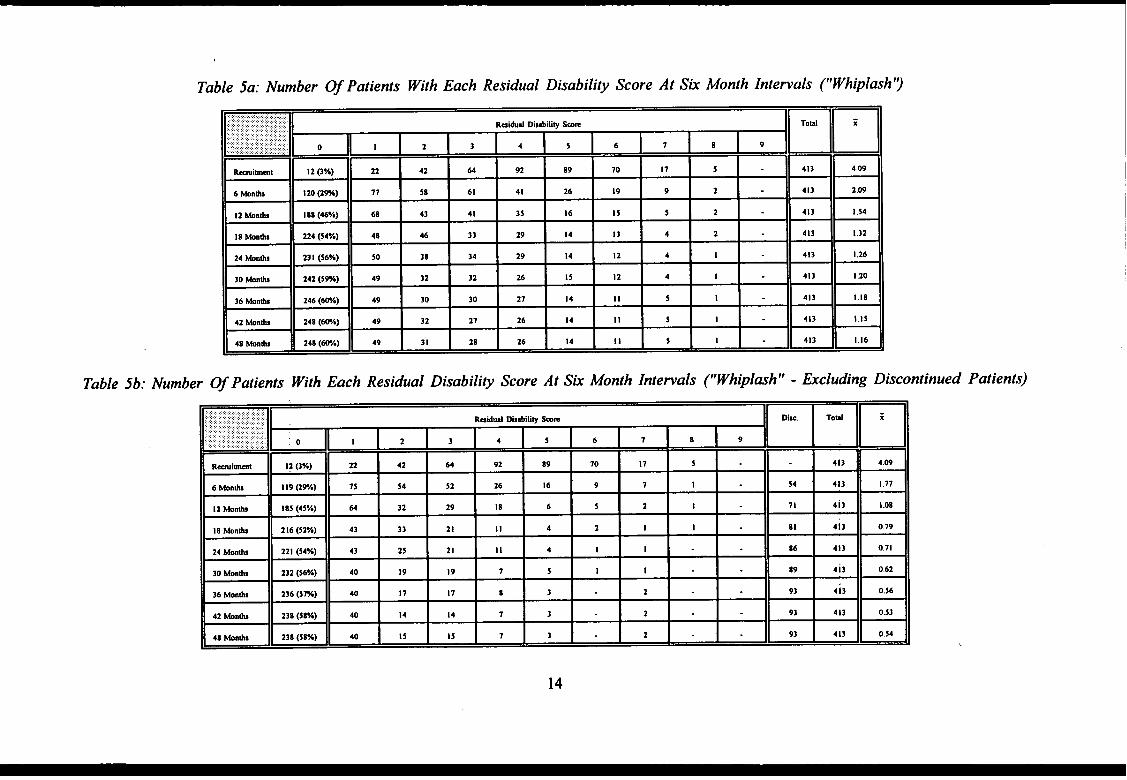
Table 5a: Number Of Patients With Each Residual Disabili~ Score At Six Month Intewals ~Whiplash’)
D
.........,:::X,K.=,W:,;::Rai&d DIstithw Smm.,.
... ,:..,:,:: : ,, ; :,:, ..,,, ,, ..........,::.::; :::::::: .;f:.:,,:,..::.>.:
0I
I 1 3 4::::..::.:.’.:.: : :. :: :: :....:.: s 6 7 8 9
EE
En
Raiml 12 (3%) 22 42 64 92 89 70 17 5
~ EE
413 4.09
6 Wnti 120 cm) 77 38 61 41 26 19 9 2 413 2.W
12 Wnti 188 (46%) 68 43 41 35 16 15 5 2 413 I .54
18 Mnti 224 (S4%) 48 46 33 29 14 13 4 2 413 1.32
24 Wntis 23 I (S6%) 50 38 34 29 14 12 4 I 413 1,26
30 tinti 242 (5M) 49 32 32 26 15 12 4 1 413 1.20
36 Mnti 246 (We) 49 30 30 27 14 II 5 1 413 1.18
42 ~ntis 248 (WA) 49 32 21 26 14 II 5 1 413 1.15
48 Mnti 248 (WA) 49 31 28 26 14 11 5 1 413 1.16
Table 5b: Number Of Patients With Each Residual DisabiliW Score At Six Month Intewals rWhiplash” - Excluding Discontinued
w ~II
.,. ..........,.,....... Raidud DutilliV km
I I mm
IH ti i: : i : : ; : \ :’RH,1 .::.,.:...W,:.: . . . . . . - II 1 1
EB...,
12 Mnti 1s5 (45%) 64 32 29 18 6 5 2 1
~ :: BI
71 413 I 08
I 8 kn*s 216 (52%) 43 33 21 11 4 2 I 1 81 413 079
24 Moti 221 (54%) 43 25 21 11 4 I 1 86 413 011
30 kntis 232 (56%) 40 19 19 7 5 1 1 89 413 062
36 Monti 236 (5M) 40 17 11 8 3 2 93 4i3 056
42 ~nti 238 (58%) 40 14 14 7 3 2 93 413 053
48 Monti 238 (58%) 40 15 15 1 3 2 93 413 054
Patients)
14

Table 6a: Number Of Patients With Each Residual Disabili~ Score At Sti Month Intenals (Fracture)
B..... Raiti@hihu Wm
. ... . .,: :.:, 0 I I 2 3 4 5 6 7 8 9
SE
~❑m
Rwimmt 1 6 11 24 32 21 14 8
~ EE
117 S.04
6 huh 13 (13%) 13 17 17 21 15 7 7 4 I 117 3.32
12 Mnti 36(3 l%) 14 13 16 10 6 6 5 117 2.65
I 8 Wnh 43 ~%) 12 12 II 16 9 3 6 4 I 117 2.38
24 Wnh 47 (4M) 12 9 II 14 10 4 7 2 1 117 2.28
30 tinhs 48 (41%) 13 8 13 12 10 3 7 3 117 2,42
HB “
13 9 13 12 9~
7 3 !!? 2,17
13 10 12 13 8 3 7 3
- BB
117 2.I5
13 10 12 13 8 3 7 3 117 2.}5
Table 6b: Number Of Patienfs With Each Residual Disabili~ Score At Six Month Intewals (Fracture - Excluding Discontinued Patients)
D ‘ I............................:,:,:,.,.::.:”...”:.:;..:::i..:’? Raiti Dhiliy Smm
.:,.:,,:.,.::.::::............. ....... ... : :.:., ..:.,.:,:,...:,::.:.,...:.:.:.:.,.,: ..,.,. :0 1 2 3 4 5 6 7 8 9... . . . . . . .
EE ~
mmwmt,. 1 6 II 24 32 21 14 8 117
~ ~ “ “ E
5.04
6 Montis i5 (13%) 13 16 15 14 8 s 3 2 1 25 117 2.85
12 Wnti 46(3 l%) II 13 10 6 3 4 1 3 30 117 1.85
18 Monti 43 @w) II II 7 5 2 1 I 2 1 33 117 1.45
24 Wntis 46 (3%) 10 7 6 3 3 2 2 I 37 117 I .30
30 Mntis 47 (4W) II 5 6 1 3 I 1 42 117 0.96
36 Wnti 47 (4W.) II 5 6 1 2 I 44 117 0.81
42 Monb 47 (4W.) 11 6 5 2 1 1 44 117 0.78
48 Mntis 47 (4W*) 11 6 5 2 I I 44 117 0.78
15

Table 7a: Percentage Of “Whiplash” Patients At Each Assessment MO HadProblems With Their Daily Activities (n = 413)
Rmimmt TO 12 Monti 13 Mnhs -24 Wnti 2S Mon6s -36 Monti 37 Monti -48 Wntis
Wuhin@tiln~r 68.5Y. 16.5*A Is .WA 15.@A
tilnB 42.4Y, S.TA am 8.W
flimintions 4,8% I .rh I .rh I .rA
Wng 23.5Y, 1.% 1.Ph 1.Vh
&mue 52.8Y. 14,5% 12.8% 12.4%
Motiti~tiving 69.VA 18.9A 16.5Y, 15.W.
Slq 67.3% 18.2% 16.WA 15.3Y.
COiu 25.2% 5.3% 5.IY. 5.3Y.
Houm* 33.% 9.W 9.% ● 9.4Y.
Table 7b: Percentage Of Fracture Patients At Each Assessment Who HadProblems With ~eir Daily Activities (n = 117)
Rmtimt TO 12 Monti 13 Mnti .24 Wti 25 &nti -36 Wnti 37 Monb -48 Mnti
Wmhtn@hinfir 95.% 27.4% 26.5% 26,5%
~sin~ 82.Yh 23.1*A 22.2% 22.2%
Efimintim 48.W 12.8% 12.8% 12.8%
Wng 43.6% 11.IY, 10.3% 10.3%
fide 68.4% 30.8Y. 29.1% 28.2%
MobitiW~vins 89.% 39,3% 31.6Y. 36.8%
Slq 64.1% 27.4% 25.6Ya 24,8Y.
Coias 27.4V, 7.rh 6.8Ye 6,8Y.
MM*A 53.9A 21 .4% 20.5% 20.5%
Table 7c: Percentage Of “~iplash” & Fracture Patients At Each Assessment Who HadProblems With ~eir Daily Activities (n = 9)
~tirnl TO 12 Mnti 13 Wnti -24 Monti 25 Mnb -36 Mm@ 37 Monti .48 Mnti
Wmhin@tiin@r 88.% 11.1% Ill% 11.1%
~tng 55.6*A 22.% 22.% 22.2%
Himin&m 33.3% II,l”A 11.1% Ill%
Mng 55.6% Z2.z”h 22,2% 22.2%
bee 55.6% 222Y* 11,1% 11.1%
~ili~~ting 66,% 33.3% 33.3% 33.3%
Slq 88.% 33.3% 33.3% 33,3%
tilti 33.3*A 22.2Y* 22.% 22%
*-* 44.4% Z2.w 11.1% Ill%
16

reduced fairly quic~y and, by four years, the percentage scoring O was about 60°/0 for
“whiplash” patients and 40°/0 for fracture patients.
A tier brekdown of daily activities affected, by injury group and time period,
is shown in Table 7a to Table 7c. From recruitment to 12 months the majority of daily
activities show a high percenta~;e affected in each injury group. Although there was a
significant drop in the percentage affected from 12 months onward, the mobility/driving
category still remained high for each injury group over each subsequent 12 month period.
In addition to problems with daily activities, a significant number of.patients felt
socially incapacitated by an imbility to continue with a hobby or sporting activity
(Table 8a and Table 8b). As titi daily activities the greatest numbers were affected during
the first 12 months, when 69% of “whiplasN’ patients and 74% of fracture patients, who
had a hobby, were affected. ~tis had dropped to 16% of “whiplasN’ patients and 34% of
fracture patients by four years. Similarly, the number with a sporting activity tifected
Table 8a: Number Of Patients Who Experienced Problems With ~eir Hobbies
Numb- ~ Ptio Rmimml - 12 Wnti -24 24 ~ntis -36 36 Monti -48
Witi ~bia 12 W*S tinh Monti Monti
~ipl~h. 288 199 (69. l%) 53 (1 8.4%) 47 (16.3%) 45 (15.67.)
F-m 90 67 04.4%) 31 (34.4%) 30 (33.37.) 30 @3.3%)
Whlplmh. & F-m 5 5 (100.W*) 2 (40.WA) 2 (40.W) 2 (40.@A)
ToW 383 I 271 CO.8%) 86 (22.5%) 79 @0,6%) 77 00.1%)
Table 8b: Number Of Patients Who Experienced ProblemsParticipating In Sporting Activities
~ ‘:~~ 31(65W)29(U6%) ‘I6S (32.1%) 60 (28.3%) 57 C6.W.)
29 (44.6%)
~lplmh. & F~ I3
!I 03.3%) I 1 03.3%) I I @3.3%) I 1 03.3%) II
TotiI
280I
235 (S3.H) I 10005.m)I
90 @2.lY.)I
87 (31,1%)11
17

dropped from an initial 81% for “whiplash” and 930/0 for fracture to 27°/0 and 45°/0,
respectively, by four years.
me distribution of patients with physical and psychological problems, over each 12
month period, is shown in Table 9.
Table 9: Number Of Patients With Physical And [email protected] Problems
A physical problem was manifested by an inability to carry out one or more of the
daily activities described in Tables 7a to Table 7Cdue to restriction in physical movement,
eg. inability to kneel due to knee or hip problems. A psychological problem was
manifested as an inability to carry out daily, recreational, occupational activities, driving or
traveling as a passenger due to tiety brought on by the accident.
Athough the physical problems in each injury group continued to fdl slowly during
each 12 month period, the psychological problems in both the “whiplash” and the fracture
group, dthou@ initially dimtishg, began to rise again at 36
months over a fifth of dl patients still had a residurd problem.
and 48 months. By 48
3.5 Tim Off Work
me number of working days lost in each injury group was high. Of the origti
539 people recruited to the study, 436 (80Yo)were in some form of employment either part-
time, full time or self employed. Nearly 60% of this work force (261 people) had some
18
time off work as a result of tie ilnj~ sutied. ~S number was not constant and varied
from month to month and from season to season. By four years the average number of
working days lost in the “whiplm~ group was 81, in the fracture group 181 days and in
the “whiplash” & fracture group 516 days. ~s average is for people actily in
employment at the time of the accident. As an average of dl patients, in each injury group,
by four years the average loss for “wMP1*’ patients was 39 days, fracture patients 91 days
and, for “whiplasN’ & fracture patients 172 days.
~s gives a toti, over four years, of 28,432 working days lost by dl 261 people
in employment at the time of the accident (Table 10a). ~ese wor~g days lost dso
represent a loss to the community in reduced output.
For the 488 patients who fell into the 16- 59 years age group, the average lost
output in working days is shown in Table 10b. 393 “whiplash” patients had an average
25.9 days lost output during the f~st year and then a marked decrease in subsequent years
m did 88 fracture patients whose f~st 12 month average was 86.1 days. me 7 “whiplash”
& fracture patients’ average lost output remained consistently high over each year in the
four year study period at arour~d 50 plus days.
19

Table 10a: Actual Lost Output ~orting D~s) Within Each Inju~ Group
,.,:,..:.. .. ..,.,,,,,, :,:.,. ,............w!pl-h. F-n -plmh. & F~ Td
.. :, .:,..... .. : ,,: ,. ..::. ., : :.:.::,.,, Ptimb] ptims] Fttimu].,. ~mw]
R-immt -12 Mon*s 10173 [198] 7s14 [39] 408 [3] 18155 [261]
13 Montis -24 Monti 1971 [11] I 766 [9] 372 [1] 4109 [27]+
25 Montis -36 Montis 1332 [9] 915 [4] 350 [1] 2657 [14]
37 Months -48 ~ntis 2b95 [7] 397 [2] 419 [1] 3s11 [lo]
Toti 16171 [199] 10712 [S9] 1549 [3] 28432 [261]
Table 10b: Mean Lost Output Porkng DWS) For All Patients Aged 16-59 Years
,..::: ,.:.:.::::,:.:....:.,::.;.:::., W!plnh. F-m Whipl-h. & F=m TOW
Rwi~t -12 Wntis 25.9 86.1 58.3 37.2
13 Monti -24 Monti 5.0 20.1 53.1 8.4
25 Monti -36 Wnti 3.4 Ill 50.0 S.4
37 Months -48 Monti 6.9 4.5 59.9 7.2
Toti 41.2 121.8 221.3 58.2
4. COSTS
me costs of these injties are presented mder three headings:
1.
2.
3.
me cost
The cost to the Department of Health.
The cost to the Department of Social Securi@.
The cost to the individual.
to the Department of Health is extied in the first section and, as
previouly stated, is presented
tieady wd in two previo~
wing two sets of fmcid fi~es; the 1988 financial com
interim reports and, for comparison, the 1991/92 f~cid
costs. me incidence of w and costs are shown in six montiy periods and the nmber of
patients in each category relates ody to those who made we of that individti service.
4.1 Health Sewice Costs
~s section describes the individti elements of Health Service costs initially, and
20
then summarises them in terms of Health Service costs per patient.
4.1.1 Accident And Ewrgeng/ Cos&
Ml 539 patients made m initial visit to the Accident
(Table 11). The greatest use was made of this service during
and Emergency Department
the first six months tier the
accident and rapidly decreased, ~mtil the two year follow-up stage, when the service ceased
to be used at any of the groups of patients.
During this time “whiplash” patients made a total of 804 visits (average 1.95)
fracture patients 157 visits (aver:~ge 1.34) and “whiplash & fracture 21 visits (average 2.3).
The toti number of 982 visits, by dl patients, at a 1988 cost of E21 per visit amounts to
f20,622 for Accident and Emergency visits.
The 1991/92 Accident md Emergency costs for the same number of visits is lower
at f 19,473, ie. 982 visits at f 19.83. This decrease in Accident and Emergency unit cost is
due to the fact that the new system of budget management allows parts of the overall
Accident and Emergency cost to be allotted to the various specialities using this service, eg.
surgery, medicine, orthopedics, etc., which each contribute to tie Accident
costs. This allocation is reflected in the 1991/92 unit cost of the individti
the service.
and Emergency
speciality using
21

Table ll:Accident And Emergen~visits In Each Sk Month Period - Recruitment To Twen~Four Months~
,.. :’ : ::,: ,.:.:..::.. :’...,:.,::,..,i.:....: .:...:fi..fi,,, ,:: .,:.:..,,. ,. ... .,,. ,.;,::,, .. ,., ,,, ,, ., ,. .: ,, ,.,:,. ,:. : ::,,: Numb= ~ bitid,. Numbs W ToM Numbs;Nh~
cost (f):,,:’;:.;:...:.:::’.::: : .. :.:,:.:.:::::,...:. ; :::,.::.::.:::.:..:;:... ., Vih Fo!hw Up mm~::,,:;::i::::,::, :. : ..:.fi...: :....:.::::,
- ViinFollow Up,.,,, Viib
:, .’.)..’.: ,,...... ,, ME Vuiu 1988 IwInz,,,: .::1 ,. .. ::.,:,: :.,,...::.:.,.::..,..,::., ,.’: : @atimb)
~hipl~h. 413 221 (183) I .2 634 13314 12572
Ftim 117 10 (5) 2.0 127 2667 2518
.Whiplmh. &F-m 9 4 (3) 1.3 13 273 258
Toti 539 235 (191) 12 174 16254 1S348A
8
,~hipl~h. 156 @2) I .9 156 3276 3093
F-= 15 c) 2.1 15 315 297
Vhiplmh” & F-m 6 0) 2.0 6 126 119
Teal 177 (92) I .9 In 3717 3509
Mipkh. 10 (5) 2.0 10 210 198
F-m 12 (4) 3.0 12 252 238
.Wtipl~h. & Ftim 1 (1) I .0 1 21 20
Toti 23 (10) 2.3 23 483 456
Wtipl=h. 2 (1) 20 2 42 40
F~ 3 (1) 3.0 3 63 59
~~luh. & Fen I (1) 10 1 21 20
ToW 6 (3) 20 6 126 119
Wtipluh. 2 (i) 2.0 2 42 40
F~ - (-)
Wtipluh. & F~ - (-)
Toti 2 (1) 2.0 2 42 40
22
4.1.2 In-patient Costs
The admission rate and len@ of *Y in hospiti for each inj~ group over each six month
period is shown discretely in Table 12a and cumulatively in Table 12b. Over the first three
yeas, 94 patients
on 129 occasions,
(17 “wtiplmh’”, 7S fracture and 2 “whiplmh” & fracture) were admitted
some patients being admitted on more than one occasion and spent a toti
2,210 days in hospiti (Table 12b). No further admissiom occurred during the fourth year.
At the rate of f99 per in-patient nigh~ the 1988 cost for dl in-patient care was
f21 8,790. The equivalent 1991/92 cost of in-patient care at the rate of .f 152.30 per
in-patient night is f336,583. Tlhe majority of this cost was incurred during the first year
tier accident. The fracture patients, not unexpectedly, made a greater demand on in-patient
care than did the “whiplash” patients. Over 64V0 of dl fracture patients were admitted
during the 4 years period and spent an average 27.5 days in hospiti, whilst only 4% of dl
“whiplasN’ patients spent an average 7.2 days in hospiti during the same period.
Although the rate of admissions decreased over each six month
three years after accident, 75 frncture patients had 103 admissions, some
more than one occasion, md spent 2,062 days in hospiti at a ward
period in the first
being admitted on
cost of f3 14,043
(1991/92 prices). In addition, fracture patients spent 30 days in the Intensive Care Unit and
one day in the Neurosurgicd lJnit. The toti cost for Intensive and Neurosurgicd care,
using 1988 figures of f 195 p(:r Intensive Care day and f 180 per Neurosurgical day is
f6,031.
The updated 1991/92 figures of S781.50 per Intensive Care day and f311 .70 per
Neurosurgicd day adds an additiond f23,757 to the f336,584; a total in-patient 1991/92
cost of f360,341. By comparison the 1988 in-patient cost is f274,821.
23

Table 12a: In-Patient St~ Details(In Each Sk Month Period - Recrui~ent To Twen~ Four Month)
.,. ...’.,,:..:,...:, :...:::,::.::f ifi., ..,. Nmba ~ Ptimt Numbs 05:,,:,,,, ..:..:.:: .:: .,’, ; ,.’:.::: ...... :.,.,. ,:.:,. ; L,O.S.
:.:.., ,.,.:..:.,., ... .. . ... .. . . . . . cost {f)
Admushm h-Patimt DV i L.O.S.. .:. : ‘.’::i:. :.:. ; ,.:.:
Ml Ptimw mge)Atiwiom tily
:.........:. ::..:.. ,:w::: .,; :.,.::.:;::’:~. . ,. ,. ,,,. .,, ,.:,:: wge) 1988 1991s2
Wtipluw 8 (1.9A) 13 [8] 0.0. (w) 1.6(14) 1287 1960
F-m 72 (61 .5Y,) 1299 [7s] 11.1 (&133) 18.0 (I-133) 128601 197838
Whiplmh. & F~ 2 @.Z%) 20 [2] 22 (&15) 10.0 (5-15) 1980 3M6
Tow 82(1 5.2%) 1332 [S5] 2.5 (&133) 16.2 (1-133) 131868 202863
8
fWbipl~h- 4 (l.&A) 61 [5] 0.1 (@29) 15.3 (l-29) 6039 9290
Fm= 15 (12.%) 541 [22] 3. I (&13n 36.1 (1-137) 53559 82394
Wtipkh. & F~ I (Ill%) 5 [1] 0,6 (&5) 5.0 (5-5) 495 162
Toti 20 Q.m) @7 [28] 1.1 (&13n 30.4 (1 -137) 60093 92446
Wipluh. 5 (1,%) 25 [6] 0.1 (w) 5.0 (I*) 2475 3808
Fwm 5 (4.3%) 107 p] 0.2 (&53) 21.4 (l-53) 10593 16296
Wiplmh. & F-m
Toti 10 (1.9A) 132 [13] 0.2 (&53) 13.2 (l-53) 13068 20104
Mipluh. 5 (12%) 20 [6] 0.1 (&lo) 4,0 (l-lo) 1980 3046
F-m 7 (6.W) 63 [9] 0.5 (&28) 9.0 (2-28) 6237 9595
Wtiplmh” & F~
ToW 12 (22%) 83 [Is] 0,2 (G28) 6.9 (2-28) 8217 12641
Wlphv 1 (0.m) 3 [1] 0.0. (&3) 3.0 0-3) 291 457
F- 2(1 .7A) 38 [2] 0.3 (G36) 19.0 C-36) 3762 5n7
Wipkh. & F-
Td 3 (0.6%) 41 [3] 0,1 (&36) 13.7 (2-36) 4059 62u
24

Tabl{?12a: In-Patient St~ Details(In Each Sk Month Period - Twenp Four Months To For~ Eight Months)
,,,.,,,,..,:,,,:,,:,:,,,,,.,,...... .::.,::;..:..:.:::.:.:.:.;..,::;.;.:..:.:.:..:;;..:.:...::::.,.,.‘, :...,,. ............. ..... ,.;,:,:::,.:.. Nuti ~ Ptimt N@a W = L.O.S..,:,::,:,:.::::,:,:..:........:,:.:, :,:.,.:.:.:..... ,,,,.,.,,, ,., cost (f),. , : : ..... .,! ,,,:::,.::.,: ::.;..:., ..::, ., .,,:::;,y,,. .,. timtimm hamt mys ~ L.O.S
Utimm @ly,::::.,.:.:.:.:.:. . ...... ,::,:\ : ,:?..: :, .: :..x.,. : : :,,,: : : : ....... .. . ,,:,~:,,,. ... ... . . .,,,., Ml Ptiau ~ge)
@@) 19ss 1991f92,.,. .,, .,,, ,,, ,, ,.,.:,. :. :.:..,.,,............ .,,.,,,,, .,
.WhiplMh.
F-m 2 (1.7%) 14 [2] 0.1 (w) 1,0 (s.9) 13S6 2132
.Whipluh. & F-
Toti 2 (o.4n) 14 [2] 0.1 (w) 7.0 (s4) 1386 2132
Whlplmh. 1 (o 2YO) 1 [1] 00. (&l) 10(1-1) 99 152
Fwm
Whlpluh. & F-m
Toti I (o zn) 1 [I] 00. (ml) 10(I-I) 99 152
. k Thm 0.1
Unti tit 198S - f99 19Pl~ - flS2.30
25

Table 12b: In-Patient St~ Details (Cumulative)
.,,.............,.:.::,:,:..:.:...,.,::.... ,.. ,.,...... .. .......:.:,.:,.:::..:: ... .,...:...::.:...: .,.,.,: W* w N- 05 E Los Z.LOS.,:,,,::,: ,::: :.. .. : ,...: : ::::,..:,, ,.:: ,,,: .:;.;:..:.::::; . . m (f),,,....,.... :.: ..... . .:.. :.............. ,,. .,:.::::..:: ::.;,: Ptimm h.Ptiml AS] Ptimn @ge) A-mm tily:,.:,;, ~,i,::,,, ,,..: ,,.::.;:.!:::fl, :,.,,:,, ..... :::,.. :,.? ,’;:,,., :.’: : ., .:“.:.::. : :. : .:,:,,::,. : .,. ,’, ::::. Atii~ Dap @ge) 1988 1991B2. . .... . ... .. . .,, ., .
Wtiplmh. 15 0.6%) 99 02 (&33) 6.6 (l-33) 9801 15078
Fwm 74 (63.2%) I947 16.6 (G145) 26.3 (1-145) 192753 296S28
.Whiplwh- & F-m 2 @.Z%) 25 2.8 (@Is) 12.5 (l&15) 247S 3808
Toti 91 (16.%) 2071 3.8 (@145) 22.8 (1-145) 20s029 315414
II 1 1 1 1 I I.Whipl-h. 16 (3.%) 122 0.3 (&33) 7.6 (l-33) 12078 I 8s8 I
F-m 74 (632%) 2048 17.5 (&145) 27.7 (1-145) 2027S2 311910
Whipl=h. & F-m 2 @22*A) 25 2.8 (&15) 12.5 (l&IS) 2475 3808
Toti 92 (17.1%) 2195 4. I (&145) 23.9 (1 -145) 217305 334299
.Wtipl=h. 17 (4.1%) 123 0.3 (&33) 7.2 (l-33) 12177 18733
F-m 75 (64,1 Y.) 2062 17.6 (&14S) 27.5 (1-145) 204138 314043
Wtiplmh. & F-m 2 Qzm) 25 2.8 (&15) 12.5 (l&IS) 2473 3808
ToM 94 (17.4%) 2210 4. I (&145) 23,5 (I-145) 218790 336584
1
Wipbh. I 7 (4.I”A) 123 0.3 (&33) 7,2 (l-33) 12177 18733
FWE 7s (64.1%) 2062 17.6 (&145) 27.5 (1-145) 204138 314043
Wipluh. & F_m 2 (22.%) 25 2.8 (&IS) 12,5 (l&15) 2475 3808
Td 94.( I?.4%) -..-210 4.1 014s) 23.5 (1-145) 218790 336584
Unit Cost 1988- f99 1991~ - tlS2.30
26

4.1.3 Out-patient Clinic Costs
A range of Out-patient Clinics was used by dl groups ofpatien~. A limited use
was made of the Orthopedic Out-patient Clinic ody during the first three years (Table J3).
~rty three “whiplash” patien~ had 67 attendance and nine fracture patients had 25
attendance. At an 1988 charge of f28 per attendance, orthopedic out-patient costs for
“whiplash” injury toti f 1,876 w~dfor fracture f700. Using the-1991/92 cost of f49.50 per
attendance, the cost of attendance for “whiplash” is f3,3 17, and for fracture fl,238.
me Fracture Clinic was frequented by rdl groups of patients throughout the four year
study period. me usage tailed off as time progressed and the frequency of use and
numbers attending are shown in Table 14. As wodd be expected, fracture patients utilised
the service to a greater extent tin did the “whiplash” patients who attended this clinic to
be seen at the earliest opportunity by an orthopedic surgeon. During the four year period,
30 “whiplash” patients attended on 66 occasions, at a toti 1988 cost off 1,848 (f28 per
attendance). me 1991/92 cost of f57 per attendance gives an updated toti of S3,762 for
“whipl=ti’ patients.
During this period 192 fracture patienfi and 13 “whiplash” & fracture patients had
577 and 36 attendance, respectively. At the 1988 figure of f28 per attendance, fracture
patients cost f 16,156 and “wti~)lash” & fracture patients f 1,008,
Applying the 1991/92 cc~stof f57 per attendance, fracture patients would have cost
f32,889 and “whiplas~’ & fracture patients $2,052.
me overall Frwture Clinic cost for dl patients using 1988 figures is f 19,012, but
doubles, using 1991/92 figures, to f38,703 (Table 1$.
27

Table 13: hthopaedic Clinic Attendances(In Each Sti Month Period -Recmi~ent To Tweny Four Montb)
At h oJhmimI
.:..... ::...,:::...:,... ..... ... :,.,.:.,,..::...::.:...:,..:.,.::,,.,..,.:,:.,:. ..:.:...:.::, Numbu W Awtim cost (f)
,.. : ...,. .:., ;: ..;...y.,:,:...... ,. .,.. ,:.:..:.:,.. Patims,,: ~: : : :.,,:,: ,,, : .:.: :,,,;,,:, , ,:: : : : .: :.. :, ,,,
Tmti,:,; ,.,, :,:,:, :.::.: .. ..:y ::,: ::... ::. .. :. ;:,. Toti i kge 1988 1991m2
Whiplmh. I (02%) I 1.0 l-l 2a so
Fwm 1 (0.w.) I 1.0 l-l 2a 50
.Wtiplmh. & F~
Toti 2 (0.4%) 2 1,0 l-l 56 100
8
bitinf To Stititi
Wtiplmh. 9 (2.%) 25 2.8 14 7W 123a
F-m 5 (4.3%) 18 3.6 2-5 S04 a9i
~ipl~h. &Fmm
Toti 14 (2.6%) 43 3.1 14 1204 2129
.Wtipkh. a (I %) 15 19 14 420 743
Fmm 1 (Owe) 2 20 2-2 56 99
Wiplmh. & F-m
Toti 9(1 m) 17 19 14 476 a42
hh TO men ~
Wtiplmh. 10 Q.4*A) 19 1,9 1-3 S32 941
F~ 1 (0.9A) 2 2.0 2-2 56 99
Whipluh. & F-m
To~ 1I Q.w) 21 1.9 I-3 58a 1040
. ... .. . --w To rq+m~ti
Wiplmv 3 (0.m) 5 1,7 I-2 140 24a
Fwm I (0.%) 2 2.0 2-2 56 99
-Iphh. & F~
Td 4 (0.m) 7 1.8 I -2 1% 347
28

Table 13: hthopaedic Clinic Attendances(In Each Six Month Peri{~d - Twen~ Four Months To For~ Eight Months)
,:,.:....:: : .:::.::,.::::..,J,..,::,.:.:.:,................. .. ... .,:..:.:::,$.W .,:. .........~ .......:,:.+ :;:,:,;,.,.,..................... Nuda W Awdm= cost (f),.,.,.:.:.,.:...,.,:,:,,.:...,:: : .,..:,.::. ...., ..,::,:.,.:.,.:.:.: .,, ,..,:.:,, ,.,:..::..:, . . . ,.,
,.. Ptimn,..,,’.:: : :..., : .,:.:.?,”: “::.: ,.:,:..:..., :.: ,.,,.: ,,,.:,,: ; ,.;
Th Td i hge.: ,.. :,,::,., :...,,,,., ,..................>:., .:.,. ,.,:,. ., 1988 1991@2
.Wlplmh.
●
Fwn
Wfipl=h. & F-m
Toti
Whipluh. 2 (0.5%) 2 10 l-l S6 99
FWR
.Whipluh. & F-m
Toti 2 (o 4%) 2 1.0 1.1 56 99
Whiplsh.
F~
“Wtipluh. &F- .,. - . .-
Toti
Unit ~ 1988. US 1991~ _ f49.50
29

Table 14: Fracture Clinic Attendance(In Each Sk Month Period - Recrui~ent To Twen@ Four Month)
:,..; ...: .:.;......:.....,:,:,.:,.,.,:,:,,,.,..... ::.’:?.;..:!.::?.:.:”,,):::;;,:: ,:,, :’ Numb- W.,. Atidm- Cost (f)
., ,::.:.j:.::..~, ., ..........::..::::..: :.::::,.:::,.,. ...,:,,,,.,,:..:.::., ,.:,,.:,,,..,,,::,.. Pltims
!.:.. :.:.:..W .:,;..:.:.:: ..:: :.:.:.:..‘.’... . ....,,: ,,,,... ::.. :.:::,,:: : : :. .,.... ::. T- Toti.,. i tine 1988 1991m2,.
.Wtipluh. 6(1 .5%) 6 1.0 l-l !68 342
Fmam 52 (44.4%) 72 1.4 14 2016 4104
Whiplmh. & F-m 4 (44.4%) 5 1.3 1-2 140 285
Toti 62(1 1.S%) 83 1.3 l-l 2324 4731
●
Whiplwh. 9 @.2Y.) 35 3.9 14 980 I995
Fwm 78 (66,%) 33s 4.3 I-16 9380 19095
.Wfiplmh” & F~m 2 @2%) 11 5.5 54 308 621
*--, no I16 ~v.! In 1 43 1.16 10668 ,,7,,
%Ipluh. 7 (1.%) 14 2.0 I -5 392 198
FWE 31 (26.5%) 80 2.6 14 2240 4560
Whiplmh. & F~ 2 (222%) 14 70 54 392 798
Toti 40 p,4%) 108 2.1 1-9 3024 6156
.Whipkh. 4 (1.w) 5 I .3 I-2 140 28s
Fmm 15 (13,W,) 52 3.5 1.9 1456 2964
WMpbY & F~ I (1 1.1%) 1 1.0 l-l 28 57
ToW 20 p.%) 58 2.9 1-9 1624 3306
Whipbh. 2 (0.5%) 4 2.0 2-2 112 22s
F-m 8 (6.8%) 21 3.4 1-11 756 I 539
~Iplub. & F-m I (Ill%) I 1.0 l-l 28 57
Td 11 Q.H) 32 2.9 1-11 8% 1824
30

Table 14: Fracture Clinic Attendances(In Each Sk Month Period - Twenp Four Months To For~ Eight Months)
~:.::.:..::...:...:.:.:.:.::;,:,,,.,,,.:., ,.,.,,:,:.,:,..:,.:::.::.......,,:,.,,.,:,:,.,::...:,.,,.,.,.,,..,.. .,:,:,,,:,,,:,:,:., :,,:: :,:,. Numb- ~ Atirn cost (f)‘,’,,:::. : .’:::.: : :. ,,:,::,,,:,,::: :,; ,:,:,,,,., ::.,::,.:..:: :
Ptimu,.. . .......,..,, . . . .... ... .... ..... ..:,.. .. ..:,. .’,; ;::,;,;,.,.. . ... ;. ........ .. .. Th Toti i,., ,. ., ,, ,, ,, :.,., ,.... .,.Y..,.:...: hge 1988,, ..,.. 1991m2
Wtiplmh. 1 (0.2%) I 1.0 l-l 28 57
Fwm 5 (4.3%) 7 1.4 14 196 399
.Wtiplmh. & F-m I (11.IYO) 1 I .0 l-l 28 57
Toti 7(1 .3%) 9 1.3 I-2 2s2 513
..Whlplmh-
FmR 2(1 rA) 2 10 l-l 56 114
M!pl-h. & Fam
Toti 2 (o 4%) 2 10 l-l 56 114
WhipluW
Fmm
Whlpkh. & F- t (11 l%) 2 20 2-2 56 114
ToW 1 (o 2%) 2 20 2-2 56 114
31

A variety of other Out-patient Clinics was used by 32 patients mtig a to~ of 252
attendance, either as a direct restit of the injury or due to complications arising from the
injury, eg. the Anti-coa@ant Clinic for deep vein thrombosis or to a Neurological Clinic
after a“whiplash” injury for nerve tests. Mer 24 months this service was used ordy by the
“whiplasN’ patients who required on-going treatment for pain (Table 15). The 1991/92 unit
cost at f20.64 is lower than the 1988 unit wst ‘of Z28, as this cost, l~e the Accident and
Emergency 1991/92 cost, is pdy borne by the specialty requesting the service.
The overall other out-patient cox using 1988 figures, is f7,000 and for 1991/92
figures is $5,201.28 (Table 15).
4.1.4 Physiotherapy Costi
The Physiotherapy Out-patient Clinic was used by dl groups of patients during the
first six months fier accident. From 6 months to 2 years the fracture group and the
“whiplash” group continued to use the service. After this time it was used by “wtiplasN’
patients only.
Over tie four year period 309 “whiplash patients attended the Physiotherapy
Department on 1,870 occasions, at a unit cost of f5 per session - totrd of f9,350. Seventy
fracture patients made 1,126 visits at a cost of f5,630, and the “whiplas~ & fracture
patients cost f295, an overall Physiotherapy cost off 15,275 (1988 costs).
The 1991/92 Physiotherapy Unit cost of f37.78 shows a “whiplas~ Physiotherapy
cost of f70,648.60, a fracture cost of f42,540.28 and a “whiplas~ & fracture cost of
f2,229.02, giving m overall 1991/92 Physiotherapy out-patient cost of fl 15,417.90.
Some patients attended a private physiotherapist at an average cost of f 15 per
session. As these costs were either paid privately, or were covered by private health
insurance, they are not included in the costs quoted in this report (Table lo.
32

Table 15: Other Out-Patient Clinic(In Each Sk Month Period - Recrui~ent To
At n~ o!bmimt
AttendanceTweny Four Month,
.Wtipl~h.
F-m
.Whiplmh. & F-m 1 (11,1%) 3 3.0 3-3 M 62
Toti 1 (0,2%) 3 3.0 3-3 M 62
.Wh!plmh. 1(1w,) 11 16 14 308 227
Fwm 8(6 8%) 83 104 1-32 2324 1713
.Wtipl~h. & F-m I (11 l%) 1 10 l-l 28 21
Toti 16@W0) 95 59 1-32 2660 1%1
Sk To Twk titi
.Whlpluh. 4(1 w) 7 18 I.3 1% 144
F-m 4 p 4%) 13 28 1.5 364 268
Wh!pbh. & F-m
Toti 8(1 Svo) 20 25 1-7 560 412
Wtipkh”I
6 (1.5%)I
20!
3.3 I 1-11 I 560 I 413
F- !4 ~,4%) I
II I 2.8 ! 1-5 I 308I 221
. ~~ ~~‘- -TotiYFmtiti
1
Wtipluh. 5 (1,2%) 9 I .8 I -3 252 186
Fmm 2 (1.%) 13 6,5 67 364 268
%Ipluh. & F-m
Toti 1 (1.3%) 22 3.1 1-7 616 454
33

Table 15: Other Out-Patient Clinic Attendance(In Each Sk Month Period - Twen~ Four Months To For~ Eight Months)
.............................,,.::::::::.:,.,:,:,,,..:.::;~,;:;:::,::’:. Nuti W khm cost (1),.::,::::,::: .:: ::,: : : :..::.:: ,:., ;,:,:: :.,., :.:...:.. .,,,:..:: :.,: Mmo
,., ,,,,,,,.,,, ........ ... .,...,.,::., ,:,: ,, ,:,.,, T& Toti; :.,,..,.:,., .: :,.: ,,.,, ,, ,,, ,,, i hge 19s8 1991P2
Vtiplmh” I (02n) I I .0 l-l 28 21
●
F-m 1 (0.9%) 9 9,0 94 2s2 186
.Wfiplmh. 4 F~
Toti 2 (0.4%) 10 5.0 3-3 280 201
Whipluh. 1 (0.2Y.) 3 3.0 3-3 84 62
F~m 1 (0.9%) 2 2.0 2-2 S6 41
~tiplm~ 4 Fwm
Toti 2 (o.4n) 5 2.5 2-3 140 103
Wfiplmh. s (I .2n) 23 46 1-12 644 475
F~m 3 @.6n) 25 8.3 2-13 700 516
~ipkh. & F~
Toti 8(1 .5Y,) 48 6.0 1-13 1344 991
Whlplww 2 (o,sn) 13 6,S 67 364 268
F~ 2 (1.7%) 5 2.5 14 I 40 I03
W!pbh. 4 F~ .-
Toti 4 (0.7%) 18 4.5 I.1 5W 371
34

Table 16: Out-Patient Physiotherapy Attendance(In Each Six Month .Period - Recruitment To Twenty Four
At Eme o~ RewiMn!
Months)
Numbu Of Anmdm- Cosl (f)
Patimu
Td TOUI i Range 1988 1991E2
.Wh!pluh. 63 (IS 3%) 209 33 1.18 1045 7896
Fmam 4 (3 4*A) 13 33 14 6S 491
‘Wh,plmh - & Fmare
Toul 67(124%) 222 33 1-18 1110 8387h
●
.Whipi-h. 126 (30.5%) 1144 9. I 1-36 5720 43220
Fmmm 46 G9.3%) 854 186 1-121 4270 32264
.Whipl-h. & Fm~m 4 (444V.) 59 14,8 626 2q5 ~2~q
Toti 176 (32.7A) 2057 11.7 1-121 102S5 71113
Six To Tweiw Mfh
.Whtpkh. 15 (3.6Yo) 128 85 1-2q 640 4836
Fan I I (9 4%) 161 146 I44 805 6083
.Whipluh- & F-m
1-,s1 26 (48Y.) 28q Ill ! 44 1445 Iwlq
.Wbtpluh. 17(4 l%) Iq8 117 I -36 990 7480
F-K b (5 IY.) 87 145 5.22 435 3287
Whtpbh. & F-m
Toti 23 (43*A) 285 124 I-36 1425 10767
Whlplxh- 7(1 m) 124 177 2-50 620 4685
Fwm 3 @ 6%) II 37 I-q 55 416
Wh!pluh. & Fmm
TOMI 10(1%) 135 13 s 1-50 615 5101
35

Table 16: Out-Patient Physiotherapy Attendance(In Each Sk Month Period - Twenty Four Months To Forty Eight Months)
,. Numbs ~ Atihrn Cmt (f)
Palms
Td Toti z hge 1988,,. 1991m2
Wtipl-h. I (0,2%) 28 28.0 28-28 140 1058
Fwm●
Mipl=h” & F-n
Totil 1 (0,2%) 28 28.0 28-28 140 83s7
mim To mti Sutiti
~hipl~h. 3 (0.m) 23 7.7 3-14 )15 869
F-m
.Whipbh. & F-m
Toti 3 (0.6%) 23 7.7 3-14 115 869
~i~ & To FW Tw kk
.WhtplmV 2 (o 5%) 8 40 24 40 302
Fw=
Whlpluh. & Fem
Td 2 (o 4%) 8 40 24 40 302
F- TM To F- E@f ~ti
.Whipluh. 1 (0.2%) 8 8.0 84 40 302
F-m
Whipluh. &F- .- .
Toti I (0.%) 8 8.0 84 40 302
Unit -1988- f5 1991B2 - f37.75
36

4.1.5 Cost Of Appliances (Onthoses)
A collar was the most frequently issued appliance. Ninety per cent of “whiplash”
ordy patients, and 8 of the 9 “whiplmti’ & fiactie patients were issued with cervical collars
at a cost off2,151 (1988 costs), There wodd appear to be litie difference in the 1991/92
costs at f 5.35 per item. Crutches were supplied to 62% of fracture patients. These and
other items of equipment, eg. wheel chairs and tier frames, are supplied on a use and
return basis and have, therefore:, not been individtily costed. However, many of these
items are not returned, adding mmadditiod *own fwtor to the toti health service costs.
Other smaller items were issued in limited numbers, eg. slings and wrist braces, dl
at a cost of f5 per item. The toti
(Table 19a).
4.1.6 Cost Of Ambulance Trips
The quoted 1988 Arnb~dance
overall cost for dl groups was f3,340 (1988 costs)
cost was f5 per patient, per mile, over a five mile
catchment area - an average cost to the Arnbtimce Senice of f25 per tip. A toti of 96
“whiplash” injury patients usecl the Arnbdance Service on 130 occasions during tie first
six months after the acciden~ at an 1988 cost of f3,250, the fi~~e patients mtig a toti
of 1,109 trips, an average of 9.5 trips per fracture patient, at a toti 1988 cost of f27,725
(Table l?.
The 1991/92 Ambdanc(~ figures are split into emergency and non-emergency costs.
An Emergency Ambdance costs f76.51 per journey and a Non-Emergency Ambulance
costs f7.45 per jomey. For d~e purposes of costing, each initial visit to the Accident and
Emergency Departmen\ immediately after tie accident has been costed using tie
Emergency rate. On my subsequent trip the Non-Emergency cost has been applied. The
37

Table 17: Ambulance Journeys(In Each Sti Month Period-Recruitment To Eighteen Months”)
At 33meoj&wimnf
.. ...... .:.,:,.,,..,..,:,:,;BY..,:,:.:,:..,..:,::::...:.:.::.,:::.:..,,:,,..::,:.,:, Wmkm Nmk W z.~ . ..-(1).,::.:..:.:::.:.:.;..’...,.,..::.:::.:::..;,:..:::::.:.,::::;.:..:.::::.:>
mm JO- W J-m: :.:.:.+..:.,,.,...:,.:: .:... ::~,: T-.. : : :...:.,:,; .:. .:....:.::.::,:..:,:;,,,::,:::.,::.:.: .:.:,.::.:.. 1988 1991m2
Wtiplxh. % 101 1.1 2525 7382
F-= I03 169 1.6 4225 0372
.WMpl~h. & F-m 6 6 I .0 150 4s9
To&l 205 276 I .4 6900 16213
.Wtiplmh. 2 29 14,5 725 216
F- 30 743 24.8 18s1s 5535
‘Whipluh. & Ftim I I 1.0 25 7
Toti 33 773 23.4 19325 5758
Wtipbh”
Fma~ 4 142 35.5 3550 1058
Whiplmh. & F-m
.-l d 142 35.5 3ss0 *ncn
38

lower Non-Emergency cost accomts for the decrease in overall costs in 1991/92 to f23,439.
4.1.7 Summa~ Of Health Semite Costi
Outside the hospiti other
recent implementation of General
health services were utilised by these patients. With the
Practice fund holders, it had been hoped to be able to cost
visits by R.T.A, patients more accurately. This”has not been possible due to the complexity
of the costing systems used.
A General Practitioner is paid a fixed annti amount for each registered patient,
dependent on age, and irrespective of the number of visits made. A special rate cost is ody
charged if certain specific procedures are carried out, eg. reduction of a dislocation. The
1988 annti registration fee W= f8.25 for patients under 65 years of age and f13.15 for
75+ years. The 1991/92 ann~ registration is divided into three age bands of f13.85 under
65 years, $18.20 if aged between 65- 74 years and f35. 15 for the over 75 years old age
group.
Table 18: l~atient Visits To General Practitioners
“pB~EBm.:.,,.,.::.,,,,,,::,,Toti ~!- - “+~~~~;; 1.36
: ,,:.::’;l;fi, :.::
332 . ~~j;;:: :fi.,,.,. ........... 1.17. *, ;$,;~~; i-24 1714 ‘:;, :;:;;;:: 1-36
The greatest number of visits to a Generrd Practitioner was made, by dl injury
groups, during the first 12 months when 267 “whiplas~ patients made
the minimum number of visits being 1 and the
(Table 18). 63 fracture patients made 261 visits
39
maximum 36 visits
and 8 “whiplash” &
a toti of 997 visits,
by any one patient
fracture patients 43

visits during tis time. The number of General Practitioner visits does decrease over the
four year period but a small number in each group was still attending at 4 years. The
average number of visits for dl patien~ in each injury group is 3 per “whiplash”, 3 per
fracture and 9 per “whiplas~ & fracture.
The District Nursing Service was dso used to a very limited extent over the first two
years ody, two “wtiplasti’ patients requiring 40 visits and 13 fracture patients requiring 98
visits, At a district nurse cost of f9 per hour, “whiplasti’ patients needed 12 hours care at
an overall 1988 cost of f 108, and the fracture patients 32.5 hours at an J 988 cost of
f292.50.
The 1991/92 cost of f 13 per district nurse hour gives a toti cost of f 156 for
“whiplasW patients and f423 for fracture patients.
A summary of toti Health Service costs hi@ighting the individti specialities is
given for each injury group (Table 19a).
The bre~down of cost per patient (Table 19b) is averaged over dl patients in that
40

Table 19a: fierall Health Sewice Costs fier For~ Eight Months
12177
1876
1848
2436
93s0
3250
108
2164
199102 Cmt
I 5943
18733
3317
3762
17%
70649
7598
1S6
2164.
F~ (f) ~hipl~h. & F-m (f) Toti (1)
1988 Cti 1991B2 Cmt I 988 cost 1991m2 tist 1988 cost 1991M cost
3297 3113 441 416 20622 19472
5850 23445 5850 2344S181 312 181 312
204138 314043 2475 3808 218790700 1238
336584
2576 4555
161s6 32889 1008 2052 19012 3870344S2 3323 112 83 7m 52015630 42540 295 2229 15275 11s418
277ij i 337$ ! ?~ 466 31150 23439293 423 401 579
Ills 1118 58 58 3340 3340
IIT@ I; 5m3
I124456 I 269540
I437819 I 4564
I9112
I 324197I 571048
Table 19b: Health Semite Costs, Per Patient, ~er For~ Eight Months
II~d Aids
WMplmh. (f) I F-m (f)
I1988 Cost I 1991@2 Cmt I 1988 Cost
41 39 28
50
2
29 43 1745
5 8 6
4 9 138
6 4 38
23 171 48
8 18 237
1 1 3
5 5 10
122 300 2304
1991m2 Cmt
27
200
3
2684
11
281
28
364
131
4
10
3743
Wtiplmh. & F~ (f)
1988 Cost 199 1s2 cost
49 46
275 423
112 228
12 9
33 248
19 52
6 6
506 I 10I2
Toti
1988 Cost
38
II
1
406
5
35
13
28
58
1
6
602
f)
I99 Imz cost
36
43
1
624
9
72
10
214
43
1
6
I 059
41

injury group. The bti of Health Semite costs were incurred during the first year
following accident, with a limited number of patients using the service during the
subsequent years. The cost per patient was over 10 times higher for fracture patients
f3,743) compared with “whiplash” patients (f301) in 1991/92 prices.
The Accident and Emergency Service was used by dl injury groups, mtiy at the
time of accident and in the six months follotig (Table 11). The service was used to a
limited extent from six months to 24 months, by 7 “whiplasN patients making 14 visits;
5 fracture patients mting 15 visits and 2 “whiplasM & fracture making 2 visi~ during this
time. During the fmd two years, no tier use was made of the Accident and Emergency
Department by any of the injury groups.
All groups of patients required admission to hospiti with the fracture group patients,
not unexpectedly, requiring a greater number of admissions than the other two groups.
During the f~st bee years following the accident, 102 fracture admissions accounted for
a toti of 2,053 in-patient ward days (Table 12a), 30 Intensive Care days and 1
Neurological in-patient day - a toti of 2,084 in-patient days.
All Out-patient Clinics, apart from the Orthopedic Clinic, were used by the Study
Oroup patients in decreasing numbers over the four year study period.
The Arnbtiance Service was used to the greatest extent during the f~st six months
period and was used by ody six frac~e patients during the 6- 18 months period, no
further use being made tier this time.
4.2 Soctil Secu@ Costi
The principal benefiL available to those people in employment who are incapacitated
through ilkess, is Statutory Sick Pay (S.S.P.). This benefit can be claimed by people who
have paid the required number of insurance stamps to qtiifi and is paid in two rate
42

bands -alower current rate of143.50 topeopleetigbeWeen f52.00and f184.99 per
week and a current higher rate of f52.50 to those e-g f 185 and over per week. In 1988
the lower rate was f34.25 per week and tie higher rate f49.20. StatutoW Sick Pay is
payable after a three day exemption period
This benefit is payable up to a limit of 28
and is crdcdated on a five day working week.
weeks in any one continuous sickness period.
Thereafter, if a person still remlains incapable of work through ilhess, different types and
amounts of benefit are paid, depending on f~cid circumstances.
During the course of ttis study, the various benefits have been updated at six
montiy intervals by the Deptiment of Social Sectity. Each six montiy study assessment
period reflects the true monetiq value paid out in these fmancid changes in S.S.P. and
additiond benefits (Table 20 and Table 21).
Patients did not always know under which headings benefits
but were able to provide information on the toti amount received.
Bearing in mind the 28 weeks S.S.P. limi~ it is not surprising
paid in this benefit occurred dtig the fust six months tier accident.
had been apportioned
that the greatest sum
Fracture patients lost
a toti of 713.5 working weeks at an S.S.P. cost of f33,014 over the first 24 months, an
average, for dl fracture patients, of f282. “mplash patients continued to have time off
with recurrent problems over the whole four year period, having a toti loss of 1401.4
working weeks at an S.S.P. (cost of f66,429, an average, for dl “whiplash” patients, of
f161.
men looking at additioti benefits, the fracture costs are over five times greater
than those of “whiplas~ patients (f698 compared with f 133) (Table 21). The additiond
benefits cover dl those quoted in the footnote and are varied, someties covering more
than one benefit over different time periods and me summarised in terms of patients
claiming and toti amount claimed during each year of the four year study period.
43
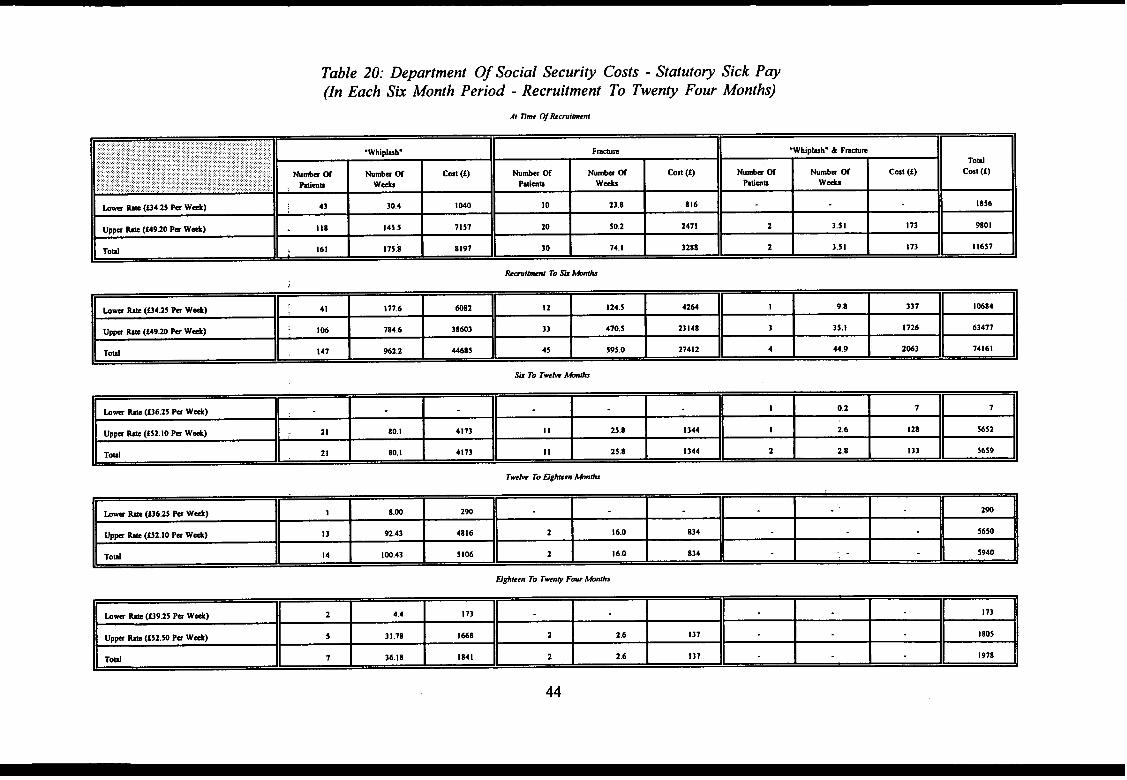
Table 20: Department Of Social Security Costs - Statutory Sick Pay(In Each Sk Month Period - Recruitment To Twenty Four Months)
,,. ,,: .,.,,. ,.,,,,,,,,.,: ..... .,,,,,::,:.:,,::::.::,:,,,:,,,:,:,,,:.:,,:,.:.:::::::,,..,:?::::::::::,,::::,:,:;,;,::::;.,,.:,.;.:.~:::..,,:.:.::::.,. ::.:,.,:,::,,::::.,:>,.:::.:.:.:,...:.:..,, ......... ... ,.,.:,, : ..:.:..::...:.:..:,,,::::::.::,::,.::......,:...: .Wtiplmw..... .... ....... ,. F-m .WMplmh” & F-m
...... . .. ..,.,...,:.:,..... ,::. .,:.: .: :.,,,.... : : ::,:. ... :. ,,,,,,,,,., ...:,:.:.,,..,.:, :.
- “ B
Toti., .,,,. Numbs ~,.:,:,., .:$.:,.::...::,;,::.:.::,:::.:,:,.:.;,,....:,.~,..:j,.. ::.::..:,;,:.:, ,:, .:......,:,:,:,:,, ,:.{;,::,:: hmba 05 c-t (i) Numb= W Wmbw ~ cost (i) Wmk ~ Numbm Of cost (i) cost (f)
, Ptimu WA Pdmn: ::.:-:.:.:::..,:::::.::::::.::.:.:..,::::::,.,.,.... .. .:. ....... ...... :.?.. ...... ..... .. : . .. .. ... W* Mmm WA
km W (U4.25 M W*) 43 30.4 1040 10 23.8 S16 1856
Upw M (f49.20 Pu W+) 118 145.5 71s7 20 50.2 2471 2 3.51 I 73 9801
Toti 161 175:8 8197 30 74.1 3288 2 3.s1 173 11657
hi-l To Sk hti
.=-- 7~‘ ‘ HDtiteen To Twny Fwr tinhS
44
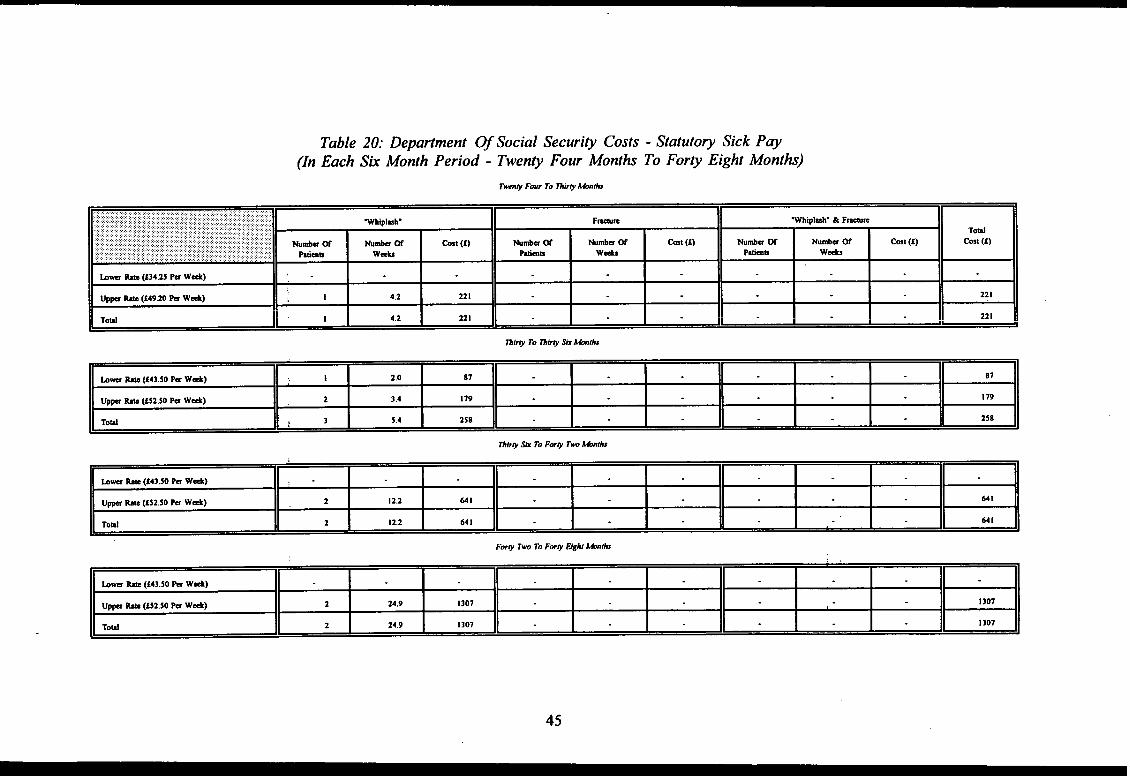
Table 20: Department Of Social Security Costs - Statutory Sick Pay(In Each Sk Month Period - Twenty Four Months To Forty Eight Month)
,,,........::,::::,::,.,.::::,:.:::.:.: ....:.:,....:.:::.:,,:.,..,,,..:,..:....:.,,,,,,,,.,:,:,:.:.:.::..:...:::.:::.::.:.:,:.:.,,:.:,:.:,.,..:, ~.:.:...:............. ..............:,:,,..:.,..:.:...:.,,. ..:................. ..... :::,:,:,::,::.... ............. .........,.,.:.::.:.:.:.:,. .:.::.::Wipld. F-E .WtiplmW & F-m
. . . . . . ... . .‘.’..,:.:’. : : : : : y:...,.,.:.:: .. .:.: .;.;::.:.:.::: W..!. .::. ::.; .“.:.’.:.:.:.;.“..:..
~ ~ E
Toti.y ::..:.:.::;.:.:.:......... ............. ... ..... . ... . . . Wda a -u a @st (f) W* a Wtia w cost (t) mm w Numb= ~ Cmt (t)... ... .. cm (1)
.::;...:.:::...,..: ,.:.:,:.:.:,,,,:.:.:...... ,:,,.. ,: ; y V::;.... .:. .. . . . . Man Wd,.,,,; ... ..... ... . . . . . . . . . . . ... .. . . Ptimn WA Ptirnb Wti
b- M (f34.25 Pu W*) ,.
up~ w (f49.20 Pa WA) I 4.2 221 221
Toti 1 4,2 221 121
45

Table 21: Total Additional Bene]tsg At 12 Month Internals
:,:.::;,,,,,,., .. .. .,,..., ,.:.::.:,,,.,:,:\.:.,::::,..,:,;.::,::,.,.,:,...........:..:.::,,..:::.:.:...,... ,, ~i~t . 13 mob - 25 @h - 37 Wnti -
BB
Td (f) i Al Ptimm (f)..:: :.,:.: ,.:i.: : :>.:..: ,..’:. :..:.::...:,..::,,,:,.. .. :.,,, : :...,..,: .:.: 12 MOnti (f) 24 Mb (f) 36 Mm~ (f) 48 Mnti (f).,.,.,,... .... ,., ... .,.,.,.:: ... ptimn] ~ms] pbims]... ,’............ ... .: Ptimb]
.Wtiplur 9269.7 [12] 17332.7 [IO] I 7550.8 [8] 10879.4 [6] S5032.6 133.3
F-E 24861.1 [15] 32639.0 [15] 16326. I [5] 7848.0 [2] 81674.2 698.1
wtipl~h. & F-m 2719.0 [1] 2767.7 [1] 2873.0 [1] 3349.8 [1] I 1709.5 1301.1
Totil 36849.8 [28] 52739.4 [26] 36749.9 [14] 22077.2 [9] 148416.3 275.4
4.3 Pemonal Costi
Nearly 40% of dl patients had some change in income over the four year period
(Table 22). ~s was invtiably a loss due to time off work, loss of current job, bonus or
overtime payments. One hundred and sixty “whiplasV patients (39°/0) had a toti income
loss of S271,508, an average loss of fl ,657 per “whiplash” patient with a loss. Fracture
patients with a loss (41%) had a higher average at S3,391. Six patients, 2 “whiplash” and
4 fracture gained income as a direct result of the accident. A temporary enforced change
of occupation resulted in moving to a higher paid post in the same company or to a
completely new career witi a higher dary. me toti gain of these six patients was
f15,073 (Table 22).
Table 22: Changes In Income
,,:.::,,::.:.{:.:: :..:::..:. .. :,: ,;,::;.l:::::~:;::,:,::;,.{,::,.::..:,.::. :.:::...:..... :..,,:,:.:.:.:. ......... .... . ~ @ Ptimb Td hm - (f) Av~e b
E
To~ ha tin (f). ............ . .
W& A Ch~e b. . . . . . .. . . . ..., .,.,,,.,. ..,...::.::::.“.......................... . . .. .. .. .... ... h- Mmm Wd A - Ml Pbim
W!pkh. ,.lm (3s.=) .271508 . . .1697 f17 307 @ -b)
F-m 48 (4 I .W) 162772 3391 1391 147M (4 P*)
Wipkh. & F- 3 (33.3%) 5108 I 703 568
Toti 211 09,1%) 439388 2082 815 15073 (6 Ptimu)
More than 50% of fracture patients and “whiplasti’ & fracture patients pursued a
compensation claim for injuries sustained in
46
the acciden~ as did more than 70% of

“whiplasN’ patients (Table 23). To date 230 claims (65%) have been settled, with
compensation figures ranging tiom f200 - fg,600 for “wfiPlm~; f257 - f24, 180 for
fracture and from f850 - f4,000 for “wfiplmh” & fiac@e. ne overall compensation
figures paid by the end of fow years is f555,745 with 124 claims (35Yo) still awaiting
judgement.
Table 23: Settled Compensation Claims At Fory Eight Months
...,,,,,,:,,:,,,,,: ‘,.,,...::,:::..:.7 :::,:.:..,. .;.,.}::,:::\:::,::!::::.Ntia ~ timm N& WC- To~ but (S) i knt (f):., .:::,:,:,::;,:;,:. ..$: :.:.,:.! : :,:,,,.,. :,.:: .,..:.;..,:.::...:.
: .,...,~,~,~:.,:,, ,. . .,.,,,....: :.: w Cltid Vo) Md @ m Clumm) @ge) [ ~ -.1 Ml Ptims],,,
Wtiplmh- 290 CO.2”A) 202 (69.TA) 4132S3 (2~) 2046 [1000]
Fmmm 59 (50.4V.) 24 (40.TA) 132942 (257-241 80) 5539 [1136]
.Whip~h. & F~ 5 (55.5%) 4 (80.W) 9550 (asMm) 2388 [1061]
Toml 354 (65.%) 230 (65.W) 555745 @@24180) 2416 [1031]
This study has concentrated on Health and Social Security costs but there are other costs
eg. private medicd or osteopathy costs, additiod heating costs for someone cotilned to
the house after the accident zmd loss of income by family members who have time off
work to care for the injured person. These additiond costs though not quantified should
be borne in mind when
5. DISCUSSION
estimating the true cost of road traffic accidents.
5.1 Population Characteri~tim
Athough the two previous T.R.RL. Contractor Reports @o. 212 and No. 340) have
concentrated on the fmcid costs of tie long-term problems following Road Traffic
Accidents, it has to be borne k mind that there are other eqtily important costs to the
people involved and their ftilies. By 48 months the toti number of people still
experiencing some problems - 45 patients “not be~er” ~d 72 patien~ “*bili*d”, ie.
47
having come to terms with the disability and expecting no further improvement is still high
at over 21‘1o. Assuming that a ceti percentage of tie people who had “discontinued” at
each six month assessment still had a problem, tie over~l propofiion with a disability at
48 months would be higher (Table # and
fracture patients, though decreasing slightly
Fi~re 1). The average disability score for
over each six monti period, is still higher tian
the average disability score for “whiplash” patients over the equivalent six month periods
(Table 5a and Table 5b). Since over 61% of the ~dy popdation fell into the 15-44 year
age group, the residti disability and recovery rates must have some ~uenc~ on time off
work and other daily activities.
The time off work, as a resdt of the accident was high in dl groups. Of the
patients in work “whiplas~ injury patients averaged 81 days off, fracture patients 181 days
off and “whiplas~ & fracture 516 days off sick, over the four year study period.
5.2 Health Semite Costi
The 1988 system of attributing a cost to an inditidti semice, as used in previous
T.R.R.L. Contractor Reports 212 and 340, did not include a cost for refurbishment
replacement, rebuilding nor individti tilng costs, though it did include an average
administration cost of 31‘/0.
The change in the budget management of hospitrd services over tie last few years
does reflect a more realistic cost for any individti service and the procedure is constandy
being refined and updated.
To allow for a yearly comparison over the whole four year study period, 1988
figures are used as in the previous repo~. Aongside this, the equivalent cost for the
service in 1991/92 is shown. Over the four year period, 75 fracture patients (64%) had 166
admissions to hospiti, spending 30 days in Intensive Care, one day in Neurological Care
48

and 2,062 days in Ward Care, at a 1988 toti in-patient cost of S210,168 - an average
fl ,796 for each fracture patie]lt. The 1991/92 equivalent fracture cost is E337,799 -
averaging S2,887 for each fractme patient.
As would be expected, lhe “whiplash” injury patients spent ody a fraction of this
time in hospiti, 17 patients (4%) spending a toti of 123 days in 26 admissions at an 1988
cost of f12, 177 and fl 8,733 in 1991/92 - an average of Z29 and ‘Z45, respectively, for dl
“whiplash” patients. None of these patients needed intensive care.
In-patient care represents the largest single cost to the Health
increase in costs from the 1988 figures to the 1991/92 figures, is nearly
Service, and the
f120,000.
However, a considerable amount of resources go into supplying out-patient care in
the various Out-patient and Physiotherapy Departments. Indeed, for “whiplash” patients,
the cost of physiotherapy was tihe largest single element of Health Service costs, averaging
fl 71 per patient.
The Orthopedic Clinic was used on ody 92 occasions during the whole four year
period, 25 attendance by fracture patients and 67 attendance by “whiplash” patien~, at a
toti 1988 cost of f2,576 (S28 per visit) and rising to S4,554 ($49.50 per visit) in 1991/92.
Apart horn the Physiotherapy Out-patient Department, the most fiequendy used
clinic was the Fracture Clinic which dl groups of patients attended over the entire four year
period to a greater or lesser del~ee (Table lo. The costs doubled between 1988 -1991/92
from f 19,012 to f38,703 for all patients (averaging f72 per patient).
The most dramatic rise was in Physiotherapy out-patients cost. The 1988 cost of f5
per treatment, described as a ]nomind cost, has risen in 1991/92 to a cost of f37.78 per
treatment. Subsequently, the [988 cost off 14,275- an average of f28 per patient - rose
in 1991/92 to f 115,418 for dl ]patients - an average off214 per patient. The change in cost
of mechanical aids, over the time period, was negligible.
49

In 1991/92 the cost of an Accident and Emergency visit fell due to a new budget
management policy of attributing some of the cost to the Speciality Department which,
subsequently, dedt with the patient. This procedure dso applied to a variety of other Out-
patient Departments.
In the 1988 costing of Ambulance trips, an overall figure of f25 per trip was
applied, irrespective of type of ambdance used. However;- 1991792 figures supplied by the
Greater Manchester Arnbtiance Service give a breakdown of cost for Emergency and Non-
Emergency Ambulance trips. As each patien~ who used an arnbtiance at the time of the
accident, ordy required an Emergency Ambulance,
occasion, dl subsequent Ambdance trips are costed
per trip. The average cost of the Ambdance Service
at
at
a cost of 276.51,
the non-emergency
on this single
rate, of f7.45
used was S18 per “whiplmh’ patient
and f131 per fracture patient.
Over the four year period the Health Service Costs amounted to some f300 per
“whiplas~ patient and f3,700 per fracture patient (1991/92 figures).
5.3 Social Secuti@ Costi
Social Security payments dso represent a large cost to the community as a resdt of
Road Trtific Accidents. Over 80% (436) of the original 539 patients recruited had some
form of employment.
Statutory Sick
Nearly 60% of these had time off work, as a result of the injury.
Pay is an enticement to employed people who require time off work,
and is payable for a period of 28 weeks in any one spell of sickness (spells tith eight
weeks or less, between them, count as one). By four years, “whiplasN’ patients in
employment had been paid a toti of 1,357 weeks S.S.P., fracture patients 714 weeks S.S.P.
and “whiplash & fracture 51 weeks S.S.P..
As this benefit is paid for ody 28 weeks continuous sick leave, some people then
50

became eligible for additiond benefits, depending on financial circumstances. At the end
of the study period of four years, additiond benefit payments of S148,416 exceeded S.S.P.
payments of fl 01,822 by over S46,594. ~ese additiond benefit costs will continue to rise
yearly as Severe Disability and Invalidity Allowances are payable on a long-term bwis.
Over the four year period Social Security costs amounted to some f294 per
“whiplasM patient and tiost ,E980per fracture patient.
5.4 Local Author@ Costi
mere are some other costs which are difficdt to quantify. ~ese can be incurred
either by the Local Authority, by the patients themselves or shared between the two. mere
a charge is levied by the Local Authority for services, such as merds-on-wheels and home
help, the amount one pays is based on means. So few patients in this study (4 fracture
patients had an average 17 home help visits over the f~st two years and 3 fracture patients
had 98 reeds from the service during the fust six month period) made use of the service -
it was not reasonable to dloc~ite an average cost to each patient in the injury group.
Ordy 7 patients had any major or minor structural changes to their homes to m~e
living easier. One patient - ii “whiplas~ injury - had a shower instiled. Of tie six
remaining patients - dl frac~res - two moved to a bungalow as climbing stairs was a
problem, two had hand rails fitted in the shower and on the landing, one had a shower
idled and one had a driveway levelled to accommodate a wheel chair. Acti costs for
these
5.5
services are not available>,as these too are means tested.
Pemonal Costs
In addition to the intangible persoti costs and effects on the patient and family,
which can be long and far-reaching, situations for some of these patients are exacerbated
51

by the worry of financial loss. Over 39% of patients declared a loss in income. Two
hundred and eleven people have an overall 10SSof S439,388 over the four year period.
“whiplash” patients averaged f657 10SS,fracture f 1,391 loss and “whiplas~’ & fracture
f568 loss (Table 22).
In toti, 354 patients (65%) made a compensation claim for injury and, by four
years, 65% of these claims had been settled (Table 23). me setiement figures ranged from
f200 for one of the “whiplash” injuries to f24, 180 for one of the fracture patients who,
subsequendy, required
f 1,000 per “whiplash”,
amputation of a limb. The average settlemen~ per. patient, was
f 1,136 per fracture and f 1,061 per “whiplasN’ & fracture. The rest
of the claims are still proceeding.
In addition to personal and family losses tieady discussed, days off work as a result
of R.T.A. injury represent a loss to an individti’s employer and to the community as a
whole. One codd assume that absence from work wodd result in lost production, and that
this should be taken into account in assessing overall costs. However, an attempt to
quantifi tiese losses brought a negative response from several large industrird companies
and office complexes who were contacted.
The loss of income of those who are unable to work through injury dso means a tax
loss to tie Exchequer.
6. SU~Y - CONCLUSIONS
This report presents the findings of a four year follow-up on a group of 539 patienti
sustaining either a “whiplasW; closed fracture injury or a combination of the two injuries
in a Road Trfic Accident, in an effort to determine the incidence and costs of long-term
disability associated with injuries. The conclusions can be summarised as follows:
52

(O The costs to the Health Semite and the Department of Social Security, of “whiplash”
or fracture injury as tie resdt of a Road Trfilc Accident, continues to some degee for
many years after tie accident.
Table 24a: Summa~ Of @erall Costs Per Patient At 12 Month~~@lash” (E))
Intewals
.,,.,.,:.,.:,.:.:.., :.:..,::,.:,:.,,::,.,:,:::,:,.:.,.;, ::...::::,:,: :,,::Hdti S.S.P. Additiond:.,.,.:: .,. ,:,: :,,,,:,:. .. .. ::.:.:.:::.:,:,.,: .....: hmme Chmge COmp-tiOn.:::,:::,..... ... .. . . ,,,.: .,,.,:,: ,:,: ,,,.:,,.. . ... .. BrndIu
..... :, ,,:: :,:::::..::..:....... ,,: : .,. ,,., : :,.,.,,..,:.,, :..,,,, ,,:., .. .,:.: ,,. ., :,::,:;:,,,,: : :.:..; bu ti
R~itirnt -12 Mnti 241 138.1 22.4 2bS.b 0.7 ~ 233.1
13 Monti -24 Mnti 44 16.8 42.0 128.3 37b.O
25 Monti -36 Monb 6 1.2 42,5 166.7 289.3
37 ~n~s -48 Monti 3 4.7 42,5 166,7 289.3
Toti 300 160.8 133.2 657,3 0.7 1~.6
Table 24b: Summa~ Of tierall Costs Per Patient At 12 Month Internals(Fracture (~))
,:.,,...,::.,:::,,.:::,::.........:::,,:,,,:,:,:::.,:.:.,::.:..,,, ,,.,.,,:.,:.:.,...:.::.,, .,.,.:..:.,,,,;: .,. Hdth S.S.P. Wltiod brnme Chmge,.. ,, ,, ., .:.::,:.:::,....::::..;.:.::: CO~n
. .:.,”’.:”:”:,,:,., .. . ::...::::..:........ ... B*IS....... : :.::,>.::,:::.:,. :. :: ,,::.:.:.::::::,:::,:.:.:.:..,.
k ti,. .,: :.,.::.:.::.,.., ,, ,:...:.,..,. ,., . .
R-inrnt -12 Mmti 3499 273.8 212.5 771.5 36.4 111.2
13 Wnths -24 Wnh 211 8.3 279.0 327.6 lb.4 357.7
25 Monti -36 ~nthl 24 139.5 231.4 13.4 667.4
37 ~nti -48 Monti 6 b7.1 60.8
Toti 3740 282.1 b98, I 1391.3 12b.2 113b.3
Table 24c: Summa~ Of tierall Costs Per Patient At 12 Month Intewals~~@lash” & Fracture (1))
....................... ..Ha S.S.P. Addii hrnme Ctige -W
:,:,.,:,:.:,:::::::::.:.>,.. :. :,,::,,:::,::::j ,..;.,::.:,..,,: ,..:...:..:..,:,,,::::,: ,,, ,,.,. ..,.,,, .,. Bmdrn,:,,,,,::,,,,, ,,.: .,’,::.:.::. :. ::::.::::::...:.:. : : . . . .,,, ,.. ... ..,,.:.:::,:.:,:..: :.::.:.:,. ...,. bn tin: :...:....,.:::.::.:,,:,..... .:.,.,.... ... ....
~immt -12 Mnti k 2632 302.1 226.4 94.4
13 mnti -24 Wnti 14 307.5 104.2 300.0
25 Mnti - 3b Wnti 13 319.2 96.2 222.2
37 Wnti -48 hnti 13 3721 140.7 444,4
Td 1012 2632 1301.0 5bl.5 1061.0
53

A summary of Health Sefice 1991/92 CO*, per patient (Table 24a to Table 24c)
shows that the greater cost is during tie f~s year after the accident but that a small cost
for Health Semite care W= still required, by each injury group, at four years.
Table 25a: Summa~ Of tierall Costs Per Patient At 12 Month Internals(Standardised To June 1991 Prices - “~iplash” (1))
,.. ...::,.....::.:.:.....:........ ................:::,:.:.::.:........ : :,.:::.::::.:;..,:.:.....:...,:,:,,.:.,.:.:.:.,.,..:.. ....:..:.: Hdti S.S.P.... ~itind W Chmge., ,,,:,...:.:.:.:.:..:..,:.,. c~n.:....................,:.,.,,,,..:,.:...:; ,. ::.;::, Bmdm
,.,:...:.; .’, ,, .:..:,,:..::!,:: : ... ... ::::..:. :.. :::,..,,:,:.:,,,,..:,,,,,: k ti
R~imrnt -12 knti 242,1 178,1 28.9 346.5 0.9 300.7
1,13 Months -24 ~nti 43.1 20.0 50.0 152,7 447.4
25 Monti -36 Monti 5.9 I .3 46.0 180.0 312.4
37 Monti -48 Mnti 2.9 4,6 25.8 91.8 IW.2
Toti 294.0 204.0 150.7 771.0 0.9 11607
Table 25b: Summa~ Of berall Costs Per Patient At 12 Month Intenals(Standardised To June 1991 Prices - Fracture (1))
,..::::.,::..:.:.:.:.:.;.:.:.:::,:.,,.,.,......... ...,..,... Hti S.S.P. MM hrnme Cbge cO~n:,,,:,::::,,::.:,:,, : ;,. :.: . . :,:,:...:.,:..
Brn&.:; ....’.. ,’.’ : y:, ; ;, :.:....:,,’,:,:’ ,’ ‘.:,:,~,. .,.,..,.,.,. : .. ,.,,..,:..:::::,:,,,.,.,, : ,: ..... .:.:.:.::,. .,. hss W
Rai-1 -12 Monti 3429.0 353.2 274.1 955,2 47.0 143.4
13 Mmtis -24 Monti 206.8 9.9 332,0 389.8 91.O 425.1
25 Monti8 .36 Monti 23.5 150.7 149.9 14,5 720.8
37 WntiS -48 Monti 5.8 65.8 59.6
Toti 3ti5.1 363.1 822.6 1654.5 152.2 1289.9
Table 25c: Summa~ Of berall Costs Per Patient At 12 Month Intewals(Standardised To June 1991 Prices - “m@lash” & Fracture (E))
::,.,;..,.,..::.:...~,:,:::::,........:,.....:..,,.::...,:::,:?..,.,,.,:,,,.,.,.:..,:,......::.::,:,:.... .,. Hti.. ..:::; :::,: ~,~,: ,.::..::: : .,, ...,::;;,j:::;, S.S,P. Mdtid,. .,. hW~ cb8e,. c~n
.. . . .. . ... : ..: ... ....... ... :.,.,.:.:.::, :. BMdIS
::.:::.:’:’::.:.: .. : ..:.,...............,:::::::: : ...... :,......... k =
H-t -12 mob 952,6 339.5 389.7 192.0 121.8
13 tinti -24 Mnti 13.7 365.9 124.0 357.0
25 Monti -36 ~ti 12.8 344.7 103.9 240.0
37 knti -48 Mnti 12.8 364.8 137.9 435.5
Toti 991.9 339.5 1465.1 657.8 I 154.3
54

Using acturd costs for tile relevant year, the average cost of S.S.P. per “whiplash”
patient was f138.1 during the fust year, but varied in subsequent years, due to shoti
intermittent periods of time off sick by this group.
me fracture and “whiplash” & fracture patient tended to have longer sutied spells
of time off sick which resulted in higher costs, for additiond benefits, fier the statutory
28 weeks level had been passe(i.
Using the montiy index of average earnings for rdl Great Britain employees, the
costs per patient for Statutory Sick Pay, additioti benefits, income loss compensation and
health are standardised, using the appropriate mdtiplying factors, to June 199’
(Table 25a to Table 25c).
prices
(i~ me non-recovered rate decreased gradtily over each year but, by the end of the
fourth year a substantial minority, over 8% of dl patients, were in the “not recovered”
category. Of these 8% “whiplasti’, 7V0fracture and 22V0of “whiplash” & fracture - still
had residti effects. In addition, over 13% of dl patients had stabilised, ie. still having a
residurd problem but no longer wishing to participate in the study.
(ii~ me average number of work days lost, for dl patients, is high in each group -39
days for “whiplas~ patients, $)1days for fracture patients and 172 days for “whiplash” &
fracture patients. Some time was lost by dl groups over each six month assessment period.
(iv) Of the patients having ‘m-patient care, the “whiplasN’ group spend an average eight
days in hospiti, fracture group 28 days and the “whiplas~ & fracture group coming
between, at an average, 12 days per patient. ~s relatively small number of days spent as
in-patients by “whiplas~ & fracture patients compared with fracture patients is the main
55

reason why overall costs were lower for “whiplash” & fracture compared with fracture
patients; it is likely that if the sample of “whiplash & fracture patients had been larger than
9, the difference between the two groups of patients would have been smaller.
(v) -me main Out-patient Clinics used were the Fracture Clinic and the Physiotherapy
Out-patient Clinic. Ml clinics were used less fiequentiy as time progressed. Over 82% of
fracture patients attended, as did 4V0of “whiplash patients. ne Ofiopaedic and otier
out-patient Clinics dso treated both groups of patients.
(VO Physiotherapy attendance were frequent in dl groups of patients during the fust two
years. After this time it was used ody by the “whiplasW group, who attended on 1,870
occasions. me fracture patients made 1,126 visits during the ffist two years.
(vi~ Mechanical aids, of which a collar was the most fiequendy issued (402), was
relatively inexpensive. Ml bigger items, eg. wheel chairs or wtig frames, are returnable.
(viifl Al injury groups made use of the General Practitioner service with “whiplas~
patients making 1299 visits, fracture patients 332 visih and “whiplash & fracture patients
83 visits during the four year study period.
(h) me more realistic 1991/92 costings give a clearer picture of the costs of N.H.S.
resources used.
(x) Statutory Sick Pay from the Dep-ent of Social Security represented over 41V0of
56

Social Security costs, the remainder being paid in Additiond Benefits.
(Xg A toti of211 patients (39%) lost some income through time off work. Six patients
(4 “whiplash” and 2 fracture) had a gain through an enforced change of occupation.
(xi~ A claim for hjury compensation
of the claims have been settled to date.
was made by”354 patients (660/0). Ntogether 65°/0
(xiifl In addition to personal losses, days off work represent a loss to the community in
lost output and dso a cost to the Exchequer in lost taxes.
(xiv) Apart from the financial loss, the physical and psychological long-term effects have
a debilitating effect on the R.T.A. castity and his family. For example, the fear of
traveling curtails family outings; the tijured party cannot play with tie children; recurrent
pain causes stressti situatiom~ and on one occasion even led to a divorce.
(N) The toti overall
“whiplash” patien~ f4,85’
in June 1991 prices.
Hezdth and Social Security cost at four years is f649 per
per fracture patient and E2,796 per “whiplash” & fracture patient
57

7. ~FE~NCES
Gdasko, C S B, Mmay, P A, HodSon, M (1986). Long term disability following road
traffic accidents. T.R.R.L. Research Report 59. Transport and Road Research Laboratory,
Crowthome.
Mmay, PA, Pitcher, M, Gdasko, C S B (1992). The cost of long term disability remlting
from road trtilc accidents: two year follow Up repofi. T.RL. Contractor Report 340.
Transport and Road Research Laboratory, Crowthome. ●
Tmbridge, R J, Mmay, PA, Well% AM, Gdasko C S B (1990). The cost of long term
disabili~ resdting from road trfilc accidents: interim report. T.R.R.L. Contractor Report
212. Transport and Road Research Laboratory, Crowthome.
58

APPEND~ A: DIS~ZLITY SCOMNG ~THODOLOGY
The Disability Scoring sysem tied to look at tiee diwbct areas of daily life and
combine them to give a fmd disabiliw score for each patient in the study. The areas of
interest were:
1. Amiety
2. Physical Activities
3. Physical Movements
●
1. Amiety
At each six month interval the patients were asked if they stiered from anxiety
when placed in the following situations:
1. Daily Activities2. Recreational Activities3. Occupational Activities4. Driving5. Traveling As A Privatt6. Using Public Transport
Vehicle Passenger
For each question the patient was awarded a score of O if the activity codd be performed
with no feelings of anxiety; a score of 1 if they felt anxious but codd still accomplish the
task; and a score of 2 if their anxiety prevented them from even attempting the activity.
The resdting scores for the six questions were totiled to give an initial anxie~ score in
the range of O to 12.
2. Physical Activities
At each six month interval the patient was asked if they cotid perform the following
physical activities:
1. Washin@athing2. Dressing
59

3. Eliminations4, Eating5. Exercise6. Mobility~riving7. Sleep8. Coitus9. Housework10. Work
For each question the patient was awarded a score of O if the activity cotid be performed
with no problems and a score of 1 if the activity had been tiected by the accident. The
resdting scores for the ten questions were totiled to give an initial physical activities score
in the range O to 10.
3. Physical Movements
At each six month interval the patient was asked if they codd perform the following
physical movements:
1.2.3.4,5.6.7.8.9.10.11.12.13.14.15.16.17.
LiftingBendingReachingcarryingWalkingPushingPallingSittingsquattingheelingStandingPetilingTwistingPinchingOraspingClimbingOther
For each question the patient was awarded a score of Oif they codd perform the movement
and a score of 1 if they codd not. The resdting scores for the seventeen questions were
totiled to give an initial physicrd movements score in the range of O to 17.
60

To overcome the
assigned a High
groupings.
problem of having different ranges in
(3), Mediw (2), LOW (1) or None
each group; the initial scores were
(0) score based on the following
,........... Mm (3) MdIM (2) bw (3) None (0)
hxi~ 6-12 3-5 I-2 o
Physid Advitim 7.10 4.6 I-3 o
Physi-1 Movmmu 12-17 6.11 1.s o
The resulting scores were totiled to give a fmd disabili~ score in the range O to 9.
61

AC~O~EDG~NTS
The work described in this report was carried out under contract to the Road Stiety
Division of the Safety and Transportation Department of T.R.R.L. (now T.R.L.). The
collection of the data for the fourth year of
Manchester. Special thanks are due to Mrs.
follow-up was financed by the University Of
Carol Jordan and Ms. Hannah Chambers, the
research sisters on the project and to Mrs. Annette Wells and John Sunter for heir
computing expertise. We codd dso like to thank the Accident and Emergency Department
and Medicd Records staff at Hope Hospiti, North Manchester General Hospiti and
Stockport Infiiary for their invaluable co-operation in
the staff of the Financial Department at Sdford Area
tis study. We are dso grate~ to
Health Authority and the tieater
Manchester Ambdance Service, and to Mrs. Blanche Towers, for her secretarial expetiise.
62