more insurers lower premiums: evidence from initial pricing in the
TRANSCRIPT

MORE INSURERS LOWER PREMIUMS
Evidence from Initial Pricing in the HealthInsurance Marketplaces
l eemore dafnyjonathan gruberc h ristoph er o dy
A B S T R A C TFirst-year insurer participation in the Health Insurance Marketplaces (HIMs) establishedby the Affordable Care Act is limited in many areas of the country. There are 3.9 partic-ipants, on (population-weighted) average, in the 395 ratings areas spanning the 34 stateswith federally facilitated marketplaces (FFMs). Using data on the plans offered in theFFMs, together with predicted market shares for HIM participants (estimated using 2011insurer-state market shares in the individual insurance market), we study the impact ofcompetition on premiums. We exploit variation in ratings-area-level competition inducedby UnitedHealthcare’s decision not to participate in any of the FFMs. We estimate that thesecond-lowest-price silver premium (which is directly linked to federal subsidies) wouldhave decreased by 5.4 percent, on average, had UnitedHealthcare participated. If all insur-ers active in each state’s individual insurance market in 2011 had participated in all ratingsareas in that state’s HIM, we estimate this key premium would be 11.1% lower and 2014federal subsidies would be reduced by $1.7 billion.
K E Y W O R D S : health insurance, insurance market competition, health insurance ex-change, federally facilitated marketplacesJ E L C L A S S I F I C A T I O N : H51, I11, I18, L1
I. Introduction
The Patient Protection and Affordable Care Act (ACA), passed in March 2010 and up-held by the US Supreme Court in June 2012, introduced dramatic reforms to the healthinsurance industry. A number of benefit designs were banned, premium variation waslimited, and online marketplaces for the purchase of insurance were established in everystate. Along with Medicaid expansions and mandates for individuals to purchase and largeemployers to offer coverage, these marketplaces are a key vehicle for expanding insurancecoverage. Federal health insurance subsidies are only available to those who purchase apolicy through Health Insurance Marketplaces (HIMs), formerly known as exchanges.HIMs are intended to promote competition along “beneficial” dimensions (such as
Leemore Dafny (corresponding author, [email protected]), Kellogg School of Man-agement, Northwestern University, and the National Bureau of Economic Research. Jonathan Gru-ber, Massachusetts Institute of Technology and the National Bureau of Economic Research. Christo-pher Ody, Kellogg School of Management, Northwestern University.
C© 2015 American Society of Health Economists and doi:10.1162/ajhe a 00003Massachusetts Institute of Technology American Journal of Health Economics 1(1): 53–81

A M E R I C A N J O U R N A L O F H E A L T H E C O N O M I C S
premiums and quality), while at the same time limiting competition along dimensionsthought to be socially undesirable (such as selection based on the health of enrollees).Whether the federal health reform affordably expands insurance coverage will depend inno small part on the success of HIMs.
The success of HIMs, in turn, will depend on attracting both consumers and in-surers. Competition can only have its salutary effects if there are competitors. Priorto the ACA, health insurance markets were very concentrated. The average stateHerfindahl-Hirschman index (HHI) for the individual insurance market was 4,100 in2011, substantially higher than the Department of Justice’s threshold of 2,500 for “highlyconcentrated.”1 HIMs were designed to lower barriers to entry into the insurance indus-try. By steering a pool of subsidy-eligible consumers to HIMs and mandating that individ-uals carry insurance, policy makers hoped to create enough new demand to allow entrantsto achieve reasonable scale. HIMs also fulfill the role of “certifying” new entrants, whoseplans must satisfy federal standards in order to participate in these regulated marketplaces.This federal stamp of approval serves to increase both consumer and supplier confidencein the quality of entrants, a feat that has proved challenging in recent history. And bydisplaying products online on a centralized website, HIMs reduce marketing, sales, andadministrative costs. In addition, the ACA provided subsidized loans to new, nonprofitinsurance co-operatives known as Consumer Operated and Oriented Plans, or CO-OPs.
In spite of these policies, there was limited participation in HIMs during 2014, theirfirst year of operation (and the only year for which data are presently available). In thediscussion that follows, we focus exclusively on the 34 federally facilitated marketplaces(FFMs), as our identification strategy and data pertain only to this set of marketplaces.Of the 102 top-three insurers in the 34 FFMs, 55 participated in the relevant state HIM.A number of large national insurers, such as Aetna, Cigna, and Humana, participated inonly a limited number of HIMs.2 As we discuss in detail below, the nation’s largest insurer,UnitedHealthcare (hereafter United), did not participate in any of the FFMs. There weresome new entrants, however. Across all FFMs, there were 36 new insurer-state “entries,”where entry is defined as participation by an insurer that did not offer individual insurancein that state in 2011.3 Of these 36, 13 were CO-OPs.4
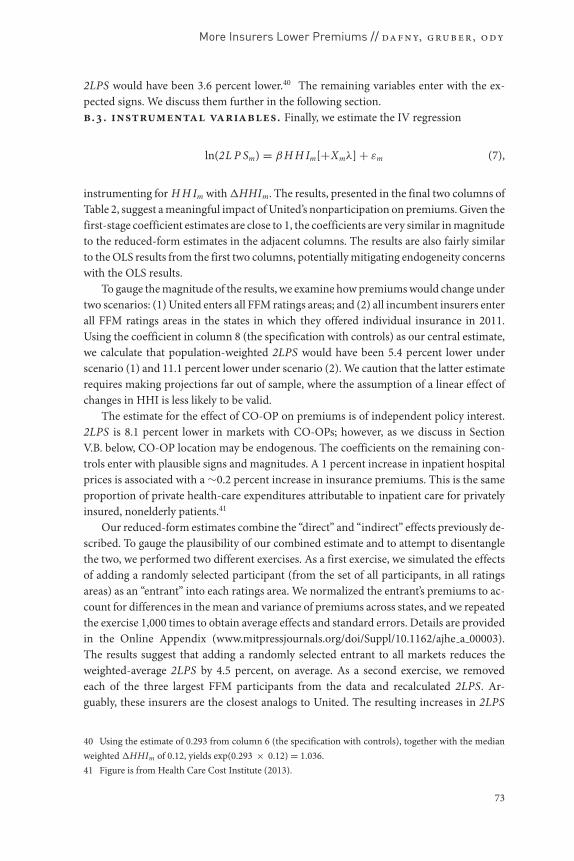
The combination of concentrated pre-HIM markets, substantial nonparticipation inthe HIMs, and limited entry imply highly concentrated marketplaces. Figure 1 gives the
1 Calculated using data from the Center for Consumer Information and Insurance Oversight (CCIIO),described in Section III.2 Our numbers may not match those reported by the Department of Health and Human Services (or othersources) as we attempted to identify plans offered by the same insurer under different names and link themto a single insurer.3 Based on 2011 data, 33 of these 36 had not previously offered individual insurance in any FFM state.Most “entrants” to the individual market are insurers who previously provided Medicaid-managed care in agiven state.4 There are 13 new, federally sponsored CO-OPs operating in 13 of the 34 FFMs. In 2014, each CO-OPoperated in only one state, with three exceptions. First, “CO-OPortunity Health” operates in both Iowaand Nebraska. Second, “Health CO-OPerative SCW” and “Common Ground Healthcare CO-OPerative”operate in Wisconsin.
54
More Insurers Lower Premiums // da fn y, gru ber, o dy
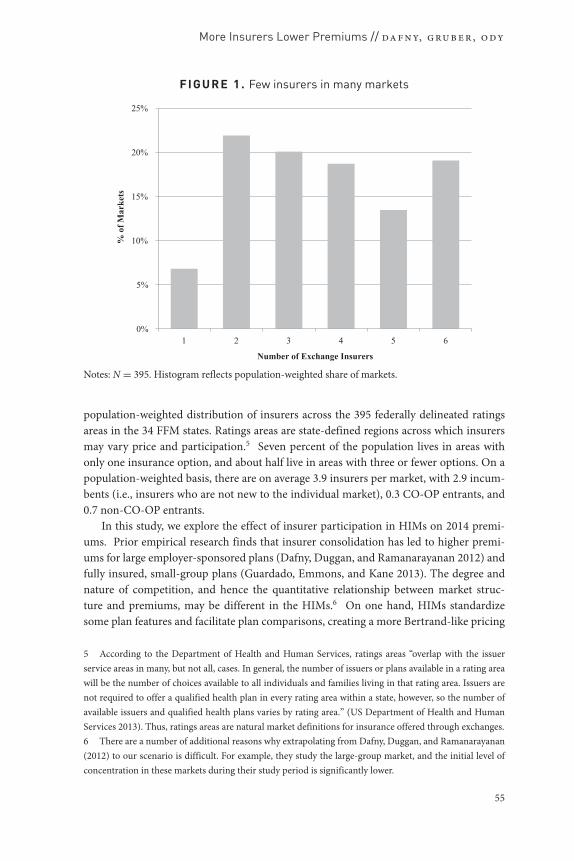
FIGU RE 1. Few insurers in many markets
0%
5%
10%
15%
20%
25%
1 2 3 4 5 6
% o
f Mar
kets
Number of Exchange Insurers
Notes: N = 395. Histogram reflects population-weighted share of markets.
population-weighted distribution of insurers across the 395 federally delineated ratingsareas in the 34 FFM states. Ratings areas are state-defined regions across which insurersmay vary price and participation.5 Seven percent of the population lives in areas withonly one insurance option, and about half live in areas with three or fewer options. On apopulation-weighted basis, there are on average 3.9 insurers per market, with 2.9 incum-bents (i.e., insurers who are not new to the individual market), 0.3 CO-OP entrants, and0.7 non-CO-OP entrants.
In this study, we explore the effect of insurer participation in HIMs on 2014 premi-ums. Prior empirical research finds that insurer consolidation has led to higher premi-ums for large employer-sponsored plans (Dafny, Duggan, and Ramanarayanan 2012) andfully insured, small-group plans (Guardado, Emmons, and Kane 2013). The degree andnature of competition, and hence the quantitative relationship between market struc-ture and premiums, may be different in the HIMs.6 On one hand, HIMs standardizesome plan features and facilitate plan comparisons, creating a more Bertrand-like pricing
5 According to the Department of Health and Human Services, ratings areas “overlap with the issuerservice areas in many, but not all, cases. In general, the number of issuers or plans available in a rating areawill be the number of choices available to all individuals and families living in that rating area. Issuers arenot required to offer a qualified health plan in every rating area within a state, however, so the number ofavailable issuers and qualified health plans varies by rating area.” (US Department of Health and HumanServices 2013). Thus, ratings areas are natural market definitions for insurance offered through exchanges.6 There are a number of additional reasons why extrapolating from Dafny, Duggan, and Ramanarayanan(2012) to our scenario is difficult. For example, they study the large-group market, and the initial level ofconcentration in these markets during their study period is significantly lower.
55
A M E R I C A N J O U R N A L O F H E A L T H E C O N O M I C S
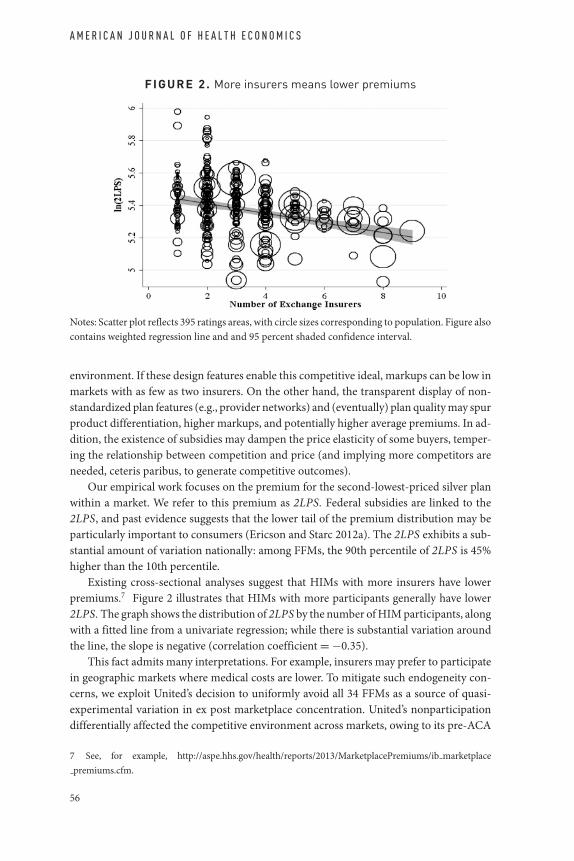
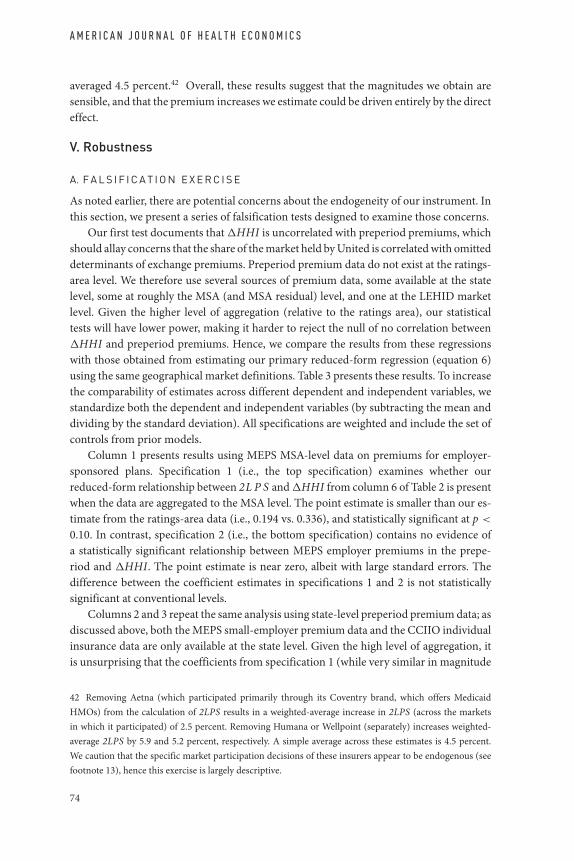
FI G URE 2. More insurers means lower premiums
Notes: Scatter plot reflects 395 ratings areas, with circle sizes corresponding to population. Figure alsocontains weighted regression line and and 95 percent shaded confidence interval.
environment. If these design features enable this competitive ideal, markups can be low inmarkets with as few as two insurers. On the other hand, the transparent display of non-standardized plan features (e.g., provider networks) and (eventually) plan quality may spurproduct differentiation, higher markups, and potentially higher average premiums. In ad-dition, the existence of subsidies may dampen the price elasticity of some buyers, temper-ing the relationship between competition and price (and implying more competitors areneeded, ceteris paribus, to generate competitive outcomes).
Our empirical work focuses on the premium for the second-lowest-priced silver planwithin a market. We refer to this premium as 2LPS. Federal subsidies are linked to the2LPS, and past evidence suggests that the lower tail of the premium distribution may beparticularly important to consumers (Ericson and Starc 2012a). The 2LPS exhibits a sub-stantial amount of variation nationally: among FFMs, the 90th percentile of 2LPS is 45%higher than the 10th percentile.
Existing cross-sectional analyses suggest that HIMs with more insurers have lowerpremiums.7 Figure 2 illustrates that HIMs with more participants generally have lower2LPS. The graph shows the distribution of 2LPS by the number of HIM participants, alongwith a fitted line from a univariate regression; while there is substantial variation aroundthe line, the slope is negative (correlation coefficient = −0.35).
This fact admits many interpretations. For example, insurers may prefer to participatein geographic markets where medical costs are lower. To mitigate such endogeneity con-cerns, we exploit United’s decision to uniformly avoid all 34 FFMs as a source of quasi-experimental variation in ex post marketplace concentration. United’s nonparticipationdifferentially affected the competitive environment across markets, owing to its pre-ACA
7 See, for example, http://aspe.hhs.gov/health/reports/2013/MarketplacePremiums/ib marketplacepremiums.cfm.
56
More Insurers Lower Premiums // da fn y, gru ber, o dy
premium and product characteristics as well as the participation decisions, premiums, andproduct characteristics of rivals. It is also a policy-relevant source of variation, as insur-ers similar to United are likely marginal nonparticipants: if expected profits for insurersincrease, large insurers who shunned the HIMS are likely to enter.
We construct a measure of the change in market concentration resulting from United’sdecision to avoid FFMs. We then model 2LPS across ratings areas as a function of this mea-sure. We find that premiums are highest in markets where United’s participation wouldhave most reduced concentration. Our findings are robust to a wide variety of specificationchecks.
We estimate that the population-weighted average 2LPS would have been 5.4 percentlower had United entered all markets in the FFMs. If all insurers present in a state’s indi-vidual market in 2011 had entered the FFMs, we estimate that the weighted average 2LPSin the FFMs would have been 11.1 percent lower. We also find that 2LPS is lower in mar-kets with CO-OPs, although we caution against a causal interpretation of this associationdue to the potential endogeneity of CO-OP locations.
These results suggest that additional competitors can have a large impact on premiumsand federal subsidies for HIM plans. Spiro and Gruber (2013) estimate that each 1 percentreduction in 2LPS reduces federal subsidies by 1.25 percent. Back-of-the-envelope calcu-lations imply that attracting all incumbents to insurance markets would save an estimated$1.7 billion in federal subsidies in 2014, and $105.2 billion over the 2014–23 ten-yearhorizon, under the (admittedly strong) assumptions that our findings are generalizableto state-based HIMs and that market structures do not change.
The remainder of the paper proceeds as follows. Section II provides background onthe health insurance marketplaces, United’s nonparticipation decision, and prior researchon competition among health insurers. Section III describes the construction of our dataset and discusses summary statistics. Section IV presents the main analysis. Section V pro-vides a falsification check of the results by examining the relationship between pre-HIMindividual market premiums and the instrument for HIM HHI. We also discuss robust-ness of the findings to alternative specifications. Section VI concludes.
II. Background
A. H E A L T H I N S U R A N C E M A R K E T P L A C E S
HIMs are regulated online marketplaces for the purchase of health insurance. In this pa-per, we study HIMs for individual policies.8 The ACA gave states three options withrespect to the development of their HIMs: (1) design and manage their own (so-called“state-based” marketplaces)—selected by 16 states and DC; (2) let the federal govern-ment design and operate the marketplace—selected by 27 states; (3) pursue a hybrid ap-proach (“state–federal partnership” marketplace)—selected by 7 states. Options (2) and (3)
8 HIMs for small-group policies exist—and are known by the acronym SHOP for the Small Health OptionsProgram—but as of this writing they do not yet comply with many requirements included in the ACA.Premium and other data on SHOP plans are not readily available.
57
A M E R I C A N J O U R N A L O F H E A L T H E C O N O M I C S
together comprise the federally facilitated marketplaces (FFMs). All HIMs became avail-able as of October 1, 2013, for individuals to purchase coverage effective in January 2014.
The broad design of an HIM is the same in every state. Five tiers of products are of-fered. The first tier consists of “catastrophic” high-deductible plans offered primarily tothose under age 30.9 The four remaining tiers are categorized by “actuarial value” (AV),defined as the share of health-care spending that an insurance plan pays for a typical en-rollee. These tiers are identified by precious metals (AV thresholds): bronze (0.6); silver(0.7); gold (0.8); and platinum (0.9). The ACA requires all products sold on or off the HIMsin the individual and small-group markets to conform to one of these tiers. In addition,all plans in these markets must satisfy federal standards regarding “essential health ben-efits.” Essential health benefits include coverage of a specified set of services, restrictionson benefits limitations (such as annual spending limits), and a maximum out-of-pocketexposure for enrollees of $6,350 (single)/$12,700 (family).
Subject to this standardization, insurers have wide latitude to design their products inalmost all states. For example, insurers may adjust features of patient out-of-pocket costsin any way that satisfies the AV standard for a plan’s metal tier. Insurers can offer any plandesign that is within 2 percent of the actuarial-value target, as long as essential benefits arecovered. Insurers may also compete on network design, subject to broad restrictions onnetwork adequacy. The resulting variation across plans is meaningful. On the pre-ACAMassachusetts exchange, which standardized benefits to a greater degree than required bythe ACA, the most expensive plan within a standardized benefits tier (and for a specific zipcode–age combination) was 50 percent more expensive than the cheapest plan (Ericsonand Starc 2013).
Plans on the HIMs set their own premiums. While there is no explicit premium reg-ulation, there is regulation on the plan Medical Loss Ratio (MLR), the ratio of medicalbenefits paid out to premiums collected. MLRs must exceed 80 percent in the individualand small-group market and 85 percent in the large-group market, which places limitson the ability of firms to make large profits. In addition, premiums are community-rated,varying only by ratings area, family composition, tobacco use, and age, with a maximum3:1 ratio of the premiums for the oldest:youngest enrollee.
All plans on an HIM must successfully complete the HIM’s “plan certification process.”The process is uniform across FFMs and is described through public announcements bythe Centers for Medicare and Medicaid Services.10 Each plan must be certified as “quali-fied health plan” (QHP) in the relevant state. QHPs must satisfy a set of standards regard-ing licensure, service areas, network adequacy, and patient safety. They must also undergoa review of rates. States may review QHP applications and provide recommendations toCMS regarding certification.
Individuals in the HIMs will in most cases be purchasing insurance products using afederal tax subsidy. The ACA provides that households with income between 100 percent
9 The catastrophic plan is also available to individuals who do not have the option to purchase insurancebelow the mandate affordability threshold of 8 percent of income.10 For 2015, this notice is available at http://www.cms.gov/CCIIO/Resources/Regulations-and-Guidance/Downloads/2015-final-issuer-letter-3-14-2014.pdf.
58

More Insurers Lower Premiums // da fn y, gru ber, o dy
and 400 percent of the federal poverty line may access tax credits to offset some of theirpremiums. These tax credits offset the difference between premiums and a sliding-scalepercentage of income, beginning at 2 percent of income for households with income equalto 100 percent of the poverty line and rising to 9.5 percent of income between 300 percentand 400 percent of the poverty line. In some states, a federally funded Medicaid expansioncovers all those below 133 percent of the poverty line, so HIM participation starts at thathigher level; in states without Medicaid expansions, eligibility for HIM subsidies begins at100 percent of the poverty line. An estimated 4.8 million individuals have income belowthe federal poverty line and are ineligible for subsidies and Medicaid.11
B. U N I T E D ’ S N O N P A R T I C I P A T I O N
A standard difficulty with any study assessing the impact of market concentration on priceis the endogeneity of market participation and market shares. In this setting, one concernwith regressing HIM premiums on market concentration arises from the possibility thatparticipation decisions (whether by incumbents or de novo entrants) may have been af-fected by expectations about market premiums. Many of the large national insurers, suchas Aetna, Humana, and Cigna, selectively entered the HIMs. For example, Aetna entered16 of 34 FFMs.12
One exception is United, the nation’s largest commercial insurer. Once a mid-size regional insurer, United now has a national footprint, achieved largely throughacquisitions.13 Its market share varies widely across states, with no consistent geographicpattern. In the individual insurance market, these shares range from less than 1 percent inMontana, North and South Dakota, New Hampshire, Maine, and Utah to over 20 percentin South Carolina, Missouri, West Virginia, and Arizona.
The variation in United’s pre-HIM market position implies that its blanket nonpar-ticipation decision (discussed below) differentially affected the competitive landscape ofeach market. United’s decision not to enter could affect 2LPS through two mechanisms:(1) a “direct effect” arising from the possibility that United could have offered one of thetwo lowest-priced silver plans in a given market; and/or (2) an “indirect effect” due torivals’ strategically lowering their premiums to compete with United. We expect both ef-fects to be larger in areas where United would have been a more significant competitoron the HIMs. In areas where United had higher pre-HIM market share in the individualinsurance market, we can infer that its combination of premium and product attributeswas relatively attractive. Thus, its decision to stay out of the market ought to have softenedcompetition more considerably in these markets (the indirect effect). If United’s premium
11 Source: “The Coverage Gap: Uninsured Poor Adults in States that Do Not Expand Medicaid,”Kaiser Family Foundation Issue Brief, March 2014. http://kaiserfamilyfoundation.files.wordpress.com/2014/04/8505-the-coverage-gap uninsured-poor-adults-in-states-that-do-not-expand-medicaid.pdf.12 These entry decisions are nonrandom. For example, Aetna’s pre-exchange individual market share (per2011 CCIIO data, described below) was more than twice as high in the markets it entered as compared tothose it did not. Note that Aetna participates on seven exchanges using the Aetna brand name. In most otherexchanges, it offers plans under the brand name of Coventry, which it acquired in 2013.13 Major plan acquisitions in the past decade include Oxford and Mid Atlantic Medical Services (MAMSI)in 2004, PacifiCare in 2005, Sierra in 2008, and parts of HealthNet in 2009.
59
A M E R I C A N J O U R N A L O F H E A L T H E C O N O M I C S
tended to be on the low side in these markets as well, all else equal we would also expectthe direct effect to be larger in these areas. Our data on pre-HIM individual market pre-miums (described in Section III below) confirm that United’s relative rates are lower instates in which they have a larger presence.14
Note that if United’s decision not to participate in a market provoked others who wouldnot otherwise have participated to do so—and if this is particularly likely where Unitedhad high pre-HIM share because the market opportunity is more substantial—then ourestimated effects will be downward-biased. Given the long application process associatedwith participating in the first-generation FFMs, we believe this bias is likely to be small.For the same reason, the indirect effect may also be low in the first year of the HIM oper-ations, as rivals may not have had ample time to adjust their premiums in light of United’snonparticipation decision.
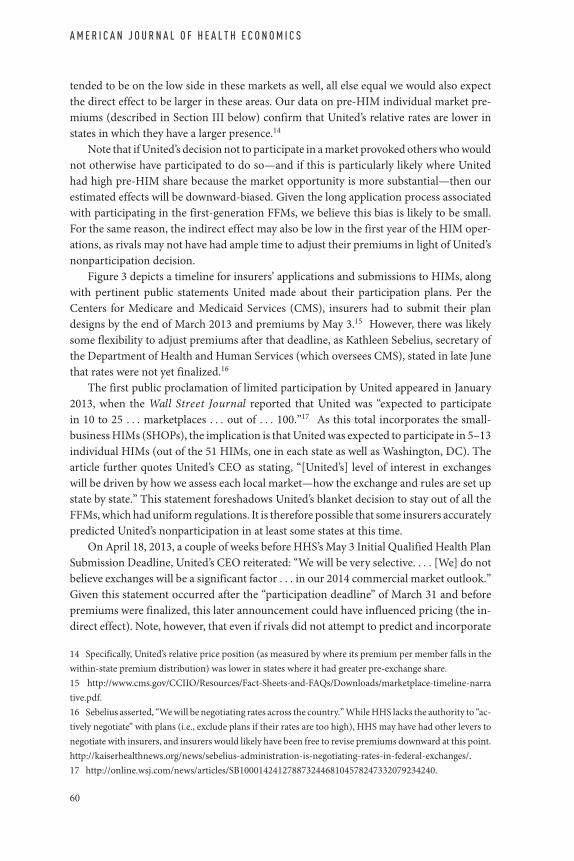
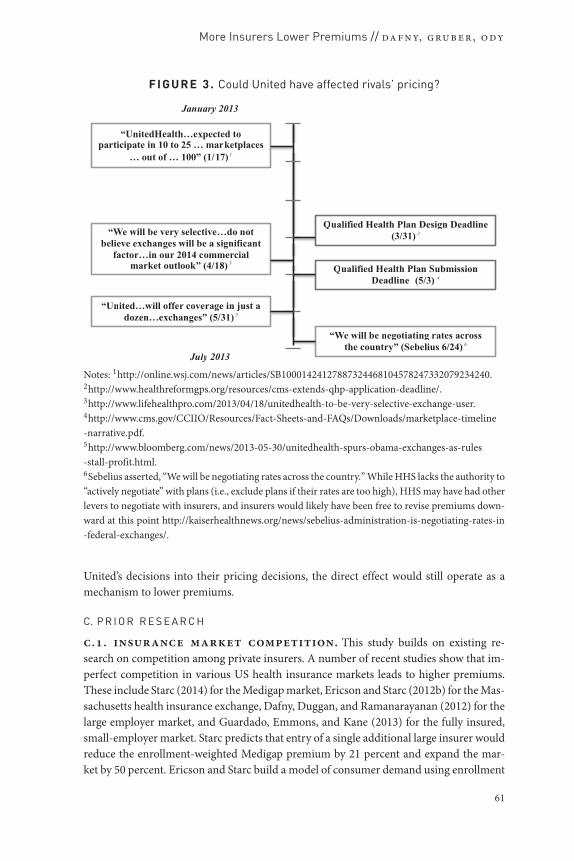
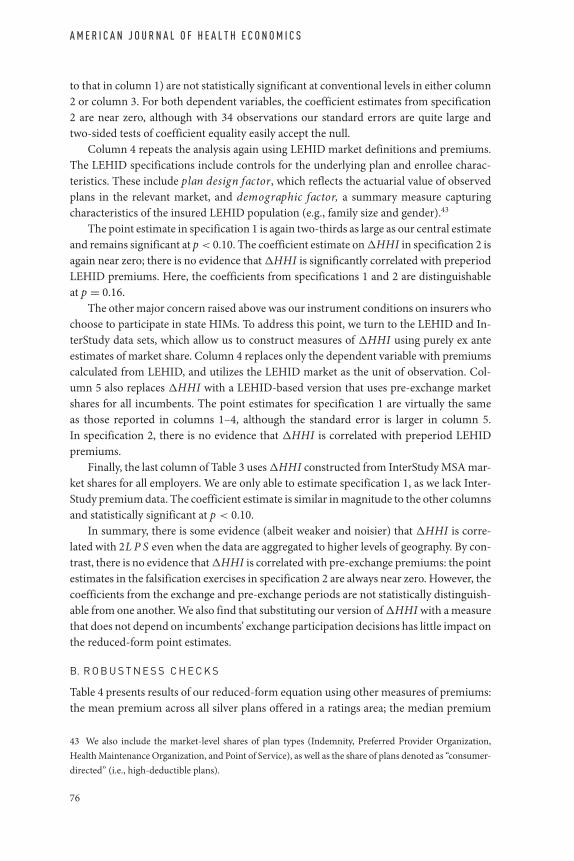
Figure 3 depicts a timeline for insurers’ applications and submissions to HIMs, alongwith pertinent public statements United made about their participation plans. Per theCenters for Medicare and Medicaid Services (CMS), insurers had to submit their plandesigns by the end of March 2013 and premiums by May 3.15 However, there was likelysome flexibility to adjust premiums after that deadline, as Kathleen Sebelius, secretary ofthe Department of Health and Human Services (which oversees CMS), stated in late Junethat rates were not yet finalized.16
The first public proclamation of limited participation by United appeared in January2013, when the Wall Street Journal reported that United was “expected to participatein 10 to 25 . . . marketplaces . . . out of . . . 100.”17 As this total incorporates the small-business HIMs (SHOPs), the implication is that United was expected to participate in 5–13individual HIMs (out of the 51 HIMs, one in each state as well as Washington, DC). Thearticle further quotes United’s CEO as stating, “[United’s] level of interest in exchangeswill be driven by how we assess each local market—how the exchange and rules are set upstate by state.” This statement foreshadows United’s blanket decision to stay out of all theFFMs, which had uniform regulations. It is therefore possible that some insurers accuratelypredicted United’s nonparticipation in at least some states at this time.
On April 18, 2013, a couple of weeks before HHS’s May 3 Initial Qualified Health PlanSubmission Deadline, United’s CEO reiterated: “We will be very selective. . . . [We] do notbelieve exchanges will be a significant factor . . . in our 2014 commercial market outlook.”Given this statement occurred after the “participation deadline” of March 31 and beforepremiums were finalized, this later announcement could have influenced pricing (the in-direct effect). Note, however, that even if rivals did not attempt to predict and incorporate
14 Specifically, United’s relative price position (as measured by where its premium per member falls in thewithin-state premium distribution) was lower in states where it had greater pre-exchange share.15 http://www.cms.gov/CCIIO/Resources/Fact-Sheets-and-FAQs/Downloads/marketplace-timeline-narrative.pdf.16 Sebelius asserted, “We will be negotiating rates across the country.” While HHS lacks the authority to “ac-tively negotiate” with plans (i.e., exclude plans if their rates are too high), HHS may have had other levers tonegotiate with insurers, and insurers would likely have been free to revise premiums downward at this point.http://kaiserhealthnews.org/news/sebelius-administration-is-negotiating-rates-in-federal-exchanges/.17 http://online.wsj.com/news/articles/SB10001424127887324468104578247332079234240.
60
More Insurers Lower Premiums // da fn y, gru ber, o dy
FI GURE 3. Could United have affected rivals’ pricing?
Notes: 1http://online.wsj.com/news/articles/SB10001424127887324468104578247332079234240.2http://www.healthreformgps.org/resources/cms-extends-qhp-application-deadline/.3http://www.lifehealthpro.com/2013/04/18/unitedhealth-to-be-very-selective-exchange-user.4http://www.cms.gov/CCIIO/Resources/Fact-Sheets-and-FAQs/Downloads/marketplace-timeline-narrative.pdf.5http://www.bloomberg.com/news/2013-05-30/unitedhealth-spurs-obama-exchanges-as-rules-stall-profit.html.6Sebelius asserted, “We will be negotiating rates across the country.” While HHS lacks the authority to“actively negotiate” with plans (i.e., exclude plans if their rates are too high), HHS may have had otherlevers to negotiate with insurers, and insurers would likely have been free to revise premiums down-ward at this point http://kaiserhealthnews.org/news/sebelius-administration-is-negotiating-rates-in-federal-exchanges/.
United’s decisions into their pricing decisions, the direct effect would still operate as amechanism to lower premiums.
C. P R I O R R E S E A R C H
c.. insurance market competition. This study builds on existing re-search on competition among private insurers. A number of recent studies show that im-perfect competition in various US health insurance markets leads to higher premiums.These include Starc (2014) for the Medigap market, Ericson and Starc (2012b) for the Mas-sachusetts health insurance exchange, Dafny, Duggan, and Ramanarayanan (2012) for thelarge employer market, and Guardado, Emmons, and Kane (2013) for the fully insured,small-employer market. Starc predicts that entry of a single additional large insurer wouldreduce the enrollment-weighted Medigap premium by 21 percent and expand the mar-ket by 50 percent. Ericson and Starc build a model of consumer demand using enrollment
61

A M E R I C A N J O U R N A L O F H E A L T H E C O N O M I C S
data from the Massachusetts health insurance exchange and simulate optimal insurer pric-ing under alternative competitive scenarios. They find that pricing exceeds the levels pre-dicted under perfect competition. Dafny, Duggan, and Ramanarayanan (2012) quantifythe impact of market concentration (as measured by HHI) on premium growth in thelarge-group segment, instrumenting for concentration using the predicted change in localmarket HHI generated by a large, national merger in 1999. This merger had varying im-pacts on local markets owing to differences in the market shares and geographic overlapof the merging firms. They estimate premiums in the average market were approximately7 percentage points higher by 2007 due to increases in local concentration between 1998and 2006. Finally, Guardado, Emmons, and Kane (2013) use data on small-group pre-miums at the Metropolitan Statistical Area (MSA) carrier level to study the impact of a2008 merger between Nevada’s first and third-largest insurance carriers, United and SierraHealth Services. As compared to plans in control MSAs (matched to the treatment MSAsusing propensity scores), metropolitan areas affected by the merger experienced premiumincreases of 13.7 percent.
Our instrument is similar in spirit to that used by Dafny, Duggan, and Ramanarayanan(2012). We exploit variation in the local impact of United’s national nonparticipation deci-sion to identify the effect of exchange market concentration on premiums. Whereas Dafny,Duggan, and Ramanarayanan (2012) study the effect of HHI on premium growth, we haveonly one year of data and hence focus on premium levels. Our point estimates are roughlyone-third the size of those reported by Dafny, Duggan, and Ramanarayanan (2012). Be-cause their estimate captures the cumulative impact of changes in HHI over time, it isunsurprising that we find a smaller single-year effect.c.. exchange research. As HIMs are a recent phenomenon, there is a limitedamount of relevant prior research. We briefly discuss the literature on the three most directpredecessors to HIMs: the Massachussetts Connector exchange, Medicare Advantage, andMedicare Part D.
There are a number of recent papers examining the Massachusetts Health Connec-tor, an exchange established by the 2006 health-care reforms in Massachusetts. In a seriesof papers, Ericson and Starc study (1) how changes in the degree of plan standardizationrequired by the exchange affected consumer choice, plans offered, and pricing (Ericsonand Starc 2013), (2) what types of plans consumers choose (20 percent select the cheapestoption; Ericson and Starc 2012a), and (3) the interaction between age-specific consumerprice elasticities, imperfect competition, and modified community rating (Ericson andStarc 2012b). Hackmann, Kolstad, and Kowalski (2013) report that average costs and pre-miums per insured individual in Massachusetts decreased following the imposition of themandate to carry insurance coverage, confirming adverse selection into the state’s indi-vidual insurance market prior to 2006.
Another predecessor of HIMs is the market for privately provided Medicare plans,known today as “Medicare Advantage.” Like HIMs, competition among plans can af-fect prices and subsidies. Unlike HIMs, market participants compete against traditionalMedicare, and often use the same provider reimbursement rates as traditional Medicare.Medicare Advantage premiums (after subsidies, which all Medicare eligible enjoy) can-not fall below zero. In addition, profit margins are restricted. Thus, plans may provide
62

More Insurers Lower Premiums // da fn y, gru ber, o dy
beneficiaries with additional benefits beyond those offered in traditional Medicare. Ofgreatest relevance to our work, a growing body of evidence suggests that Medicare Ad-vantage markets are imperfectly competitive, with a large share of increases in governmentsubsidies accruing to providers, rather than being competed away through more generousenrollee benefits. (See, for example, Song, Landrum, and Chernew 2012; Song, Landrum,and Chernew 2013; Cabral, Geruso, and Mahoney 2013; and Duggan, Starc, and Vabson2014.)
There is a substantial and growing body of literature on Medicare Part D, a marketplacewith many similarities to the HIMs. In both settings, the government subsidizes purchasesand creates rules to manage how competition among firms takes place. This literaturefocuses heavily on whether enrollees make good choices, how limitations in consumerdecision-making affect firm behavior, and how alternative choice architecture could im-prove consumer welfare. (See, for example, Abaluck and Gruber 2011, 2013; Ericson 2014;Ketcham et al. 2012; Kling et al. 2012; Lucarelli, Prince, and Simon 2012; Zhou and Zhang2012; and Heiss et al. 2012.) Overall, the Medicare Part D literature suggests that even withrobust entry, poor optimization by enrollees mitigates the salutary effects of competition.
III. Data and Methodology
We draw on a number of sources to create a data set of plans offered in the 395 ratingsareas (across 34 FFMs), along with measures of ratings-area-level market structure and lo-cal health spending. Because United’s nonparticipation decision was uniform only acrossFFMs, we limit attention to these. We also construct a data set of enrollment and premiumsat various units of geography, depending on the source.
A. K E Y D E P E N D E N T A N D I N D E P E N D E N T V A R I A B L E S
Data on plans were downloaded from the healthcare.gov website.18 The plan data con-tains insurer identifiers, plan metal tier, ratings areas in which a plan is offered, andpremiums for a 27-year-old. Our key dependent variable, 2LPS, is the premium for thesecond-lowest-price silver plan in a ratings area. Plan premiums for other ages and familystructures are a constant percentage of the 27-year-old single premium.19
We focus on the 2LPS for two reasons. First, federal subsidies are linked to the 2LPSin each “ratings area,” the geographic market utilized on the HIMs. More specifically, sub-sidies are set so that 2LPS minus the subsidy is no more than x percent of income, where xranges between 2 and 9.5 and increases with income as described in Section II. Those withhousehold incomes above 400 percent of the federal poverty line are not eligible for subsi-dies. Recently released enrollment data from the FFMs shows that 85 percent of enrolleesin 2014 received government subsidies.20 The Congressional Budget Office projects that76 percent of HIM enrollees in 2020 will receive subsidies, accounting for $93 billion of
18 Source: https://www.healthcare.gov/health-plan-information.19 States had the opportunity to design their own state-specific age curves for defining how premiumswould vary by age. None in our sample did so.20 http://aspe.hhs.gov/health/reports/2014/MarketPlaceEnrollment/Apr2014/excel/workbook.xls.
63
A M E R I C A N J O U R N A L O F H E A L T H E C O N O M I C S
the $197 billion estimated cost of ACA’s coverage expansions.21 Thus, 2LPS is a key driverof the overall costs of the ACA.
Second, there is evidence that the lower segment of the premium distribution is par-ticularly important to consumers. As noted above, Ericson and Starc (2012a) report thata substantial number of consumers who purchased insurance on the Massachusetts ex-change in 2007–09 selected the least expensive plan. In 2014, 65 percent of FFM enrolleeschose a silver plan, and 20 percent chose bronze plans.22 More pragmatically, given thenumber of plans, and our inability to judge which of these will prove relevant in eachmarketplace, a measure like the mean or median is less informative. For completeness,however, we also report results using such measures.
Our key independent variable for measuring competition is H H I , a predictedHerfindahl-Hirschman index. Because the market is new, we must predict market sharesin order to compute a predicted HHI. To do so, we match insurers appearing in the FFMdata with state-insurer enrollment data (in the individual insurance market) for 2011.These data are collected and reported by the Center for Consumer Information and In-surance Oversight (CCIIO) for the purpose of enforcing the MLR regulations.
For insurer i in ratings area m, we define s har eim as its share among those insurerswho are active within that ratings area in the exchange, under the assumption that insur-ers split the market proportionally to their ex ante (i.e., 2011) state shares. Based on thelimited empirical evidence available, it appears that pre-exchange shares are highly corre-lated with exchange shares.23 This methodology gives new entrants a share of zero. (InSection V.B., we discuss the robustness of our results to alternative share allocationsfor entrants.) Denoting the set of insurers in market m as Im, we construct H H Im =∑
i∈I m s har eim.Next, we construct �HHI, the change in HHI resulting from United’s nonpartici-
pation. The predicted share of each insurer had United entered the market is denoteds har eU
im, and the predicted HHI is H H I Um . United’s share had it entered the FFMs is
s har eUUHC m. Note that for all insurers other than United, s har eim = s har eU
im1−s har eU
UHC m.The in-
crease in HHI from United’s nonparticipation can then be expressed as
�HHIm = H H Im − H H I Um (1);
�HHIm =∑i∈Im
(s har eU
im
1 − s har eUUHC m
)2
−(∑
i∈Im
(s har eU
im
)2 + (s har eU
UHC m
)2)
(2).
21 http://www.cbo.gov/sites/default/files/cbofiles/attachments/45231-ACA Estimates.pdf.22 Ibid. 15 percent chose catastrophic, gold, or platinum plans.23 Emerging evidence on exchange enrollment suggests that pre-exchange shares are good indicators ofexchange shares. The Huffington Post collected enrollment data for eight states (CA, CT, MA, MN, NV, NY,RI, WA). Using their reported data (which excludes some small players) for states other than MA (which hadan exchange prior to 2011), we calculated predicted exchange market shares using 2011 CCIIO data (andexcluding United). Insurers that entered in 2014 but were not present in 2011 are assigned a share of 0 in2011. Insurers present in 2011 but not participating in the exchanges are excluded. The correlation betweenour predicted shares and the actual 2014 shares was 0.63. (Data source: http://www.huffingtonpost.com/2014/01/27/health-insurance-obamacare n 4661164.html.)
64
More Insurers Lower Premiums // da fn y, gru ber, o dy
The effect of increasing United’s share on �HHIm is
∂�HHIm
∂s har eUUHC m
= 2[H H Im − s har eUUHC m H H Im − s har eU
UHC m] (3).
This expression shows that, theoretically, United’s nonparticipation has a nonmonotoniceffect on �HHI. If United is very large and its competitors are all small, �HHI will de-crease in s har eU
UHC m and can even become negative. As a practical matter, �HHI in ourdata is almost always increasing in United’s share, and is only negative for one observation.We censor this observation at zero in our main results; dropping it has little impact on thefindings.
An alternative to �HHI is United’s pre-exchange share. The advantage of using HHI isthat it captures the relative importance of United’s rivals: a 10 percent United share mattersmore in a market with just one rival (�HHI = 1, 800) than in a market with, say, threeequally sized rivals (each with pre-exchange market share of 30 percent, yielding �HHI =533). As a robustness check, however, we also examine results using United’s pre-exchangeshare in place of �HHI.
B. A D D I T I O N A L C O N T R O L S
We supplement our data set with a number of controls that may affect health-care costs,insurance preferences, or the competitive environment in a ratings area. The first of thesemeasures is hospital price, constructed using 2007–09 hospital-level data from the Cen-ters for Medicare and Medicaid Services’ Healthcare Cost Report Information System(HCRIS) data set.24 Hospitals account for roughly one-third of spending by private in-surance plans, hence hospital prices are a significant determinant of premiums. We followthe methodology in Dafny (2009), which calculates price as the net inpatient revenue percase-mix adjusted, non-Medicare admission.25 Although it would be preferable to excludeMedicaid admissions from this price measure, as hospitals are paid largely fixed rates forthese patients, the HCRIS data on Medicaid revenues are exceedingly noisy.
Per Dafny and Ramanarayanan (2012), nonprofits with significant market sharecharge lower premiums, ceteris paribus, than for-profits. We control for this by includingthe expected market share of nonprofit insurers, share NFP, using the same methodologyto assign shares that we used to calculate HHI. We account separately for the presenceof a nonprofit CO-OP using a dummy variable (which varies at the ratings-area level).26
Both share NFP and CO-OP are likely to be endogenous. However, the similarity of the
24 Cost Report estimates for hospital prices shift from year to year. For example, the non-Medicareadmission-weighted correlation in prices for facilities in 2007 and 2009 is 0.73. We therefore pool threeyears (deflating to a common year using the CPI) to improve the precision of our estimates.25 We use each hospital’s Medicare Case-Mix Index (CMI) to adjust for admissions severity; non-MedicareCMI is not reported. Critical Access Hospitals and other hospitals not paid under Medicare’s ProspectivePayment System are excluded from the sample.26 Our methodology assigns zero share to entrants, hence the need for a separate variable. In addition,nonprofit CO-OPs are of independent interest as they are new entrants partially funded by governmentloans.
65
A M E R I C A N J O U R N A L O F H E A L T H E C O N O M I C S
results with and without controls tempers concerns that their inclusion biases the effect ofinterest (i.e., how competition affects price).
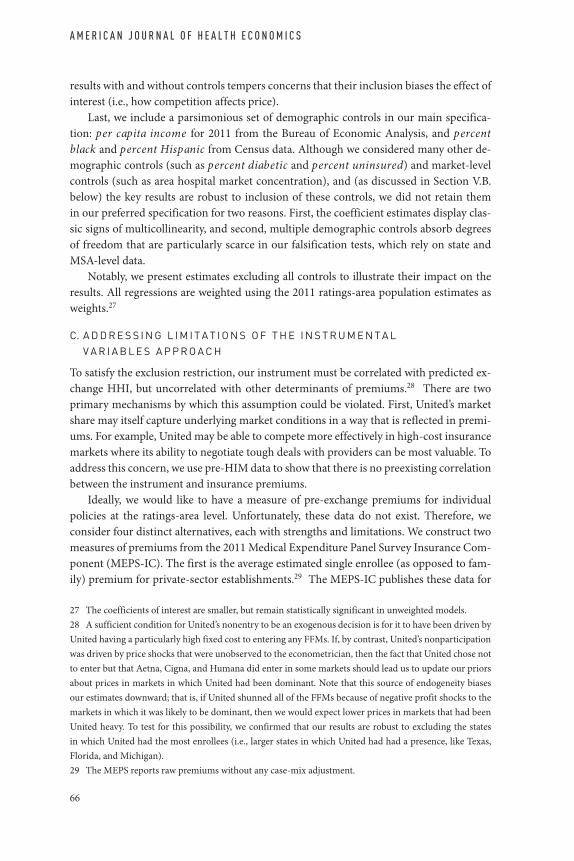
Last, we include a parsimonious set of demographic controls in our main specifica-tion: per capita income for 2011 from the Bureau of Economic Analysis, and percentblack and percent Hispanic from Census data. Although we considered many other de-mographic controls (such as percent diabetic and percent uninsured) and market-levelcontrols (such as area hospital market concentration), and (as discussed in Section V.B.below) the key results are robust to inclusion of these controls, we did not retain themin our preferred specification for two reasons. First, the coefficient estimates display clas-sic signs of multicollinearity, and second, multiple demographic controls absorb degreesof freedom that are particularly scarce in our falsification tests, which rely on state andMSA-level data.
Notably, we present estimates excluding all controls to illustrate their impact on theresults. All regressions are weighted using the 2011 ratings-area population estimates asweights.27
C. A D D R E S S I N G L I M I T A T I O N S O F T H E I N S T R U M E N T A LV A R I A B L E S A P P R O A C H
To satisfy the exclusion restriction, our instrument must be correlated with predicted ex-change HHI, but uncorrelated with other determinants of premiums.28 There are twoprimary mechanisms by which this assumption could be violated. First, United’s marketshare may itself capture underlying market conditions in a way that is reflected in premi-ums. For example, United may be able to compete more effectively in high-cost insurancemarkets where its ability to negotiate tough deals with providers can be most valuable. Toaddress this concern, we use pre-HIM data to show that there is no preexisting correlationbetween the instrument and insurance premiums.
Ideally, we would like to have a measure of pre-exchange premiums for individualpolicies at the ratings-area level. Unfortunately, these data do not exist. Therefore, weconsider four distinct alternatives, each with strengths and limitations. We construct twomeasures of premiums from the 2011 Medical Expenditure Panel Survey Insurance Com-ponent (MEPS-IC). The first is the average estimated single enrollee (as opposed to fam-ily) premium for private-sector establishments.29 The MEPS-IC publishes these data for
27 The coefficients of interest are smaller, but remain statistically significant in unweighted models.28 A sufficient condition for United’s nonentry to be an exogenous decision is for it to have been driven byUnited having a particularly high fixed cost to entering any FFMs. If, by contrast, United’s nonparticipationwas driven by price shocks that were unobserved to the econometrician, then the fact that United chose notto enter but that Aetna, Cigna, and Humana did enter in some markets should lead us to update our priorsabout prices in markets in which United had been dominant. Note that this source of endogeneity biasesour estimates downward; that is, if United shunned all of the FFMs because of negative profit shocks to themarkets in which it was likely to be dominant, then we would expect lower prices in markets that had beenUnited heavy. To test for this possibility, we confirmed that our results are robust to excluding the statesin which United had the most enrollees (i.e., larger states in which United had had a presence, like Texas,Florida, and Michigan).29 The MEPS reports raw premiums without any case-mix adjustment.
66

More Insurers Lower Premiums // da fn y, gru ber, o dy
large MSAs and state “residuals” (i.e., non-MSA areas). Therefore, the strength of thismeasure is that it is available at a relatively fine level of geography; our 34 states contain79 MEPS-IC markets.30 However, employer premiums are imperfectly correlated withindividual-market premiums—in spite of the fact that both reflect local market cost andutilization trends—limiting the value of evidence that employer premiums are uncorre-lated with �HHI (the falsification exercise).31 Hence, we also present results using theaverage estimated single enrollee premium for small employers only, which is more closelylinked to the individual market.32 The limitation of this second measure is that it is onlyavailable at the state level, owing to MEPS-IC confidentiality restrictions.
Our third measure of pre-exchange premiums is the average 2011 individual mar-ket premium by state, as reported by CCIIO. (This source is also used to calculate ourpre-exchange market shares, as described above.) This average premium is available forthe most relevant market segment (the individual market), but only at the state level. Thefourth and final measure of premiums comes from the Large Employer Health InsuranceDataset (LEHID) for 2009, the most recent year for which we have these data. LEHID isa proprietary data set containing information on the health insurance plans (and asso-ciated premiums) offered by a sample of very large employers. The details of these data,as well as their comparability with other sources, are discussed in Dafny (2010). LEHID’smain strengths are that it is available at a relatively disaggregated level of geography (our34 states contain 98 LEHID markets),33 and that it includes a rich set of variables we canuse to control for plan and employee characteristics. However, the data are older and re-flect an even more distant market segment from the individual market than the MEPS-ICall-employer sample.34
A second concern with our identifying assumption is that variation in �HHI comesnot only from variation across states in United’s individual insurance market share, butalso from the decisions of other insurers to participate on the HIMs in each ratings area.This arises from the fact that United’s predicted share for each ratings area is defined as
30 MSAs and ratings areas do not perfectly match. We assign each ratings area to the MSA with the highestshare of the ratings area’s population. We follow the same procedure for assigning ratings areas to LEHIDmarkets.31 Most employer-sponsored plans are self-insured, whereas all individual plans are fully insured. Self- andfully insured plans are subject to different regulations and premium taxes, and market participants may differacross the two segments. For more details, see Dafny, Duggan, and Ramanarayanan (2012). The correlationbetween state-level employer premiums and small-employer premiums in the MEPS is 0.61.32 Most small-group plans are fully insured, and therefore subject to the same regulations as individualpolicies. In addition, state-level regulations regarding community rating (when present) are often the samefor individuals and small groups.33 There are 139 geographic markets defined by LEHID. Most reflect metropolitan areas or nonmetropoli-tan areas within the same state (e.g., Chicago, Northern Illinois except Chicago, Southern Illinois), althougha few cross state boundaries.34 To improve the precision of our estimates for �HHI, we pool LEHID data from 2007–09 and includeboth self- and fully insured enrollees when constructing insurer shares. When constructing LEHID premi-ums, we use only 2009 and only fully insured enrollees, as the fully insured segment is more similar to theindividual market than the self-insured segment. The falsification results are not sensitive to this decision.
67
A M E R I C A N J O U R N A L O F H E A L T H E C O N O M I C S
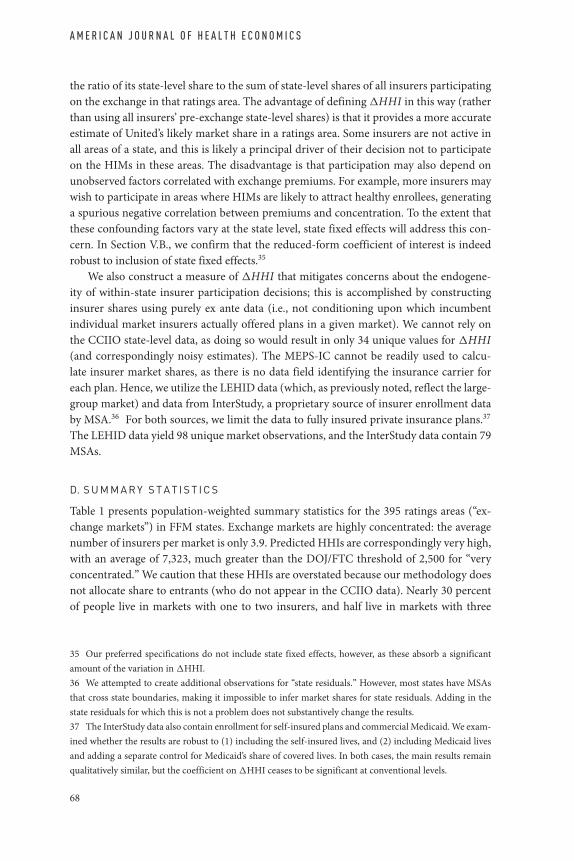
the ratio of its state-level share to the sum of state-level shares of all insurers participatingon the exchange in that ratings area. The advantage of defining �HHI in this way (ratherthan using all insurers’ pre-exchange state-level shares) is that it provides a more accurateestimate of United’s likely market share in a ratings area. Some insurers are not active inall areas of a state, and this is likely a principal driver of their decision not to participateon the HIMs in these areas. The disadvantage is that participation may also depend onunobserved factors correlated with exchange premiums. For example, more insurers maywish to participate in areas where HIMs are likely to attract healthy enrollees, generatinga spurious negative correlation between premiums and concentration. To the extent thatthese confounding factors vary at the state level, state fixed effects will address this con-cern. In Section V.B., we confirm that the reduced-form coefficient of interest is indeedrobust to inclusion of state fixed effects.35
We also construct a measure of �HHI that mitigates concerns about the endogene-ity of within-state insurer participation decisions; this is accomplished by constructinginsurer shares using purely ex ante data (i.e., not conditioning upon which incumbentindividual market insurers actually offered plans in a given market). We cannot rely onthe CCIIO state-level data, as doing so would result in only 34 unique values for �HHI(and correspondingly noisy estimates). The MEPS-IC cannot be readily used to calcu-late insurer market shares, as there is no data field identifying the insurance carrier foreach plan. Hence, we utilize the LEHID data (which, as previously noted, reflect the large-group market) and data from InterStudy, a proprietary source of insurer enrollment databy MSA.36 For both sources, we limit the data to fully insured private insurance plans.37
The LEHID data yield 98 unique market observations, and the InterStudy data contain 79MSAs.
D. S U M M A R Y S T A T I S T I C S
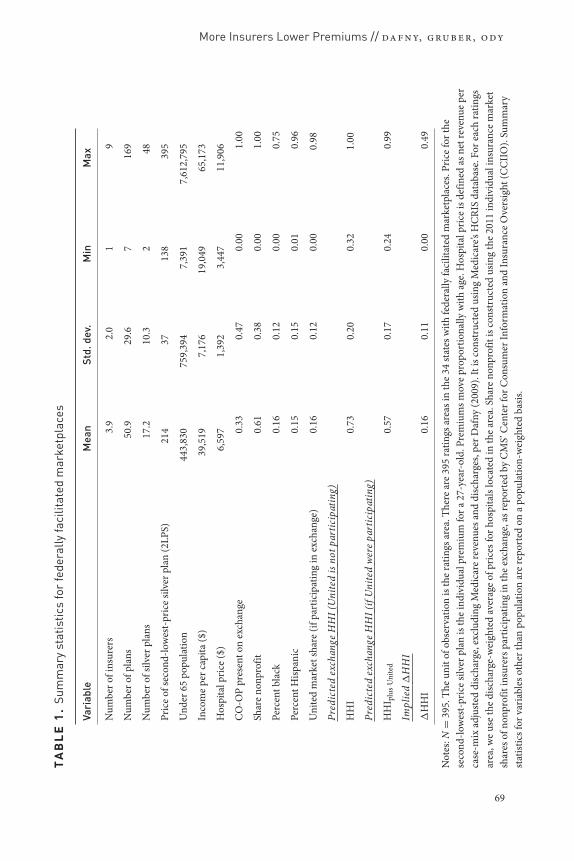
Table 1 presents population-weighted summary statistics for the 395 ratings areas (“ex-change markets”) in FFM states. Exchange markets are highly concentrated: the averagenumber of insurers per market is only 3.9. Predicted HHIs are correspondingly very high,with an average of 7,323, much greater than the DOJ/FTC threshold of 2,500 for “veryconcentrated.” We caution that these HHIs are overstated because our methodology doesnot allocate share to entrants (who do not appear in the CCIIO data). Nearly 30 percentof people live in markets with one to two insurers, and half live in markets with three
35 Our preferred specifications do not include state fixed effects, however, as these absorb a significantamount of the variation in �HHI.36 We attempted to create additional observations for “state residuals.” However, most states have MSAsthat cross state boundaries, making it impossible to infer market shares for state residuals. Adding in thestate residuals for which this is not a problem does not substantively change the results.37 The InterStudy data also contain enrollment for self-insured plans and commercial Medicaid. We exam-ined whether the results are robust to (1) including the self-insured lives, and (2) including Medicaid livesand adding a separate control for Medicaid’s share of covered lives. In both cases, the main results remainqualitatively similar, but the coefficient on �HHI ceases to be significant at conventional levels.
68
More Insurers Lower Premiums // da fn y, gru ber, o dy
TA
BL
E1
.Su
mm
ary
stat
istic
sfo
rfe
dera
llyfa
cilit
ated
mar
ketp
lace
s
Vari
able
Mea
nSt
d.de
v.M
inM
ax
Num
bero
fins
urer
s3.
92.
01
9
Num
bero
fpla
ns50
.929
.67
169
Num
bero
fsilv
erpl
ans
17.2
10.3
248
Pric
eof
seco
nd-lo
wes
t-pr
ice
silve
rpla
n(2
LPS)
214
3713
839
5
Und
er65
popu
latio
n44
3,83
075
9,39
47,
391
7,61
2,79
5
Inco
me
perc
apita
($)
39,5
197,
176
19,0
4965
,173
Hos
pita
lpri
ce($
)6,
597
1,39
23,
447
11,9
06
CO
-OP
pres
ento
nex
chan
ge0.
330.
470.
001.
00
Shar
eno
npro
fit0.
610.
380.
001.
00
Perc
entb
lack
0.16
0.12
0.00
0.75
Perc
entH
ispan
ic0.
150.
150.
010.
96
Uni
ted
mar
kets
hare
(ifpa
rtic
ipat
ing
inex
chan
ge)
0.16
0.12
0.00
0.98
Pred
icte
dex
chan
geH
HI(
Uni
ted
isno
tpar
ticip
atin
g)
HH
I0.
730.
200.
321.
00
Pred
icte
dex
chan
geH
HI(
ifU
nite
dw
ere
part
icip
atin
g)
HH
I plu
sU
nite
d0.
570.
170.
240.
99
Impl
ied
�H
HI
�H
HI
0.16
0.11
0.00
0.49
Not
es:N
=39
5.Th
eun
itof
obse
rvat
ion
isth
era
tings
area
.The
rear
e39
5ra
tings
area
sin
the
34st
ates
with
fede
rally
faci
litat
edm
arke
tpla
ces.
Pric
efo
rthe
seco
nd-lo
wes
t-pr
ice
silve
rpla
nis
the
indi
vidu
alpr
emiu
mfo
ra27
-yea
r-ol
d.Pr
emiu
msm
ove
prop
ortio
nally
with
age.
Hos
pita
lpri
ceis
defin
edas
netr
even
uepe
rca
se-m
ixad
just
eddi
scha
rge,
excl
udin
gM
edic
are
reve
nues
and
disc
harg
es,p
erD
afny
(200
9).I
tisc
onst
ruct
edus
ing
Med
icar
e’sH
CRI
Sda
taba
se.F
orea
chra
tings
area
,we
use
the
disc
harg
e-w
eigh
ted
aver
age
ofpr
ices
forh
ospi
tals
loca
ted
inth
ear
ea.S
hare
nonp
rofit
isco
nstr
ucte
dus
ing
the
2011
indi
vidu
alin
sura
nce
mar
ket
shar
esof
nonp
rofit
insu
rers
part
icip
atin
gin
the
exch
ange
,asr
epor
ted
byC
MS’
Cen
terf
orC
onsu
mer
Info
rmat
ion
and
Insu
ranc
eO
vers
ight
(CC
IIO
).Su
mm
ary
stat
istic
sfor
vari
able
soth
erth
anpo
pula
tion
are
repo
rted
ona
popu
latio
n-w
eigh
ted
basis
.
69
A M E R I C A N J O U R N A L O F H E A L T H E C O N O M I C S
FI GURE 4. Predicted impact of United’s decision
0
10
20
30
40
50
60
70
80
90
100
0 to500
500 to1000
1000 to1500
1500 to2000
2000 to2500
2500 to3000
3000 to3500
3500 to4000
4000 to4500
>4500
Num
ber
of R
atin
gs A
reas
ΔHHI
Population Weighted Average ΔHHI = 1644
Note: N = 395.
or fewer insurers.38 Despite the relatively small number of insurers, most ratings areasfeature a large number of plans: the mean is 50.9 (including all metal tiers), and 17.2 forsilver plans only. The predicted share of nonprofit insurers averages 61 percent. One inthree markets contains a CO-OP.
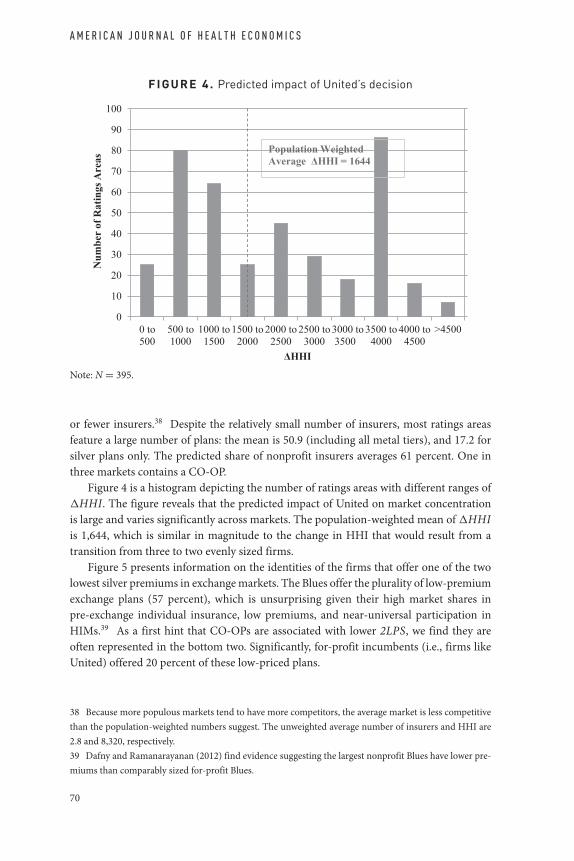
Figure 4 is a histogram depicting the number of ratings areas with different ranges of�HHI. The figure reveals that the predicted impact of United on market concentrationis large and varies significantly across markets. The population-weighted mean of �HHIis 1,644, which is similar in magnitude to the change in HHI that would result from atransition from three to two evenly sized firms.
Figure 5 presents information on the identities of the firms that offer one of the twolowest silver premiums in exchange markets. The Blues offer the plurality of low-premiumexchange plans (57 percent), which is unsurprising given their high market shares inpre-exchange individual insurance, low premiums, and near-universal participation inHIMs.39 As a first hint that CO-OPs are associated with lower 2LPS, we find they areoften represented in the bottom two. Significantly, for-profit incumbents (i.e., firms likeUnited) offered 20 percent of these low-priced plans.
38 Because more populous markets tend to have more competitors, the average market is less competitivethan the population-weighted numbers suggest. The unweighted average number of insurers and HHI are2.8 and 8,320, respectively.39 Dafny and Ramanarayanan (2012) find evidence suggesting the largest nonprofit Blues have lower pre-miums than comparably sized for-profit Blues.
70

More Insurers Lower Premiums // da fn y, gru ber, o dy
FI G URE 5 . Identity of 1st and 2nd lowest-priced silver insurers, by category
Note: N = 790.
IV. The Relationship between Market Structure and Prices
A. A R E P R I C E S C O R R E L A T E D W I T H M A R K E T S T R U C T U R E ?
We begin by examining whether 2L P S is correlated with our endogenous measure ofcompetition. More specifically, we estimate the following equation using data at theratings-area level:
ln(2L P S)m = β H H Im[+Xmλ] + εm (4).
H H Im is our estimate of market competition and Xm is a vector of optional controls,specifically ln(hospital price), ln(per capita income), share NFP, CO-OP, percentblack, and percent Hispanic. All observations are weighted by the 2011 ratings-area pop-ulation. Results from this endogenous regression are presented in the first two columnsof Table 2. The first column excludes the control variables, while the second column in-cludes them. In both specifications, greater concentration is positively and significantlycorrelated with 2LPS. The results imply a one-standard-deviation decrease in HHI (equalto 0.2, per Table 1, which is slightly larger than the mean decrease in HHI that would re-sult if United entered all ratings areas) is associated with a reduction in 2LPS of 5.6–7.2percent. Of course, given the endogeneity concerns raised above, we are hesitant to placea causal interpretation on the findings.
B. D O E S C O M P E T I T I O N H A V E A C A U S A L E F F E C T O N P R E M I U M S ?
Next, we investigate whether competition has a causal effect on premiums. We posit thatUnited’s decision not to participate in any of the FFMs is a source of plausibly exogenousvariation in exchange market structure. We use �HHIm, as defined in Section III.A., toinstrument for H H Im. In the following three subsections, we (1) confirm that �HHIm iscorrelated with H H Im; (2) show that �HHIm is correlated with 2LPS; and (3) estimateequation 4 using �HHIm as an instrument for H H Im.b.. first-stage model. To evaluate whether �HHIm is indeed predictive ofchanges in H H Im, we estimate the following model:
H H Im = β�HHIm[+Xmλ] + εm (5).
71

A M E R I C A N J O U R N A L O F H E A L T H E C O N O M I C S
TABLE 2 . Main results
Endogenous First Reduced Instrumentalregression stage form variables
Dep var = Dep var = Dep var = Dep var =ln(2LPS) HHI ln(2LPS) ln(2LPS)
(1) (2) (3) (4) (5) (6) (7) (8)
HHI 0.274a 0.348a 0.260a 0.336a
(0.040) (0.041) (0.079) (0.083)
�HHI 0.954a 0.871a 0.248a 0.293a
(0.081) (0.079) (0.079) (0.078)
ln(per capita income) 0.058 −0.138a 0.009 0.055(0.045) (0.049) (0.048) (0.048)
ln(hospital price) 0.183a −0.011 0.179a 0.183a
(0.038) (0.041) (0.041) (0.038)
CO-OP in market −0.086a 0.022 −0.078a −0.085a
(0.017) (0.019) (0.019) (0.018)
Share nonprofit −0.077a 0.157a −0.023 −0.075a
(0.022) (0.023) (0.023) (0.024)
Percent black 0.156b 0.241a 0.240a 0.159b
(0.064) (0.069) (0.068) (0.066)
Percent Hispanic −0.087c −0.281a −0.186a −0.091(0.052) (0.055) (0.054) (0.056)
R2 0.105 0.290 0.259 0.398 0.025 0.185 0.105 0.289
Notes: N = 395. All regressions are weighted by the ratings-area population under 65, as reportedby the US Census. The instrument for HHI is �HHI. Standard errors in parentheses. ap < 0.01,bp < 0.05, cp < 0.10.
Results are presented in the third and fourth columns of Table 2, first excluding and thenincluding the controls described above. Across both specifications, changes in �HHIm
translate into H H Im nearly one for one, and the coefficient estimates are highly statisti-cally significant. A number of the controls, such as income, racial composition, and shareNFP, are significant predictors of HHI.b.. reduced form. The reduced-form model relates exchange premiums to theinstrument, that is,
ln(2L P Sm) = β�HHIm[+Xmλ] + εm (6).
The results, presented in the fifth and sixth columns of Table 2, imply that premiums arehigher in markets where United’s nonparticipation has a larger effect on predicted mar-ket competition. For example, in a market with the median weighted �HHIm, we predict
72
More Insurers Lower Premiums // da fn y, gru ber, o dy
2LPS would have been 3.6 percent lower.40 The remaining variables enter with the ex-pected signs. We discuss them further in the following section.b.. instrumental variables. Finally, we estimate the IV regression
ln(2L P Sm) = β H H Im[+Xmλ] + εm (7),
instrumenting for H H Im with �HHIm. The results, presented in the final two columns ofTable 2, suggest a meaningful impact of United’s nonparticipation on premiums. Given thefirst-stage coefficient estimates are close to 1, the coefficients are very similar in magnitudeto the reduced-form estimates in the adjacent columns. The results are also fairly similarto the OLS results from the first two columns, potentially mitigating endogeneity concernswith the OLS results.
To gauge the magnitude of the results, we examine how premiums would change undertwo scenarios: (1) United enters all FFM ratings areas; and (2) all incumbent insurers enterall FFM ratings areas in the states in which they offered individual insurance in 2011.Using the coefficient in column 8 (the specification with controls) as our central estimate,we calculate that population-weighted 2LPS would have been 5.4 percent lower underscenario (1) and 11.1 percent lower under scenario (2). We caution that the latter estimaterequires making projections far out of sample, where the assumption of a linear effect ofchanges in HHI is less likely to be valid.
The estimate for the effect of CO-OP on premiums is of independent policy interest.2LPS is 8.1 percent lower in markets with CO-OPs; however, as we discuss in SectionV.B. below, CO-OP location may be endogenous. The coefficients on the remaining con-trols enter with plausible signs and magnitudes. A 1 percent increase in inpatient hospitalprices is associated with a ∼0.2 percent increase in insurance premiums. This is the sameproportion of private health-care expenditures attributable to inpatient care for privatelyinsured, nonelderly patients.41
Our reduced-form estimates combine the “direct” and “indirect” effects previously de-scribed. To gauge the plausibility of our combined estimate and to attempt to disentanglethe two, we performed two different exercises. As a first exercise, we simulated the effectsof adding a randomly selected participant (from the set of all participants, in all ratingsareas) as an “entrant” into each ratings area. We normalized the entrant’s premiums to ac-count for differences in the mean and variance of premiums across states, and we repeatedthe exercise 1,000 times to obtain average effects and standard errors. Details are providedin the Online Appendix (www.mitpressjournals.org/doi/Suppl/10.1162/ajhe a 00003).The results suggest that adding a randomly selected entrant to all markets reduces theweighted-average 2LPS by 4.5 percent, on average. As a second exercise, we removedeach of the three largest FFM participants from the data and recalculated 2LPS. Ar-guably, these insurers are the closest analogs to United. The resulting increases in 2LPS
40 Using the estimate of 0.293 from column 6 (the specification with controls), together with the medianweighted �HHIm of 0.12, yields exp(0.293 × 0.12) = 1.036.41 Figure is from Health Care Cost Institute (2013).
73
A M E R I C A N J O U R N A L O F H E A L T H E C O N O M I C S
averaged 4.5 percent.42 Overall, these results suggest that the magnitudes we obtain aresensible, and that the premium increases we estimate could be driven entirely by the directeffect.
V. Robustness
A. F A L S I F I C A T I O N E X E R C I S E
As noted earlier, there are potential concerns about the endogeneity of our instrument. Inthis section, we present a series of falsification tests designed to examine those concerns.
Our first test documents that �HHI is uncorrelated with preperiod premiums, whichshould allay concerns that the share of the market held by United is correlated with omitteddeterminants of exchange premiums. Preperiod premium data do not exist at the ratings-area level. We therefore use several sources of premium data, some available at the statelevel, some at roughly the MSA (and MSA residual) level, and one at the LEHID marketlevel. Given the higher level of aggregation (relative to the ratings area), our statisticaltests will have lower power, making it harder to reject the null of no correlation between�HHI and preperiod premiums. Hence, we compare the results from these regressionswith those obtained from estimating our primary reduced-form regression (equation 6)using the same geographical market definitions. Table 3 presents these results. To increasethe comparability of estimates across different dependent and independent variables, westandardize both the dependent and independent variables (by subtracting the mean anddividing by the standard deviation). All specifications are weighted and include the set ofcontrols from prior models.
Column 1 presents results using MEPS MSA-level data on premiums for employer-sponsored plans. Specification 1 (i.e., the top specification) examines whether ourreduced-form relationship between 2L P S and �HHI from column 6 of Table 2 is presentwhen the data are aggregated to the MSA level. The point estimate is smaller than our es-timate from the ratings-area data (i.e., 0.194 vs. 0.336), and statistically significant at p <
0.10. In contrast, specification 2 (i.e., the bottom specification) contains no evidence ofa statistically significant relationship between MEPS employer premiums in the prepe-riod and �HHI. The point estimate is near zero, albeit with large standard errors. Thedifference between the coefficient estimates in specifications 1 and 2 is not statisticallysignificant at conventional levels.
Columns 2 and 3 repeat the same analysis using state-level preperiod premium data; asdiscussed above, both the MEPS small-employer premium data and the CCIIO individualinsurance data are only available at the state level. Given the high level of aggregation, itis unsurprising that the coefficients from specification 1 (while very similar in magnitude
42 Removing Aetna (which participated primarily through its Coventry brand, which offers MedicaidHMOs) from the calculation of 2LPS results in a weighted-average increase in 2LPS (across the marketsin which it participated) of 2.5 percent. Removing Humana or Wellpoint (separately) increases weighted-average 2LPS by 5.9 and 5.2 percent, respectively. A simple average across these estimates is 4.5 percent.We caution that the specific market participation decisions of these insurers appear to be endogenous (seefootnote 13), hence this exercise is largely descriptive.
74

More Insurers Lower Premiums // da fn y, gru ber, o dy
TA
BL
E3
.R
educ
ed-f
orm
fals
ifica
tion
exer
cise
(1)
(2)
(3)
(4)
(5)
(6)
Sour
ceof
pre-
peri
odpr
emiu
ms
MEP
S,al
lfirm
sM
EPS,
smal
lfirm
sCC
IIOLE
HID
LEH
IDN
/A
Sour
ceof
�H
HI
CCIIO
CCIIO
CCIIO
CCIIO
LEH
IDIn
terS
tudy
Spec
ifica
tion
1(c
onfir
mat
ion
that
mai
nre
sults
pers
ist)
:D
epVa
r=ln
(2LP
S),s
tude
ntiz
ed�
HH
I(st
uden
tized
)0.
194c
0.17
40.
174
0.18
8c0.
179
0.14
9c
(0.1
13)
(0.1
80)
(0.1
80)
(0.1
01)
(0.1
70)
(0.0
89)
Spec
ifica
tion
2(f
alsi
ficat
ion)
:D
epVa
r=ln
(pre
-per
iod
prem
ium
s),s
tude
ntiz
ed�
HH
I(st
uden
tized
)0.
029
0.01
10.
039
0.01
8−0
.033
(0.1
13)
(0.1
47)
(0.1
59)
(0.0
61)
(0.1
04)
Num
bero
fobs
erva
tions
7934
3498
9824
8
Uni
tofo
bser
vatio
nM
SASt
ate
Stat
eLE
HID
mar
ket
LEH
IDm
arke
tR
atin
gsar
ea
p-va
lue
forH
0:id
entic
alef
fect
ofin
depe
nden
tvar
iabl
eon
both
depe
nden
tvar
iabl
es0.
300.
480.
580.
160.
30
Not
es:A
llre
gres
sions
are
wei
ghte
dby
the
ratin
gs-a
rea
popu
latio
nun
der6
5,as
repo
rted
byth
eU
SC
ensu
s.M
EPS
MSA
defin
ition
sbre
akst
ates
into
MSA
sand
stat
ere
sidua
ls(i.
e.,a
reas
outs
ide
the
MSA
s).A
llsp
ecifi
catio
nsin
clud
eth
eco
ntro
lsin
the
even
colu
mns
inTa
ble
2.Re
gres
sions
with
aLE
HID
depe
nden
tvar
iabl
eal
soco
ntro
lfor
plan
type
shar
es,p
lan
desig
nfa
ctor
,and
dem
ogra
phic
fact
or.T
hest
anda
rder
rors
inco
lum
n6
are
clus
tere
dat
the
MSA
leve
l(19
6cl
uste
rs).
Stan
dard
erro
rsin
pare
nthe
ses.
a p<
0.01
,b p<
0.05
,c p<
0.10
.
75
A M E R I C A N J O U R N A L O F H E A L T H E C O N O M I C S
to that in column 1) are not statistically significant at conventional levels in either column2 or column 3. For both dependent variables, the coefficient estimates from specification2 are near zero, although with 34 observations our standard errors are quite large andtwo-sided tests of coefficient equality easily accept the null.
Column 4 repeats the analysis again using LEHID market definitions and premiums.The LEHID specifications include controls for the underlying plan and enrollee charac-teristics. These include plan design factor, which reflects the actuarial value of observedplans in the relevant market, and demographic factor, a summary measure capturingcharacteristics of the insured LEHID population (e.g., family size and gender).43
The point estimate in specification 1 is again two-thirds as large as our central estimateand remains significant at p < 0.10. The coefficient estimate on �HHI in specification 2 isagain near zero; there is no evidence that �HHI is significantly correlated with preperiodLEHID premiums. Here, the coefficients from specifications 1 and 2 are distinguishableat p = 0.16.
The other major concern raised above was our instrument conditions on insurers whochoose to participate in state HIMs. To address this point, we turn to the LEHID and In-terStudy data sets, which allow us to construct measures of �HHI using purely ex anteestimates of market share. Column 4 replaces only the dependent variable with premiumscalculated from LEHID, and utilizes the LEHID market as the unit of observation. Col-umn 5 also replaces �HHI with a LEHID-based version that uses pre-exchange marketshares for all incumbents. The point estimates for specification 1 are virtually the sameas those reported in columns 1–4, although the standard error is larger in column 5.In specification 2, there is no evidence that �HHI is correlated with preperiod LEHIDpremiums.
Finally, the last column of Table 3 uses �HHI constructed from InterStudy MSA mar-ket shares for all employers. We are only able to estimate specification 1, as we lack Inter-Study premium data. The coefficient estimate is similar in magnitude to the other columnsand statistically significant at p < 0.10.
In summary, there is some evidence (albeit weaker and noisier) that �HHI is corre-lated with 2L P S even when the data are aggregated to higher levels of geography. By con-trast, there is no evidence that �HHI is correlated with pre-exchange premiums: the pointestimates in the falsification exercises in specification 2 are always near zero. However, thecoefficients from the exchange and pre-exchange periods are not statistically distinguish-able from one another. We also find that substituting our version of �HHI with a measurethat does not depend on incumbents’ exchange participation decisions has little impact onthe reduced-form point estimates.
B. R O B U S T N E S S C H E C K S
Table 4 presents results of our reduced-form equation using other measures of premiums:the mean premium across all silver plans offered in a ratings area; the median premium
43 We also include the market-level shares of plan types (Indemnity, Preferred Provider Organization,Health Maintenance Organization, and Point of Service), as well as the share of plans denoted as “consumer-directed” (i.e., high-deductible plans).
76

More Insurers Lower Premiums // da fn y, gru ber, o dy
TABLE 4 . Reduced-form effect of �HHI on ln(prices) (robustness toalternative measures of prices)
(1) (2) (3) (4)
Dep Dep var = Dep var = Dep var = ln(meanvar = ln(mean ln(median of within-insurer
ln(2LPS) premium) premium) mean premiums)
�HHI 0.293a 0.162a 0.182a 0.175a
(0.079) (0.057) (0.062) (0.055)
ln(per capita income) −0.013 0.058 0.097b 0.061c
(0.053) (0.038) (0.041) (0.037)
ln(hospital price) 0.197a 0.169a 0.151a 0.161a
(0.043) (0.031) (0.033) (0.030)
CO-OP in market −0.079a −0.009 −0.002 0.000(0.019) (0.014) (0.015) (0.013)
Share nonprofit −0.018 −0.032c −0.051a −0.018(0.024) (0.017) (0.019) (0.017)
Percent black 0.260a 0.175a 0.218a 0.105b
(0.070) (0.050) (0.055) (0.049)
Percent Hispanic −0.187a 0.070c 0.131a 0.049(0.054) (0.039) (0.042) (0.038)
R2 0.190 0.173 0.185 0.160
Notes: N = 383. All regressions are weighted by the ratings-area population under 65, as reportedby the US Census. Samples exclude Virginia, which has very large pricing outliers. When Virginiais included, specifications utilizing a mean premium (i.e., columns 2 and 4) yield statisticallyinsignificant coefficients on �HHI. Standard errors in parentheses. ap < 0.01, bp < 0.05,cp < 0.10.
across the silver plans; and the mean of within-insurer mean silver premium (i.e., a meancalculated using one observation per insurer, so as to avoid overweighting insurers withmany plans). For this analysis, we exclude the state of Virginia, which has some extremepremium outliers.44 The first column presents the results obtained using this sample andour primary dependent variable, 2LPS. Our conclusions are robust to using these otherdependent variables. The point estimates are somewhat smaller, but the differences acrossspecifications are not statistically significant. There are a number of possible causes for thesmaller estimated magnitudes obtained using these alternative premium measures.
First, the alternative premium measures have smaller standard deviations than 2LPS,suggesting that there is less variation to explain. Second, some of the variation in 2LPS isrelated to the sheer number of plans offered in a ratings area. Even if plan premiums are inexpectation the same (e.g., drawn at random from the same distribution of prices), adding
44 Three Virginia insurers (Optima, Aetna, and Innovation Health) have premiums that are extreme out-liers. The mean silver premium (for a 27-year-old) across these three insurers is 885. This compares to amean of 256 for the rest of the country.
77
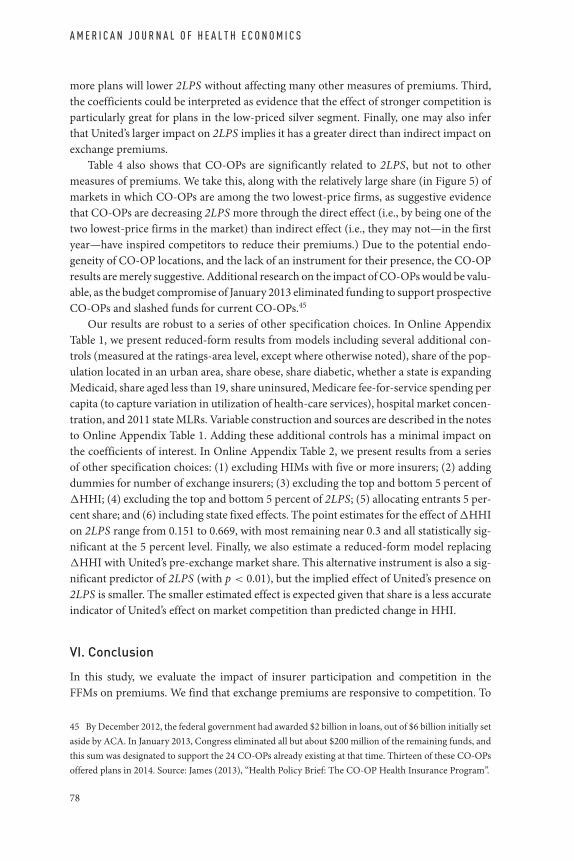
A M E R I C A N J O U R N A L O F H E A L T H E C O N O M I C S
more plans will lower 2LPS without affecting many other measures of premiums. Third,the coefficients could be interpreted as evidence that the effect of stronger competition isparticularly great for plans in the low-priced silver segment. Finally, one may also inferthat United’s larger impact on 2LPS implies it has a greater direct than indirect impact onexchange premiums.
Table 4 also shows that CO-OPs are significantly related to 2LPS, but not to othermeasures of premiums. We take this, along with the relatively large share (in Figure 5) ofmarkets in which CO-OPs are among the two lowest-price firms, as suggestive evidencethat CO-OPs are decreasing 2LPS more through the direct effect (i.e., by being one of thetwo lowest-price firms in the market) than indirect effect (i.e., they may not—in the firstyear—have inspired competitors to reduce their premiums.) Due to the potential endo-geneity of CO-OP locations, and the lack of an instrument for their presence, the CO-OPresults are merely suggestive. Additional research on the impact of CO-OPs would be valu-able, as the budget compromise of January 2013 eliminated funding to support prospectiveCO-OPs and slashed funds for current CO-OPs.45
Our results are robust to a series of other specification choices. In Online AppendixTable 1, we present reduced-form results from models including several additional con-trols (measured at the ratings-area level, except where otherwise noted), share of the pop-ulation located in an urban area, share obese, share diabetic, whether a state is expandingMedicaid, share aged less than 19, share uninsured, Medicare fee-for-service spending percapita (to capture variation in utilization of health-care services), hospital market concen-tration, and 2011 state MLRs. Variable construction and sources are described in the notesto Online Appendix Table 1. Adding these additional controls has a minimal impact onthe coefficients of interest. In Online Appendix Table 2, we present results from a seriesof other specification choices: (1) excluding HIMs with five or more insurers; (2) addingdummies for number of exchange insurers; (3) excluding the top and bottom 5 percent of�HHI; (4) excluding the top and bottom 5 percent of 2LPS; (5) allocating entrants 5 per-cent share; and (6) including state fixed effects. The point estimates for the effect of �HHIon 2LPS range from 0.151 to 0.669, with most remaining near 0.3 and all statistically sig-nificant at the 5 percent level. Finally, we also estimate a reduced-form model replacing�HHI with United’s pre-exchange market share. This alternative instrument is also a sig-nificant predictor of 2LPS (with p < 0.01), but the implied effect of United’s presence on2LPS is smaller. The smaller estimated effect is expected given that share is a less accurateindicator of United’s effect on market competition than predicted change in HHI.
VI. Conclusion
In this study, we evaluate the impact of insurer participation and competition in theFFMs on premiums. We find that exchange premiums are responsive to competition. To
45 By December 2012, the federal government had awarded $2 billion in loans, out of $6 billion initially setaside by ACA. In January 2013, Congress eliminated all but about $200 million of the remaining funds, andthis sum was designated to support the 24 CO-OPs already existing at that time. Thirteen of these CO-OPsoffered plans in 2014. Source: James (2013), “Health Policy Brief: The CO-OP Health Insurance Program”.
78

More Insurers Lower Premiums // da fn y, gru ber, o dy
contend with the endogeneity of exchange market structure, we exploit the decision byUnited to forgo participation in the FFMs. This decision differentially impacted marketsdue to United’s pre-exchange market position.
We estimate that the population-weighted average second-lowest silver premiumwould have been reduced by 5.4 percent had United entered all markets. If all insurerspresent in a state had entered all ratings areas in that state’s exchange, we predict FFM pre-miums would have been 11.1 percent lower. We also find that markets with CO-OPs havelower premiums. A portion of this association is attributable to a “direct effect” becauseCO-OPs are often among the two lowest-price silver plans in a market; their premiumsdirectly lowered the weighted average 2LPS by 2.1 percent.46
The magnitude of the relationship between HHI and exchange premiums is roughlyone-third that obtained by Dafny, Duggan, and Ramanarayanan (2012) for the large-employer-group market. Although the estimates are not perfectly comparable (in particu-lar, the Dafny, Duggan, and Ramanarayanan (2012) estimate reflects the cumulative effectof changes in HHI on premium growth over a few years’ time), the similar order of magni-tude suggests that the competitive dynamic characterizing early exchange markets is akinto that of the mature, but imperfectly competitive, large-group market. This suggests thatHIMs have not (to date) produced a Bertrand-like outcome in which a small number ofplayers can drive premiums down to cost.
Future entry, firm learning, consumer learning, and greater plan standardization maychange this assessment. There is room for significant learning on both sides of this mar-ket. For example, over time consumers are likely to learn how to better compare differentplan attributes, like premiums, actuarial value and network design. Tools to facilitate thesecomparisons and to help consumers prioritize attributes will also improve. Changes in theshapes of consumer demand curves will in turn affect pricing. Relatedly, insurers’ uncer-tainty about who their competitors will be, what the pool of consumers will look like, andwhat kinds of products will be attractive to those consumers will resolve. While impossi-ble to sign definitively, most of these forces are likely to make the cross-price elasticities ofdemand across insurers higher for a given market structure. Under these circumstances,margins will decline faster with a move from one to two insurers. Once pricing nears thecompetitive level, however, additional competitors will have a smaller incremental effect.
Given the incipiency of these markets, this study is but a first step in what will surelybecome a deeper and broader literature on insurance HIMs and the nature and signifi-cance of competition among exchange participants. There is substantial room for furtherresearch on how competition affects pricing and other outcomes in this market. Futurestudies will be easier to execute once information about consumer enrollment decisionshas been released, and once the market is in longer-term equilibrium. These conditionswill allow researchers to apply well-established supply-side methodologies to studyingcompetition on the HIMs. Such research will permit more-nuanced conclusions and rec-ommendations regarding the impact of competition and competition-related policies onvarious outcomes of interest. Given the large federal role in developing and regulating the
46 To obtain this estimate, we recalculated 2LPS without CO-OPs in the sample of markets with a CO-OPand compared it to actual 2LPS.
79
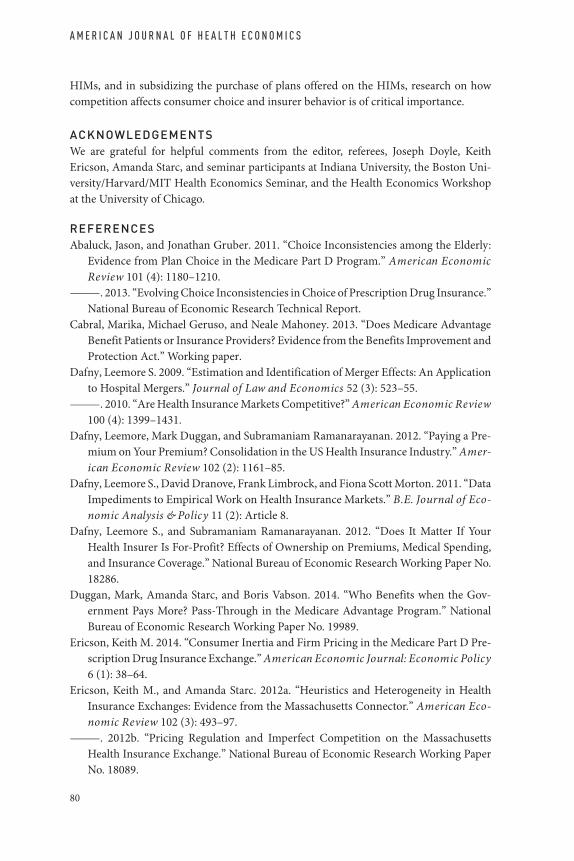
A M E R I C A N J O U R N A L O F H E A L T H E C O N O M I C S
HIMs, and in subsidizing the purchase of plans offered on the HIMs, research on howcompetition affects consumer choice and insurer behavior is of critical importance.
ACKNOWLEDGEMENTSWe are grateful for helpful comments from the editor, referees, Joseph Doyle, KeithEricson, Amanda Starc, and seminar participants at Indiana University, the Boston Uni-versity/Harvard/MIT Health Economics Seminar, and the Health Economics Workshopat the University of Chicago.
REFERENCESAbaluck, Jason, and Jonathan Gruber. 2011. “Choice Inconsistencies among the Elderly:
Evidence from Plan Choice in the Medicare Part D Program.” American EconomicReview 101 (4): 1180–1210.
———. 2013. “Evolving Choice Inconsistencies in Choice of Prescription Drug Insurance.”National Bureau of Economic Research Technical Report.
Cabral, Marika, Michael Geruso, and Neale Mahoney. 2013. “Does Medicare AdvantageBenefit Patients or Insurance Providers? Evidence from the Benefits Improvement andProtection Act.” Working paper.
Dafny, Leemore S. 2009. “Estimation and Identification of Merger Effects: An Applicationto Hospital Mergers.” Journal of Law and Economics 52 (3): 523–55.
———. 2010. “Are Health Insurance Markets Competitive?” American Economic Review100 (4): 1399–1431.
Dafny, Leemore, Mark Duggan, and Subramaniam Ramanarayanan. 2012. “Paying a Pre-mium on Your Premium? Consolidation in the US Health Insurance Industry.” Amer-ican Economic Review 102 (2): 1161–85.
Dafny, Leemore S., David Dranove, Frank Limbrock, and Fiona Scott Morton. 2011. “DataImpediments to Empirical Work on Health Insurance Markets.” B.E. Journal of Eco-nomic Analysis & Policy 11 (2): Article 8.
Dafny, Leemore S., and Subramaniam Ramanarayanan. 2012. “Does It Matter If YourHealth Insurer Is For-Profit? Effects of Ownership on Premiums, Medical Spending,and Insurance Coverage.” National Bureau of Economic Research Working Paper No.18286.
Duggan, Mark, Amanda Starc, and Boris Vabson. 2014. “Who Benefits when the Gov-ernment Pays More? Pass-Through in the Medicare Advantage Program.” NationalBureau of Economic Research Working Paper No. 19989.
Ericson, Keith M. 2014. “Consumer Inertia and Firm Pricing in the Medicare Part D Pre-scription Drug Insurance Exchange.” American Economic Journal: Economic Policy6 (1): 38–64.
Ericson, Keith M., and Amanda Starc. 2012a. “Heuristics and Heterogeneity in HealthInsurance Exchanges: Evidence from the Massachusetts Connector.” American Eco-nomic Review 102 (3): 493–97.
———. 2012b. “Pricing Regulation and Imperfect Competition on the MassachusettsHealth Insurance Exchange.” National Bureau of Economic Research Working PaperNo. 18089.
80
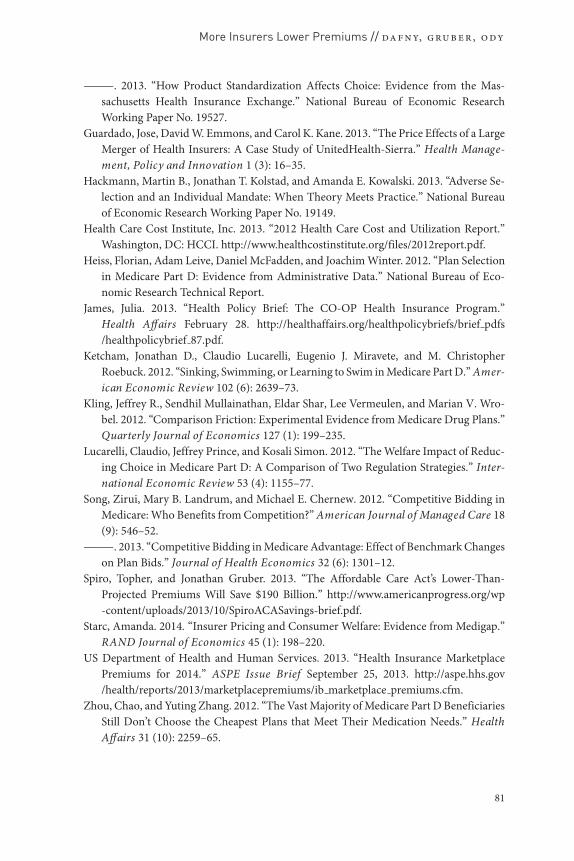
More Insurers Lower Premiums // da fn y, gru ber, o dy
———. 2013. “How Product Standardization Affects Choice: Evidence from the Mas-sachusetts Health Insurance Exchange.” National Bureau of Economic ResearchWorking Paper No. 19527.
Guardado, Jose, David W. Emmons, and Carol K. Kane. 2013. “The Price Effects of a LargeMerger of Health Insurers: A Case Study of UnitedHealth-Sierra.” Health Manage-ment, Policy and Innovation 1 (3): 16–35.
Hackmann, Martin B., Jonathan T. Kolstad, and Amanda E. Kowalski. 2013. “Adverse Se-lection and an Individual Mandate: When Theory Meets Practice.” National Bureauof Economic Research Working Paper No. 19149.
Health Care Cost Institute, Inc. 2013. “2012 Health Care Cost and Utilization Report.”Washington, DC: HCCI. http://www.healthcostinstitute.org/files/2012report.pdf.
Heiss, Florian, Adam Leive, Daniel McFadden, and Joachim Winter. 2012. “Plan Selectionin Medicare Part D: Evidence from Administrative Data.” National Bureau of Eco-nomic Research Technical Report.
James, Julia. 2013. “Health Policy Brief: The CO-OP Health Insurance Program.”Health Affairs February 28. http://healthaffairs.org/healthpolicybriefs/brief pdfs/healthpolicybrief 87.pdf.
Ketcham, Jonathan D., Claudio Lucarelli, Eugenio J. Miravete, and M. ChristopherRoebuck. 2012. “Sinking, Swimming, or Learning to Swim in Medicare Part D.” Amer-ican Economic Review 102 (6): 2639–73.
Kling, Jeffrey R., Sendhil Mullainathan, Eldar Shar, Lee Vermeulen, and Marian V. Wro-bel. 2012. “Comparison Friction: Experimental Evidence from Medicare Drug Plans.”Quarterly Journal of Economics 127 (1): 199–235.
Lucarelli, Claudio, Jeffrey Prince, and Kosali Simon. 2012. “The Welfare Impact of Reduc-ing Choice in Medicare Part D: A Comparison of Two Regulation Strategies.” Inter-national Economic Review 53 (4): 1155–77.
Song, Zirui, Mary B. Landrum, and Michael E. Chernew. 2012. “Competitive Bidding inMedicare: Who Benefits from Competition?” American Journal of Managed Care 18(9): 546–52.
———. 2013. “Competitive Bidding in Medicare Advantage: Effect of Benchmark Changeson Plan Bids.” Journal of Health Economics 32 (6): 1301–12.
Spiro, Topher, and Jonathan Gruber. 2013. “The Affordable Care Act’s Lower-Than-Projected Premiums Will Save $190 Billion.” http://www.americanprogress.org/wp-content/uploads/2013/10/SpiroACASavings-brief.pdf.
Starc, Amanda. 2014. “Insurer Pricing and Consumer Welfare: Evidence from Medigap.”RAND Journal of Economics 45 (1): 198–220.
US Department of Health and Human Services. 2013. “Health Insurance MarketplacePremiums for 2014.” ASPE Issue Brief September 25, 2013. http://aspe.hhs.gov/health/reports/2013/marketplacepremiums/ib marketplace premiums.cfm.
Zhou, Chao, and Yuting Zhang. 2012. “The Vast Majority of Medicare Part D BeneficiariesStill Don’t Choose the Cheapest Plans that Meet Their Medication Needs.” HealthAffairs 31 (10): 2259–65.
81