more on consumer theory: predicting and ex- plaining the ... · more on consumer theory: predicting...
TRANSCRIPT

More on consumer theory: predicting and ex-plaining the choices we make:Introducing the concept of utility, and utility functions.draft Nov 1, 2017Choices depend on preferences and on constraints
Wrt constraints, and quoting from a course evaluation
"You seem like a nice guy but you are soooooooooboring. I would not hang out with you even if you theonly person in my budget set."
In my defense, this person understands the difference between his preferencesand his constraints, and managed to learn in an extreme state of boredom.
In previous lectures we discussed the budget constraint and preferences.
Here we discuss a different way to represent preferences
The relevant chapter is 10, and, in particular, its appendix.
1
1 Economists assume individuals have prefer-ences: they can rank bundles of goods suchthat
• Bundle j is preferred to bundle i, or
• Bundle i is preferred to bundle j, or
• The individual is indifferent between bundles i and j.
• And this is true for any pair of bundles i and j
Economists often represent preferences with something called a utility func-tion.1
A utility function is simply a mathematical function that assigns a numberto each bundle such that is assigns a higher number to bundle k than to bundlev if bundle k is preferred to bundle v, and assign bundles h and t the samenumber if the individual is indifferent between these to bundles.
The function is chosen such that u(k) > u(v) if bundle k is preferred tobundle v, and u(t) = u(h) if the individual is indifferent between the two bundles.Your u(.) is different from mine u(.).
One has preferences and a mathematical function is one way to representthose preference, there are other ways as well.2 For example one could writedown, in a notebook a description of each possible bundle and the ranking ofthat bundle.
Economists do no assume people get utility: utility is simply a short-hand way to represent preferences.
We call these numbers produced by this function, utils or utility. If a bundlem has a higher utility number than bundle w this simply means that bundle mis preferred to bundle w, and nothing more.
1Utility is a concept that confuses many people. Many people want to make more ofutlity than is there. Economists do not assume that people get utility per sec; it is only amathematical metric we use to rank bundles.
2Note that if one can find a mathematical function that ranks bundles in the same orderthat George ranks them, then there are an infinite number of other mathematical functionsthat will also rank the bundles in the same order.
2

Economists assume your preferences are your preferences- they are what theyare. If you like to play with your dog, and you would give up everything elseto play with your dog, those are your preferences, which we economists take asgiven.
If your preference is to drink motor oil and stick pins in your eyeballs, so-be-itif that is what you prefer.
However, economists might want to influence (restrain or encourage) yourchoices if your choices directly influence others in a signficant way (if yourconsumption produces substantial external effects).
Psychologists, on the other hand, might ask why you have the preferencesyou have, and consider some preference abnormal, even if they do not lead tobehaviors with external effects.3
3Actually, many of them would ask whether people have preferences at all in the economicsense of the word.
3

1.1 KW, and I as well, will proceed assuming there areonly two goods in play
KW assumes the two commodities are restaurant meals and rooms.they assume u = (r,m). KW choose a matematical function of r and m that
would produce a graph that looks like this one.
Picture this in 3-dimensions in the room.
4

Consider my previous example of aquarium fish and dog biscuits . I have abig aquarium that will hold many fish. My dog, Sofie, likes dog biscuits. Mytrust fund provides me with a small amount of money each month that I canonly spend on fish or dog biscuits, Sofie has no money.
All of our other needs are fufilled by care packages sent by relatives, so allof my money can be spent on fish or biscuits.
Sofie always prefers more dog biscuits to less dog biscuits, and I care aboutSofieCeteris paribus, I would always prefer to have more fish in my aquiarium.
5

Sofie swimming in my large aquarium
1.1.1
6

1.2 We we want to represent my preferences in terms of autility function, we must choose a mathematical formfor that function such that it represents how I rankthe bundles (so it gets my indifferent map correct).
1.2.1 Assume it is4 u = f .8d.2
Fish more important than dog biscuits.
A digression about graphs and mathematical functions. A graph is a visual image ofa specific mathematica function. That is, if we know the mathematical function I havesuffi cient information to graph it, and if one has the graph one can work backwardsand figure out what mathematical function would produce that graph. As you advanceto higher math courses or higher economics courses, the mathematical function ofinterest will be specified. It will then possibly be graphed so the student can visualizethe function. Mostly in Econ 2010 and in the book, the graph is shown withoutmaking explicit the mathematical function that generated that graph. Rememberthat underlying the graph, there is a mathematicall function.
I have assumed a preference map (and corresponding utility function) suchthat, if I am currently consuming equal quantities of both, I would prefer anadditional fish to an additional dog biscuits.
5
2
4
3
1
00
0 1 21
d3 42
f53
45
My assumed utility for fish and dog biscuits
4This function generates the indifference map I showed when I initally used this example.
7

uitlity is on the vertical axis.5
5Note that the utility keeps rising as I consume more of each good, but I can’t draw agraph that goes on forever.
8
Imagine all the bundles between which I am indifferent. How would youindentify such bundles? GRAB A SWORD?
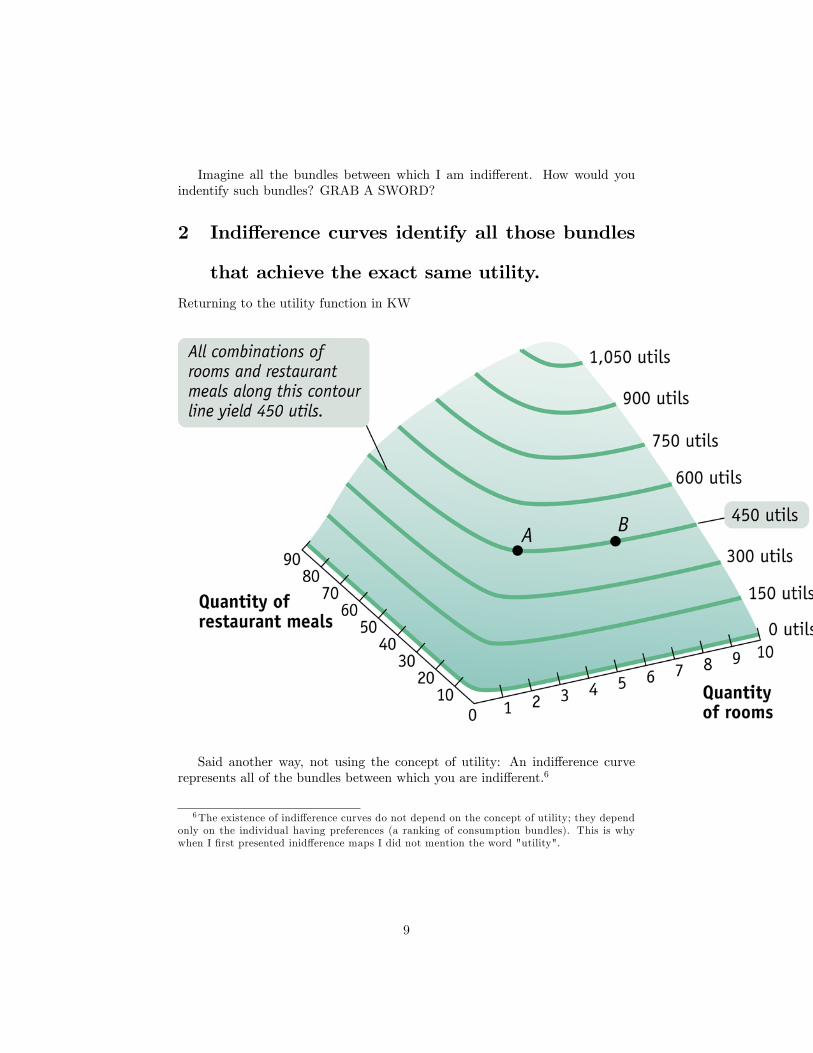
2 Indifference curves identify all those bundles
that achieve the exact same utility.
Returning to the utility function in KW
Said another way, not using the concept of utility: An indifference curverepresents all of the bundles between which you are indifferent.6
6The existence of indifference curves do not depend on the concept of utility; they dependonly on the individual having preferences (a ranking of consumption bundles). This is whywhen I first presented inidfference maps I did not mention the word "utility".
9

An example indifference curve in KW
10

The individual is indifferent between living in a three-room house and eatingout 30 times a month, and 6 rooms and 15 meals out.
If this guy is currently living in 3 rooms and eating out 30 times he wouldbe willing to give up 15 meals to get to move to a 6 room place. That is, hiswtp (willingness-to-pay) for three more rooms is 15, measured in forgone mealsout. (Said another way: if he currently lives in 6 rooms and eats out 15 times amonth, he would give up three of those rooms to get to eat out 15 more timesa month.)
If this guy is currently living in 3 rooms and eating out 30 times and he gaveup less than (more than) 15 meals to get to move to a 6 room place he wouldbe better off (worse off), where better off (worse off) means he moves to ahigher (lower) indifference curve..
11

2.1 The indifference curves that correspond to my utilityfunction for fish and biscuits
2.2
0 1 2 3 4 5 6 7
1
2
3
4
5
6
7
biscuits
fish
Indiff. curvs : Blk u = 1, Red u = 2, Blu u = 3
This is identical to my earlier indifference map for biscuits and fish.For example I am indifferent between 1 biscuit with 2.4 fish, and 5 biscuits
with 1.6 fish: each of these bundles generates 2 utils.
Notice how my indifference curves become flatter when there are relativelymore biscuits than fish in the bundle (steeper as there are relatively more fishin the bundle). It does not have to be this way, but often is this way.
12
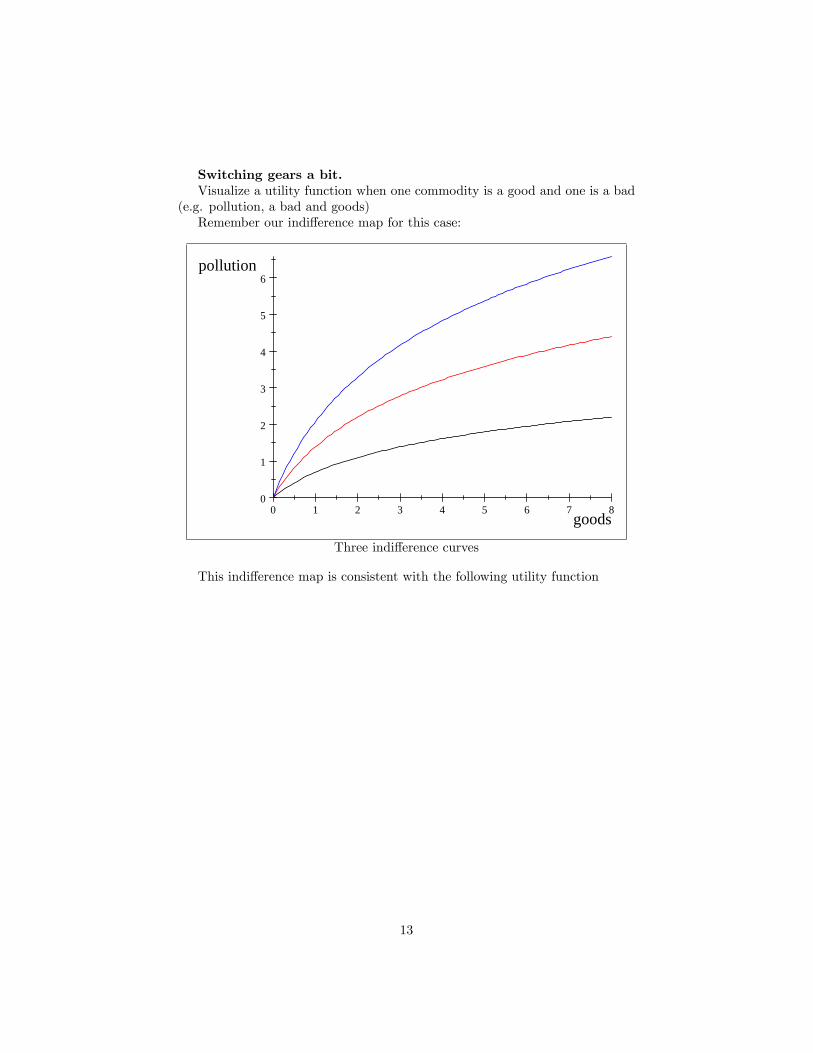
Switching gears a bit.Visualize a utility function when one commodity is a good and one is a bad
(e.g. pollution, a bad and goods)Remember our indifference map for this case:
0 1 2 3 4 5 6 7 80
1
2
3
4
5
6
goods
pollution
Three indifference curves
This indifference map is consistent with the following utility function
13
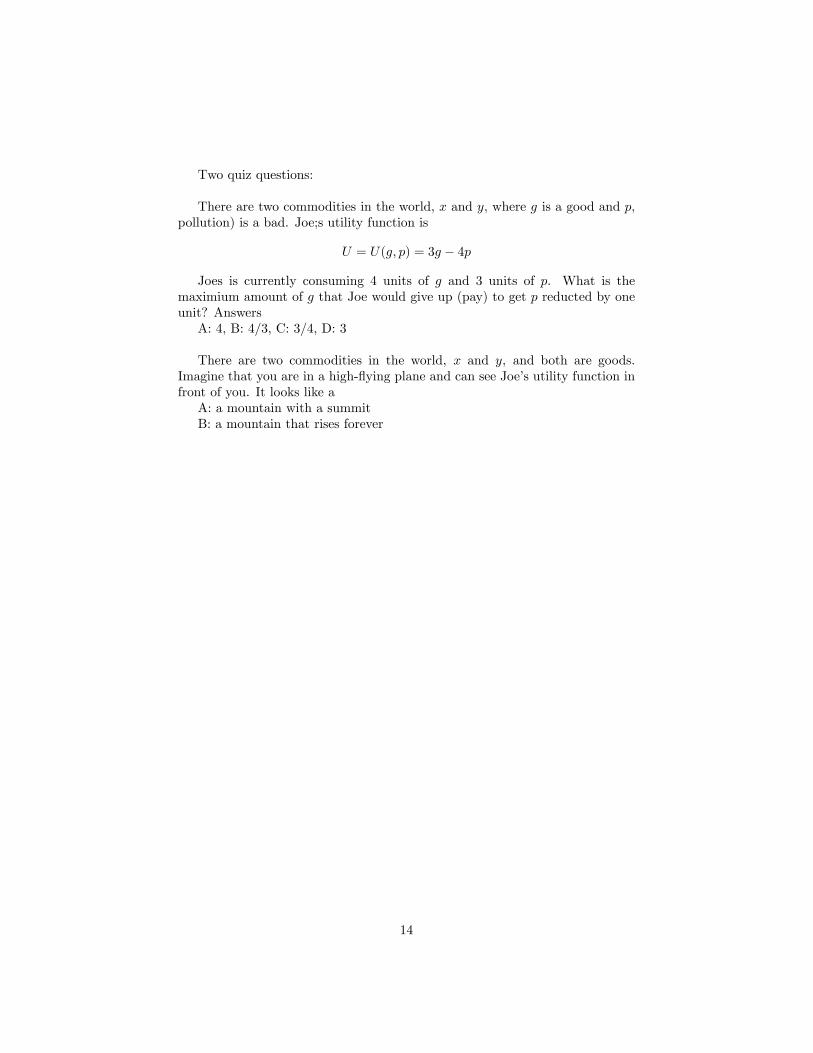
Two quiz questions:
There are two commodities in the world, x and y, where g is a good and p,pollution) is a bad. Joe;s utility function is
U = U(g, p) = 3g − 4p
Joes is currently consuming 4 units of g and 3 units of p. What is themaximium amount of g that Joe would give up (pay) to get p reducted by oneunit? AnswersA: 4, B: 4/3, C: 3/4, D: 3
There are two commodities in the world, x and y, and both are goods.Imagine that you are in a high-flying plane and can see Joe’s utility function infront of you. It looks like aA: a mountain with a summitB: a mountain that rises forever
14

If p is reduced by one unit, holding g constant, his utility would increase by4 units.So, to keep him indifferent, we are looking for the decrease in g that would
decrease his utility from g consumption by 4 units. The answer is 4/3. if hepaid more than 4/3 units of g he would be worse off (lower utility) and if hepaid less he would be better off.
If both x and y are good, utility increases forever as they increase.
15

What would the utility function look like if both commodities were bads?
10
util6
8
2
4
000108642
pollution5
dog sh__t10
An assumed utility for dog sh_t and pollution
16

Note that if both commodities are bads each indifference curve has a negative slope(the same as 2 goods). But, higher ranked bundles are closer to the origin.
2.3 For those who like math: It is "easy" to mathemat-
ically derive one or more of your indifference curvesif one knows a utility function, u = (x1, x2), consistentwith your preferences.
For example, if one solved 5 = u(x1, x2) for x2 = x2(x1, 5) one would have agraph of all those bundels of x1 and x2 that just produced 5 units of utility.
Take our previous example u = u(f, d) = f .8d.2, and solve it for f to getf = f(d, u) = u1.25d−.25 which is the indifference curve for utility level u.
For example, the indifference curve for utlity level 5 is f = f(d, 5) =(5)1.25d−.25 = 7.48d−.25. Graphing this, you get.
0 1 2 3 4 55
6
7
8
9
10
11
12
d
f
Indifference curve for u=5
STOP here if you do not know what a derivative is.Once you have the indifference curve, you can get its slope for any amount
of d by taking its derivative wrt d and evaluting at that level of d.
For example, if the equation for the indifference curve for u = 5 is f =f(d, 5) = 7.48d−.25 its derivative is
17

df
dd= (−.25) ∗ 7.48d−1.25 = −1.87d−1.25
Note the negative sign because the slope of the this indifference curve isnegative.So, for example, when d = 1 the slope is
−1.87(1)−1.25 = −1.87
But, when d = 5 is is−1.87(5)−1.25 = −.25
which is much smaller is absolute value (because the indifference curve getsless steep as d increases.
18