morgan stanley european tmt conference - vivendi · european tmt conference ... 2008 important...
TRANSCRIPT

Morgan Stanley European TMT conference
November 20, 2008
IMPORTANT NOTICE: INVESTORS ARE STRONGLY URGED TO READ THE IMPORTANT DISCLAIMER AT THE END OF THIS PRESENTATION
Jean-Bernard LévyChairman of the Management Board &
Chief Executive Officer

2November 2008
A world leader in communications and entertainment
#1 Video Games Worldwide
#1 Music Worldwide
#2 Telecoms France
#1 Telecoms Morocco
#1 Pay-TV France

3November 2008
Vivendi is exceptionally well positioned to resist market volatility
Strong free cash generation in each business
Strong financial position and high dividend distribution to shareholders
Guidance reiterated and unchanged since the beginning of the year
Vivendi: solid fundamentalsin the current environment

4November 2008
Growth dynamics:Home entertainment (TV, video games, music) and Telecom (Mobile, ADSL) are integrated in our customers’ lives like eating and sleepingIncreased customer demand for broadband products and attractive entertainment experience Continued innovation of all businesses in communications and entertainment
Resistance to market volatility:Non-cyclical revenues through subscriptions with high visibilityProven business models delivering recurrent profitsStrong customer loyalty and exceptional creative skills
Leading position in each business driving high operating margins
Vivendi: exceptionally well positioned

5November 2008
Vivendi: innovation drives demandSFR, the most creative telco operator
#1 in 3G in FranceMultiple innovation in mobile digital contentAlready 10% of subscriber base with 3G unlimited internet access
Canal+ features new TV experiencesDigital migration drives higher customer value on multi-channel premium content platformsIPTV penetration drives new services: VOD, catch-up TV
Activision Blizzard markets best-selling franchises World leader in music-based console game platforms with Guitar HeroWorldwide leader in MMORPG with World of Warcraft
UMG, Digital migration and new services enhances consumer valueSeveral key partnerships to develop new business models: My Space, Nokia, Microsoft, Sony Ericson, Apple, LastFM, Buzznet, Imeem…Digital revenues already represent more than 30% of recording revenues in the US, more than 20% worldwide
Maroc Telecom investing for future opportunities3G services on mobileTV over ADSL

6November 2008
Solid operational performance as of September 30, 2008
30% increase in digital recorded music sales at constant currencyEBITA margin rate of 13%
Technical migration of TPS subscribers achieved at more than 90%Increase of almost 3 points in the EBITA margin rate
Rapid integration of Neuf Cegetel. ~€250 to €300m synergies expected through 2011Increase in mobile revenues: spectacular success of Illimythics driving data growth; postpaid at 69% of the customer baseMobile EBITDA margin rate at 40%, despite competition and regulatory pressure
Customer growth fueled by African subsidiariesEBITA margin rate above 47%
Newly combined Activision Blizzard already up and runningExcellent results in the first quarter as a combined entity, performing above expectations

7November 2008
Successful outcome of bidding process for football rights new contract by Canal+
Close the merger to create Activision Blizzard
Close the acquisition of Neuf Cegetel by SFR
Focus on efficient execution of previously announced transactions
Maintain strong operating performance
Vivendi 2008 priorities announced in February are achieved
€140m yearly of savings
July 9, 2008
At 100% since June 24, 2008
All cost savings plans on track (Canal+/TPS, UMG/BMGP, …)
Outlook unchanged since first announcement

8November 2008
Two major acquisitions finalizedwith no capital increase
* approximately 52% after full dilution
Expect ~$100-150m in synergies
€89m in integration costs at end of Sept. 08
Activision Blizzard
100% control of Neuf Cegetel as ofJune 24, 2008
Increase in Vivendi’s net debt of €5.3 Bn
Expect ~ €250-300m in synergies
€110m in restructuring costs at end of Sept. 08
SFR/Neuf Cegetel
Creation of Activision Blizzard, 54% held*, July 9, 2008
Reduction in Vivendi’s net debt of €0.6 Bn

9November 2008
(1) Based on the perimeter as of September 2008 and before any potential impact of the share buy-back of Activision Blizzard (2) Standard & Poor’s / Fitch Rating: BBB stable – Moody’s: Baa2 stable(3) Including the put option granted to TF1/M6 on 15% of Canal+ France, exercisable in February 2010 (~€1bn at 2007 year end)(4) Including Activision Blizzard’s cash (~€1.9bn as of September 30, 2008)
0
1
2
3
4
5
6
7
8
9
Slightly> €8 Bn
(1) (3) (4) Slightly> €6 Bn
(1) (3) €5.2 Bn(3)
Dec. 2009 (estimated) Dec. 2008 (estimated) Dec. 2007
Vivendi: strong financial position
~€5.5 Bn of undrawn facilities anticipated at the end of 2008 and 2009 (1)
No significant debt reimbursement before 2012
Strong free cash generation by each business
A quality rating: BBB stable (2)
Controlled financing costs
€9.4 Bn(3) (4)
Sept. 30, 2008
Impact of the Neuf Cegetel and Activision Blizzard deals
Financial net debt (IFRS)

10November 2008
Each year, Vivendi’s dividend increase
Dividend
0
0.2
0.4
0.6
0.8
1
1.2
1.4
2003 2004 2005 2006 2007
Pay-for CAC 40 companies
€0.60
€1.00€1.20
1.30€
2008

11November 2008
In the current environment, Vivendi confirms 2008 outlook
Vivendi confirms its guidance for 2008: increase in results similar to 2007 at constant perimeter, i.e. excluding impact of Neuf Cegetel and Activision Blizzard
In 2009, the dividend corresponding to 2008 earnings will show similar increase, illustrating Vivendi’s confidence in the future performance of its businesses

12November 2008
A world leader in communications and entertainment
#1 Video Games Worldwide
#1 Music Worldwide
#2 Telecoms France
#1 Telecoms Morocco
#1 Pay-TV France

Appendices

November 2008 14
Vivendi Businesses
A worldwide leader in entertainment
#1 Worldwide in music #1 in pay-TV in France
#1 worldwide in video games
#1 Telco in Morocco
#2 Telco in France
56%
20%*
100% 100%/65%
53% 54%*
* Based on shares outstanding

November 2008 15
EBITA for the first 9 months of 2008 is strongly impacted by the integration costs of the Neuf Cegetel and Activision Blizzard deals (€199m)
Revenues: €17.8 Bn, +13.6%(+15.9% at constant currency)
EBITA: €3,848m, -2.1% (-1.0% at constant currency)
Adjusted Net Income: €2,079m, -7.5%
Net Income: €3,982m, +89.3%
9 Months 2008

November 2008 16
Net debt evolution
-11
-10
-9
-8
-7
-6
-5
-4
-3
-5.2
-9.4
-0.8
-0.6
-1.5
+3.3
-4.9
Including: SFR: €(237)m
Maroc Telecom SA: €(331)m
Including: Interest: €(253)m
Tax: €(570)m
Including: Acquisition of Neuf Cegetel €(5,339)m; Activision €635m; Univision, KinoweltSale of UMG publishing catalogues
December 31,2007
Net financial Investments
CFFOafter Capex
Interest, tax & other
Dividendspaid to
shareholders OtherSeptember 30,
2008
+0.3
In euro billions - IFRS Dividends
paid to minorities

November 2008 17
0
0.2
0.4
0.6
0.8
1
1.2
1.4
1.6
2009 2010 2011 2012 2013 2018
in eu
ro bil
lions
VivendiSFR
0
1
2
3
4
5
6
7
8
End of 2008 End of 2009 End of 2010 End of 2011 End of 2012
in eu
ro bil
lions
VivendiSFR
No significant debt reimbursementbefore 2012
At 2008 year end, the economic average term of the group’s consolidated debt should be 4 years
Maturity of bonds
7.5
Amount of bank credit lines*
Important credit lines up to 2011
3.5
At 2008 year end, anticipated available undrawn facilities, net of commercial paper: Vivendi SA: ~ €5.5 Bn SFR: ~ €1.1 Bn
6.0 6.0
5.0
3.5 3.32.7
0.9
1.8
* Bank credit line agreements as of Nov. 13, 2008, of which a €1.5 Bn« bridge to equity » loan, expiring at the end of August 2009

November 2008 18
In euro millions - IFRS 9 months 2008 9 months 2007 ChangeConstant currency
Revenues 3,142 3,265 -3.8% 3.5%
EBITA 408 335 21.8% 27.3%o/w restructuring costs (41) (17) EBITA margin 13.0% 10.3%
Q4 Release Schedule
50 Cent, Akon, Take That, Fall Out Boy, Florent Pagny, Guns N’ Roses, Snow Patrol, Keane, The Killers, Kanye West
Revenues up 3.5%at constant currency
Digital revenues increase +30% at constant currency representing 21% of recorded music
Diversification of revenue sources: merchandising, marketing services and artist management
EBITA up 27.3%at constant currency
BMGP integration completed Achieved margin for publishing above 30% in that period
Positive impact from the reduction in equity compensation provision
Increase in license income
Despite increase in restructuring costs of €24m2008 Outlook confirmed

November 2008 19
September 30, 2007 YTDMillion Units*
Amy Winehouse 3.73.33.2
Hannah Montana 2 2.82.8
15.8
Nelly FurtadoMika
High School Musical 2Top - 5 Artists
13%
UMG
September 30, 2008 YTDMillion Units*
Duffy 3.73.63.4
Lil Wayne 3.02.6
16.3
Amy WinehouseMamma Mia! OST
Jack JohnsonTop - 5 Artists
Top-selling artists
* Physical and digital album sales
US: Previously announced My Space Music offering, featuring the largest initiative in ad-supported interactive audio and streaming of music launched in September
Partnership between Dell and UMG to create pre-recorded digital music MP3 libraries
UK: Nokia launches « Comes With Music »UMG launches « Lost Tunes », an online download store for rare music
France: UMG teams up with SFR to launch the first unlimited music down-loading offer for music without DRM on mobiles in France
Digital Initiatives
In euro millions9 months
2008
% Change at constant
currency
Physical 1,708 -12.0%Digital 557 29.9%License and Other 334 14.5%Recorded music 2,599 -2.2%
Artist services 115 Music Publishing 465 22.4%Inter-co elimination (37) Revenues 3,142 3.5%

November 2008 20
Revenues: +5.0%Canal+ France revenues: +2.9%
Increase of c.110K* subscriptions vs. September 2007 despite the current environment
Strong increase in Canal Overseas
Other activities: +19%, integration of Kinowelt**
EBITA: +21.2%excluding transition costs
Increase in revenues
Benefit of synergies following TPS merger: reduced distribution and programming costs including savings on Ligue 1 rights
Favorable Ligue 1 schedule: 2 fewer match days compared to 2007 (+€32m)
* Excluding the elimination of c. 70K subscribers, in order to maintain a perennial subscription formula** Consolidated since April 2, 2008
Cost synergies in line with plan2008 Outlook confirmed
Transition costs of €64mMore than 90% of TPS subscribers already transferred to the CanalSat platform
In euro millions - IFRS 9 months 2008 9 months 2007 ChangeRevenues 3,391 3,231 5.0%o/w Canal+ France 2,882 2,802 2.9%
EBITA excl. transition costs 685 565 21.2%Transition costs (64) (56) -14.3%EBITA 621 509 22.0%

November 2008 21
5,149
5,182
5,225
5,227
Canal+ Group
Gross additions: 107kNegative adjustment: 72k
Net additions: 35k
Sept 2007
Sept 2008
10,374 k
10,409 kIncrease in digital subscriptions:
Canal+ Le Bouquet represented 78% of the total portfolio of Canal+ at the end of
September 2008compared to 68% at end of September 2007
/
Canal+ France net portfolio (in thousands)*
The New TV Experience
The freedom to fully benefit fromCanal+ and CanalSat either athome or on the go, live or on demand
Launch of the new decoder + LE CUBE: HD satellite terminal with an internet connection. Equipped with a hard disk and offering new services such as « Séries en avant-première »
Launch of CANAL+ A LA DEMANDE and CANALSAT A LA DEMANDE
Canal+ invents LA CLE CANAL+: a pocket-size TNT HD decoder with aUSB key
Signature of a multi-year agreement between CanalPlay and Gaumont for the downloading of a large selection of movies
* Individual and group subscriptions at Canal+, CanalSat and TPS (in 2007) in metropolitan France, DOM/TOM and Africa

November 2008 22
MobileContinued growth of mobile service revenues: +2.6%(+4.5% excluding the impact of regulated tariff cuts*)
Strong increase in postpaid customer base(+10.7% YoY) and in the mix:postpaid represent 69% (+2.8 pts YoY) of the19.2 m** SFR customers
Data revenues up 32.6% YoY
3G customers: +50.4% YoY at 5.2m
EBITDA margin at 40.1% in a very competitive market, despite:
Increase in postpaid customer recruitments leading to higher acquisition and retention costs (+1.9 pts as a % of mobile service revenues)
Increase in interconnection costs, due to unlimited bundles
Regulatory pressure
Restructuring costs €110m of which voluntary redundancy plan (€88m)
* -13% for call terminations as of January 1, 2008** including customers of the Debitel and Neuf Mobile offers since June 30, 2008 (438k as of that date)
*** please refer to comparable basis definition on slide 25
Fixed and ADSLRevenues: +2.0% vs. 2007 on a comparable basis***
Increase of mass market broadband Internet and Corporate segment partly offset by wholesale and switched voice
Increase in total number of broadband Internet clients to 3.73 million, + 8.2% vs. 2007 cb
EBITDA: €303m, +14m vs. 2007 on a comparable basis
In euro millions - IFRS 9 months 2008* 9 months 2007 ChangeRevenues 8,420 6,647 26.7%Mobile 6,716 6,539 2.7%Fixed and ADSL 1,916 108 naIntercos (212) na naEBITDA 2,997 2,724 10.0%Mobile 2,694 2,746 -1.9%Fixed and ADSL 303 (22) na
EBITA excl. restructuring 2,076 2,066 0.5%Restructuring costs (110) na naEBITA 1,966 2,066 -4.8%* Including Neuf Cegetel since April 15 na not applicable
November 2008 23
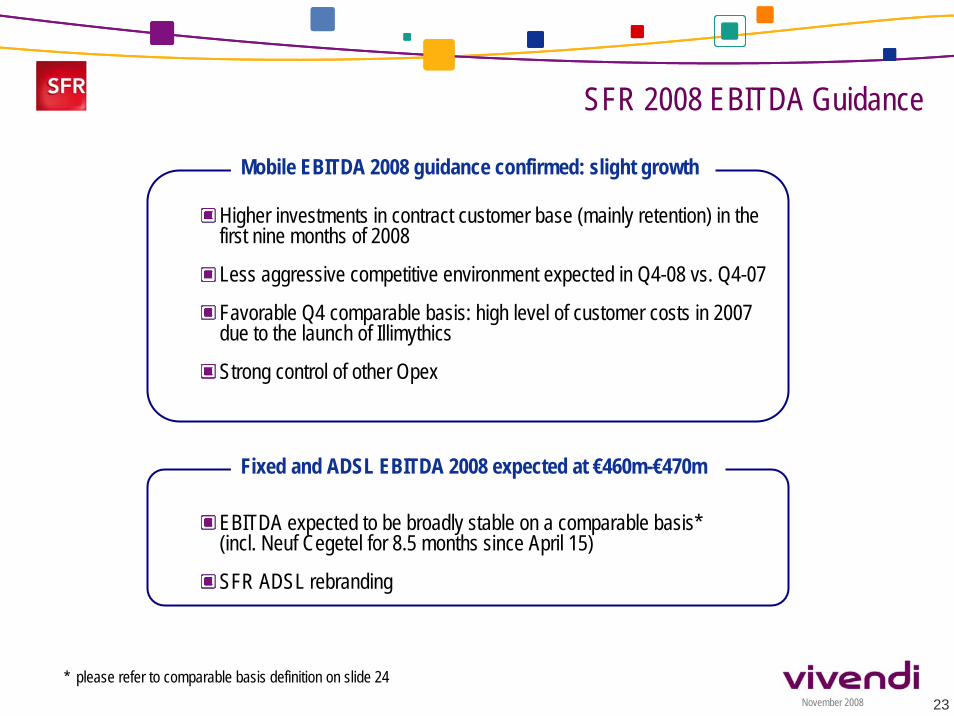
Higher investments in contract customer base (mainly retention) in the first nine months of 2008
Less aggressive competitive environment expected in Q4-08 vs. Q4-07
Favorable Q4 comparable basis: high level of customer costs in 2007 due to the launch of Illimythics
Strong control of other Opex
SFR 2008 EBITDA Guidance
Mobile EBITDA 2008 guidance confirmed: slight growth
EBITDA expected to be broadly stable on a comparable basis* (incl. Neuf Cegetel for 8.5 months since April 15)
SFR ADSL rebranding
Fixed and ADSL EBITDA 2008 expected at €460m-€470m
* please refer to comparable basis definition on slide 24

24November 2008
(including SRR) 9 months 2008
9 months 2007 Change
MOBILECustomers (in ‘000) * 19,228 18,109 + 6.2%Proportion of postpaid clients * 69.0% 66.2% +2,8pts3G customers (in ‘000) * 5,200 3,457 + 50.4%Market share on customer base (%) * 34.1% 34.1% -Network market share (%) 36.0% 36.0% -12-month rolling blended ARPU (€/year) ** 431 443 -2.7%12-month rolling postpaid ARPU (€/year) ** 556 575 -3.3%12-month rolling prepaid ARPU (€/year) ** 182 193 -5.7%Net data revenues as a % of service revenues ** 17.1% 13.2% +3,9ptsPostpaid customer acquisition costs (€/gross adds) 213 204 + 4.4%Prepaid customer acquisition costs (€/gross adds) 25 23 + 8.7%Acquisition costs as a % of service revenues 7.1% 6.2% +0,9ptRetention costs as a % of service revenues 5.9% 4.9% +1,0pt
FIXED AND ADSLBroadband Internet EoP customer base (in ‘000) *** 3,730 3,447 + 8.2%Enterprise data links (in ‘000) 188 165 + 13.9%
SFR
* including Neuf Mobile and Debitel clients since June 30, 2008 (438k at that date). Not including MVNO clients which are estimated at approximately 1,050k at Sept. 2008 vs. 969k at end of Sept. 2007
** including mobile terminations*** as from September 30, 2008, broadband Internet customers are disclosed excluding Neuf Cegetel customers who subscribed but
that are not activated (55k customers)
Launch of SFR’s « neufbox »: 1st triple-play offer with SFR service included
SFR launches the 1st « mobile internet devices » on the French market: Eee PC 901 with an integrated 3G+ connection, Archos 3G+, SFR M! Pocket PC
Launch of Ma Sfere, a new experience that allows for moving between mobile and PC
1st offer for unlimited music downloading without DRM on mobile
2 new convergence solutions for businesses: 9Office SFR and Global Access Ipnet
SFR. And the world is yours.

November 2008 25
IFRS %
in euro million Change
Outgoing revenues net of promotions 5,233 82% 5,059 81% 3.4% 5,079 81% 3.0%Mobile incoming 641 10% 618 10% 3.7% 618 10%Fixed incoming revenues 295 5% 306 5% -3.6% 311 5%Roaming in 179 2% 199 3% -10.1% 199 3%Network revenues 6,348 6,182 2.7% 6,207 2.3%
Other mobile 68 1% 72 1% -5.6% 72 1%Service revenues 6,416 100% 6,254 100% 2.6% 6,279 100% 2.2%
Equipment sales, net 300 285 5.3% 297 Total mobile revenues 6,716 6,539 2.7% 6,576 2.1%
Broadband Internet and fixed revenues 1,916 108 na 1,879 2.0%
Elimination of intersegment transactions -212 0 na -200 Total SFR revenues 8,420 6,647 26.7% 8,255 2.0%of which data revenues from mobile services 1,098 828 32.6%
% Change on a Comparable
Basis *
sept-07 YTD
Comparable Basis*
sept-08 YTD sept-07 YTD
Actual Actual
* Comparable basis mainly illustrates:(i) the full consolidation of the fixed and ADSL activities of Tele2 France as if this acquisition had taken place on January 1, 2007(ii) the full consolidation of Neuf Cegetel and Club Internet as if this acquisition had taken place on April 15, 2007(iii) the restatement of 2007 figures in compliance with IFRIC 12 Service Concession Arrangements
SFR: Detailed revenues
na : not applicable

November 2008 26
In euro millions - IFRS 9 months 2008 9 months 2007 ChangeConstant currency
Revenues 1,930 1,819 6.1% 8.3%Mobile 1,382 1,266 9.2% 11.4%Fixed and Internet 737 743 -0.8% 1.2%Intercos (189) (190) -0.5% -1.1%
EBITDA 1,147 1,057 8.5% 10.9%
EBITA 913 851 7.3% 9.7%Mobile 708 659 7.4% 9.8%Fixed and Internet 205 192 6.8% 9.1%
Maroc Telecom GroupRevenues: +7.2%at constant currency and constant perimeter*
Increase in mobile revenues, up 10.6% at constant currency and constant perimeterFixed and Internet: -0.3% at constant currency and constant perimeter
EBITA: +10.2%at constant currency and constant perimeter*
Improvement of EBITA margin by more than 1 pt*Cost control, including acquisition costs, despite an increasingly competitive environment
* Constant perimeter illustrates the consolidation of Gabon Telecom, consolidated since March 1, 2007, as if the transaction had occurred on January 1, 2007
Continued increase in customer base
Mobile customers: 17.2 m +18.5% YoYFixed customers: 1.5 m +2.3% YoYInternet customers: 0.5 m +9.5% YoY2008 Outlook confirmed

November 2008 27
Maroc Telecom Group
* Maroc Telecom SA’s fixed customer base is now displayed in numbers of equivalent lines. It was previously displayed in numbers of accesses.** Including narrowband and ADSL
In '000 9 months2008
9 months2007 Change
MAROC TELECOMNumber of mobile customers 14,629 12,838 14.0%% Prepaid customers 96.1% 96.2%Number of fixed lines* 1,314 1,324 -0.8%Total Internet access** 482 449 7.3%
SubsidiariesNumber of mobile customers 2,575 1,679 53.4%Number of fixed lines 216 172 25.6%Internet customers 36 24 50.0%

November 2008 28
A successful merger: Seamless integration of Vivendi Games and ActivisionIncreased profitabilityExpanded global reach of powerful franchises
Very strong performance in the first quarter of the combined company: Q3 results exceed prior outlook*Continued strong worldwide sales of the best-selling franchises in the industry:
Guitar Hero is the best-selling franchise in the U.S, on all console platforms for the first 9 months**
Call of Duty 4: Modern Warfare is still selling at launch pricing one full year after its releaseWorld of Warcraft has now exceeded 11 million subscribers worldwide
Confidence in the long-term growth opportunitiesBoard authorized a $1 billion stock repurchase program***
* See outlook for quarter ending September 30, 2008 as presented in the Activision Blizzard press release, July 31 2008 ** According to the NPD Group
*** Activision Blizzard may suspend or discontinue the repurchase program at anytime. Vivendi does not intend to sell any of its Activision Blizzardshares in that program. Additionally, Vivendi does not have any current plans to buy additional Activision Blizzard shares.

November 2008 29
Revenues up 29%:Activision Publishing up 58% driven by Guitar Heroand Call of Duty 4: Modern Warfare
Blizzard Entertainment flat with 2007 which is exceptional given the success of The Burning Crusade in 2007. 2nd expansion pack launched on November 13, 2008
Operating income up 46%Activision Publishing: $101m vs. $66m loss in 2007
Blizzard Entertainment: 51.6% margin
2nd expansion pack of World of Warcraft: Wrath of the Lich King, Guitar Hero World Tour, Guitar Hero: On Tour Decades, Call of Duty: World at War , Quantum of Solace, Spider-Man: Web of Shadows, Madagascar: Escape 2 Africa
** As defined by Vivendi, includes transaction costs, restructuring costs and balance sheet write-offs of a number of Sierra titles*** Comparable basis includes Activision Inc historical results prior to July 10, 2008. See definitions provided on slide 34
**** Information from Activision Blizzard’s press release of July 31, 2008 and confirmed in the press release of November 5, 2008. In addition, see definitions provided on slide 34
• Consolidation of Activision Inc. from July 10, 2008
IFRS in Euros
In euro millions - IFRS 9 months 2008 9 months 2007 ChangeRevenues 919 716 28.4%
EBITA before integration costs 122 160 -23.8%Integration costs** (89) na naEBITA 33 160 -79.4%
Combined 2008 outlook set to exceed the comparable year 2009 US Non-GAAP financial target****
Q3 YTD Standalone resultson a US Non-GAAP US$ comparable basis***
Activision Blizzard’s holiday line-up,the strongest in its history:

30November 2008
Activision Blizzard: September 30, 2008
13%
US Non-GAAP comparable basis segment performance*
July 9, 2008: Vivendi Games and Activision completed the transaction, announced on December 2, 2007 to create Activision Blizzard as the world’s most profitable pure-play online and console game publisher
August 12, 2008: Blizzard Entertainment and NetEase.com announced an agreement to license StarCraft II, Warcraft III: Reign of Chaos, Warcraft III: The Frozen Throne, and Battle.net platform, which provides online multiplayer services for these games
September 8, 2008: Activision Blizzard completed a two-for-one stock split
September 12, 2008: Activision Publishing acquired FreeStyle Games, a premier U.K.-based video game developer specializing in music-based games
October 28, 2008: World of Warcraft exceeded 11 million players
Recent EventsHighlights for Activision BlizzardSeptember Quarter:
Two of the top-10 titles in dollars on all console platforms in the U.S**, #1 third-party publisher on the Nintendo DS**
• Guitar Hero: On Tour was the #1 best-selling title overall in North America for the Nintendo DS**
• Two of the top-five PC titles worldwide –World of Warcraft: Battle Chest and Call of Duty 4: Modern Warfare***
First nine months of 2008:Guitar Hero remained the #1 best selling franchise in U.S. on all console platforms***
Core
US$ in millionsRevenues Operating Income
ActivisionBlizzardDistribution
Core2,689 +29%
101447
8
556 +46%
9 Months 2008 9 Months 2008
* Information is from Activision Blizzard’s press release dated November 5, 2008** According to The NPD Group
*** According to Charttrack, Gfk and The NPD Group
ActivisionBlizzardDistribution
1,584 +58%866 +1%239 +2%

31November 2008
Activision Blizzard: Guidance 2008
Activision Blizzard has reaffirmed its calendar year 2008 US Non-GAAP combined outlook of $4.9 billion in revenues and $1.2 billion in operating income*,
exceeding the comparable year 2009 US Non-GAAP financial targets that were provided on December 2, 2007 by:
approx. $600 million in US Non-GAAP net revenuesapprox. $100 million in US Non-GAAP operating income
Synergies expected to be $100-$150 million
* Information is from Activision Blizzard’s press release dated November 5, 2008 and speaks of that date. Additionnally, please see slide 34 for definitions** Information is from Activision Blizzard’s press release dated November 5, 2008 and speaks of that date. This press release includes the reconciliation of the US
GAAP fourth quarter guidance. Additionnally, please see slide 34 for definitions
Activision Blizzard outlook for Q4 2008**
US GAAP:Net revenues of $1.6 billionLoss per diluted share of $0.01
US Non-GAAP :Net revenues of $2.2 billionEarnings per diluted share of $0.29

November 2008 32
A dual and collegial corporate governance structure
Internal control : creation of the Risks Committee in 2006
Attentiveness to shareholders: Thomson Extel 2006, 2007 and 2008 Award for Investor Relations in Media Sector
Appendix : Governance
The Supervisory Board chaired by Jean-René Fourtou■ 13 members (as of April 25, 2008): 11 independent; 12 European citizens (2 Belgian, 8 French, 1 Polish, 1 Spanish); 1 American■ 4 Committees of the Supervisory Board: Strategy Committee; Audit Committee; Human Resources Committee; Corporate Governance Committee■ 9 meetings in 2007; participation rate: 94%
Management Board chaired by Jean-Bernard Lévy7 members (heads of Vivendi’s business units, the Chief Financial Officer and the senior Vice-President,
Human resources) ; 4 European citizens (3 French and 1 German), 1 Moroccan citizen, 1 American citizenMain areas of expertise include: implementation of Vivendi’s strategic orientations in collaboration with
the Supervisory Board ; social and human resources policy ; environmental matters, Compliance Program activities, internal audit and internal control procedures, monitoring of risk assessment and of the work of the Risks Committee.

November 2008 33
Adjusted earnings before interest and income taxes (EBITA): EBIT (defined as the difference between charges and income that do not result from financial activities, equity affiliates, discontinued operations and tax) before the amortization of intangible assets acquired through business combinations and the impairment losses of goodwill and other intangible assets acquired through business combinations.Adjusted net income includes the following items: EBITA, income from equity affiliates, interest, income from investments, including dividends received from unconsolidated interests as well as interest collected on advances to equity affiliates and loans to unconsolidated interests, as well as taxes and minority interests related to these items. It does not include the following items: impairment losses of goodwill and other intangibles acquired through business combinations, the amortization of intangibles acquired through business combinations, other financial charges and income, earnings from discontinued operations, provision for income taxes and minority interests relating to these adjustments, as well as non-recurring tax items (notably the change in deferred tax assets relating to the Consolidated Global Profit Tax System).Cash flow from operations (CFFO): Net cash provided by operating activities after capital expenditures net, dividends received from equity affiliates and unconsolidated companies and before income taxes paid.Capital expenditures net (Capex, net): Capital expenditures, net of proceeds from property, plant and equipment and intangible assets.Financial net debt: Is calculated as the sum of long-term and short-term borrowings and other long-term and short-term financial liabilities as reported on the consolidated statement of financial position, less cash and cash equivalents as reported on the consolidated statement of financial position, as well as derivative instruments in assets and cash deposits backing financing (included in the Consolidated Statement of Financial Position under “financial assets”). The percentage of change are compared with the same period of the previous accounting year, exceptparticular mention.
Glossary

November 2008 34
Activision Blizzard – standalone - definitions
US Non-GAAP Financial Measures*
Activision Blizzard provides net revenues, net income (loss), earnings (loss) per share and operating margin data and guidance both including (in accordance with US GAAP) and excluding (US Non-GAAP): the impact of the change in deferred net revenues and costs of sales related to online-enabled key titles on certain platforms and also the deferred revenues and costs related to the MMORPG platform for World of Warcraft ; the impact of expenses related to equity-based compensation costs; Activision Blizzard’s non-core exit operations (which is the operating results of products and operations from the historical Vivendi Games, Inc. businesses that the company has begun to exit or wind down); one-time costs related to the business combination between Activision, Inc. and Vivendi Games, Inc. (including transaction costs, integration costs, and restructuring activities); the amortization of intangibles and the increase in the fair value of inventories and the associated changes in cost of sales resulting from purchase price accounting adjustments from the business combination; and the associated tax benefits.
Comparable basis
Comparable basis includes both Activision, Inc. and Vivendi Games from January 1st and is based on standalone US GAAP.* Information from Activision Blizzard’s press release dated November 5, 2008 and speaks of that date

35November 2008
Important legal disclaimer
This presentation contains forward-looking statements with respect to the financial condition, results of operations, business, strategy and plans of Vivendi. Although Vivendi believes that such forward-looking statements are based on reasonable assumptions, such statements are not guarantees of future performance. Actual results may differ materially from the forward-looking statements as a result of a number of risks and uncertainties, many of which are outside our control, including, but not limited to the risk that Vivendi will not be able to obtain the necessary approvals in connection with certain transactions, as well as the risks described in the documents Vivendi filed with the Autorité des MarchésFinanciers (French securities regulator) and which are also available in English on our web site (www.vivendi.com). Investors and security holders may obtain a free copy of documents filed by Vivendi with the Autorité des Marchés Financiers at www.amf-france.org, or directly from Vivendi. The present forward-looking statements are made as of the date of the present presentation and Vivendi disclaims any intention or obligation to provide, update or revise any forward-looking statements, whether as a result of new information, future events or otherwise. The release schedules for both UMG and Activision Blizzard may change.

36November 2008
Investor Relations team
Aurélia ChevalIR Director
Agnès De LeersnyderIR Senior Analyst
Eileen McLaughlinV.P. Investor Relations North America
Daniel ScolanExecutive Vice President Investor Relations
For all financial or business information, please refer to our Investor Relations website at: http://www.vivendi.com/ir
New York800 Third Avenue
New York, NY 10022 / USAPhone: +1.212.572.1334
Fax: +1.212.572.7112
Paris42, Avenue de Friedland
75380 Paris cedex 08 / FrancePhone: +33.1.71.71.32.80
Fax: +33.1.71.71.14.16