morgan stanley institutional fund trust - proxy direct
TRANSCRIPT

INVESTMENT MANAGEMENT
Semi-AnnualReportMarch 31, 2012
Morgan StanleyInstitutional Fund Trust
Balanced PortfolioBalanced Portfolio
Equity PortfolioMid Cap Growth Portfolio
Fixed Income PortfoliosCore Fixed Income PortfolioCore Plus Fixed Income PortfolioCorporate Bond Portfolio
(formerly Investment Grade FixedIncome Portfolio)
High Yield PortfolioLimited Duration PortfolioLong Duration Fixed Income Portfolio
e-DELIVERY: GO PAPERLESS It’s faster, easier and greener. Sign up today at: www.icsdelivery.com

(This Page has been left blank intentionally.)

Shareholders’ Letter................................................2
Expense Examples ..................................................3
Portfolios of Investments
Balanced Portfolio:Balanced .................................................................................4
Equity Portfolio:Mid Cap Growth .....................................................................16
Fixed Income Portfolios:Core Fixed Income .................................................................19Core Plus Fixed Income ..........................................................26Corporate Bond (formerly Investment Grade Fixed Income) .......34High Yield..............................................................................41Limited Duration ....................................................................44Long Duration Fixed Income....................................................49
Statements of Assets and Liabilities .......................54
Statements of Operations ......................................58
Statements of Changes in Net Assets.....................60
Financial Highlights................................................65
Notes to Financial Statements................................85
U.S. Privacy Policy ................................................95
Trustee and Officer Information ..............................98
This report is authorized for distribution only when preceded or accompanied by prospectuses of the Morgan Stanley Institutional Fund Trust.To receive a prospectus and/or SAI, which contains more complete information such as investment objectives, charges, expenses, policies forvoting proxies, risk considerations, and describes in detail each of the Portfolio’s investment policies to the prospective investor, please calltoll free 1-(800) 548-7786. Please read the prospectuses carefully before you invest or send money.
Additionally, you can access portfolio information including performance, characteristics, and investment team commentary through MorganStanley Investment Management’s website: www.morganstanley.com/im.
Market forecasts provided in this report may not necessarily come to pass. There is no guarantee that any sectors mentioned will continue toperform as discussed herein or that securities in such sectors will be held by the Portfolio in the future. There is no assurance that a Portfoliowill achieve its investment objective. Portfolios are subject to market risk, which is the possibility that market values of securities owned by thePortfolio will decline and, therefore, the value of the Portfolio’s shares may be less than what you paid for them. Accordingly, you can losemoney investing in Portfolios. Please see the prospectus for more complete information on investment risks.
Table of Contents
1
2012 Semi-Annual Report
March 31, 2012

2
Dear Shareholders:
We are pleased to present to you the Morgan Stanley Institutional Fund Trust’s (the “Fund”) Semi-Annual Report for the sixmonths ended March 31, 2012. Our Fund currently offers 8 portfolios providing investors with asset allocation, domesticequity and fixed-income products. The Fund’s portfolios, together with the portfolios of the Morgan Stanley InstitutionalFund, Inc., provide investors with a means to help them meet specific investment needs and to allocate their investmentsamong equities and fixed income.
Sincerely,
Arthur LevPresident and Principal Executive Officer
April 2012
Shareholders’ Letter
2012 Semi-Annual Report
March 31, 2012

3
As a shareholder of the Portfolio, you may incur two types of costs: (1) transactional costs, including sales charge (loads) on purchasepayments, if applicable; and (2) ongoing costs, including management fees, distribution and shareholder servicing fees; and otherPortfolio expenses. These examples are intended to help you understand your ongoing costs (in dollars) of investing in the Portfolioand to compare these costs with the ongoing costs of investing in other mutual funds.
These examples are based on an investment of $1,000 invested at the beginning of the six-month period ended March 31, 2012and held for the entire six-month period.
Actual Expenses
The table below provides information about actual account values and actual expenses. You may use the information in this table,together with the amount you invested, to estimate the expenses that you paid over the period. Simply divide your account value by$1,000 (for example, an $8,600 account value divided by $1,000 = 8.6), then multiply the result by the number in the table underthe heading entitled “Actual Expenses Paid During Period” to estimate the expenses you paid on your account during this period.
Please note that “Actual Expenses Paid During Period” are grossed up to reflect Portfolio expenses prior to the effect of ExpenseOffset (See Note F in the Notes to Financial Statements). Therefore, the annualized net expense ratios may differ from the ratio ofexpenses to average net assets shown in the Financial Highlights.
Hypothetical Example for Comparison Purposes
The table below provides information about hypothetical account values and hypothetical expenses based on the Portfolio’s actualexpense ratio and an assumed rate of return of 5% per year before expenses, which is not the Portfolio’s actual return. Thehypothetical account values and expenses may not be used to estimate the actual ending account balance or expenses you paid for theperiod. You may use this information to compare the ongoing costs of investing in the Portfolio and other funds. To do so, comparethis 5% hypothetical example with the 5% hypothetical examples that appear in the shareholder reports of the other funds.
Please note that the expenses shown in the table are meant to highlight your ongoing costs only and do not reflect any transactionalcosts, such as sales charges (loads, if applicable). Therefore, the hypothetical account values and hypothetical expenses are useful incomparing ongoing costs only, and will not help you determine the relative total costs of owning different funds. In addition, ifthese transactional costs were included, your costs would have been higher. Actual Net Beginning Actual Ending Expenses Expense Account Account Hypothetical Paid Hypothetical Ratio Value Value Ending Account During Expenses Paid DuringPortfolio 10/1/11 3/31/12 Value Period* During Period* Period**Balanced Portfolio Class I $1,000.00 $1,173.20 $1,019.20 $6.30 $5.86 1.16%Balanced Portfolio Class P 1,000.00 1,171.30 1,017.95 7.65 7.11 1.41Mid Cap Growth Portfolio Class I 1,000.00 1,215.50 1,021.50 3.88 3.54 0.70Mid Cap Growth Portfolio Class P 1,000.00 1,213.80 1,020.25 5.26 4.80 0.95Core Fixed Income Portfolio Class I 1,000.00 1,031.20 1,022.55 2.49 2.48 0.49Core Fixed Income Portfolio Class P 1,000.00 1,029.70 1,021.30 3.75 3.74 0.74Core Plus Fixed Income Portfolio Class I 1,000.00 1,045.20 1,022.05 3.02 2.98 0.59Core Plus Fixed Income Portfolio Class P 1,000.00 1,042.70 1,020.80 4.29 4.24 0.84Corporate Bond Portfolio Class I 1,000.00 1,040.60 1,021.20 3.88 3.84 0.76Corporate Bond Portfolio Class P 1,000.00 1,039.80 1,020.45 4.64 4.60 0.91Corporate Bond Portfolio Class H 1,000.00 1,039.20 1,019.95 5.15 5.10 1.01Corporate Bond Portfolio Class L 1,000.00 1,038.00 1,018.70 6.42 6.36 1.26High Yield Portfolio Class I 1,000.00 1,023.00 1,006.18 1.07+ 1.06 0.73High Yield Portfolio Class P 1,000.00 1,023.00 1,005.82 1.44+ 1.42 0.98High Yield Portfolio Class H 1,000.00 1,023.00 1,005.82 1.44+ 1.42 0.98High Yield Portfolio Class L 1,000.00 1,023.00 1,005.46 1.80+ 1.79 1.23Limited Duration Portfolio Class I 1,000.00 1,019.00 1,022.15 2.88 2.88 0.57Limited Duration Portfolio Class P 1,000.00 1,017.70 1,020.90 4.14 4.14 0.82Long Duration Fixed Income Portfolio Class I 1,000.00 1,010.00 1,022.50 2.51 2.53 0.50Long Duration Fixed Income Portfolio Class P 1,000.00 1,007.90 1,021.25 3.76 3.79 0.75
* Expenses are calculated using each Portfolio Class’ annualized net expense ratio (as disclosed), multiplied by the average account value over the period,and multiplied by 183/366 (to reflect the most recent one-half year period).
**Annualized.+ Expenses are calculated using each Portfolio Class’ annualized net expense ratio (as disclosed), multiplied by the average account value over the period,
and multiplied by 53/366 (to reflect the actual days in period).
Expense Examples (unaudited)
2012 Semi-Annual Report
March 31, 2012

4
Commercial Mortgage Backed Securities (0.6%)Citigroup Commercial Mortgage
Trust (See Note G-2)6.07%, 12/10/49 (c) $ 50 $ 58
JP Morgan Chase Commercial Mortgage Securities Corp.,4.17%, 8/15/46 70 764.39%, 7/15/46 (b) 100 109
243
Corporate Bonds (8.0%)Finance (3.6%)ABB Treasury Center USA, Inc.
2.50%, 6/15/16 (b) 55 56Abbey National Treasury Services PLC,
MTN3.88%, 11/10/14 (b) 100 101
Bank of America Corp.5.63%, 7/1/20 15 16
BNP Paribas SA5.00%, 1/15/21 40 40
Brandywine Operating Partnership LP4.95%, 4/15/18 50 51
Cigna Corp.2.75%, 11/15/16 50 51
Citigroup, Inc. (See Note G-2),6.13%, 5/15/18 100 1128.50%, 5/22/19 5 6
CNA Financial Corp.5.75%, 8/15/21 45 48
Coventry Health Care, Inc.5.45%, 6/15/21 35 38
General Electric Capital Corp.5.88%, 1/14/38 50 55
Genworth Financial, Inc.7.20%, 2/15/21 30 31
Goldman Sachs Group, Inc. (The)5.75%, 1/24/22 80 82
Hartford Financial Services Group, Inc.5.50%, 3/30/20 25 27
HSBC Holdings PLC4.00%, 3/30/22 45 45
JPMorgan Chase & Co.,3.15%, 7/5/16 60 624.95%, 3/25/20 25 27
Lloyds TSB Bank PLC5.80%, 1/13/20 (b) 100 103
Macquarie Bank Ltd.6.63%, 4/7/21 (b) 25 25
Macquarie Group Ltd.6.00%, 1/14/20 (b) 25 25
Merrill Lynch & Co., Inc.,MTN6.88%, 4/25/18 40 44
Portfolio of InvestmentsBalanced Portfolio Face Amount Value (000) (000)
Face Amount Value (000) (000)
Fixed Income Securities (36.5%)Agency Adjustable Rate Mortgage (0.1%)Federal National Mortgage Association,
Conventional Pools:2.39%, 5/1/35 $ 59 $ 63
Agency Fixed Rate Mortgages (9.0%)Federal Home Loan Mortgage Corporation,
April TBA:3.00%, 4/25/27 (a) 150 155Gold Pools:4.00%, 12/1/41 86 914.50%, 6/1/39 504 5355.00%, 10/1/35 292 3157.50%, 5/1/35 16 19
Federal National Mortgage Association,April TBA:2.50%, 4/25/27 (a) 150 152Conventional Pools:4.00%, 11/1/41 65 685.00%, 9/1/39 - 5/1/41 315 3435.50%, 5/1/37 - 8/1/38 390 4286.00%, 1/1/38 85 947.50%, 8/1/37 31 37
Government National Mortgage Association,April TBA:3.50%, 4/25/42 (a) 370 3864.00%, 4/25/42 (a) 825 886Various Pools:4.50%, 4/15/39 - 8/15/39 149 163
3,672Asset-Backed Securities (0.8%)FUEL Trust
4.21%, 4/15/16 (b) 200 205Santander Drive Auto Receivables Trust
3.06%, 11/15/17 50 50U-Haul S Fleet LLC
4.90%, 10/25/23 (b) 83 87
342Collateralized Mortgage Obligations — Agency Collateral Series (0.8%)Federal Home Loan Mortgage Corporation,
2.97%, 10/25/21 90 92IO0.68%, 1/25/21 (c) 695 29IO PAC REMIC6.23%, 6/15/40 (c) 463 89
Federal National Mortgage Association,IO REMIC5.00%, 8/25/37 84 56.36%, 9/25/38 (c) 189 40
Government National Mortgage Association,IO REMIC6.34%, 6/20/40 (c) 130 236.36%, 4/16/41 (c) 310 59
337
The accompanying notes are an integral part of the financial statements.
2012 Semi-Annual Report
March 31, 2012 (unaudited)
5
Portfolio of Investments (cont’d)Balanced Portfolio
The accompanying notes are an integral part of the financial statements.
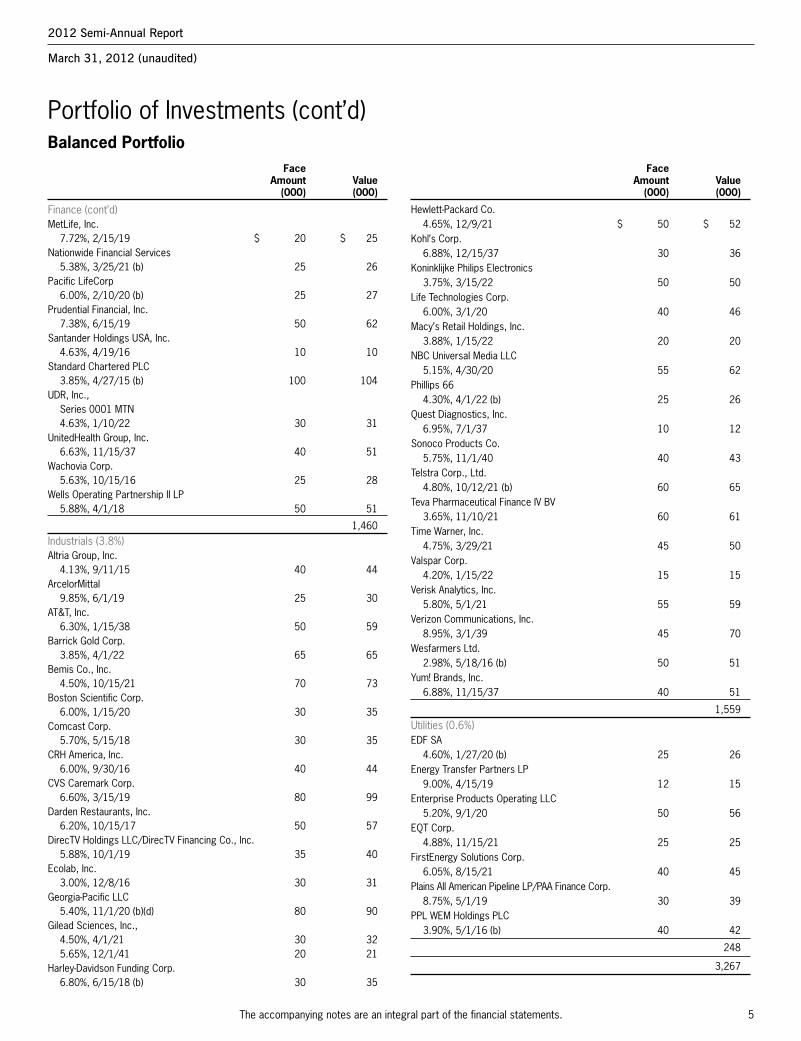
Hewlett-Packard Co.4.65%, 12/9/21 $ 50 $ 52
Kohl’s Corp.6.88%, 12/15/37 30 36
Koninklijke Philips Electronics3.75%, 3/15/22 50 50
Life Technologies Corp.6.00%, 3/1/20 40 46
Macy’s Retail Holdings, Inc.3.88%, 1/15/22 20 20
NBC Universal Media LLC5.15%, 4/30/20 55 62
Phillips 664.30%, 4/1/22 (b) 25 26
Quest Diagnostics, Inc.6.95%, 7/1/37 10 12
Sonoco Products Co.5.75%, 11/1/40 40 43
Telstra Corp., Ltd.4.80%, 10/12/21 (b) 60 65
Teva Pharmaceutical Finance IV BV3.65%, 11/10/21 60 61
Time Warner, Inc.4.75%, 3/29/21 45 50
Valspar Corp.4.20%, 1/15/22 15 15
Verisk Analytics, Inc.5.80%, 5/1/21 55 59
Verizon Communications, Inc.8.95%, 3/1/39 45 70
Wesfarmers Ltd.2.98%, 5/18/16 (b) 50 51
Yum! Brands, Inc.6.88%, 11/15/37 40 51
1,559
Utilities (0.6%)EDF SA
4.60%, 1/27/20 (b) 25 26Energy Transfer Partners LP
9.00%, 4/15/19 12 15Enterprise Products Operating LLC
5.20%, 9/1/20 50 56EQT Corp.
4.88%, 11/15/21 25 25FirstEnergy Solutions Corp.
6.05%, 8/15/21 40 45Plains All American Pipeline LP/PAA Finance Corp.
8.75%, 5/1/19 30 39PPL WEM Holdings PLC
3.90%, 5/1/16 (b) 40 42
248
3,267
Face Amount Value (000) (000)
Face Amount Value (000) (000)
Finance (cont’d)MetLife, Inc.
7.72%, 2/15/19 $ 20 $ 25Nationwide Financial Services
5.38%, 3/25/21 (b) 25 26Pacific LifeCorp
6.00%, 2/10/20 (b) 25 27Prudential Financial, Inc.
7.38%, 6/15/19 50 62Santander Holdings USA, Inc.
4.63%, 4/19/16 10 10Standard Chartered PLC
3.85%, 4/27/15 (b) 100 104UDR, Inc.,
Series 0001 MTN4.63%, 1/10/22 30 31
UnitedHealth Group, Inc.6.63%, 11/15/37 40 51
Wachovia Corp.5.63%, 10/15/16 25 28
Wells Operating Partnership II LP5.88%, 4/1/18 50 51
1,460Industrials (3.8%)Altria Group, Inc.
4.13%, 9/11/15 40 44ArcelorMittal
9.85%, 6/1/19 25 30AT&T, Inc.
6.30%, 1/15/38 50 59Barrick Gold Corp.
3.85%, 4/1/22 65 65Bemis Co., Inc.
4.50%, 10/15/21 70 73Boston Scientific Corp.
6.00%, 1/15/20 30 35Comcast Corp.
5.70%, 5/15/18 30 35CRH America, Inc.
6.00%, 9/30/16 40 44CVS Caremark Corp.
6.60%, 3/15/19 80 99Darden Restaurants, Inc.
6.20%, 10/15/17 50 57DirecTV Holdings LLC/DirecTV Financing Co., Inc.
5.88%, 10/1/19 35 40Ecolab, Inc.
3.00%, 12/8/16 30 31Georgia-Pacific LLC
5.40%, 11/1/20 (b)(d) 80 90Gilead Sciences, Inc.,
4.50%, 4/1/21 30 325.65%, 12/1/41 20 21
Harley-Davidson Funding Corp.6.80%, 6/15/18 (b) 30 35
2012 Semi-Annual Report
March 31, 2012 (unaudited)

6
Portfolio of Investments (cont’d)Balanced Portfolio
The accompanying notes are an integral part of the financial statements.
Common Stocks (49.5%)Aerospace & Defense (1.5%)Alliant Techsystems, Inc. (d) 648 $ 32Boeing Co. (The) 601 45Exelis, Inc. 594 7General Dynamics Corp. 504 37Goodrich Corp. 197 25Honeywell International, Inc. 1,602 98Huntington Ingalls Industries, Inc. (d)(e) 53 2L-3 Communications Holdings, Inc. (d) 200 14Lockheed Martin Corp. (d) 262 23Northrop Grumman Corp. 222 13Precision Castparts Corp. 385 67Raytheon Co. (d) 1,435 76Rockwell Collins, Inc. 375 22Textron, Inc. 500 14United Technologies Corp. 1,579 131
606
Air Freight & Logistics (0.4%)C.H. Robinson Worldwide, Inc. (d) 200 13Expeditors International of Washington, Inc. 200 9FedEx Corp. 400 37United Parcel Service, Inc., Class B (d) 1,153 93
152
Airlines (0.0%)Southwest Airlines Co. 1,300 11
Auto Components (0.3%)BorgWarner, Inc. (e) 835 71Johnson Controls, Inc. (d) 1,614 52
123
Automobiles (0.0%)Ford Motor Co. (d) 531 7
Beverages (0.8%)Brown-Forman Corp., Class B 119 10Coca-Cola Co. (The) 2,226 165Coca-Cola Enterprises, Inc. 577 16Constellation Brands, Inc., Class A (d)(e) 500 12Molson Coors Brewing Co. 400 18PepsiCo, Inc. 1,485 99
320
Biotechnology (0.5%)Amgen, Inc. 1,071 73Biogen Idec, Inc. (e) 314 39Celgene Corp. (e) 508 39Gilead Sciences, Inc. (e) 1,059 52
203
Capital Markets (0.7%)Ameriprise Financial, Inc. 100 6Bank of New York Mellon Corp. (The) 1,914 46BlackRock, Inc. 31 6Charles Schwab Corp. (The) 747 11
Face Amount Value (000) (000)
Value Shares (000)
Mortgages — Other (1.3%)Banc of America Alternative Loan Trust,
5.86%, 10/25/36 $ 66 $ 445.91%, 10/25/36 (c) 125 836.00%, 4/25/36 69 69
Chase Mortgage Finance Corp.6.00%, 11/25/36 72 61
Chaseflex Trust6.00%, 2/25/37 65 46
First Horizon Alternative Mortgage Securities6.25%, 8/25/36 40 30
GSR Mortgage Loan Trust5.75%, 1/25/37 74 70
Lehman Mortgage Trust,5.50%, 11/25/35 41 396.50%, 9/25/37 86 65
Residential Accredit Loans, Inc.0.74%, 3/25/35 (c) 54 30
537
Municipal Bonds (0.1%)State of California,
General Obligation Bonds
5.95%, 4/1/16 40 45
Sovereign (0.4%)Brazilian Government International Bond
4.88%, 1/22/21 90 102Mexico Government International Bond
3.63%, 3/15/22 80 82
184
U.S. Agency Securities (1.4%)Federal National Mortgage Association,
1.25%, 9/28/16 350 3525.38%, 6/12/17 170 205
557
U.S. Treasury Securities (14.0%)U.S. Treasury Bonds,
3.50%, 2/15/39 310 3223.88%, 8/15/40 (d) 400 4435.25%, 11/15/28 310 405
U.S. Treasury Notes,0.50%, 11/15/13 725 7270.75%, 6/15/14 230 2321.25%, 8/31/15 1,080 1,1031.75%, 3/31/14 745 7662.25%, 1/31/15 580 6083.00%, 8/31/16 - 9/30/16 675 7363.63%, 8/15/19 330 375
5,717
Total Fixed Income Securities (Cost $14,615) 14,964
2012 Semi-Annual Report
March 31, 2012 (unaudited)

7
Portfolio of Investments (cont’d)Balanced Portfolio
The accompanying notes are an integral part of the financial statements.
Juniper Networks, Inc. (d)(e) 839 $ 19Motorola Mobility Holdings, Inc. (e) 410 16Motorola Solutions, Inc. 368 19QUALCOMM, Inc. 2,239 152
474
Computers & Peripherals (2.6%)Apple, Inc. (e) 1,233 739Dell, Inc. (d)(e) 1,924 32EMC Corp. (e) 2,971 89Hewlett-Packard Co. 3,963 95Lexmark International, Inc., Class A (d) 100 3NetApp, Inc. (e) 607 27SanDisk Corp. (e) 1,918 95
1,080
Construction & Engineering (0.3%)Foster Wheeler AG (e) 1,881 43Jacobs Engineering Group, Inc. (e) 200 9URS Corp. 1,683 71
123
Consumer Finance (0.3%)American Express Co. 944 54Capital One Financial Corp. 783 44Discover Financial Services 993 33SLM Corp. 444 7
138
Containers & Packaging (0.0%)Ball Corp. 239 10
Distributors (0.0%)Genuine Parts Co. 200 13
Diversified Consumer Services (0.1%)Apollo Group, Inc., Class A (d)(e) 258 10DeVry, Inc. (d) 119 4H&R Block, Inc. (d) 916 15
29
Diversified Financial Services (2.0%)Bank of America Corp. 18,046 173Citigroup, Inc. (See Note G-2) (d) 5,096 186CME Group, Inc. 138 40JPMorgan Chase & Co. 8,415 387Leucadia National Corp. (d) 123 3Moody’s Corp. (d) 109 5NASDAQ OMX Group, Inc. (The) (e) 136 3NYSE Euronext (d) 331 10
807
Diversified Telecommunication Services (1.2%)AT&T, Inc. 7,477 234CenturyLink, Inc. (d) 1,957 76Frontier Communications Corp. 2,518 10Verizon Communications, Inc. 4,999 191
511
Value Shares (000)
Value Shares (000)
Capital Markets (cont’d)Franklin Resources, Inc. (d) 124 $ 15Goldman Sachs Group, Inc. (The) 990 123Invesco Ltd. 500 13Janus Capital Group, Inc. 200 2Legg Mason, Inc. 342 10Northern Trust Corp. 130 6State Street Corp. 716 33T. Rowe Price Group, Inc. 165 11
282Chemicals (1.0%)Air Products & Chemicals, Inc. (d) 191 18CF Industries Holdings, Inc. 412 75Dow Chemical Co. (The) (d) 1,113 39Eastman Chemical Co. 200 10Ecolab, Inc. (d) 226 14EI du Pont de Nemours & Co. 2,121 112FMC Corp. (d) 119 13International Flavors & Fragrances, Inc. (d) 119 7Monsanto Co. 530 42Mosaic Co. (The) 52 3PPG Industries, Inc. 211 20Praxair, Inc. 369 42Sherwin-Williams Co. (The) 119 13Sigma-Aldrich Corp. 139 10
418Commercial Banks (1.4%)BB&T Corp. (d) 1,177 37Comerica, Inc. (d) 400 13Fifth Third Bancorp (d) 1,511 21Huntington Bancshares, Inc. 1,600 10KeyCorp 1,356 12M&T Bank Corp. (d) 174 15PNC Financial Services Group, Inc. 803 52Regions Financial Corp. 2,532 17SunTrust Banks, Inc. 908 22US Bancorp 2,852 90Wells Fargo & Co. 7,534 257Zions Bancorporation (d) 400 9
555Commercial Services & Supplies (0.2%)Avery Dennison Corp. (d) 234 7Cintas Corp. 287 11Iron Mountain, Inc. (d) 206 6Pitney Bowes, Inc. 429 7Republic Services, Inc. 446 14RR Donnelley & Sons Co. (d) 458 6Stericycle, Inc. (d)(e) 119 10Waste Management, Inc. 1,009 35
96Communications Equipment (1.2%)Ciena Corp. (d)(e) 7,434 120Cisco Systems, Inc. 6,986 148
2012 Semi-Annual Report
March 31, 2012 (unaudited)

8
Portfolio of Investments (cont’d)Balanced Portfolio
The accompanying notes are an integral part of the financial statements.
Mead Johnson Nutrition Co. 324 $ 27Sara Lee Corp. 878 19Smithfield Foods, Inc. (d)(e) 3,334 74Tyson Foods, Inc., Class A 700 13
471Health Care Equipment & Supplies (0.8%)Baxter International, Inc. 708 42Becton Dickinson and Co. 461 36Boston Scientific Corp. (d)(e) 2,517 15CR Bard, Inc. 139 14Intuitive Surgical, Inc. (d)(e) 135 73Medtronic, Inc. (d) 1,071 42St. Jude Medical, Inc. 569 25Stryker Corp. (d) 590 33Varian Medical Systems, Inc. (d)(e) 258 18Zimmer Holdings, Inc. (d) 302 19
317Health Care Providers & Services (1.6%)Aetna, Inc. 519 26AmerisourceBergen Corp. (d) 638 25Cardinal Health, Inc. 439 19Cigna Corp. 465 23Coventry Health Care, Inc. 2,409 86DaVita, Inc. (e) 139 12Express Scripts, Inc. (e) 766 41HealthSouth Corp. (d)(e) 3,600 74Laboratory Corp. of America Holdings (e) 183 17McKesson Corp. 319 28Medco Health Solutions, Inc. (e) 543 38Omnicare, Inc. (d) 2,218 79Patterson Cos., Inc. (d) 358 12Quest Diagnostics, Inc. 139 8Tenet Healthcare Corp. (d)(e) 1,432 8UnitedHealth Group, Inc. 750 44Universal Health Services, Inc., Class B (d) 1,501 63WellPoint, Inc. (d) 419 31
634Health Care Technology (0.1%)Cerner Corp. (e) 292 22Hotels, Restaurants & Leisure (1.1%)Carnival Corp. 653 21Darden Restaurants, Inc. (d) 138 7International Game Technology (d) 996 17Marriott International, Inc., Class A (d) 318 12Marriott Vacations Worldwide Corp. (e) 31 1McDonald’s Corp. 1,555 152Starbucks Corp. 1,011 56Starwood Hotels & Resorts Worldwide, Inc. 175 10Wyndham Worldwide Corp. 477 22Wynn Resorts Ltd. 119 15Yum! Brands, Inc. 1,638 117
430
Value Shares (000)
Value Shares (000)
Electric Utilities (0.8%)American Electric Power Co., Inc. 769 $ 30Duke Energy Corp. 1,615 34Edison International (d) 735 31Exelon Corp. 633 25FirstEnergy Corp. (d) 395 18NextEra Energy, Inc. (d) 635 39Pepco Holdings, Inc. 85 2PPL Corp. 735 21Progress Energy, Inc. 405 21Southern Co. (The) (d) 2,119 95
316
Electrical Equipment (0.1%)Emerson Electric Co. 812 42
Electronic Equipment, Instruments & Components (0.3%)Amphenol Corp., Class A (d) 285 17Arrow Electronics, Inc. (e) 1,669 70Corning, Inc. 2,375 33Jabil Circuit, Inc. 300 8Molex, Inc. 164 5
133
Energy Equipment & Services (1.2%)Baker Hughes, Inc. 639 27Cameron International Corp. (d)(e) 717 38Diamond Offshore Drilling, Inc. (d) 139 9FMC Technologies, Inc. (e) 754 38Halliburton Co. 1,609 54National Oilwell Varco, Inc. (d) 1,068 85Noble Corp. (e) 596 22Schlumberger Ltd. 3,137 219
492
Food & Staples Retailing (1.2%)Costco Wholesale Corp. 595 54CVS Caremark Corp. 1,673 75Kroger Co. (The) 772 19Safeway, Inc. 2,695 55Sysco Corp. 1,087 32Wal-Mart Stores, Inc. (d) 2,687 164Walgreen Co. (d) 458 15Whole Foods Market, Inc. 705 59
473
Food Products (1.2%)Archer-Daniels-Midland Co. 1,016 32Campbell Soup Co. (d) 400 14ConAgra Foods, Inc. 3,093 81General Mills, Inc. 1,024 40H.J. Heinz Co. (d) 543 29Hershey Co. (The) 200 12JM Smucker Co. (The) (d) 223 18Kellogg Co. 462 25Kraft Foods, Inc., Class A 2,284 87
2012 Semi-Annual Report
March 31, 2012 (unaudited)

9
Portfolio of Investments (cont’d)Balanced Portfolio
The accompanying notes are an integral part of the financial statements.
Internet & Catalog Retail (0.3%)Amazon.com, Inc. (e) 446 $ 90Expedia, Inc. (d) 201 7NetFlix, Inc. (d)(e) 100 11Priceline.com, Inc. (d)(e) 37 27TripAdvisor, Inc. (d)(e) 201 7
142
Internet Software & Services (0.8%)eBay, Inc. (e) 1,582 58Google, Inc., Class A (e) 344 221Yahoo!, Inc. (e) 3,657 56
335
Leisure Equipment & Products (0.1%)Hasbro, Inc. (d) 358 13Mattel, Inc. 477 16
29
Life Sciences Tools & Services (0.2%)Agilent Technologies, Inc. (d) 153 7Life Technologies Corp. (e) 265 13Thermo Fisher Scientific, Inc. 818 46
66
Machinery (1.0%)Caterpillar, Inc. 1,340 143Cummins, Inc. (d) 458 55Deere & Co. 551 44Eaton Corp. 300 15Illinois Tool Works, Inc. (d) 1,867 107ITT Corp. (d) 297 7PACCAR, Inc. 255 12Stanley Black & Decker, Inc. 139 11Xylem, Inc. 594 16
410
Media (1.7%)AMC Networks, Inc., Class A (e) 119 5Cablevision Systems Corp. (d) 477 7CBS Corp., Class B 768 26Comcast Corp., Class A 4,271 128DIRECTV, Class A (e) 1,303 64Discovery Communications, Inc. (d)(e) 377 19Gannett Co., Inc. (d) 600 9Interpublic Group of Cos., Inc. (The) 835 10McGraw-Hill Cos., Inc. (The) 465 23News Corp., Class A 2,959 58Omnicom Group, Inc. (d) 437 22Scripps Networks Interactive, Inc., Class A (d) 100 5Time Warner Cable, Inc. (d) 546 45Time Warner, Inc. 3,039 115Viacom, Inc., Class B 1,020 48Walt Disney Co. (The) (d) 2,516 110
694
Value Shares (000)
Value Shares (000)
Household Durables (0.2%)Harman International Industries, Inc. 139 $ 6Toll Brothers, Inc. (d)(e) 3,034 73
79
Household Products (1.0%)Colgate-Palmolive Co. 712 69Kimberly-Clark Corp. 701 52Procter & Gamble Co. (The) 4,267 287
408
Independent Power Producers & Energy Traders (0.1%)AES Corp. (The) (d)(e) 1,404 19NRG Energy, Inc. (e) 1,611 25
44
Industrial Conglomerates (1.1%)3M Co. 802 72Danaher Corp. (d) 1,009 56General Electric Co. 10,833 217Tyco International Ltd. 1,702 96
441
Information Technology Services (1.5%)Accenture PLC, Class A 82 5Automatic Data Processing, Inc. 528 29Cognizant Technology Solutions Corp., Class A (e) 421 32Fidelity National Information Services, Inc. 100 3International Business Machines Corp. 1,940 405Mastercard, Inc., Class A 123 52Paychex, Inc. 450 14Visa, Inc., Class A (d) 555 66Western Union Co. (The) 1,290 23
629
Insurance (1.8%)Aflac, Inc. 471 22Allstate Corp. (The) (d) 889 29AON Corp. 380 19Assurant, Inc. (d) 1,261 51Berkshire Hathaway, Inc., Class B (e) 989 80Chubb Corp. (The) 1,546 107Fidelity National Financial, Inc. (d) 2,892 52Hartford Financial Services Group, Inc. 685 14Lincoln National Corp. (d) 1,593 42Loews Corp. 737 29Marsh & McLennan Cos., Inc. (d) 737 24MetLife, Inc. (d) 1,293 48PartnerRe Ltd. 652 44Principal Financial Group, Inc. 1,490 44Progressive Corp. (The) (d) 713 17Prudential Financial, Inc. (d) 380 24Travelers Cos., Inc. (The) 685 41Unum Group (d) 2,400 59
746
2012 Semi-Annual Report
March 31, 2012 (unaudited)

10
Portfolio of Investments (cont’d)Balanced Portfolio
The accompanying notes are an integral part of the financial statements.
Occidental Petroleum Corp. 1,179 $ 112Peabody Energy Corp. 761 22Pioneer Natural Resources Co. 377 42Southwestern Energy Co. (e) 1,090 33Spectra Energy Corp. (d) 754 24Valero Energy Corp. 649 17Williams Cos., Inc. (The) 779 24WPX Energy, Inc. (e) 326 6
1,614
Paper & Forest Products (0.1%)International Paper Co. 425 15MeadWestvaco Corp. 1,449 46
61
Personal Products (0.0%)Avon Products, Inc. (d) 701 14Estee Lauder Cos., Inc. (The), Class A (d) 70 4
18
Pharmaceuticals (2.6%)Abbott Laboratories 2,333 143Allergan, Inc. 559 53Bristol-Myers Squibb Co. 4,662 157Eli Lilly & Co. 879 36Hospira, Inc. (e) 820 31Johnson & Johnson 3,694 244Merck & Co., Inc. 4,012 154Pfizer, Inc. 11,439 259
1,077
Professional Services (0.0%)Dun & Bradstreet Corp. (The) 119 10Equifax, Inc. 149 7
17
Real Estate Investment Trusts (REITs) (1.0%)American Tower Corp., Class A 698 44AvalonBay Communities, Inc. REIT 139 20Boston Properties, Inc. REIT 190 20Equity Residential REIT (d) 523 33HCP, Inc. REIT 533 21Health Care, Inc. REIT 217 12Host Hotels & Resorts, Inc. REIT (d) 1,058 17Kimco Realty Corp. REIT 824 16Plum Creek Timber Co., Inc. REIT (d) 374 16ProLogis, Inc. REIT 744 27Public Storage REIT 213 29Simon Property Group, Inc. REIT (d) 512 75Ventas, Inc. REIT (d) 446 25Vornado Realty Trust REIT 218 18Weyerhaeuser Co. REIT 837 18
391
Real Estate Management & Development (0.0%)CBRE Group, Inc. (e) 716 14
Value Shares (000)
Value Shares (000)
Metals & Mining (0.5%)Alcoa, Inc. (d) 1,129 $ 11Allegheny Technologies, Inc. 200 8Cliffs Natural Resources, Inc. 139 10Freeport-McMoRan Copper & Gold, Inc. 1,048 40Molycorp, Inc. (e) 867 29Newmont Mining Corp. 443 23Nucor Corp. 187 8Steel Dynamics, Inc. (d) 4,992 73United States Steel Corp. (d) 100 3
205
Multi-Utilities (0.7%)CenterPoint Energy, Inc. (d) 58 1Consolidated Edison, Inc. 405 24Dominion Resources, Inc. (d) 1,934 99DTE Energy Co. 58 3Integrys Energy Group, Inc. 1,062 56NiSource, Inc. (d) 58 2PG&E Corp. (d) 735 32Public Service Enterprise Group, Inc. 769 24Sempra Energy 405 24Wisconsin Energy Corp. (d) 455 16Xcel Energy, Inc. 769 20
301
Multiline Retail (0.3%)Family Dollar Stores, Inc. 200 12JC Penney Co., Inc. (d) 400 14Kohl’s Corp. 295 15Macy’s, Inc. 446 18Nordstrom, Inc. 161 9Target Corp. 904 53
121
Office Electronics (0.0%)Xerox Corp. 1,624 13
Oil, Gas & Consumable Fuels (3.9%)Anadarko Petroleum Corp. 1,850 145Apache Corp. 704 71Chesapeake Energy Corp. (d) 3,206 74Chevron Corp. 1,993 214ConocoPhillips 1,969 150Consol Energy, Inc. (d) 753 26Denbury Resources, Inc. (e) 1,251 23Devon Energy Corp. 703 50El Paso Corp. 1,270 38EOG Resources, Inc. 468 52Exxon Mobil Corp. 3,901 338Hess Corp. 1,010 60Marathon Oil Corp. 700 22Marathon Petroleum Corp. 450 19Murphy Oil Corp. 255 14Newfield Exploration Co. (e) 377 13Noble Energy, Inc. 257 25
2012 Semi-Annual Report
March 31, 2012 (unaudited)
11
Portfolio of Investments (cont’d)Balanced Portfolio
The accompanying notes are an integral part of the financial statements.
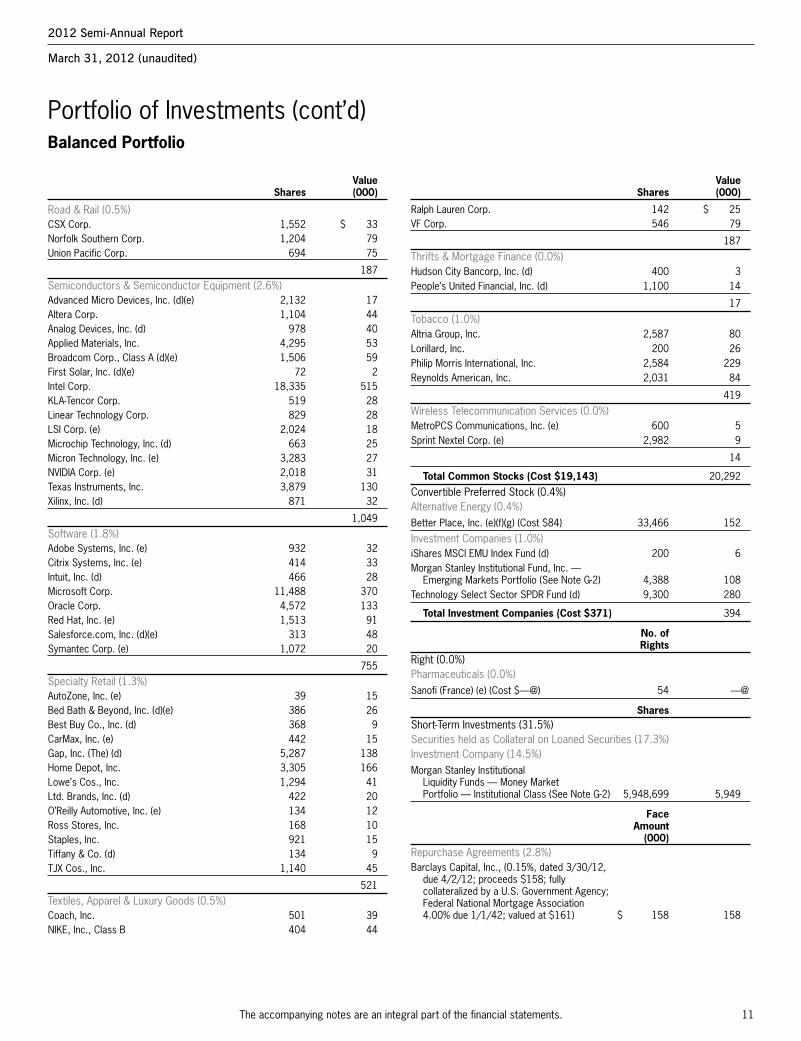
Ralph Lauren Corp. 142 $ 25VF Corp. 546 79
187
Thrifts & Mortgage Finance (0.0%)Hudson City Bancorp, Inc. (d) 400 3People’s United Financial, Inc. (d) 1,100 14
17
Tobacco (1.0%)Altria Group, Inc. 2,587 80Lorillard, Inc. 200 26Philip Morris International, Inc. 2,584 229Reynolds American, Inc. 2,031 84
419
Wireless Telecommunication Services (0.0%)MetroPCS Communications, Inc. (e) 600 5Sprint Nextel Corp. (e) 2,982 9
14
Total Common Stocks (Cost $19,143) 20,292
Convertible Preferred Stock (0.4%)Alternative Energy (0.4%)Better Place, Inc. (e)(f)(g) (Cost $84) 33,466 152
Investment Companies (1.0%)iShares MSCI EMU Index Fund (d) 200 6Morgan Stanley Institutional Fund, Inc. —
Emerging Markets Portfolio (See Note G-2) 4,388 108Technology Select Sector SPDR Fund (d) 9,300 280
Total Investment Companies (Cost $371) 394
No. of Rights Right (0.0%)Pharmaceuticals (0.0%)Sanofi (France) (e) (Cost $—@) 54 —@
Shares Short-Term Investments (31.5%)Securities held as Collateral on Loaned Securities (17.3%)Investment Company (14.5%)Morgan Stanley Institutional
Liquidity Funds — Money Market Portfolio — Institutional Class (See Note G-2) 5,948,699 5,949
Face Amount (000) Repurchase Agreements (2.8%)Barclays Capital, Inc., (0.15%, dated 3/30/12,
due 4/2/12; proceeds $158; fully collateralized by a U.S. Government Agency; Federal National Mortgage Association 4.00% due 1/1/42; valued at $161) $ 158 158
Value Shares (000)
Value Shares (000)
Road & Rail (0.5%)CSX Corp. 1,552 $ 33Norfolk Southern Corp. 1,204 79Union Pacific Corp. 694 75
187Semiconductors & Semiconductor Equipment (2.6%)Advanced Micro Devices, Inc. (d)(e) 2,132 17Altera Corp. 1,104 44Analog Devices, Inc. (d) 978 40Applied Materials, Inc. 4,295 53Broadcom Corp., Class A (d)(e) 1,506 59First Solar, Inc. (d)(e) 72 2Intel Corp. 18,335 515KLA-Tencor Corp. 519 28Linear Technology Corp. 829 28LSI Corp. (e) 2,024 18Microchip Technology, Inc. (d) 663 25Micron Technology, Inc. (e) 3,283 27NVIDIA Corp. (e) 2,018 31Texas Instruments, Inc. 3,879 130Xilinx, Inc. (d) 871 32
1,049Software (1.8%)Adobe Systems, Inc. (e) 932 32Citrix Systems, Inc. (e) 414 33Intuit, Inc. (d) 466 28Microsoft Corp. 11,488 370Oracle Corp. 4,572 133Red Hat, Inc. (e) 1,513 91Salesforce.com, Inc. (d)(e) 313 48Symantec Corp. (e) 1,072 20
755Specialty Retail (1.3%)AutoZone, Inc. (e) 39 15Bed Bath & Beyond, Inc. (d)(e) 386 26Best Buy Co., Inc. (d) 368 9CarMax, Inc. (e) 442 15Gap, Inc. (The) (d) 5,287 138Home Depot, Inc. 3,305 166Lowe’s Cos., Inc. 1,294 41Ltd. Brands, Inc. (d) 422 20O’Reilly Automotive, Inc. (e) 134 12Ross Stores, Inc. 168 10Staples, Inc. 921 15Tiffany & Co. (d) 134 9TJX Cos., Inc. 1,140 45
521Textiles, Apparel & Luxury Goods (0.5%)Coach, Inc. 501 39NIKE, Inc., Class B 404 44
2012 Semi-Annual Report
March 31, 2012 (unaudited)

12
Portfolio of Investments (cont’d)Balanced Portfolio
The accompanying notes are an integral part of the financial statements.
(a) Security is subject to delayed delivery.(b) 144A security — Certain conditions for public sale may exist. Unless
otherwise noted, these securities are deemed to be liquid.(c) Variable/Floating Rate Security — Interest rate changes on these
instruments are based on changes in a designated base rate. The ratesshown are those in effect on March 31, 2012.
(d) All or a portion of this security was on loan at March 31, 2012.(e) Non-income producing security.(f) At March 31, 2012, the Portfolio held a fair valued security valued at
approximately $152,000, representing 0.4% of net assets. This securityhas been fair valued as determined in good faith under proceduresestablished by and under the general supervision of the Fund’s Trustees.
(g) Security has been deemed illiquid at March 31, 2012.(h) Rate shown is the yield to maturity at March 31, 2012.(i) Securities are available for collateral in connection with securities
purchased on a forward commitment basis, open foreign currencyexchange contracts, futures contracts and swap agreements.
@ Value is less than $500.IO Interest Only.MTN Medium Term Note.PAC Planned Amortization Class.REMIC Real Estate Mortgage Investment Conduit.SPDR Standard & Poor’s Depository Receipt.TBA To Be Announced.
Face Amount Value (000) (000)
Repurchase Agreements (cont’d)Merrill Lynch & Co., Inc., (0.25%, dated 3/30/12,
due 4/2/12; proceeds $976; fully collateralized by Common Stocks; Alliance Data Systems Corp.; American International Group, Inc.; Boeing Co. (The); Energy Transfer Equity LP; Freeport-McMoRan Copper & Gold, Inc.; GNC Holdings, Inc.; Hershey Co. (The); L-3 Communications Holdings, Inc.; McKesson Corp.; Teva Pharmaceutical Industries Ltd.; Two Harbors Investment Corp.; Vale SA; valued at $1,054) $ 976 $ 976
1,134
Total Securities held as Collateral on Loaned Securities (Cost $7,083) 7,083
Shares Investment Company (13.0%)Morgan Stanley Institutional
Liquidity Funds — Money Market Portfolio — Institutional Class (See Note G-2) (Cost $5,317) 5,316,709 5,317
Face Amount (000) U.S. Treasury Security (1.2%)U.S. Treasury Bill
0.09%, 6/7/12 (h) $ 500 500
Total Short-Term Investments (Cost $12,900) 12,900
Total Investments (118.9%) (Cost $47,113) Including $7,630 of Securities Loaned (i) 48,702
Liabilities in Excess of Other Assets (-18.9%) (7,732)
Net Assets (100.0%) $40,970
2012 Semi-Annual Report
March 31, 2012 (unaudited)
Foreign Currency Exchange Contracts Information:The Portfolio had the following foreign currency exchange contracts open at period end:
UnrealizedCurrency to In Exchange Appreciation
Deliver Value Settlement For Value (Depreciation)Counterparty (000) (000) Date (000) (000) (000)Goldman Sachs International NOK 276 $ 48 4/4/12 USD 49 $ 49 $ 1JPMorgan Chase Bank USD 96 96 4/4/12 NOK 545 96 (—)@UBS AG NOK —@ —@ 4/4/12 USD —@ —@ (—)@UBS AG NOK 269 47 4/4/12 USD 47 47 —@Goldman Sachs International USD 42 42 4/5/12 CHF 38 42 —@Goldman Sachs International USD —@ —@ 4/5/12 SEK —@ —@ (—)@JPMorgan Chase Bank CHF 38 42 4/5/12 USD 42 42 (—)@UBS AG SEK 190 29 4/5/12 USD 29 29 (—)@UBS AG USD —@ —@ 4/5/12 CHF —@ —@ —@UBS AG USD 28 28 4/5/12 SEK 190 29 1Deutsche Bank AG London AUD 418 433 4/19/12 USD 439 439 6Deutsche Bank AG London AUD 475 492 4/19/12 USD 497 497 5Deutsche Bank AG London USD 440 440 4/19/12 EUR 335 447 7Goldman Sachs International EUR 152 202 4/19/12 USD 199 199 (3)JPMorgan Chase Bank NOK 394 69 4/19/12 USD 69 69 —@JPMorgan Chase Bank USD 50 50 4/19/12 SEK 340 51 1State Street Bank and Trust Co. CLP 580,930 1,186 4/19/12 USD 1,193 1,193 7UBS AG BRL 80 43 4/19/12 USD 44 44 1UBS AG EUR 411 548 4/19/12 USD 539 539 (9)UBS AG GBP 45 72 4/19/12 USD 70 70 (2) $3,867 $3,882 $15

13
Portfolio of Investments (cont’d)Balanced Portfolio
The accompanying notes are an integral part of the financial statements.
2012 Semi-Annual Report
March 31, 2012 (unaudited)
Futures Contracts:The Portfolio had the following futures contracts open at period end:
Unrealized Number Appreciation of Value Expiration (Depreciation) Contracts (000) Date (000)
Long:
DAX Index (Germany) 4 $ 928 Jun-12 $ 12Euro Stoxx 50 Index (Germany) 13 418 Jun-12 (11)FTSE 100 Index (United Kingdom) 1 92 Jun-12 (1)FTSE MIB Index (United Kingdom) 4 420 Jun-12 (15)NIKKEI 225 Index (Japan) 6 368 Jun-12 9S+P 500 E-Mini Index 83 5,823 Jun-12 57U.S. Treasury 10 yr. Note 6 777 Jun-12 8U.S. Treasury 30 yr. Bond 1 138 Jun-12 2
Short:
ASX Spi 200 Index (Australia) 1 (113) Jun-12 (1)Copper High Grade Index 1 (96) May-12 4IBEX 35 Index (United Kingdom) 4 (423) Apr-12 —@MSCI Emerging Market E-Mini 15 (779) Jun-12 11S+P TSE 60 Index 8 (1,129) Jun-12 2U.S. Treasury 2 yr. Note 2 (440) Jun-12 (—)@Ultra Long U.S. Treasury Bond 4 (604) Jun-12 (3) $ 74
Interest Rate Swap Agreements:The Portfolio had the following interest rate swap agreements open at period end: Unrealized Notional Appreciation Floating Rate Pay/Receive Termination Amount (Depreciation)Swap Counterparty Index Floating Rate Fixed Rate Date (000) (000)Bank of America NA 6 Month EURIBOR Pay 4.26% 8/18/26 EUR 910 $ 40Bank of America NA 3 Month LIBOR Receive 4.35 8/18/26 $ 1,220 (22)Bank of America NA 6 Month EURIBOR Receive 3.61 8/18/31 EUR 1,150 (35)Bank of America NA 3 Month LIBOR Pay 4.15 8/18/31 $ 1,515 21Goldman Sachs — International 3 Month LIBOR Receive 2.42 3/22/22 173 (2)JP Morgan Chase 3 Month LIBOR Receive 2.43 3/22/22 84 (1) $ 1
Total Return Swap Agreements:The Portfolio had the following total return swap agreements open at period end: Pay/Receive Unrealized Notional Total Return Appreciation Amount Floating of Referenced Maturity (Depreciation)Counterparty Index (000) Rate Index Date (000)Goldman Sachs Custom Construction Index $445 1-Month USD-LIBOR-minus 0.47% Pay 3/27/13 $ 9Goldman Sachs Custom Miners Index 145 1-Month USD-LIBOR-minus 0.35% Pay 2/13/13 1Goldman Sachs Custom Miners Index 268 1-Month USD-LIBOR-minus 0.35% Pay 2/13/13 1Bank of America NA Merrill Lynch Custom Luxury Basket Index 432 3-Month USD-LIBOR-minus 0.15% Pay 3/26/13 2Bank of America NA Merrill Lynch Custom Test Index 431 3-Month USD-LIBOR-minus 0.10% Pay 3/26/13 (3) $10 @ Value is less than $500.EURIBOR Euro Interbank Offered Rate.LIBOR London Interbank Offered Rate.

14
Portfolio of Investments (cont’d)Balanced Portfolio
The accompanying notes are an integral part of the financial statements.
Fair Value Measurement Information: (cont’d) Level 2 Level 1 Other Level 3 Unadjusted significant Significant quoted observable unobservable prices inputs inputs TotalInvestment Type (000) (000) (000) (000)
Common Stocks (cont’d)Diversified Financial
Services $ 807 $ — $ — $ 807Diversified
Telecommunication Services 511 — — 511
Electric Utilities 316 — — 316Electrical Equipment 42 — — 42Electronic Equipment,
Instruments & Components 133 — — 133
Energy Equipment & Services 492 — — 492
Food & Staples Retailing 473 — — 473Food Products 471 — — 471Health Care
Equipment & Supplies 317 — — 317Health Care Providers &
Services 634 — — 634Health Care Technology 22 — — 22Hotels, Restaurants &
Leisure 430 — — 430Household Durables 79 — — 79Household Products 408 — — 408Independent Power
Producers & Energy Traders 44 — — 44
Industrial Conglomerates 441 — — 441Information Technology
Services 629 — — 629Insurance 746 — — 746Internet & Catalog Retail 142 — — 142Internet Software &
Services 335 — — 335Leisure Equipment &
Products 29 — — 29Life Sciences Tools &
Services 66 — — 66Machinery 410 — — 410Media 694 — — 694Metals & Mining 205 — — 205Multi-Utilities 301 — — 301Multiline Retail 121 — — 121Office Electronics 13 — — 13Oil, Gas &
Consumable Fuels 1,614 — — 1,614Paper & Forest Products 61 — — 61Personal Products 18 — — 18Pharmaceuticals 1,077 — — 1,077Professional Services 17 — — 17Real Estate Investment
Trusts (REITs) 391 — — 391Real Estate
Management & Development 14 — — 14
Road & Rail 187 — — 187
AUD — Australian DollarBRL — Brazilian RealCHF — Swiss FrancCLP — Chilean PesoEUR — EuroGBP — British PoundNOK — Norwegian KroneSEK — Swedish KronaUSD — United States Dollar
Fair Value Measurement Information:The following is a summary of the inputs used to value the Portfolio’sinvestments as of March 31, 2012. (See Note A-5 to the financial statementsfor further information regarding fair value measurement.) Level 2 Level 1 Other Level 3 Unadjusted significant Significant quoted observable unobservable prices inputs inputs TotalInvestment Type (000) (000) (000) (000)Assets:
Fixed Income SecuritiesAgency Adjustable
Rate Mortgage $ — $ 63 $ — $ 63Agency Fixed Rate
Mortgages — 3,672 — 3,672Asset-Backed Securities — 342 — 342Collateralized Mortgage
Obligations — Agency Collateral Series — 337 — 337
Commercial Mortgage Backed Securities — 243 — 243
Corporate Bonds — 3,267 — 3,267Mortgages — Other — 537 — 537Municipal Bonds — 45 — 45Sovereign — 184 — 184U.S. Agency Securities — 557 — 557U.S. Treasury Securities — 5,717 — 5,717Total Fixed Income
Securities — 14,964 — 14,964
Common StocksAerospace & Defense 606 — — 606Air Freight & Logistics 152 — — 152Airlines 11 — — 11Auto Components 123 — — 123Automobiles 7 — — 7Beverages 320 — — 320Biotechnology 203 — — 203Capital Markets 282 — — 282Chemicals 418 — — 418Commercial Banks 555 — — 555Commercial Services &
Supplies 96 — — 96Communications
Equipment 474 — — 474Computers & Peripherals 1,080 — — 1,080Construction & Engineering 123 — — 123Consumer Finance 138 — — 138Containers & Packaging 10 — — 10Distributors 13 — — 13Diversified Consumer
Services 29 — — 29
2012 Semi-Annual Report
March 31, 2012 (unaudited)

15
Portfolio of Investments (cont’d)Balanced Portfolio
The accompanying notes are an integral part of the financial statements.
Fair Value Measurement Information: (cont’d)Following is a reconciliation of investments in which significant unobservableinputs (Level 3) were used in determining fair value. Convertible Preferred Stock (000)Beginning Balance $ 84Purchases —Sales —Amortization of discount —Transfers in —Transfers out —Change in unrealized appreciation (depreciation) 68Realized gains (losses) —Ending Balance $152Net change in unrealized appreciation/depreciation
from investments still held as of March 31, 2012 $ 68
@ Value is less than $500.
Portfolio Composition*
Percentage ofClassification Total InvestmentsCommon Stocks 48.8%Fixed Income Securities 35.9Short-Term Investments 14.0Other** 1.3Total Investments 100.0%***
* Percentages indicated are based upon total investments (excluding Securities heldas Collateral on Loaned Securities) as of March 31, 2012.
** Industries and/or investment types representing less than 5% of total investments.*** Does not include open long/short futures contracts with a value of approximately
$12,548,000 and net unrealized appreciation of approximately $74,000. Alsodoes not include open foreign currency exchange contracts with net unrealizedappreciation of approximately $15,000 and open swap agreements with netunrealized appreciation of approximately $11,000.
Fair Value Measurement Information: (cont’d) Level 2 Level 1 Other Level 3 Unadjusted significant Significant quoted observable unobservable prices inputs inputs TotalInvestment Type (000) (000) (000) (000)
Common Stocks (cont’d)Semiconductors &
Semiconductor Equipment $ 1,049 $ — $ — $ 1,049
Software 755 — — 755Specialty Retail 521 — — 521Textiles, Apparel &
Luxury Goods 187 — — 187Thrifts & Mortgage
Finance 17 — — 17Tobacco 419 — — 419Wireless
Telecommunication Services 14 — — 14
Total Common Stocks 20,292 — — 20,292Convertible Preferred
Stock — — 152 152Investment Companies 394 — — 394Right —@ — — —@
Short-Term InvestmentsRepurchase Agreements — 1,134 — 1,134Investment Company 11,266 — — 11,266U.S. Treasury Security — 500 — 500Total Short-Term
Investments 11,266 1,634 — 12,900Foreign Currency
Exchange Contracts — 29 — 29Futures Contracts 105 — — 105Interest Rate Swap
Agreements — 61 — 61Total Return Swap
Agreements — 13 — 13Total Assets 32,057 16,701 152 48,910
Liabilities:Foreign Currency
Exchange Contracts — (14) — (14)Futures Contracts (31) — — (31)Interest Rate Swap
Agreements — (60) — (60)Total Return Swap
Agreements — (3) — (3)Total Liabilities (31) (77) — (108)Total $32,026 $16,624 $152 $48,802
Transfers between investment levels may occur as the markets fluctuateand/or the availability of data used in an investment’s valuation changes. ThePortfolio recognizes transfers between the levels as of the end of the period.As of March 31, 2012, the Portfolio did not have any significant investmentstransfer between investment levels.
2012 Semi-Annual Report
March 31, 2012 (unaudited)

16
Consumer Services: Miscellaneous (2.2%)Qualicorp SA (Brazil) (a) 10,808,545 $ 92,664Sun Art Retail Group Ltd. (Hong Kong) (a) 45,309,110 61,380
154,044
Cosmetics (0.9%)Natura Cosmeticos SA (Brazil) 2,917,711 63,455
Diversified Materials & Processing (1.4%)Schindler Holding AG (Switzerland) 838,395 100,864
Diversified Media (3.0%)Factset Research Systems, Inc. 1,027,933 101,806McGraw-Hill Cos., Inc. (The) 2,311,282 112,028
213,834
Diversified Retail (9.2%)Ctrip.com International Ltd. ADR (China) (a) 2,278,685 49,311Dollar Tree, Inc. (a) 1,137,155 107,450Fastenal Co. 4,968,859 268,815Groupon, Inc. (a) 935,773 17,199Groupon, Inc. Series A (a)(c)(d) 5,992,988 106,495NetFlix, Inc. (a) 857,715 98,672
647,942
Education Services (0.9%)New Oriental Education & Technology
Group, Inc. ADR (China) (a) 2,450,769 67,298
Electronic Entertainment (0.8%)Nexon Co., Ltd. (Korea, Republic of) (a) 3,097,745 53,968
Financial Data & Systems (5.4%)MSCI, Inc., Class A (a) 5,067,356 186,530Verisk Analytics, Inc., Class A (a) 4,088,659 192,044
378,574
Health Care Services (2.6%)athenahealth, Inc. (a) 1,159,804 85,965Stericycle, Inc. (a) 1,151,676 96,326
182,291
Media (0.5%)Legend Pictures LLC Ltd. (a)(c)(d) 34,510 36,896
Medical & Dental Instruments & Supplies (1.2%)Techne Corp. 1,227,668 86,060
Medical Equipment (3.9%)Intuitive Surgical, Inc. (a) 506,387 274,335
Metals & Minerals: Diversified (1.6%)Lynas Corp. Ltd. (Australia) (a) 23,242,119 26,363Molycorp, Inc. (a) 2,602,753 88,051
114,414
Pharmaceuticals (5.1%)Ironwood Pharmaceuticals, Inc. (a) 3,422,223 45,550Mead Johnson Nutrition Co. 2,282,409 188,253Valeant Pharmaceuticals
International, Inc. (Canada) (a) 2,372,203 127,363
361,166
Portfolio of InvestmentsMid Cap Growth Portfolio Value Shares (000)
Value Shares (000)
Common Stocks (96.9%)Air Transport (2.0%)Expeditors International of Washington, Inc. 3,004,615 $ 139,745
Alternative Energy (2.6%)Range Resources Corp. 2,047,125 119,020Ultra Petroleum Corp. (a) 2,977,886 67,389
186,409
Asset Management & Custodian (0.7%)Greenhill & Co., Inc. 1,073,048 46,828
Biotechnology (3.8%)IDEXX Laboratories, Inc. (a) 1,280,698 111,997Illumina, Inc. (a) 2,938,723 154,606
266,603
Cement (1.1%)Martin Marietta Materials, Inc. 888,183 76,055
Chemicals: Diversified (2.6%)Intrepid Potash, Inc. (a) 3,116,709 75,830Rockwood Holdings, Inc. (a) 2,056,282 107,235
183,065
Commercial Services (8.4%)Gartner, Inc. (a) 2,571,500 109,649Intertek Group PLC (United Kingdom) 3,156,547 126,778Leucadia National Corp. 3,380,338 88,227MercadoLibre, Inc. (Brazil) 695,150 67,978Weight Watchers International, Inc. 2,636,286 203,495
596,127
Communications Technology (5.0%)Millicom International Cellular SA SDR (Sweden) 571,172 64,751Motorola Solutions, Inc. 5,676,901 288,557
353,308
Computer Services, Software & Systems (16.0%)Akamai Technologies, Inc. (a) 3,324,944 122,025Alibaba.com Ltd. (China) (a)(b) 31,471,356 53,495Citrix Systems, Inc. (a) 783,246 61,806IHS, Inc., Class A (a) 1,164,845 109,088LinkedIn Corp., Class A (a) 2,049,409 209,019Red Hat, Inc. (a) 1,832,620 109,756Salesforce.com, Inc. (a) 1,045,265 161,504Solera Holdings, Inc. 2,707,326 124,239Zynga, Inc., Class A (a) 10,638,003 139,890Zynga, Inc., Class B (a)(c)(d) 3,390,490 42,347
1,133,169
Computer Technology (3.6%)NVIDIA Corp. (a) 1,396,016 21,485Yandex N.V., Class A (Russia) (a) 6,056,854 162,747Youku.com, Inc. ADR (China) (a) 3,106,136 68,304
252,536
Consumer Lending (1.5%)IntercontinentalExchange, Inc. (a) 776,648 106,727
The accompanying notes are an integral part of the financial statements.
2012 Semi-Annual Report
March 31, 2012 (unaudited)

17
Portfolio of Investments (cont’d)Mid Cap Growth Portfolio
The accompanying notes are an integral part of the financial statements.
Fair Value Measurement Information:The following is a summary of the inputs used to value the Portfolio’sinvestments as of March 31, 2012. (See Note A-5 to the financial statementsfor further information regarding fair value measurement.) Level 2 Level 1 Other Level 3 Unadjusted significant Significant quoted observable unobservable prices inputs inputs TotalInvestment Type (000) (000) (000) (000)
Assets:
Common StocksAir Transport $ 139,745 $— $ — $ 139,745Alternative Energy 186,409 — — 186,409Asset Management &
Custodian 46,828 — — 46,828Biotechnology 266,603 — — 266,603Cement 76,055 — — 76,055Chemicals: Diversified 183,065 — — 183,065Commercial Services 596,127 — — 596,127Communications Technology 353,308 — — 353,308Computer Services,
Software & Systems 1,090,822 — 42,347 1,133,169Computer Technology 252,536 — — 252,536Consumer Lending 106,727 — — 106,727Consumer Services:
Miscellaneous 154,044 — — 154,044Cosmetics 63,455 — — 63,455Diversified Materials &
Processing 100,864 — — 100,864Diversified Media 213,834 — — 213,834Diversified Retail 541,447 — 106,495 647,942Education Services 67,298 — — 67,298Electronic Entertainment 53,968 — — 53,968Financial Data & Systems 378,574 — — 378,574Health Care Services 182,291 — — 182,291Media — — 36,896 36,896Medical & Dental
Instruments & Supplies 86,060 — — 86,060Medical Equipment 274,335 — — 274,335Metals & Minerals: Diversified 114,414 — — 114,414Pharmaceuticals 361,166 — — 361,166Publishing 97,201 — — 97,201Recreational Vehicles &
Boats 254,545 — — 254,545Restaurants 83,010 — — 83,010Scientific Instruments:
Pollution Control 74,018 — — 74,018Semiconductors &
Components 138,365 — — 138,365Utilities: Electrical 119,265 — — 119,265Total Common Stocks 6,656,379 — 185,738 6,842,117Convertible
Preferred Stocks — — 82,162 82,162Short-Term
Investment — Investment Company 174,656 — — 174,656Total Assets $6,831,035 $— $267,900 $7,098,935
Value Shares (000)
Publishing (1.4%)Morningstar, Inc. 1,541,657 $ 97,201
Recreational Vehicles & Boats (3.6%)Edenred (France) 8,459,946 254,545
Restaurants (1.2%)Dunkin’ Brands Group, Inc. 2,756,896 83,010
Scientific Instruments: Pollution Control (1.0%)Covanta Holding Corp. 4,560,544 74,018
Semiconductors & Components (2.0%)ARM Holdings PLC ADR (United Kingdom) 3,882,222 109,828First Solar, Inc. (a) 1,139,195 28,537
138,365
Utilities: Electrical (1.7%)Brookfield Infrastructure Partners LP (Canada) 3,774,214 119,265
Total Common Stocks (Cost $5,610,323) 6,842,117
Convertible Preferred Stocks (1.1%)Alternative Energy (0.8%)Better Place, Inc. (a)(c)(d) 9,009,542 40,903Better Place, Inc. Series C (a)(c)(d) 2,796,975 12,698
53,601
Computer Services, Software & Systems (0.1%)Workday, Inc. (a)(c)(d) 805,930 10,687
Technology: Miscellaneous (0.2%)Peixe Urbano, Inc. (Brazil) (a)(c)(d) 542,936 17,874
Total Convertible Preferred Stocks (Cost $63,782) 82,162
Short-Term Investment (2.5%)Investment Company (2.5%)Morgan Stanley Institutional
Liquidity Funds — Money Market Portfolio — Institutional Class (See Note G-2) (Cost $174,656) 174,655,713 174,656
Total Investments (100.5%) (Cost $5,848,761) 7,098,935
Liabilities in Excess of Other Assets (-0.5%) (38,705)
Net Assets (100.0%) $7,060,230
(a) Non-income producing security.(b) Security trades on the Hong Kong exchange.(c) At March 31, 2012, the Portfolio held fair valued securities valued at
approximately $267,900,000, representing 3.8% of net assets. Thesesecurities have been fair valued as determined in good faith underprocedures established by and under the general supervision of the Fund’sTrustees.
(d) Security has been deemed illiquid at March 31, 2012.ADR American Depositary Receipt.SDR Swedish Depositary Receipt.
2012 Semi-Annual Report
March 31, 2012 (unaudited)

18
Portfolio of Investments (cont’d)Mid Cap Growth Portfolio
The accompanying notes are an integral part of the financial statements.
Portfolio Composition
Percentage ofClassification Total InvestmentsOther* 51.1%Computer Services, Software & Systems 16.0Diversified Retail 9.1Commercial Services 8.4Financial Data & Systems 5.3Pharmaceuticals 5.1Communications Technology 5.0Total Investments 100.0%
* Industries representing less than 5% of total investments.
Fair Value Measurement Information: (cont’d)Transfers between investment levels may occur as the markets fluctuateand/or the availability of data used in an investment’s valuation changes. ThePortfolio recognizes transfers between the levels as of the end of the period.As of March 31, 2012, securities with a total value of approximately$587,312,000 transferred from Level 2 to Level 1. At September 30, 2011the fair market value of certain securities were adjusted due todevelopments which occurred between the time of the close of foreignmarkets which they trade and the close of business on the NYSE whichresulted in their Level 2 classification.Following is a reconciliation of investments in which significant unobservableinputs (Level 3) were used in determining fair value.
Convertible Common Preferred Preferred
Stocks Stocks Stock(000) (000) (000)
Beginning Balance $ — $118,412 $ 47,566Purchases 36,896 41,259 —Sales — — —Amortization of discount — — —Transfers in — — —Transfers out — — —Corporate Action 94,895 (47,329) (47,566)Change in unrealized appreciation
(depreciation) 53,947 (30,180) —Realized gains (losses) — — —Ending Balance $185,738 $ 82,162 $ —Net change in unrealized
appreciation/depreciation from investments still held as of March 31, 2012 $ 5,389 $ 18,379 $ —
2012 Semi-Annual Report
March 31, 2012 (unaudited)

19
FUEL Trust4.21%, 4/15/16 (b) $ 200 $ 205
Great America Leasing Receivables1.69%, 2/15/14 (b) 300 301
Louisiana Public Facilities Authority1.46%, 4/26/27 (c) 325 316
Macquarie Equipment Funding Trust1.21%, 9/20/13 (b) 234 234
Mercedes-Benz Auto Lease Trust1.18%, 11/15/13 (b) 350 351
MMCA Automobile Trust1.22%, 1/15/15 (b) 225 226
North Carolina State Education Assistance Authority1.46%, 1/26/26 (c) 225 222
Panhandle-Plains Higher Education Authority, Inc.1.42%, 7/1/24 (c) 125 123
Textainer Marine Containers Ltd.4.70%, 6/15/26 (b) 231 236
3,673
Collateralized Mortgage Obligations — Agency Collateral Series (6.8%)Federal Home Loan Mortgage Corporation,
2.32%, 10/25/18 155 1572.70%, 5/25/18 335 3482.97%, 10/25/21 300 3063.87%, 4/25/21 325 353IO0.68%, 1/25/21 (c) 2,283 96IO PAC REMIC6.23%, 6/15/40 (c) 1,946 374IO STRIPS8.00%, 1/1/28 22 6REMIC6.66%, 1/15/42 (c)(d) 126 119
Federal National Mortgage Association,3.76%, 6/25/21 110 117IO6.15%, 9/25/20 (c) 1,773 497IO REMIC6.36%, 9/25/38 (c) 607 129REMIC6.66%, 1/25/42 (c)(d) 312 2989.11%, 10/25/41 (c)(d) 219 211
Government National Mortgage Association,IO1.37%, 4/16/53 (c) 4,545 368IO REMIC0.85%, 8/20/58 (c) 2,953 1005.00%, 2/16/41 177 335.81%, 11/16/40 (c) 1,182 2276.34%, 6/20/40 (c) 874 1556.36%, 4/16/41 (c) 1,239 236
4,130
Portfolio of InvestmentsCore Fixed Income Portfolio Face Amount Value (000) (000)
Face Amount Value (000) (000)
Fixed Income Securities (96.2%)Agency Fixed Rate Mortgages (28.4%)Federal Home Loan Mortgage Corporation,
April TBA:3.00%, 4/25/27 (a) $ 1,205 $ 1,2463.50%, 4/25/42 (a) 610 625Gold Pools:4.00%, 12/1/41 288 3025.00%, 10/1/35 937 1,0106.00%, 5/1/37 - 10/1/38 353 3927.50%, 5/1/35 64 778.00%, 8/1/32 32 398.50%, 8/1/31 52 64
Federal National Mortgage Association,April TBA:2.50%, 4/25/27 (a) 605 6134.50%, 4/25/42 (a) 275 293Conventional Pools:4.00%, 11/1/41 - 12/1/41 1,680 1,7644.50%, 8/1/40 - 8/1/41 2,196 2,3515.00%, 3/1/39 896 9835.50%, 4/1/34 - 2/1/38 2,120 2,3236.00%, 1/1/38 230 2536.50%, 7/1/29 - 2/1/33 389 4457.00%, 10/1/31 - 12/1/31 3 37.50%, 8/1/37 108 1308.00%, 4/1/33 79 968.50%, 10/1/32 78 95
Government National Mortgage Association,April TBA:3.50%, 4/25/42 (a) 1,305 1,3614.00%, 4/25/42 (a) 1,935 2,076Various Pools:4.50%, 4/15/39 - 8/15/39 590 644
17,185
Asset-Backed Securities (6.1%)Ally Master Owner Trust
2.88%, 4/15/15 (b) 225 229ARI Fleet Lease Trust
1.69%, 8/15/18 (b)(c) 30 30Brazos Higher Education Authority
1.41%, 7/25/29 (c) 325 318CVS Pass-Through Trust
6.04%, 12/10/28 73 81Discover Card Master Trust
0.59%, 8/15/16 (c) 300 302Enterprise Fleet Financing LLC,
1.43%, 10/20/16 (b) 200 2001.62%, 5/20/17 (b) 120 120
Ford Credit Floorplan Master Owner Trust2.12%, 2/15/16 175 179
The accompanying notes are an integral part of the financial statements.
2012 Semi-Annual Report
March 31, 2012 (unaudited)
20
Portfolio of Investments (cont’d)Core Fixed Income Portfolio
The accompanying notes are an integral part of the financial statements.
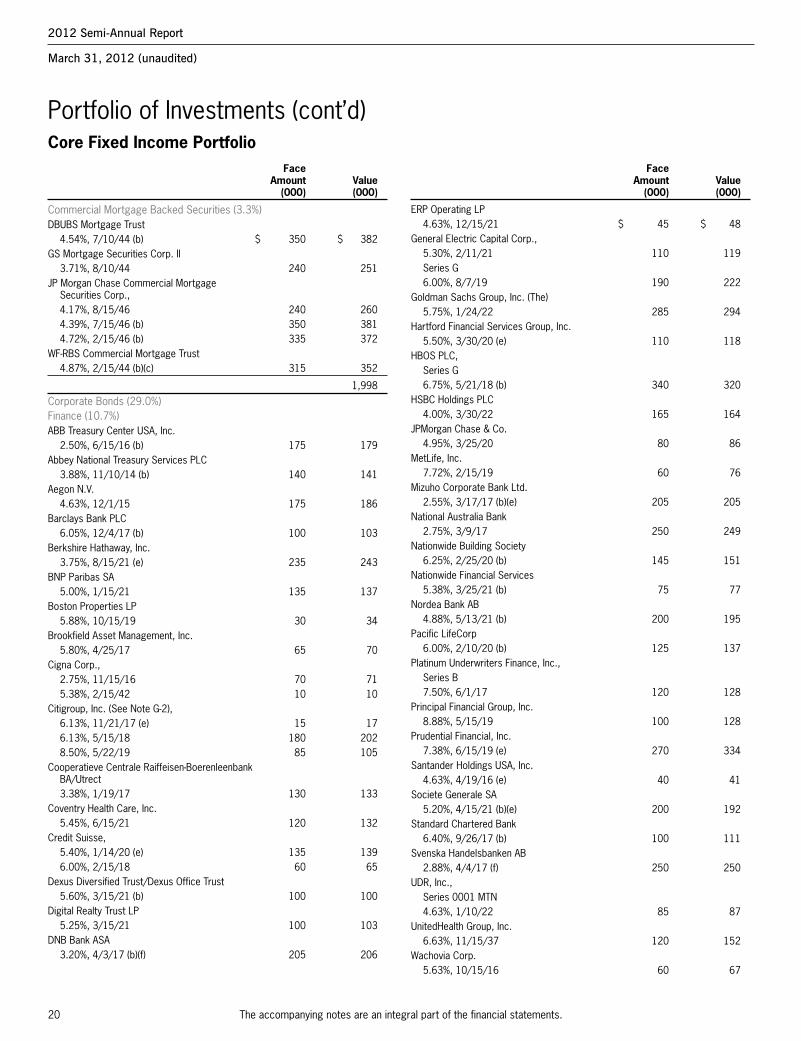
ERP Operating LP4.63%, 12/15/21 $ 45 $ 48
General Electric Capital Corp.,5.30%, 2/11/21 110 119Series G6.00%, 8/7/19 190 222
Goldman Sachs Group, Inc. (The)5.75%, 1/24/22 285 294
Hartford Financial Services Group, Inc.5.50%, 3/30/20 (e) 110 118
HBOS PLC,Series G6.75%, 5/21/18 (b) 340 320
HSBC Holdings PLC4.00%, 3/30/22 165 164
JPMorgan Chase & Co.4.95%, 3/25/20 80 86
MetLife, Inc.7.72%, 2/15/19 60 76
Mizuho Corporate Bank Ltd.2.55%, 3/17/17 (b)(e) 205 205
National Australia Bank2.75%, 3/9/17 250 249
Nationwide Building Society6.25%, 2/25/20 (b) 145 151
Nationwide Financial Services5.38%, 3/25/21 (b) 75 77
Nordea Bank AB4.88%, 5/13/21 (b) 200 195
Pacific LifeCorp6.00%, 2/10/20 (b) 125 137
Platinum Underwriters Finance, Inc.,Series B7.50%, 6/1/17 120 128
Principal Financial Group, Inc.8.88%, 5/15/19 100 128
Prudential Financial, Inc.7.38%, 6/15/19 (e) 270 334
Santander Holdings USA, Inc.4.63%, 4/19/16 (e) 40 41
Societe Generale SA5.20%, 4/15/21 (b)(e) 200 192
Standard Chartered Bank6.40%, 9/26/17 (b) 100 111
Svenska Handelsbanken AB2.88%, 4/4/17 (f) 250 250
UDR, Inc.,Series 0001 MTN4.63%, 1/10/22 85 87
UnitedHealth Group, Inc.6.63%, 11/15/37 120 152
Wachovia Corp.5.63%, 10/15/16 60 67
Face Amount Value (000) (000)
Face Amount Value (000) (000)
Commercial Mortgage Backed Securities (3.3%)DBUBS Mortgage Trust
4.54%, 7/10/44 (b) $ 350 $ 382GS Mortgage Securities Corp. II
3.71%, 8/10/44 240 251JP Morgan Chase Commercial Mortgage
Securities Corp.,4.17%, 8/15/46 240 2604.39%, 7/15/46 (b) 350 3814.72%, 2/15/46 (b) 335 372
WF-RBS Commercial Mortgage Trust4.87%, 2/15/44 (b)(c) 315 352
1,998
Corporate Bonds (29.0%)Finance (10.7%)ABB Treasury Center USA, Inc.
2.50%, 6/15/16 (b) 175 179Abbey National Treasury Services PLC
3.88%, 11/10/14 (b) 140 141Aegon N.V.
4.63%, 12/1/15 175 186Barclays Bank PLC
6.05%, 12/4/17 (b) 100 103Berkshire Hathaway, Inc.
3.75%, 8/15/21 (e) 235 243BNP Paribas SA
5.00%, 1/15/21 135 137Boston Properties LP
5.88%, 10/15/19 30 34Brookfield Asset Management, Inc.
5.80%, 4/25/17 65 70Cigna Corp.,
2.75%, 11/15/16 70 715.38%, 2/15/42 10 10
Citigroup, Inc. (See Note G-2),6.13%, 11/21/17 (e) 15 176.13%, 5/15/18 180 2028.50%, 5/22/19 85 105
Cooperatieve Centrale Raiffeisen-Boerenleenbank BA/Utrect3.38%, 1/19/17 130 133
Coventry Health Care, Inc.5.45%, 6/15/21 120 132
Credit Suisse,5.40%, 1/14/20 (e) 135 1396.00%, 2/15/18 60 65
Dexus Diversified Trust/Dexus Office Trust5.60%, 3/15/21 (b) 100 100
Digital Realty Trust LP5.25%, 3/15/21 100 103
DNB Bank ASA3.20%, 4/3/17 (b)(f) 205 206
2012 Semi-Annual Report
March 31, 2012 (unaudited)

21
Portfolio of Investments (cont’d)Core Fixed Income Portfolio
The accompanying notes are an integral part of the financial statements.
ConAgra Foods, Inc.8.25%, 9/15/30 $ 115 $ 146
Corning, Inc.4.75%, 3/15/42 (e) 50 49
CRH America, Inc.6.00%, 9/30/16 135 147
Daimler Finance North America LLC8.50%, 1/18/31 55 80
Darden Restaurants, Inc.6.20%, 10/15/17 205 232
Delhaize Group SA5.70%, 10/1/40 106 98
Deutsche Telekom International Finance BV8.75%, 6/15/30 65 90
DirecTV Holdings LLC/DirecTV Financing Co., Inc.,3.80%, 3/15/22 (b) 75 745.88%, 10/1/19 (e) 125 143
Ecolab, Inc.3.00%, 12/8/16 90 94
Fiserv, Inc.3.13%, 6/15/16 80 82
Georgia-Pacific LLC5.40%, 11/1/20 (b)(e) 90 101
Gilead Sciences, Inc.,4.50%, 4/1/21 (e) 95 1015.65%, 12/1/41 75 80
Grupo Bimbo SAB de CV4.88%, 6/30/20 (b) 100 106
Harley-Davidson Funding Corp.6.80%, 6/15/18 (b) 105 123
Hess Corp.6.00%, 1/15/40 175 201
Hewlett-Packard Co.4.65%, 12/9/21 165 173
Holcim US Finance Sarl & Cie SCS6.00%, 12/30/19 (b) 85 88
Kinross Gold Corp.5.13%, 9/1/21 (b)(e) 115 117
KLA-Tencor Corp.6.90%, 5/1/18 145 173
Koninklijke Philips Electronics3.75%, 3/15/22 150 151
Kraft Foods, Inc.5.38%, 2/10/20 195 226
L-3 Communications Corp.4.75%, 7/15/20 (e) 135 140
Macy’s Retail Holdings, Inc.3.88%, 1/15/22 55 55
Marathon Petroleum Corp.5.13%, 3/1/21 (e) 195 212
NBC Universal Media LLC5.15%, 4/30/20 140 159
Face Amount Value (000) (000)
Face Amount Value (000) (000)
Finance (cont’d)WEA Finance LLC
4.63%, 5/10/21 (b) $ 75 $ 76Wells Fargo & Co.
5.63%, 12/11/17 (e) 60 70
6,473
Industrials (15.9%)Agilent Technologies, Inc.
5.50%, 9/14/15 120 135Air Products & Chemicals, Inc.
2.00%, 8/2/16 165 169Albemarle Corp.
4.50%, 12/15/20 110 118Altria Group, Inc.,
4.13%, 9/11/15 50 559.25%, 8/6/19 125 168
American Honda Finance Corp.2.13%, 2/28/17 (b) 200 201
Anglo American Capital PLC9.38%, 4/8/19 (b) 100 132
ArcelorMittal9.85%, 6/1/19 (e) 100 120
Aristotle Holding, Inc.2.65%, 2/15/17 (b) 110 111
AT&T, Inc.,3.88%, 8/15/21 (e) 45 486.30%, 1/15/38 170 200
BAA Funding Ltd.4.88%, 7/15/21 (b)(e) 170 174
Barrick Gold Corp.3.85%, 4/1/22 75 75
Barrick North America Finance LLC4.40%, 5/30/21 95 100
BAT International Finance PLC9.50%, 11/15/18 (b) 165 225
Bemis Co., Inc.4.50%, 10/15/21 110 115
Best Buy Co., Inc.3.75%, 3/15/16 (e) 165 167
Boeing Capital Corp.2.13%, 8/15/16 (e) 175 181
Bunge Ltd. Finance Corp.8.50%, 6/15/19 85 104
Burlington Northern Santa Fe LLC5.65%, 5/1/17 115 134
Canadian Oil Sands Ltd.7.75%, 5/15/19 (b) 125 153
Coca-Cola Co. (The)1.65%, 3/14/18 150 149
Comcast Corp.,5.15%, 3/1/20 (e) 75 865.70%, 5/15/18 50 59
2012 Semi-Annual Report
March 31, 2012 (unaudited)

22
Portfolio of Investments (cont’d)Core Fixed Income Portfolio
The accompanying notes are an integral part of the financial statements.
Utilities (2.4%)EDF SA
4.60%, 1/27/20 (b) $ 80 $ 85Energy Transfer Partners LP
9.00%, 4/15/19 58 72Enterprise Products Operating LLC,
5.25%, 1/31/20 (e) 50 56Series N6.50%, 1/31/19 160 190
Exelon Generation Co., LLC6.25%, 10/1/39 140 164
FirstEnergy Solutions Corp.6.05%, 8/15/21 225 253
Kinder Morgan Energy Partners LP5.95%, 2/15/18 160 187
Plains All American Pipeline LP/PAA Finance Corp.,6.70%, 5/15/36 160 1888.75%, 5/1/19 (e) 65 85
PPL WEM Holdings PLC3.90%, 5/1/16 (b) 150 156
1,436
17,548
Municipal Bonds (1.5%)Chicago, IL, Transit Authority
6.20%, 12/1/40 100 114City of Chicago, IL,
O’Hare International Airport Revenue6.40%, 1/1/40 40 49
City of New York, NY,Series G-15.97%, 3/1/36 85 104
Illinois State Toll Highway Authority, Highway Revenue, Build America Bonds6.18%, 1/1/34 130 156
Municipal Electric Authority of Georgia6.66%, 4/1/57 155 174
New York City Transitional Finance Authority5.27%, 5/1/27 80 95
State of California, General Obligation Bonds5.95%, 4/1/16 175 198
890
Sovereign (1.2%)Bermuda Government International Bond
5.60%, 7/20/20 (b) 100 113Brazilian Government International Bond
4.88%, 1/22/21 (e) 220 250Korea Development Bank
4.38%, 8/10/15 130 138Mexico Government International Bond
3.63%, 3/15/22 (e) 200 205
706
Face Amount Value (000) (000)
Face Amount Value (000) (000)
Industrials (cont’d)News America, Inc.
4.50%, 2/15/21 $ 75 $ 80Nordstrom, Inc.
4.00%, 10/15/21 85 91PepsiCo, Inc.
2.75%, 3/5/22 125 122Phillips 66
4.30%, 4/1/22 (b) 100 102Quest Diagnostics, Inc.
6.95%, 7/1/37 95 116SABMiller Holdings, Inc.
3.75%, 1/15/22 (b) 200 204Sanofi
4.00%, 3/29/21 (e) 135 147Sonoco Products Co.
5.75%, 11/1/40 100 107Syngenta Finance
3.13%, 3/28/22 80 81Telstra Corp., Ltd.
4.80%, 10/12/21 (b)(e) 100 109Teva Pharmaceutical Finance IV BV
3.65%, 11/10/21 215 218Time Warner Cable, Inc.,
6.75%, 6/15/39 (e) 40 488.75%, 2/14/19 (e) 55 72
Time Warner, Inc.,4.70%, 1/15/21 100 1094.75%, 3/29/21 (e) 90 995.88%, 11/15/16 75 88
Total Capital International SA2.88%, 2/17/22 (e) 150 144
Vale Overseas Ltd.5.63%, 9/15/19 110 123
Valspar Corp.4.20%, 1/15/22 155 159
Verizon Communications, Inc.,4.60%, 4/1/21 (e) 30 338.95%, 3/1/39 50 77
VF Corp.3.50%, 9/1/21 105 108
Vivendi SA6.63%, 4/4/18 (b) 120 135
Volkswagen International Finance2.38%, 3/22/17 (b) 115 116
Wesfarmers Ltd.2.98%, 5/18/16 (b) 85 87
Woolworths Ltd.4.00%, 9/22/20 (b) 125 129
WPP Finance UK8.00%, 9/15/14 100 115
9,639
2012 Semi-Annual Report
March 31, 2012 (unaudited)
23
Portfolio of Investments (cont’d)Core Fixed Income Portfolio
The accompanying notes are an integral part of the financial statements.
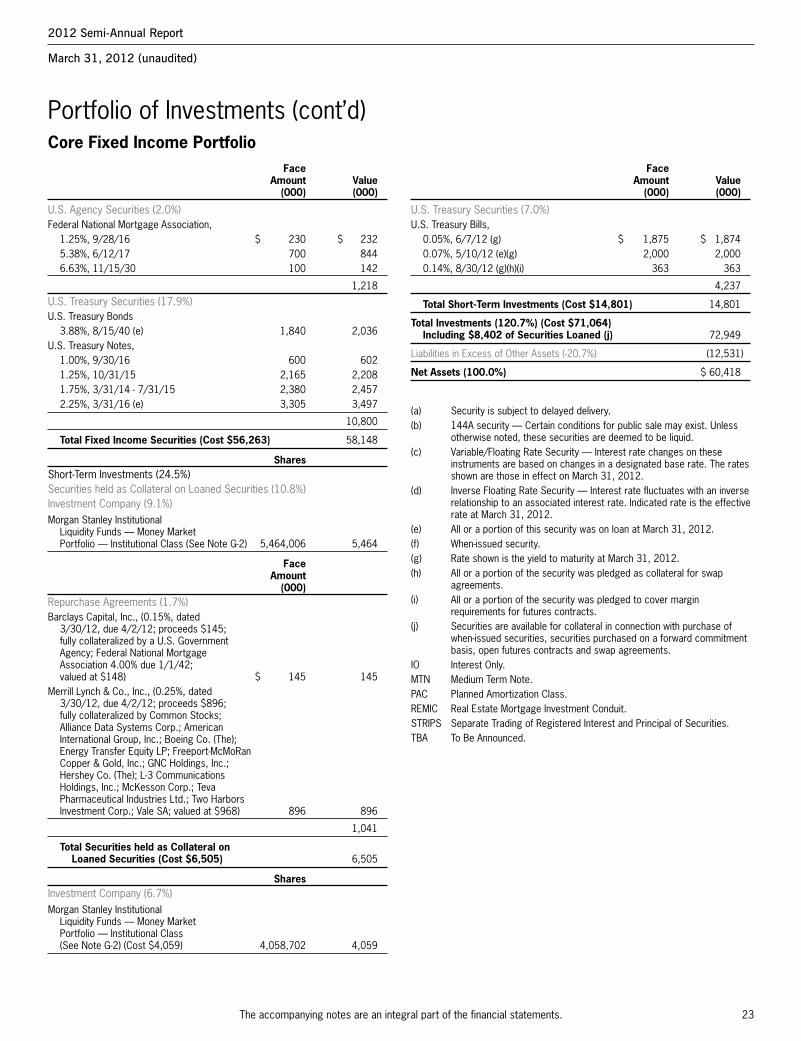
U.S. Treasury Securities (7.0%)U.S. Treasury Bills,
0.05%, 6/7/12 (g) $ 1,875 $ 1,8740.07%, 5/10/12 (e)(g) 2,000 2,0000.14%, 8/30/12 (g)(h)(i) 363 363
4,237
Total Short-Term Investments (Cost $14,801) 14,801
Total Investments (120.7%) (Cost $71,064) Including $8,402 of Securities Loaned (j) 72,949
Liabilities in Excess of Other Assets (-20.7%) (12,531)
Net Assets (100.0%) $ 60,418
(a) Security is subject to delayed delivery.(b) 144A security — Certain conditions for public sale may exist. Unless
otherwise noted, these securities are deemed to be liquid.(c) Variable/Floating Rate Security — Interest rate changes on these
instruments are based on changes in a designated base rate. The ratesshown are those in effect on March 31, 2012.
(d) Inverse Floating Rate Security — Interest rate fluctuates with an inverserelationship to an associated interest rate. Indicated rate is the effectiverate at March 31, 2012.
(e) All or a portion of this security was on loan at March 31, 2012.(f) When-issued security.(g) Rate shown is the yield to maturity at March 31, 2012.(h) All or a portion of the security was pledged as collateral for swap
agreements.(i) All or a portion of the security was pledged to cover margin
requirements for futures contracts.(j) Securities are available for collateral in connection with purchase of
when-issued securities, securities purchased on a forward commitmentbasis, open futures contracts and swap agreements.
IO Interest Only.MTN Medium Term Note.PAC Planned Amortization Class.REMIC Real Estate Mortgage Investment Conduit.STRIPS Separate Trading of Registered Interest and Principal of Securities.TBA To Be Announced.
Face Amount Value (000) (000)
Face Amount Value (000) (000)
U.S. Agency Securities (2.0%)Federal National Mortgage Association,
1.25%, 9/28/16 $ 230 $ 2325.38%, 6/12/17 700 8446.63%, 11/15/30 100 142
1,218
U.S. Treasury Securities (17.9%)U.S. Treasury Bonds
3.88%, 8/15/40 (e) 1,840 2,036U.S. Treasury Notes,
1.00%, 9/30/16 600 6021.25%, 10/31/15 2,165 2,2081.75%, 3/31/14 - 7/31/15 2,380 2,4572.25%, 3/31/16 (e) 3,305 3,497
10,800
Total Fixed Income Securities (Cost $56,263) 58,148
Shares Short-Term Investments (24.5%)Securities held as Collateral on Loaned Securities (10.8%)Investment Company (9.1%)Morgan Stanley Institutional
Liquidity Funds — Money Market Portfolio — Institutional Class (See Note G-2) 5,464,006 5,464
Face Amount (000) Repurchase Agreements (1.7%)Barclays Capital, Inc., (0.15%, dated
3/30/12, due 4/2/12; proceeds $145; fully collateralized by a U.S. Government Agency; Federal National Mortgage Association 4.00% due 1/1/42; valued at $148) $ 145 145
Merrill Lynch & Co., Inc., (0.25%, dated 3/30/12, due 4/2/12; proceeds $896; fully collateralized by Common Stocks; Alliance Data Systems Corp.; American International Group, Inc.; Boeing Co. (The); Energy Transfer Equity LP; Freeport-McMoRan Copper & Gold, Inc.; GNC Holdings, Inc.; Hershey Co. (The); L-3 Communications Holdings, Inc.; McKesson Corp.; Teva Pharmaceutical Industries Ltd.; Two Harbors Investment Corp.; Vale SA; valued at $968) 896 896
1,041
Total Securities held as Collateral on Loaned Securities (Cost $6,505) 6,505
Shares Investment Company (6.7%)Morgan Stanley Institutional
Liquidity Funds — Money Market Portfolio — Institutional Class (See Note G-2) (Cost $4,059) 4,058,702 4,059
2012 Semi-Annual Report
March 31, 2012 (unaudited)

24
Portfolio of Investments (cont’d)Core Fixed Income Portfolio
The accompanying notes are an integral part of the financial statements.
2012 Semi-Annual Report
March 31, 2012 (unaudited)
Futures Contracts:The Portfolio had the following futures contracts open at period end:
Unrealized Number Appreciation of Value Expiration (Depreciation) Contracts (000) Date (000)
Long:
U.S. Treasury 2 yr. Note 16 $ 3,522 Jun-12 $ (2)
Short:
U.S. Treasury 5 yr. Note 11 (1,348) Jun-12 (1)U.S. Treasury 10 yr. Note 11 (1,424) Jun-12 (4)U.S. Treasury 10 yr. Note 3 (344) Jun-12 (4)U.S. Treasury 30 yr. Bond 3 (413) Jun-12 12Ultra Long U.S. Treasury Bond 4 (604) Jun-12 (11) $(10)
Zero Coupon Swap Agreements:
The Portfolio had the following zero coupon swap agreements open at period end: Premium Unrealized Notional Paid Appreciation Amount Floating Pay/Receive Termination (Received) (Depreciation)Swap Counterparty (000) Rate Index Floating Rate Date (000) (000)Barclays Capital $1,726 3 Month LIBOR Pay 11/15/19 $ 59 $ 246Barclays Capital 1,457 3 Month LIBOR Receive 11/15/19 (105) (455) $(209) LIBOR London Interbank Offered Rate.
Fair Value Measurement Information: (cont’d) Level 2 Level 1 Other Level 3 Unadjusted significant Significant quoted observable unobservable prices inputs inputs TotalInvestment Type (000) (000) (000) (000)
Fixed Income Securities (cont’d)
U.S. Treasury Securities $ — $ 10,800 $— $ 10,800Total Fixed Income
Securities — 58,148 — 58,148
Short-Term Investments
Repurchase Agreements — 1,041 — 1,041Investment Companies 9,523 — — 9,523U.S. Treasury Securities — 4,237 — 4,237Total Short-Term
Investments 9,523 5,278 — 14,801Futures Contracts 12 — — 12Zero Coupon Swap
Agreements — 246 — 246Total Assets 9,535 63,672 — 73,207Liabilities:Futures Contracts (22) — — (22)Zero Coupon Swap
Agreements — (455) — (455)Total Liabilities (22) (455) — (477)Total $9,513 $63,217 $— $72,730
Fair Value Measurement Information:The following is a summary of the inputs used to value the Portfolio’sinvestments as of March 31, 2012. (See Note A-5 to the financial statementsfor further information regarding fair value measurement.) Level 2 Level 1 Other Level 3 Unadjusted significant Significant quoted observable unobservable prices inputs inputs TotalInvestment Type (000) (000) (000) (000)Assets:
Fixed Income Securities
Agency Fixed Rate Mortgages $ — $ 17,185 $— $ 17,185
Asset-Backed Securities — 3,673 — 3,673Collateralized Mortgage
Obligations — Agency Collateral Series — 4,130 — 4,130
Commercial Mortgage Backed Securities — 1,998 — 1,998
Corporate Bonds — 17,548 — 17,548Municipal Bonds — 890 — 890Sovereign — 706 — 706U.S. Agency Securities — 1,218 — 1,218

25
Portfolio of Investments (cont’d)Core Fixed Income Portfolio
The accompanying notes are an integral part of the financial statements.
Fair Value Measurement Information: (cont’d)
Transfers between investment levels may occur as the markets fluctuateand/or the availability of data used in an investment’s valuation changes. ThePortfolio recognizes transfers between the levels as of the end of the period.As of March 31, 2012, the Portfolio did not have any significant investmentstransfer between investment levels.
Portfolio Composition*
Percentage ofClassification Total InvestmentsAgency Fixed Rate Mortgages 25.9%U.S. Treasury Securities 16.3Industrials 14.5Short-Term Investments 12.5Finance 9.7Other** 9.4Collateralized Mortgage Obligations — Agency
Collateral Series 6.2Asset-Backed Securities 5.5Total Investments 100.0%***
* Percentages indicated are based upon total investments (excluding Securities heldas Collateral on Loaned Securities) as of March 31, 2012.
** Industries and/or investment types representing less than 5% of total investments.*** Does not include open long/short futures contracts with an underlying face amount
of approximately $7,655,000 and net unrealized depreciation of approximately$10,000 and open swap agreements with net unrealized depreciation ofapproximately $209,000.
2012 Semi-Annual Report
March 31, 2012 (unaudited)

26
Santander Drive Auto Receivables Trust3.06%, 11/15/17 $ 1,075 $ 1,078
SLM Student Loan Trust4.37%, 4/17/28 (c) 825 857
Textainer Marine Containers Ltd.4.70%, 6/15/26 (c) 694 709
U-Haul S Fleet LLC4.90%, 10/25/23 (c) 1,556 1,625
Westlake Automobile Receivables Trust5.00%, 5/15/15 (c) 534 539
6,664
Collateralized Mortgage Obligations — Agency Collateral Series (4.7%)Federal Home Loan Mortgage Corporation,
IO0.68%, 1/25/21 (b) 10,125 428IO PAC REMIC6.23%, 6/15/40 (b) 11,121 2,136IO STRIPS7.50%, 12/1/29 92 218.00%, 1/1/28 157 42PAC REMIC9.50%, 4/15/20 1 2REMIC6.66%, 1/15/42 (b)(d) 593 557
Federal National Mortgage Association,IO6.15%, 9/25/20 (b) 5,220 1,463IO PAC REMIC8.00%, 9/18/27 415 96IO REMIC5.00%, 8/25/37 2,523 1386.00%, 7/25/33 684 1136.36%, 9/25/38 (b) 2,886 614IO STRIPS6.50%, 9/1/29 - 12/1/29 1,785 2758.00%, 4/1/24 509 1108.50%, 10/1/25 131 269.00%, 11/1/26 125 30REMIC6.66%, 1/25/42 (b)(d) 1,485 1,4227.00%, 9/25/32 855 1,0149.11%, 10/25/41 (b)(d) 973 93963.02%, 9/25/20 (b)(d) 10 20
Government National Mortgage Association,IO REMIC5.00%, 2/16/41 930 1735.81%, 11/16/40 (b) 5,181 9946.34%, 6/20/40 (b) 3,806 6756.36%, 4/16/41 (b) 6,817 1,299
12,587
Portfolio of InvestmentsCore Plus Fixed Income Portfolio Face Amount Value (000) (000)
Face Amount Value (000) (000)
Fixed Income Securities (96.0%)Agency Adjustable Rate Mortgages (0.7%)Federal National Mortgage Association,
Conventional Pools:2.39%, 5/1/35 $ 1,884 $ 1,993
Agency Fixed Rate Mortgages (27.4%)Federal Home Loan Mortgage Corporation,
April TBA:3.00%, 4/25/27 (a) 2,600 2,6893.50%, 4/25/42 (a) 2,680 2,747Conventional Pools:12.00%, 2/1/15 1 113.00%, 6/1/19 —@ —@Gold Pools:4.00%, 12/1/41 2,883 3,0224.50%, 6/1/39 - 3/1/41 9,486 10,0675.00%, 10/1/35 352 3806.00%, 10/1/36 - 8/1/38 1,789 1,9806.50%, 3/1/16 - 8/1/33 433 4927.00%, 6/1/28 - 11/1/31 152 177
Federal National Mortgage Association,April TBA:2.50%, 4/25/27 (a) 2,720 2,7584.50%, 4/25/42 (a) 2,550 2,713Conventional Pools:4.00%, 11/1/41 - 1/1/42 13,165 13,8225.00%, 1/1/37 - 3/1/41 3,375 3,6645.50%, 6/1/35 - 5/1/41 10,825 11,8786.00%, 5/1/38 2,045 2,2566.50%, 11/1/23 - 1/1/34 5,285 6,0397.00%, 11/1/13 - 1/1/34 816 9458.50%, 1/1/15 3 39.50%, 4/1/30 720 86412.00%, 11/1/15 25 2612.50%, 9/1/15 5 5
Government National Mortgage Association,April TBA:3.50%, 4/25/42 (a) 3,125 3,2574.00%, 4/25/42 (a) 2,700 2,897Various Pool4.50%, 8/15/39 746 814
73,496
Asset-Backed Securities (2.5%)ARI Fleet Lease Trust
1.69%, 8/15/18 (b)(c) 197 197Contimortgage Home Equity Trust
8.10%, 8/15/25 43 43CVS Pass-Through Trust
6.04%, 12/10/28 636 700FUEL Trust
4.21%, 4/15/16 (c) 860 883Mid-State Trust
8.33%, 4/1/30 33 33
The accompanying notes are an integral part of the financial statements.
2012 Semi-Annual Report
March 31, 2012 (unaudited)

27
Portfolio of Investments (cont’d)Core Plus Fixed Income Portfolio
The accompanying notes are an integral part of the financial statements.
Citigroup, Inc. (See Note G-2)8.50%, 5/22/19 (e) $ 704 $ 8695.88%, 5/29/37 264 272
CNA Financial Corp.5.75%, 8/15/21 315 336
Cooperatieve Centrale Raiffeisen-Boerenleenbank BA/Utrect3.38%, 1/19/17 (e) 615 629
Coventry Health Care, Inc.5.45%, 6/15/21 540 592
Credit Suisse6.00%, 2/15/18 (e) 369 400
Dexus Diversified Trust/Dexus Office Trust5.60%, 3/15/21 (c) 600 599
Digital Realty Trust LP4.50%, 7/15/15 400 420
Discover Bank7.00%, 4/15/20 (e) 575 661
DNB Bank ASA3.20%, 4/3/17 (c)(f) 685 688
ERP Operating LP4.63%, 12/15/21 205 216
Farmers Insurance Exchange8.63%, 5/1/24 (c) 320 404
General Electric Capital Corp.,5.30%, 2/11/21 (e) 630 684Series G6.00%, 8/7/19 694 812
Genworth Financial, Inc.7.20%, 2/15/21 625 638
Goldman Sachs Group, Inc. (The)5.75%, 1/24/22 1,355 1,397
Goodman Funding Pty Ltd.6.38%, 4/15/21 (c) 850 881
Hartford Financial Services Group, Inc.5.50%, 3/30/20 (e) 645 690
HBOS PLC,Series G6.75%, 5/21/18 (c) 1,388 1,304
Health Care REIT, Inc.4.75%, 7/15/27 520 582
HSBC Holdings PLC4.00%, 3/30/22 635 631
ING Bank3.75%, 3/7/17 (c) 600 595
JPMorgan Chase Bank NA6.00%, 10/1/17 (e) 715 819
Macquarie Bank Ltd.6.63%, 4/7/21 (c) 490 493
Merrill Lynch & Co., Inc.,MTN6.88%, 4/25/18 908 1,011
Face Amount Value (000) (000)
Face Amount Value (000) (000)
Commercial Mortgage Backed Securities (2.6%)Banc of America Merrill Lynch Commercial
Mortgage, Inc.5.67%, 4/10/49 (b) $ 795 $ 794
Bear Stearns Commercial Mortgage Securities5.47%, 1/12/45 (b) 1,526 1,737
DBUBS Mortgage Trust5.45%, 7/10/44 (b)(c) 325 329
FREMF Mortgage Trust5.16%, 2/25/47 (b)(c) 525 543
Greenwich Capital Commercial Funding Corp.5.87%, 12/10/49 (b) 960 929
JP Morgan Chase Commercial Mortgage Securities Corp.,4.17%, 8/15/46 1,100 1,1904.80%, 7/15/46 (c) 775 8066.06%, 2/15/51 (b) 730 724
7,052
Corporate Bonds (36.7%)Finance (13.9%)ABB Treasury Center USA, Inc.
2.50%, 6/15/16 (c) 800 817Abbey National Treasury Services PLC
3.88%, 11/10/14 (c) 439 442ABN Amro Bank N.V.
4.25%, 2/2/17 (c) 465 473Aegon N.V.
4.63%, 12/1/15 (e) 830 880Affiliated Managers Group, Inc.
3.95%, 8/15/38 (e) 496 548Alexandria Real Estate Equities, Inc.
4.60%, 4/1/22 400 392American International Group, Inc.
6.40%, 12/15/20 375 425Barclays Bank PLC
6.05%, 12/4/17 (c)(e) 600 620BBVA Bancomer SA
4.50%, 3/10/16 (c) 525 543Bear Stearns Cos. LLC (The)
7.25%, 2/1/18 (e) 490 592BNP Paribas SA
5.00%, 1/15/21 615 622Brandywine Operating Partnership LP
4.95%, 4/15/18 750 766Brookfield Asset Management, Inc.
5.80%, 4/25/17 (e) 300 325Capital One Bank, USA NA
8.80%, 7/15/19 555 680Cigna Corp.,
2.75%, 11/15/16 335 3405.38%, 2/15/42 45 46
2012 Semi-Annual Report
March 31, 2012 (unaudited)

28
Portfolio of Investments (cont’d)Core Plus Fixed Income Portfolio
The accompanying notes are an integral part of the financial statements.
Altria Group, Inc.,4.13%, 9/11/15 $ 45 $ 499.25%, 8/6/19 687 925
American Honda Finance Corp.2.13%, 2/28/17 (c) 770 774
AMERIGROUP Corp.7.50%, 11/15/19 415 457
ArcelorMittal9.85%, 6/1/19 (e) 666 802
Archer-Daniels-Midland Co.0.88%, 2/15/14 535 550
Aristotle Holding, Inc.2.65%, 2/15/17 (c) 485 491
AT&T, Inc.6.30%, 1/15/38 (e) 500 590
BAA Funding Ltd.4.88%, 7/15/21 (c)(e) 750 766
Barrick Gold Corp.3.85%, 4/1/22 340 340
Barrick North America Finance LLC4.40%, 5/30/21 430 454
BAT International Finance PLC9.50%, 11/15/18 (c) 405 553
Bemis Co., Inc.4.50%, 10/15/21 525 550
Best Buy Co., Inc.3.75%, 3/15/16 (e) 545 550
Bombardier, Inc.7.75%, 3/15/20 (c)(e) 575 644
Boston Scientific Corp.6.00%, 1/15/20 480 552
Bunge Ltd. Finance Corp.8.50%, 6/15/19 566 692
Burlington Northern Santa Fe LLC3.05%, 3/15/22 725 714
Canadian Oil Sands Ltd.7.75%, 5/15/19 (c) 425 519
CBS Corp.8.88%, 5/15/19 500 658
CenturyLink, Inc.,5.80%, 3/15/22 380 3726.45%, 6/15/21 (e) 440 452
CF Industries, Inc.6.88%, 5/1/18 1,075 1,243
Chesapeake Energy Corp.,2.50%, 5/15/37 455 4156.78%, 3/15/19 (e) 425 422
Chrysler Group LLC/CG Co-Issuer, Inc.8.00%, 6/15/19 (e) 760 768
Cimarex Energy Co.5.88%, 5/1/22 (f) 400 409
Comcast Corp.5.70%, 5/15/18 98 116
Face Amount Value (000) (000)
Face Amount Value (000) (000)
Finance (cont’d)MetLife, Inc.
7.72%, 2/15/19 $ 285 $ 360Mizuho Corporate Bank Ltd.
2.55%, 3/17/17 (c)(e) 570 571National Australia Bank
2.75%, 3/9/17 545 543Nationwide Building Society
6.25%, 2/25/20 (c) 645 670Nationwide Financial Services
5.38%, 3/25/21 (c) 450 461Nordea Bank AB
4.88%, 5/13/21 (c) 765 746Platinum Underwriters Finance, Inc.,
Series B7.50%, 6/1/17 (e) 791 847
Principal Financial Group, Inc.8.88%, 5/15/19 308 394
QBE Capital Funding III Ltd.7.25%, 5/24/41 (b)(c)(e) 550 519
Regions Financial Corp.5.75%, 6/15/15 (e) 545 576
Santander Holdings USA, Inc.4.63%, 4/19/16 (e) 250 254
SLM Corp.,MTN6.25%, 1/25/16 580 604
Societe Generale SA5.20%, 4/15/21 (c)(e) 455 438
Standard Chartered Bank6.40%, 9/26/17 (c) 790 880
Svenska Handelsbanken AB2.88%, 4/4/17 (f) 695 696
UDR, Inc.,Series 0001 MTN4.63%, 1/10/22 410 421
UnitedHealth Group, Inc.,3.38%, 11/15/21 (e) 235 2424.63%, 11/15/41 (e) 265 266
Vornado Realty LP3.88%, 4/15/25 507 510
Wachovia Bank NA6.00%, 11/15/17 415 477
Wachovia Corp.5.63%, 10/15/16 400 446
WEA Finance LLC4.63%, 5/10/21 (c) 325 329
Wells Operating Partnership II LP5.88%, 4/1/18 800 811
37,195
Industrials (21.1%)Alpha Natural Resources, Inc.,
6.00%, 6/1/19 (e) 100 916.25%, 6/1/21 (e) 280 254
2012 Semi-Annual Report
March 31, 2012 (unaudited)

29
Portfolio of Investments (cont’d)Core Plus Fixed Income Portfolio
The accompanying notes are an integral part of the financial statements.
Hyatt Hotels Corp.6.88%, 8/15/19 (c) $ 545 $ 629
Ingram Micro, Inc.5.25%, 9/1/17 295 311
Intel Corp.2.95%, 12/15/35 (e) 588 679
International Game Technology3.25%, 5/1/14 492 560
Kinross Gold Corp.5.13%, 9/1/21 (c)(e) 520 529
KLA-Tencor Corp.6.90%, 5/1/18 659 787
Koninklijke Philips Electronics3.75%, 3/15/22 850 857
Lafarge SA6.20%, 7/9/15 (c) 765 806
Lam Research Corp.1.25%, 5/15/18 (c)(e) 651 687
Life Technologies Corp.6.00%, 3/1/20 605 693
LyondellBasell Industries N.V.5.00%, 4/15/19 (c)(f) 950 952
Macy’s Retail Holdings, Inc.3.88%, 1/15/22 (e) 265 266
Marathon Petroleum Corp.5.13%, 3/1/21 (e) 750 817
MeadWestvaco Corp.7.38%, 9/1/19 (e) 155 181
Medtronic, Inc.,Series B1.63%, 4/15/13 563 571
Micron Technology, Inc.1.88%, 6/1/14 466 476
Microsoft Corp.Zero Coupon, 6/15/13 (c)(e) 534 587
Molson Coors Brewing Co.2.50%, 7/30/13 (e) 497 522
NBC Universal Media LLC5.15%, 4/30/20 (e) 915 1,037
News America, Inc.4.50%, 2/15/21 (e) 340 363
PepsiCo, Inc.2.75%, 3/5/22 600 585
Phillips 664.30%, 4/1/22 (c) 750 764
Pioneer Natural Resources Co.7.50%, 1/15/20 375 461
priceline.com, Inc.1.00%, 3/15/18 (c) 155 165
Quest Diagnostics, Inc.6.95%, 7/1/37 400 490
RadioShack Corp.2.50%, 8/1/13 (c) 563 539
Face Amount Value (000) (000)
Face Amount Value (000) (000)
Industrials (cont’d)ConAgra Foods, Inc.
8.25%, 9/15/30 $ 425 $ 541Concho Resources, Inc.
7.00%, 1/15/21 (e) 115 124Constellation Brands, Inc.
7.25%, 9/1/16 370 421Continental Resources, Inc.
7.13%, 4/1/21 575 641Corning, Inc.,
4.75%, 3/15/42 (e) 200 1947.25%, 8/15/36 270 323
CRH America, Inc.6.00%, 9/30/16 (e) 580 632
CSC Holdings LLC6.75%, 11/15/21 (c)(e) 470 492
Daimler Finance North America LLC8.50%, 1/18/31 (e) 224 327
Darden Restaurants, Inc.6.20%, 10/15/17 520 587
Delhaize Group SA5.70%, 10/1/40 433 402
DirecTV Holdings LLC/DirecTV Financing Co., Inc.3.80%, 3/15/22 (c) 675 667
DISH DBS Corp.7.13%, 2/1/16 580 645
Ecolab, Inc.3.00%, 12/8/16 (e) 435 453
Fidelity National Information Services, Inc.5.00%, 3/15/22 (c) 989 979
Fiserv, Inc.3.13%, 6/15/16 360 368
FMG Resources August 2006 Pty Ltd.,6.38%, 2/1/16 (c) 380 3816.88%, 2/1/18 (c)(e) 140 141
Frontier Communications Corp.8.50%, 4/15/20 (e) 75 79
Gap, Inc. (The)5.95%, 4/12/21 (e) 645 652
Georgia-Pacific LLC8.88%, 5/15/31 480 649
Gilead Sciences, Inc.5.65%, 12/1/41 490 525
Grupo Bimbo SAB de CV4.88%, 6/30/20 (c) 735 778
Harley-Davidson Funding Corp.6.80%, 6/15/18 (c) 630 737
Hewlett-Packard Co.4.65%, 12/9/21 780 818
Holcim US Finance Sarl & Cie SCS6.00%, 12/30/19 (c) 483 500
Home Depot, Inc. (The)5.88%, 12/16/36 443 533
2012 Semi-Annual Report
March 31, 2012 (unaudited)

30
Portfolio of Investments (cont’d)Core Plus Fixed Income Portfolio
The accompanying notes are an integral part of the financial statements.
FirstEnergy Solutions Corp.6.05%, 8/15/21 $ 869 $ 977
MarkWest Energy Partners LP/MarkWest Energy Finance Corp.6.25%, 6/15/22 225 237
Plains All American Pipeline LP/PAA Finance Corp.6.70%, 5/15/36 (e) 614 719
PPL WEM Holdings PLC3.90%, 5/1/16 (c) 625 651
4,580
98,230
Mortgages — Other (6.8%)Banc of America Alternative Loan Trust,
5.86%, 10/25/36 (b) 1,194 7995.91%, 10/25/36 (b) 2,050 1,3546.00%, 4/25/36 832 833
Banc of America Funding Corp.0.61%, 8/25/36 (b) 658 599
Chase Mortgage Finance Corp.,5.50%, 11/25/35 1,024 9846.00%, 11/25/36 1,199 1,016
Chaseflex Trust6.00%, 2/25/37 1,918 1,362
First Horizon Alternative Mortgage Securities6.25%, 8/25/36 1,262 937
GS Mortgage Securities Corp.7.50%, 9/25/36 (b)(c) 1,445 1,106
JP Morgan Mortgage Trust,6.00%, 6/25/37 837 7726.25%, 7/25/36 1,186 1,111
Lehman Mortgage Trust,5.50%, 11/25/35 - 2/25/36 2,766 2,5016.50%, 9/25/37 2,520 1,914
WaMu Mortgage Pass-Through Certificates,1.14%, 7/25/46 (b) 2,054 1,3515.13%, 6/25/37 (b) 2,089 1,533
18,172
Municipal Bonds (1.8%)Chicago, IL, Transit Authority
6.20%, 12/1/40 665 755City of Chicago, IL,
O’Hare International Airport Revenue6.40%, 1/1/40 255 313
City of New York, NY,Series G-15.97%, 3/1/36 270 332
Illinois State Toll Highway Authority,Highway Revenue, Build America Bonds6.18%, 1/1/34 877 1,053
Municipal Electric Authority of Georgia,6.64%, 4/1/57 283 3196.66%, 4/1/57 320 359
Face Amount Value (000) (000)
Face Amount Value (000) (000)
Industrials (cont’d)Sable International Finance Ltd.
7.75%, 2/15/17 (c) $ 681 $ 715SABMiller Holdings, Inc.
3.75%, 1/15/22 (c) 420 428SBA Telecommunications, Inc.
8.25%, 8/15/19 (e) 565 626Sonoco Products Co.
5.75%, 11/1/40 370 395Symantec Corp.,
Series B1.00%, 6/15/13 (e) 488 549
Syngenta Finance3.13%, 3/28/22 360 363
Teva Pharmaceutical Finance IV BV3.65%, 11/10/21 525 533
Time Warner, Inc.,4.70%, 1/15/21 200 2194.75%, 3/29/21 (e) 405 4465.88%, 11/15/16 (e) 170 199
Total Capital International SA2.88%, 2/17/22 (e) 650 625
Vale Overseas Ltd.5.63%, 9/15/19 (e) 694 779
Valspar Corp.4.20%, 1/15/22 605 621
Verisk Analytics, Inc.5.80%, 5/1/21 550 588
Vivendi SA6.63%, 4/4/18 (c) 758 853
Volkswagen International Finance N.V.2.38%, 3/22/17 (c)(e) 550 553
Weatherford Bermuda4.50%, 4/15/22 375 375
Wesfarmers Ltd.2.98%, 5/18/16 (c)(e) 390 399
WPP Finance UK8.00%, 9/15/14 664 762
Wyndham Worldwide Corp.4.25%, 3/1/22 (e) 680 668
Wynn Las Vegas LLC/Wynn Las Vegas Capital Corp.5.38%, 3/15/22 (c)(e) 700 684
56,455
Utilities (1.7%)Energy Transfer Partners LP
9.00%, 4/15/19 308 383Enterprise Products Operating LLC
5.20%, 9/1/20 (e) 635 710EQT Corp.
4.88%, 11/15/21 375 380Exelon Generation Co., LLC
6.25%, 10/1/39 445 523
2012 Semi-Annual Report
March 31, 2012 (unaudited)

31
Portfolio of Investments (cont’d)Core Plus Fixed Income Portfolio
The accompanying notes are an integral part of the financial statements.
Merrill Lynch & Co., Inc., (0.25%, dated 3/30/12, due 4/2/12; proceeds $2,132; fully collateralized by Common Stocks; Alliance Data Systems Corp.; American International Group, Inc.; Boeing Co. (The); Energy Transfer Equity LP; Freeport-McMoRan Copper & Gold, Inc.; GNC Holdings, Inc.; Hershey Co. (The); L-3 Communications Holdings, Inc.; McKesson Corp.; Teva Pharmaceutical Industries Ltd.; Two Harbors Investment Corp.; Vale SA; valued at $2,302) $ 2,132 $ 2,132
2,477
Total Securities held as Collateral on Loaned Securities (Cost $15,468) 15,468
Shares Investment Company (9.1%)Morgan Stanley Institutional
Liquidity Funds — Money Market Portfolio — Institutional Class (See Note G-2) (Cost $24,349) 24,348,953 24,349
Face Amount (000) U.S. Treasury Security (2.1%)U.S. Treasury Bill
0.05%, 6/7/12 (g) $ 5,700 5,699
Total Short-Term Investments (Cost $45,517) 45,516
Total Investments (113.0%) (Cost $296,940) Including $20,904 of Securities Loaned (h) 302,736
Liabilities in Excess of Other Assets (-13.0%) (34,779)
Net Assets (100.0%) $267,957
(a) Security is subject to delayed delivery.(b) Variable/Floating Rate Security — Interest rate changes on these
instruments are based on changes in a designated base rate. The ratesshown are those in effect on March 31, 2012.
(c) 144A security — Certain conditions for public sale may exist. Unlessotherwise noted, these securities are deemed to be liquid.
(d) Inverse Floating Rate Security — Interest rate fluctuates with an inverserelationship to an associated interest rate. Indicated rate is the effectiverate at March 31, 2012.
(e) All or a portion of this security was on loan at March 31, 2012.(f) When-issued security.(g) Rate shown is the yield to maturity at March 31, 2012.(h) Securities are available for collateral in connection with purchase of
when-issued securities, securities purchased on a forward commitmentbasis, open foreign currency exchange contracts, futures contracts andswap agreements.
@ Face Amount/Value is less than $500.IO Interest Only.MTN Medium Term Note.PAC Planned Amortization Class.REIT Real Estate Investment Trust.REMIC Real Estate Mortgage Investment Conduit.STRIPS Separate Trading of Registered Interest and Principal of Securities.TBA To Be Announced.
Face Amount Value (000) (000)
Face Amount Value (000) (000)
Municipal Bonds (cont’d)New York City, NY, Transitional Finance Authority
5.27%, 5/1/27 $ 540 $ 640State of California,
General Obligation Bonds5.95%, 4/1/16 830 942
4,713
Sovereign (1.7%)Bermuda Government International Bond
5.60%, 7/20/20 (c) 775 879Brazilian Government International Bond
4.88%, 1/22/21 (e) 800 909Korea Development Bank (The)
4.38%, 8/10/15 875 927Korea Finance Corp.
4.63%, 11/16/21 670 687Mexico Government International Bond
3.63%, 3/15/22 (e) 400 410Russian Foreign Bond — Eurobond
3.25%, 4/4/17 (c)(f) 800 807
4,619
U.S. Agency Securities (1.7%)Federal Home Loan Mortgage Corporation,
3.75%, 3/27/19 (e) 3,500 3,9336.75%, 3/15/31 470 679
4,612
U.S. Treasury Securities (9.4%)U.S. Treasury Bonds
3.88%, 8/15/40 (e) 10,400 11,505U.S. Treasury Notes,
1.00%, 9/30/16 5,365 5,3841.75%, 7/31/15 7,900 8,193
25,082
Total Fixed Income Securities (Cost $251,423) 257,220
Shares Short-Term Investments (17.0%)Securities held as Collateral on Loaned Securities (5.8%)Investment Company (4.9%)Morgan Stanley Institutional
Liquidity Funds — Money Market Portfolio — Institutional Class(See Note G-2) 12,991,378 12,991
Face Amount (000) Repurchase Agreements (0.9%)Barclays Capital, Inc., (0.15%, dated
3/30/12, due 4/2/12; proceeds $345; fully collateralized by a U.S. Government Agency; Federal National Mortgage Association 4.00% due 1/1/42; valued at $352) $ 345 345
2012 Semi-Annual Report
March 31, 2012 (unaudited)

32
Portfolio of Investments (cont’d)Core Plus Fixed Income Portfolio
The accompanying notes are an integral part of the financial statements.
2012 Semi-Annual Report
March 31, 2012 (unaudited)
Foreign Currency Exchange Contracts Information:The Portfolio had the following foreign currency exchange contracts open at period end:
UnrealizedCurrency to In Exchange Appreciation
Deliver Value Settlement For Value (Depreciation)Counterparty (000) (000) Date (000) (000) (000)Goldman Sachs International NOK 3,943 $ 692 4/4/12 USD 702 $ 702 $ 10JPMorgan Chase Bank USD 1,443 1,443 4/4/12 NOK 8,215 1,442 (1)UBS AG NOK 1 —@ 4/4/12 USD —@ —@ (—)@UBS AG NOK 4,271 750 4/4/12 USD 753 753 3Goldman Sachs International AUD 2,780 2,879 4/5/12 USD 2,953 2,953 74Goldman Sachs International USD 648 648 4/5/12 CHF 592 655 7Goldman Sachs International USD —@ —@ 4/5/12 SEK 1 —@ (—)@JPMorgan Chase Bank CHF 592 655 4/5/12 USD 649 649 (6)UBS AG CAD 2,921 2,928 4/5/12 USD 2,927 2,927 (1)UBS AG SEK 3,010 455 4/5/12 USD 452 452 (3)UBS AG USD 2,929 2,929 4/5/12 CAD 2,921 2,928 (1)UBS AG USD —@ —@ 4/5/12 CHF —@ —@ —@UBS AG USD 442 442 4/5/12 SEK 3,009 455 13Wells Fargo Bank USD 2,881 2,881 4/5/12 AUD 2,780 2,879 (2)UBS AG USD 2,926 2,926 4/30/12 CAD 2,921 2,927 1Wells Fargo Bank AUD 2,780 2,871 4/30/12 USD 2,873 2,873 2 $22,499 $22,595 $ 96
Futures Contracts:The Portfolio had the following futures contracts open at period end:
Unrealized Number Appreciation of Value Expiration (Depreciation) Contracts (000) Date (000)
Long:
U.S. Treasury 2 yr. Note 151 $33,241 Jun-12 $(21)U.S. Treasury 5 yr. Note 27 3,309 Jun-12 (7)
Short:
U.S. Treasury 10 yr. Note 38 (4,921) Jun-12 7U.S. Treasury 30 yr. Bond 7 (964) Jun-12 17Ultra Long U.S. Treasury Bond 25 (3,774) Jun-12 (63) $(67)
Interest Rate Swap Agreements:The Portfolio had the following interest rate swap agreements open at period end: Unrealized Notional Appreciation Floating Rate Pay/Receive Termination Amount (Depreciation)Swap Counterparty Index Floating Rate Fixed Rate Date (000) (000)Bank of America NA 6 Month EURIBOR Pay 4.26% 8/18/26 EUR 14,435 $ 644Bank of America NA 3 Month LIBOR Receive 4.35 8/18/26 $ 19,325 (342)Bank of America NA 6 Month EURIBOR Receive 3.61 8/18/31 EUR 18,225 (561)Bank of America NA 3 Month LIBOR Pay 4.15 8/18/31 $ 23,970 329Goldman Sachs International 3 Month LIBOR Receive 2.42 3/22/22 3,020 (41)JPMorgan Chase Bank 3 Month LIBOR Receive 2.43 3/22/22 1,464 (22) $ 7

33
Portfolio of Investments (cont’d)Core Plus Fixed Income Portfolio
The accompanying notes are an integral part of the financial statements.
2012 Semi-Annual Report
March 31, 2012 (unaudited)
Fair Value Measurement Information: (cont’d) Level 2 Level 1 Other Level 3 Unadjusted significant Significant quoted observable unobservable prices inputs inputs TotalInvestment Type (000) (000) (000) (000)
Liabilities:Foreign Currency
Exchange Contracts $ — $ (14) $— $ (14)Futures Contracts (91) — — (91)Interest Rate Swap
Agreements — (966) — (966)Total Liabilities (91) (980) — (1,071)Total $37,273 $265,499 $— $302,772
Transfers between investment levels may occur as the markets fluctuateand/or the availability of data used in an investment’s valuation changes. ThePortfolio recognizes transfers between the levels as of the end of the period.As of March 31, 2012, the Portfolio did not have any significant investmentstransfer between investment levels.
Portfolio Composition*
Percentage ofClassification Total InvestmentsAgency Fixed Rate Mortgages 25.6%Industrials 19.7Other** 16.3Finance 12.9Short-Term Investments 10.5U.S. Treasury Securities 8.7Mortgages — Other 6.3Total Investments 100.0%***
* Percentages indicated are based upon total investments (excluding Securities heldas Collateral on Loaned Securities) as of March 31, 2012.
** Industries and/or investment types representing less than 5% of total investments.*** Does not include open long/short futures contracts with a value of approximately
$46,209,000 and net unrealized depreciation of approximately $67,000. Also,does not include open foreign currency exchange contracts with net unrealizedappreciation of approximately $96,000 and open swap agreements with netunrealized appreciation of approximately $7,000.
@ Value is less than $500.EURIBOR Euro Interbank Offered Rate.LIBOR London Interbank Offered Rate.AUD — Australian DollarCAD — Canadian DollarCHF — Swiss FrancEUR — EuroNOK — Norwegian KroneSEK — Swedish KronaUSD — United States Dollar
Fair Value Measurement Information:The following is a summary of the inputs used to value the Portfolio’sinvestments as of March 31, 2012. (See Note A-5 to the financial statementsfor further information regarding fair value measurement.) Level 2 Level 1 Other Level 3 Unadjusted significant Significant quoted observable unobservable prices inputs inputs TotalInvestment Type (000) (000) (000) (000)
Assets:
Fixed Income SecuritiesAgency Adjustable
Rate Mortgages $ — $ 1,993 $— $ 1,993Agency Fixed Rate
Mortgages — 73,496 — 73,496Asset-Backed Securities — 6,664 — 6,664Collateralized Mortgage
Obligations — Agency Collateral Series — 12,587 — 12,587
Commercial Mortgage Backed Securities — 7,052 — 7,052
Corporate Bonds — 98,230 — 98,230Mortgages — Other — 18,172 — 18,172Municipal Bonds — 4,713 — 4,713Sovereign — 4,619 — 4,619U.S. Agency Securities — 4,612 — 4,612U.S. Treasury Securities — 25,082 — 25,082Total Fixed Income
Securities — 257,220 — 257,220
Short-Term InvestmentsRepurchase Agreements — 2,477 — 2,477Investment Company 37,340 — — 37,340U.S. Treasury Security — 5,699 — 5,699Total Short-Term
Investments 37,340 8,176 — 45,516Foreign Currency
Exchange Contracts — 110 — 110Futures Contracts 24 — — 24Interest Rate Swap
Agreements — 973 — 973Total Assets 37,364 266,479 — 303,843
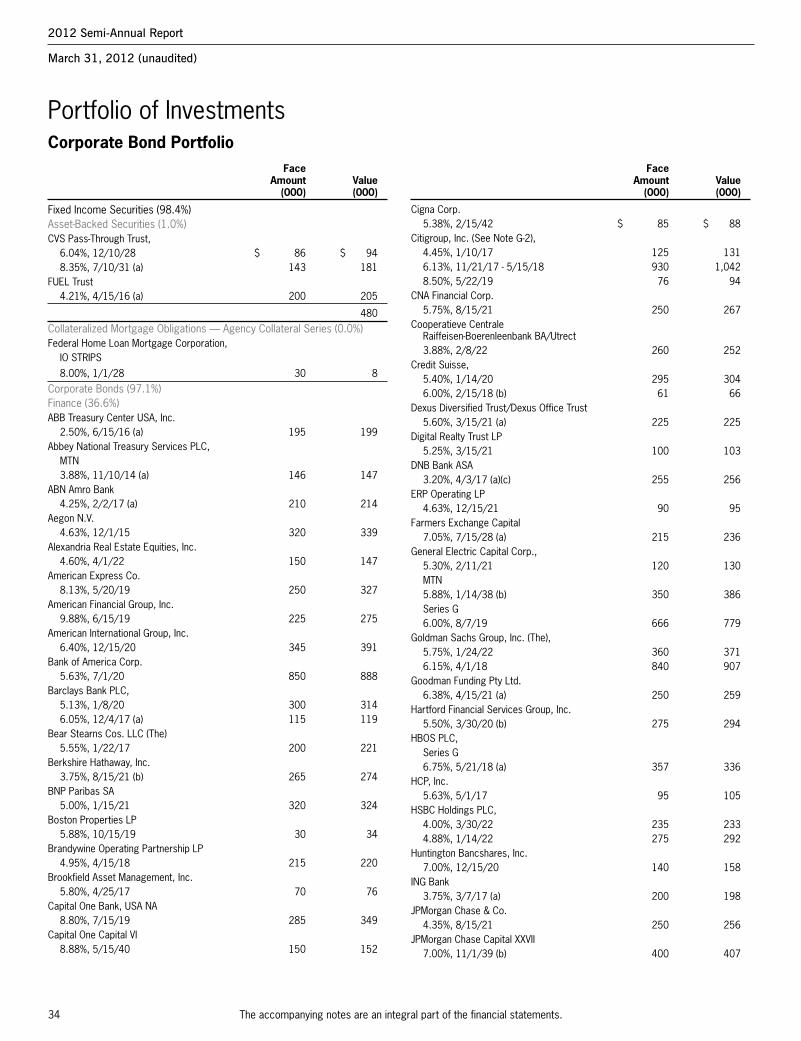
34
Cigna Corp.5.38%, 2/15/42 $ 85 $ 88
Citigroup, Inc. (See Note G-2),4.45%, 1/10/17 125 1316.13%, 11/21/17 - 5/15/18 930 1,0428.50%, 5/22/19 76 94
CNA Financial Corp.5.75%, 8/15/21 250 267
Cooperatieve Centrale Raiffeisen-Boerenleenbank BA/Utrect3.88%, 2/8/22 260 252
Credit Suisse,5.40%, 1/14/20 295 3046.00%, 2/15/18 (b) 61 66
Dexus Diversified Trust/Dexus Office Trust5.60%, 3/15/21 (a) 225 225
Digital Realty Trust LP5.25%, 3/15/21 100 103
DNB Bank ASA3.20%, 4/3/17 (a)(c) 255 256
ERP Operating LP4.63%, 12/15/21 90 95
Farmers Exchange Capital7.05%, 7/15/28 (a) 215 236
General Electric Capital Corp.,5.30%, 2/11/21 120 130MTN5.88%, 1/14/38 (b) 350 386Series G6.00%, 8/7/19 666 779
Goldman Sachs Group, Inc. (The),5.75%, 1/24/22 360 3716.15%, 4/1/18 840 907
Goodman Funding Pty Ltd.6.38%, 4/15/21 (a) 250 259
Hartford Financial Services Group, Inc.5.50%, 3/30/20 (b) 275 294
HBOS PLC,Series G6.75%, 5/21/18 (a) 357 336
HCP, Inc.5.63%, 5/1/17 95 105
HSBC Holdings PLC,4.00%, 3/30/22 235 2334.88%, 1/14/22 275 292
Huntington Bancshares, Inc.7.00%, 12/15/20 140 158
ING Bank3.75%, 3/7/17 (a) 200 198
JPMorgan Chase & Co.4.35%, 8/15/21 250 256
JPMorgan Chase Capital XXVII7.00%, 11/1/39 (b) 400 407
Portfolio of InvestmentsCorporate Bond Portfolio Face Amount Value (000) (000)
Face Amount Value (000) (000)
Fixed Income Securities (98.4%)Asset-Backed Securities (1.0%)CVS Pass-Through Trust,
6.04%, 12/10/28 $ 86 $ 948.35%, 7/10/31 (a) 143 181
FUEL Trust4.21%, 4/15/16 (a) 200 205
480Collateralized Mortgage Obligations — Agency Collateral Series (0.0%)Federal Home Loan Mortgage Corporation,
IO STRIPS8.00%, 1/1/28 30 8
Corporate Bonds (97.1%)Finance (36.6%)ABB Treasury Center USA, Inc.
2.50%, 6/15/16 (a) 195 199Abbey National Treasury Services PLC,
MTN3.88%, 11/10/14 (a) 146 147
ABN Amro Bank4.25%, 2/2/17 (a) 210 214
Aegon N.V.4.63%, 12/1/15 320 339
Alexandria Real Estate Equities, Inc.4.60%, 4/1/22 150 147
American Express Co.8.13%, 5/20/19 250 327
American Financial Group, Inc.9.88%, 6/15/19 225 275
American International Group, Inc.6.40%, 12/15/20 345 391
Bank of America Corp.5.63%, 7/1/20 850 888
Barclays Bank PLC,5.13%, 1/8/20 300 3146.05%, 12/4/17 (a) 115 119
Bear Stearns Cos. LLC (The)5.55%, 1/22/17 200 221
Berkshire Hathaway, Inc.3.75%, 8/15/21 (b) 265 274
BNP Paribas SA5.00%, 1/15/21 320 324
Boston Properties LP5.88%, 10/15/19 30 34
Brandywine Operating Partnership LP4.95%, 4/15/18 215 220
Brookfield Asset Management, Inc.5.80%, 4/25/17 70 76
Capital One Bank, USA NA8.80%, 7/15/19 285 349
Capital One Capital VI8.88%, 5/15/40 150 152
The accompanying notes are an integral part of the financial statements.
2012 Semi-Annual Report
March 31, 2012 (unaudited)

35
Portfolio of Investments (cont’d)Corporate Bond Portfolio
The accompanying notes are an integral part of the financial statements.
Wachovia Corp.5.63%, 10/15/16 $ 245 $ 273
WEA Finance LLC4.63%, 5/10/21 (a) 75 76
Wells Operating Partnership II LP5.88%, 4/1/18 125 127
18,717Industrials (50.6%)Agilent Technologies, Inc.
5.50%, 9/14/15 126 142Altria Group, Inc.
9.25%, 8/6/19 288 388American Honda Finance Corp.
2.13%, 2/28/17 (a) 400 402American Tower Corp.
4.70%, 3/15/22 200 202Amgen, Inc.,
2.50%, 11/15/16 240 2473.88%, 11/15/21 80 82
Anadarko Petroleum Corp.6.95%, 6/15/19 150 183
Anglo American Capital PLC9.38%, 4/8/19 (a) 100 132
ArcelorMittal9.85%, 6/1/19 (b) 209 252
Aristotle Holding, Inc.2.65%, 2/15/17 (a) 225 228
AstraZeneca PLC6.45%, 9/15/37 (b) 125 164
AT&T, Inc.,5.55%, 8/15/41 (b) 250 2786.30%, 1/15/38 340 4016.55%, 2/15/39 (b) 100 122
BAA Funding Ltd.4.88%, 7/15/21 (a)(b) 190 194
Barrick Gold Corp.3.85%, 4/1/22 180 180
Barrick North America Finance LLC4.40%, 5/30/21 245 259
BAT International Finance PLC9.50%, 11/15/18 (a) 190 260
Bemis Co., Inc.4.50%, 10/15/21 230 241
Best Buy Co., Inc.3.75%, 3/15/16 (b) 220 222
Boeing Capital Corp.2.13%, 8/15/16 (b) 175 181
Boston Scientific Corp.6.00%, 1/15/20 105 121
Bunge Ltd. Finance Corp.8.50%, 6/15/19 149 182
Burlington Northern Santa Fe LLC,3.05%, 3/15/22 150 1485.65%, 5/1/17 130 151
Face Amount Value (000) (000)
Face Amount Value (000) (000)
Finance (cont’d)Macquarie Group Ltd.
6.00%, 1/14/20 (a) $ 215 $ 215Merrill Lynch & Co., Inc.,
MTN6.88%, 4/25/18 217 242
MetLife, Inc.7.72%, 2/15/19 70 88
Mizuho Corporate Bank Ltd.2.55%, 3/17/17 (a)(b) 245 245
National Australia Bank2.75%, 3/9/17 250 249
Nationwide Building Society6.25%, 2/25/20 (a) 260 270
Nationwide Financial Services5.38%, 3/25/21 (a) 175 180
Nordea Bank AB4.88%, 5/13/21 (a) 200 195
Pacific LifeCorp6.00%, 2/10/20 (a) 150 164
Platinum Underwriters Finance, Inc.,Series B7.50%, 6/1/17 234 250
PNC Funding Corp.5.13%, 2/8/20 (b) 110 125
Principal Financial Group, Inc.8.88%, 5/15/19 167 214
Protective Life Corp.7.38%, 10/15/19 175 194
Prudential Financial, Inc.7.38%, 6/15/19 (b) 200 248
Royal Bank of Scotland PLC (The)4.88%, 3/16/15 (b) 255 265
Santander Holdings USA, Inc.4.63%, 4/19/16 55 56
Santander US Debt SA Unipersonal3.72%, 1/20/15 (a) 200 195
SLM Corp.,MTN6.25%, 1/25/16 320 3338.00%, 3/25/20 90 97
Societe Generale SA5.20%, 4/15/21 (a)(b) 200 192
Standard Chartered Bank6.40%, 9/26/17 (a) 200 223
Svenska Handelsbanken AB2.88%, 4/4/17 (c) 250 250
UDR, Inc.,MTN4.63%, 1/10/22 180 185
UnitedHealth Group, Inc.6.63%, 11/15/37 225 286
2012 Semi-Annual Report
March 31, 2012 (unaudited)
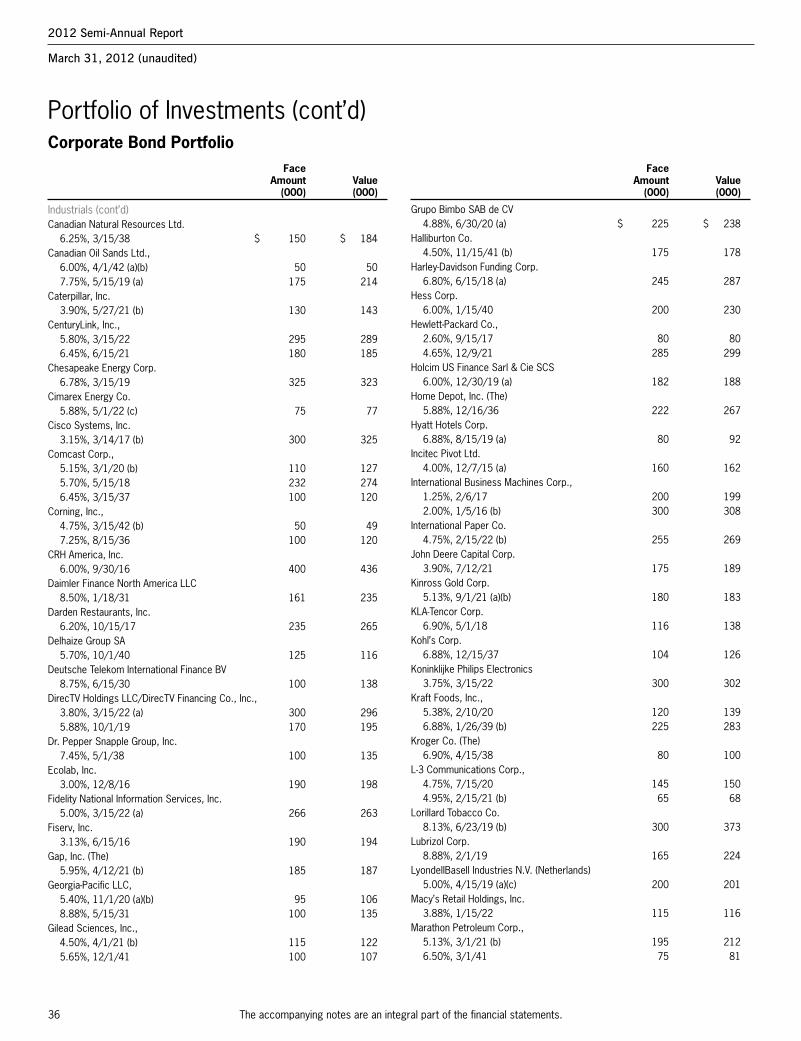
36
Portfolio of Investments (cont’d)Corporate Bond Portfolio
The accompanying notes are an integral part of the financial statements.
Grupo Bimbo SAB de CV4.88%, 6/30/20 (a) $ 225 $ 238
Halliburton Co.4.50%, 11/15/41 (b) 175 178
Harley-Davidson Funding Corp.6.80%, 6/15/18 (a) 245 287
Hess Corp.6.00%, 1/15/40 200 230
Hewlett-Packard Co.,2.60%, 9/15/17 80 804.65%, 12/9/21 285 299
Holcim US Finance Sarl & Cie SCS6.00%, 12/30/19 (a) 182 188
Home Depot, Inc. (The)5.88%, 12/16/36 222 267
Hyatt Hotels Corp.6.88%, 8/15/19 (a) 80 92
Incitec Pivot Ltd.4.00%, 12/7/15 (a) 160 162
International Business Machines Corp.,1.25%, 2/6/17 200 1992.00%, 1/5/16 (b) 300 308
International Paper Co.4.75%, 2/15/22 (b) 255 269
John Deere Capital Corp.3.90%, 7/12/21 175 189
Kinross Gold Corp.5.13%, 9/1/21 (a)(b) 180 183
KLA-Tencor Corp.6.90%, 5/1/18 116 138
Kohl’s Corp.6.88%, 12/15/37 104 126
Koninklijke Philips Electronics3.75%, 3/15/22 300 302
Kraft Foods, Inc.,5.38%, 2/10/20 120 1396.88%, 1/26/39 (b) 225 283
Kroger Co. (The)6.90%, 4/15/38 80 100
L-3 Communications Corp.,4.75%, 7/15/20 145 1504.95%, 2/15/21 (b) 65 68
Lorillard Tobacco Co.8.13%, 6/23/19 (b) 300 373
Lubrizol Corp.8.88%, 2/1/19 165 224
LyondellBasell Industries N.V. (Netherlands)5.00%, 4/15/19 (a)(c) 200 201
Macy’s Retail Holdings, Inc.3.88%, 1/15/22 115 116
Marathon Petroleum Corp.,5.13%, 3/1/21 (b) 195 2126.50%, 3/1/41 75 81
Face Amount Value (000) (000)
Face Amount Value (000) (000)
Industrials (cont’d)Canadian Natural Resources Ltd.
6.25%, 3/15/38 $ 150 $ 184Canadian Oil Sands Ltd.,
6.00%, 4/1/42 (a)(b) 50 507.75%, 5/15/19 (a) 175 214
Caterpillar, Inc.3.90%, 5/27/21 (b) 130 143
CenturyLink, Inc.,5.80%, 3/15/22 295 2896.45%, 6/15/21 180 185
Chesapeake Energy Corp.6.78%, 3/15/19 325 323
Cimarex Energy Co.5.88%, 5/1/22 (c) 75 77
Cisco Systems, Inc.3.15%, 3/14/17 (b) 300 325
Comcast Corp.,5.15%, 3/1/20 (b) 110 1275.70%, 5/15/18 232 2746.45%, 3/15/37 100 120
Corning, Inc.,4.75%, 3/15/42 (b) 50 497.25%, 8/15/36 100 120
CRH America, Inc.6.00%, 9/30/16 400 436
Daimler Finance North America LLC8.50%, 1/18/31 161 235
Darden Restaurants, Inc.6.20%, 10/15/17 235 265
Delhaize Group SA5.70%, 10/1/40 125 116
Deutsche Telekom International Finance BV8.75%, 6/15/30 100 138
DirecTV Holdings LLC/DirecTV Financing Co., Inc.,3.80%, 3/15/22 (a) 300 2965.88%, 10/1/19 170 195
Dr. Pepper Snapple Group, Inc.7.45%, 5/1/38 100 135
Ecolab, Inc.3.00%, 12/8/16 190 198
Fidelity National Information Services, Inc.5.00%, 3/15/22 (a) 266 263
Fiserv, Inc.3.13%, 6/15/16 190 194
Gap, Inc. (The)5.95%, 4/12/21 (b) 185 187
Georgia-Pacific LLC,5.40%, 11/1/20 (a)(b) 95 1068.88%, 5/15/31 100 135
Gilead Sciences, Inc.,4.50%, 4/1/21 (b) 115 1225.65%, 12/1/41 100 107
2012 Semi-Annual Report
March 31, 2012 (unaudited)
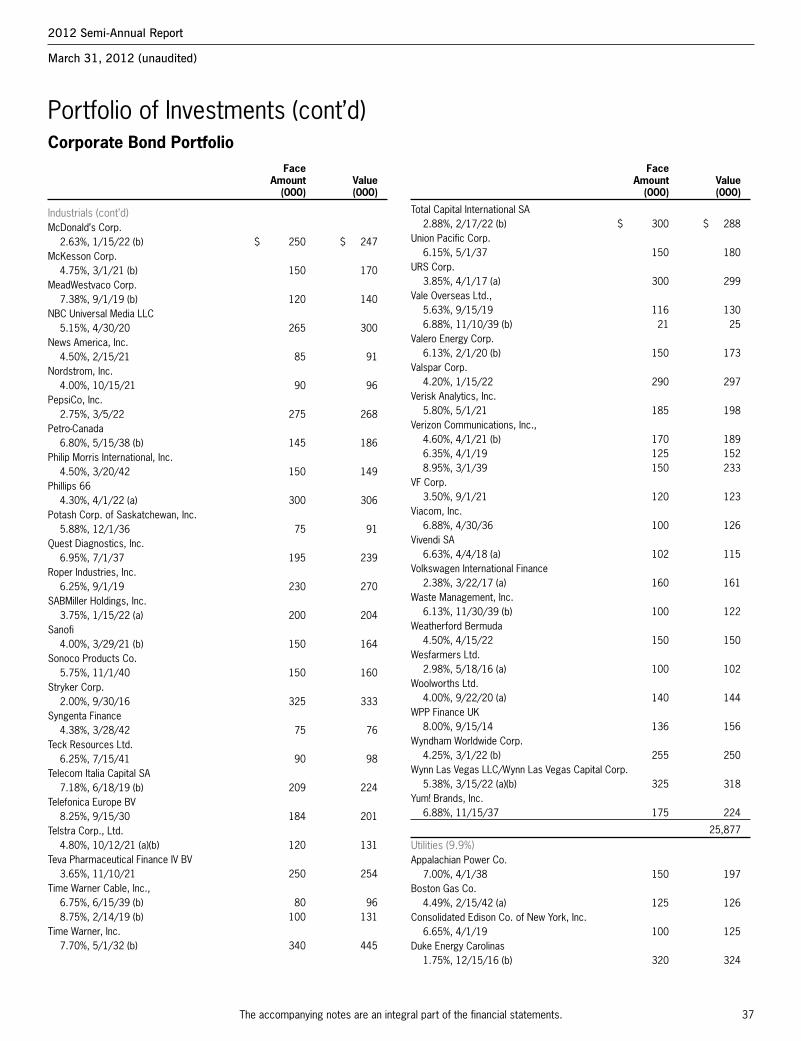
37
Portfolio of Investments (cont’d)Corporate Bond Portfolio
The accompanying notes are an integral part of the financial statements.
Total Capital International SA2.88%, 2/17/22 (b) $ 300 $ 288
Union Pacific Corp.6.15%, 5/1/37 150 180
URS Corp.3.85%, 4/1/17 (a) 300 299
Vale Overseas Ltd.,5.63%, 9/15/19 116 1306.88%, 11/10/39 (b) 21 25
Valero Energy Corp.6.13%, 2/1/20 (b) 150 173
Valspar Corp.4.20%, 1/15/22 290 297
Verisk Analytics, Inc.5.80%, 5/1/21 185 198
Verizon Communications, Inc.,4.60%, 4/1/21 (b) 170 1896.35%, 4/1/19 125 1528.95%, 3/1/39 150 233
VF Corp.3.50%, 9/1/21 120 123
Viacom, Inc.6.88%, 4/30/36 100 126
Vivendi SA6.63%, 4/4/18 (a) 102 115
Volkswagen International Finance2.38%, 3/22/17 (a) 160 161
Waste Management, Inc.6.13%, 11/30/39 (b) 100 122
Weatherford Bermuda4.50%, 4/15/22 150 150
Wesfarmers Ltd.2.98%, 5/18/16 (a) 100 102
Woolworths Ltd.4.00%, 9/22/20 (a) 140 144
WPP Finance UK8.00%, 9/15/14 136 156
Wyndham Worldwide Corp.4.25%, 3/1/22 (b) 255 250
Wynn Las Vegas LLC/Wynn Las Vegas Capital Corp.5.38%, 3/15/22 (a)(b) 325 318
Yum! Brands, Inc.6.88%, 11/15/37 175 224
25,877Utilities (9.9%)Appalachian Power Co.
7.00%, 4/1/38 150 197Boston Gas Co.
4.49%, 2/15/42 (a) 125 126Consolidated Edison Co. of New York, Inc.
6.65%, 4/1/19 100 125Duke Energy Carolinas
1.75%, 12/15/16 (b) 320 324
Face Amount Value (000) (000)
Face Amount Value (000) (000)
Industrials (cont’d)McDonald’s Corp.
2.63%, 1/15/22 (b) $ 250 $ 247McKesson Corp.
4.75%, 3/1/21 (b) 150 170MeadWestvaco Corp.
7.38%, 9/1/19 (b) 120 140NBC Universal Media LLC
5.15%, 4/30/20 265 300News America, Inc.
4.50%, 2/15/21 85 91Nordstrom, Inc.
4.00%, 10/15/21 90 96PepsiCo, Inc.
2.75%, 3/5/22 275 268Petro-Canada
6.80%, 5/15/38 (b) 145 186Philip Morris International, Inc.
4.50%, 3/20/42 150 149Phillips 66
4.30%, 4/1/22 (a) 300 306Potash Corp. of Saskatchewan, Inc.
5.88%, 12/1/36 75 91Quest Diagnostics, Inc.
6.95%, 7/1/37 195 239Roper Industries, Inc.
6.25%, 9/1/19 230 270SABMiller Holdings, Inc.
3.75%, 1/15/22 (a) 200 204Sanofi
4.00%, 3/29/21 (b) 150 164Sonoco Products Co.
5.75%, 11/1/40 150 160Stryker Corp.
2.00%, 9/30/16 325 333Syngenta Finance
4.38%, 3/28/42 75 76Teck Resources Ltd.
6.25%, 7/15/41 90 98Telecom Italia Capital SA
7.18%, 6/18/19 (b) 209 224Telefonica Europe BV
8.25%, 9/15/30 184 201Telstra Corp., Ltd.
4.80%, 10/12/21 (a)(b) 120 131Teva Pharmaceutical Finance IV BV
3.65%, 11/10/21 250 254Time Warner Cable, Inc.,
6.75%, 6/15/39 (b) 80 968.75%, 2/14/19 (b) 100 131
Time Warner, Inc.7.70%, 5/1/32 (b) 340 445
2012 Semi-Annual Report
March 31, 2012 (unaudited)

38
Portfolio of Investments (cont’d)Corporate Bond Portfolio
The accompanying notes are an integral part of the financial statements.
Repurchase Agreements (2.9%)Barclays Capital, Inc., (0.15%, dated 3/30/12,
due 4/2/12; proceeds $210; fully collateralized by a U.S. Government Agency; Federal National Mortgage Association 4.00% due 1/1/42; valued at $214) $ 210 $ 210
Merrill Lynch & Co., Inc., (0.25%, dated 3/30/12, due 4/2/12; proceeds $1,298; fully collateralized by Common Stocks; Alliance Data Systems Corp.; American International Group, Inc.; Boeing Co. (The); Energy Transfer Equity LP; Freeport-McMoRanCopper & Gold, Inc.; GNC Holdings, Inc.; Hershey Co. (The); L-3 Communications Holdings, Inc.; McKesson Corp.; Teva Pharmaceutical Industries Ltd.; Two Harbors Investment Corp.; Vale SA; valued at $1,402) 1,298 1,298
1,508
Total Securities held as Collateral on Loaned Securities (Cost $9,422) 9,422
Shares Investment Company (1.4%)Morgan Stanley Institutional
Liquidity Funds — Money Market Portfolio — Institutional Class (See Note G-2) (Cost $723) 723,124 723
Face Amount (000) U.S. Treasury Security (0.2%)U.S. Treasury Bill
0.14%, 8/30/12 (d)(e) $ 95 95
Total Short-Term Investments (Cost $10,240) 10,240
Total Investments (118.4%) (Cost $58,854) Including $9,206 of Securities Loaned (f) 60,518
Liabilities in Excess of Other Assets (-18.4%) (9,395)
Net Assets (100.0%) $51,123
(a) 144A security — Certain conditions for public sale may exist. Unlessotherwise noted, these securities are deemed to be liquid.
(b) All or a portion of this security was on loan at March 31, 2012.(c) When-issued security.(d) Rate shown is the yield to maturity at March 31, 2012.(e) All or a portion of the security was pledged as collateral for swap
agreements.(f) Securities are available for collateral in connection with purchase of
when-issued securities, open futures contracts and swap agreements.IO Interest Only.MTN Medium Term Note.STRIPS Separate Trading of Registered Interest and Principal of Securities.
Face Amount Value (000) (000)
Face Amount Value (000) (000)
Utilities (cont’d)EDF SA
4.60%, 1/27/20 (a)(b) $ 90 $ 95Enel Finance International N.V.
5.13%, 10/7/19 (a)(b) 200 197Energy Transfer Partners LP
9.00%, 4/15/19 105 130Enterprise Products Operating LLC,
5.25%, 1/31/20 (b) 25 28Series N6.50%, 1/31/19 529 629
EQT Corp.4.88%, 11/15/21 200 203
Exelon Generation Co., LLC6.25%, 10/1/39 175 205
FirstEnergy Solutions Corp.,6.05%, 8/15/21 171 1926.80%, 8/15/39 125 140
Iberdrola Finance Ireland Ltd.5.00%, 9/11/19 (a) 175 178
Kinder Morgan Energy Partners LP5.95%, 2/15/18 300 351
Nevada Power Co.6.65%, 4/1/36 150 193
Plains All American Pipeline LP/PAA Finance Corp.6.70%, 5/15/36 181 212
PPL WEM Holdings PLC3.90%, 5/1/16 (a) 315 328
PSEG Power LLC8.63%, 4/15/31 200 285
Sempra Energy6.00%, 10/15/39 125 151
Spectra Energy Capital LLC8.00%, 10/1/19 50 63
UIL Holdings Corp.4.63%, 10/1/20 375 380
Virginia Electric and Power Co.2.95%, 1/15/22 325 322
5,054
49,648Sovereign (0.3%)Bermuda Government International Bond
5.60%, 7/20/20 (a) 125 142
Total Fixed Income Securities (Cost $48,614) 50,278
Shares Short-Term Investments (20.0%)Securities held as Collateral on Loaned Securities (18.4%)Investment Company (15.5%)Morgan Stanley Institutional
Liquidity Funds — Money Market Portfolio — Institutional Class (See Note G-2) 7,913,899 7,914
2012 Semi-Annual Report
March 31, 2012 (unaudited)

39
Portfolio of Investments (cont’d)Corporate Bond Portfolio
The accompanying notes are an integral part of the financial statements.
2012 Semi-Annual Report
March 31, 2012 (unaudited)
Futures Contracts:The Portfolio had the following futures contracts open at period end:
Unrealized Number Appreciation of Value Expiration (Depreciation) Contracts (000) Date (000)
Long:
U.S. Treasury 2 yr. Note 40 $ 8,806 Jun-12 $ (5)U.S. Treasury 5 yr. Note 1 122 Jun-12 1U.S. Treasury Ultra Long Bond 9 1,359 Jun-12 (26)
Short:
U.S. Treasury 10 yr. Note 54 (6,992) Jun-12 (20)U.S. Treasury 30 yr. Bond 15 (2,066) Jun-12 51 $ 1
Interest Rate Swap Agreements:The Portfolio had the following interest rate swap agreements open at period end: Unrealized Notional Appreciation Floating Rate Pay/Receive Termination Amount (Depreciation)Swap Counterparty Index Floating Rate Fixed Rate Date (000) (000)Goldman Sachs 3 Month LIBOR Receive 2.42% 3/22/22 $ 642 $ (8)JP Morgan Chase 3 Month LIBOR Receive 2.43 3/22/22 311 (5) $(13)
LIBOR London Interbank Offered Rate
Fair Value Measurement Information:The following is a summary of the inputs used to value the Portfolio’sinvestments as of March 31, 2012. (See Note A-5 to the financial statementsfor further information regarding fair value measurement.) Level 2 Level 1 Other Level 3 Unadjusted significant Significant quoted observable unobservable prices inputs inputs TotalInvestment Type (000) (000) (000) (000)
Assets:
Fixed Income SecuritiesAsset-Backed Securities $ — $ 480 $ — $ 480Collateralized Mortgage
Obligations — Agency Collateral Series — 8 — 8
Corporate Bonds — 49,648 — 49,648Sovereign — 142 — 142Total Fixed Income
Securities — 50,278 — 50,278
Short-Term Investments
Repurchase Agreements — 1,508 — 1,508Investment Company 8,637 — — 8,637U.S. Treasury Security — 95 — 95Total Short-Term
Investments 8,637 1,603 — 10,240
Fair Value Measurement Information: (cont’d) Level 2 Level 1 Other Level 3 Unadjusted significant Significant quoted observable unobservable prices inputs inputs TotalInvestment Type (000) (000) (000) (000)Futures Contracts $ 52 $ — $ — $ 52Total Assets 8,689 51,881 — 60,570Liabilities:Futures Contracts (51) — — (51)Interest Rate Swap
Agreements — (13) — (13)Total Liabilities (51) (13) — (64)Total $8,638 $51,868 $— $60,506
Transfers between investment levels may occur as the markets fluctuateand/or the availability of data used in an investment’s valuation changes. ThePortfolio recognizes transfers between the levels as of the end of the period.As of March 31, 2012, the Portfolio did not have any significant investmentstransfer between investment levels.

40
Portfolio of Investments (cont’d)Corporate Bond Portfolio
The accompanying notes are an integral part of the financial statements.
Portfolio Composition*
Percentage ofClassification Total InvestmentsIndustrials 50.7%Finance 36.6Utilities 9.9Other** 2.8Total Investments 100.0%***
* Percentages indicated are based upon total investments (excluding Securities heldas Collateral on Loaned Securities) as of March 31, 2012.
** Industries representing less than 5% of total investments.*** Does not include open long/short futures contracts with an underlying face amount
of approximately $19,345,000 and net unrealized appreciation of approximately$1,000 and open swap agreements with total unrealized depreciation ofapproximately $13,000.
2012 Semi-Annual Report
March 31, 2012 (unaudited)

41
Diamond Resorts Corp.12.00%, 8/15/18 $ 150 $ 161
Gap, Inc. (The)5.95%, 4/12/21 100 101
INTCOMEX, Inc.13.25%, 12/15/14 150 151
Lions Gate Entertainment, Inc.10.25%, 11/1/16 (a) 150 166
Logan’s Roadhouse, Inc.10.75%, 10/15/17 150 147
MGM Resorts International8.63%, 2/1/19 (a) 100 108
Realogy Corp.7.63%, 1/15/20 (a) 50 53
Rite Aid Corp.9.50%, 6/15/17 150 151
Sabre Holdings Corp.8.35%, 3/15/16 150 137
Snoqualmie Entertainment Authority9.13%, 2/1/15 (a) 150 151
VWR Funding, Inc.,Series B10.25%, 7/15/15 (b) 100 104
2,438
Consumer, Non-Cyclical (20.6%)Amscan Holdings, Inc.
8.75%, 5/1/14 52 52Apria Healthcare Group, Inc.
11.25%, 11/1/14 100 105Armored Autogroup, Inc.
9.25%, 11/1/18 (a) 150 126BioScrip, Inc.
10.25%, 10/1/15 100 109Bumble Bee Holdco SCA,
PIK9.63%, 3/15/18 (a)(c) 200 183
Emergency Medical Services Corp.8.13%, 6/1/19 150 155
HCA, Inc.5.88%, 3/15/22 100 100
inVentiv Health, Inc.10.00%, 8/15/18 (a) 150 136
Kindred Healthcare, Inc.8.25%, 6/1/19 150 131
Knowledge Learning Corp.7.75%, 2/1/15 (a) 150 125
NCO Group, Inc.11.88%, 11/15/14 150 155
Pinnacle Foods Finance LLC/Pinnacle Foods Finance Corp.8.25%, 9/1/17 100 109
ServiceMaster Co.8.00%, 2/15/20 (a) 100 107
Portfolio of InvestmentsHigh Yield Portfolio Face Amount Value (000) (000)
Face Amount Value (000) (000)
Fixed Income Securities (97.8%)Corporate Bonds (97.8%)Basic Materials (3.4%)FMG Resources August 2006 Pty Ltd.
6.88%, 4/1/22 (a) $ 100 $ 98Ineos Group Holdings Ltd.
8.50%, 2/15/16 (a) 150 142Kraton Polymers LLC/Kraton Polymers
Capital Corp.6.75%, 3/1/19 100 104
344
Communications (6.0%)Avaya, Inc.
7.00%, 4/1/19 (a) 150 151Cablevision Systems Corp.
7.75%, 4/15/18 100 105CommScope, Inc.
8.25%, 1/15/19 (a) 100 107GXS Worldwide, Inc.
9.75%, 6/15/15 150 147Level 3 Financing, Inc.
8.13%, 7/1/19 (a) 100 104
614
Consumer Discretionary (4.0%)IDQ Holdings, Inc.
11.50%, 4/1/17 (a) 150 154Monitronics International, Inc.
9.13%, 4/1/20 (a) 150 153Silgan Holdings, Inc.
5.00%, 4/1/20 (a) 100 100
407
Consumer, Cyclical (23.8%)Academy Ltd./Academy Finance Corp.
9.25%, 8/1/19 (a) 150 155Ameristar Casinos, Inc.
7.50%, 4/15/21 100 105Burlington Coat Factory Warehouse Corp.
10.00%, 2/15/19 150 157Caesars Entertainment Operating Co., Inc.
10.00%, 12/15/18 150 117Caesars Operating Escrow LLC/Caesars
Escrow Corp.8.50%, 2/15/20 (a) 50 51
Chester Downs & Marina LLC9.25%, 2/1/20 (a) 100 106
Chrysler Group LLC/CG Co-Issuer, Inc.8.00%, 6/15/19 200 202
CKE Restaurants, Inc.11.38%, 7/15/18 100 115
The accompanying notes are an integral part of the financial statements.
2012 Semi-Annual Report
March 31, 2012 (unaudited)

42
Portfolio of Investments (cont’d)High Yield Portfolio
The accompanying notes are an integral part of the financial statements.
Industrials (11.2%)Atkore International, Inc.
9.88%, 1/1/18 $ 100 $ 105Griffon Corp.
7.13%, 4/1/18 100 104JB Poindexter & Co., Inc.
9.00%, 4/1/22 (a)(d) 100 103Kratos Defense & Security Solutions, Inc.
10.00%, 6/1/17 150 163Marquette Transportation Co./Marquette
Transportation Finance Corp.10.88%, 1/15/17 150 159
Pregis Corp.12.38%, 10/15/13 135 136
Quality Distribution LLC/QD Capital Corp.9.88%, 11/1/18 150 165
Sequa Corp.11.75%, 12/1/15 (a) 150 160
Terex Corp.6.50%, 4/1/20 50 51
1,146
Technology (9.2%)BE Aerospace, Inc.
5.25%, 4/1/22 50 51CDW LLC/CDW Finance Corp.
8.50%, 4/1/19 100 107First Data Corp.,
10.55%, 9/24/15 200 204Freescale Semiconductor, Inc.
9.25%, 4/15/18 (a) 100 110Harron Communications LP/Harron Finance Corp.
9.13%, 4/1/20 (a)(d) 150 155iGate Corp.
9.00%, 5/1/16 100 109Lawson Software, Inc.
9.38%, 4/1/19 (a)(d) 150 156Lawson Software, Inc.
11.50%, 7/15/18 (a) 45 50
942
Utilities (2.6%)AES Corp. (The)
7.38%, 7/1/21 (a) 100 111CMS Energy Corp.
5.05%, 3/15/22 100 101United Maritime Group LLC/United Maritime
Group Finance Corp.11.75%, 6/15/15 50 52
264
Total Fixed Income Securities (Cost $9,898) 10,005
Face Amount Value (000) (000)
Face Amount Value (000) (000)
Consumer, Non-Cyclical (cont’d)Spectrum Brands, Inc.
6.75%, 3/15/20 (a) $ 100 $ 101US Foodservice
8.50%, 6/30/19 (a) 150 153Vanguard Health Holding Co. II LLC/Vanguard
Holding Co. II, Inc.8.00%, 2/1/18 100 103
YCC Holdings LLC/Yankee Finance, Inc.,PIK10.25%, 2/15/16 (c) 150 154
2,104
Diversified (1.0%)CCM Merger, Inc.
9.13%, 5/1/19 (a) 100 101
Energy (7.3%)Chesapeake Energy Corp.
6.78%, 3/15/19 100 99Concho Resources, Inc.
5.50%, 10/1/22 50 49Continental Resources, Inc.
5.00%, 9/15/22 (a) 100 101Hercules Offshore, Inc.
7.13%, 4/1/17 (a)(d) 100 100Key Energy Services, Inc.
6.75%, 3/1/21 (a) 100 103Linn Energy LLC/Linn Energy Finance Corp.
6.25%, 11/1/19 (a) 50 49Penn Virginia Corp.
10.38%, 6/15/16 150 148PetroBakken Energy Ltd.
8.63%, 2/1/20 (a) 100 104
753
Finance (8.7%)E*Trade Financial Corp.
7.88%, 12/1/15 150 153Icahn Enterprises LP/Icahn Enterprises
Finance Corp.7.75%, 1/15/16 100 104
Kennedy-Wilson, Inc.8.75%, 4/1/19 150 157
Neuberger Berman Group LLC/Neuberger Berman Finance Corp.5.88%, 3/15/22 (a) 100 101
Nuveen Investments, Inc.10.50%, 11/15/15 125 130
Regions Financial Corp.5.75%, 6/15/15 100 106
USI Holdings Corp.4.38%, 11/15/14 (a)(b) 150 141
892
2012 Semi-Annual Report
March 31, 2012 (unaudited)
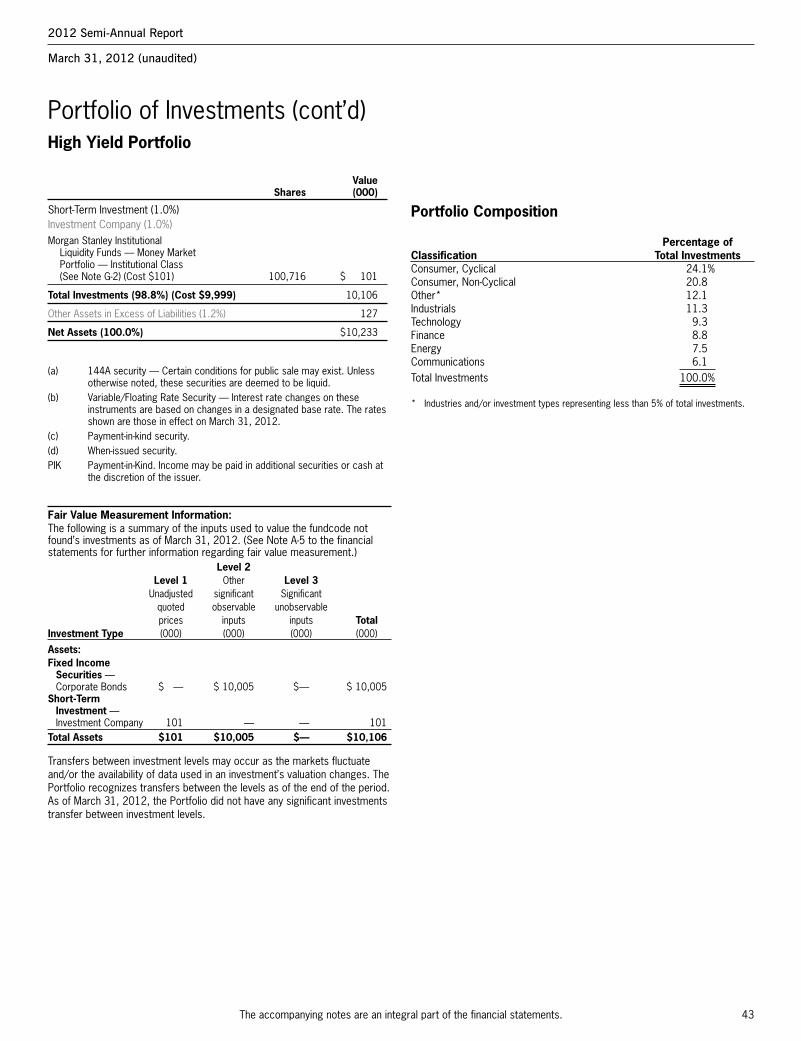
43
Portfolio of Investments (cont’d)High Yield Portfolio
The accompanying notes are an integral part of the financial statements.
Portfolio Composition
Percentage ofClassification Total InvestmentsConsumer, Cyclical 24.1%Consumer, Non-Cyclical 20.8Other* 12.1Industrials 11.3Technology 9.3Finance 8.8Energy 7.5Communications 6.1Total Investments 100.0%
* Industries and/or investment types representing less than 5% of total investments.
Value Shares (000)
Short-Term Investment (1.0%)Investment Company (1.0%)Morgan Stanley Institutional
Liquidity Funds — Money Market Portfolio — Institutional Class (See Note G-2) (Cost $101) 100,716 $ 101
Total Investments (98.8%) (Cost $9,999) 10,106
Other Assets in Excess of Liabilities (1.2%) 127
Net Assets (100.0%) $10,233
(a) 144A security — Certain conditions for public sale may exist. Unlessotherwise noted, these securities are deemed to be liquid.
(b) Variable/Floating Rate Security — Interest rate changes on theseinstruments are based on changes in a designated base rate. The ratesshown are those in effect on March 31, 2012.
(c) Payment-in-kind security.(d) When-issued security.PIK Payment-in-Kind. Income may be paid in additional securities or cash at
the discretion of the issuer.
Fair Value Measurement Information:The following is a summary of the inputs used to value the fundcode notfound’s investments as of March 31, 2012. (See Note A-5 to the financialstatements for further information regarding fair value measurement.) Level 2 Level 1 Other Level 3 Unadjusted significant Significant quoted observable unobservable prices inputs inputs TotalInvestment Type (000) (000) (000) (000)
Assets:Fixed Income
Securities —Corporate Bonds $ — $ 10,005 $— $ 10,005
Short-Term Investment —Investment Company 101 — — 101
Total Assets $101 $10,005 $— $10,106
Transfers between investment levels may occur as the markets fluctuateand/or the availability of data used in an investment’s valuation changes. ThePortfolio recognizes transfers between the levels as of the end of the period.As of March 31, 2012, the Portfolio did not have any significant investmentstransfer between investment levels.
2012 Semi-Annual Report
March 31, 2012 (unaudited)

44
GE Capital Credit Card Master Note Trust2.34%, 4/15/15 (b) $ 3,850 $ 3,847
GE Equipment Midticket LLC0.94%, 7/14/14 (a) 928 928
Harley-Davidson Motorcycle Trust,1.16%, 2/15/15 1,825 1,8311.74%, 9/15/13 193 1931.87%, 2/15/14 263 264
Macquarie Equipment Funding Trust1.21%, 9/20/13 (a) 1,295 1,296
MMAF Equipment Finance LLC2.37%, 11/15/13 (a) 549 551
MMCA Automobile Trust1.39%, 1/15/14 (a) 736 737
Nissan Auto Lease Trust1.12%, 12/15/13 1,625 1,631
Nissan Master Owner Trust Receivables1.39%, 1/15/15 (a)(b) 625 630
North Carolina State Education Assistance Authority,1.01%, 1/25/21 (b) 732 7301.36%, 7/25/25 (b) 625 614
Panhandle-Plains Higher Education Authority, Inc.1.42%, 7/1/24 (b) 275 270
Wheels SPV LLC1.79%, 3/15/18 (a)(b) 204 204
34,376
Collateralized Mortgage Obligation — Agency Collateral Series (1.4%)Federal Home Loan Mortgage Corporation,
REMIC
7.50%, 9/15/29 1,811 2,153
Commercial Mortgage Backed Security (0.5%)Wachovia Bank Commercial Mortgage Trust
5.32%, 7/15/41 (b) 665 715
Corporate Bonds (58.3%)Finance (25.6%)ABB Treasury Center USA, Inc.
2.50%, 6/15/16 (a) 745 760Abbey National Treasury Services PLC
2.88%, 4/25/14 615 613ABN Amro Bank
4.25%, 2/2/17 (a) 400 407Aflac, Inc.
3.45%, 8/15/15 325 342American Express Co.
7.25%, 5/20/14 1,680 1,892American International Group, Inc.
3.65%, 1/15/14 745 759Bank of America Corp.,
Series 13.75%, 7/12/16 1,295 1,303
Barclays Bank PLC2.50%, 1/23/13 1,030 1,039
Portfolio of InvestmentsLimited Duration Portfolio Face Amount Value (000) (000)
Face Amount Value (000) (000)
Fixed Income Securities (97.9%)Agency Adjustable Rate Mortgages (0.7%)Federal Home Loan Mortgage Corporation,
Conventional Pools:5.45%, 1/1/38 $ 281 $ 300
Federal National Mortgage Association,Conventional Pools:2.39%, 5/1/35 820 868
1,168
Agency Fixed Rate Mortgages (0.8%)Federal Home Loan Mortgage Corporation,
Gold Pools:6.50%, 9/1/19 - 11/1/29 17 217.50%, 11/1/19 2 212.00%, 6/1/15 3 3
Federal National Mortgage Association,Conventional Pools:6.50%, 2/1/28 - 10/1/32 1,011 1,1537.00%, 7/1/29 - 12/1/33 65 75
Government National Mortgage Association,Various Pools:9.00%, 11/15/16 - 12/15/16 42 47
1,301
Asset-Backed Securities (22.0%)Ally Master Owner Trust,
1.99%, 1/15/15 (a)(b) 275 2782.15%, 1/15/16 700 7152.88%, 4/15/15 (a) 650 662
American Express Credit Account Master Trust1.49%, 3/15/17 (b) 2,325 2,391
ARI Fleet Lease Trust1.69%, 8/15/18 (a)(b) 168 169
Bank of America Auto Trust2.13%, 9/15/13 (a) 100 100
BMW Floorplan Master Owner Trust1.39%, 9/15/14 (a)(b) 2,600 2,613
Capital One Multi-Asset Execution Trust0.32%, 9/15/15 (b) 1,355 1,355
Chase Issuance Trust1.79%, 4/15/14 (b) 1,600 1,601
Chesapeake Funding LLC2.24%, 12/15/20 (a)(b) 260 261
Citibank Credit Card Issuance Trust (See Note G-2)2.25%, 12/23/14 1,950 1,975
CNH Equipment Trust,1.17%, 5/15/15 1,368 1,3701.54%, 7/15/14 287 288
Discover Card Master Trust1.54%, 12/15/14 (b) 3,000 3,008
Ford Credit Floorplan Master Owner Trust,1.79%, 9/15/14 (b) 2,600 2,6184.20%, 2/15/17 (a) 1,150 1,246
The accompanying notes are an integral part of the financial statements.
2012 Semi-Annual Report
March 31, 2012 (unaudited)

45
Portfolio of Investments (cont’d)Limited Duration Portfolio
The accompanying notes are an integral part of the financial statements.
National Australia Bank Ltd.3.00%, 7/27/16 (a) $ 900 $ 917
Nationwide Building Society4.65%, 2/25/15 (a) 840 864
Nissan Motor Acceptance Corp.3.25%, 1/30/13 (a) 90 91
Nordea Bank AB2.25%, 3/20/15 (a) 635 636
Northern Trust Corp.5.50%, 8/15/13 1,060 1,128
Principal Financial Group, Inc.7.88%, 5/15/14 816 901
Prudential Financial, Inc.,MTN4.75%, 9/17/15 930 1,010
Standard Chartered PLC3.85%, 4/27/15 (a) 940 977
Svenska Handelsbanken AB2.88%, 4/4/17 (c) 645 646
UBS AG3.88%, 1/15/15 1,140 1,187
US Bancorp2.20%, 11/15/16 940 959
Wells Fargo & Co.3.68%, 6/15/16 1,350 1,443
39,960
Industrials (27.2%)Agilent Technologies, Inc.
4.45%, 9/14/12 1,325 1,345Altria Group, Inc.
4.13%, 9/11/15 750 819Anglo American Capital PLC
9.38%, 4/8/14 (a) 1,100 1,267Anheuser-Busch InBev Worldwide, Inc.,
4.13%, 1/15/15 350 3795.38%, 11/15/14 785 872
Applied Materials, Inc.2.65%, 6/15/16 455 472
Apria Healthcare Group, Inc.11.25%, 11/1/14 375 394
ArcelorMittal9.00%, 2/15/15 610 702
Aristotle Holding, Inc.,2.65%, 2/15/17 (a) 35 352.75%, 11/21/14 (a) 580 596
AT&T, Inc.4.95%, 1/15/13 2,510 2,596
Bacardi Ltd.7.45%, 4/1/14 (a) 835 933
Barrick Gold Corp.1.75%, 5/30/14 660 668
Best Buy Co., Inc.3.75%, 3/15/16 875 883
Face Amount Value (000) (000)
Face Amount Value (000) (000)
Finance (cont’d)BBVA Bancomer SA
4.50%, 3/10/16 (a) $ 955 $ 988BNP Paribas SA
3.60%, 2/23/16 920 930BP Capital Markets PLC
3.88%, 3/10/15 595 639Canadian Imperial Bank of Commerce
1.45%, 9/13/13 1,130 1,142Capital One Financial Corp.
7.38%, 5/23/14 875 969Citigroup, Inc. (See Note G-2)
4.45%, 1/10/17 1,125 1,180CNH Capital LLC
6.25%, 11/1/16 (a) 130 140Commonwealth Bank of Australia
1.95%, 3/16/15 735 740Cooperatieve Centrale
Raiffeisen-Boerenleenbank BA/Utrect3.38%, 1/19/17 330 338
Credit Suisse5.50%, 5/1/14 840 901
Deutsche Bank AG2.38%, 1/11/13 1,105 1,114
DNB Bank ASA3.20%, 4/3/17 (a)(c) 610 613
General Electric Capital Corp.2.95%, 5/9/16 2,790 2,913
Genworth Life Institutional Funding Trust5.88%, 5/3/13 (a) 865 898
Goldman Sachs Group, Inc. (The)3.63%, 2/7/16 1,250 1,251
HCP, Inc.2.70%, 2/1/14 575 583
HSBC USA, Inc.2.38%, 2/13/15 775 781
Icahn Enterprises LP/Icahn Enterprises Finance Corp.7.75%, 1/15/16 375 390
ING Bank3.75%, 3/7/17 (a) 600 595
Intesa Sanpaolo SpA3.63%, 8/12/15 (a) 550 526
JPMorgan Chase & Co.,1.88%, 3/20/15 475 4773.15%, 7/5/16 1,025 1,058
Macquarie Group Ltd.7.30%, 8/1/14 (a) 720 772
Metropolitan Life Global Funding I2.00%, 1/10/14 (a) 950 965
Monumental Global Funding III5.25%, 1/15/14 (a) 1,115 1,183
2012 Semi-Annual Report
March 31, 2012 (unaudited)

46
Portfolio of Investments (cont’d)Limited Duration Portfolio
The accompanying notes are an integral part of the financial statements.
Stryker Corp.2.00%, 9/30/16 $ 715 $ 734
Tesoro Corp.6.63%, 11/1/15 350 360
Texas Instruments, Inc.1.38%, 5/15/14 955 970
Time Warner Cable, Inc.8.25%, 2/14/14 700 793
Tyco Electronics Group SA1.60%, 2/3/15 170 170
United Air Lines, Inc.9.88%, 8/1/13 (a) 400 422
Verizon Communications, Inc.1.25%, 11/3/14 715 723
Viacom, Inc.4.38%, 9/15/14 1,100 1,187
Vodafone Group PLC5.00%, 12/16/13 1,060 1,134
Volkswagen International Finance1.63%, 3/22/15 (a) 1,195 1,196
Waste Management, Inc.2.60%, 9/1/16 725 744
Wesfarmers Ltd.2.98%, 5/18/16 (a) 395 404
WMG Acquisition Corp.9.50%, 6/15/16 350 383
42,433
Utilities (5.5%)AES Corp. (The)
7.75%, 10/15/15 350 392Commonwealth Edison Co.
1.63%, 1/15/14 805 818EDF SA
5.50%, 1/26/14 (a) 1,105 1,186Enel Finance International N.V.
3.88%, 10/7/14 (a) 1,115 1,126FirstEnergy Solutions Corp.
4.80%, 2/15/15 755 817NextEra Energy Capital Holdings, Inc.
5.35%, 6/15/13 825 868Plains All American Pipeline L.P./PAA Finance Corp.
4.25%, 9/1/12 1,140 1,154Sempra Energy
2.00%, 3/15/14 915 934Spectra Energy Capital LLC
5.90%, 9/15/13 965 1,025TransCanada PipeLines Ltd.
0.88%, 3/2/15 300 300
8,620
91,013
Mortgage — Other (0.3%)FDIC Structured Sale Guaranteed Notes
0.55%, 2/25/48 (a)(b) 531 532
Face Amount Value (000) (000)
Face Amount Value (000) (000)
Industrials (cont’d)Bunge Ltd. Finance Corp.
5.35%, 4/15/14 $ 830 $ 881Coca-Cola Co. (The)
0.75%, 3/13/15 1,195 1,193Comcast Corp.
6.50%, 1/15/15 870 993COX Communications, Inc.
4.63%, 6/1/13 690 721Daimler Finance North America LLC
1.88%, 9/15/14 (a) 785 797Danaher Corp.
1.30%, 6/23/14 255 259Delhaize Group SA
5.88%, 2/1/14 1,025 1,103DirecTV Holdings LLC /DirecTV Financing Co., Inc.
4.75%, 10/1/14 695 756Ecolab, Inc.
3.00%, 12/8/16 320 333Ford Motor Credit Co. LLC
5.63%, 9/15/15 375 400Gilead Sciences, Inc.
3.05%, 12/1/16 1,000 1,048Harley-Davidson Funding Corp.
5.25%, 12/15/12 (a) 820 842Hewlett-Packard Co.
3.30%, 12/9/16 815 849Home Depot, Inc.
5.40%, 3/1/16 630 728Kinross Gold Corp.
3.63%, 9/1/16 (a) 740 745Kraft Foods, Inc.
6.75%, 2/19/14 875 967Kroger Co. (The)
7.50%, 1/15/14 725 809Marathon Petroleum Corp.
3.50%, 3/1/16 1,070 1,116Marriott International, Inc.
4.63%, 6/15/12 1,300 1,308McKesson Corp.
3.25%, 3/1/16 1,070 1,147NBC Universal Media LLC
2.10%, 4/1/14 835 853News America, Inc.
5.30%, 12/15/14 455 504PepsiCo, Inc.
0.75%, 3/5/15 525 523Phillips 66
1.95%, 3/5/15 (a) 200 202Potash Corp. of Saskatchewan, Inc.
5.25%, 5/15/14 1,105 1,205Quest Diagnostics, Inc.
3.20%, 4/1/16 925 970
2012 Semi-Annual Report
March 31, 2012 (unaudited)

47
Portfolio of Investments (cont’d)Limited Duration Portfolio
The accompanying notes are an integral part of the financial statements.
U.S. Treasury Security (0.3%)U.S. Treasury Bill
0.14%, 8/30/12 (e)(f)(g) $ 510 $ 510
Total Short-Term Investments (Cost $4,524) 4,524
Total Investments (100.8%) (Cost $154,640) (h) 157,514
Liabilities in Excess of Other Assets (-0.8%) (1,266)
Net Assets (100.0%) $156,248
(a) 144A security — Certain conditions for public sale may exist. Unlessotherwise noted, these securities are deemed to be liquid.
(b) Variable/Floating Rate Security — Interest rate changes on theseinstruments are based on changes in a designated base rate. The ratesshown are those in effect on March 31, 2012.
(c) When-issued security.(d) Non-income producing security.(e) Rate shown is the yield to maturity at March 31, 2012.(f) All or a portion of the security was pledged to cover margin
requirements for futures contracts.(g) All or a portion of the security was pledged as collateral for swap
agreements.(h) Securities are available for collateral in connection with purchase of
when-issued securities, open futures contracts and swap agreements.FDIC Federal Deposit Insurance Corporation.MTN Medium Term Note.REMIC Real Estate Mortgage Investment Conduit.
Face Amount Value (000) (000)
Face Amount Value (000) (000)
Non-U.S. Government — Guaranteed (8.7%)Commonwealth Bank of Australia
2.50%, 12/10/12 (a) $ 2,300 $ 2,328Royal Bank of Scotland PLC (The)
2.63%, 5/11/12 (a) 2,230 2,230Swedbank AB
2.90%, 1/14/13 (a) 5,900 6,001Westpac Securities NZ Ltd.
2.50%, 5/25/12 (a) 3,020 3,018
13,577
U.S. Treasury Securities (5.2%)U.S. Treasury Notes,
0.50%, 11/15/13 4,050 4,0631.25%, 8/31/15 3,100 3,1662.38%, 6/30/18 875 926
8,155
Total Fixed Income Securities (Cost $150,116) 152,990
Shares Short-Term Investments (2.9%)Investment Company (2.6%)Morgan Stanley Institutional
Liquidity Funds — Money Market Portfolio — Institutional Class (See Note G-2) (Cost $4,014) 4,014,149 4,014
2012 Semi-Annual Report
March 31, 2012 (unaudited)
Futures Contracts:The Portfolio had the following futures contracts open at period end:
Unrealized Number Appreciation of Value Expiration (Depreciation) Contracts (000) Date (000)
Long:
U.S. Treasury 2 yr. Note 186 $ 40,946 Jun-12 $(28)U.S. Treasury 10 yr. Note 10 1,295 Jun-12 (19)
Short:
U.S. Treasury 5 yr. Note 125 (15,317) Jun-12 70 $ 23
Zero Coupon Swap Agreements:The Portfolio had the following zero coupon swap agreements open at period end: Premium Unrealized Notional Paid Appreciation Amount Floating Pay/Receive Termination (Received) (Depreciation)Swap Counterparty (000) Rate Index Floating Rate Date (000) (000)Deutsche Bank $4,696 3 Month LIBOR Pay 11/15/21 $ 170 $ 729Deutsche Bank 4,009 3 Month LIBOR Receive 11/15/21 (280) (1,266) $ (537) LIBOR London Interbank Offered Rate.

48
Portfolio of Investments (cont’d)Limited Duration Portfolio
The accompanying notes are an integral part of the financial statements.
Portfolio Composition
Percentage ofClassification Total InvestmentsIndustrials 26.9%Finance 25.4Asset-Backed Securities 21.8Non-U.S. Government — Guaranteed 8.6Other* 6.3Utilities 5.5U.S. Treasury Securities 5.5Total Investments 100.0%**
* Industries and/or investment types representing less than 5% of total investments.** Does not include open long/short futures contracts with an underlying face amount
of approximately $57,558,000 and net unrealized appreciation of approximately$23,000 and open swap agreements with net unrealized depreciation ofapproximately $537,000.
Fair Value Measurement Information:The following is a summary of the inputs used to value the Portfolio’sinvestments as of March 31, 2012. (See Note A-5 to the financial statementsfor further information regarding fair value measurement.) Level 2 Level 1 Other Level 3 Unadjusted significant Significant quoted observable unobservable prices inputs inputs TotalInvestment Type (000) (000) (000) (000)
Assets:
Fixed Income Securities
Agency Adjustable Rate Mortgages $ — $ 1,168 $— $ 1,168
Agency Fixed Rate Mortgages — 1,301 — 1,301
Asset-Backed Securities — 34,376 — 34,376
Collateralized Mortgage Obligations —Agency Collateral Series — 2,153 — 2,153
Commercial Mortgage Backed Security — 715 — 715
Corporate Bonds — 91,013 — 91,013Mortgages — Other — 532 — 532Non-U.S.
Government —Guaranteed — 13,577 — 13,577
U.S. Treasury Securities — 8,155 — 8,155
Total Fixed Income Securities — 152,990 — 152,990
Short-Term Investments
Investment Company 4,014 — — 4,014U.S. Treasury Security — 510 — 510Total Short-Term
Investments 4,014 510 — 4,524Futures Contracts 70 — — 70Zero Coupon Swap
Agreements — 729 — 729Total Assets 4,084 154,229 — 158,313Liabilities:Futures Contracts (47) — — (47)Zero Coupon Swap
Agreements — (1,266) — (1,266)Total Liabilities (47) (1,266) — (1,313)Total $4,037 $152,963 $— $157,000
Transfers between investment levels may occur as the markets fluctuateand/or the availability of data used in an investment’s valuation changes. ThePortfolio recognizes transfers between the levels as of the end of the period.As of March 31, 2012, the Portfolio did not have any significant investmentstransfer between investment levels.
2012 Semi-Annual Report
March 31, 2012 (unaudited)

49
Merrill Lynch & Co., Inc.7.75%, 5/14/38 $ 175 $ 192
MetLife, Inc.5.70%, 6/15/35 95 111
Principal Financial Group, Inc.6.05%, 10/15/36 70 76
Protective Life Corp.8.45%, 10/15/39 50 58
Prudential Financial, Inc.,MTN6.63%, 12/1/37 55 64
UnitedHealth Group, Inc.,5.80%, 3/15/36 80 926.88%, 2/15/38 50 66
WellPoint, Inc.6.38%, 6/15/37 30 37
2,750
Industrials (26.8%)Agrium, Inc.
7.13%, 5/23/36 55 69Alcoa, Inc.
5.95%, 2/1/37 20 20Altria Group, Inc.,
9.95%, 11/10/38 45 6910.20%, 2/6/39 80 124
Amgen, Inc.5.15%, 11/15/41 35 35
Anadarko Petroleum Corp.6.20%, 3/15/40 100 114
ArcelorMittal7.00%, 10/15/39 30 29
AT&T, Inc.,5.35%, 9/1/40 325 3475.55%, 8/15/41 60 676.30%, 1/15/38 30 35
BSKYB Finance UK PLC6.50%, 10/15/35 (a) 50 56
Bunge Ltd. Finance Corp.8.50%, 6/15/19 40 49
Burlington Northern Santa Fe LLC6.15%, 5/1/37 55 66
Canadian Natural Resources Ltd.6.25%, 3/15/38 75 92
Canadian Oil Sands Ltd.6.00%, 4/1/42 (a) 25 25
CBS Corp.7.88%, 7/30/30 35 45
CenturyLink, Inc.,Series P7.60%, 9/15/39 120 114
Comcast Corp.6.95%, 8/15/37 100 127
Portfolio of InvestmentsLong Duration Fixed Income Portfolio Face Amount Value (000) (000)
Face Amount Value (000) (000)
Fixed Income Securities (95.6%)Asset-Backed Securities (0.6%)CVS Pass-Through Trust,
6.04%, 12/10/28 $ 95 $ 1058.35%, 7/10/31 (a) 29 36
141
Corporate Bonds (47.0%)Finance (11.4%)ACE INA Holdings, Inc.
6.70%, 5/15/36 40 52Aetna, Inc.
6.63%, 6/15/36 40 50Aflac, Inc.
6.90%, 12/17/39 75 88AIG SunAmerica Global Financing X
6.90%, 3/15/32 (a) 17 19Allstate Corp. (The),
5.95%, 4/1/36 65 746.13%, 12/15/32 30 35
American Express Co.8.13%, 5/20/19 45 59
Bear Stearns Cos. LLC (The)7.25%, 2/1/18 45 54
Chubb Corp. (The)6.50%, 5/15/38 30 39
Cigna Corp.5.38%, 2/15/42 35 36
Citigroup, Inc.(See Note G-2),5.85%, 12/11/34 225 2316.88%, 3/5/38 30 35
Credit Suisse USA, Inc.7.13%, 7/15/32 50 60
Farmers Exchange Capital7.05%, 7/15/28 (a) 100 109
General Electric Capital Corp.,5.88%, 1/14/38 155 171MTN6.15%, 8/7/37 5 66.75%, 3/15/32 140 168
Goldman Sachs Group, Inc. (The)6.75%, 10/1/37 290 284
Hartford Financial Services Group, Inc.6.63%, 3/30/40 75 78
HSBC Holdings PLC6.50%, 5/2/36 235 262
JPMorgan Chase & Co.6.40%, 5/15/38 55 66
JPMorgan Chase Capital XXVII7.00%, 11/1/39 55 56
Lincoln National Corp.6.30%, 10/9/37 20 22
The accompanying notes are an integral part of the financial statements.
2012 Semi-Annual Report
March 31, 2012 (unaudited)

50
Portfolio of Investments (cont’d)Long Duration Fixed Income Portfolio
The accompanying notes are an integral part of the financial statements.
Lowe’s Cos., Inc.6.65%, 9/15/37 $ 45 $ 58
Marathon Petroleum Corp.6.50%, 3/1/41 100 108
NBC Universal Media LLC6.40%, 4/30/40 45 54
News America, Inc.6.40%, 12/15/35 105 119
Petro-Canada,5.95%, 5/15/35 55 646.80%, 5/15/38 100 128
Petrobras International Finance Co.6.88%, 1/20/40 60 71
Philip Morris International, Inc.4.50%, 3/20/42 75 74
Potash Corp. of Saskatchewan, Inc.5.88%, 12/1/36 85 103
Quest Diagnostics, Inc.,5.75%, 1/30/40 30 316.95%, 7/1/37 80 98
Qwest Corp.6.88%, 9/15/33 40 40
Ralcorp Holdings, Inc.6.63%, 8/15/39 90 91
Rio Tinto Alcan, Inc.6.13%, 12/15/33 25 29
Rio Tinto Finance USA Ltd.7.13%, 7/15/28 40 52
Southern Copper Corp.6.75%, 4/16/40 100 109
Syngenta Finance4.38%, 3/28/42 30 30
Target Corp.7.00%, 1/15/38 100 135
Telecom Italia Capital SA7.20%, 7/18/36 40 39
Telefonica Europe BV8.25%, 9/15/30 35 38
Teva Pharmaceutical Finance Co. LLC6.15%, 2/1/36 25 30
Time Warner Cable, Inc.6.55%, 5/1/37 85 99
Time Warner, Inc.7.70%, 5/1/32 195 255
Union Pacific Corp.6.25%, 5/1/34 115 141
Vale Overseas Ltd.6.88%, 11/21/36 50 58
Valero Energy Corp.,6.63%, 6/15/37 65 719.38%, 3/15/19 40 53
Face Amount Value (000) (000)
Face Amount Value (000) (000)
Industrials (cont’d)ConAgra Foods, Inc.
8.25%, 9/15/30 $ 65 $ 83Corning, Inc.
7.25%, 8/15/36 85 102CSX Corp.
6.15%, 5/1/37 60 70Daimler Finance North America LLC
8.50%, 1/18/31 65 95Darden Restaurants, Inc.
6.80%, 10/15/37 50 57Delhaize Group SA
5.70%, 10/1/40 105 97Deutsche Telekom International Finance BV
8.75%, 6/15/30 85 117DirecTV Holdings LLC/DirecTV Financing Co., Inc.
6.35%, 3/15/40 40 44Dr. Pepper Snapple Group, Inc.
7.45%, 5/1/38 75 102Grupo Televisa SA
6.63%, 1/15/40 75 86Halliburton Co.
4.50%, 11/15/41 50 51Harley-Davidson Funding Corp.
6.80%, 6/15/18 (a) 40 47Hess Corp.
7.13%, 3/15/33 55 70Hewlett-Packard Co.
6.00%, 9/15/41 75 82Holcim Capital Corp. Ltd.
6.88%, 9/29/39 (a) 100 101Home Depot, Inc. (The)
5.88%, 12/16/36 140 168Illinois Tool Works, Inc.
4.88%, 9/15/41 (a) 50 54International Paper Co.
7.30%, 11/15/39 95 116JC Penney Corp., Inc.
7.40%, 4/1/37 50 49KLA-Tencor Corp.
6.90%, 5/1/18 45 54Kohl’s Corp.
6.88%, 12/15/37 55 67Koninklijke KPN N.V.
8.38%, 10/1/30 25 32Koninklijke Philips Electronics N.V.
6.88%, 3/11/38 70 87Kraft Foods, Inc.
6.88%, 1/26/39 150 189Kroger Co. (The)
6.90%, 4/15/38 80 100Lorillard Tobacco Co.
8.13%, 5/1/40 45 55
2012 Semi-Annual Report
March 31, 2012 (unaudited)

51
Portfolio of Investments (cont’d)Long Duration Fixed Income Portfolio
The accompanying notes are an integral part of the financial statements.
ONEOK Partners LP6.85%, 10/15/37 $ 75 $ 90
Plains All American Pipeline LP/PAA Finance Corp.,6.65%, 1/15/37 40 476.70%, 5/15/36 75 88
PPL Electric Utilities Corp.6.45%, 8/15/37 30 40
Sempra Energy6.00%, 10/15/39 125 151
Spectra Energy Capital LLC7.50%, 9/15/38 45 57
Tennessee Gas Pipeline Co.7.00%, 10/15/28 125 142
2,116
11,350
Municipal Bonds (6.5%)American Municipal Power, Inc.
6.05%, 2/15/43 55 61Bay Area Toll Authority
6.26%, 4/1/49 90 116Chicago, IL Board of Education
6.14%, 12/1/39 50 56Chicago, IL Transit Authority
6.20%, 12/1/40 85 97City of New York, NY,
Series G-15.97%, 3/1/36 40 49
City of San Francisco, CA,Public Utilities Commission Water Revenue6.00%, 11/1/40 55 66
County of Clark N.V.6.82%, 7/1/45 105 139
District of Columbia5.59%, 12/1/34 65 79
Illinois State Toll Highway Authority,Highway Revenue, Build America Bonds6.18%, 1/1/34 70 84
Indianapolis, IN Local Public Improvement Bond Bank6.12%, 1/15/40 35 44
Los Angeles, CA Unified School District6.76%, 7/1/34 45 58
Municipal Electric Authority of Georgia,6.64%, 4/1/57 65 736.66%, 4/1/57 25 28
New Jersey Transportation Trust Fund Authority6.56%, 12/15/40 35 45
New York City, NY Municipal Water Finance Authority5.72%, 6/15/42 30 38
New York City, NY Transitional Finance Authority5.27%, 5/1/27 40 47
North Texas Tollway Authority6.72%, 1/1/49 90 116
Face Amount Value (000) (000)
Face Amount Value (000) (000)
Industrials (cont’d)Verizon Communications, Inc.,
5.85%, 9/15/35 $ 120 $ 1388.95%, 3/1/39 115 178
Vivendi SA6.63%, 4/4/18 (a) 40 45
Vodafone Group PLC6.15%, 2/27/37 45 55
Wal-Mart Stores, Inc.6.50%, 8/15/37 35 46
Waste Management, Inc.6.13%, 11/30/39 95 116
Williams Cos., Inc. (The)7.75%, 6/15/31 39 48
Xerox Corp.5.63%, 12/15/19 20 22
6,484
Utilities (8.8%)Columbus Southern Power Co.
6.60%, 3/1/33 30 37Constellation Energy Group, Inc.
7.60%, 4/1/32 75 98Detroit Edison Co. (The)
6.35%, 10/15/32 60 74E.ON International Finance BV
6.65%, 4/30/38 (a) 25 32EDF SA
5.60%, 1/27/40 (a) 30 31Enbridge Energy Partners LP
7.50%, 4/15/38 50 64Energy Transfer Partners LP,
7.50%, 7/1/38 60 689.00%, 4/15/19 19 23
Entergy Louisiana LLC5.40%, 11/1/24 50 58
Enterprise Products Operating LLC5.95%, 2/1/41 100 112
Exelon Generation Co., LLC6.25%, 10/1/39 175 205
FirstEnergy Solutions Corp.6.80%, 8/15/39 180 201
Kinder Morgan Energy Partners LP6.50%, 2/1/37 65 72
Nevada Power Co.6.65%, 4/1/36 125 160
Nisource Finance Corp.6.13%, 3/1/22 85 99
Ohio Power Co.6.60%, 2/15/33 110 135
Oncor Electric Delivery Co. LLC7.50%, 9/1/38 25 32
2012 Semi-Annual Report
March 31, 2012 (unaudited)

52
Portfolio of Investments (cont’d)Long Duration Fixed Income Portfolio
The accompanying notes are an integral part of the financial statements.
Short-Term Investment (3.6%)Investment Company (3.6%)Morgan Stanley Institutional
Liquidity Funds — Money Market Portfolio — Institutional Class (See Note G-2) (Cost $876) 875,832 $ 876
Total Investments (99.2%) (Cost $21,194) (b) 23,943
Other Assets in Excess of Liabilities (0.8%) 196
Net Assets (100.0%) $24,139
(a) 144A security — Certain conditions for public sale may exist. Unlessotherwise noted, these securities are deemed to be liquid.
(b) Securities are available for collateral in connection with futures contractsand swap agreements.
MTN Medium Term Note.
Futures Contracts:The Portfolio had the following futures contracts open at period end:
Unrealized Number Appreciation of Value Expiration (Depreciation) Contracts (000) Date (000)
Long:
U.S. Treasury 10 yr. Note 18 $2,331 Jun-12 $12
Short:
U.S. Treasury 2 yr. Note 4 (880) Jun-12 (1)
U.S. Treasury 5 yr. Note 3 (368) Jun-12 2
$13
Face Amount Value (000) (000)
Value Shares (000)
Municipal Bonds (cont’d)San Diego, CA County Water Authority
6.14%, 5/1/49 $ 25 $ 32State of California, General Obligation Bonds
7.55%, 4/1/39 160 206State of Illinois
6.63%, 2/1/35 50 55State of Washington
5.09%, 8/1/33 65 74
1,563
Sovereign (3.0%)Brazilian Government International Bond
8.25%, 1/20/34 210 318Mexico Government International Bond
6.05%, 1/11/40 165 200Panama Government International Bond
9.38%, 4/1/29 43 69Peruvian Government International Bond
8.75%, 11/21/33 35 54Petroleos Mexicanos
4.88%, 1/24/22 (a) 70 74
715
U.S. Agency Security (2.5%)Federal Home Loan Mortgage Corporation
6.75%, 3/15/31 417 602U.S. Treasury Securities (36.0%)U.S. Treasury Bonds,
3.13%, 11/15/41 1,240 1,1893.50%, 2/15/39 1,060 1,1013.75%, 8/15/41 885 9573.88%, 8/15/40 860 9514.25%, 11/15/40 1,500 1,7675.50%, 8/15/28 1,455 1,9486.75%, 8/15/26 530 783
8,696
Total Fixed Income Securities (Cost $20,318) 23,067
2012 Semi-Annual Report
March 31, 2012 (unaudited)
Interest Rate Swap Agreements:The Portfolio had the following interest rate swap agreements open at period end: Unrealized Notional Appreciation Floating Rate Pay/Receive Termination Amount (Depreciation)Swap Counterparty Index Floating Rate Fixed Rate Date (000) (000)Bank of America NA 6 Month EURIBOR Pay 4.26% 8/18/26 EUR 1,090 $ 48Bank of America NA 3 Month LIBOR Receive 4.35 8/18/26 $ 1,460 (26)Bank of America NA 6 Month EURIBOR Receive 3.61 8/18/31 EUR 1,375 (42)Bank of America NA 3 Month LIBOR Pay 4.15 8/18/31 $ 1,810 25Goldman Sachs International 3 Month LIBOR Receive 2.42 3/22/22 273 (4)JP Morgan Chase 3 Month LIBOR Receive 2.43 3/22/22 132 (2) $ (1)
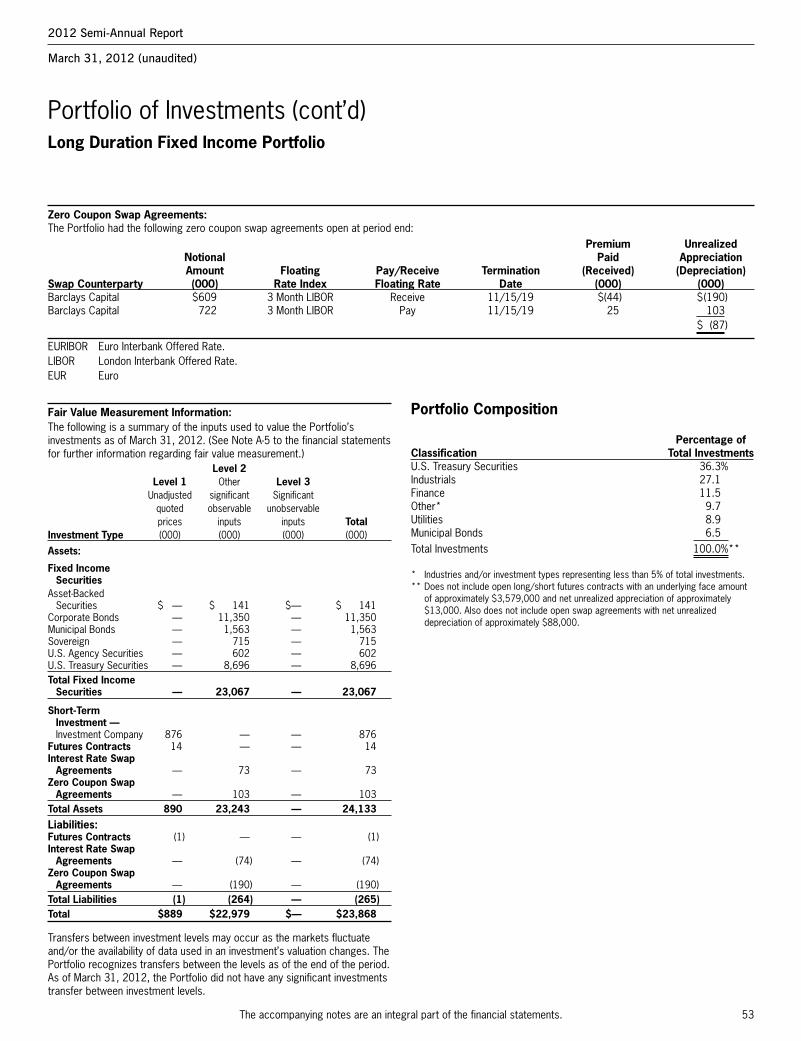
53
Portfolio of Investments (cont’d)Long Duration Fixed Income Portfolio
The accompanying notes are an integral part of the financial statements.
Zero Coupon Swap Agreements:The Portfolio had the following zero coupon swap agreements open at period end: Premium Unrealized Notional Paid Appreciation Amount Floating Pay/Receive Termination (Received) (Depreciation)Swap Counterparty (000) Rate Index Floating Rate Date (000) (000)Barclays Capital $609 3 Month LIBOR Receive 11/15/19 $(44) $(190)Barclays Capital 722 3 Month LIBOR Pay 11/15/19 25 103 $ (87) EURIBOR Euro Interbank Offered Rate.LIBOR London Interbank Offered Rate.EUR Euro
2012 Semi-Annual Report
March 31, 2012 (unaudited)
Portfolio Composition
Percentage ofClassification Total InvestmentsU.S. Treasury Securities 36.3%Industrials 27.1Finance 11.5Other* 9.7Utilities 8.9Municipal Bonds 6.5Total Investments 100.0%**
* Industries and/or investment types representing less than 5% of total investments.** Does not include open long/short futures contracts with an underlying face amount
of approximately $3,579,000 and net unrealized appreciation of approximately$13,000. Also does not include open swap agreements with net unrealizeddepreciation of approximately $88,000.
Fair Value Measurement Information:The following is a summary of the inputs used to value the Portfolio’sinvestments as of March 31, 2012. (See Note A-5 to the financial statementsfor further information regarding fair value measurement.) Level 2 Level 1 Other Level 3 Unadjusted significant Significant quoted observable unobservable prices inputs inputs TotalInvestment Type (000) (000) (000) (000)
Assets:
Fixed Income Securities
Asset-Backed Securities $ — $ 141 $— $ 141
Corporate Bonds — 11,350 — 11,350Municipal Bonds — 1,563 — 1,563Sovereign — 715 — 715U.S. Agency Securities — 602 — 602U.S. Treasury Securities — 8,696 — 8,696Total Fixed Income
Securities — 23,067 — 23,067
Short-Term Investment —Investment Company 876 — — 876
Futures Contracts 14 — — 14Interest Rate Swap
Agreements — 73 — 73Zero Coupon Swap
Agreements — 103 — 103Total Assets 890 23,243 — 24,133Liabilities:Futures Contracts (1) — — (1)Interest Rate Swap
Agreements — (74) — (74)Zero Coupon Swap
Agreements — (190) — (190)Total Liabilities (1) (264) — (265)Total $889 $22,979 $— $23,868
Transfers between investment levels may occur as the markets fluctuateand/or the availability of data used in an investment’s valuation changes. ThePortfolio recognizes transfers between the levels as of the end of the period.As of March 31, 2012, the Portfolio did not have any significant investmentstransfer between investment levels.
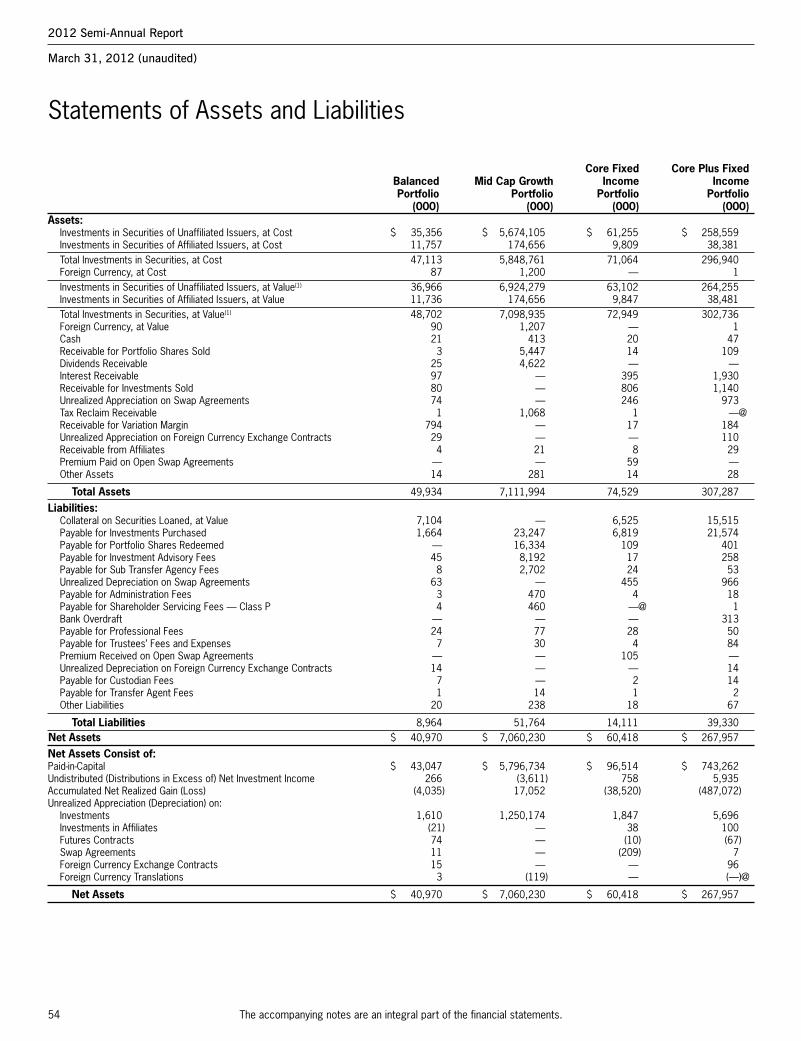
54
Statements of Assets and Liabilities
The accompanying notes are an integral part of the financial statements.
Core Fixed Core Plus Fixed Balanced Mid Cap Growth Income Income Portfolio Portfolio Portfolio Portfolio (000) (000) (000) (000)Assets:
Investments in Securities of Unaffiliated Issuers, at Cost $ 35,356 $ 5,674,105 $ 61,255 $ 258,559Investments in Securities of Affiliated Issuers, at Cost 11,757 174,656 9,809 38,381Total Investments in Securities, at Cost 47,113 5,848,761 71,064 296,940Foreign Currency, at Cost 87 1,200 — 1Investments in Securities of Unaffiliated Issuers, at Value(1) 36,966 6,924,279 63,102 264,255Investments in Securities of Affiliated Issuers, at Value 11,736 174,656 9,847 38,481Total Investments in Securities, at Value(1) 48,702 7,098,935 72,949 302,736Foreign Currency, at Value 90 1,207 — 1Cash 21 413 20 47Receivable for Portfolio Shares Sold 3 5,447 14 109Dividends Receivable 25 4,622 — —Interest Receivable 97 — 395 1,930Receivable for Investments Sold 80 — 806 1,140Unrealized Appreciation on Swap Agreements 74 — 246 973Tax Reclaim Receivable 1 1,068 1 —@Receivable for Variation Margin 794 — 17 184Unrealized Appreciation on Foreign Currency Exchange Contracts 29 — — 110Receivable from Affiliates 4 21 8 29Premium Paid on Open Swap Agreements — — 59 —Other Assets 14 281 14 28
Total Assets 49,934 7,111,994 74,529 307,287
Liabilities:Collateral on Securities Loaned, at Value 7,104 — 6,525 15,515Payable for Investments Purchased 1,664 23,247 6,819 21,574Payable for Portfolio Shares Redeemed — 16,334 109 401Payable for Investment Advisory Fees 45 8,192 17 258Payable for Sub Transfer Agency Fees 8 2,702 24 53Unrealized Depreciation on Swap Agreements 63 — 455 966Payable for Administration Fees 3 470 4 18Payable for Shareholder Servicing Fees — Class P 4 460 —@ 1Bank Overdraft — — — 313Payable for Professional Fees 24 77 28 50Payable for Trustees’ Fees and Expenses 7 30 4 84Premium Received on Open Swap Agreements — — 105 —Unrealized Depreciation on Foreign Currency Exchange Contracts 14 — — 14Payable for Custodian Fees 7 — 2 14Payable for Transfer Agent Fees 1 14 1 2Other Liabilities 20 238 18 67
Total Liabilities 8,964 51,764 14,111 39,330Net Assets $ 40,970 $ 7,060,230 $ 60,418 $ 267,957
Net Assets Consist of:Paid-in-Capital $ 43,047 $ 5,796,734 $ 96,514 $ 743,262Undistributed (Distributions in Excess of) Net Investment Income 266 (3,611) 758 5,935Accumulated Net Realized Gain (Loss) (4,035) 17,052 (38,520) (487,072)Unrealized Appreciation (Depreciation) on:
Investments 1,610 1,250,174 1,847 5,696Investments in Affiliates (21) — 38 100Futures Contracts 74 — (10) (67)Swap Agreements 11 — (209) 7Foreign Currency Exchange Contracts 15 — — 96Foreign Currency Translations 3 (119) — (—)@
Net Assets $ 40,970 $ 7,060,230 $ 60,418 $ 267,957
2012 Semi-Annual Report
March 31, 2012 (unaudited)

55
Statements of Assets and Liabilities (cont’d)
The accompanying notes are an integral part of the financial statements.
Core Fixed Core Plus Fixed Balanced Mid Cap Growth Income Income Portfolio Portfolio Portfolio Portfolio (000) (000) (000) (000)CLASS I:Net Assets $ 21,196 $ 4,870,199 $ 60,292 $ 264,083Shares Outstanding (unlimited number of shares authorized, no par value)
(not in 000s) 1,457,781 125,785,817 5,912,953 26,042,890Net Asset Value, Offering and Redemption Price Per Share $ 14.54 $ 38.72 $ 10.20 $ 10.14
CLASS P:Net Assets $ 19,774 $ 2,190,031 $ 126 $ 3,874Shares Outstanding (unlimited number of shares authorized, no par value)
(not in 000s) 1,363,871 58,660,088 12,253 381,496Net Asset Value, Offering and Redemption Price Per Share $ 14.50 $ 37.33 $ 10.26 $ 10.15(1) Including:
Securities on Loan, at Value: $ 7,630 $ — $ 8,402 $ 20,904
@ Amount is less than $500.
2012 Semi-Annual Report
March 31, 2012 (unaudited)

56
Statements of Assets and Liabilities
The accompanying notes are an integral part of the financial statements.
Corporate Limited Long Duration Bond High Yield Duration Fixed Income Portfolio Portfolio Portfolio Portfolio (000) (000) (000) (000)Assets:
Investments in Securities of Unaffiliated Issuers, at Cost $ 49,028 $ 9,898 $ 147,491 $ 20,066Investments in Securities of Affiliated Issuers, at Cost 9,826 101 7,149 1,128Total Investments in Securities, at Cost 58,854 9,999 154,640 21,194Foreign Currency, at Cost — — — —@Investments in Securities of Unaffiliated Issuers, at Value(1) 50,614 10,005 150,345 22,801Investments in Securities of Affiliated Issuers, at Value 9,904 101 7,169 1,142Total Investments in Securities, at Value(1) 60,518 10,106 157,514 23,943Foreign Currency, at Value — — — —@Cash 29 — 19 —Interest Receivable 607 210 1,019 277Receivable for Investments Sold 609 418 — —Unrealized Appreciation on Swap Agreements — — 729 176Premium Paid on Open Swap Agreements — — 170 25Receivable for Portfolio Shares Sold 65 — 10 —Receivable for Variation Margin 22 — 6 41Receivable from Affiliates 25 —@ 24 4Due from Adviser — 22 — 11Tax Reclaim Receivable —@ — — —Prepaid Offering Cost — 108 — —Other Assets 59 5 19 6
Total Assets 61,934 10,869 159,510 24,483
Liabilities:Collateral on Securities Loaned, at Value 9,451 — — —Payable for Investments Purchased 1,189 500 1,254 —Unrealized Depreciation on Swap Agreements 13 — 1,266 264Premium Received on Open Swap Agreements — — 280 44Payable for Portfolio Shares Redeemed 48 — 201 —Payable for Investment Advisory Fees 57 — 117 —Payable for Offering Cost Fees — 119 — —Payable for Professional Fees 14 12 19 21Payable for Sub Transfer Agency Fees 12 — 52 —@Payable for Administration Fees 4 1 11 2Payable for Trustees’ Fees and Expenses 14 — 4 —Payable for Custodian Fees 1 2 3 3Payable for Transfer Agent Fees 2 1 1 1Payable for Shareholder Servicing Fees — Class P —@ —@ —@ —@Payable for Shareholder Servicing Fees — Class H —@ —@ — —Payable for Distribution and Shareholder Servicing Fees — Class L 2 —@ — —Other Liabilities 4 1 54 9
Total Liabilities 10,811 636 3,262 344Net Assets $ 51,123 $ 10,233 $ 156,248 $ 24,139
Net Assets Consist of:Paid-in-Capital $ 108,969 $ 10,000 $ 412,164 $ 20,785Undistributed Net Investment Income 748 99 499 322Accumulated Net Realized Gain (Loss) (60,246) 27 (258,775) 358Unrealized Appreciation (Depreciation) on:
Investments 1,586 107 2,854 2,735Investments in Affiliates 78 — 20 14Futures Contracts 1 — 23 13Swap Agreements (13) — (537) (88)
Net Assets $ 51,123 $ 10,233 $ 156,248 $ 24,139
2012 Semi-Annual Report
March 31, 2012 (unaudited)

57
Statements of Assets and Liabilities (cont’d)
The accompanying notes are an integral part of the financial statements.
Corporate Limited Long Duration Bond High Yield Duration Fixed Income Portfolio Portfolio Portfolio Portfolio (000) (000) (000) (000)CLASS I:Net Assets $ 46,389 $ 9,927 $ 156,123 $ 23,561Shares Outstanding (unlimited number of shares authorized, no par value)
(not in 000s) 4,429,096 970,000 20,128,383 2,035,437Net Asset Value, Offering and Redemption Price Per Share $ 10.47 $ 10.23 $ 7.76 $ 11.58
CLASS P:Net Assets $ 626 $ 102 $ 125 $ 578Shares Outstanding (unlimited number of shares authorized, no par value)
(not in 000s) 59,820 10,000 16,112 50,000Net Asset Value, Offering and Redemption Price Per Share $ 10.47 $ 10.23 $ 7.76 $ 11.56
CLASS H:Net Assets $ 170 $ 102 $ — $ —Shares Outstanding (unlimited number of shares authorized, no par value)
(not in 000s) 16,275 10,000 — —Net Asset Value, Redemption Price Per Share $ 10.47 $ 10.23 $ — $ —
Maximum Sales Load 3.50% 3.50% — —Maximum Sales Charge $ 0.38 $ 0.37 $ — $ —Maximum Offering Price Per Share $ 10.85 $ 10.60 $ — $ —
CLASS L:Net Assets $ 3,938 $ 102 $ — $ —Shares Outstanding (unlimited number of shares authorized, no par value)
(not in 000s) 376,372 10,000 — —Net Asset Value, Offering and Redemption Price Per Share $ 10.46 $ 10.23 $ — $ —(1) Including:
Securities on Loan, at Value: $ 9,206 $ — $ — $ —
@ Amount is less than $500.
2012 Semi-Annual Report
March 31, 2012 (unaudited)
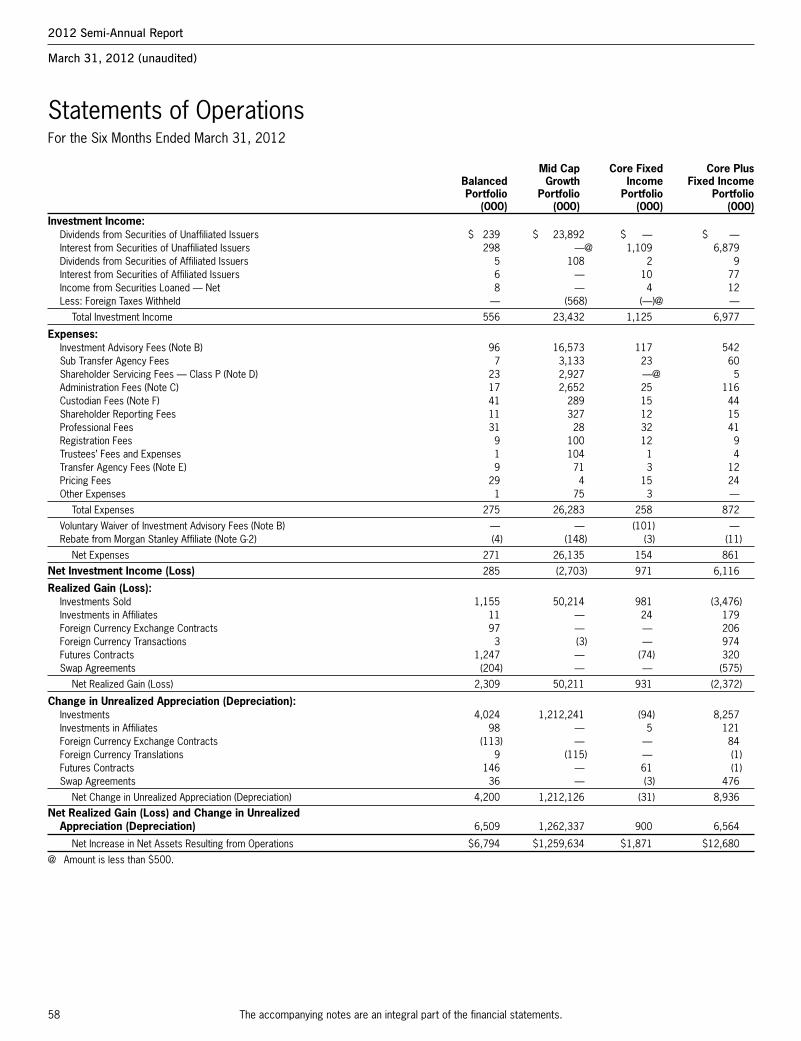
58
Statements of OperationsFor the Six Months Ended March 31, 2012
The accompanying notes are an integral part of the financial statements.
Mid Cap Core Fixed Core Plus Balanced Growth Income Fixed Income Portfolio Portfolio Portfolio Portfolio (000) (000) (000) (000)Investment Income:
Dividends from Securities of Unaffiliated Issuers $ 239 $ 23,892 $ — $ —Interest from Securities of Unaffiliated Issuers 298 —@ 1,109 6,879Dividends from Securities of Affiliated Issuers 5 108 2 9Interest from Securities of Affiliated Issuers 6 — 10 77Income from Securities Loaned — Net 8 — 4 12Less: Foreign Taxes Withheld — (568) (—)@ —
Total Investment Income 556 23,432 1,125 6,977
Expenses:Investment Advisory Fees (Note B) 96 16,573 117 542Sub Transfer Agency Fees 7 3,133 23 60Shareholder Servicing Fees — Class P (Note D) 23 2,927 —@ 5Administration Fees (Note C) 17 2,652 25 116Custodian Fees (Note F) 41 289 15 44Shareholder Reporting Fees 11 327 12 15Professional Fees 31 28 32 41Registration Fees 9 100 12 9Trustees’ Fees and Expenses 1 104 1 4Transfer Agency Fees (Note E) 9 71 3 12Pricing Fees 29 4 15 24Other Expenses 1 75 3 —
Total Expenses 275 26,283 258 872
Voluntary Waiver of Investment Advisory Fees (Note B) — — (101) —Rebate from Morgan Stanley Affiliate (Note G-2) (4) (148) (3) (11)
Net Expenses 271 26,135 154 861
Net Investment Income (Loss) 285 (2,703) 971 6,116
Realized Gain (Loss):Investments Sold 1,155 50,214 981 (3,476)Investments in Affiliates 11 — 24 179Foreign Currency Exchange Contracts 97 — — 206Foreign Currency Transactions 3 (3) — 974Futures Contracts 1,247 — (74) 320Swap Agreements (204) — — (575)
Net Realized Gain (Loss) 2,309 50,211 931 (2,372)
Change in Unrealized Appreciation (Depreciation):Investments 4,024 1,212,241 (94) 8,257Investments in Affiliates 98 — 5 121Foreign Currency Exchange Contracts (113) — — 84Foreign Currency Translations 9 (115) — (1)Futures Contracts 146 — 61 (1)Swap Agreements 36 — (3) 476
Net Change in Unrealized Appreciation (Depreciation) 4,200 1,212,126 (31) 8,936
Net Realized Gain (Loss) and Change in Unrealized Appreciation (Depreciation) 6,509 1,262,337 900 6,564
Net Increase in Net Assets Resulting from Operations $6,794 $1,259,634 $1,871 $12,680
@ Amount is less than $500.
2012 Semi-Annual Report
March 31, 2012 (unaudited)

59
Statements of OperationsFor the Six Months Ended March 31, 2012
The accompanying notes are an integral part of the financial statements.
Corporate Limited Long Duration Bond High Yield Duration Fixed Income Portfolio Portfolio* Portfolio Portfolio (000) (000) (000) (000)Investment Income:
Interest from Securities of Unaffiliated Issuers $ 1,385 $110 $2,077 $ 543Interest from Securities of Affiliated Issuers 31 — 46 8Income from Securities Loaned — Net 5 — — —Dividends from Securities of Affiliated Issuers 1 —@ 2 —@Less: Foreign Taxes Withheld (—)@ — (1) (—)@
Total Investment Income 1,422 110 2,124 551
Expenses:Investment Advisory Fees (Note B) 120 9 241 45Administration Fees (Note C) 26 1 64 10Professional Fees 28 12 27 26Sub Transfer Agency Fees 10 — 48 1Custodian Fees (Note F) 17 2 14 11Pricing Fees 15 1 11 13Shareholder Reporting Fees 8 —@ 31 —@Registration Fees 11 — 10 15Transfer Agency Fees (Note E) 8 2 4 3Offering Costs — 15 — —Shareholder Servicing Fees — Class P (Note D) 1 —@ —@ 1Shareholder Servicing Fees — Class H (Note D) —@ —@ — —Distribution and Shareholder Servicing Fees — Class L (Note D) 10 —@ — —Trustees’ Fees and Expenses 1 — 2 —@Other Expenses 1 — 2 2
Total Expenses 256 42 454 127
Voluntary Waiver of Shareholder Servicing Fees — Class P (Note D) (—)@ — — —Voluntary Waiver of Investment Advisory Fees (Note B) — (9) — (45)Expenses Reimbursed by Advisor (Note B) — (22) — (21)Rebate from Morgan Stanley Affiliate (Note G-2) (2) (—)@ (2) (—)@
Net Expenses 254 11 452 61
Net Investment Income 1,168 99 1,672 490
Realized Gain (Loss):Investments Sold 2,387 27 (46) 551Investments in Affiliates 153 — 46 —Foreign Currency Exchange Contracts — — — (4)Foreign Currency Transactions — — — (—)@Futures Contracts (85) — (110) 15Swap Agreements — — — (41)
Net Realized Gain (Loss) 2,455 27 (110) 521
Change in Unrealized Appreciation (Depreciation):Investments (975) 107 1,320 (834)Investments in Affiliates (97) — (16) 15Foreign Currency Exchange Contracts — — — 4Foreign Currency Translations — — — 1Futures Contracts 80 — 40 (11)Swap Agreements (13) — (9) 29
Net Change in Unrealized Appreciation (Depreciation) (1,005) 107 1,335 (796)
Net Realized Gain (Loss) and Change in Unrealized Appreciation (Depreciation) 1,450 134 1,225 (275)
Net Increase in Net Assets Resulting from Operations $ 2,618 $233 $2,897 $ 215
@ Amount is less than $500.* Commencement of Operations February 7, 2012.
2012 Semi-Annual Report
March 31, 2012 (unaudited)

60
Statements of Changes in Net Assets
The accompanying notes are an integral part of the financial statements.
Balanced Mid Cap Growth Portfolio Portfolio
Six Months Six Months Ended Year Ended Ended Year Ended March 31, 2012 September 30, March 31, 2012 September 30, (unaudited) 2011 (unaudited) 2011 (000) (000) (000) (000)Increase (Decrease) in Net Assets:Operations:
Net Investment Income (Loss) $ 285 $ 589 $ (2,703) $ (2,342)Net Realized Gain 2,309 4,315 50,211 658,813Net Change in Unrealized Appreciation (Depreciation) 4,200 (4,228) 1,212,126 (763,740)Net Increase (Decrease) in Net Assets Resulting from Operations 6,794 676 1,259,634 (107,269)
Distributions from and/or in Excess of:Class I:Net Investment Income (221) (410) — (9,653)Net Realized Gain — — (211,942) —Investment Class:Net Investment Income — (41)* — —Class P:Net Investment Income (126) (234) — (2,780)Net Realized Gain — — (135,932) —Total Distributions (347) (685) (347,874) (12,433)
Capital Share Transactions:(1)
Class I:Subscribed 313 1,198 607,585 1,490,614Distributions Reinvested 221 406 199,699 8,865Conversion from Investment Class — 5,798 — —Redeemed (8,231) (4,609) (360,937) (614,738)Investment Class:Subscribed — 168* — —Distributions Reinvested — 41* — —Conversion to Class I — (5,798) — —Redeemed — (73)* — —Class P:Subscribed 794 1,375 142,678 1,017,179Distributions Reinvested 126 234 110,582 2,751Redeemed (749) (1,852) (943,673) (869,991)Net Increase (Decrease) in Net Assets Resulting from Capital Share Transactions (7,526) (3,112) (244,066) 1,034,680Total Increase (Decrease) in Net Assets (1,079) (3,121) 667,694 914,978
Net Assets:Beginning of Period 42,049 45,170 6,392,536 5,477,558End of Period $40,970 $42,049 $7,060,230 $6,392,536Undistributed (Distribution in Excess of) Net Investment Income Included in
End of Period Net Assets $ 266 $ 328 $ (3,611) $ (908)
(1) Capital Share Transactions:Class I:Shares Subscribed 23 92 16,956 38,900Shares Issued on Distributions Reinvested 17 30 6,154 238Conversion from Investment Class — 432 — —Shares Redeemed (597) (348) (10,157) (16,008)Net Increase (Decrease) in Class I Shares Outstanding (557) 206 12,953 23,130Investment Class:Shares Subscribed — 13* — —Shares Issued on Distributions Reinvested — 3* — —Conversion to Class I — (433) — —Shares Redeemed — (5)* — —Net Decrease in Investment Class Shares Outstanding — (422) — —Class P:Shares Subscribed 57 104 4,126 27,862Shares Issued on Distributions Reinvested 10 18 3,531 76Shares Redeemed (55) (141) (28,723) (24,055)Net Increase (Decrease) in Class P Shares Outstanding 12 (19) (21,066) 3,883
* For the period October 1, 2010 through March 22, 2011.
2012 Semi-Annual Report
March 31, 2012

61
Statements of Changes in Net Assets
The accompanying notes are an integral part of the financial statements.
Core Fixed Income Core Plus Fixed Income Portfolio Portfolio
Six Months Six Months Ended Year Ended Ended Year Ended March 31, 2012 September 30, March 31, 2012 September 30, (unaudited) 2011 (unaudited) 2011 (000) (000) (000) (000)Increase (Decrease) in Net Assets:Operations:
Net Investment Income $ 971 $ 2,374 $ 6,116 $ 14,267Net Realized Gain (Loss) 931 1,877 (2,372) 20,947Net Change in Unrealized Appreciation (Depreciation) (31) (1,423) 8,936 (23,167)
Net Increase in Net Assets Resulting from Operations 1,871 2,828 12,680 12,047
Distributions from and/or in Excess of:Class I:Net Investment Income (1,188) (2,131) (6,502) (15,254)Investment Class:Net Investment Income — — — (898)*Class P:Net Investment Income (1) (4) (94) (206)
Total Distributions (1,189) (2,135) (6,596) (16,358)
Capital Share Transactions:(1)
Class I:Subscribed 816 2,966 16,481 42,742Distributions Reinvested 1,188 2,131 6,481 15,228Conversion from Investment Class — — — 94Redeemed (6,259) (17,577) (60,108) (193,906)Investment Class:Conversion to Class I — — — (94)Redeemed — — — (92,182)*Class P:Subscribed 90 6 409 1,120Distributions Reinvested 1 4 94 206Redeemed (10) (173) (1,364) (2,394)
Net Decrease in Net Assets Resulting from Capital Share Transactions (4,174) (12,643) (38,007) (229,186)
Total Decrease in Net Assets (3,492) (11,950) (31,923) (233,497)Net Assets:
Beginning of Period 63,910 75,860 299,880 533,377
End of Period $60,418 $ 63,910 $267,957 $ 299,880
Undistributed Net Investment Income Included in End of Period Net Assets $ 758 $ 976 $ 5,935 $ 6,415
(1) Capital Share Transactions:Class I:Shares Subscribed 81 302 1,652 4,346Shares Issued on Distributions Reinvested 119 217 661 1,559Conversion from Investment Class — — — 10Shares Redeemed (621) (1,778) (6,019) (19,801)
Net Decrease in Class I Shares Outstanding (421) (1,259) (3,706) (13,886)
Investment Class:Conversion to Class I — — — (9)Shares Redeemed — — — (9,331)*
Net Decrease in Investment Class Shares Outstanding — — — (9,340)
Class P:Shares Subscribed 9 1 41 114Shares Issued on Distributions Reinvested —@@ —@@ 9 21Shares Redeemed (1) (18) (137) (242)
Net Increase (Decrease) in Class P Shares Outstanding 8 (17) (87) (107)
* For the period October 1, 2010 through March 14, 2011.@@ Amount is less than 500 shares.
2012 Semi-Annual Report
March 31, 2012

62
Statements of Changes in Net Assets
The accompanying notes are an integral part of the financial statements.
Corporate Bond High Yield Portfolio Portfolio
Period from February 7, Six Months 2012^ to Ended Year Ended March 31, March 31, 2012 September 30, 2012 (unaudited) 2011 (unaudited) (000) (000) (000)Increase (Decrease) in Net Assets:Operations:
Net Investment Income $ 1,168 $ 2,508 $ 99Net Realized Gain 2,455 2,094 27Net Change in Unrealized Appreciation (Depreciation) (1,005) (1,640) 107
Net Increase in Net Assets Resulting from Operations 2,618 2,962 233
Distributions from and/or in Excess of:Class I:Net Investment Income (1,252) (2,195) —Class P:Net Investment Income (8) (14) —Class H:Net Investment Income (5) (5) —Class L:Net Investment Income (71) (119) —
Total Distributions (1,336) (2,333) —
Capital Share Transactions:(1)
Class I:Subscribed 928 4,447 9,700Distributions Reinvested 1,251 2,100 —Redeemed (19,400) (24,083) —Class P:Subscribed 281 10 100Distributions Reinvested 8 14 —Redeemed (79) (207) —Class H:Subscribed — 301 100Distributions Reinvested 4 2 —Redeemed (308) (1) —Class L:Subscribed 19 266 100Distributions Reinvested 71 115 —Redeemed (305) (1,827) —
Net Increase (Decrease) in Net Assets Resulting from Capital Share Transactions (17,530) (18,863) 10,000
Total Increase (Decrease) in Net Assets (16,248) (18,234) 10,233Net Assets:
Beginning of Period 67,371 85,605 —
End of Period $ 51,123 $ 67,371 $10,233
Undistributed Net Investment Income Included in End of Period Net Assets $ 748 $ 916 $ 99
2012 Semi-Annual Report
March 31, 2012

63
Statements of Changes in Net Assets (cont’d)
The accompanying notes are an integral part of the financial statements.
Corporate Bond High Yield Portfolio Portfolio
Period from February 7, Six Months 2012^ to Ended Year Ended March 31, March 31, 2012 September 30, 2012 (unaudited) 2011 (unaudited) (000) (000) (000)(1) Capital Share Transactions:
Class I:Shares Subscribed 90 443 970Shares Issued on Distributions Reinvested 123 210 —Shares Redeemed (1,858) (2,383) —
Net Increase (Decrease) in Class I Shares Outstanding (1,645) (1,730) 970
Class P:Shares Subscribed 27 1 10Shares Issued on Distributions Reinvested 1 1 —Shares Redeemed (8) (20) —
Net Increase (Decrease) in Class P Shares Outstanding 20 (18) 10
Class H:Shares Subscribed — 29 10Shares Issued on Distributions Reinvested —@@ —@@ —Shares Redeemed (30) (—)@@ —
Net Increase (Decrease) in Class H Shares Outstanding (30) 29 10
Class L:Shares Subscribed 1 27 10Shares Issued on Distributions Reinvested 7 12 —Shares Redeemed (29) (183) —
Net Increase (Decrease) in Class L Shares Outstanding (21) (144) 10
^ Commencement of Operations.@@ Amount is less than 500 shares.
2012 Semi-Annual Report
March 31, 2012

64
Statements of Changes in Net Assets
The accompanying notes are an integral part of the financial statements.
Limited Duration Long Duration Fixed Income Portfolio Portfolio
Six Months Six Months Ended Year Ended Ended Year Ended March 31, 2012 September 30, March 31, 2012 September 30, (unaudited) 2011 (unaudited) 2011 (000) (000) (000) (000)Increase (Decrease) in Net Assets:Operations:
Net Investment Income $ 1,672 $ 3,987 $ 490 $ 1,179Net Realized Gain (Loss) (110) (157) 521 450Net Change in Unrealized Appreciation (Depreciation) 1,335 (2,438) (796) 226
Net Increase in Net Assets Resulting from Operations 2,897 1,392 215 1,855
Distributions from and/or in Excess of:Class I:Net Investment Income (1,993) (3,268) (494) (1,088)Net Realized Gain — — (364) (1,496)Class P:Net Investment Income (2) (2) (12) (22)Net Realized Gain — — (9) (27)
Total Distributions (1,995) (3,270) (879) (2,633)
Capital Share Transactions:(1)
Class I:Subscribed 4,597 11,161 791 221Distributions Reinvested 1,992 3,267 2 236Redeemed (19,178) (53,349) (244) (8,365)Class P:Subscribed 40 250 — —Distributions Reinvested 2 2 — —Redeemed (112) (108) — —
Net Increase (Decrease) in Net Assets Resulting from Capital Share Transactions (12,659) (38,777) 549 (7,908)
Total Decrease in Net Assets (11,757) (40,655) (115) (8,686)Net Assets:
Beginning of Period 168,005 208,660 24,254 32,940
End of Period $156,248 $168,005 $24,139 $24,254
Undistributed Net Investment Income Included in End of Period Net Assets $ 499 $ 822 $ 322 $ 338
(1) Capital Share Transactions:Class I:Shares Subscribed 594 1,439 67 19Shares Issued on Distributions Reinvested 259 421 —@@ 23Shares Redeemed (2,488) (6,875) (21) (811)
Net Increase (Decrease) in Class I Shares Outstanding (1,635) (5,015) 46 (769)
Class P:Shares Subscribed 5 32 — —Shares Issued on Distributions Reinvested —@@ —@@ — —Shares Redeemed (14) (14) — —
Net Increase (Decrease) in Class P Shares Outstanding (9) 18 — —
@@ Amount is less than 500 shares.
2012 Semi-Annual Report
March 31, 2012

65
Financial HighlightsBalanced Portfolio
The accompanying notes are an integral part of the financial statements.
Class I
Six Months Ended March 31, 2012 Year Ended September 30,
Selected Per Share Data and Ratios (unaudited) 2011 2010 2009 2008 2007Net Asset Value, Beginning of Period $ 12.50 $ 12.55 $ 11.66 $ 11.87 $ 14.69 $ 12.63
Income (Loss) from Investment Operations:Net Investment Income† 0.10 0.18 0.21 0.16 0.38 0.32Net Realized and Unrealized Gain (Loss) 2.05 (0.02) 0.91 0.17 (2.84) 2.00
Total from Investment Operations 2.15 0.16 1.12 0.33 (2.46) 2.32
Distributions from and/or in Excess of:Net Investment Income (0.11) (0.21) (0.23) (0.54) (0.36) (0.26)
Redemption Fees — — — 0.00‡ 0.00‡ 0.00‡
Net Asset Value, End of Period $ 14.54 $ 12.50 $ 12.55 $ 11.66 $ 11.87 $ 14.69
Total Return++ 17.32%# 1.07% 9.77% 3.45%** (17.02)% 18.57%
Ratios and Supplemental Data:Net Assets, End of Period (Thousands) $21,196 $25,192 $22,706 $45,567 $40,799 $310,886Ratio of Expenses to Average Net Assets (1) 1.16%*+†† 1.30%+†† 0.89%+†† 0.67%+ 0.57%+ 0.61%+Ratio of Net Investment Income to Average Net Assets (1) 1.44%*+†† 1.35%+†† 1.73%+†† 1.56%+ 2.66%+ 2.35%+Ratio of Rebate from Morgan Stanley Affiliates to
Average Net Assets 0.02%* 0.01% 0.01% 0.04% 0.05% 0.00%§Portfolio Turnover Rate 58%# 164% 176% 171% 148% 60%(1) Supplemental Information on the Ratios to
Average Net Assets:Ratios Before Expense Limitation:
Expenses to Average Net Assets N/A N/A N/A N/A 0.58%+ N/ANet Investment Income to Average Net Assets N/A N/A N/A N/A 2.65%+ N/A
† Per share amount is based on average shares outstanding.‡ Amount is less than $0.005 per share.++ Calculated based on the net asset value as of the last business day of the period.# Not Annualized.** Performance was positively impacted by approximately 0.79% due to the receipt of proceeds from the settlements of class action suits involving primarily two of the
Portfolio’s past holdings. This was a one-time settlement, and as a result, the impact on the NAV and consequently the performance will not likely be repeated in thefuture. Had these settlements not occurred, the total return for Class I shares would have been approximately 2.66%.
* Annualized.+ The Ratios of Expenses and Net Investment Income reflect the rebate of certain Portfolio expenses in connection with the investments in Morgan Stanley affiliates
during the period. The effect of the rebate on the ratios is disclosed in the above table as “Ratio of Rebate from Morgan Stanley Affiliates to Average Net Assets.”†† Reflects overall Portfolio ratios for investment income and non-class specific expenses.§ Amount is less than 0.005%.
2012 Semi-Annual Report
March 31, 2012
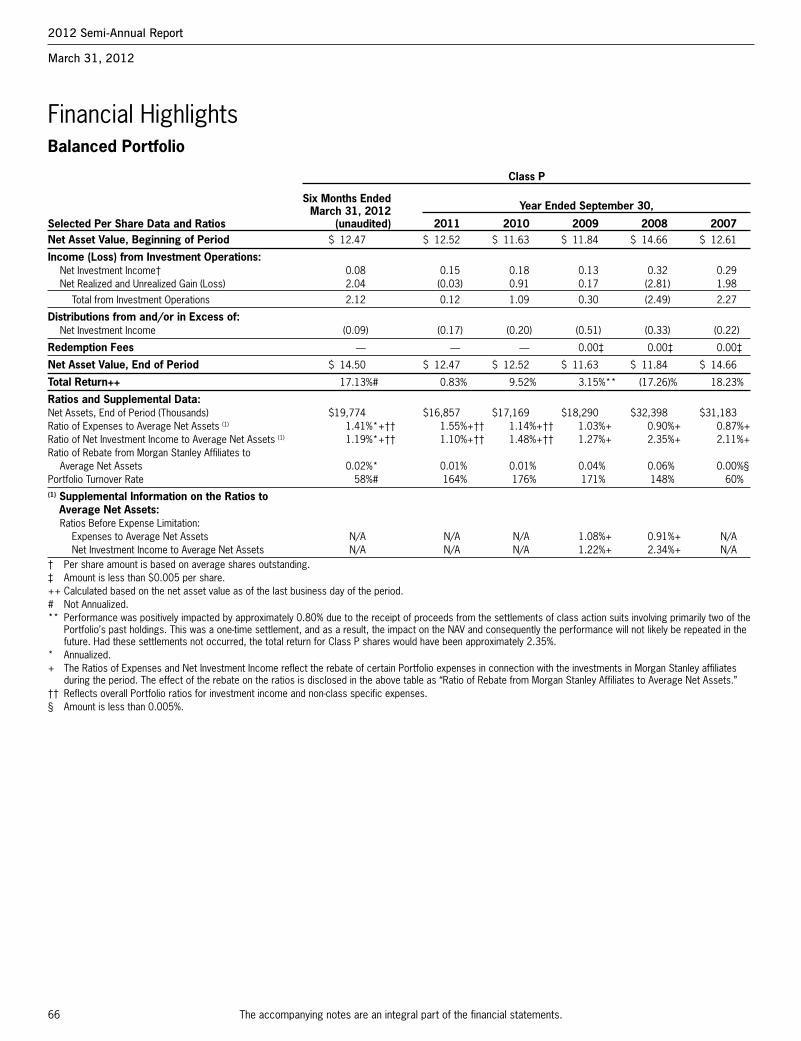
66
Financial HighlightsBalanced Portfolio
The accompanying notes are an integral part of the financial statements.
Class P
Six Months EndedMarch 31, 2012 Year Ended September 30,
Selected Per Share Data and Ratios (unaudited) 2011 2010 2009 2008 2007Net Asset Value, Beginning of Period $ 12.47 $ 12.52 $ 11.63 $ 11.84 $ 14.66 $ 12.61
Income (Loss) from Investment Operations:Net Investment Income† 0.08 0.15 0.18 0.13 0.32 0.29Net Realized and Unrealized Gain (Loss) 2.04 (0.03) 0.91 0.17 (2.81) 1.98
Total from Investment Operations 2.12 0.12 1.09 0.30 (2.49) 2.27
Distributions from and/or in Excess of:Net Investment Income (0.09) (0.17) (0.20) (0.51) (0.33) (0.22)
Redemption Fees — — — 0.00‡ 0.00‡ 0.00‡
Net Asset Value, End of Period $ 14.50 $ 12.47 $ 12.52 $ 11.63 $ 11.84 $ 14.66
Total Return++ 17.13%# 0.83% 9.52% 3.15%** (17.26)% 18.23%
Ratios and Supplemental Data:Net Assets, End of Period (Thousands) $19,774 $16,857 $17,169 $18,290 $32,398 $31,183Ratio of Expenses to Average Net Assets (1) 1.41%*+†† 1.55%+†† 1.14%+†† 1.03%+ 0.90%+ 0.87%+Ratio of Net Investment Income to Average Net Assets (1) 1.19%*+†† 1.10%+†† 1.48%+†† 1.27%+ 2.35%+ 2.11%+Ratio of Rebate from Morgan Stanley Affiliates to
Average Net Assets 0.02%* 0.01% 0.01% 0.04% 0.06% 0.00%§Portfolio Turnover Rate 58%# 164% 176% 171% 148% 60%(1) Supplemental Information on the Ratios to
Average Net Assets:Ratios Before Expense Limitation:
Expenses to Average Net Assets N/A N/A N/A 1.08%+ 0.91%+ N/ANet Investment Income to Average Net Assets N/A N/A N/A 1.22%+ 2.34%+ N/A
† Per share amount is based on average shares outstanding.‡ Amount is less than $0.005 per share.++ Calculated based on the net asset value as of the last business day of the period.# Not Annualized.** Performance was positively impacted by approximately 0.80% due to the receipt of proceeds from the settlements of class action suits involving primarily two of the
Portfolio’s past holdings. This was a one-time settlement, and as a result, the impact on the NAV and consequently the performance will not likely be repeated in thefuture. Had these settlements not occurred, the total return for Class P shares would have been approximately 2.35%.
* Annualized.+ The Ratios of Expenses and Net Investment Income reflect the rebate of certain Portfolio expenses in connection with the investments in Morgan Stanley affiliates
during the period. The effect of the rebate on the ratios is disclosed in the above table as “Ratio of Rebate from Morgan Stanley Affiliates to Average Net Assets.”†† Reflects overall Portfolio ratios for investment income and non-class specific expenses.§ Amount is less than 0.005%.
2012 Semi-Annual Report
March 31, 2012

67
Financial HighlightsMid Cap Growth Portfolio
The accompanying notes are an integral part of the financial statements.
Class I
Six Months EndedMarch 31, 2012 Year Ended September 30,
Selected Per Share Data and Ratios (unaudited) 2011 2010 2009 2008 2007Net Asset Value, Beginning of Period $ 33.65 $ 33.58 $ 26.96 $ 23.99 $ 33.68 $ 25.21
Income (Loss) from Investment Operations:Net Investment Income† 0.00‡ 0.03 0.11 0.03 0.05^^ 0.17Net Realized and Unrealized Gain (Loss) 6.90 0.14 6.52 2.94 (9.58) 8.42
Total from Investment Operations 6.90 0.17 6.63 2.97 (9.53) 8.59
Distributions from and/or in Excess of:Net Investment Income — (0.10) (0.01) — (0.16) (0.12)Net Realized Gain (1.83) — — — — —
Total Distributions (1.83) (0.10) (0.01) — (0.16) (0.12)
Redemption Fees — — — 0.00‡ 0.00‡ 0.00‡
Net Asset Value, End of Period $ 38.72 $ 33.65 $ 33.58 $ 26.96 $ 23.99 $ 33.68
Total Return++ 21.55%# 0.47% 24.58% 12.38%** (28.42)%^^ 34.24%
Ratios and Supplemental Data:Net Assets, End of Period (Thousands) $4,870,199 $3,797,139 $3,012,006 $2,005,809 $1,609,506 $1,647,326Ratio of Expenses to Average Net Assets 0.70%*+†† 0.69%+†† 0.68%+†† 0.69%+ 0.63%+ 0.63%+Ratio of Net Investment Income to Average
Net Assets 0.01%*+†† 0.07%+†† 0.38%+†† 0.16%+ 0.17%+ 0.57%+Ratio of Rebate from Morgan Stanley Affiliates to
Average Net Assets 0.00%*§ 0.01% 0.01% 0.01% 0.00%§ 0.00%§Portfolio Turnover Rate 9%# 35% 23% 27% 37% 64%† Per share amount is based on average shares outstanding.‡ Amount is less than $0.005 per share.^^ During the year, the Portfolio received a regulatory settlement from an unaffiliated third party, which had an impact of less than $0.005 on net investment income per
share and less than 0.005% on total returns for Class I.++ Calculated based on the net asset value as of the last business day of the period.# Not Annualized.** Performance was positively impacted by approximately 0.04% due to the receipt of proceeds from the settlements of class action suits involving primarily two of the
Portfolio’s past holdings. This was a one-time settlement, and as a result, the impact on the NAV and consequently the performance will not likely be repeated in thefuture. Had these settlements not occurred, the total return for Class I shares would have been approximately 12.34%.
* Annualized.+ The Ratios of Expenses and Net Investment Income reflect the rebate of certain Portfolio expenses in connection with the investments in Morgan Stanley affiliates
during the period. The effect of the rebate on the ratios is disclosed in the above table as “Ratio of Rebate from Morgan Stanley Affiliates to Average Net Assets.”†† Reflects overall Portfolio ratios for investment income and non-class specific expenses.§ Amount is less than 0.005%.
2012 Semi-Annual Report
March 31, 2012

68
Financial HighlightsMid Cap Growth Portfolio
The accompanying notes are an integral part of the financial statements.
Class P
Six Months Ended March 31, 2012 Year Ended September 30,
Selected Per Share Data and Ratios (unaudited) 2011 2010 2009 2008 2007Net Asset Value, Beginning of Period $ 32.55 $ 32.51 $ 26.15 $ 23.33 $ 32.78 $ 24.54
Income (Loss) from Investment Operations:Net Investment Income (Loss)† (0.04) (0.07) 0.04 (0.02) (0.02)^^ 0.09Net Realized and Unrealized Gain (Loss) 6.65 0.15 6.32 2.84 (9.34) 8.20
Total from Investment Operations 6.61 0.08 6.36 2.82 (9.36) 8.29
Distributions from and/or in Excess of:Net Investment Income — (0.04) — — (0.09) (0.05)Net Realized Gain (1.83) — — — — —
Total Distributions (1.83) (0.04) — — (0.09) (0.05)
Redemption Fees — — — 0.00‡ 0.00‡ 0.00‡
Net Asset Value, End of Period $ 37.33 $ 32.55 $ 32.51 $ 26.15 $ 23.33 $ 32.78
Total Return++ 21.38%# 0.22% 24.32% 12.04%** (28.59)%^^ 33.89%
Ratios and Supplemental Data:Net Assets, End of Period (Thousands) $2,190,031 $2,595,397 $2,465,552 $1,567,302 $1,236,945 $1,520,096Ratio of Expenses to Average Net Assets (1) 0.95%*+†† 0.94%+†† 0.93%+†† 0.96%+ 0.88%+ 0.88%+Ratio of Net Investment Income (Loss) to Average
Net Assets (1) (0.24)%*+†† (0.18)%+†† 0.13%+†† (0.11)%+ (0.07)%+ 0.31%+Ratio of Rebate from Morgan Stanley Affiliates to
Average Net Assets 0.00%*§ 0.01% 0.01% 0.01% 0.00%§ 0.00%§Portfolio Turnover Rate 9%# 35% 23% 27% 37% 64%(1) Supplemental Information on the Ratios
to Average Net Assets:Ratios Before Expense Limitation:
Expenses to Average Net Assets N/A N/A N/A N/A 0.89%+ N/ANet Investment Loss to Average Net Assets N/A N/A N/A N/A (0.08)%+ N/A
† Per share amount is based on average shares outstanding.^^ During the year, the Portfolio received a regulatory settlement from an unaffiliated third party, which had an impact of less than $0.005 on net investment income per
share and less than 0.005% on total returns for Class P.‡ Amount is less than $0.005 per share.++ Calculated based on the net asset value as of the last business day of the period.# Not Annualized.** Performance was positively impacted by approximately 0.04% due to the receipt of proceeds from the settlements of class action suits involving primarily two of the
Portfolio’s past holdings. This was a one-time settlement, and as a result, the impact on the NAV and consequently the performance will not likely be repeated in thefuture. Had these settlements not occurred, the total return for Class P shares would have been approximately 12.00%.
* Annualized.+ The Ratios of Expenses and Net Investment Income (Loss) reflect the rebate of certain Portfolio expenses in connection with the investments in Morgan Stanley
affiliates during the period. The effect of the rebate on the ratios is disclosed in the above table as “Ratio of Rebate from Morgan Stanley Affiliates to Average NetAssets.”
†† Reflects overall Portfolio ratios for investment income and non-class specific expenses.§ Amount is less than 0.005%.
2012 Semi-Annual Report
March 31, 2012

69
Financial HighlightsCore Fixed Income Portfolio
The accompanying notes are an integral part of the financial statements.
Class I
Six Months Ended March 31, 2012 Year Ended September 30,
Selected Per Share Data and Ratios (unaudited) 2011 2010 2009 2008 2007Net Asset Value, Beginning of Period $ 10.08 $ 9.96 $ 9.49 $ 9.18 $ 10.77 $ 10.80
Income (Loss) from Investment Operations:Net Investment Income† 0.16 0.34 0.34 0.34 0.53 0.52Net Realized and Unrealized Gain (Loss) 0.15 0.08 0.45 0.57 (1.60) (0.02)
Total from Investment Operations 0.31 0.42 0.79 0.91 (1.07) 0.50
Distributions from and/or in Excess of:Net Investment Income (0.19) (0.30) (0.32) (0.60) (0.52) (0.53)
Redemption Fees — — — 0.00‡ 0.00‡ 0.00‡
Net Asset Value, End of Period $ 10.20 $ 10.08 $ 9.96 $ 9.49 $ 9.18 $ 10.77
Total Return++ 3.12%# 4.34% 8.57% 10.41% (10.40)% 4.76%
Ratios and Supplemental Data:Net Assets, End of Period (Thousands) $60,292 $63,866 $75,651 $93,768 $186,305 $308,111Ratio of Expenses to Average Net Assets (1) 0.49%*+†† 0.50%+†† 0.50%+†† 0.50%+ 0.49%+ 0.49%+Ratio of Net Investment Income to Average Net Assets (1) 3.13%*+†† 3.43%+†† 3.58%+†† 3.73%+ 5.11%+ 4.83%+Ratio of Rebate from Morgan Stanley Affiliates to
Average Net Assets 0.01%* 0.00%§ 0.00%§ 0.01% 0.01% 0.01%Portfolio Turnover Rate 102%# 234% 261% 437% 306% 107%(1) Supplemental Information on the Ratios to
Average Net Assets:Ratios Before Expense Limitation:
Expenses to Average Net Assets 0.83%*†† 0.99%†† 0.67%+†† 0.61%+ 0.53%+ 0.54%+Net Investment Income to Average Net Assets 2.79%*†† 2.94%†† 3.41%+†† 3.62%+ 5.07%+ 4.78%+
† Per share amount is based on average shares outstanding.‡ Amount is less than $0.005 per share.++ Calculated based on the net asset value as of the last business day of the period.# Not Annualized.* Annualized.+ The Ratios of Expenses and Net Investment Income reflect the rebate of certain Portfolio expenses in connection with the investments in Morgan Stanley affiliates
during the period. The effect of the rebate on the ratios is disclosed in the above table as “Ratio of Rebate from Morgan Stanley Affiliates to Average Net Assets.”†† Reflects overall Portfolio ratios for investment income and non-class specific expenses.§ Amount is less than 0.005%.
2012 Semi-Annual Report
March 31, 2012

70
Financial HighlightsCore Fixed Income Portfolio
The accompanying notes are an integral part of the financial statements.
Class P
Six Months EndedMarch 31, 2012 Year Ended September 30,
Selected Per Share Data and Ratios (unaudited) 2011 2010 2009 2008 2007Net Asset Value, Beginning of Period $10.14 $10.01 $ 9.53 $ 9.12 $ 10.71 $ 10.74
Income (Loss) from Investment Operations:Net Investment Income† 0.15 0.31 0.32 0.31 0.50 0.49Net Realized and Unrealized Gain (Loss) 0.15 0.09 0.46 0.58 (1.60) (0.02)
Total from Investment Operations 0.30 0.40 0.78 0.89 (1.10) 0.47
Distributions from and/or in Excess of:Net Investment Income (0.18) (0.27) (0.30) (0.48) (0.49) (0.50)
Redemption Fees — — — 0.00‡ 0.00‡ 0.00‡
Net Asset Value, End of Period $10.26 $10.14 $10.01 $ 9.53 $ 9.12 $ 10.71
Total Return++ 2.97%# 4.11% 8.47% 10.10% (10.68)% 4.53%
Ratios and Supplemental Data:Net Assets, End of Period (Thousands) $ 126 $ 44 $ 209 $ 214 $ 487 $11,805Ratio of Expenses to Average Net Assets (1) 0.74%*+†† 0.75%+†† 0.75%+†† 0.75%+ 0.74%+ 0.74%+Ratio of Net Investment Income to Average Net Assets (1) 2.88%*+†† 3.18%+†† 3.33%+†† 3.48%+ 4.87%+ 4.58%+Ratio of Rebate from Morgan Stanley Affiliates to Average
Net Assets 0.01%* 0.00%§ 0.00%§ 0.01% 0.01% 0.01%Portfolio Turnover Rate 102%# 234% 261% 437% 306% 107%(1) Supplemental Information on the Ratios to
Average Net Assets:Ratios Before Expense Limitation:
Expenses to Average Net Assets 1.08%*†† 1.24%†† 0.92%+†† 0.86%+ 0.78%+ 0.79%+Net Investment Income to Average Net Assets 2.54%*†† 2.69%†† 3.16%+†† 3.37%+ 4.84%+ 4.54%+
† Per share amount is based on average shares outstanding.‡ Amount is less than $0.005 per share.++ Calculated based on the net asset value as of the last business day of the period.# Not Annualized.* Annualized.+ The Ratios of Expenses and Net Investment Income reflect the rebate of certain Portfolio expenses in connection with the investments in Morgan Stanley affiliates
during the period. The effect of the rebate on the ratios is disclosed in the above table as “Ratio of Rebate from Morgan Stanley Affiliates to Average Net Assets.”†† Reflects overall Portfolio ratios for investment income and non-class specific expenses.§ Amount is less than 0.005%.
2012 Semi-Annual Report
March 31, 2012
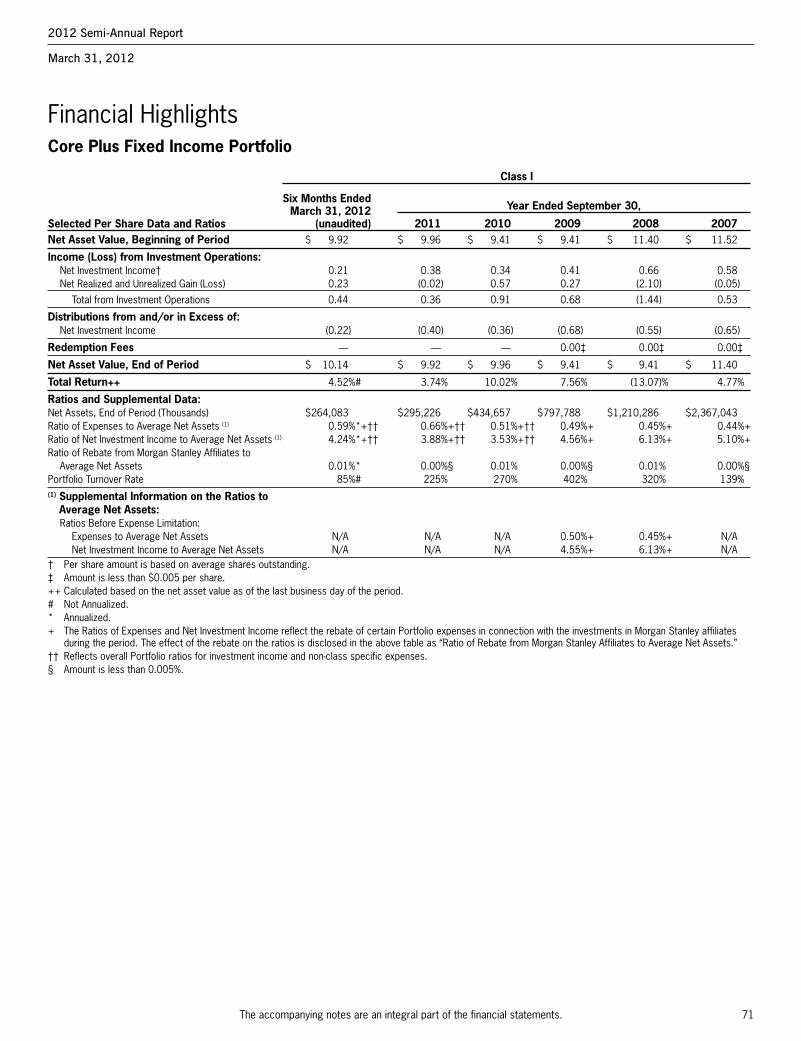
71
Financial HighlightsCore Plus Fixed Income Portfolio
The accompanying notes are an integral part of the financial statements.
Class I
Six Months Ended March 31, 2012 Year Ended September 30,
Selected Per Share Data and Ratios (unaudited) 2011 2010 2009 2008 2007Net Asset Value, Beginning of Period $ 9.92 $ 9.96 $ 9.41 $ 9.41 $ 11.40 $ 11.52
Income (Loss) from Investment Operations:Net Investment Income† 0.21 0.38 0.34 0.41 0.66 0.58Net Realized and Unrealized Gain (Loss) 0.23 (0.02) 0.57 0.27 (2.10) (0.05)
Total from Investment Operations 0.44 0.36 0.91 0.68 (1.44) 0.53
Distributions from and/or in Excess of:Net Investment Income (0.22) (0.40) (0.36) (0.68) (0.55) (0.65)
Redemption Fees — — — 0.00‡ 0.00‡ 0.00‡
Net Asset Value, End of Period $ 10.14 $ 9.92 $ 9.96 $ 9.41 $ 9.41 $ 11.40
Total Return++ 4.52%# 3.74% 10.02% 7.56% (13.07)% 4.77%
Ratios and Supplemental Data:Net Assets, End of Period (Thousands) $264,083 $295,226 $434,657 $797,788 $1,210,286 $2,367,043Ratio of Expenses to Average Net Assets (1) 0.59%*+†† 0.66%+†† 0.51%+†† 0.49%+ 0.45%+ 0.44%+Ratio of Net Investment Income to Average Net Assets (1) 4.24%*+†† 3.88%+†† 3.53%+†† 4.56%+ 6.13%+ 5.10%+Ratio of Rebate from Morgan Stanley Affiliates to
Average Net Assets 0.01%* 0.00%§ 0.01% 0.00%§ 0.01% 0.00%§Portfolio Turnover Rate 85%# 225% 270% 402% 320% 139%(1) Supplemental Information on the Ratios to
Average Net Assets:Ratios Before Expense Limitation:
Expenses to Average Net Assets N/A N/A N/A 0.50%+ 0.45%+ N/ANet Investment Income to Average Net Assets N/A N/A N/A 4.55%+ 6.13%+ N/A
† Per share amount is based on average shares outstanding.‡ Amount is less than $0.005 per share.++ Calculated based on the net asset value as of the last business day of the period.# Not Annualized.* Annualized.+ The Ratios of Expenses and Net Investment Income reflect the rebate of certain Portfolio expenses in connection with the investments in Morgan Stanley affiliates
during the period. The effect of the rebate on the ratios is disclosed in the above table as “Ratio of Rebate from Morgan Stanley Affiliates to Average Net Assets.”†† Reflects overall Portfolio ratios for investment income and non-class specific expenses.§ Amount is less than 0.005%.
2012 Semi-Annual Report
March 31, 2012

72
Financial HighlightsCore Plus Fixed Income Portfolio
The accompanying notes are an integral part of the financial statements.
Class P
Six Months EndedMarch 31, 2012 Year Ended September 30,
Selected Per Share Data and Ratios (unaudited) 2011 2010 2009 2008 2007Net Asset Value, Beginning of Period $ 9.94 $ 9.97 $ 9.40 $ 9.40 $ 11.38 $ 11.50
Income (Loss) from Investment Operations:Net Investment Income† 0.20 0.36 0.31 0.41 0.63 0.55Net Realized and Unrealized Gain (Loss) 0.22 (0.02) 0.57 0.24 (2.09) (0.05)
Total from Investment Operations 0.42 0.34 0.88 0.65 (1.46) 0.50
Distributions from and/or in Excess of:Net Investment Income (0.21) (0.37) (0.31) (0.65) (0.52) (0.62)
Redemption Fees — — — 0.00‡ 0.00‡ 0.00‡
Net Asset Value, End of Period $10.15 $ 9.94 $ 9.97 $ 9.40 $ 9.40 $ 11.38
Total Return++ 4.27%# 3.57% 9.73% 7.26% (13.23)% 4.42%
Ratios and Supplemental Data:Net Assets, End of Period (Thousands) $3,874 $4,654 $5,732 $6,442 $97,823 $137,733Ratio of Expenses to Average Net Assets (1) 0.84%*+†† 0.91%+†† 0.76%+†† 0.73%+ 0.70%+ 0.69%+Ratio of Net Investment Income to Average Net Assets (1) 3.99%*+†† 3.63%+†† 3.28%+†† 4.56%+ 5.87%+ 4.84%+Ratio of Rebate from Morgan Stanley Affiliates to
Average Net Assets 0.01%* 0.00%§ 0.01% 0.00%§ 0.01% 0.00%§Portfolio Turnover Rate 85%# 225% 270% 402% 320% 139%(1) Supplemental Information on the Ratios to
Average Net Assets:Ratios Before Expense Limitation:
Expenses to Average Net Assets N/A N/A N/A N/A 0.70%+ N/ANet Investment Income to Average Net Assets N/A N/A N/A N/A 5.87%+ N/A
† Per share amount is based on average shares outstanding.‡ Amount is less than $0.005 per share.++ Calculated based on the net asset value as of the last business day of the period.# Not Annualized.* Annualized.+ The Ratios of Expenses and Net Investment Income reflect the rebate of certain Portfolio expenses in connection with the investments in Morgan Stanley affiliates
during the period. The effect of the rebate on the ratios is disclosed in the above table as “Ratio of Rebate from Morgan Stanley Affiliates to Average Net Assets.”†† Reflects overall Portfolio ratios for investment income and non-class specific expenses.§ Amount is less than 0.005%.
2012 Semi-Annual Report
March 31, 2012

73
Financial HighlightsCorporate Bond Portfolio
The accompanying notes are an integral part of the financial statements.
Class I
Six Months EndedMarch 31, 2012 Year Ended September 30,
Selected Per Share Data and Ratios (unaudited) 2011 2010 2009 2008 2007Net Asset Value, Beginning of Period $ 10.27 $ 10.17 $ 9.75 $ 9.61 $ 11.15 $ 11.22
Income (Loss) from Investment Operations:Net Investment Income† 0.19 0.33 0.33 0.31 0.55 0.52Net Realized and Unrealized Gain (Loss) 0.22 0.07 0.49 0.38 (1.57) 0.01
Total from Investment Operations 0.41 0.40 0.82 0.69 (1.02) 0.53
Distributions from and/or in Excess of:Net Investment Income (0.21) (0.30) (0.40) (0.55) (0.52) (0.60)
Redemption Fees — — — 0.00‡ 0.00‡ 0.00‡
Net Asset Value, End of Period $ 10.47 $ 10.27 $ 10.17 $ 9.75 $ 9.61 $ 11.15
Total Return++ 4.06%# 4.05% 8.65% 7.46% (9.37)% 4.82%
Ratios and Supplemental Data:Net Assets, End of Period (Thousands) $46,389 $62,410 $79,337 $140,890 $316,894 $519,504Ratio of Expenses to Average Net Assets 0.76%*+†† 0.80%+†† 0.76%+†† 0.56%+ 0.52%+ 0.50%+Ratio of Net Investment Income to Average Net Assets 3.70%*+†† 3.27%+†† 3.36%+†† 3.30%+ 5.18%+ 4.74%+Ratio of Rebate from Morgan Stanley Affiliates to
Average Net Assets 0.01%* 0.00%§ 0.00%§ 0.01% 0.01% 0.00%§Portfolio Turnover Rate 91%# 224% 277% 545% 325% 124%† Per share amount is based on average shares outstanding.‡ Amount is less than $0.005 per share.++ Calculated based on the net asset value as of the last business day of the period.# Not Annualized.* Annualized.+ The Ratios of Expenses and Net Investment Income reflect the rebate of certain Portfolio expenses in connection with the investments in Morgan Stanley affiliates
during the period. The effect of the rebate on the ratios is disclosed in the above table as “Ratio of Rebate from Morgan Stanley Affiliates to Average Net Assets.”†† Reflects overall Portfolio ratios for investment income and non-class specific expenses.§ Amount is less than 0.005%.
2012 Semi-Annual Report
March 31, 2012

74
Financial HighlightsCorporate Bond Portfolio
The accompanying notes are an integral part of the financial statements.
Class P
Six Months EndedMarch 31, 2012 Year Ended September 30,
Selected Per Share Data and Ratios (unaudited) 2011 2010 2009 2008 2007Net Asset Value, Beginning of Period $10.27 $10.16 $ 9.74 $ 9.60 $11.14 $11.21
Income (Loss) from Investment Operations:Net Investment Income† 0.18 0.31 0.31 0.30 0.53 0.51Net Realized and Unrealized Gain (Loss) 0.22 0.08 0.49 0.38 (1.57) 0.00‡
Total from Investment Operations 0.40 0.39 0.80 0.68 (1.04) 0.51
Distributions from and/or in Excess of:Net Investment Income (0.20) (0.28) (0.38) (0.54) (0.50) (0.58)
Redemption Fees — — — 0.00‡ 0.00‡ 0.00‡
Net Asset Value, End of Period $10.47 $10.27 $10.16 $ 9.74 $ 9.60 $11.14
Total Return++ 3.98%# 3.99% 8.50% 7.44% (9.60)% 4.56%
Ratios and Supplemental Data:Net Assets, End of Period (Thousands) $ 626 $ 408 $ 590 $ 611 $ 842 $1,177Ratio of Expenses to Average Net Assets (1) 0.91%*+†† 0.95%+†† 0.91%+†† 0.69%+ 0.67%+ 0.65%+Ratio of Net Investment Income to Average Net Assets (1) 3.55%*+†† 3.12%+†† 3.21%+†† 3.19%+ 5.01%+ 4.59%+Ratio of Rebate from Morgan Stanley Affiliates to Average Net Assets 0.01%* 0.00%§ 0.00%§ 0.01% 0.01% 0.00%§Portfolio Turnover Rate 91%# 224% 277% 545% 325% 124%(1) Supplemental Information on the Ratios to Average
Net Assets:Ratios Before Expense Limitation:
Expenses to Average Net Assets 1.01%*†† 1.05%†† 1.01%+†† 0.79%+ 0.77%+ 0.75%+Net Investment Income to Average Net Assets 3.45%*†† 3.02%†† 3.11%+†† 3.09%+ 4.91%+ 4.49%+
† Per share amount is based on average shares outstanding.‡ Amount is less than $0.005 per share.++ Calculated based on the net asset value as of the last business day of the period.# Not Annualized.* Annualized.+ The Ratios of Expenses and Net Investment Income reflect the rebate of certain Portfolio expenses in connection with the investments in Morgan Stanley affiliates
during the period. The effect of the rebate on the ratios is disclosed in the above table as “Ratio of Rebate from Morgan Stanley Affiliates to Average Net Assets.”†† Reflects overall Portfolio ratios for investment income and non-class specific expenses.§ Amount is less than 0.005%.
2012 Semi-Annual Report
March 31, 2012

75
Financial HighlightsCorporate Bond Portfolio
The accompanying notes are an integral part of the financial statements.
Class H Six Months Ended Period from March 31, 2012 Year Ended September 30, January 2, 2008^ toSelected Per Share Data and Ratios (unaudited) 2011 2010 2009 September 30, 2008Net Asset Value, Beginning of Period $10.27 $10.16 $ 9.74 $ 9.53 $ 11.15
Income (Loss) from Investment Operations:Net Investment Income† 0.18 0.31 0.31 0.28 0.21Net Realized and Unrealized Gain (Loss) 0.22 0.07 0.48 0.39 (1.68)
Total from Investment Operations 0.40 0.38 0.79 0.67 (1.47)
Distributions from and/or in Excess of:Net Investment Income (0.20) (0.27) (0.37) (0.46) (0.15)
Redemption Fees — — — 0.00‡ —
Net Asset Value, End of Period $10.47 $10.27 $10.16 $ 9.74 $ 9.53
Total Return++ 3.92%# 3.89% 8.39% 7.21% (13.21)%#
Ratios and Supplemental Data:Net Assets, End of Period (Thousands) $ 170 $ 473 $ 170 $ 162 $ 85Ratio of Expenses to Average Net Assets 1.01%*+†† 1.05%+†† 1.01%+†† 0.81%+ 2.98%*+Ratio of Net Investment Income to Average Net Assets 3.45%*+†† 3.02%+†† 3.11%+†† 2.94%+ 2.71%*+Rebate from Morgan Stanley Affiliates to Average Net Assets 0.01%* 0.00%§ 0.00%§ 0.01% 0.01%*Portfolio Turnover Rate 91%# 224% 277% 545% 325%#^ Commencement of Operations.† Per share amount is based on average shares outstanding.‡ Amount is less than $0.005 per share.++ Calculated based on the net asset value which does not reflect sales charges, if applicable, as of the last business day of the period.# Not Annualized.* Annualized.+ The Ratios of Expenses and Net Investment Income reflect the rebate of certain Portfolio expenses in connection with the investments in Morgan Stanley affiliates
during the period. The effect of the rebate on the ratios is disclosed in the above table as “Ratio of Rebate from Morgan Stanley Affiliates to Average Net Assets.”†† Reflects overall Portfolio ratios for investment income and non-class specific expenses.§ Amount is less than 0.005%.
2012 Semi-Annual Report
March 31, 2012

76
Financial HighlightsCorporate Bond Portfolio
The accompanying notes are an integral part of the financial statements.
Class L Six Months Ended Period from March 31, 2012 Year Ended September 30, June 16, 2008^ toSelected Per Share Data and Ratios (unaudited) 2011 2010 2009 September 30, 2008Net Asset Value, Beginning of Period $10.26 $10.15 $ 9.74 $ 9.63 $10.12
Income (Loss) from Investment Operations:Net Investment Income† 0.16 0.28 0.28 0.24 0.12Net Realized and Unrealized Gain (Loss) 0.22 0.08 0.48 0.41 (0.60)
Total from Investment Operations 0.38 0.36 0.76 0.65 (0.48)
Distributions from and/or in Excess of:Net Investment Income (0.18) (0.25) (0.35) (0.54) (0.01)
Redemption Fees — — — 0.00‡ —
Net Asset Value, End of Period $10.46 $10.26 $10.15 $ 9.74 $ 9.63
Total Return++ 3.80%# 3.51% 8.15% 7.08% (4.73)%#
Ratios and Supplemental Data:Net Assets, End of Period (Thousands) $3,938 $4,080 $5,508 $5,159 $ 58Ratio of Expenses to Average Net Assets 1.26%*+†† 1.30%+†† 1.26%+†† 1.06%+ 1.15%*+Ratio of Net Investment Income to Average Net Assets 3.20%*+†† 2.77%+†† 2.86%+†† 2.58%+ 4.34%*+Ratio of Rebate from Morgan Stanley Affiliates to Average Net Assets 0.01%* 0.00%§ 0.00%§ 0.01% 0.01%*Portfolio Turnover Rate 91%# 224% 277% 545% 325%#^ Commencement of Operations.† Per share amount is based on average shares outstanding.‡ Amount is less than $0.005 per share.++ Calculated based on the net asset value as of the last business day of the period.# Not Annualized.* Annualized.+ The Ratios of Expenses and Net Investment Income reflect the rebate of certain Portfolio expenses in connection with the investments in Morgan Stanley affiliates
during the period. The effect of the rebate on the ratios is disclosed in the above table as “Ratio of Rebate from Morgan Stanley Affiliates to Average Net Assets.”†† Reflects overall Portfolio ratios for investment income and non-class specific expenses.§ Amount is less than 0.005%.
2012 Semi-Annual Report
March 31, 2012

77
Financial HighlightsHigh Yield Portfolio
The accompanying notes are an integral part of the financial statements.
Class I
Period from February 7, 2012^ to March 31, 2012Selected Per Share Data and Ratios (unaudited)Net Asset Value, Beginning of Period $10.00
Income (Loss) from Investment Operations:Net Investment Income† 0.10Net Realized and Unrealized Gain 0.13
Total from Investment Operations 0.23
Net Asset Value, End of Period $10.23
Total Return++ 2.30%#
Ratios and Supplemental Data:††Net Assets, End of Period (Thousands) $9,927Ratio of Expenses to Average Net Assets (1) 0.73%*+Ratio of Net Investment Income to Average Net Assets (1) 6.80%*+Ratio of Rebate from Morgan Stanley Affiliates to Average Net Assets 0.02%*Portfolio Turnover Rate 51%#(1) Supplemental Information on the Ratios to Average Net Assets:††
Ratios Before Expense Limitation:Expenses to Average Net Assets 2.85%*Net Investment Income to Average Net Assets 4.68%*
^ Commencement of Operations.† Per share amount is based on average shares outstanding.++ Calculated based on the net asset value as of the last business day of the period.# Not Annualized.* Annualized.+ The Ratios of Expenses and Net Investment Income reflect the rebate of certain Portfolio expenses in connection with the investments in Morgan Stanley affiliates
during the period. The effect of the rebate on the ratios is disclosed in the above table as “Ratio of Rebate from Morgan Stanley Affiliates to Average Net Assets.”†† Reflects overall Portfolio ratios for investment income and non-class specific expenses.
2012 Semi-Annual Report
March 31, 2012

78
Financial HighlightsHigh Yield Portfolio
The accompanying notes are an integral part of the financial statements.
Class P
Period from February 7, 2012^ to March 31, 2012Selected Per Share Data and Ratios (unaudited)Net Asset Value, Beginning of Period $10.00
Income (Loss) from Investment Operations:Net Investment Income† 0.09Net Realized and Unrealized Gain 0.14
Total from Investment Operations 0.23
Net Asset Value, End of Period $10.23
Total Return++ 2.30%#
Ratios and Supplemental Data:††Net Assets, End of Period (Thousands) $ 102Ratio of Expenses to Average Net Assets (1) 0.98%*+Ratio of Net Investment Income to Average Net Assets (1) 6.55%*+Ratio of Rebate from Morgan Stanley Affiliates to Average Net Assets 0.02%*Portfolio Turnover Rate 51%#(1) Supplemental Information on the Ratios to Average Net Assets:††
Ratios Before Expense Limitation:Expenses to Average Net Assets 3.10%*Net Investment Income to Average Net Assets 4.43%*
^ Commencement of Operations.† Per share amount is based on average shares outstanding.++ Calculated based on the net asset value as of the last business day of the period.# Not Annualized.* Annualized.+ The Ratios of Expenses and Net Investment Income reflect the rebate of certain Portfolio expenses in connection with the investments in Morgan Stanley affiliates
during the period. The effect of the rebate on the ratios is disclosed in the above table as “Ratio of Rebate from Morgan Stanley Affiliates to Average Net Assets.”†† Reflects overall Portfolio ratios for investment income and non-class specific expenses.
2012 Semi-Annual Report
March 31, 2012

79
Financial HighlightsHigh Yield Portfolio
The accompanying notes are an integral part of the financial statements.
Class H
Period from February 7, 2012^ to March 31, 2012Selected Per Share Data and Ratios (unaudited)Net Asset Value, Beginning of Period $10.00
Income (Loss) from Investment Operations:Net Investment Income† 0.09Net Realized and Unrealized Gain 0.14
Total from Investment Operations 0.23
Net Asset Value, End of Period $10.23
Total Return++ 2.30%#
Ratios and Supplemental Data:††Net Assets, End of Period (Thousands) $ 102Ratio of Expenses to Average Net Assets (1) 0.98%*+Ratio of Net Investment Income to Average Net Assets (1) 6.55%*+Rebate from Morgan Stanley Affiliates to Average Net Assets 0.02%*Portfolio Turnover Rate 51%#(1) Supplemental Information on the Ratios to Average Net Assets:††
Ratios Before Expense Limitation:Expense to Average Net Assets 3.10%*Net Investment Income to Average Net Assets 4.43%*
^ Commencement of Operations.† Per share amount is based on average shares outstanding.++ Calculated based on the net asset value which does not reflect sales charges, if applicable, as of the last business day of the period.# Not Annualized.* Annualized.+ The Ratios of Expenses and Net Investment Income reflect the rebate of certain Portfolio expenses in connection with the investments in Morgan Stanley affiliates
during the period. The effect of the rebate on the ratios is disclosed in the above table as “Ratio of Rebate from Morgan Stanley Affiliates to Average Net Assets.”†† Reflects overall Portfolio ratios for investment income and non-class specific expenses.
2012 Semi-Annual Report
March 31, 2012
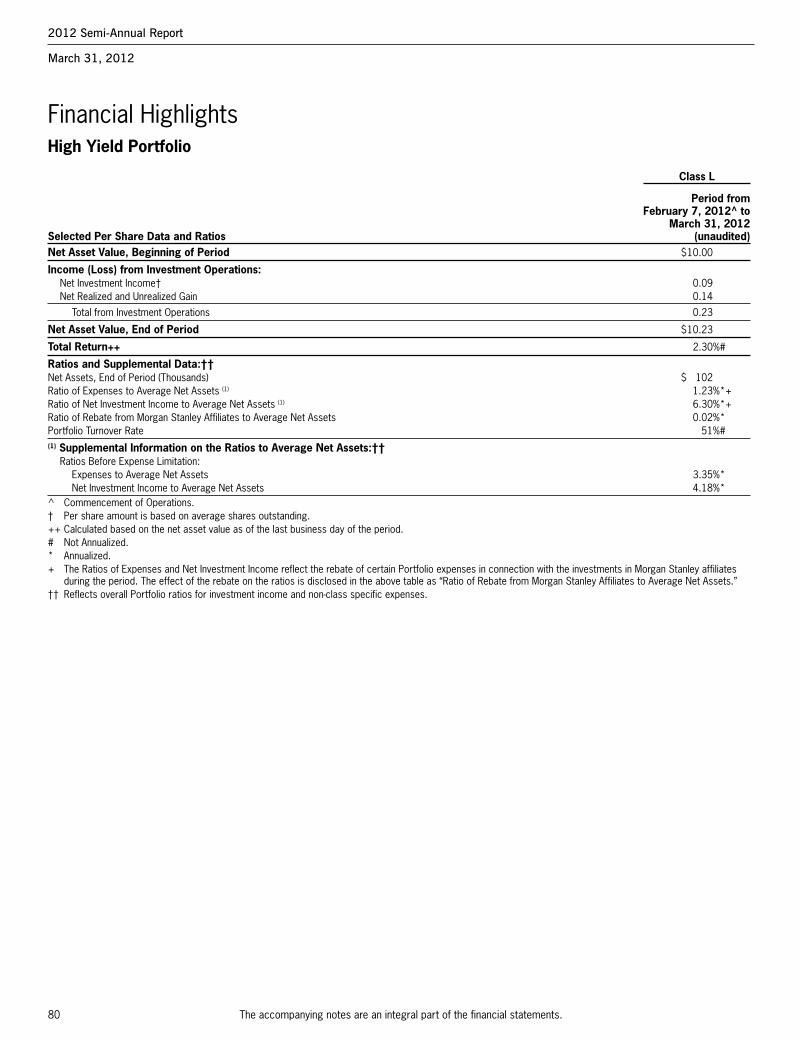
80
Financial HighlightsHigh Yield Portfolio
The accompanying notes are an integral part of the financial statements.
Class L
Period from February 7, 2012^ to March 31, 2012Selected Per Share Data and Ratios (unaudited)Net Asset Value, Beginning of Period $10.00
Income (Loss) from Investment Operations:Net Investment Income† 0.09Net Realized and Unrealized Gain 0.14
Total from Investment Operations 0.23
Net Asset Value, End of Period $10.23
Total Return++ 2.30%#
Ratios and Supplemental Data:††Net Assets, End of Period (Thousands) $ 102Ratio of Expenses to Average Net Assets (1) 1.23%*+Ratio of Net Investment Income to Average Net Assets (1) 6.30%*+Ratio of Rebate from Morgan Stanley Affiliates to Average Net Assets 0.02%*Portfolio Turnover Rate 51%#(1) Supplemental Information on the Ratios to Average Net Assets:††
Ratios Before Expense Limitation:Expenses to Average Net Assets 3.35%*Net Investment Income to Average Net Assets 4.18%*
^ Commencement of Operations.† Per share amount is based on average shares outstanding.++ Calculated based on the net asset value as of the last business day of the period.# Not Annualized.* Annualized.+ The Ratios of Expenses and Net Investment Income reflect the rebate of certain Portfolio expenses in connection with the investments in Morgan Stanley affiliates
during the period. The effect of the rebate on the ratios is disclosed in the above table as “Ratio of Rebate from Morgan Stanley Affiliates to Average Net Assets.”†† Reflects overall Portfolio ratios for investment income and non-class specific expenses.
2012 Semi-Annual Report
March 31, 2012
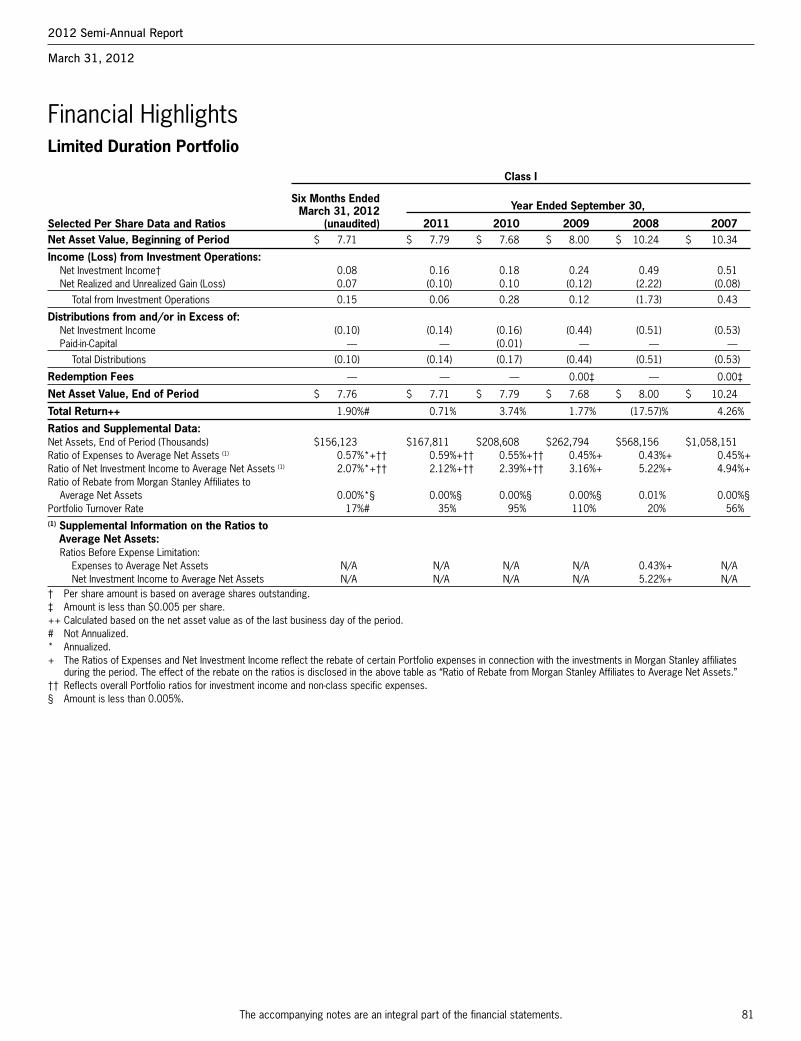
81
Financial HighlightsLimited Duration Portfolio
The accompanying notes are an integral part of the financial statements.
Class I
Six Months EndedMarch 31, 2012 Year Ended September 30,
Selected Per Share Data and Ratios (unaudited) 2011 2010 2009 2008 2007Net Asset Value, Beginning of Period $ 7.71 $ 7.79 $ 7.68 $ 8.00 $ 10.24 $ 10.34
Income (Loss) from Investment Operations:Net Investment Income† 0.08 0.16 0.18 0.24 0.49 0.51Net Realized and Unrealized Gain (Loss) 0.07 (0.10) 0.10 (0.12) (2.22) (0.08)
Total from Investment Operations 0.15 0.06 0.28 0.12 (1.73) 0.43
Distributions from and/or in Excess of:Net Investment Income (0.10) (0.14) (0.16) (0.44) (0.51) (0.53)Paid-in-Capital — — (0.01) — — —
Total Distributions (0.10) (0.14) (0.17) (0.44) (0.51) (0.53)
Redemption Fees — — — 0.00‡ — 0.00‡
Net Asset Value, End of Period $ 7.76 $ 7.71 $ 7.79 $ 7.68 $ 8.00 $ 10.24
Total Return++ 1.90%# 0.71% 3.74% 1.77% (17.57)% 4.26%
Ratios and Supplemental Data:Net Assets, End of Period (Thousands) $156,123 $167,811 $208,608 $262,794 $568,156 $1,058,151Ratio of Expenses to Average Net Assets (1) 0.57%*+†† 0.59%+†† 0.55%+†† 0.45%+ 0.43%+ 0.45%+Ratio of Net Investment Income to Average Net Assets (1) 2.07%*+†† 2.12%+†† 2.39%+†† 3.16%+ 5.22%+ 4.94%+Ratio of Rebate from Morgan Stanley Affiliates to
Average Net Assets 0.00%*§ 0.00%§ 0.00%§ 0.00%§ 0.01% 0.00%§Portfolio Turnover Rate 17%# 35% 95% 110% 20% 56%(1) Supplemental Information on the Ratios to
Average Net Assets:Ratios Before Expense Limitation:
Expenses to Average Net Assets N/A N/A N/A N/A 0.43%+ N/ANet Investment Income to Average Net Assets N/A N/A N/A N/A 5.22%+ N/A
† Per share amount is based on average shares outstanding.‡ Amount is less than $0.005 per share.++ Calculated based on the net asset value as of the last business day of the period.# Not Annualized.* Annualized.+ The Ratios of Expenses and Net Investment Income reflect the rebate of certain Portfolio expenses in connection with the investments in Morgan Stanley affiliates
during the period. The effect of the rebate on the ratios is disclosed in the above table as “Ratio of Rebate from Morgan Stanley Affiliates to Average Net Assets.”†† Reflects overall Portfolio ratios for investment income and non-class specific expenses.§ Amount is less than 0.005%.
2012 Semi-Annual Report
March 31, 2012

82
Financial HighlightsLimited Duration Portfolio
The accompanying notes are an integral part of the financial statements.
Class P
Six Months Ended Period fromMarch 31, 2012 Year Ended September 30, September 28, 2007^ to
Selected Per Share Data and Ratios (unaudited) 2011 2010 2009 2008 September 30, 2007Net Asset Value, Beginning of Period $ 7.71 $ 7.79 $ 7.68 $ 8.00 $ 10.24 $10.24
Income (Loss) from Investment Operations:Net Investment Income† 0.07 0.15 0.17 0.22 0.47 0.00‡Net Realized and Unrealized Gain (Loss) 0.07 (0.12) 0.09 (0.12) (2.23) (0.00)‡
Total from Investment Operations 0.14 0.03 0.26 0.10 (1.76) 0.00‡
Distributions from and/or in Excess of:Net Investment Income (0.09) (0.11) (0.15) (0.42) (0.48) —Paid-in-Capital — — (0.00)‡ — — —
Total Distributions (0.09) (0.11) (0.15) (0.42) (0.48) —
Redemption Fees — — — 0.00‡ — 0.00‡
Net Asset Value, End of Period $ 7.76 $ 7.71 $ 7.79 $ 7.68 $ 8.00 $10.24
Total Return++ 1.77%# 0.45% 3.48% 1.52% (17.77)% —
Ratios and Supplemental Data:Net Assets, End of Period (Thousands) $ 125 $ 194 $ 52 $ 169 $ 294 $1,020Ratio of Expenses to Average Net Assets 0.82%*+†† 0.84%+†† 0.80%+†† 0.70%+ 0.68%+ 0.59%*+Ratio of Net Investment Income to Average Net Assets 1.82%*+†† 1.87%+†† 2.14%+†† 2.87%+ 4.95%+ 5.38%*+Ratio of Rebate from Morgan Stanley Affiliates to
Average Net Assets 0.00%*§ 0.00%§ 0.00%§ 0.00%§ 0.01% 0.06%*Portfolio Turnover Rate 17%# 35% 95% 110% 20% 56%#^ Commencement of Operations.† Per share amount is based on average shares outstanding.‡ Amount is less than $0.005 per share.++ Calculated based on the net asset value as of the last business day of the period.# Not Annualized.* Annualized.+ The Ratios of Expenses and Net Investment Income reflect the rebate of certain Portfolio expenses in connection with the investments in Morgan Stanley affiliates
during the period. The effect of the rebate on the ratios is disclosed in the above table as “Ratio of Rebate from Morgan Stanley Affiliates to Average Net Assets.”†† Reflects overall Portfolio ratios for investment income and non-class specific expenses.§ Amount is less than 0.005%.
2012 Semi-Annual Report
March 31, 2012

83
Financial HighlightsLong Duration Fixed Income Portfolio
The accompanying notes are an integral part of the financial statements.
Class I
Six Months EndedMarch 31, 2012 Year Ended September 30,
Selected Per Share Data and Ratios (unaudited) 2011 2010 2009 2008 2007Net Asset Value, Beginning of Period $ 11.89 $ 11.73 $ 11.52 $ 9.93 $ 10.33 $ 10.48
Income (Loss) from Investment Operations:Net Investment Income† 0.24 0.50 0.55 0.49 0.46 0.49Net Realized and Unrealized Gain (Loss) (0.12) 0.66 0.80 1.66 (0.37) (0.18)
Total from Investment Operations 0.12 1.16 1.35 2.15 0.09 0.31
Distributions from and/or in Excess of:Net Investment Income (0.25) (0.46) (0.55) (0.56) (0.49) (0.43)Net Realized Gain (0.18) (0.54) (0.59) — — (0.03)
Total Distributions (0.43) (1.00) (1.14) (0.56) (0.49) (0.46)
Net Asset Value, End of Period $ 11.58 $ 11.89 $ 11.73 $ 11.52 $ 9.93 $ 10.33
Total Return++ 1.00%# 11.40% 13.09% 22.19% 0.87% 3.06%
Ratios and Supplemental Data:Net Assets, End of Period (Thousands) $23,561 $23,660 $32,354 $31,410 $27,438 $25,297Ratio of Expenses to Average Net Assets (1) 0.50%*+†† 0.50%+†† 0.50%+†† 0.50%+ 0.49%+ 0.50%+Ratio of Net Investment Income to Average Net Assets (1) 4.12%*+†† 4.69%+†† 4.98%+†† 4.68%+ 4.44%+ 4.73%+Ratio of Rebate from Morgan Stanley Affiliates to Average
Net Assets 0.00%*§ 0.00%§ 0.00%§ 0.00%§ 0.01% 0.00%§Portfolio Turnover Rate 18%# 59% 90% 80% 63% 49%(1) Supplemental Information on the Ratios to
Average Net Assets:Ratios Before Expense Limitation:
Expenses to Average Net Assets 1.05%*†† 1.12%†† 0.79%+†† 0.80%+ 0.75%+ 0.94%+Net Investment Income to Average Net Assets 3.57%*†† 4.07%†† 4.69%+†† 4.38%+ 4.18%+ 4.29%+
† Per share amount is based on average shares outstanding.++ Calculated based on the net asset value as of the last business day of the period.# Not Annualized.* Annualized.+ The Ratios of Expenses and Net Investment Income reflect the rebate of certain Portfolio expenses in connection with the investments in Morgan Stanley affiliates
during the period. The effect of the rebate on the ratios is disclosed in the above table as “Ratio of Rebate from Morgan Stanley Affiliates to Average Net Assets.”†† Reflects overall Portfolio ratios for investment income and non-class specific expenses.§ Amount is less than 0.005%.
2012 Semi-Annual Report
March 31, 2012

84
Financial HighlightsLong Duration Fixed Income Portfolio
The accompanying notes are an integral part of the financial statements.
Class P
Six Months EndedMarch 31, 2012 Year Ended September 30,
Selected Per Share Data and Ratios (unaudited) 2011 2010 2009 2008 2007Net Asset Value, Beginning of Period $11.88 $11.72 $11.51 $ 9.92 $10.32 $10.48
Income (Loss) from Investment Operations:Net Investment Income† 0.23 0.48 0.51 0.46 0.44 0.46Net Realized and Unrealized Gain (Loss) (0.13) 0.65 0.82 1.67 (0.37) (0.19)
Total from Investment Operations 0.10 1.13 1.33 2.13 0.07 0.27
Distributions from and/or in Excess of:Net Investment Income (0.24) (0.43) (0.53) (0.54) (0.47) (0.40)Net Realized Gain (0.18) (0.54) (0.59) — — (0.03)
Total Distributions (0.42) (0.97) (1.12) (0.54) (0.47) (0.43)
Net Asset Value, End of Period $11.56 $11.88 $11.72 $11.51 $ 9.92 $10.32
Total Return++ 0.79%# 11.13% 12.81% 21.91% 0.61% 2.72%
Ratios and Supplemental Data:Net Assets, End of Period (Thousands) $ 578 $ 594 $ 586 $ 575 $ 496 $ 516Ratio of Expenses to Average Net Assets (1) 0.75%*+†† 0.75%+†† 0.75%+†† 0.75%+ 0.74%+ 0.75%+Ratio of Net Investment Income to Average Net Assets (1) 3.87%*+†† 4.44%+†† 4.73%+†† 4.43%+ 4.18%+ 4.48%+Ratio of Rebate from Morgan Stanley Affiliates to Average
Net Assets 0.00%*§ 0.00%§ 0.00%§ 0.00%§ 0.01% 0.00%§Portfolio Turnover Rate 18%# 59% 90% 80% 63% 49%(1) Supplemental Information on the Ratios to
Average Net Assets:Ratios Before Expense Limitation:
Expenses to Average Net Assets 1.30%*†† 1.37%†† 1.04%+†† 1.05%+ 1.00%+ 1.19%+Net Investment Income to Average Net Assets 3.32%*†† 3.82%†† 4.44%+†† 4.13%+ 3.92%+ 4.04%+
† Per share amount is based on average shares outstanding.++ Calculated based on the net asset value as of the last business day of the period.# Not Annualized.* Annualized.+ The Ratios of Expenses and Net Investment Income reflect the rebate of certain Portfolio expenses in connection with the investments in Morgan Stanley affiliates
during the period. The effect of the rebate on the ratios is disclosed in the above table as “Ratio of Rebate from Morgan Stanley Affiliates to Average Net Assets.”†† Reflects overall Portfolio ratios for investment income and non-class specific expenses.§ Amount is less than 0.005%.
2012 Semi-Annual Report
March 31, 2012

85
Morgan Stanley Institutional Fund Trust (“MSIFT” or the“Fund”) is registered under the Investment Company Act of1940, as amended (the “Act”), as an open-end managementinvestment company. The Fund is comprised of eight separate,active portfolios (individually referred to as a “Portfolio”, col-lectively as the “Portfolios”). All Portfolios are considered di-versified for purposes of the Act.
The Fund offers up to four different classes of shares for certainPortfolios — Class I shares, Class P shares, Class H shares andClass L shares. Each class of shares has identical voting rights(except shareholders of each Class have exclusive voting rightsregarding any matter relating solely to that particular Class ofshares), dividend, liquidation and other rights, except eachclass bears different distribution and shareholder service fees asdescribed in Note D.
The Fund has suspended offering shares of the Mid CapGrowth Portfolio to new investors. The Fund will continue tooffer shares of the Portfolio to existing shareholders. The Fundmay recommence offering shares of the Portfolio to new in-vestors in the future.
A. Significant Accounting Policies: The following signif-icant accounting policies are in conformity with U.S. generallyaccepted accounting principles (“GAAP”). Such policies areconsistently followed by the Portfolio in the preparation of itsfinancial statements. GAAP may require management to makeestimates and assumptions that affect the reported amountsand disclosures in the financial statements. Actual results maydiffer from those estimates.
1. Security Valuation: Bonds and other fixed income securities may be valued according to the broadest andmost representative market. In addition, bonds and otherfixed income securities may be valued on the basis ofprices provided by a pricing service. The prices providedby a pricing service take into account broker dealer marketprice quotations for institutional size trading in similargroups of securities, security quality, maturity, coupon andother security characteristics as well as any developmentsrelated to the specific securities. Short-term debt securitiespurchased with remaining maturities of 60 days or less are valued at amortized cost, unless the Board of Trustees (the“Trustees”) determines such valuation does not reflect thesecurities’ market value, in which case these securities willbe valued at their fair value as determined in good faithunder procedures adopted by the Trustees. Equity securities listed on a U.S. exchange are valued at the latestquoted sales price on the valuation date. Equity securitieslisted or traded on NASDAQ, for which market quota-tions are available, are valued at the NASDAQ OfficialClosing Price. Securities listed on a foreign exchange arevalued at their closing price, except as noted below.
Unlisted and listed equity securities not traded on the val-uation date, for which market quotations are readily avail-able, are valued at the mean between the current bid andasked prices obtained from reputable brokers.
All other securities and investments for which market val-ues are not readily available, including restricted securities,and those securities for which it is inappropriate to deter-mine prices in accordance with the aforementioned proce-dures, are valued at fair value as determined in good faithunder procedures adopted by the Trustees, although theactual calculations may be done by others. Factors consid-ered in making this determination may include, but arenot limited to, information obtained by contacting the issuer, analysts, or the appropriate stock exchange (for exchange-traded securities), analysis of the issuer’s finan-cial statements or other available documents and, if neces-sary, available information concerning other securities insimilar circumstances.
Most foreign markets close before the New York Stock Exchange (“NYSE”). Occasionally, developments thatcould affect the closing prices of securities and other assetsmay occur between the times at which valuations of suchsecurities are determined (that is, close of the foreign mar-ket on which the securities trade) and the close of businesson the NYSE. If these developments are expected to mate-rially affect the value of the securities, the valuations maybe adjusted to reflect the estimated fair value as of theclose of the NYSE, as determined in good faith under procedures established by the Trustees.
2. Foreign Currency Translation and Foreign Investments: The books and records of the Portfolios aremaintained in U.S. dollars. Foreign currency amounts aretranslated into U.S. dollars at the bid prices of such cur-rencies against U.S. dollars quoted by a bank. Net realizedgains (losses) on foreign currency transactions representnet foreign exchange gains (losses) from foreign currencyexchange contracts, disposition of foreign currencies, cur-rency gains (losses) realized between the trade and settle-ment dates on securities transactions, and the differencebetween the amount of investment income and foreignwithholding taxes recorded on the Portfolio’s books andthe U.S. dollar equivalent amounts actually received orpaid.
Certain Portfolios’ net assets include foreign denominatedsecurities and currency. The net assets of these Portfoliosare presented at the foreign exchange rates and market val-ues at the close of the period. The Portfolios do not isolatethat portion of the results of operations arising as a resultof changes in the foreign exchange rates from the fluctua-tions arising from changes in the market prices of the
Notes to Financial Statements
2012 Semi-Annual Report
March 31, 2012 (unaudited)

86
securities held at period end. Similarly, the Portfolios donot isolate the effect of changes in foreign exchange ratesfrom the fluctuations arising from changes in the marketprices of securities sold during the period. Accordingly, thecomponents of realized and unrealized foreign currencygains (losses) representing foreign exchange changes on in-vestments is included in the reported net realized and un-realized gains (losses) on investment transactions andbalances. Changes in currency exchange rates will affectthe value of and investment income from such securitiesand currency.
Foreign security and currency transactions may involvecertain considerations and risks not typically associatedwith those of U.S. dollar denominated transactions as a re-sult of, among other factors, fluctuations of exchange ratesin relation to the U.S. dollar, the possibility of lower levelsof governmental supervision and regulation of foreign se-curities markets and the possibility of political or eco-nomic instability.
3. Derivatives: Certain Portfolios use derivative instru-ments for a variety of purposes, including hedging, riskmanagement, portfolio management or to earn income.Derivatives are financial instruments whose value is basedon the value of another underlying asset, interest rate, in-dex or financial instrument. A derivative instrument oftenhas risks similar to its underlying instrument and mayhave additional risks, including imperfect correlation be-tween the value of the derivative and the underlying in-strument, risks of default by the other party to certaintransactions, magnification of losses incurred due tochanges in the market value of the securities, instruments,indices or interest rates to which they relate, and risks thatthe transactions may not be liquid. The use of derivativesinvolves risks that are different from, and possibly greaterthan, the risks associated with other portfolio investments.Derivatives may involve the use of highly specialized instruments that require investment techniques and riskanalyses different from those associated with other portfo-lio investments. All of a Portfolio’s holdings, including derivative instruments, are marked to market each daywith the change in value reflected in unrealized apprecia-tion (depreciation). Upon disposition, a realized gain orloss is recognized.
Certain derivative transactions may give rise to a form ofleverage. Leverage associated with derivative transactionsmay cause the Portfolios to liquidate portfolio positionswhen it may not be advantageous to do so to satisfy its ob-ligations or to meet earmarking or segregation require-ments, pursuant to applicable Securities and ExchangeCommission rules and regulations, or may cause the Port-folios to be more volatile than if the Portfolios had not
been leveraged. Although the Adviser seeks to use deriva-tives to further the Portfolios’ investment objectives, thereis no assurance that the use of derivatives will achieve thisresult.
Following is a description of the derivative instrumentsand techniques that certain Portfolios used during the period and their associated risks:
Futures: A futures contract is a standardized agreementbetween two parties to buy or sell a specific quantity of anunderlying instrument at a specific price at a specific fu-ture time. The value of a futures contract tends to increaseand decrease in tandem with the value of the underlyinginstrument. Depending on the terms of the particular con-tract, futures contracts are settled through either physicaldelivery of the underlying instrument on the settlementdate or by payment of a cash settlement amount on thesettlement date. During the period the futures contract isopen, payments are received from or made to the brokerbased upon changes in the value of the contract (the varia-tion margin). A decision as to whether, when and how touse futures involves the exercise of skill and judgment andeven a well conceived futures transaction may be unsuc-cessful because of market behavior or unexpected events.In addition to the derivatives risks discussed above, theprices of futures can be highly volatile, using futures canlower total return, and the potential loss from futures canexceed a Portfolio’s initial investment in such contracts.
Swaps: An over the counter (“OTC”) swap agreement isan agreement between two parties pursuant to which theparties exchange payments at specified dates on the basisof a specified notional amount, with the payments calcu-lated by reference to specified securities, indexes, referencerates, currencies or other instruments. A small percentageof swap agreements are cleared through a central clearinghouse. Most swap agreements provide that when the pe-riod payment dates for both parties are the same, the pay-ments are made on a net basis (i.e., the two paymentstreams are netted out, with only the net amount paid byone party to the other). The Portfolio’s obligations orrights under a swap agreement entered into on a net basiswill generally be equal only to the net amount to be paidor received under the agreement, based on the relative val-ues of the positions held by each counterparty. Most swapagreements are not entered into or traded on exchangesand there is no central clearing or guaranty function forswaps. These OTC swaps are often subject to credit risk orthe risk of default or non-performance by the counter-party. Swaps could result in losses if interest rate or foreigncurrency exchange rates or credit quality changes are notcorrectly anticipated by the Portfolio or if the reference in-dex, security or investments do not perform as expected.
Notes to Financial Statements (cont’d)
2012 Semi-Annual Report
March 31, 2012 (unaudited)

87
When a Portfolio has an unrealized loss on a swap agree-ment, the Portfolio has instructed the custodian to pledgecash or liquid securities as collateral with a value approxi-mately equal to the amount of the unrealized loss. Collat-eral pledges are monitored and subsequently adjusted ifand when the swap valuations fluctuate. Cash collateral isincluded with “Due from (to) Broker” on the Statementsof Assets and Liabilities. For cash collateral received, aPortfolio pays a monthly fee to the counterparty based onthe effective rate for Federal Funds. This fee, when paid, isincluded within realized gain (loss) on swap agreements onthe Statements of Operations.
Upfront payments received or paid by a Portfolio will bereflected as an asset or liability in the Statements of Assetsand Liabilities.
Foreign Currency Exchange Contracts: In connec-tion with their investments in foreign securities, certainPortfolios also entered into contracts with banks, brokersor dealers to purchase or sell foreign currencies at a futuredate. A foreign currency exchange contract (“currency con-tracts”) is a negotiated agreement between the contractingparties to exchange a specified amount of currency at aspecified future time at a specified rate. The rate can behigher or lower than the spot rate between the currenciesthat are the subject of the currency contract. Currencycontracts are used to protect against uncertainty in thelevel of future foreign currency exchange rates or to gain ormodify exposure to a particular currency. Hedging a Port-folio’s currency risks involves the risk of mismatching aPortfolio’s objectives under a currency contract with thevalue of securities denominated in a particular currency.Furthermore, such transactions reduce or preclude the op-portunity for gain if the value of the currency should movein the direction opposite to the position taken. There is anadditional risk to the effect that currency contracts createexposure to currencies in which a Portfolio’s securities arenot denominated. Unanticipated changes in currencyprices may result in poorer overall performance for a Port-folio than if it had not entered into such currency con-tracts. The use of currency contracts involves the risk ofloss from the insolvency or bankruptcy of the counterpartyto the contract or the failure of the counterparty to makepayments or otherwise comply with the terms of the con-tract. A currency contract is marked-to-market daily andthe change in market value is recorded by the Portfolio asunrealized gain or loss. The Portfolio records realized gains(losses) when the currency contract is closed equal to thedifference between the value of the currency contract at
the time it was opened and the value at the time it wasclosed.
Financial Accounting Standards Board (“FASB”) Account-ing Standards CodificationTM (“ASC”) 815, “Derivativesand Hedging: Overall” (“ASC 815”), is intended to im-prove financial reporting about derivative instruments byrequiring enhanced disclosures to enable investors to betterunderstand how and why the Portfolios use derivative in-struments, how these derivative instruments are accountedfor and their effects on the Portfolio’s financial positionand results of operations.
The following table sets forth the fair value of each Portfo-lio’s derivative contracts by primary risk exposure as ofMarch 31, 2012.
Foreign Currency Statements of Exchange Futures Swap Assets and Contracts Contracts AgreementsPrimary Risk Exposure Liabilities (000) (000)(a) (000)Balanced Portfolio:
Currency Risk Receivables $ 29 $ — $ —Equity Risk Receivables — 91 13Commodity Risk Receivables — 4 —Interest Rate Risk Receivables — 10 61
Total Receivables $ 29 $105 $ 74
Currency Risk Payables 14 — —Equity Risk Payables — 28 3Interest Rate Risk Payables — 3 60
Total Payables $ 14 $ 31 $ 63
Core Fixed Income Portfolio:Interest Rate Risk Receivables $ — $ 12 $ 246
Interest Rate Risk Payables $ — $ 22 $ 455
Core Plus Fixed Income Portfolio:Currency Risk Receivables $110 $ — $ —Interest Rate Risk Receivables — 24 973
Total Receivables $110 $ 24 $ 973
Currency Risk Payables 14 — —Interest Rate Risk Payables — 91 966
Total Payables $ 14 $ 91 $ 966
Corporate Bond Portfolio:Interest Rate Risk Receivables $ — $ 52 $ —
Interest Rate Risk Payables $ — $ 51 $ 13
Limited Duration Portfolio:Interest Rate Risk Receivables $ — $ 70 $ 729
Interest Rate Risk Payables $ — $ 47 $1,266
Long Duration Fixed Income Portfolio:Interest Rate Risk Receivables $ — $ 14 $ 176
Interest Rate Risk Payables $ — $ 1 $ 264
(a) This amount represents the cumulative appreciation (depreciation) of futures contractsas reported in the Portfolio of Investments. The Statements of Assets and Liabilitiesonly reflect the current day net variation margin, receivable/payable to brokers.
Notes to Financial Statements (cont’d)
2012 Semi-Annual Report
March 31, 2012 (unaudited)

88
The following tables set forth by primary risk exposure thePortfolio’s realized gains (losses) and change in unrealizedappreciation (depreciation) by type of derivative contractfor the six months ended March 31, 2012 in accordancewith ASC 815.
Realized Gain (Loss) Primary Risk Derivative ValuePortfolio Exposure Type (000)Balanced Foreign Currency
Currency Risk Exchange Contracts $ 97 Equity Risk Futures Contracts 1,262 Commodity Risk Futures Contracts (8) Interest Rate Risk Futures Contracts (7) Equity Risk Swap Agreements (177) Interest Rate Risk Swap Agreements (27)
Total $1,140
Change in Unrealized Appreciation (Depreciation) Primary Risk Derivative ValuePortfolio Exposure Type (000)Balanced Foreign Currency
Currency Risk Exchange Contracts $ (113) Equity Risk Futures Contracts 118 Commodity Risk Futures Contracts 4 Interest Rate Risk Futures Contracts 24 Equity Risk Swap Agreements 10 Interest Rate Risk Swap Agreements 26
Total $ 69
Realized Gain (Loss) Primary Risk Derivative ValuePortfolio Exposure Type (000)Core Fixed Income Interest Rate Risk Futures Contracts $ (74)
Change in Unrealized Appreciation (Depreciation) Primary Risk Derivative ValuePortfolio Exposure Type (000)Core Fixed Income Interest Rate Risk Futures Contracts $ 61
Interest Rate Risk Swap Agreements (3)
Total $ 58
Realized Gain (Loss) Primary Risk Derivative ValuePortfolio Exposure Type (000)Core Plus Fixed Income Foreign Currency
Currency Risk Exchange Contracts $ 206 Interest Rate Risk Futures Contracts 320 Interest Rate Risk Swap Agreements (575)
Total $ (49)
Change in Unrealized Appreciation (Depreciation) Primary Risk Derivative ValuePortfolio Exposure Type (000)Core Plus Fixed Income Foreign Currency
Currency Risk Exchange Contracts $ 84 Interest Rate Risk Futures Contracts (1) Interest Rate Risk Swap Agreements 476
Total $ 559
Realized Gain (Loss) Primary Risk Derivative ValuePortfolio Exposure Type (000)Corporate Bond Interest Rate Risk Futures Contracts $ (85)
Change in Unrealized Appreciation (Depreciation) Primary Risk Derivative ValuePortfolio Exposure Type (000)Corporate Bond Interest Rate Risk Futures Contracts $ 80
Interest Rate Risk Swap Agreements (13)
Total $ 67
Realized Gain (Loss) Primary Risk Derivative ValuePortfolio Exposure Type (000)Limited Duration Interest Rate Risk Futures Contracts $ (110)
Change in Unrealized Appreciation (Depreciation) Primary Risk Derivative ValuePortfolio Exposure Type (000)Limited Duration Interest Rate Risk Futures Contracts $ 40
Interest Rate Risk Swap Agreements (9)
Total $ 31
Realized Gain (Loss) Primary Risk Derivative ValuePortfolio Exposure Type (000)Long Duration Fixed Income Foreign Currency
Currency Risk Exchange Contracts $ (4) Interest Rate Risk Futures Contracts 15 Interest Rate Risk Swap Agreements (41)
Total $ (30)
Change in Unrealized Appreciation (Depreciation) Primary Risk Derivative ValuePortfolio Exposure Type (000)Long Duration Fixed Income Foreign Currency
Currency Risk Exchange Contracts $ 4 Interest Rate Risk Futures Contracts (11) Interest Rate Risk Swap Agreements 29
Total $ 22
For the six months ended March 31, 2012, Balanced andCore Plus Fixed Income Portfolio’s average monthly prin-cipal amount of foreign currency exchange contracts wasapproximately $5,993,000 and $14,196,000, averagemonthly original value of futures contracts was approxi-mately $12,025,000 and $86,207,000, and averagemonthly notional value of swap agreements was approxi-mately $18,892,000 and $284,485,000, respectively. CoreFixed Income, Corporate Bond, Limited Duration, andLong Duration Fixed Income Portfolio’s average monthlyoriginal value of futures contracts was approximately$15,066,000, $27,073,000, $43,738,000, and $2,238,000and average monthly notional value of swap agreementswas approximately $3,837,000, $159,000, $11,059,000,and $22,645,000, respectively.
4. When-Issued/Delayed Delivery Securities: CertainPortfolios purchase and sell when-issued and delayed deliv-ery securities. Securities purchased on a when-issued or de-layed delivery basis are purchased for delivery beyond thenormal settlement date at a stated price and yield, and noincome accrues to the Portfolio on such securities prior todelivery date. Payment and delivery for when-issued anddelayed delivery securities can take place up to 120 days
Notes to Financial Statements (cont’d)
2012 Semi-Annual Report
March 31, 2012 (unaudited)

89
after the date of the transaction. When the Portfolio entersinto a purchase transaction on a when-issued or delayeddelivery basis, securities are available for collateral in anamount at least equal in value to the Portfolio’s commit-ments to purchase such securities. Purchasing securities ona when-issued or delayed delivery basis may involve a riskthat the market price at the time of delivery may be lowerthan the agreed upon purchase price, in which case therecould be an unrealized loss at the time of delivery. Pur-chasing investments on a when-issued or delayed deliverybasis may be considered a form of leverage which may increase the impact that gains (losses) may have on thePortfolio.
5. Fair Value Measurement: FASB ASC 820, “Fair ValueMeasurements and Disclosures” (“ASC 820”), defines fairvalue as the value that the Fund would receive to sell aninvestment or pay to transfer a liability in a timely transac-tion with an independent buyer in the principal market, orin the absence of a principal market the most advanta-geous market for the investment or liability. ASC 820 establishes a three-tier hierarchy to distinguish between(1) inputs that reflect the assumptions market participantswould use in valuing an asset or liability developed basedon market data obtained from sources independent of thereporting entity (observable inputs) and (2) inputs that re-flect the reporting entity’s own assumptions about the as-sumptions market participants would use in valuing anasset or liability developed based on the best informationavailable in the circumstances (unobservable inputs) andto establish classification of fair value measurements fordisclosure purposes. Various inputs are used in determin-ing the value of the Fund’s investments. The inputs aresummarized in the three broad levels listed below.
• Level 1 – unadjusted quoted prices in active marketsfor identical investments
• Level 2 – other significant observable inputs (includingquoted prices for similar investments, interestrates, prepayment speeds, credit risk, etc.)
• Level 3 – significant unobservable inputs includingthe Fund’s own assumptions in determiningthe fair value of investments. Factors consid-ered in making this determination may in-clude, but are not limited to, informationobtained by contacting the issuer, analysts,or the appropriate stock exchange (for ex-change-traded securities), analysis of the is-suer’s financial statements or other availabledocuments and, if necessary, available infor-mation concerning other securities in similarcircumstances
The inputs or methodology used for valuing securities arenot necessarily an indication of the risk associated with in-vesting in those securities and the determination of the sig-nificance of a particular input to the fair valuemeasurement in its entirety requires judgment and consid-ers factors specific to each security.
In May 2011, FASB issued Accounting Standards Update(“ASU”) 2011-04. The amendments in this update are theresults of the work of FASB and the International Ac-counting Standards Board to develop common require-ments for measuring fair value and for disclosinginformation about fair value measurements, which are effective during interim and annual periods beginning af-ter December 15, 2011. Consequently, these amendmentsimprove the comparability of fair value measurements pre-sented and disclosed in the financial statements preparedin accordance with GAAP and International Financial Re-porting Standards. At this time, the Fund’s management isevaluating the implications of ASU 2011-04.
6. Indemnifications: The Fund enters into contracts thatcontain a variety of indemnifications. The Fund’s maxi-mum exposure under these arrangements is unknown.However, the Fund has not had prior claims or losses pur-suant to these contracts and expects the risk of loss to beremote.
7. Other: Security transactions are accounted for on the datethe securities are purchased or sold. Realized gains (losses)on the sale of investment securities are determined on thespecific identified cost basis. Dividend income and distri-butions are recorded on the ex-dividend date (except forcertain foreign dividends which may be recorded as soonas the Fund is informed of such dividends) net of applica-ble withholding taxes. Interest income is recognized on theaccrual basis except where collection is in doubt. Dis-counts and premiums on securities purchased are amor-tized according to the effective yield method over theirrespective lives. Most expenses of the Fund can be directlyattributed to a particular Portfolio. Expenses which cannotbe directly attributed are apportioned among the Portfo-lios based upon relative net assets or other appropriatemeasures. Income, expenses (other than class specific ex-penses) and realized and unrealized gains or losses are allo-cated to each class of shares based upon their relative netassets.
B. Investment Advisory Fees: Morgan Stanley InvestmentManagement Inc. (the “Adviser”), a wholly-owned subsidiaryof Morgan Stanley, provides the Fund with investment advi-sory services under the terms of an Investment Advisory
Notes to Financial Statements (cont’d)
2012 Semi-Annual Report
March 31, 2012 (unaudited)

90
Agreement, paid quarterly, at the annual rates of the averagedaily net assets indicated below. Average Daily AdvisoryPortfolio Net Assets FeeBalanced 0.450%Mid Cap Growth 0.500Core Fixed Income 0.375Core Plus Fixed Income first $1 billion 0.375
over $1 billion 0.300Corporate Bond 0.375High Yield 0.600Limited Duration 0.300Long Duration Fixed Income 0.375
The Adviser has agreed to reduce its advisory fee and/or reim-burse certain Portfolios, if necessary, if such fees would causethe total annual operating expenses of the Portfolios to exceedits expense limitations. In determining the actual amount offee waiver and/or expense reimbursement for the Portfolios, ifany, the Adviser excludes from annual operating expenses cer-tain investment related expenses. Expense LimitationsPortfolio Class I Class P Class H Class LCore Fixed Income 0.50% 0.75% —% —%High Yield 0.75 1.00 1.00 1.25Long Duration Fixed Income 0.50 0.75 — —
The fee waivers and/or expense reimbursements for the Portfo-lios will continue for at least one year or until such time thatthe Fund’s Board of Trustees acts to discontinue all or a por-tion of such waivers and/or expense reimbursements when itdeems such action is appropriate. For the six months endedMarch 31, 2012, the Portfolios had advisory fees waivedand/or certain expenses reimbursed as follows: Adivsory Fees Waived and/or Reimbursed Portfolio (000)Core Fixed Income $101High Yield 31Long Duration Fixed Income 66
C. Administration Fees: The Adviser also serves as Admin-istrator to the Fund and provides administrative services pur-suant to an Administration Agreement for an annual fee,accrued daily and paid monthly, of 0.08% of each Portfolio’saverage daily net assets.
Under a Sub-Administration Agreement between the Adminis-trator and State Street Bank and Trust Company (“StateStreet”), State Street provides certain administrative services tothe Fund. For such services, the Administrator pays State Streeta portion of the fee the Administrator receives from the Fund.
D. Distribution and Shareholder Servicing Fees: Morgan Stanley Distribution, Inc. (“MSDI” or the “Distribu-tor”), a wholly-owned subsidiary of the Adviser, serves as theDistributor of the Fund.
Pursuant to a Shareholder Services Plan, each Portfolio maypay the Distributor and other affiliated and unaffiliated bro-ker-dealers, financial institutions and/or intermediaries a serv-ice fee, accrued daily and paid monthly, at an annual rate of upto 0.25% of the Portfolio’s average daily net assets attributableto Class P and Class H shares, respectively. The Distributor hasagreed to waive 0.10% of the 0.25% shareholder servicing feeit is entitled to receive from the Class P shares’ average dailynet assets for the Corporate Bond Portfolio.
The Fund has adopted a Distribution and Shareholder ServicesPlan with respect to Class L shares pursuant to Rule 12b-1 un-der the Act. Under the Distribution and Shareholder ServicesPlan, the Portfolio pays the Distributor a distribution fee, accrued daily and paid monthly, at an annual rate of 0.25%and a shareholder service fee, accrued daily and paid monthly,at an annual rate of 0.25% of the Portfolio’s average daily netassets attributable to Class L shares. For the six months endedMarch 31, 2012, the Corporate Bond Portfolio waived lessthan $500.
The distribution and shareholder servicing fees are used to support the expenses associated with servicing and maintainingaccounts. The Distributor may compensate other parties forproviding shareholder support services to investors who purchase Class P, Class H and Class L shares.
E. Dividend Disbursing and Transfer Agent: TheFund’s dividend disbursing and transfer agent is Morgan Stan-ley Services Company Inc. (“Morgan Stanley Services”). Pur-suant to a transfer agency agreement, the Fund pays MorganStanley Services a fee based on the number of classes, accountsand transactions relating to the Portfolios of the Fund.
F. Custodian Fees: State Street (the “Custodian”) serves asCustodian for the Fund in accordance with a custodian agree-ment. The Custodian holds cash, securities, and other assets ofthe Fund as required by the Act.
The Fund has entered into an arrangement with its Custodianwhereby credits realized on uninvested cash balances were usedto offset a portion of each Portfolio’s expenses. If applicable,these custodian credits are shown as “Expense Offset” in theStatements of Operations.
Notes to Financial Statements (cont’d)
2012 Semi-Annual Report
March 31, 2012 (unaudited)
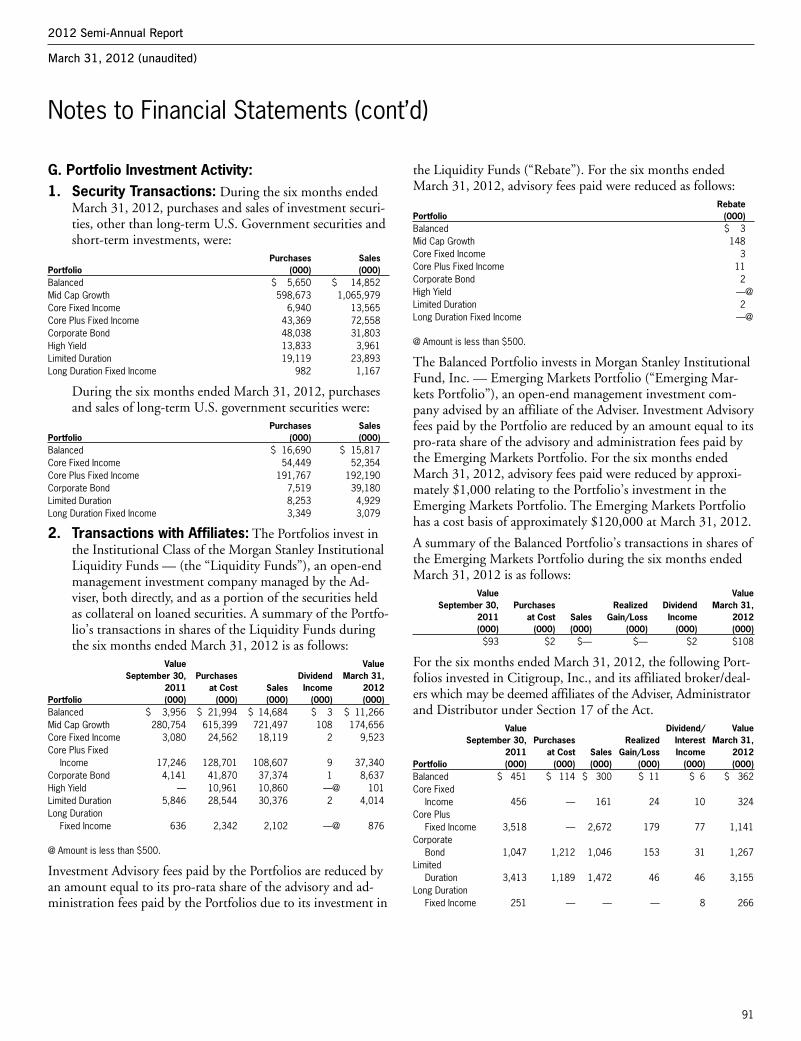
91
G. Portfolio Investment Activity:1. Security Transactions: During the six months ended
March 31, 2012, purchases and sales of investment securi-ties, other than long-term U.S. Government securities andshort-term investments, were:
Purchases Sales Portfolio (000) (000)Balanced $ 5,650 $ 14,852Mid Cap Growth 598,673 1,065,979Core Fixed Income 6,940 13,565Core Plus Fixed Income 43,369 72,558Corporate Bond 48,038 31,803High Yield 13,833 3,961Limited Duration 19,119 23,893Long Duration Fixed Income 982 1,167
During the six months ended March 31, 2012, purchasesand sales of long-term U.S. government securities were:
Purchases Sales Portfolio (000) (000)Balanced $ 16,690 $ 15,817Core Fixed Income 54,449 52,354Core Plus Fixed Income 191,767 192,190Corporate Bond 7,519 39,180Limited Duration 8,253 4,929Long Duration Fixed Income 3,349 3,079
2. Transactions with Affiliates: The Portfolios invest inthe Institutional Class of the Morgan Stanley InstitutionalLiquidity Funds — (the “Liquidity Funds”), an open-endmanagement investment company managed by the Ad-viser, both directly, and as a portion of the securities heldas collateral on loaned securities. A summary of the Portfo-lio’s transactions in shares of the Liquidity Funds duringthe six months ended March 31, 2012 is as follows:
Value Value September 30, Purchases Dividend March 31, 2011 at Cost Sales Income 2012 Portfolio (000) (000) (000) (000) (000)Balanced $ 3,956 $ 21,994 $ 14,684 $ 3 $ 11,266Mid Cap Growth 280,754 615,399 721,497 108 174,656Core Fixed Income 3,080 24,562 18,119 2 9,523Core Plus Fixed
Income 17,246 128,701 108,607 9 37,340Corporate Bond 4,141 41,870 37,374 1 8,637High Yield — 10,961 10,860 —@ 101Limited Duration 5,846 28,544 30,376 2 4,014Long Duration
Fixed Income 636 2,342 2,102 —@ 876
@ Amount is less than $500.
Investment Advisory fees paid by the Portfolios are reduced byan amount equal to its pro-rata share of the advisory and ad-ministration fees paid by the Portfolios due to its investment in
the Liquidity Funds (“Rebate”). For the six months endedMarch 31, 2012, advisory fees paid were reduced as follows: Rebate Portfolio (000)Balanced $ 3Mid Cap Growth 148Core Fixed Income 3Core Plus Fixed Income 11Corporate Bond 2High Yield —@Limited Duration 2Long Duration Fixed Income —@
@ Amount is less than $500.
The Balanced Portfolio invests in Morgan Stanley InstitutionalFund, Inc. — Emerging Markets Portfolio (“Emerging Mar-kets Portfolio”), an open-end management investment com-pany advised by an affiliate of the Adviser. Investment Advisoryfees paid by the Portfolio are reduced by an amount equal to itspro-rata share of the advisory and administration fees paid bythe Emerging Markets Portfolio. For the six months endedMarch 31, 2012, advisory fees paid were reduced by approxi-mately $1,000 relating to the Portfolio’s investment in theEmerging Markets Portfolio. The Emerging Markets Portfoliohas a cost basis of approximately $120,000 at March 31, 2012.
A summary of the Balanced Portfolio’s transactions in shares ofthe Emerging Markets Portfolio during the six months endedMarch 31, 2012 is as follows: Value Value September 30, Purchases Realized Dividend March 31, 2011 at Cost Sales Gain/Loss Income 2012 (000) (000) (000) (000) (000) (000)
$93 $2 $— $— $2 $108
For the six months ended March 31, 2012, the following Port-folios invested in Citigroup, Inc., and its affiliated broker/deal-ers which may be deemed affiliates of the Adviser, Administratorand Distributor under Section 17 of the Act. Value Dividend/ Value September 30, Purchases Realized Interest March 31, 2011 at Cost Sales Gain/Loss Income 2012 Portfolio (000) (000) (000) (000) (000) (000)Balanced $ 451 $ 114 $ 300 $ 11 $ 6 $ 362Core Fixed
Income 456 — 161 24 10 324Core Plus
Fixed Income 3,518 — 2,672 179 77 1,141Corporate
Bond 1,047 1,212 1,046 153 31 1,267Limited
Duration 3,413 1,189 1,472 46 46 3,155Long Duration
Fixed Income 251 — — — 8 266
Notes to Financial Statements (cont’d)
2012 Semi-Annual Report
March 31, 2012 (unaudited)

92
During the six months ended March 31, 2012, the followingPortfolios incurred brokerage commissions with Citigroup,Inc. and its affiliated broker/dealers, which may be deemed af-filiates of the Adviser, Administrator and Distributor underSection 17 of the Act: Broker Commissions Portfolio (000)Mid Cap Growth $2
The Fund has an unfunded Deferred Compensation Plan (the“Compensation Plan”), which allows each independent Trusteeto defer payment of all, or a portion, of the fees he or she re-ceives for serving on the Board of Trustees. Each eligible Trusteegenerally may elect to have the deferred amounts credited witha return equal to the total return on one or more of the MorganStanley funds that are offered as investment options under theCompensation Plan. Appreciation/depreciation and distribu-tions received from these investments are recorded with an off-setting increase/decrease in the deferred compensationobligation and do not affect the net asset value of the Portfolio.
H. Securities Lending: Certain Portfolios lend securities toqualified financial institutions, such as broker-dealers, to earnadditional income. Any increase or decrease in the fair value ofthe securities loaned that might occur and any interest earnedor dividends declared on those securities during the term of theloan would remain in the Portfolio. Portfolios that lend securi-ties receive cash or securities as collateral in an amount equal toor exceeding 100% of the current fair value of the loaned secu-rities. The collateral is marked-to-market daily, by the securitieslending agent, to ensure that a minimum of 100% collateralcoverage is maintained.
Based on pre-established guidelines, the securities lendingagent invests any cash collateral that is received in an affiliatedmoney market portfolio and repurchase agreements backed bythe U.S. Treasury and Agency securities. Securities lending in-come is generated from the earnings on the invested collateraland borrowing fees, less any rebates owed to the borrowers andcompensation to the lending agent, and is recorded as “Incomefrom Securities Loaned — Net” in the Portfolios’ Statementsof Operations. Risks in securities lending transactions are thata borrower may not provide additional collateral when requiredor return the securities when due, and that the value of theshort-term investments will be less than the amount of cashcollateral plus any rebate that is required to be returned to theborrower.
The value of the loaned securities and related collateral out-standing at March 31, 2012 were as follows: Value of Value of Invested Uninvested Value of Loaned Collateral Cash Cash Non-Cash Securities Outstanding Collateral* Collateral Collateral**Portfolio (000) (000) (000) (000) (000)Balanced $ 7,630 $ 7,793 $ 7,083 $21 $ 689Core Fixed Income 8,402 8,639 6,505 20 2,114Core Plus Fixed
Income 20,904 21,488 15,468 47 5,973Corporate Bond 9,206 9,451 9,422 29 —
* The Portfolios invest cash collateral received in Repurchase Agreements and the Mor-gan Stanley Institutional Liquidity Funds as reported in the Portfolios of Investments.
** The Portfolios received non-cash collateral in the form of U.S. Government Agenciesand Obligations, which the Portfolios cannot sell or repledge and, accordingly, arenot reflected in the Portfolios of Investments.
I. Federal Income Taxes: It is each Portfolio’s intention tocontinue to qualify as a regulated investment company and dis-tribute all of its taxable and tax-exempt income. Accordingly,no provision for Federal income taxes is required in the finan-cial statements.
Dividend income and distributions to shareholders arerecorded on the ex-dividend date. Interest income is recognizedon the accrual basis. Dividends from net investment income, ifany, are declared and paid quarterly except for those of theHigh Yield Portfolio and the Limited Duration Portfolio whichare declared and paid monthly and those of the Mid CapGrowth Portfolio, which are declared and paid annually. Netrealized capital gains, if any, are distributed at least annually.
A Portfolio may be subject to taxes imposed by countries inwhich it invests. Such taxes are generally based on incomeand/or capital gains earned or repatriated. Taxes are accruedbased on net investment income, net realized gains and net unrealized appreciation as such income and/or gains areearned. Taxes may also be based on transactions in foreign cur-rency and are accrued based on the value of investments de-nominated in such currency.
FASB ASC 740-10 “Income Taxes — Overall” sets forth a min-imum threshold for financial statement recognition of the bene-fit of a tax position taken or expected to be taken in a taxreturn. Management has concluded there are no significant un-certain tax positions that would require recognition in the fi-nancial statements. If applicable, the Portfolios recognizeinterest accrued related to unrecognized tax benefits in “InterestExpense” and penalties in “Other Expenses” in the Statementsof Operations. The Portfolios file tax returns with the U.S. In-ternal Revenue Service, New York and various states. Each ofthe tax years in the four-year period ended September 30, 2011,remains subject to examination by taxing authorities.
Notes to Financial Statements (cont’d)
2012 Semi-Annual Report
March 31, 2012 (unaudited)

93
The tax character of distributions paid may differ from thecharacter of distributions shown in the Statements of Changesin Net Assets due to short-term capital gains being treated asordinary income for tax purposes. The tax character of distri-butions paid during fiscal 2011 and 2010 was as follows: 2011 2010 Distributions Distributions Paid From: Paid From: Long- Long- term term Ordinary Capital Paid-In Ordinary Capital Paid-In Income Gain Capital Income Gain Capital Portfolio (000) (000) (000) (000) (000) (000)Balanced $ 685 $ — $— $ 918 $ — $ —Mid Cap Growth 8,346 4,087 — 492 — —Core Fixed Income 2,135 — — 2,896 — —Core Plus Fixed Income 16,358 — — 30,975 — —Corporate Bond 2,333 — — 4,183 — —Limited Duration 3,270 — — 5,288 — 161Long Duration Fixed
Income 1,794 839 — 1,544 1,642 —
The amount and character of income and gains to be distrib-uted are determined in accordance with income tax regulationswhich may differ from GAAP. These book/tax differences areeither considered temporary or permanent in nature.
Temporary differences are attributable to differing book andtax treatments for the timing of the recognition of gains(losses) on certain investment transactions and the timing ofthe deductibility of certain expenses.
Permanent differences, primarily due to differing treatments ofgains (losses) related to foreign currency transactions, foreignfutures transactions, basis adjustments for swap transactions,net operating losses, distribution redesignations, nondeductibleexpenses, paydown adjustments and expiration of capital losscarryforwards, resulted in the following reclassifications amongthe components of net assets at September 30, 2011: Accumulated Undistributed (Distributions in Excess of) Net Accumulated Investment Net Realized Paid-In Income (Loss) Gain (Loss) Capital Portfolio (000) (000) (000)Balanced $ 71 $ 3,291 $ (3,362)Mid Cap Growth 2,968 423 (3,391)Core Fixed Income 209 (158) (51)Core Plus Fixed Income 2,598 18,557 (21,155)Corporate Bond 214 (214) —@Limited Duration 118 (107) (11)Long Duration Fixed Income (26) 26 —@
@ Amount is less than $500.
At September 30, 2011, the components of distributable earn-ings on a tax basis were as follows: Undistributed Undistributed Ordinary Long-term Income Capital GainPortfolio (000) (000)Balanced $ 446 $ —Mid Cap Growth — 310,861Core Fixed Income 976 —Core Plus Fixed Income 6,494 —Corporate Bond 917 —Limited Duration 825 —Long Duration Fixed Income 338 371
At March 31, 2012, cost, unrealized appreciation, unrealizeddepreciation, and net unrealized appreciation (depreciation) forU.S. Federal income tax purposes of the investments of each ofthe Portfolios were: Net Appreciation Cost Appreciation Depreciation (Depreciation) Portfolio (000) (000) (000) (000)
Balanced $ 47,113 $ 2,779 $ (1,190) $ 1,589Mid Cap Growth 5,848,761 1,647,763 (397,589) 1,250,174Core Fixed Income 71,064 2,204 (319) 1,885Core Plus Fixed
Income 296,940 10,412 (4,616) 5,796Corporate Bond 58,854 1,946 (282) 1,664High Yield 9,999 165 (58) 107Limited Duration 154,640 3,045 (171) 2,874Long Duration Fixed
Income 21,194 2,904 (155) 2,749
On December 22, 2010, the Regulated Investment CompanyModernization Act of 2010 (the “Modernization Act”) wassigned into law. The Modernization Act modernizes several taxprovisions related to Regulated Investment Companies(“RICs”) and their shareholders. One key change made by theModernization Act is that capital losses will generally retaintheir character as short-term or long-term and may be carriedforward indefinitely to offset future gains. These losses are uti-lized before other capital loss carryforwards that expire. Gener-ally, the Modernization Act is effective for taxable yearsbeginning after December 22, 2010.
At September 30, 2011, the following Portfolios had availablefor Federal income tax purposes unused capital losses, whichwill expire on the indicated dates: Expiration Date September 30, 2012 2013 2014 2015Portfolio (000) (000) (000) (000)Balanced $— $ — $ — $ —Core Fixed Income — — — —Core Plus Fixed Income — — 7,135 15,680Corporate Bond — — — —Limited Duration — 8,019 8,229 7,068
Notes to Financial Statements (cont’d)
2012 Semi-Annual Report
March 31, 2012 (unaudited)

94
Expiration Date September 30, 2016 2017 2018 2019 TotalPortfolio (000) (000) (000) (000) (000)Balanced $ — $ 3,501 $ 2,441 $— $ 5,942Core Fixed Income 196 35,829 3,319 — 39,344Core Plus Fixed Income 5,336 254,264 201,462 — 483,877Corporate Bond 2,526 51,893 8,130 — 62,549Limited Duration 265 200,864 33,504 — 257,949
During the year ended September 30, 2011, the followingPortfolios expired capital loss carryforwards for U.S. Federal income tax purposes as follows: Expired Capital Loss Carryforwards Portfolio (000)Balanced $ 3,362Core Plus Fixed Income 21,148
To the extent that capital loss carryovers are used to offset anyfuture capital gains realized during the carryover period as pro-vided by U.S. Federal income tax regulations, no capital gainstax liability will be incurred by a Portfolio for gains realizedand not distributed. To the extent that capital gains are offset,such gains will not be distributed to the shareholders. Duringthe year ended September 30, 2011, the following Portfoliosutilized capital loss carryforwards for U.S. Federal income taxpurposes of approximately: Capital Loss Carryforwards UtilizedPortfolio (000)Balanced $ 1,248Mid Cap Growth 344,519Core Fixed Income 1,374Core Plus Fixed Income 15,782Corporate Bond 1,604Limited Duration 234
Capital losses and specified ordinary losses, including currencylosses, incurred after October 31 and other ordinary losses in-curred after December 31 but within the taxable year aredeemed to arise on the first day of the Portfolio’s next taxableyear. For the year ended September 30, 2011, the Portfolios de-ferred to October 1, 2011 for U.S. Federal Income tax pur-poses the following losses: Post-October Capital Currency Losses Losses Portfolio (000) (000)Mid Cap Growth $ — $842Limited Duration 726 —
J. Other: At March 31, 2012, certain Portfolios had other-wise unaffiliated record owners of 10% or greater. Investmentactivities of these shareholders could have a material impact on
these Portfolios. These Portfolios and the aggregate percentageof such owners were as follows:
Percentage of OwnershipPortfolio Class I Class PBalanced 60.5% 96.5%Mid Cap Growth 43.7 59.5Core Plus Fixed Income 45.6 45.7
K. Subsequent Events: The Balanced, Core Fixed Income,Core Plus Fixed Income and Limited Duration Portfolios com-menced operations on April 30, 2012 with Class H andClass L shares.
The Board of Trustees of the Fund approved a Plan of Liquida-tion with respect to the Long Duration Fixed Income Portfolio(the “Portfolio”). Pursuant to the Plan of Liquidation, substan-tially all of the assets of the Portfolio will be liquidated, knownliabilities of the Portfolio will be satisfied, the remaining pro-ceeds will be distributed to the Portfolio’s shareholders, and allof the issued and outstanding shares of the Portfolio will be re-deemed (the “Liquidation”). The Liquidation is expected tooccur on or about May 11, 2012.
Notes to Financial Statements (cont’d)
2012 Semi-Annual Report
March 31, 2012 (unaudited)
The Board of Trustees of the Fund approved various changes with respect to the Balanced Portfolio (the “Portfolio”), effective on or about July 16, 2012, including (i) changing the Portfolio’s name to Global Strategist Portfolio, (ii) changing the Portfolio’s principal investment strategies and (iii) changing the Portfolio’s primary benchmark index to the Morgan Stanley Capital International (MSCI) All Country World Index (ACWI).

95
AN IMPORTANT NOTICE CONCERNING OUR U.S. PRIVACY POLICY
This privacy notice describes the U.S. privacy policy of Morgan Stanley Distribution, Inc., and the Morgan Stanley family of mutual funds(“us”, “our”, “we”).
We are required by federal law to provide you with notice of our U.S. privacy policy (“Policy”). This Policy applies to both ourcurrent and former clients unless we state otherwise and is intended for individual clients who purchase products or receive servicesfrom us for personal, family or household purposes. This Policy is not applicable to partnerships, corporations, trusts or other non-individual clients or account holders, nor is this Policy applicable to individuals who are either beneficiaries of a trust for which weserve as trustee or participants in an employee benefit plan administered or advised by us. This Policy is, however, applicable toindividuals who select us to be a custodian of securities or assets in individual retirement accounts, 401(k) accounts, or accountssubject to the Uniform Gifts to Minors Act.
This notice sets out our business practices to protect your privacy; how we collect and share personal information about you; andhow you can limit our sharing or certain uses by others of this information. We may amend this Policy at any time, and will informyou of any changes to our Policy as required by law.
WE RESPECT YOUR PRIVACY
We appreciate that you have provided us with your personal financial information and understand your concerns about yourinformation. We strive to safeguard the information our clients entrust to us. Protecting the confidentiality and security of clientinformation is an important part of how we conduct our business.
This notice describes what personal information we collect about you, how we collect it, when we may share it with others, andhow certain others may use it. It discusses the steps you may take to limit our sharing of certain information about you with ouraffiliated companies, including, but not limited to our affiliated banking businesses, brokerage firms and credit service affiliates. Italso discloses how you may limit our affiliates’ use of shared information for marketing purposes.
Throughout this Policy, we refer to the nonpublic information that personally identifies you as “personal information.” We also usethe term “affiliated company” in this notice. An affiliated company is a company in our family of companies and includescompanies with the Morgan Stanley name. These affiliated companies are financial institutions such as broker-dealers, banks,investment advisers and credit card issuers. We refer to any company that is not an affiliated company as a nonaffiliated third party.For purposes of Section 5 of this notice, and your ability to limit certain uses of personal information by our affiliates, this noticeapplies to the use of personal information by our affiliated companies.
1. WHAT PERSONAL INFORMATION DO WE COLLECT FROM YOU?
We may collect the following types of information about you: (i) information provided by you, including information fromapplications and other forms we receive from you, (ii) information about your transactions with us or our affiliates,(iii) information about your transactions with nonaffiliated third parties, (iv) information from consumer reporting agencies,(v) information obtained from our websites, and (vi) information obtained from other sources. For example:
• We collect information such as your name, address, e-mail address, telephone/fax numbers, assets, income and investmentobjectives through applications and other forms you submit to us.
• We may obtain information about account balances, your use of account(s) and the types of products and services you prefer toreceive from us through your dealings and transactions with us and other sources.
• We may obtain information about your creditworthiness and credit history from consumer reporting agencies.
• We may collect background information from and through third-party vendors to verify representations you have made and tocomply with various regulatory requirements.
2. WHEN DO WE DISCLOSE PERSONAL INFORMATION WE COLLECT ABOUT YOU?
We may disclose personal information we collect about you in each of the categories listed above to affiliated and nonaffiliated thirdparties.
U.S. Privacy Policy
2012 Semi-Annual Report
March 31, 2012 (unaudited)

96
a. Information we disclose to affiliated companies.
We may disclose personal information that we collect about you to our affiliated companies to manage your account(s) effectively,to service and process your transactions, and to let you know about products and services offered by us and affiliated companies, tomanage our business, and as otherwise required or permitted by law. Offers for products and services from affiliated companies aredeveloped under conditions designed to safeguard your personal information.
b. Information we disclose to third parties.
We may disclose personal information that we collect about you to nonaffiliated third parties to provide marketing services on ourbehalf or to other financial institutions with whom we have joint marketing agreements. We may also disclose all of the informationwe collect to other nonaffiliated third parties for our everyday business purposes, such as to process transactions, maintainaccount(s), respond to court orders and legal investigations, report to credit bureaus, offer our own products and services, protectagainst fraud, for institutional risk control, to perform services on our behalf, and as otherwise required or permitted by law.
When we share personal information about you with a nonaffiliated third party, they are required to limit their use of personalinformation about you to the particular purpose for which it was shared and they are not allowed to share personal informationabout you with others except to fulfill that limited purpose or as may be permitted or required by law.
3. HOW DO WE PROTECT THE SECURITY AND CONFIDENTIALITY OF PERSONAL INFORMATION WECOLLECT ABOUT YOU?
We maintain physical, electronic and procedural security measures that comply with applicable law and regulations to helpsafeguard the personal information we collect about you. We have internal policies governing the proper handling of clientinformation by employees. Third parties that provide support or marketing services on our behalf may also receive personalinformation about you, and we require them to adhere to appropriate security standards with respect to such information.
4. HOW CAN YOU LIMIT OUR SHARING CERTAIN PERSONAL INFORMATION ABOUT YOU WITH OURAFFILIATED COMPANIES FOR ELIGIBILITY DETERMINATION?
By following the opt-out procedures in Section 6, below, you may limit the extent to which we share with our affiliated companies,personal information that was collected to determine your eligibility for products and services such as your credit reports and otherinformation that you have provided to us or that we may obtain from third parties (“eligibility information”). Eligibilityinformation does not include your identification information or personal information pertaining to our transactions or experienceswith you. Please note that, even if you direct us not to share eligibility information with our affiliated companies, we may still shareyour personal information, including eligibility information, with our affiliated companies under circumstances that are permittedunder applicable law, such as to process transactions or to service your account.
5. HOW CAN YOU LIMIT THE USE OF CERTAIN PERSONAL INFORMATION ABOUT YOU BY OUR AFFILIATEDCOMPANIES FOR MARKETING?
By following the opt-out instructions in Section 6, below, you may limit our affiliated companies from marketing their products orservices to you based on personal information we disclose to them. This information may include, for example, your income andaccount history with us. Please note that, even if you choose to limit our affiliated companies from using personal informationabout you that we may share with them for marketing their products and services to you, our affiliated companies may use yourpersonal information that they obtain from us to market to you in circumstances permitted by law, such as if the affiliated partyhas its own relationship with you.
U.S. Privacy Policy (cont’d)
2012 Semi-Annual Report
March 31, 2012 (unaudited)

97
6. HOW CAN YOU SEND US AN OPT-OUT INSTRUCTION?
If you wish to limit our sharing of eligibility information about you with our affiliated companies, or our affiliated companies’ useof personal information for marketing purposes, as described in this notice, you may do so by:
• Calling us at (800) 548-7786Monday–Friday between 8a.m. and 5p.m. (EST)
• Writing to us at the following address:
Morgan Stanley Services Company Inc.c/o Privacy Coordinator201 Plaza Two, 3rd FloorJersey City, New Jersey 07311
If you choose to write to us, your request should include: your name, address, telephone number and account number(s) to whichthe opt-out applies and whether you are opting out with respect to sharing of eligibility information (Section 4 above), orinformation used for marketing (Section 5 above), or both. Written opt-out requests should not be sent with any othercorrespondence. In order to process your request, we require that the request be provided by you directly and not through a thirdparty. Once you have informed us about your privacy preferences, your opt-out preference will remain in effect with respect to thisPolicy (as it may be amended) until you notify us otherwise. If you are a joint account owner, we will accept instructions from anyone of you and apply those instructions to the entire account.
Please understand that if you limit our sharing or our affiliated companies’ use of personal information, you and any joint accountholder(s) may not receive information about our affiliated companies’ products and services, including products or services thatcould help you manage your financial resources and achieve your investment objectives.
If you have more than one account or relationship with us, please specify the accounts to which you would like us to apply yourprivacy choices. If you have accounts or relationships with our affiliates, you may receive multiple privacy policies from them, andwill need to separately notify those companies of your privacy choices for those accounts or relationships.
7. WHAT IF AN AFFILIATED COMPANY BECOMES A NONAFFILIATED THIRD PARTY?
If, at any time in the future, an affiliated company becomes a nonaffiliated third party, further disclosures of personal informationmade to the former affiliated company will be limited to those described in Section 2(b) above relating to nonaffiliated thirdparties. If you elected under Section 6 to limit disclosures we make to affiliated companies, or use of personal information byaffiliated companies, your election will not apply to use by any former affiliated company of your personal information in theirpossession once it becomes a nonaffiliated third party.
U.S. Privacy Policy (cont’d)
2012 Semi-Annual Report
March 31, 2012 (unaudited)
SPECIAL NOTICE TO RESIDENTS OF VERMONTThe following section supplements our Policy with respect to our individualclients who have a Vermont address and supersedes anything to the contraryin the above Policy with respect to those clients only.
The State of Vermont requires financial institutions to obtain your consentprior to sharing personal information that they collect about you with
nonaffiliated third parties, or eligibility information with affiliated companies,other than in certain limited circumstances. Except as permitted by law, wewill not share personal information we collect about you with nonaffiliatedthird parties or eligibility information with affiliated companies, unless youprovide us with your written consent to share such information.
SPECIAL NOTICE TO RESIDENTS OF CALIFORNIAThe following section supplements our Policy with respect to our individualclients who have a California address and supersedes anything to thecontrary in the above Policy with respect to those clients only.
In response to a California law, if your account has a California home address,your personal information will not be disclosed to nonaffiliated third partiesexcept as permitted by applicable California law, and we will limit sharing suchpersonal information with our affiliates to comply with California privacy lawsthat apply to us.
©2012 Morgan Stanley

98
Trustee and Officer Information
2012 Semi-Annual Report
March 31, 2012 (unaudited)
Investment Adviser and AdministratorMorgan Stanley Investment Management Inc.522 Fifth AvenueNew York, New York 10036DistributorMorgan Stanley Distribution, Inc.522 Fifth AvenueNew York, New York 10036Dividend Disbursing and Transfer AgentMorgan Stanley Services Company Inc.P.O. Box 219804Kansas City, Missouri 64121CustodianState Street Bank and Trust CompanyOne Lincoln StreetBoston, Massachusetts 02111Legal CounselDechert LLP1095 Avenue of the AmericasNew York, New York 10036Independent Registered Public Accounting FirmErnst & Young LLP200 Clarendon StreetBoston, Massachusetts 02116Reporting to Shareholders
Each Morgan Stanley Fund provides a complete schedule of portfolio holdings in its semi-annual and annual reports within 60 days of the end of the Fund’ssecond and fourth fiscal quarters. The semi-annual reports and the annual reports are filed electronically with the Securities and Exchange Commission (SEC)on Form N-CSRS and Form N-CSR, respectively. Morgan Stanley also delivers the semi-annual and annual reports to Fund shareholders and makes thesereports available on its public website, www.morganstanley.com/im. Each Morgan Stanley Fund also files a complete schedule of portfolio holdings with theSEC for the Fund’s first and third fiscal quarters on Form N-Q. Morgan Stanley does not deliver the reports for the first and third fiscal quarters to shareholdersnor are the reports posted to the Morgan Stanley public website. You may, however, obtain the Form N-Q filings (as well as the Form N-CSR and N-CSRSfilings) by accessing the SEC’s website, www.sec.gov. You may also review and copy them at the SEC’s public reference room in Washington, DC. Informationon the operation of the SEC’s Public Reference Room may be obtained by calling the SEC toll free at 1-(800) SEC-0330. You can also request copies of thesematerials, upon payment of a duplicating fee, by electronic request at the SEC’s email address ([email protected]) or by writing the Public Reference sectionof the SEC, Washington, DC 20549-0102.
Proxy Voting Policies and Procedures and Proxy Voting RecordYou may obtain a copy of the Fund’s Proxy Voting Policy and Procedures and information regarding how the Fund voted proxies relating to portfolio securitiesduring the most recent twelve-month period ended June 30, without charge, upon request, by calling toll free 1-(800) 548-7786 or by visiting our website atwww.morganstanley.com/im. This information is also available on the SEC’s website at www.sec.gov.
This report is authorized for distribution only when preceded or accompanied by a prospectus of the Morgan Stanley Institutional Fund Trust which describes indetail each Investment Portfolio’s investment policies, risks, fees and expenses. Please read the prospectus carefully before you invest or send money. Foradditional information, including information regarding the investments comprising the Portfolio, please visit our website at www.morganstanley.com/im or calltoll free 1-(800) 548-7786.
TrusteesMichael E. Nugent
Frank L. Bowman
Michael Bozic
Kathleen A. Dennis
James F. Higgins
Dr. Manuel H. Johnson
Joseph J. Kearns
Michael F. Klein
W. Allen Reed
Fergus Reid
OfficersMichael E. NugentChairperson of the Board and Trustee
Arthur LevPresident and Principal Executive Officer
Mary Ann PicciottoChief Compliance Officer
Stefanie V. Chang YuVice President
Mary E. MullinSecretary
Francis J. SmithTreasurer and Principal Financial Officer

(This Page has been left blank intentionally.)

(This Page has been left blank intentionally.)


Printed in U.S.A.This Report has been prepared for shareholders and may be distributedto others only if preceded or accompanied by a current prospectus.
Morgan Stanley Investment Management Inc.522 Fifth AvenueNew York, New York 10036
© 2012 Morgan Stanley
IFEQFISAN 3/12IU12-01055P-Y03/12