morien corporate presentation - morien resources
TRANSCRIPT
Morien Resources Corp.
TSX-V: MOX morienres.com January 2018
Highly Differentiated, with Dividends!
Forward Looking Statements
2
Some of the statements made by Morien Resources Corp. (“Morien”) in this presentation may constitute "forward-looking information" as defined under applicable securities laws. These statements reflect Morien's current expectations of future revenues and business prospects and opportunities and are based on information
currently available to Morien. Morien cautions that actual performance will be affected by a number of factors, many of which are beyond its control, and that future events and results may vary substantially from what Morien
currently foresees. Factors that could cause actual results to differ materially from those in forward-looking statements include risks and uncertainties described in Morien’s annual information form filed with the Canadian
Securities regulators on SEDAR (www.sedar.com). Morien cautions that its royalty revenue will be based on production by third party property owners and operators who will be responsible for determining the manner and timing for the properties forming part of Morien’s royalty portfolio. These third party owners and operators are
also subject to risk factors that could cause actual results to differ materially from those predicted herein including: volatility in financial markets or general economic conditions; capital requirements and the need for additional financing; fluctuations in the rates of exchange for the currencies of Canada and the United States; prices for commodities including gold, coal and aggregate; unanticipated changes in production, mineral reserves and
mineral resources, metallurgical recoveries and/or exploration results; changes in regulations and unpredictable political or economic developments; loss of key personnel; labour disputes; and ineffective title to mineral claims
or property. There are other business risks and hazards associated with mineral exploration, development and mining. Although Morien believes that the forward-looking information contained herein is based on reasonable
assumptions, readers cannot be assured that actual results will be consistent with such statements. Morien expressly disclaims any intention or obligation to update or revise any forward-looking information in this news
release, whether as a result of new information, events or otherwise, except in accordance with applicable securities laws. Unless otherwise indicated, all dollar values herein are in C$.
A Highly Differentiated Strategy
3
Morien Resources Corp. Definition: A Canadian based, dividend-paying, mining development company that holds royalty interests in two (coal and aggregates) world class, tidewater accessed projects. The coal project recently commenced production and the aggregate project is expected to commence production in 2020. Morien’s management team exercises ruthless discipline in managing both the top and bottom halves of the financial ledger. Shareholder returns are paramount over corporate size, number or scale of assets and industry recognition.
Key Value Drivers
4
§ Dividend Policy • Inaugural quarterly, variable dividend announced December 2017 • Tied to royalty that is driven by seaborne metallurgical coal prices
§ Royalty Revenues • Strong returns, low risk
§ Strong Cash Position • $3.8 mln
§ Two Top Tier Royalty Assets • Anticipated average royalty revenue of $4 to $8 mln per annum
§ Future Growth • Active project generation program
§ Buying Back Stock • Normal course issuer bid - 12% of company purchased since 2015
5
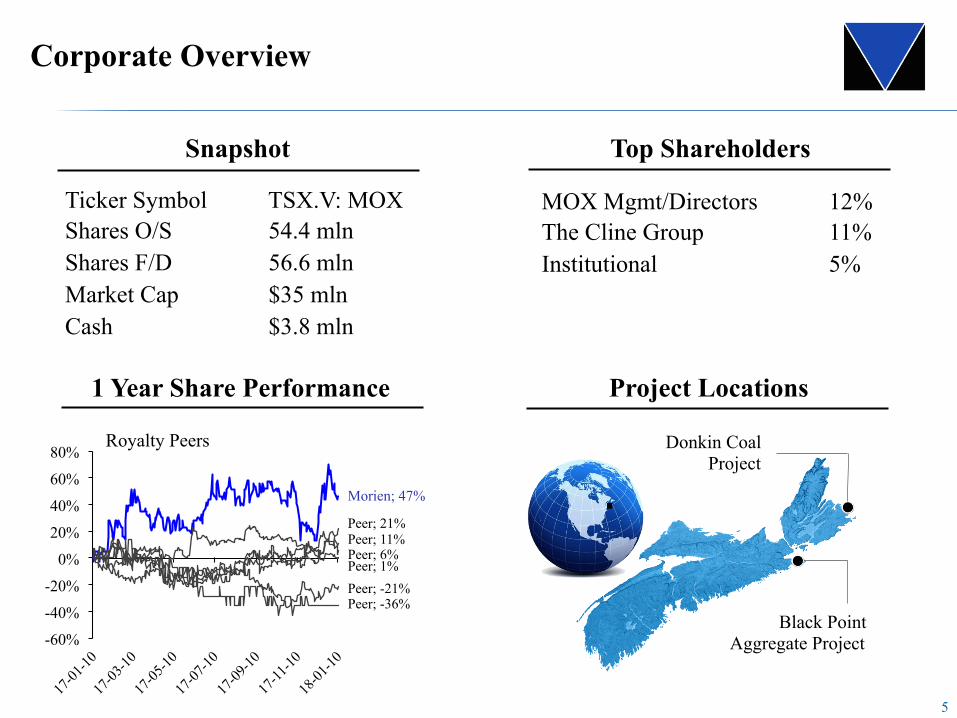
1 Year Share Performance Project Locations
Top Shareholders Snapshot
Donkin Coal Project
Ticker Symbol TSX.V: MOX
Shares O/S 54.4 mln
Shares F/D 56.6 mln
Market Cap $35 mln Cash $3.8 mln
MOX Mgmt/Directors 12%
The Cline Group 11% Institutional 5%
Black Point Aggregate Project
Corporate Overview
-60%
-40%
-20%
0%
20%
40%
60%
80%
Peer; -21%
Peer; 6%
Peer; -36%
Peer; 21%
Peer; 1%
Morien; 47%
Peer; 11%
Royalty Peers
6
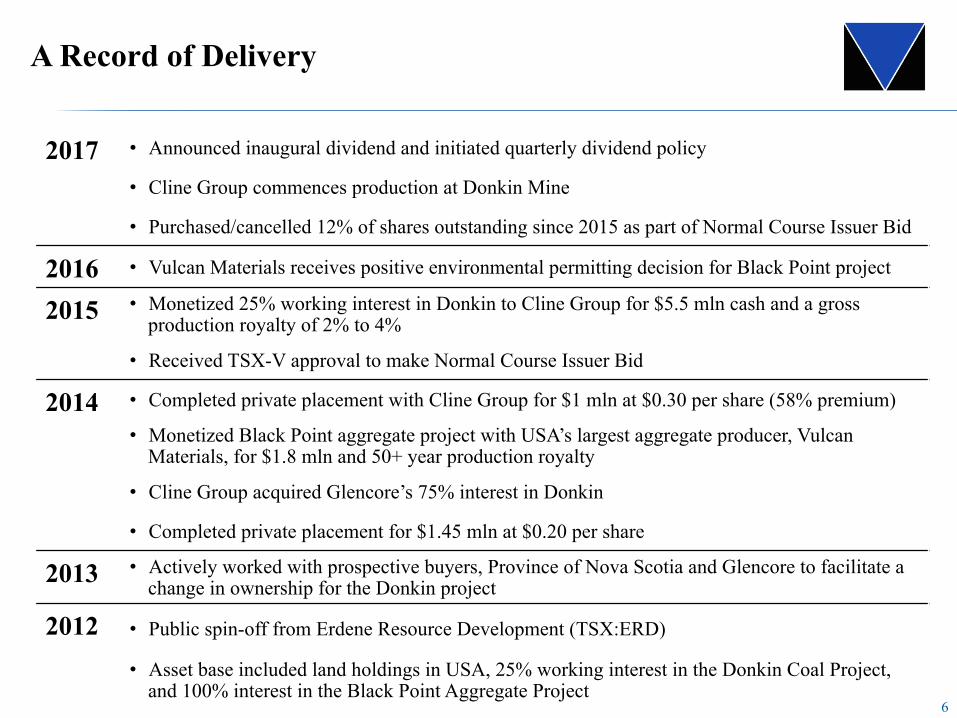
A Record of Delivery
2017 • Announced inaugural dividend and initiated quarterly dividend policy
• Cline Group commences production at Donkin Mine
• Purchased/cancelled 12% of shares outstanding since 2015 as part of Normal Course Issuer Bid
2016 • Vulcan Materials receives positive environmental permitting decision for Black Point project
2015 • Monetized 25% working interest in Donkin to Cline Group for $5.5 mln cash and a gross production royalty of 2% to 4%
• Received TSX-V approval to make Normal Course Issuer Bid
2014 • Completed private placement with Cline Group for $1 mln at $0.30 per share (58% premium)
• Monetized Black Point aggregate project with USA’s largest aggregate producer, Vulcan Materials, for $1.8 mln and 50+ year production royalty
• Cline Group acquired Glencore’s 75% interest in Donkin
• Completed private placement for $1.45 mln at $0.20 per share
2013 • Actively worked with prospective buyers, Province of Nova Scotia and Glencore to facilitate a change in ownership for the Donkin project
2012 • Public spin-off from Erdene Resource Development (TSX:ERD)
• Asset base included land holdings in USA, 25% working interest in the Donkin Coal Project, and 100% interest in the Black Point Aggregate Project
7
Dividend Policy
§ Quarterly dividend policy initiated in 2017
§ Initial dividend of $0.005 per share payable December 27, 2017
§ Quarterly dividend of $0.0025 per share established for 2018
§ Intention to transition to quarterly payout as a percentage of free cash flow commensurate with Donkin mine production expansion
§ Committed decision by Board of Directors that dividend is intended to be variable and in relation to mine production and coal prices
§ No replacement for metallurgical (coking) coal in the production of steel
§ Highly leveraged to the seaborne metallurgical coal market
8
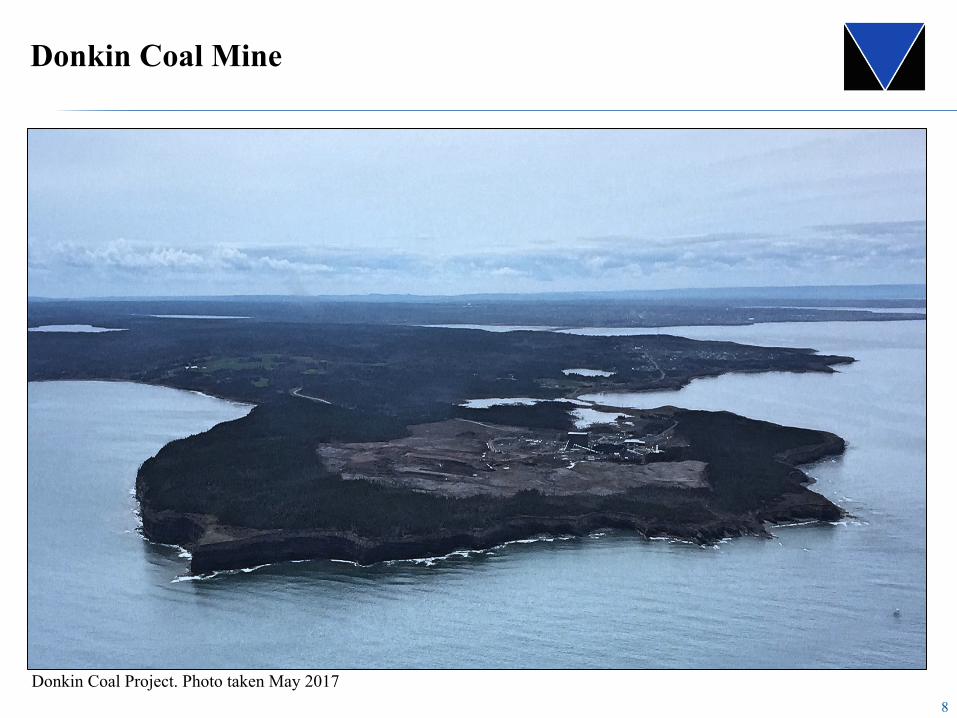
Donkin Coal Mine
Donkin Coal Project. Photo taken May 2017
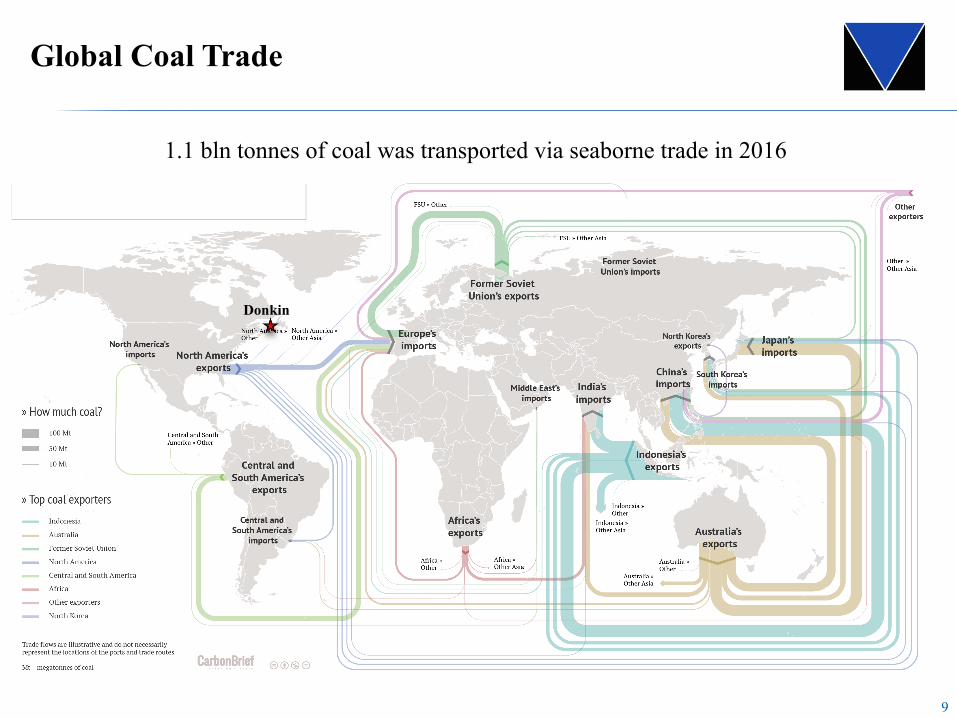
Global Coal Trade
9
Donkin
1.1 bln tonnes of coal was transported via seaborne trade in 2016
10
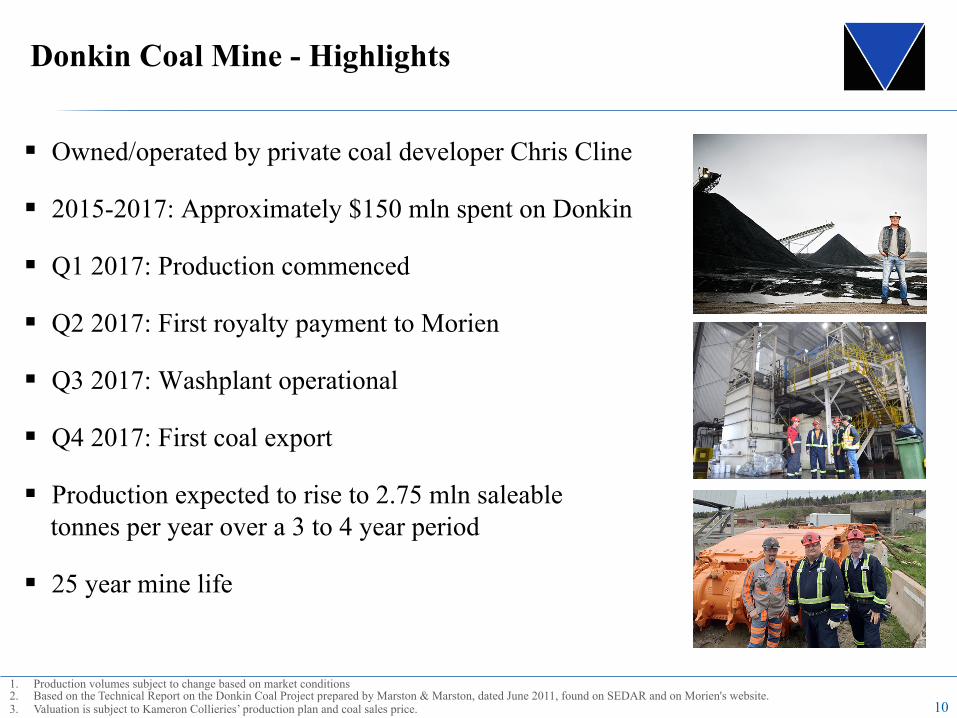
Donkin Coal Mine - Highlights
§ Owned/operated by private coal developer Chris Cline
§ 2015-2017: Approximately $150 mln spent on Donkin
§ Q1 2017: Production commenced
§ Q2 2017: First royalty payment to Morien
§ Q3 2017: Washplant operational
§ Q4 2017: First coal export
§ Production expected to rise to 2.75 mln saleable tonnes per year over a 3 to 4 year period
§ 25 year mine life
1. Production volumes subject to change based on market conditions 2. Based on the Technical Report on the Donkin Coal Project prepared by Marston & Marston, dated June 2011, found on SEDAR and on Morien's website. 3. Valuation is subject to Kameron Collieries’ production plan and coal sales price.
11
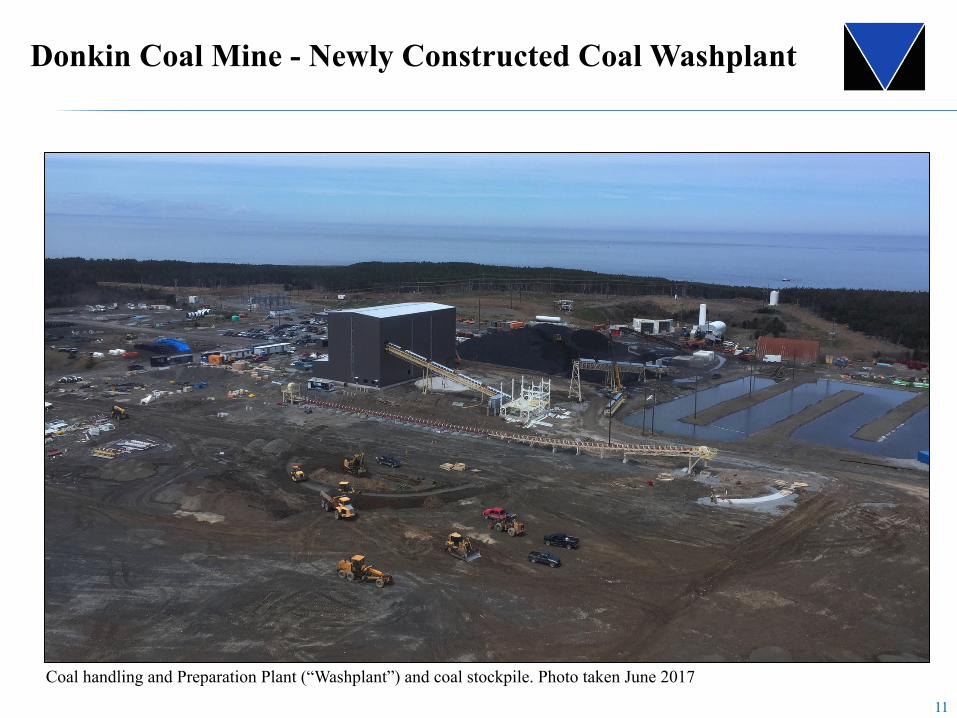
Donkin Coal Mine - Newly Constructed Coal Washplant
Coal handling and Preparation Plant (“Washplant”) and coal stockpile. Photo taken June 2017
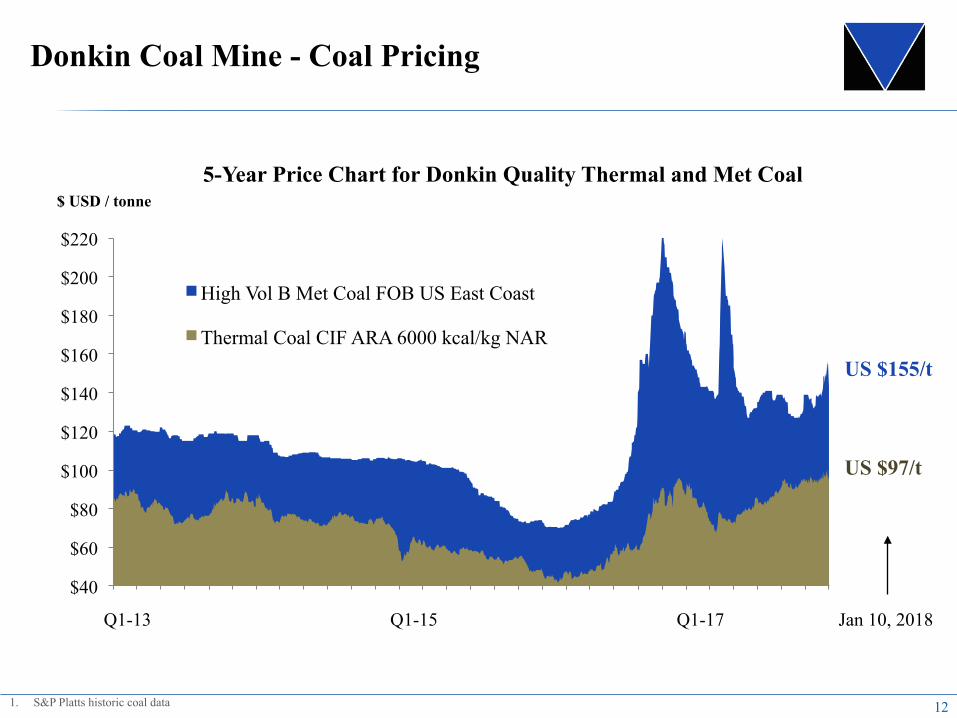
Donkin Coal Mine - Coal Pricing
12 1. S&P Platts historic coal data
$40
$60
$80
$100
$120
$140
$160
$180
$200
$220
13-0
1-10
13-0
3-10
13-0
5-10
13-0
7-10
13-0
9-10
13-1
1-10
14-0
1-10
14-0
3-10
14-0
5-10
14-0
7-10
14-0
9-10
14-1
1-10
15-0
1-10
15-0
3-10
15-0
5-10
15-0
7-10
15-0
9-10
15-1
1-10
16-0
1-10
16-0
3-10
16-0
5-10
16-0
7-10
16-0
9-10
16-1
1-10
17-0
1-10
17-0
3-10
17-0
5-10
17-0
7-10
17-0
9-10
17-1
1-10
18-0
1-10
$ USD / tonne 5-Year Price Chart for Donkin Quality Thermal and Met Coal
High Vol B Met Coal FOB US East Coast
Thermal Coal CIF ARA 6000 kcal/kg NAR
Q1-13 Jan 10, 2018 Q1-15 Q1-17
US $155/t
US $97/t
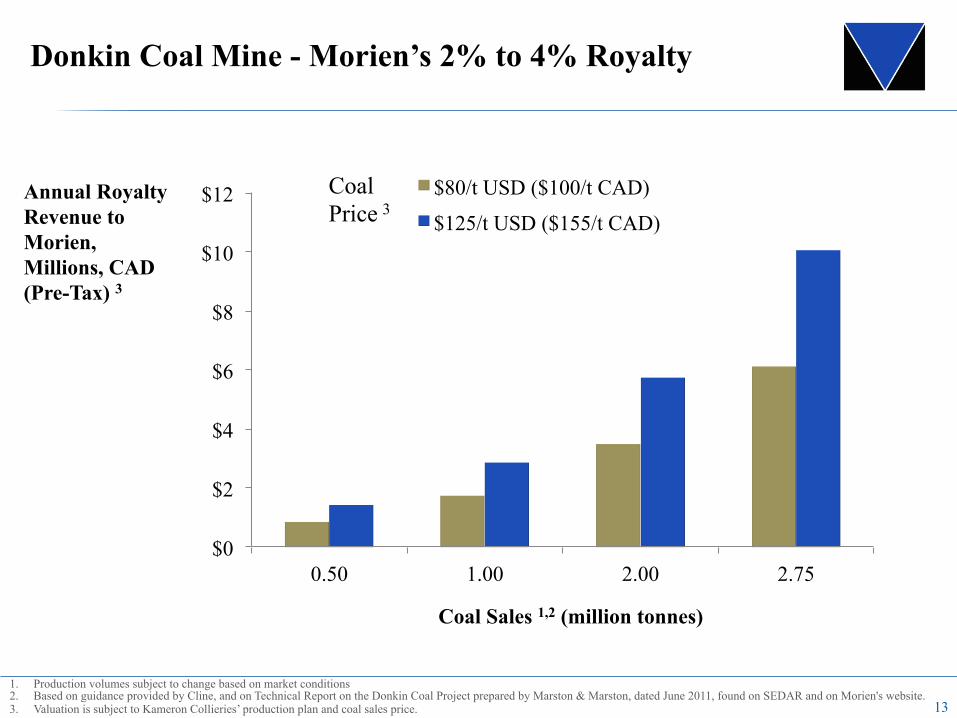
Donkin Coal Mine - Morien’s 2% to 4% Royalty
13
1. Production volumes subject to change based on market conditions 2. Based on guidance provided by Cline, and on Technical Report on the Donkin Coal Project prepared by Marston & Marston, dated June 2011, found on SEDAR and on Morien's website. 3. Valuation is subject to Kameron Collieries’ production plan and coal sales price.
Coal Sales 1,2 (million tonnes)
Annual Royalty Revenue to Morien, Millions, CAD (Pre-Tax) 3
$0
$2
$4
$6
$8
$10
$12
0.50 1.00 2.00 2.75
$80/t USD ($100/t CAD)
$125/t USD ($155/t CAD)
Coal Price 3
14
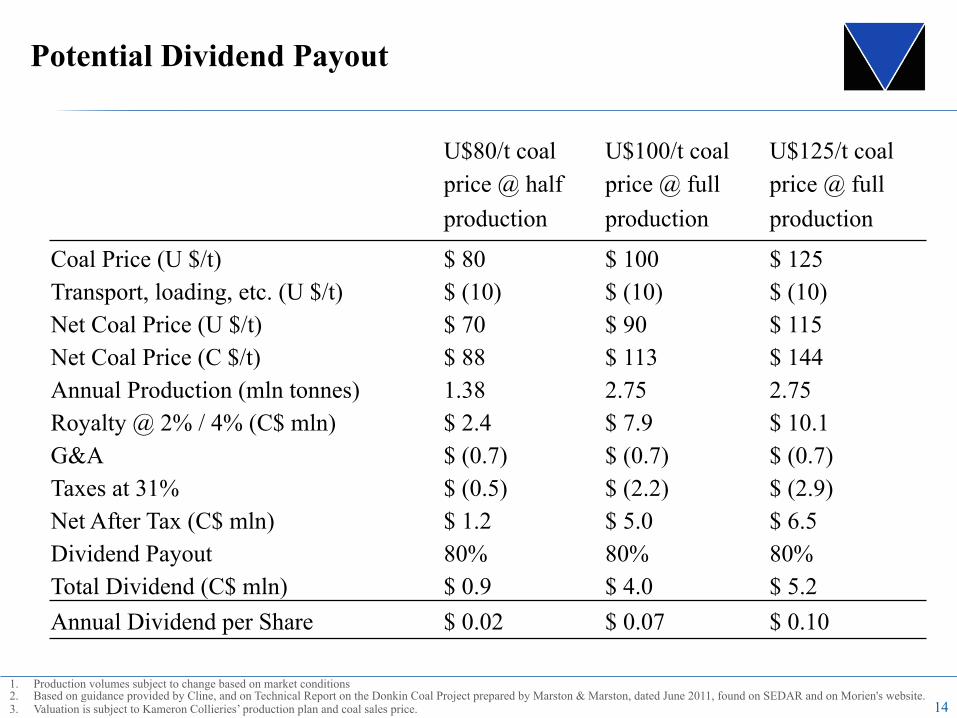
Potential Dividend Payout
U$80/t coal price @ half production
U$100/t coal price @ full production
U$125/t coal price @ full production
Coal Price (U $/t) $ 80 $ 100 $ 125 Transport, loading, etc. (U $/t) $ (10) $ (10) $ (10) Net Coal Price (U $/t) $ 70 $ 90 $ 115 Net Coal Price (C $/t) $ 88 $ 113 $ 144 Annual Production (mln tonnes) 1.38 2.75 2.75 Royalty @ 2% / 4% (C$ mln) $ 2.4 $ 7.9 $ 10.1 G&A $ (0.7) $ (0.7) $ (0.7) Taxes at 31% $ (0.5) $ (2.2) $ (2.9) Net After Tax (C$ mln) $ 1.2 $ 5.0 $ 6.5 Dividend Payout 80% 80% 80% Total Dividend (C$ mln) $ 0.9 $ 4.0 $ 5.2 Annual Dividend per Share $ 0.02 $ 0.07 $ 0.10
1. Production volumes subject to change based on market conditions 2. Based on guidance provided by Cline, and on Technical Report on the Donkin Coal Project prepared by Marston & Marston, dated June 2011, found on SEDAR and on Morien's website. 3. Valuation is subject to Kameron Collieries’ production plan and coal sales price.
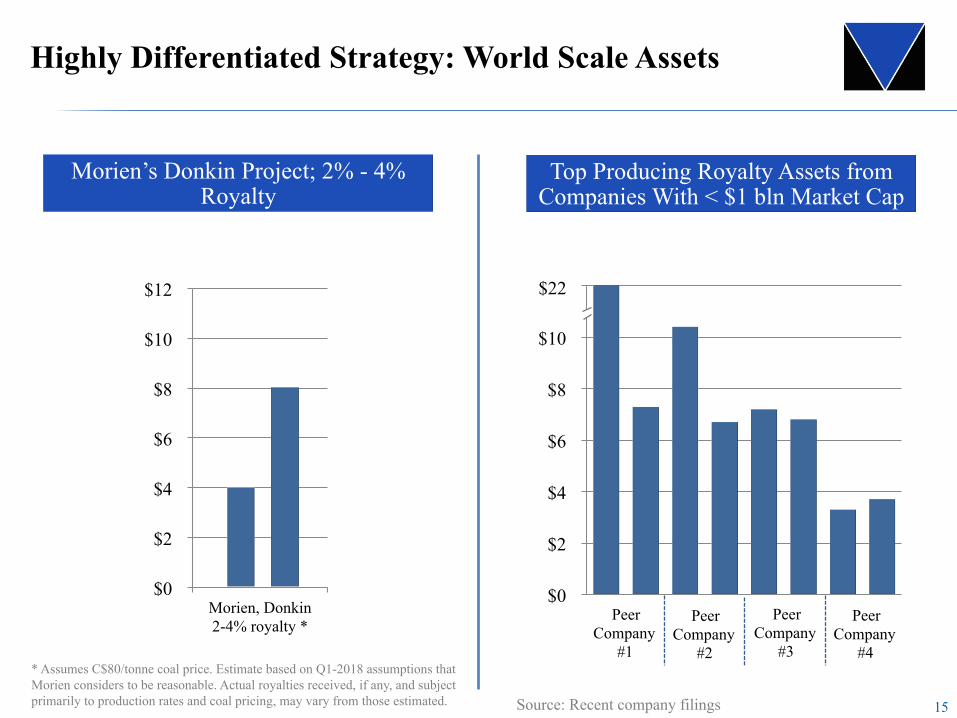
Highly Differentiated Strategy: World Scale Assets
15
Morien’s Donkin Project; 2% - 4% Royalty
Top Producing Royalty Assets from Companies With < $1 bln Market Cap
$0
$2
$4
$6
$8
$10
$12
Morien, Donkin 2-4% royalty *
* Assumes C$80/tonne coal price. Estimate based on Q1-2018 assumptions that Morien considers to be reasonable. Actual royalties received, if any, and subject primarily to production rates and coal pricing, may vary from those estimated. Source: Recent company filings
$0
$2
$4
$6
$8
$10
$12
Peer Company
#1
Peer Company
#2
Peer Company
#3
Peer Company
#4
$22
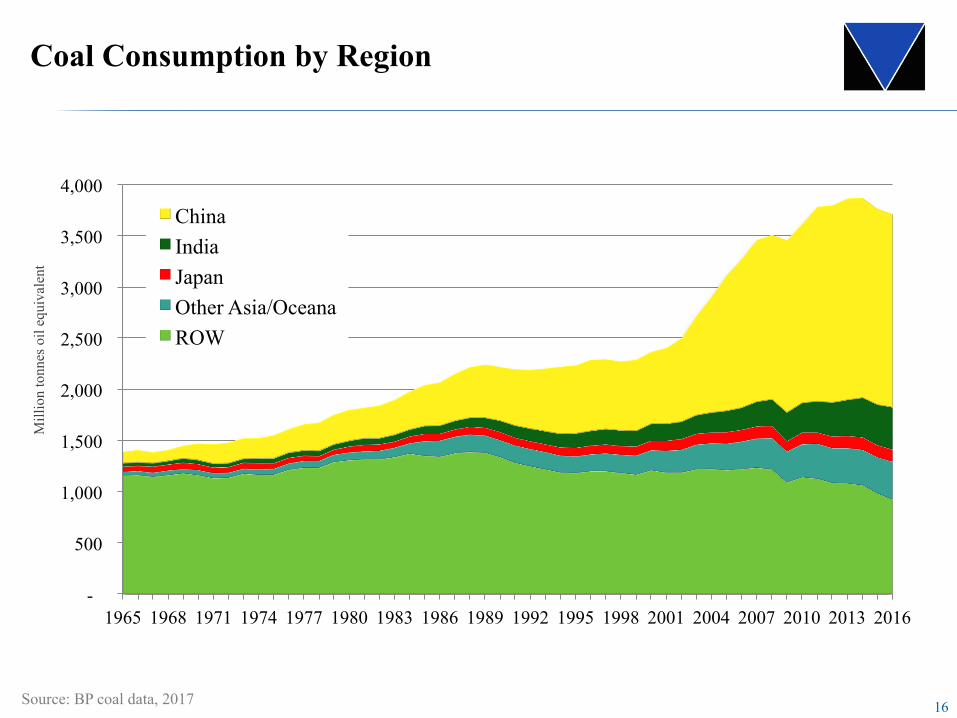
Coal Consumption by Region
16
-
500
1,000
1,500
2,000
2,500
3,000
3,500
4,000
1965 1968 1971 1974 1977 1980 1983 1986 1989 1992 1995 1998 2001 2004 2007 2010 2013 2016
China India Japan Other Asia/Oceana ROW
Source: BP coal data, 2017
Mill
ion
tonn
es o
il eq
uiva
lent
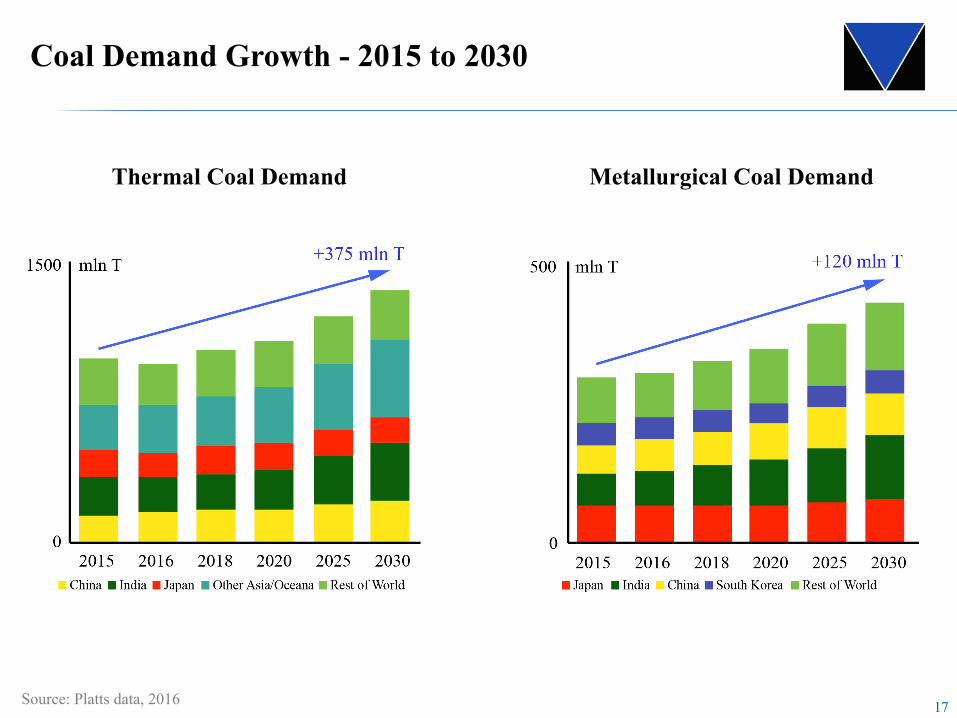
Coal Demand Growth - 2015 to 2030
17
Thermal Coal Demand Metallurgical Coal Demand
Source: Platts data, 2016
More Than Just Coal…
18
§ Black Point Aggregate Project
- Production royalty with Vulcan Materials, N. America’s largest aggregate producer
- Permitted in 2016; 50-year mine life; production decision by 2020
- Advanced quarterly royalty payments commenced 2017
- Final Black Point milestone of $400,000 pending from Vulcan
§ Project Generation Program to Enhance Royalty Portfolio
- Producing or near-to production assets based in Americas
- Industrial minerals, specialty/minor metals, bulk commodities, oil/gas
§ Prospective sale of 1,054 acres in Georgia USA
§ Continued share buy backs through NCIB
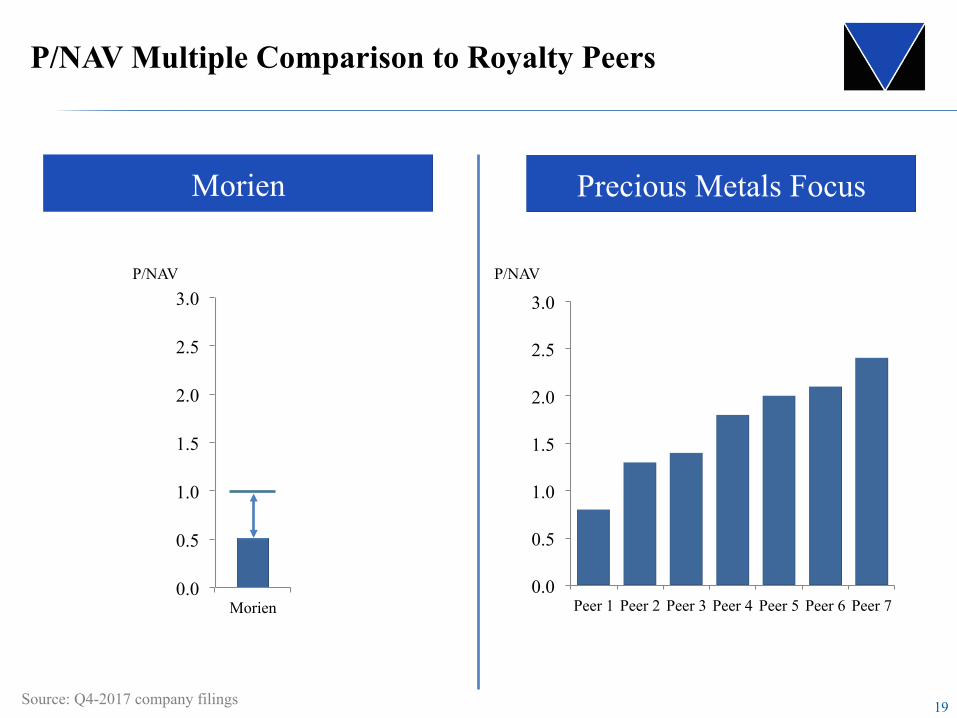
P/NAV Multiple Comparison to Royalty Peers
19
Morien Precious Metals Focus
0.0
0.5
1.0
1.5
2.0
2.5
3.0
Peer 1 Peer 2 Peer 3 Peer 4 Peer 5 Peer 6 Peer 7 0.0
0.5
1.0
1.5
2.0
2.5
3.0
Morien
Source: Q4-2017 company filings
P/NAV P/NAV
Five Reasons to Own Morien
20
§ Quarterly dividends to materially benefit from increases in production and coal price at Donkin
§ Long life dividends expected from long-life royalties; 25+ years at Donkin and 50+ years at Black Point
§ Top tier, scaled royalty at Donkin developing into a world-class mine
§ Vulcan intends to develop the Black Point project rapidly once market returns
§ Royalty incomes plus cash position plus attractive stock facilitate accretive growth opportunities
21
Contact
TSX-V: MOX www.MorienRes.com [email protected]
Metropolitan Place 99 Wyse Road, Suite 1480
Dartmouth, N.S. Canada, B3A 4S5
Tel: 902-466-7255
John P.A. Budreski President & CEO
Mike MacDonald Vice President, P.Geo
Mike O’Keefe CFO
Dawson Brisco VP Corporate Development, P.Geo