morningstar direct u.s. asset flows...
TRANSCRIPT
?
Morningstar DirectSM U.S. Asset Flows Update
Taxable-Bond Funds Receive Highest Inflows Since January 2013 The taxable-bond Morningstar category group received elevated flows of $31.9 billion in March, its highest monthly intake since January 2013’s $32.6 billion. The market seems to have anticipated the Federal Reserve’s March 29 comments. Even though they came at the end of the month, Janet Yellen’s remarks about mixed readings on the U.S. economy and the Fed’s decision to proceed cautiously with further rate increases may have been evident enough throughout the month to restore some confidence that fixed-income funds are not going to suffer from rising rates—at least not abruptly, and not right away. The S&P 500 and MSCI EAFE indexes ended the month with positive returns for the first time since November and October of last year, respectively. The U.S.- and international-equity category groups received inflows overall but nowhere near the magnitude of taxable and municipal bonds. In terms of active versus passive, four of the eight category groups reported outflows on the active side: all three equity category groups and allocation. U.S. equity and international equity received inflows on the passive side.
Active
Passive
Estimated Net Flows* $ Mil
Mar 2016
1 Year Assets Mar
2016 1 Year
Assets
$ Bil $ Bil
U.S. Equity (13,395) (178,917) 3,479 15,748 109,993 2,488
Sector Equity (860) (8,184) 362 2,931 6,841 350
International Equity (2,837) 18,377 1,462 7,630 144,284 831
Allocation (2,018) (46,927) 1,099 429 1,121 55
Taxable Bond 12,084 (95,232) 2,221 19,796 102,201 814
Municipal Bond 5,451 21,808 613 450 4,924 24
Alternative 878 13,730 164 1,193 7,453 45
Commodities 544 (1,518) 22 1,208 6,829 61
All Long Term (153) (276,862) 9,421 49,385 383,645 4,669
Money Market (14,979) 125,070 2,759
*Includes liquidated and merged funds.
Source: Morningstar Direct Asset Flows.
Morningstar Manager Research 14 April 2016 Data through March 31, 2016 U.S. Mutual Funds and Exchange-Traded Products Alina Lamy Senior Analyst Markets Research +1 312-384-3924 [email protected]

Page 2 of 11
Morningstar Manager Research | 14 April 2016
Total (Active and Passive)
Estimated Net Flows $ Mil
Mar 2016
1 Year Assets
$ Bil
U.S. Equity 2,352 (68,924) 5,967
Sector Equity 2,071 (1,343) 712
International Equity 4,793 162,660 2,293
Allocation (1,589) (45,806) 1,154
Taxable Bond 31,880 6,969 3,034
Municipal Bond 5,901 26,732 637
Alternative 2,071 21,183 209
Commodities 1,752 5,311 84
All Long Term 49,232 106,782 14,091
Money Market (14,979) 125,070 2,759
Fears of a looming recession seem to have somewhat abated, and the strong inflows into commodities funds (especially gold) were more subdued this month. However, it is interesting that, even after a month of strong stock-market performance (both in the United States and abroad), investors didn’t rush back into equity funds but instead chose the relative safety of fixed income. Overall, investors’ confidence seems to have been restored somewhat, but not enough to start going back en masse to the elevated risk of stocks. Exhibit 1. Flows for Active and Passive Taxable-Bond Funds, Quarterly ($ Billion)
Source: Morningstar Direct Asset Flows.
0%
3%
6%
9%
12%
15%
18%
21%
24%
27%
(60)
(40)
(20)
0
20
40
60
80
100
120
2008 2009 2010 2011 2012 2013 2014 2015
Flows (USD bil)
PassiveActivePassive percentage of total assets

Page 3 of 11
Morningstar Manager Research | 14 April 2016
Flows Into Passive Bond Strategies Pick Up As Exhibit 1 illustrates, flows into fixed-income funds have 1) become much more volatile since 2013 and 2) started favoring passive strategies in 2013. That’s when the Federal Reserve announced it would start tapering off its asset purchases, causing the so-called taper tantrum: panic and withdrawals from bond funds. When flows turned positive again, they did so under a different investor mindset. After the Fed’s mention of gradually eliminating its quantitative easing program, investors began to plan for lower returns and became particularly sensitive to cost. In this context, the passive share of fixed-income assets grew significantly, from 19% in 2013 to 27% in 2016. Interestingly, however, at an individual fund level, some active fixed-income funds are still in the game and going strong. There are a few such funds that we’ve been seeing on the top-flowing list, month after month (more details in the Top-Flowing Active and Passive Funds section later in the report). Fixed-income flows are very sensitive to interest-rate movements, and it looks like investors are now positioning themselves for a low-return environment while trying to control costs. This will continue to be an interesting story going forward because there is still uncertainty about when and by how much rates will increase, and that is likely to keep flows volatile for most fixed-income categories.
Flow Patterns Much Different Now From a Year Ago… …and from last month, for that matter. Exhibit 2. Category Group Flows During the Past 12 Months ($ Billion)
Source: Morningstar Direct Asset Flows.
-60
-40
-20
0
20
40
60
80
Apr May Jun Jul Aug Sep Oct Nov Dec Jan Feb Mar
2015 2016
U.S. Equity Sector Equity International EquityAllocation Taxable Bond Municipal BondAlternative Commodities
Page 4 of 11
Morningstar Manager Research | 14 April 2016
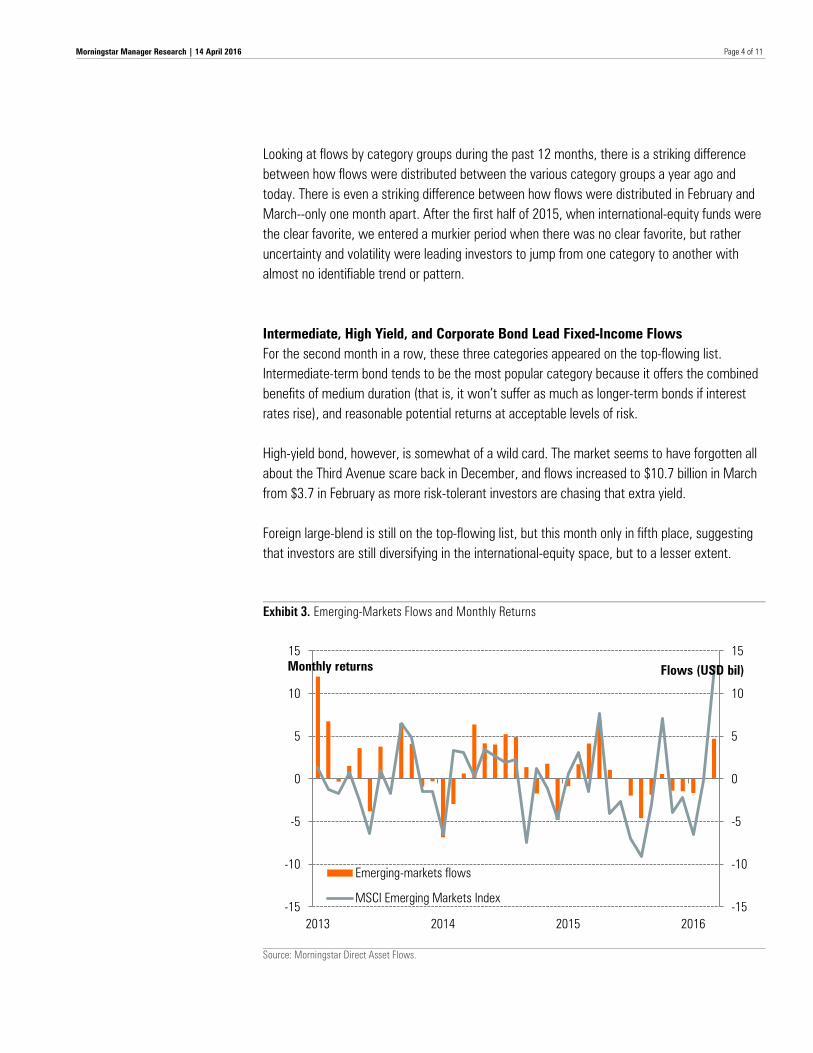
Looking at flows by category groups during the past 12 months, there is a striking difference between how flows were distributed between the various category groups a year ago and today. There is even a striking difference between how flows were distributed in February and March--only one month apart. After the first half of 2015, when international-equity funds were the clear favorite, we entered a murkier period when there was no clear favorite, but rather uncertainty and volatility were leading investors to jump from one category to another with almost no identifiable trend or pattern. Intermediate, High Yield, and Corporate Bond Lead Fixed-Income Flows For the second month in a row, these three categories appeared on the top-flowing list. Intermediate-term bond tends to be the most popular category because it offers the combined benefits of medium duration (that is, it won’t suffer as much as longer-term bonds if interest rates rise), and reasonable potential returns at acceptable levels of risk. High-yield bond, however, is somewhat of a wild card. The market seems to have forgotten all about the Third Avenue scare back in December, and flows increased to $10.7 billion in March from $3.7 in February as more risk-tolerant investors are chasing that extra yield. Foreign large-blend is still on the top-flowing list, but this month only in fifth place, suggesting that investors are still diversifying in the international-equity space, but to a lesser extent. Exhibit 3. Emerging-Markets Flows and Monthly Returns
Source: Morningstar Direct Asset Flows.
-15
-10
-5
0
5
10
15
-15
-10
-5
0
5
10
15
2013 2014 2015 2016
Flows (USD bil)
Emerging-markets flows
MSCI Emerging Markets Index
Monthly returns
Page 5 of 11
Morningstar Manager Research | 14 April 2016
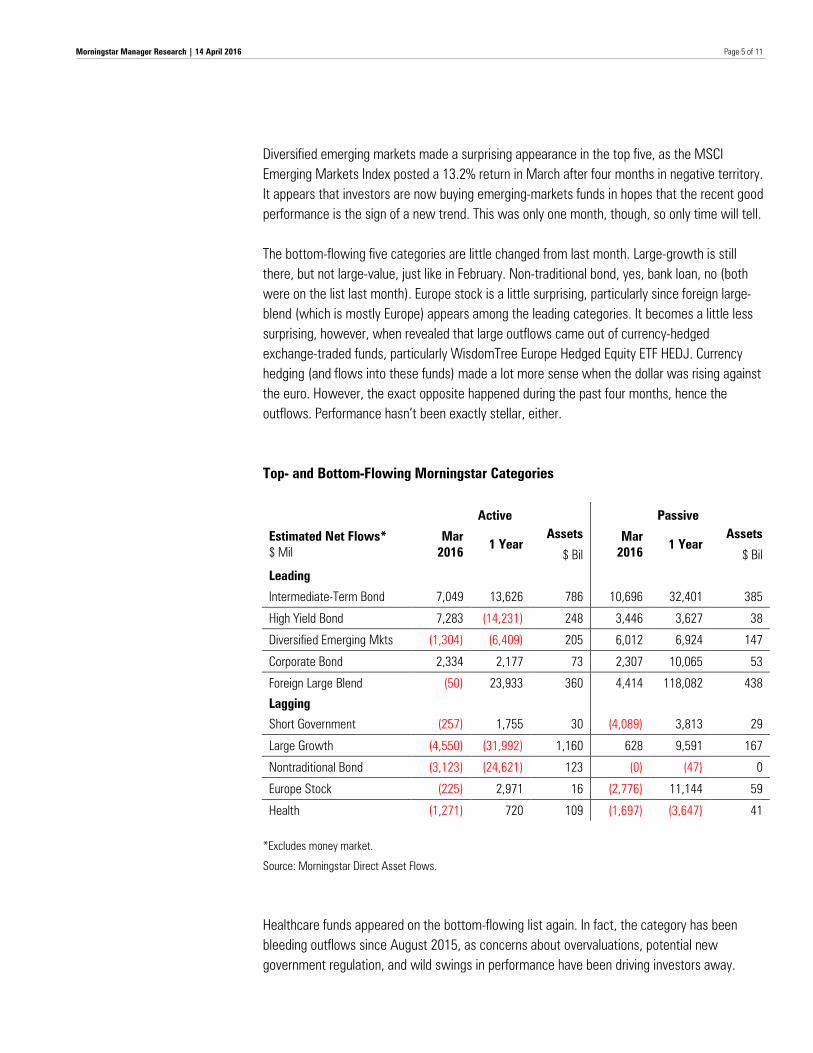
Diversified emerging markets made a surprising appearance in the top five, as the MSCI Emerging Markets Index posted a 13.2% return in March after four months in negative territory. It appears that investors are now buying emerging-markets funds in hopes that the recent good performance is the sign of a new trend. This was only one month, though, so only time will tell. The bottom-flowing five categories are little changed from last month. Large-growth is still there, but not large-value, just like in February. Non-traditional bond, yes, bank loan, no (both were on the list last month). Europe stock is a little surprising, particularly since foreign large-blend (which is mostly Europe) appears among the leading categories. It becomes a little less surprising, however, when revealed that large outflows came out of currency-hedged exchange-traded funds, particularly WisdomTree Europe Hedged Equity ETF HEDJ. Currency hedging (and flows into these funds) made a lot more sense when the dollar was rising against the euro. However, the exact opposite happened during the past four months, hence the outflows. Performance hasn’t been exactly stellar, either. Top- and Bottom-Flowing Morningstar Categories
Active
Passive
Estimated Net Flows* $ Mil
Mar 2016
1 Year Assets Mar
2016 1 Year
Assets
$ Bil $ Bil
Leading
Intermediate-Term Bond 7,049 13,626 786 10,696 32,401 385
High Yield Bond 7,283 (14,231) 248 3,446 3,627 38
Diversified Emerging Mkts (1,304) (6,409) 205 6,012 6,924 147
Corporate Bond 2,334 2,177 73 2,307 10,065 53
Foreign Large Blend (50) 23,933 360 4,414 118,082 438
Lagging
Short Government (257) 1,755 30 (4,089) 3,813 29
Large Growth (4,550) (31,992) 1,160 628 9,591 167
Nontraditional Bond (3,123) (24,621) 123 (0) (47) 0
Europe Stock (225) 2,971 16 (2,776) 11,144 59
Health (1,271) 720 109 (1,697) (3,647) 41
*Excludes money market.
Source: Morningstar Direct Asset Flows.
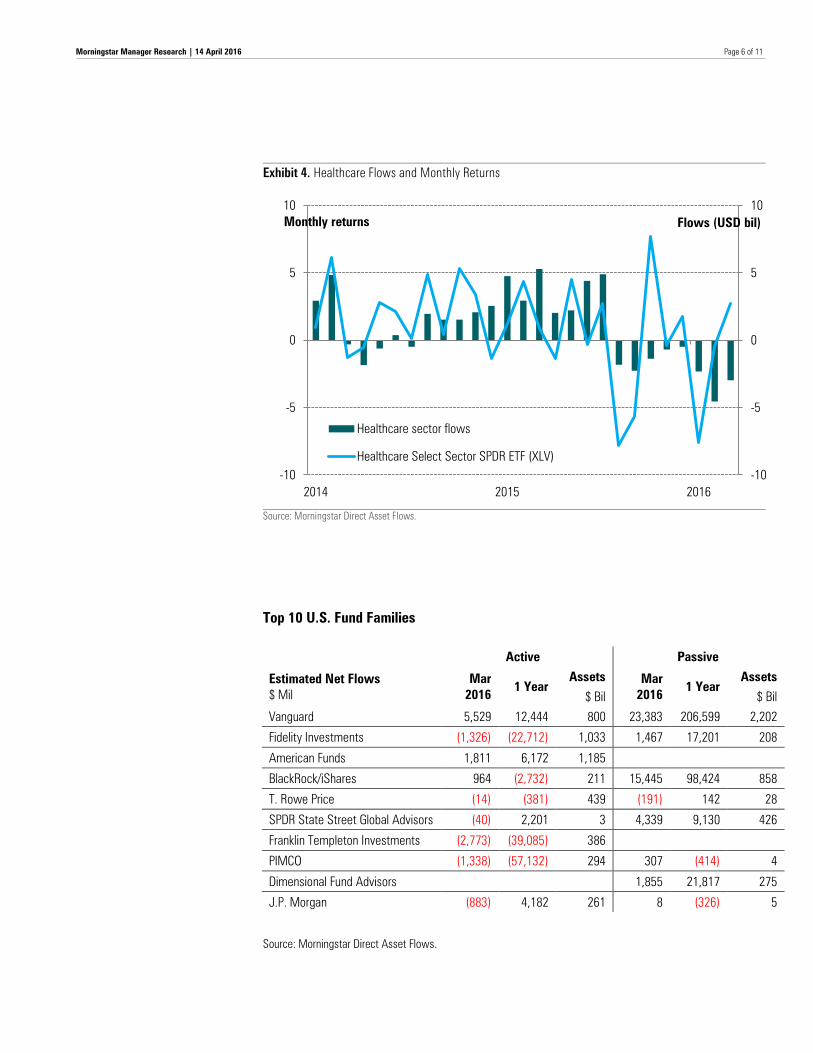
Healthcare funds appeared on the bottom-flowing list again. In fact, the category has been bleeding outflows since August 2015, as concerns about overvaluations, potential new government regulation, and wild swings in performance have been driving investors away.
Page 6 of 11
Morningstar Manager Research | 14 April 2016
Exhibit 4. Healthcare Flows and Monthly Returns
Source: Morningstar Direct Asset Flows.
Top 10 U.S. Fund Families
Active
Passive
Estimated Net Flows $ Mil
Mar 2016
1 Year Assets Mar
2016 1 Year
Assets
$ Bil $ Bil
Vanguard 5,529 12,444 800 23,383 206,599 2,202
Fidelity Investments (1,326) (22,712) 1,033 1,467 17,201 208
American Funds 1,811 6,172 1,185
BlackRock/iShares 964 (2,732) 211 15,445 98,424 858
T. Rowe Price (14) (381) 439 (191) 142 28
SPDR State Street Global Advisors (40) 2,201 3 4,339 9,130 426
Franklin Templeton Investments (2,773) (39,085) 386
PIMCO (1,338) (57,132) 294 307 (414) 4
Dimensional Fund Advisors 1,855 21,817 275
J.P. Morgan (883) 4,182 261 8 (326) 5
Source: Morningstar Direct Asset Flows.
-10
-5
0
5
10
-10
-5
0
5
10
2014 2015 2016
Flows (USD bil)
Healthcare sector flows
Healthcare Select Sector SPDR ETF (XLV)
Monthly returns

Page 7 of 11
Morningstar Manager Research | 14 April 2016
Vanguard once again led flows on both the active and the passive side in March. In fact, Vanguard’s $28.9 billion inflow for the month was higher than the flows of all the other fund companies combined. With the exception of American Funds and BlackRock, all other active fund providers sustained outflows. American Funds has been doing pretty well in the past few months in terms of flows. American Funds American Balanced ABALX and American Funds Europacific Growth AEPGX attracted the highest flows for the company in March. Top-Flowing Funds: Active Fixed Income and Passive Emerging Markets All five funds on the active top-flowing list were fixed-income funds, representative of the two top-flowing categories, intermediate term and high yield. Vanguard is the undisputed leader in the passive arena, and is also performing pretty well with its active funds, but it is unusual even for Vanguard to see one of its funds leading the active top-flowing list. Vanguard Intermediate-Term Investment-Grade VFICX overtook top-flowing list active regulars like DoubleLine Total Return Bond DBLTX and PIMCO Income PIMIX, attracting $1.6 billion in March. BlackRock High Yield Bond BHYIX and PIMCO High Yield PHIYX were the most successful funds in the high-yield category. Top-Flowing Active and Passive Funds
Assets Assets
Estimated Net Flows
Mar 2016
1 Year Mar 2016
Mar 2015
$ Mil $ Mil $ Mil
Active Funds
Vanguard Intermediate-Term Invmt-Grd 1,645 4,428 24,730 19,823
DoubleLine Total Return Bond Fund 1,577 10,919 57,627 45,586
BlackRock High Yield Bond Portfolio 1,381 896 17,227 17,432
PIMCO Income Fund 1,195 11,651 55,993 43,625
PIMCO High Yield 969 (449) 9,848 10,592
Passive Funds
iShares MSCI Emerging Markets 4,620 164 25,450 29,572
Vanguard Total Bond Market II Index Fund 4,508 (297) 96,308 95,093
Vanguard Total Bond Market Index Fund 2,794 12,177 157,965 143,913
Vanguard Total International Bd Idx Fund 2,640 19,130 56,369 35,982
Vanguard Developed Markets Index Fund 1,993 12,252 56,244 48,917
Source: Morningstar Direct Asset Flows.

Page 8 of 11
Morningstar Manager Research | 14 April 2016
No sign of SPDR Gold Shares GLD on the passive list this month, after two months of significant inflows into commodities-precious metals. iShares MSCI Emerging Markets EEM brought in $4.6 billion in new money, though, as investors rushed to emerging markets after a month of impressive performance. Franklin Templeton once again suffered a severe outflow from Templeton Global Bond TPINX in March. The reshuffling of fixed-income assets among active funds continues, and Vanguard is becoming a contender. Exhibit 5. Flows for Select Fixed-Income Funds During the Past 6 Months ($ Billion)
Source: Morningstar Direct Asset Flows.
(3)
(2)
(1)
0
1
2
3
Oct-15 Nov-15 Dec-15 Jan-16 Feb-16 Mar-16
DoubleLine Total Return Bond Fund PIMCO Income Fund
PIMCO Total Return Fund Templeton Global Bond Fund
Vanguard Intermediate-Term Invmt-Grd

Page 9 of 11
Morningstar Manager Research | 14 April 2016
Bottom-Flowing Active and Passive Funds
Assets Assets
Estimated Net Flows
Mar 2016
1 Year Mar 2016
Mar 2015
$ Mil $ Mil $ Mil
Active Funds
Ivy Asset Strategy Fund (1,497) (11,563) 10,342 25,235
Virtus Emerging Markets Opportunities Fd (1,181) (457) 8,351 9,747
PIMCO Total Return Fund (1,162) (28,585) 87,915 117,398
Templeton Global Bond Fund (1,101) (13,690) 50,900 68,012
Vontobel Global Emerging Mkts Eq Instl (919) (830) 94 1,039
Passive Funds
iShares Short Treasury Bond (1,985) (938) 3,851 4,786
iShares 1-3 Year Treasury Bond (1,509) 3,675 11,437 7,739
iShares MSCI Japan (1,216) 2,233 17,123 16,760
First Trust Health Care AlphaDEX® Fund (1,208) (1,480) 1,260 3,460
WisdomTree Europe Hedged Equity Fund (1,121) 1,035 13,733 17,314
Source: Morningstar Direct Asset Flows.
Ivy Asset Strategy IVAEX was the active fund with the largest outflow for the second month in a row, following a manager change announcement on Feb. 2. Michael Avery, who has managed the fund since 1997, will retire on June 30. My colleague Leo Acheson, who covers the fund, writes that “Avery’s departure comes as a surprise and represents a meaningful loss for the firm. He served as the longest-tenured manager on this fund and has been widely viewed as the heir apparent to CEO Hank Herrmann.” A manager change is also behind Virtus Emerging Markets Opportunities’ HIEMX outflow. Rajiv Jain, who managed this fund, stepped down on March 7 and announced his resignation effective May 31. (Vontobel Asset Management is this fund’s subadvisor.) Speaking of Vontobel, another one of its funds, Vontobel Global Emerging Markets Equity VTGIX, also landed on the bottom-flowing list this month. As successful as iShares was this month with its emerging-markets ETF, it didn’t fare as well with two of its short-term bond ETFs and its Japan ETF. WisdomTree Europe Hedged Equity ETF, so popular about a year ago, seems to have fallen from grace and is making an appearance on the bottom-flowing list more often than on the top-flowing one.

Page 10 of 11
Morningstar Manager Research | 14 April 2016
A fund company that didn’t really show up in the top five but still managed to attract consistent flows during the past year is AQR, which focuses on quantitative strategies. The majority of the inflows went to its alternative funds, but its U.S. equity funds also managed to stay in positive flow territory. Exhibit 6. AQR Flows by Category Group ($ Billion)
Source: Morningstar Direct Asset Flows.
-1.0
-0.5
0.0
0.5
1.0
1.5
2.0
2.5
2014 2015 2016
Allocation AlternativeCommodities International EquityU.S. Equity
Page 11 of 11
Morningstar Manager Research | 14 April 2016
Note: The figures in this report were compiled on April 12, 2016, and reflect only the funds that had reported net assets by that date. The figures in both the commentary and the extended tables are survivorship-bias-free. This report includes both mutual funds and exchange-traded funds, but not funds of funds unless specifically stated so. Important methodology note: Morningstar computes flows using the approach that is standard in the industry: Estimated net flow is the change in assets not explained by the performance of the fund. Our method assumes that flows occur uniformly over the course of the month. Adjustments for mergers are performed automatically. When liquidated funds are included, the final assets of the fund are counted as outflows. Reinvested dividends are not counted as inflows. We use fund-level reinvestment rates to improve accuracy in this respect. We make ad hoc adjustments for unusual corporate actions such as reverse share splits, and we overwrite our estimates with actual flows if managers are willing to provide the data to us. Please click here for a full explanation of our methodology.
?
22 West Washington Street
Chicago, IL 60602 USA
© Morningstar 2016. All Rights Reserved. The information, data, analyses and opinions presented herein do not constitute investment advice; are provided solely for informational purposes and therefore are not an offer to buy or sell a security; and are not warranted to be correct, complete or accurate. The opinions expressed are as of the date written and are subject to change without notice. Except as otherwise required by law, Morningstar shall not be responsible for any trading decisions, damages or other losses resulting from, or related to, the information, data, analyses or opinions or their use. The information contained herein is the proprietary property of Morningstar and may not be reproduced, in whole or in part, or used in any manner, without the prior written consent of Morningstar. To order reprints, call +1 312-696-6100. To license the research, call +1 312-696-6869.

Morningstar DirectSM | Publishing Date: 2016-04-14 Page 1
Fund Flows
Monthly Market Summary: US Open-end & ETF ex MM ex FoFIncluding merged and liquidated funds
Effective Date03-31-2016
Morningstar Categories Ranked by Current TNA ($Mil)Rank Name Estimated Net Flow ($mil) Total Net Assets ($bil) Total Return
1-Mo QTD YTD 1-Yr 03-2016 Mkt Sh % 03-2015 Mkt Sh % 1-Mo YTD
1 Large Blend 1,169 13,729 13,729 5,781 2,261 16.04 2,263 15.52 12.63 2.08
2 Large Growth (3,922) (15,273) (15,273) (22,401) 1,327 9.42 1,387 9.51 12.55 (3.74)
3 Intermediate-Term Bond 17,745 23,471 23,471 46,027 1,171 8.31 1,112 7.63 2.33 5.37
4 Large Value 2,698 (100) (100) (23,303) 1,000 7.10 1,049 7.19 13.98 5.49
5 Foreign Large Blend 4,365 25,681 25,681 142,015 798 5.66 746 5.12 13.39 (3.15)
6 Moderate Allocation 500 (849) (849) (4,563) 564 4.00 571 3.92 9.74 2.53
7 World Stock (1,332) (3,894) (3,894) (7,634) 390 2.77 424 2.90 14.77 3.27
8 Diversified Emerging Mkts 4,709 3,140 3,140 515 352 2.50 401 2.75 22.95 9.90
9 Short-Term Bond 1,500 2,311 2,311 1,140 339 2.40 328 2.25 1.51 2.14
10 Mid-Cap Blend 1,285 (4,332) (4,332) 4,506 324 2.30 342 2.35 14.79 2.55
11 Foreign Large Growth 320 3,320 3,320 12,108 312 2.22 344 2.36 13.69 (3.00)
12 World Allocation (2,376) (8,582) (8,582) (23,098) 302 2.14 339 2.33 10.09 4.52
13 High Yield Bond 10,729 11,303 11,303 (10,605) 286 2.03 319 2.19 6.88 4.54
14 Small Blend 1,040 (2,479) (2,479) (3,498) 267 1.90 295 2.02 15.55 1.65
15 Mid-Cap Growth (1,020) (6,618) (6,618) (12,133) 260 1.85 303 2.08 13.72 (3.12)
16 Mid-Cap Value 893 (109) (109) (9,919) 221 1.57 250 1.72 16.74 7.91
17 World Bond 1,007 (3,668) (3,668) 60 211 1.50 213 1.46 7.15 9.11
18 Conservative Allocation 339 (2,218) (2,218) (10,459) 204 1.45 224 1.53 7.27 4.60
19 Small Growth (519) (3,717) (3,717) (7,485) 186 1.32 218 1.50 13.91 (7.23)
20 Muni National Interm 2,490 7,528 7,528 19,091 175 1.24 152 1.04 0.30 3.00
21 Multisector Bond 1,192 (571) (571) (7,834) 170 1.20 182 1.25 4.05 3.72
22 Health (2,968) (9,836) (9,836) (2,927) 150 1.06 182 1.24 7.58 (27.22)
23 Real Estate 1,702 871 871 (4,283) 145 1.03 148 1.02 19.79 10.24
24 Foreign Large Value 282 1,975 1,975 (286) 141 1.00 156 1.07 15.04 (1.06)
25 Corporate Bond 4,641 8,288 8,288 12,241 127 0.90 117 0.80 5.52 6.95
26 Nontraditional Bond (3,123) (10,773) (10,773) (24,668) 123 0.88 154 1.05 3.51 (0.37)
27 Small Value 729 1,175 1,175 (440) 122 0.86 132 0.91 17.39 6.60
28 Muni National Short 661 1,116 1,116 (2,294) 121 0.86 122 0.84 (0.24) 1.00
29 Intermediate Government 33 4,396 4,396 6,061 111 0.78 104 0.72 0.47 4.52
30 Inflation-Protected Bond 1,936 516 516 315 106 0.75 105 0.72 3.68 7.33
31 Bank Loan (397) (5,798) (5,798) (20,463) 94 0.66 118 0.81 5.42 3.26
32 Muni National Long 536 1,357 1,357 1,418 88 0.62 84 0.58 1.47 4.06
33 High Yield Muni 1,058 3,436 3,436 5,590 85 0.60 77 0.53 1.84 4.02
34 Ultrashort Bond (1,416) (439) (439) (1,617) 84 0.60 86 0.59 0.51 0.45
35 Technology 470 (4,544) (4,544) 713 80 0.57 81 0.55 15.56 (3.43)
©2016 Morningstar, Inc. All Rights Reserved. For institutional use only. The information contained herein: (1) is proprietary to Morningstar and/or its content providers; (2) may not be copied or distributed; and (3) is not warranted to be accurate, complete or timely.Neither Morningstar norits content providers are responsible for any damages or losses arising from any use of this information. Past performance is no guarantee of future results. ß
®
Morningstar DirectSM | Publishing Date: 2016-04-14 Page 2
Fund Flows
Monthly Market Summary: US Open-end & ETF ex MM ex FoFIncluding merged and liquidated funds
Effective Date03-31-2016
Morningstar Categories Ranked by Current TNA ($Mil)Rank Name Estimated Net Flow ($mil) Total Net Assets ($bil) Total Return
1-Mo QTD YTD 1-Yr 03-2016 Mkt Sh % 03-2015 Mkt Sh % 1-Mo YTD
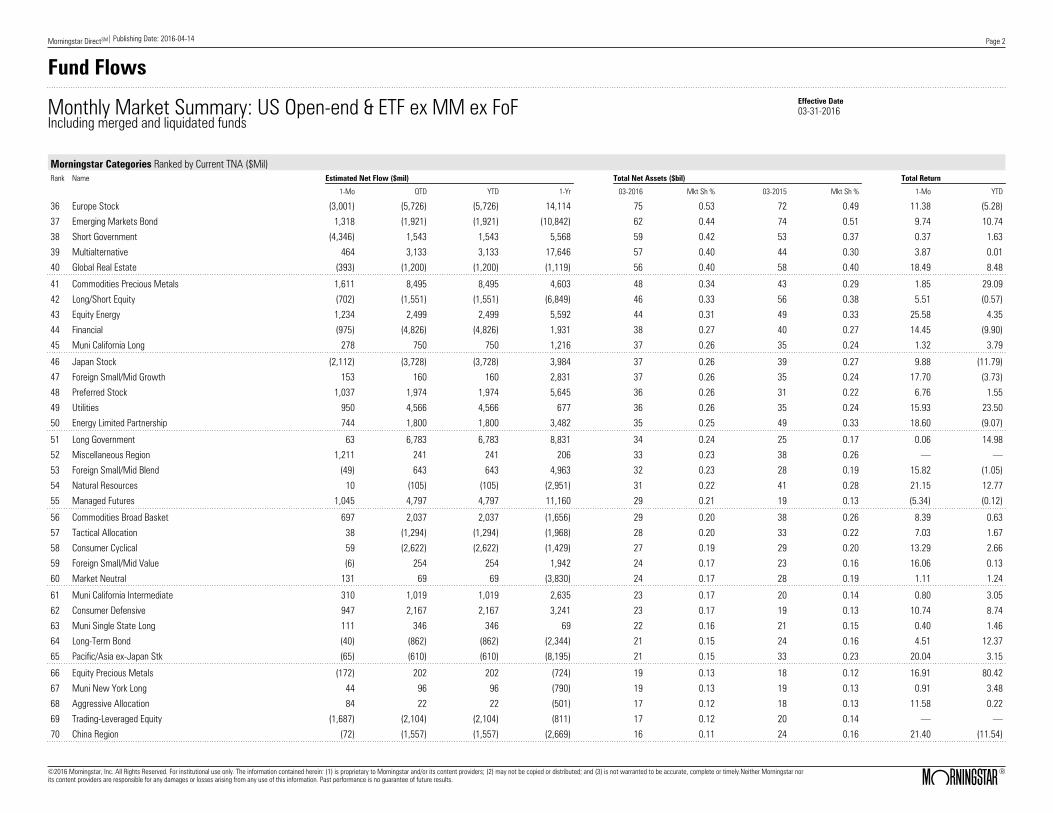
36 Europe Stock (3,001) (5,726) (5,726) 14,114 75 0.53 72 0.49 11.38 (5.28)
37 Emerging Markets Bond 1,318 (1,921) (1,921) (10,842) 62 0.44 74 0.51 9.74 10.74
38 Short Government (4,346) 1,543 1,543 5,568 59 0.42 53 0.37 0.37 1.63
39 Multialternative 464 3,133 3,133 17,646 57 0.40 44 0.30 3.87 0.01
40 Global Real Estate (393) (1,200) (1,200) (1,119) 56 0.40 58 0.40 18.49 8.48
41 Commodities Precious Metals 1,611 8,495 8,495 4,603 48 0.34 43 0.29 1.85 29.09
42 Long/Short Equity (702) (1,551) (1,551) (6,849) 46 0.33 56 0.38 5.51 (0.57)
43 Equity Energy 1,234 2,499 2,499 5,592 44 0.31 49 0.33 25.58 4.35
44 Financial (975) (4,826) (4,826) 1,931 38 0.27 40 0.27 14.45 (9.90)
45 Muni California Long 278 750 750 1,216 37 0.26 35 0.24 1.32 3.79
46 Japan Stock (2,112) (3,728) (3,728) 3,984 37 0.26 39 0.27 9.88 (11.79)
47 Foreign Small/Mid Growth 153 160 160 2,831 37 0.26 35 0.24 17.70 (3.73)
48 Preferred Stock 1,037 1,974 1,974 5,645 36 0.26 31 0.22 6.76 1.55
49 Utilities 950 4,566 4,566 677 36 0.26 35 0.24 15.93 23.50
50 Energy Limited Partnership 744 1,800 1,800 3,482 35 0.25 49 0.33 18.60 (9.07)
51 Long Government 63 6,783 6,783 8,831 34 0.24 25 0.17 0.06 14.98
52 Miscellaneous Region 1,211 241 241 206 33 0.23 38 0.26 — —
53 Foreign Small/Mid Blend (49) 643 643 4,963 32 0.23 28 0.19 15.82 (1.05)
54 Natural Resources 10 (105) (105) (2,951) 31 0.22 41 0.28 21.15 12.77
55 Managed Futures 1,045 4,797 4,797 11,160 29 0.21 19 0.13 (5.34) (0.12)
56 Commodities Broad Basket 697 2,037 2,037 (1,656) 29 0.20 38 0.26 8.39 0.63
57 Tactical Allocation 38 (1,294) (1,294) (1,968) 28 0.20 33 0.22 7.03 1.67
58 Consumer Cyclical 59 (2,622) (2,622) (1,429) 27 0.19 29 0.20 13.29 2.66
59 Foreign Small/Mid Value (6) 254 254 1,942 24 0.17 23 0.16 16.06 0.13
60 Market Neutral 131 69 69 (3,830) 24 0.17 28 0.19 1.11 1.24
61 Muni California Intermediate 310 1,019 1,019 2,635 23 0.17 20 0.14 0.80 3.05
62 Consumer Defensive 947 2,167 2,167 3,241 23 0.17 19 0.13 10.74 8.74
63 Muni Single State Long 111 346 346 69 22 0.16 21 0.15 0.40 1.46
64 Long-Term Bond (40) (862) (862) (2,344) 21 0.15 24 0.16 4.51 12.37
65 Pacific/Asia ex-Japan Stk (65) (610) (610) (8,195) 21 0.15 33 0.23 20.04 3.15
66 Equity Precious Metals (172) 202 202 (724) 19 0.13 18 0.12 16.91 80.42
67 Muni New York Long 44 96 96 (790) 19 0.13 19 0.13 0.91 3.48
68 Aggressive Allocation 84 22 22 (501) 17 0.12 18 0.13 11.58 0.22
69 Trading-Leveraged Equity (1,687) (2,104) (2,104) (811) 17 0.12 20 0.14 — —
70 China Region (72) (1,557) (1,557) (2,669) 16 0.11 24 0.16 21.40 (11.54)
©2016 Morningstar, Inc. All Rights Reserved. For institutional use only. The information contained herein: (1) is proprietary to Morningstar and/or its content providers; (2) may not be copied or distributed; and (3) is not warranted to be accurate, complete or timely.Neither Morningstar norits content providers are responsible for any damages or losses arising from any use of this information. Past performance is no guarantee of future results. ß
®

Morningstar DirectSM | Publishing Date: 2016-04-14 Page 3
Fund Flows
Monthly Market Summary: US Open-end & ETF ex MM ex FoFIncluding merged and liquidated funds
Effective Date03-31-2016
Morningstar Categories Ranked by Current TNA ($Mil)Rank Name Estimated Net Flow ($mil) Total Net Assets ($bil) Total Return
1-Mo QTD YTD 1-Yr 03-2016 Mkt Sh % 03-2015 Mkt Sh % 1-Mo YTD
71 Convertibles (323) (1,336) (1,336) (3,101) 16 0.11 21 0.14 8.80 (3.03)
72 Industrials 163 (89) (89) (3,878) 16 0.11 21 0.14 14.91 6.67
73 Muni Single State Interm 104 254 254 166 13 0.10 13 0.09 0.27 1.40
74 Diversified Pacific/Asia (361) (609) (609) (770) 13 0.09 15 0.10 16.62 (1.13)
75 Trading-Inverse Equity 1,800 3,571 3,571 4,853 11 0.08 8 0.05 — —
76 Muni New York Intermediate 99 247 247 606 11 0.08 10 0.07 0.64 2.83
77 Muni Single State Short 36 (159) (159) (1,036) 10 0.07 12 0.08 (0.09) 0.84
78 Muni Pennsylvania 34 74 74 (51) 9 0.07 9 0.06 0.46 1.44
79 India Equity 250 (143) (143) (358) 9 0.06 10 0.07 27.63 (9.66)
80 Communications 354 619 619 792 8 0.05 7 0.04 11.26 11.19
81 Multicurrency (40) (502) (502) (3,820) 8 0.05 12 0.08 3.69 2.86
82 Muni Massachusetts 54 142 142 133 7 0.05 7 0.05 0.32 1.41
83 Muni New Jersey 19 15 15 (316) 7 0.05 7 0.05 0.57 1.64
84 Commodities Energy (610) 896 896 2,556 6 0.04 5 0.04 10.58 (9.94)
85 Latin America Stock 501 380 380 86 5 0.04 6 0.04 37.65 34.78
86 Muni Ohio 33 96 96 86 5 0.04 5 0.03 0.47 1.64
87 Muni Minnesota 35 109 109 217 5 0.03 4 0.03 0.36 1.31
88 Target Date 2026-2030 45 (58) (58) (424) 4 0.03 5 0.03 5.36 3.08
89 Volatility 1,543 1,078 1,078 1,461 4 0.03 4 0.03 — —
90 Target Date 2016-2020 (9) (150) (150) (741) 4 0.03 5 0.03 4.73 2.78
91 Miscellaneous Sector (54) (248) (248) (451) 4 0.03 5 0.03 — —
92 Trading-Inverse Debt (143) (532) (532) (722) 4 0.03 5 0.03 — —
93 Bear Market (66) 281 281 (674) 4 0.02 4 0.03 (18.23) (4.14)
94 Target Date 2036-2040 38 (40) (40) (346) 3 0.02 4 0.03 6.89 3.09
95 Target Date 2021-2025 16 22 22 (73) 3 0.02 3 0.02 2.79 4.74
96 Trading-Leveraged Commodities (397) 559 559 3,214 3 0.02 3 0.02 — —
97 Target Date 2031-2035 21 51 51 54 2 0.01 2 0.01 3.60 4.22
98 Target Date 2046-2050 37 14 14 (60) 2 0.01 2 0.01 3.68 3.89
99 Retirement Income (26) (67) (67) (173) 1 0.01 2 0.01 3.28 2.44
100 Single Currency 26 (45) (45) 152 1 0.01 1 0.01 — —
101 Commodities Agriculture 49 (15) (15) (80) 1 0.01 2 0.01 4.33 (0.63)
102 Target Date 2041-2045 21 36 36 41 1 0.01 1 0.01 3.87 3.88
103 Trading-Inverse Commodities 162 144 144 (273) 1 0.01 1 0.01 — —
104 Trading-Miscellaneous (24) (142) (142) (525) 1 0.01 2 0.01 — —
105 Target Date 2011-2015 (16) (46) (46) (289) 1 0.00 1 0.01 2.13 5.13
©2016 Morningstar, Inc. All Rights Reserved. For institutional use only. The information contained herein: (1) is proprietary to Morningstar and/or its content providers; (2) may not be copied or distributed; and (3) is not warranted to be accurate, complete or timely.Neither Morningstar norits content providers are responsible for any damages or losses arising from any use of this information. Past performance is no guarantee of future results. ß
®

Morningstar DirectSM | Publishing Date: 2016-04-14 Page 4
Fund Flows
Monthly Market Summary: US Open-end & ETF ex MM ex FoFIncluding merged and liquidated funds
Effective Date03-31-2016
Morningstar Categories Ranked by Current TNA ($Mil)Rank Name Estimated Net Flow ($mil) Total Net Assets ($bil) Total Return
1-Mo QTD YTD 1-Yr 03-2016 Mkt Sh % 03-2015 Mkt Sh % 1-Mo YTD
106 Trading-Leveraged Debt 17 44 44 22 1 0.00 1 0.00 — —
107 Target Date 2000-2010 4 (27) (27) (209) 0 0.00 1 0.00 5.02 3.15
108 Target Date 2051+ 18 46 46 106 0 0.00 0 0.00 8.57 11.51
109 Commodities Industrial Metals 5 (20) (20) (67) 0 0.00 0 0.00 — —
110 Commodities Miscellaneous 0 (1) (1) 0 0 0.00 0 0.00 4.93 (40.89)
Top 10 28,717 43,884 43,884 142,083 8,524 60.49 8,622 59.13 — —
All 49,289 49,752 49,752 107,441 14,091 100.00 14,583 100.00 — —
Top Fund Families Ranked by Current TNA ($Mil)Rank Name Estimated Net Flow ($mil) Assets Under Management ($bil)
1-Mo QTD YTD 1-Yr 03-2016 Mkt Sh % 03-2015 Mkt Sh %
1 Vanguard 28,912 71,541 71,541 219,043 3,002 21.30 2,814 19.30
2 Fidelity Investments 142 (3,935) (3,935) (5,510) 1,240 8.80 1,295 8.88
3 American Funds 1,811 4,765 4,765 6,172 1,185 8.41 1,199 8.22
4 iShares 14,847 16,634 16,634 92,483 840 5.96 796 5.46
5 T. Rowe Price (205) 1,565 1,565 (239) 466 3.31 477 3.27
6 SPDR State Street Global Advisors 4,298 6,470 6,470 11,331 430 3.05 429 2.94
7 Franklin Templeton Investments (2,773) (10,176) (10,176) (39,085) 386 2.74 449 3.08
8 Pimco (1,031) (5,191) (5,191) (57,545) 298 2.12 364 2.50
9 Dimensional Fund Advisors 1,855 7,578 7,578 21,817 275 1.95 270 1.85
10 JPMorgan (875) (3,363) (3,363) 3,857 266 1.89 275 1.88
11 BlackRock 1,561 1,497 1,497 3,209 228 1.62 235 1.61
12 MFS 182 356 356 2,172 178 1.26 178 1.22
13 OppenheimerFunds (385) (2,086) (2,086) (13,180) 174 1.24 199 1.37
14 Dodge & Cox (963) (1,636) (1,636) (5,598) 171 1.22 194 1.33
15 Columbia (259) (2,729) (2,729) (13,446) 141 1.00 162 1.11
16 Invesco 551 (584) (584) (5,537) 140 0.99 152 1.04
17 Jackson National 432 (343) (343) 6,254 124 0.88 124 0.85
18 John Hancock 138 (221) (221) 7,886 122 0.87 121 0.83
19 Principal Funds 500 (307) (307) 1,259 113 0.80 115 0.79
20 Janus 48 (513) (513) (3,301) 102 0.72 109 0.75
21 Wells Fargo Funds (410) (2,498) (2,498) (11,353) 100 0.71 116 0.79
22 American Century Investments 298 (45) (45) (2,144) 100 0.71 103 0.71
23 Lord Abbett 547 39 39 (5,349) 99 0.70 108 0.74
24 AXA Equitable (479) (1,403) (1,403) (3,945) 97 0.69 103 0.71
25 TIAA-CREF Asset Management 774 1,728 1,728 6,438 90 0.64 86 0.59©2016 Morningstar, Inc. All Rights Reserved. For institutional use only. The information contained herein: (1) is proprietary to Morningstar and/or its content providers; (2) may not be copied or distributed; and (3) is not warranted to be accurate, complete or timely.Neither Morningstar norits content providers are responsible for any damages or losses arising from any use of this information. Past performance is no guarantee of future results. ß
®

Morningstar DirectSM | Publishing Date: 2016-04-14 Page 5
Fund Flows
Monthly Market Summary: US Open-end & ETF ex MM ex FoFIncluding merged and liquidated funds
Effective Date03-31-2016
Top Fund Families Ranked by Current TNA ($Mil)Rank Name Estimated Net Flow ($mil) Assets Under Management ($bil)
1-Mo QTD YTD 1-Yr 03-2016 Mkt Sh % 03-2015 Mkt Sh %
26 Legg Mason 186 (768) (768) (1,574) 90 0.64 94 0.65
27 Hartford Mutual Funds (439) (919) (919) (1,986) 89 0.63 95 0.65
28 PowerShares 1,763 (1,567) (1,567) 778 89 0.63 91 0.62
29 SEI (318) 50 50 3,225 87 0.62 87 0.59
30 Goldman Sachs (881) (3,342) (3,342) (11,968) 83 0.59 102 0.70
31 Metropolitan West Funds 981 2,280 2,280 8,712 82 0.58 73 0.50
32 Voya (637) (1,809) (1,809) (7,980) 81 0.58 92 0.63
33 Prudential Investments 587 133 133 (817) 76 0.54 81 0.55
34 Harbor (345) (605) (605) (3,765) 75 0.53 84 0.58
35 Oakmark (1,016) (2,337) (2,337) (4,999) 71 0.51 84 0.57
36 DoubleLine 2,003 6,055 6,055 14,369 70 0.49 54 0.37
37 First Eagle (101) (1,156) (1,156) (5,261) 69 0.49 75 0.51
38 Putnam (809) (2,622) (2,622) (7,749) 64 0.46 78 0.53
39 Nuveen 714 1,552 1,552 1,986 64 0.45 62 0.43
40 Eaton Vance 274 69 69 (4,526) 63 0.45 70 0.48
41 GMO (1,784) (2,758) (2,758) (9,784) 63 0.44 76 0.52
42 Federated (21) 149 149 (1,656) 62 0.44 65 0.45
43 AllianceBernstein 1,242 2,196 2,196 1,278 62 0.44 62 0.43
44 MainStay (351) (2,233) (2,233) (10,565) 59 0.42 73 0.50
45 USAA (7) (956) (956) (983) 57 0.40 59 0.40
46 Schwab Funds (113) (295) (295) 412 57 0.40 58 0.40
47 Dreyfus (42) 88 88 (4,301) 56 0.40 63 0.43
48 Natixis Funds 388 (1,198) (1,198) (4,565) 55 0.39 63 0.43
49 Northern Funds 352 248 248 (794) 49 0.34 52 0.36
50 Thornburg (44) (721) (721) (1,928) 48 0.34 53 0.36
Top 10 46,981 85,887 85,887 252,323 8,390 59.54 8,369 57.39
Top 50 51,100 66,678 66,678 161,244 12,089 85.80 12,319 84.48
Other (1,811) (16,718) (16,718) (46,834) 2,002 14.20 2,197 15.07
All 49,289 49,960 49,960 114,410 14,091 100.00 14,516 99.54
©2016 Morningstar, Inc. All Rights Reserved. For institutional use only. The information contained herein: (1) is proprietary to Morningstar and/or its content providers; (2) may not be copied or distributed; and (3) is not warranted to be accurate, complete or timely.Neither Morningstar norits content providers are responsible for any damages or losses arising from any use of this information. Past performance is no guarantee of future results. ß
®
Morningstar DirectSM | Publishing Date: 2016-04-14 Page 6
Fund Flows
Monthly Market Summary: US Open-end & ETF ex MM ex FoFIncluding merged and liquidated funds
Effective Date03-31-2016
Asset ClassesName Estimated Net Flow ($mil) Assets Under Management ($bil)
1-Mo QTD YTD 1-Yr 03-2016 Mkt Sh % 03-2015 Mkt Sh %
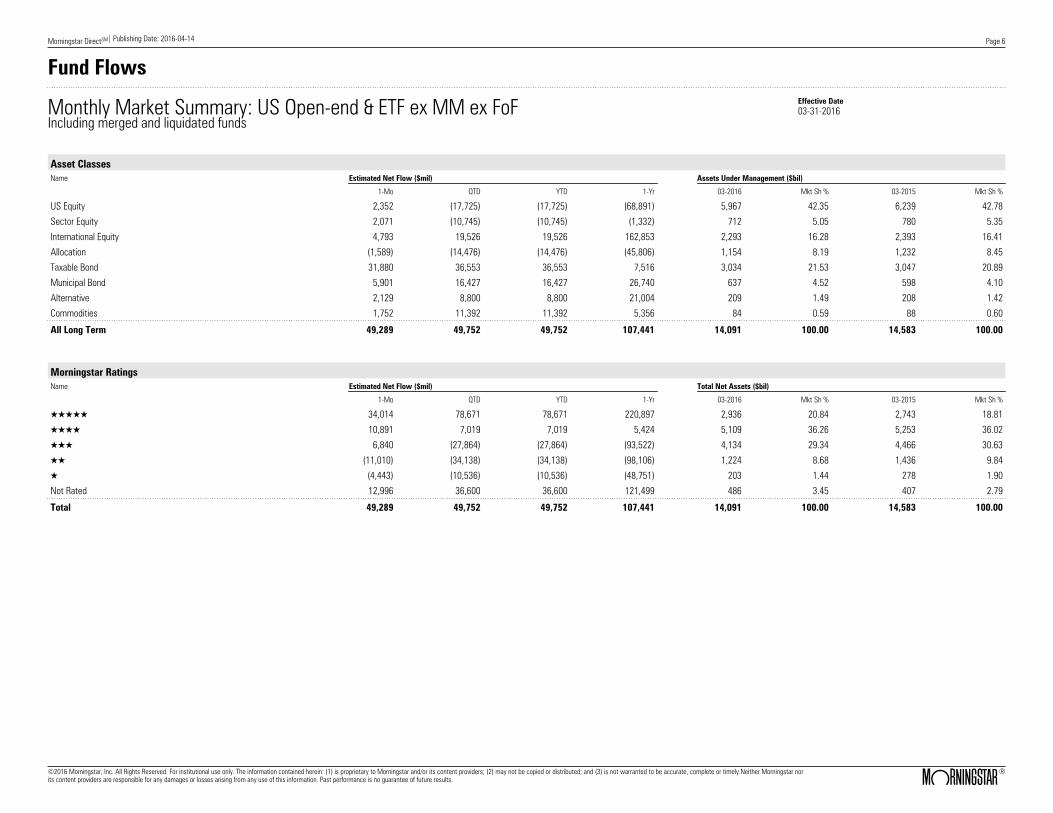
US Equity 2,352 (17,725) (17,725) (68,891) 5,967 42.35 6,239 42.78
Sector Equity 2,071 (10,745) (10,745) (1,332) 712 5.05 780 5.35
International Equity 4,793 19,526 19,526 162,853 2,293 16.28 2,393 16.41
Allocation (1,589) (14,476) (14,476) (45,806) 1,154 8.19 1,232 8.45
Taxable Bond 31,880 36,553 36,553 7,516 3,034 21.53 3,047 20.89
Municipal Bond 5,901 16,427 16,427 26,740 637 4.52 598 4.10
Alternative 2,129 8,800 8,800 21,004 209 1.49 208 1.42
Commodities 1,752 11,392 11,392 5,356 84 0.59 88 0.60
All Long Term 49,289 49,752 49,752 107,441 14,091 100.00 14,583 100.00
Morningstar RatingsName Estimated Net Flow ($mil) Total Net Assets ($bil)
1-Mo QTD YTD 1-Yr 03-2016 Mkt Sh % 03-2015 Mkt Sh %
QQQQQ 34,014 78,671 78,671 220,897 2,936 20.84 2,743 18.81
QQQQ 10,891 7,019 7,019 5,424 5,109 36.26 5,253 36.02
QQQ 6,840 (27,864) (27,864) (93,522) 4,134 29.34 4,466 30.63
QQ (11,010) (34,138) (34,138) (98,106) 1,224 8.68 1,436 9.84
Q (4,443) (10,536) (10,536) (48,751) 203 1.44 278 1.90
Not Rated 12,996 36,600 36,600 121,499 486 3.45 407 2.79
Total 49,289 49,752 49,752 107,441 14,091 100.00 14,583 100.00
©2016 Morningstar, Inc. All Rights Reserved. For institutional use only. The information contained herein: (1) is proprietary to Morningstar and/or its content providers; (2) may not be copied or distributed; and (3) is not warranted to be accurate, complete or timely.Neither Morningstar norits content providers are responsible for any damages or losses arising from any use of this information. Past performance is no guarantee of future results. ß
®