morningstar directsm equity...
TRANSCRIPT
Morningstar® DirectSM Equity Attribution
© 2013 Morningstar, Inc. All rights reserved.
1
Equity attribution, also known as micro attribution, compares a portfolio’s performance to that of a benchmark by decomposing the excess return to explain the impact of various investment decisions. Analyze the results by various groupings such as industry classifications, regional classifications, style classifications or custom classifications. Create an equity attribution report from the Investment List, Search Criteria, and Performance Reporting folders or create a report directly from the Performance Attribution folder. Outline Create an Equity Attribution Report View the Equity Attribution Results (includes Summary PDF) Automatically Run Reports Using Batch Scheduling Send Your Reports to Morningstar Direct Colleagues
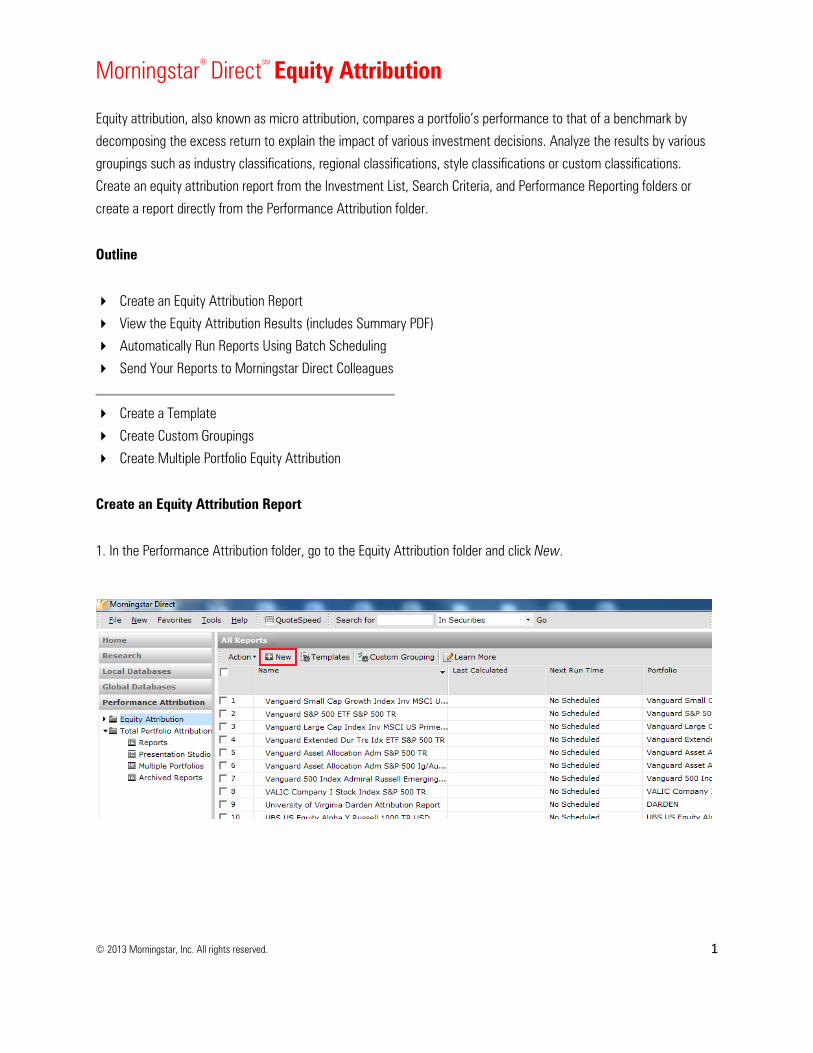
Create a Template Create Custom Groupings Create Multiple Portfolio Equity Attribution Create an Equity Attribution Report 1. In the Performance Attribution folder, go to the Equity Attribution folder and click New.
Morningstar® DirectSM Equity Attribution
© 2013 Morningstar, Inc. All rights reserved.
2
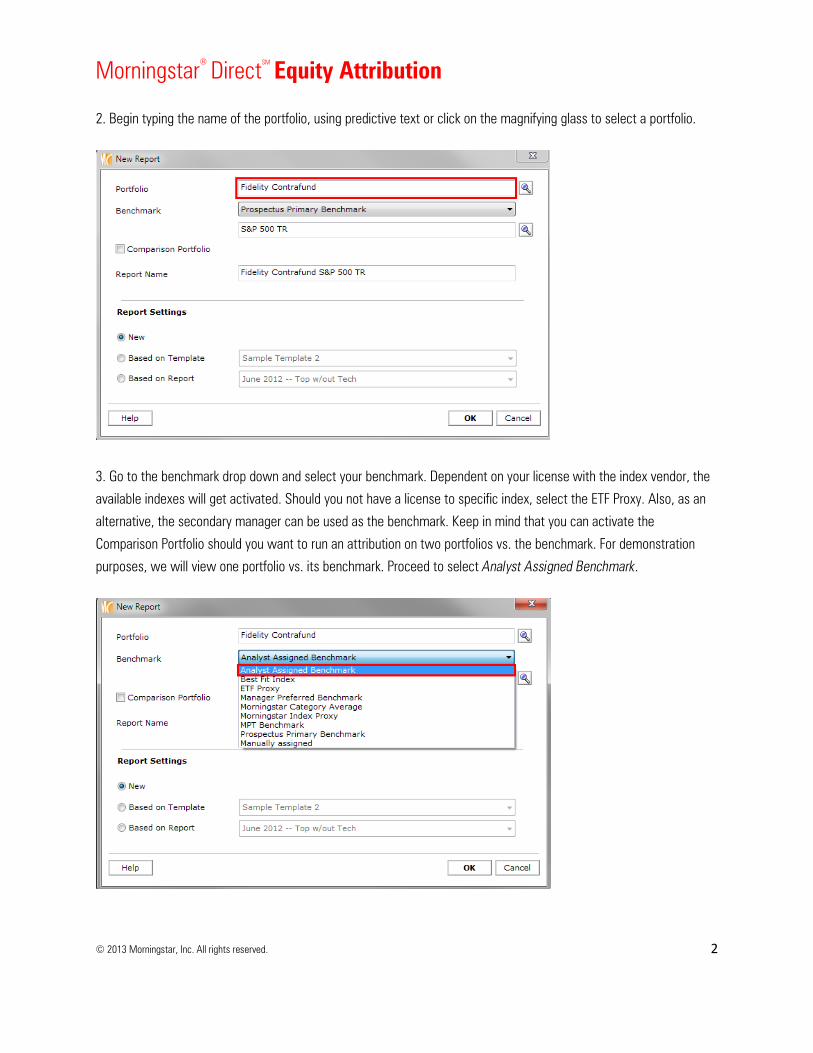
2. Begin typing the name of the portfolio, using predictive text or click on the magnifying glass to select a portfolio.
3. Go to the benchmark drop down and select your benchmark. Dependent on your license with the index vendor, the available indexes will get activated. Should you not have a license to specific index, select the ETF Proxy. Also, as an alternative, the secondary manager can be used as the benchmark. Keep in mind that you can activate the Comparison Portfolio should you want to run an attribution on two portfolios vs. the benchmark. For demonstration purposes, we will view one portfolio vs. its benchmark. Proceed to select Analyst Assigned Benchmark.
Morningstar® DirectSM Equity Attribution
© 2013 Morningstar, Inc. All rights reserved.
3
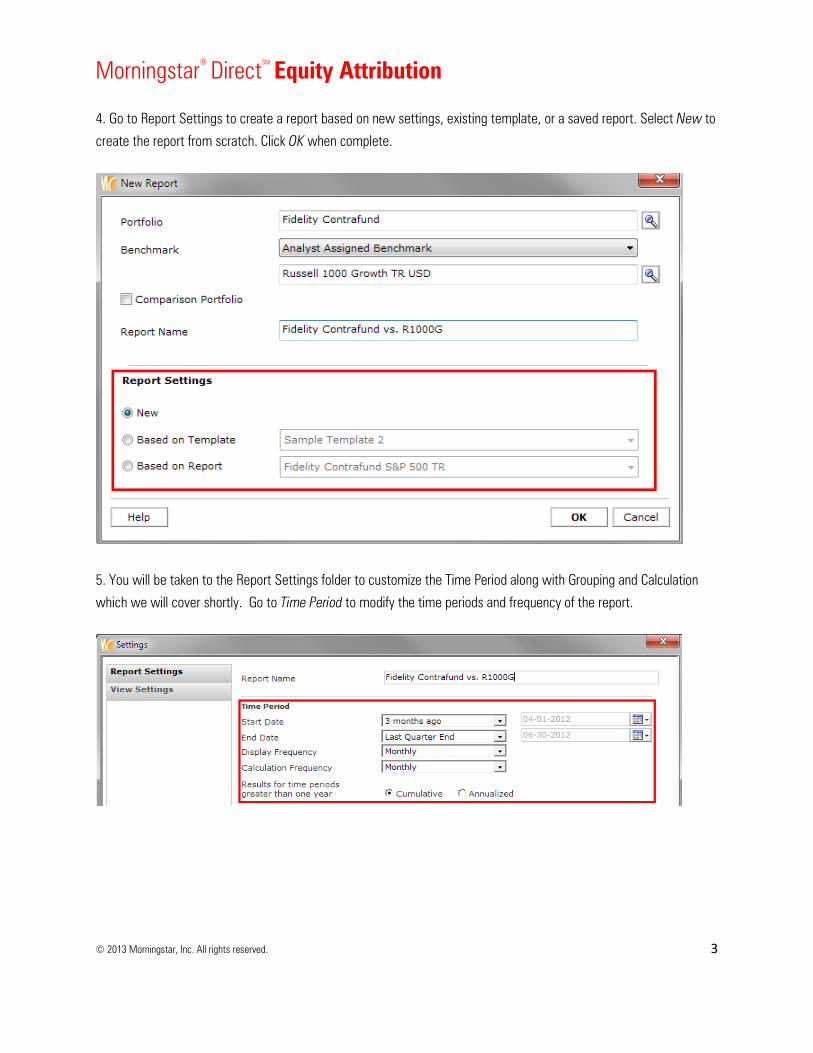
4. Go to Report Settings to create a report based on new settings, existing template, or a saved report. Select New to create the report from scratch. Click OK when complete.
5. You will be taken to the Report Settings folder to customize the Time Period along with Grouping and Calculation which we will cover shortly. Go to Time Period to modify the time periods and frequency of the report.
Morningstar® DirectSM Equity Attribution
© 2013 Morningstar, Inc. All rights reserved.
4
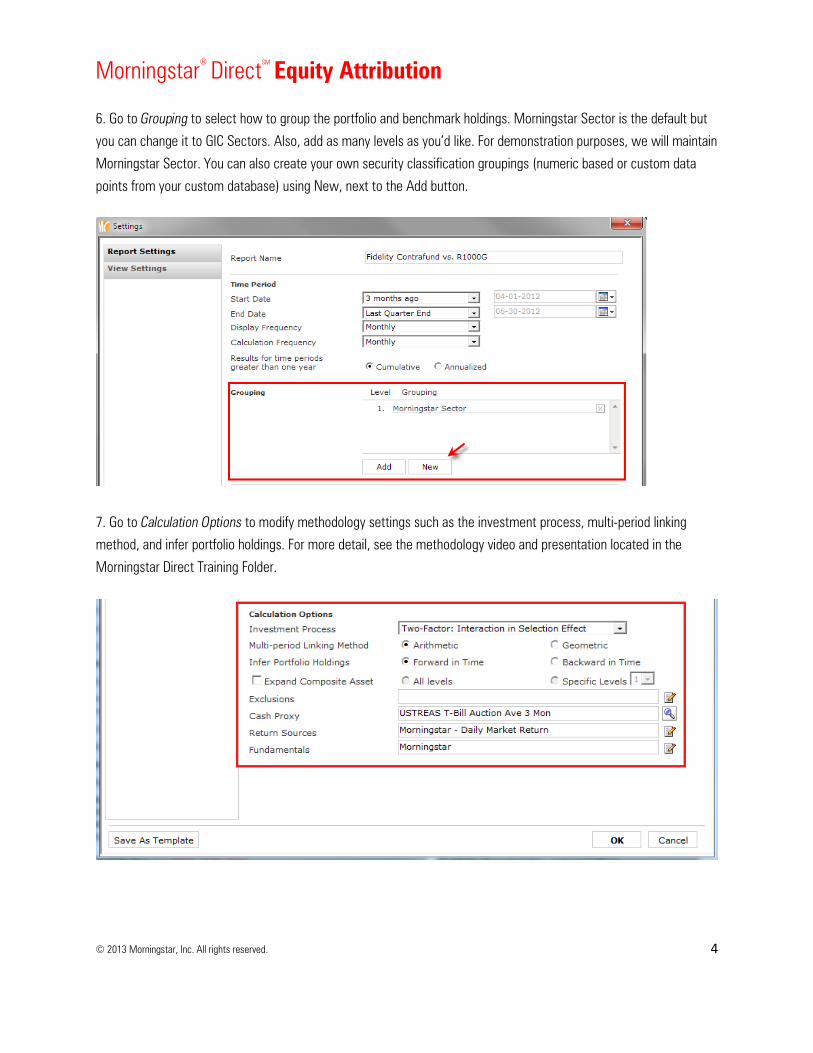
6. Go to Grouping to select how to group the portfolio and benchmark holdings. Morningstar Sector is the default but you can change it to GIC Sectors. Also, add as many levels as you’d like. For demonstration purposes, we will maintain Morningstar Sector. You can also create your own security classification groupings (numeric based or custom data points from your custom database) using New, next to the Add button.
7. Go to Calculation Options to modify methodology settings such as the investment process, multi-period linking method, and infer portfolio holdings. For more detail, see the methodology video and presentation located in the Morningstar Direct Training Folder.
Morningstar® DirectSM Equity Attribution
© 2013 Morningstar, Inc. All rights reserved.
5
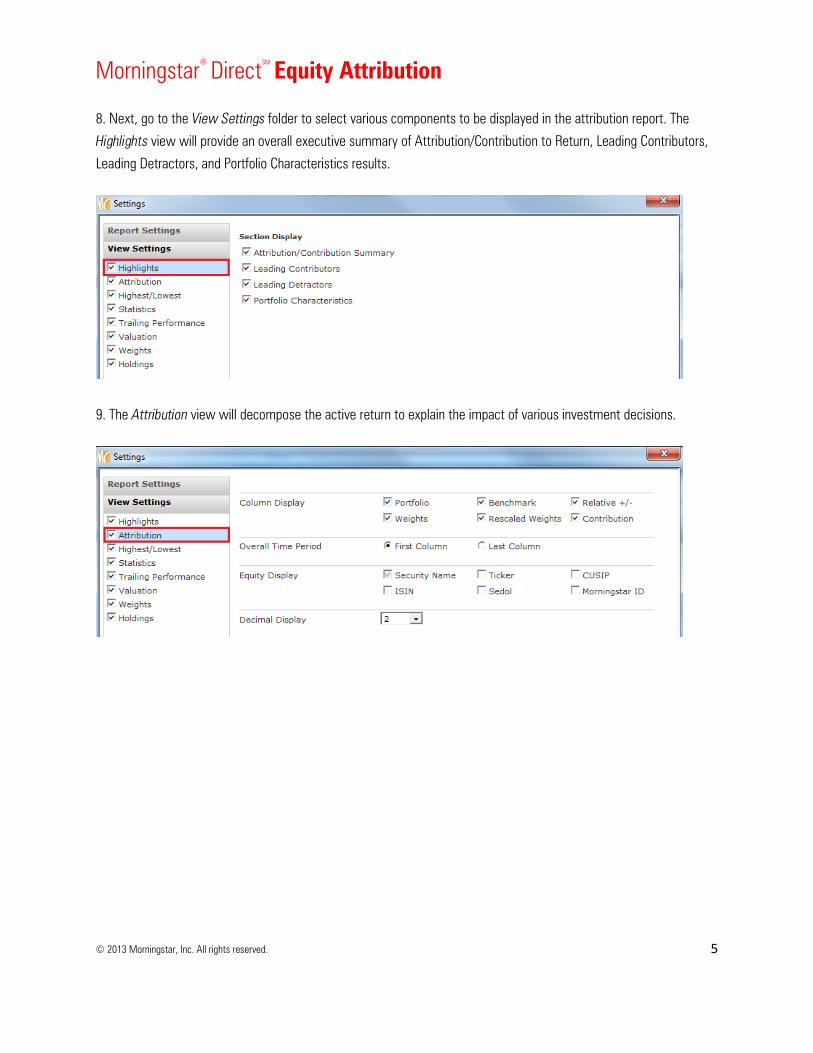
8. Next, go to the View Settings folder to select various components to be displayed in the attribution report. The Highlights view will provide an overall executive summary of Attribution/Contribution to Return, Leading Contributors, Leading Detractors, and Portfolio Characteristics results.
9. The Attribution view will decompose the active return to explain the impact of various investment decisions.

Morningstar® DirectSM Equity Attribution
© 2013 Morningstar, Inc. All rights reserved.
6
10. The Highest/Lowest view will display the fundamental data of those securities with the highest and the lowest security weightings in the portfolio.
Morningstar® DirectSM Equity Attribution
© 2013 Morningstar, Inc. All rights reserved.
7
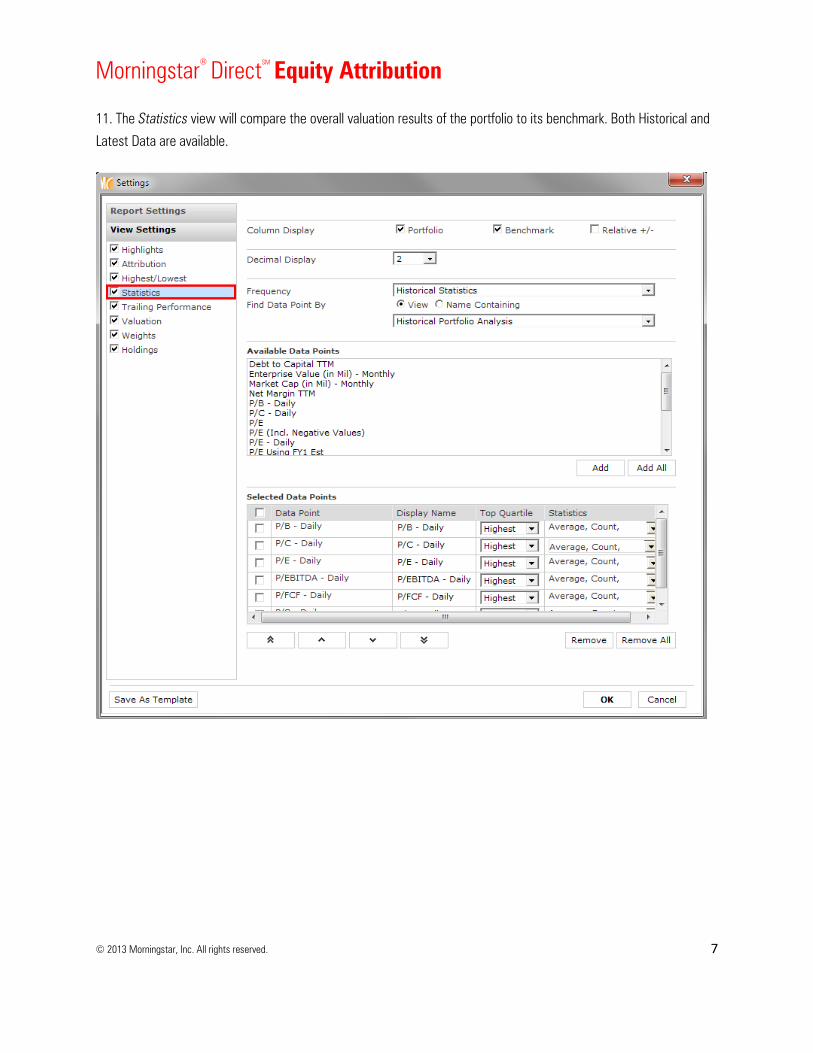
11. The Statistics view will compare the overall valuation results of the portfolio to its benchmark. Both Historical and Latest Data are available.
14
Morningstar® DirectSM Equity Attribution
© 2013 Morningstar, Inc. All rights reserved.
8
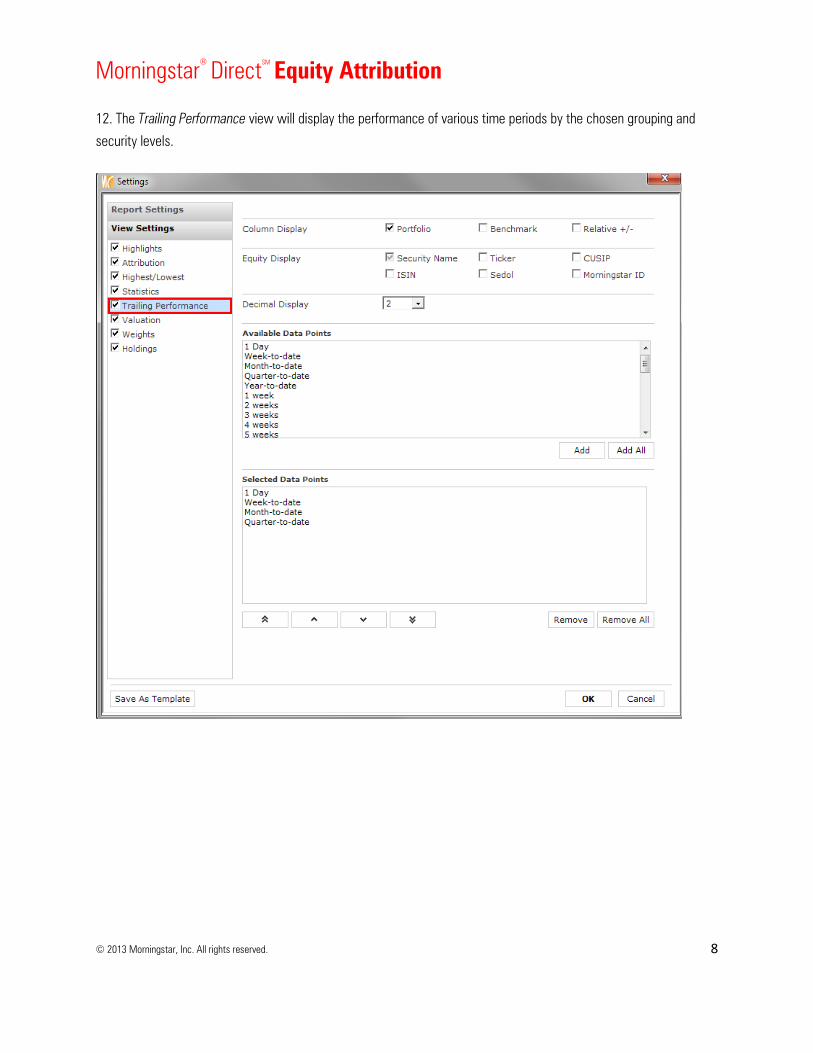
12. The Trailing Performance view will display the performance of various time periods by the chosen grouping and security levels.
15
Morningstar® DirectSM Equity Attribution
© 2013 Morningstar, Inc. All rights reserved.
9
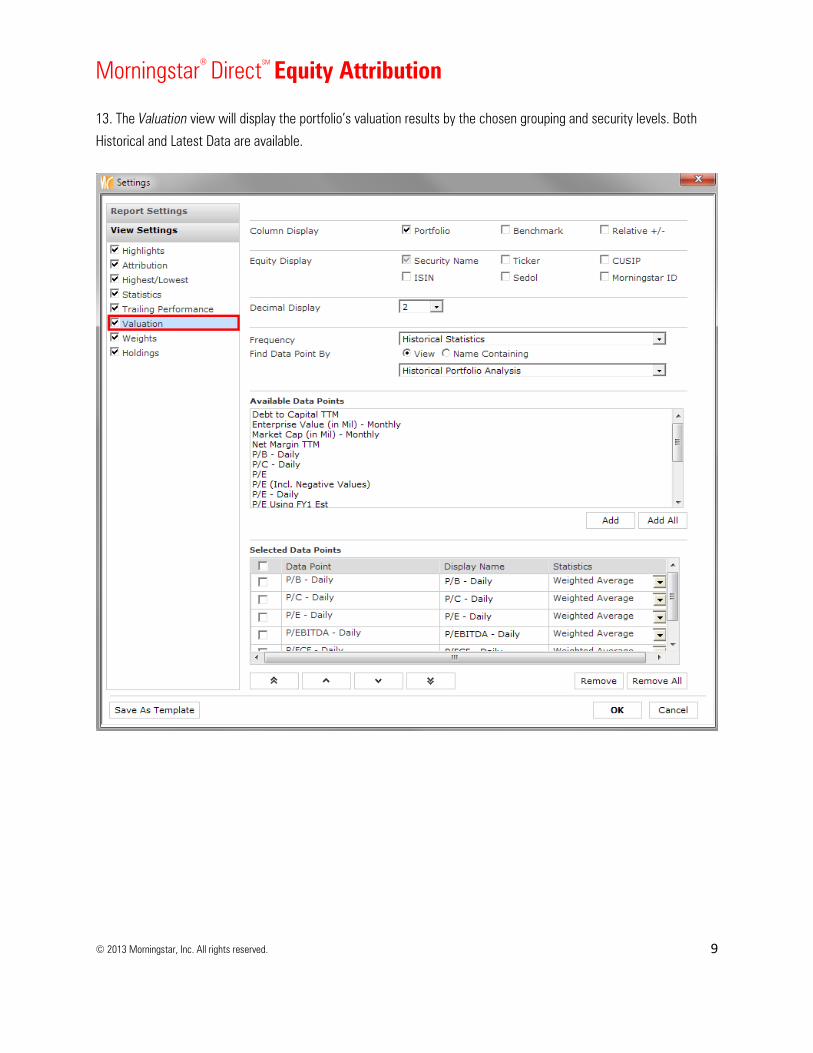
13. The Valuation view will display the portfolio’s valuation results by the chosen grouping and security levels. Both Historical and Latest Data are available.
Morningstar® DirectSM Equity Attribution
© 2013 Morningstar, Inc. All rights reserved.
10
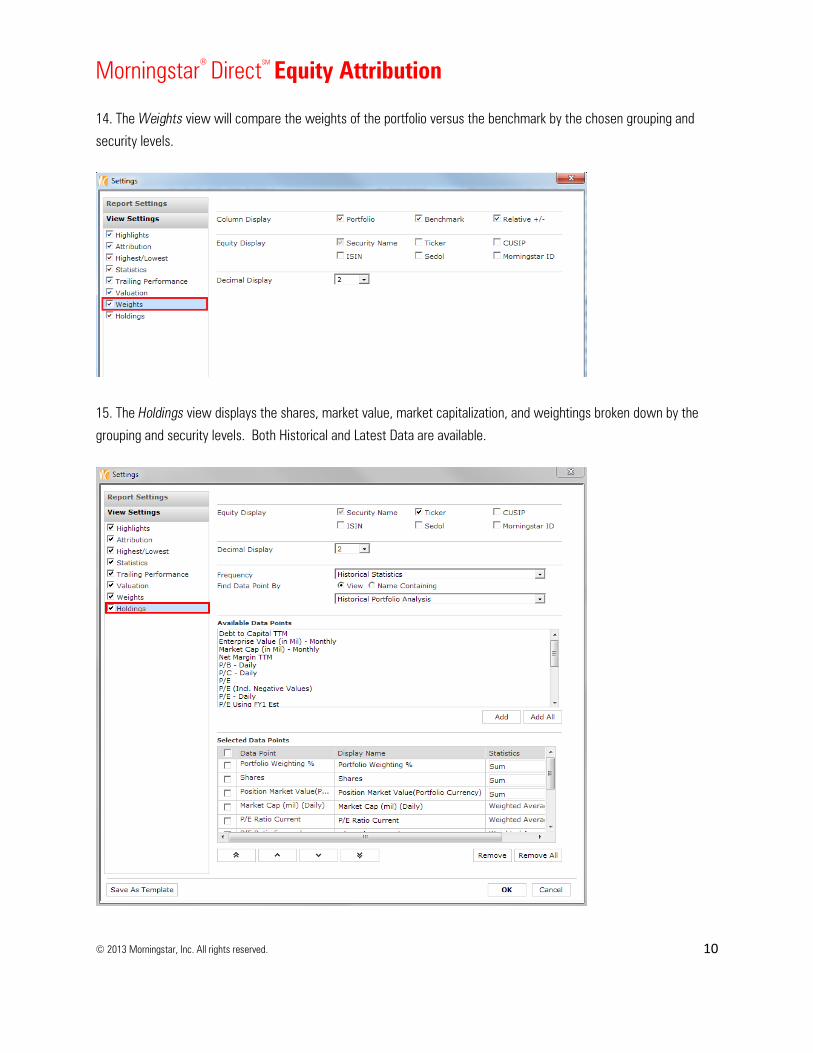
14. The Weights view will compare the weights of the portfolio versus the benchmark by the chosen grouping and security levels.
15. The Holdings view displays the shares, market value, market capitalization, and weightings broken down by the grouping and security levels. Both Historical and Latest Data are available.

Morningstar® DirectSM Equity Attribution
© 2013 Morningstar, Inc. All rights reserved.
11
16. Once you have specified the components of Report Settings and View Settings, you can save the settings as a template by selecting Save As Template. Proceed to click OK to run the Equity Attribution Report.
Morningstar® DirectSM Equity Attribution
© 2013 Morningstar, Inc. All rights reserved.
12
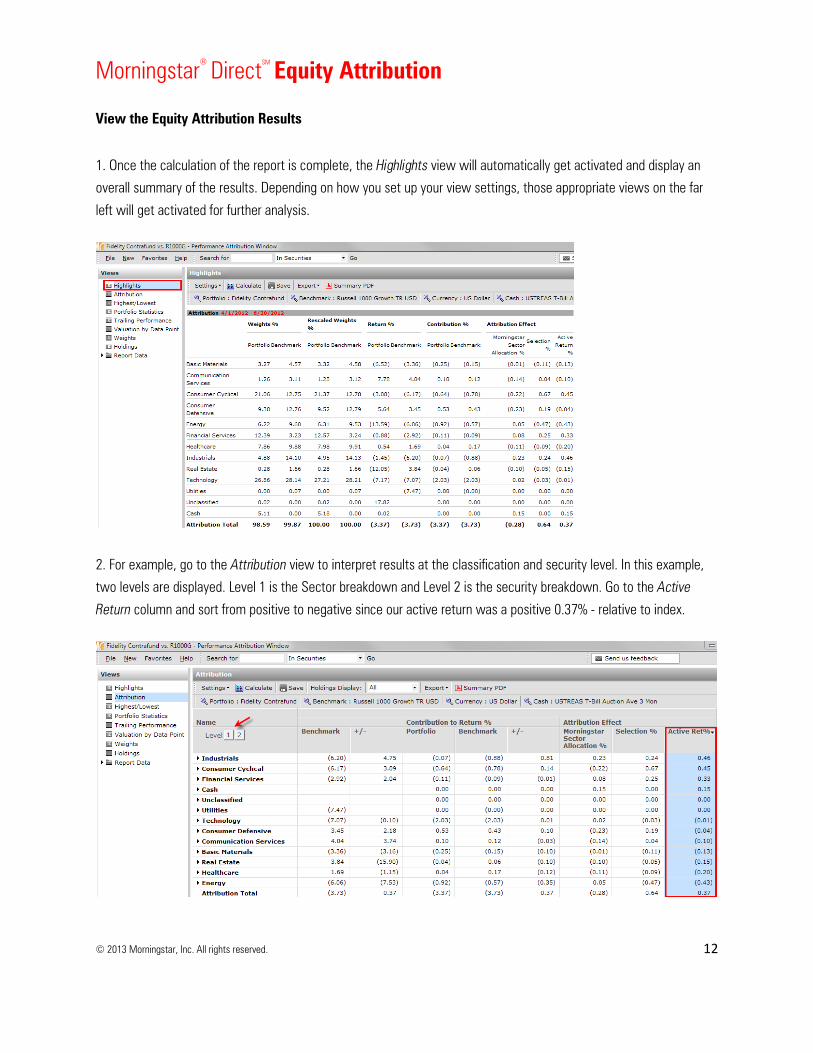
View the Equity Attribution Results 1. Once the calculation of the report is complete, the Highlights view will automatically get activated and display an overall summary of the results. Depending on how you set up your view settings, those appropriate views on the far left will get activated for further analysis.
2. For example, go to the Attribution view to interpret results at the classification and security level. In this example, two levels are displayed. Level 1 is the Sector breakdown and Level 2 is the security breakdown. Go to the Active Return column and sort from positive to negative since our active return was a positive 0.37% - relative to index.
Morningstar® DirectSM Equity Attribution
© 2013 Morningstar, Inc. All rights reserved.
13
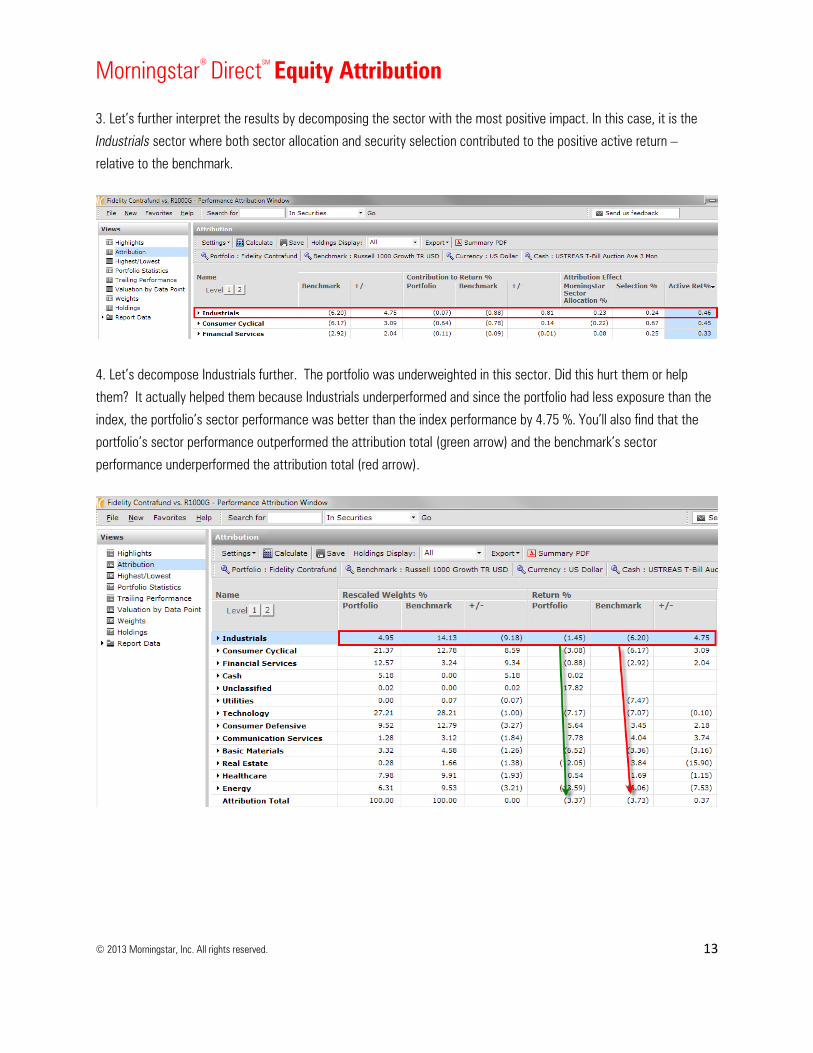
3. Let’s further interpret the results by decomposing the sector with the most positive impact. In this case, it is the Industrials sector where both sector allocation and security selection contributed to the positive active return – relative to the benchmark.
4. Let’s decompose Industrials further. The portfolio was underweighted in this sector. Did this hurt them or help them? It actually helped them because Industrials underperformed and since the portfolio had less exposure than the index, the portfolio’s sector performance was better than the index performance by 4.75 %. You’ll also find that the portfolio’s sector performance outperformed the attribution total (green arrow) and the benchmark’s sector performance underperformed the attribution total (red arrow).
Morningstar® DirectSM Equity Attribution
© 2013 Morningstar, Inc. All rights reserved.
14
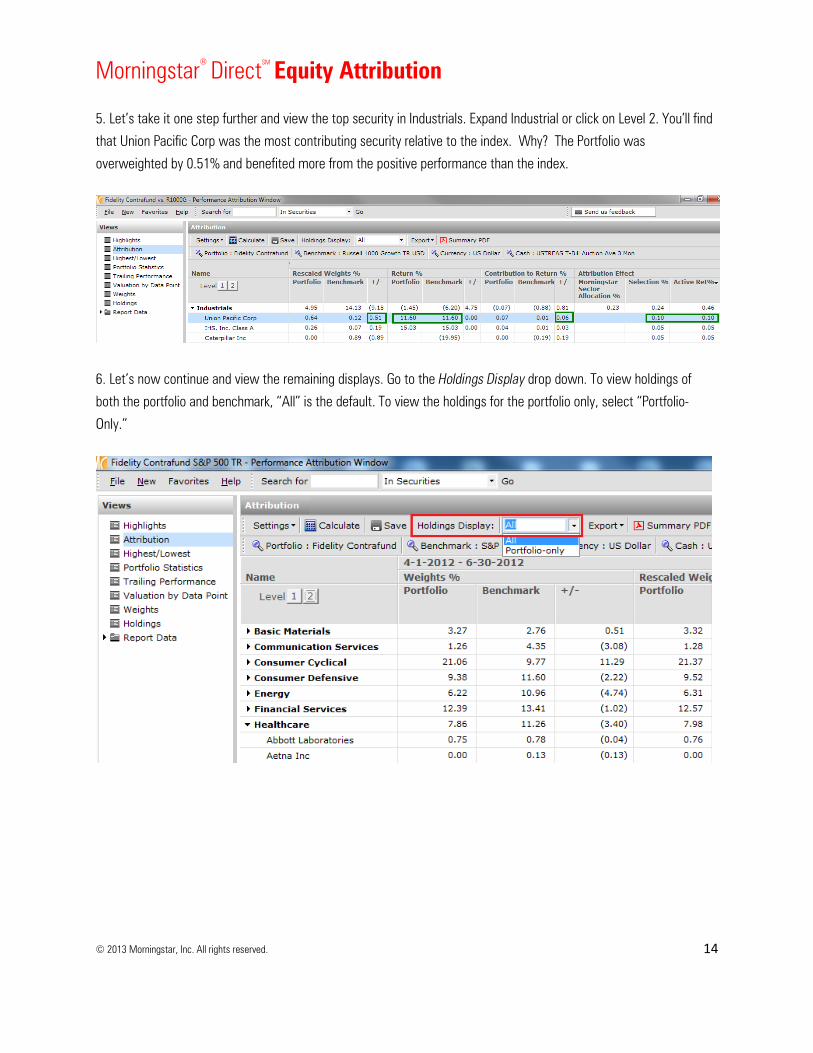
5. Let’s take it one step further and view the top security in Industrials. Expand Industrial or click on Level 2. You’ll find that Union Pacific Corp was the most contributing security relative to the index. Why? The Portfolio was overweighted by 0.51% and benefited more from the positive performance than the index.
6. Let’s now continue and view the remaining displays. Go to the Holdings Display drop down. To view holdings of both the portfolio and benchmark, “All” is the default. To view the holdings for the portfolio only, select “Portfolio-Only.”

Morningstar® DirectSM Equity Attribution
© 2013 Morningstar, Inc. All rights reserved.
15
7. Go to the Highest/Lowest view to analyze the valuation results for the highest-weighted and lowest-weighted securities in the portfolio.
8. Go to the Portfolio Statistics view to compare the valuation results of the portfolio to its benchmark.
Morningstar® DirectSM Equity Attribution
© 2013 Morningstar, Inc. All rights reserved.
16
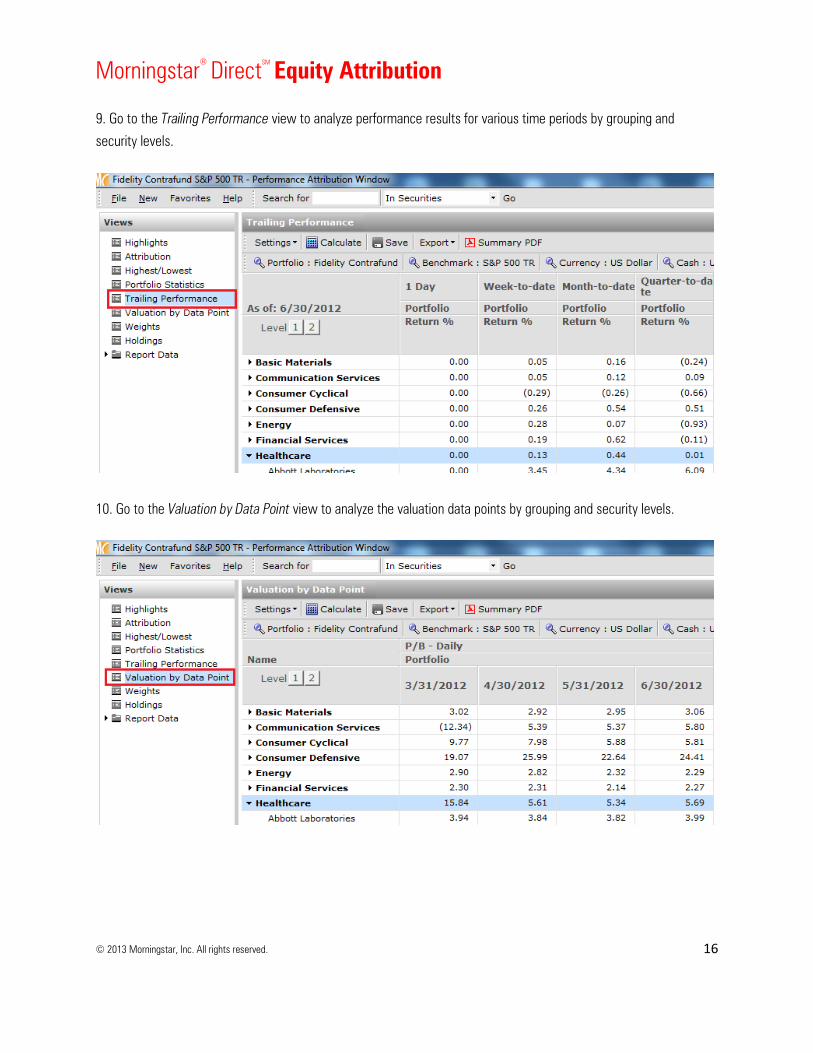
9. Go to the Trailing Performance view to analyze performance results for various time periods by grouping and security levels.
10. Go to the Valuation by Data Point view to analyze the valuation data points by grouping and security levels.
Morningstar® DirectSM Equity Attribution
© 2013 Morningstar, Inc. All rights reserved.
17
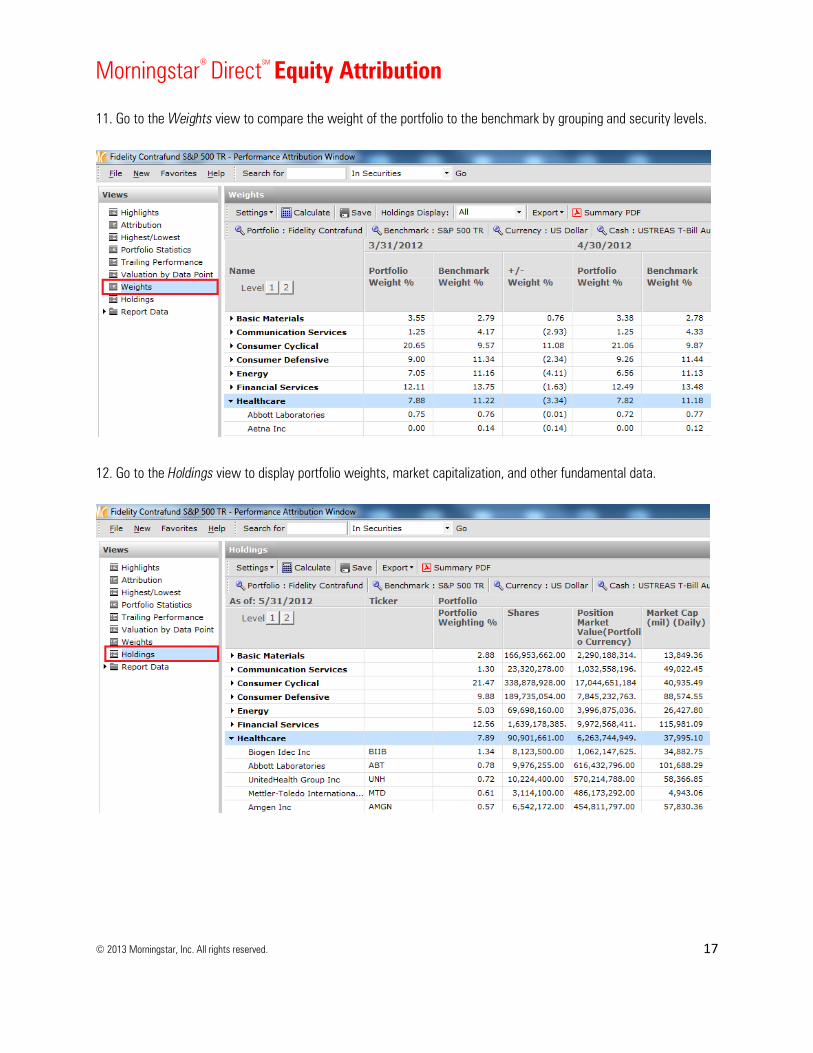
11. Go to the Weights view to compare the weight of the portfolio to the benchmark by grouping and security levels.
12. Go to the Holdings view to display portfolio weights, market capitalization, and other fundamental data.

Morningstar® DirectSM Equity Attribution
© 2013 Morningstar, Inc. All rights reserved.
18
13. In the Report Data view, details regarding Attribution Holding Data, Excluded Equities, and Missing Performance are available. Click on Attribution Holdings Data to display portfolios used in inferring holdings data.
14. Click Export to export all views or only the current view.
Morningstar® DirectSM Equity Attribution
© 2013 Morningstar, Inc. All rights reserved.
19
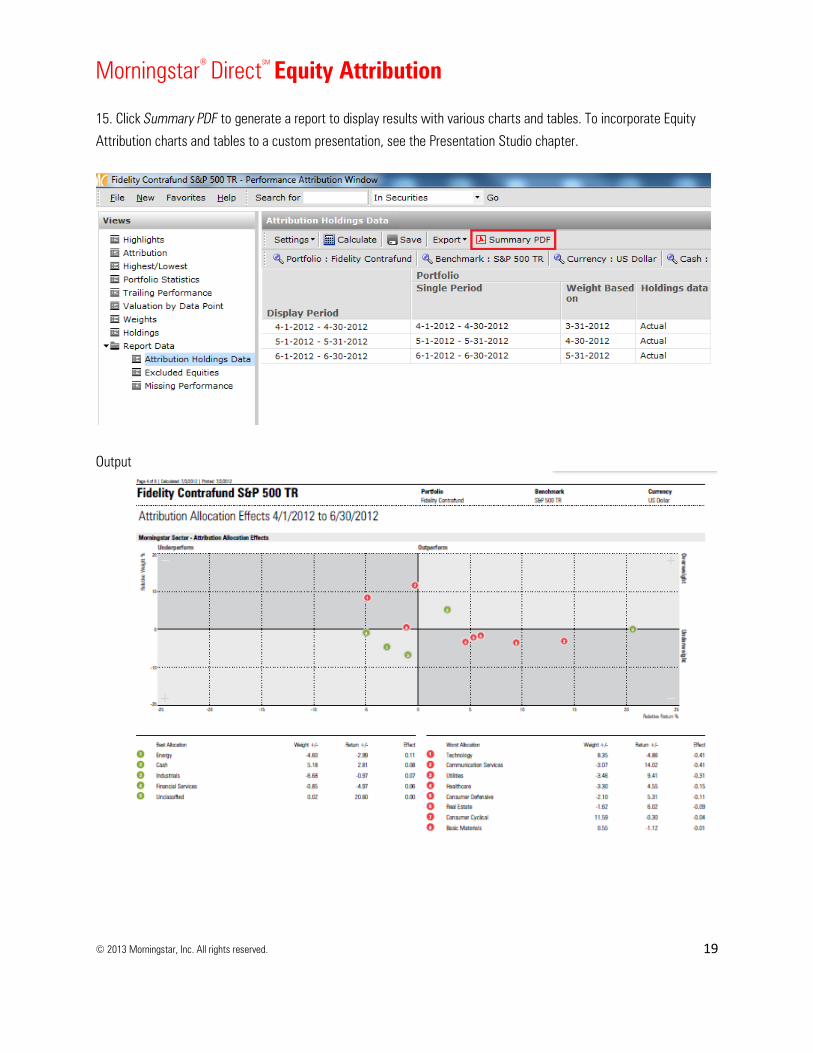
15. Click Summary PDF to generate a report to display results with various charts and tables. To incorporate Equity Attribution charts and tables to a custom presentation, see the Presentation Studio chapter.
Output
Morningstar® DirectSM Equity Attribution
© 2013 Morningstar, Inc. All rights reserved.
20
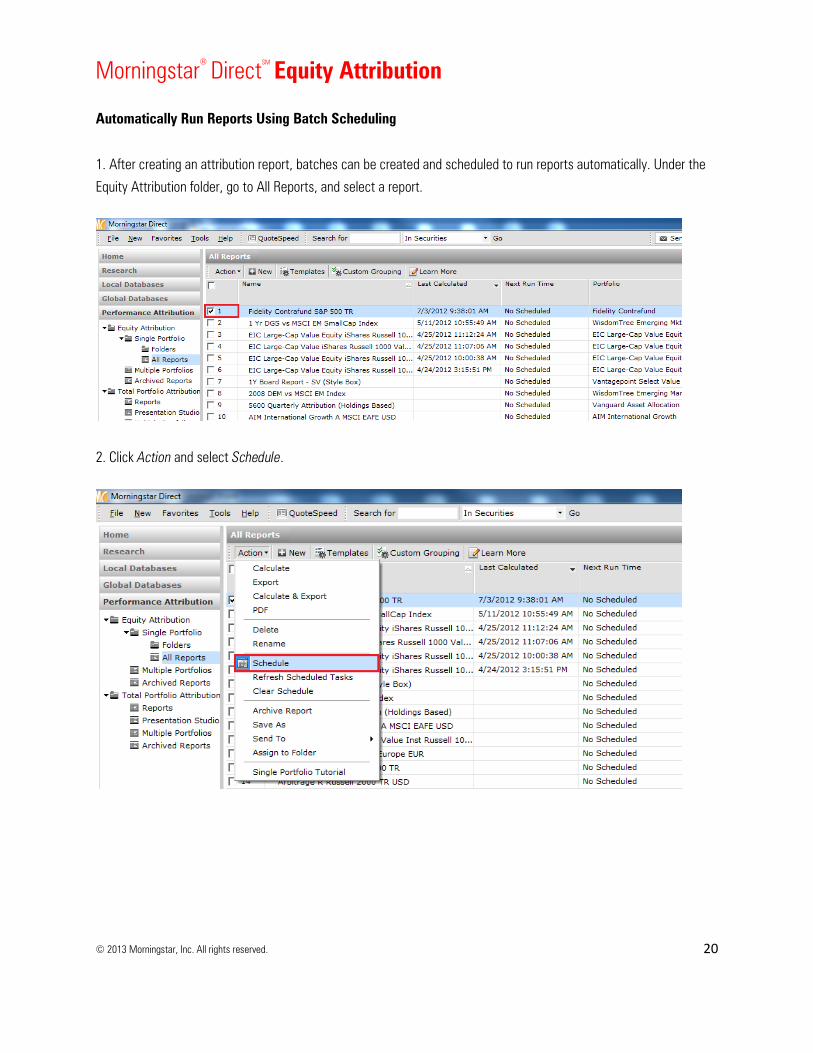
Automatically Run Reports Using Batch Scheduling 1. After creating an attribution report, batches can be created and scheduled to run reports automatically. Under the Equity Attribution folder, go to All Reports, and select a report.
2. Click Action and select Schedule.

Morningstar® DirectSM Equity Attribution
© 2013 Morningstar, Inc. All rights reserved.
21
3. Modify the details of the scheduled batch. Notice that the report can be calculated and exported to an output location. Click OK when complete.
4. Enter your Windows log-in and password. Click OK.

Morningstar® DirectSM Equity Attribution
© 2013 Morningstar, Inc. All rights reserved.
22
5. The report is now scheduled to run driven by the set specifications.
Send your Reports to Morningstar Direct Colleagues 1. Reports can be sent to colleagues within or outside your firm. Go to Action and select Send To.
Morningstar® DirectSM Equity Attribution
© 2013 Morningstar, Inc. All rights reserved.
23
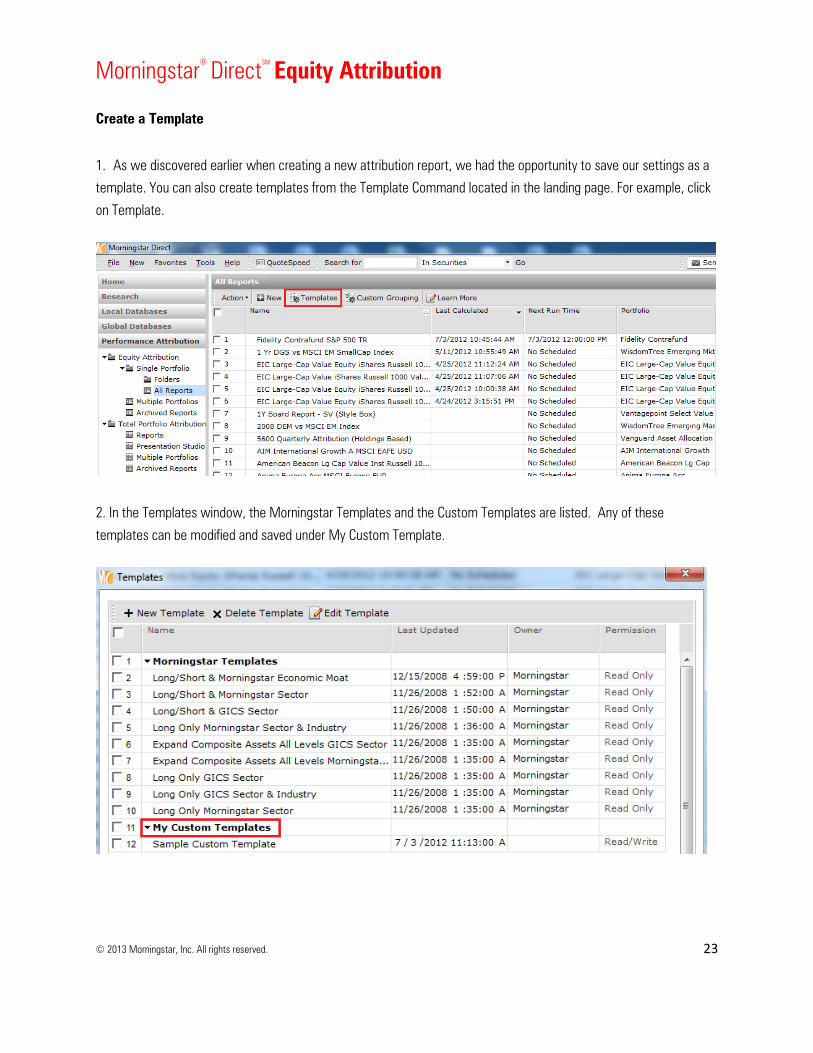
Create a Template 1. As we discovered earlier when creating a new attribution report, we had the opportunity to save our settings as a template. You can also create templates from the Template Command located in the landing page. For example, click on Template.
2. In the Templates window, the Morningstar Templates and the Custom Templates are listed. Any of these templates can be modified and saved under My Custom Template.

Morningstar® DirectSM Equity Attribution
© 2013 Morningstar, Inc. All rights reserved.
24
3. To create a new Custom Template, click New Template.
4. After completing the Report and View Settings, click Save.
Morningstar® DirectSM Equity Attribution
© 2013 Morningstar, Inc. All rights reserved.
25
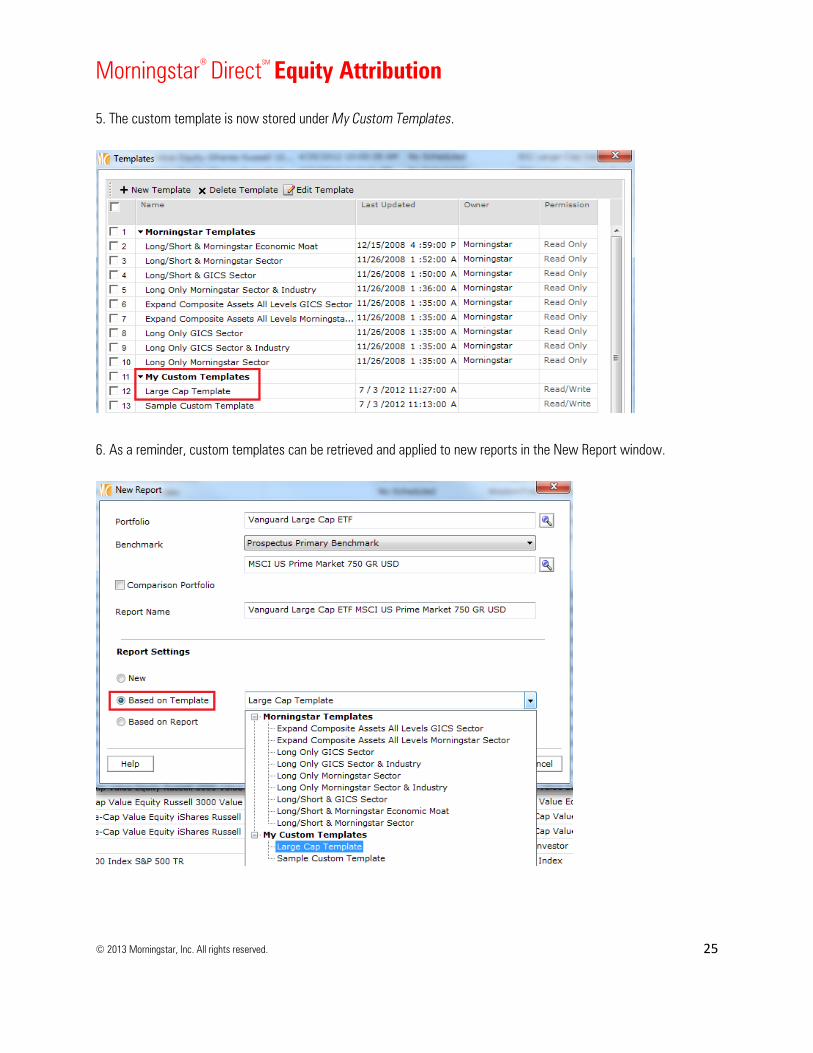
5. The custom template is now stored under My Custom Templates.
6. As a reminder, custom templates can be retrieved and applied to new reports in the New Report window.
Morningstar® DirectSM Equity Attribution
© 2013 Morningstar, Inc. All rights reserved.
26
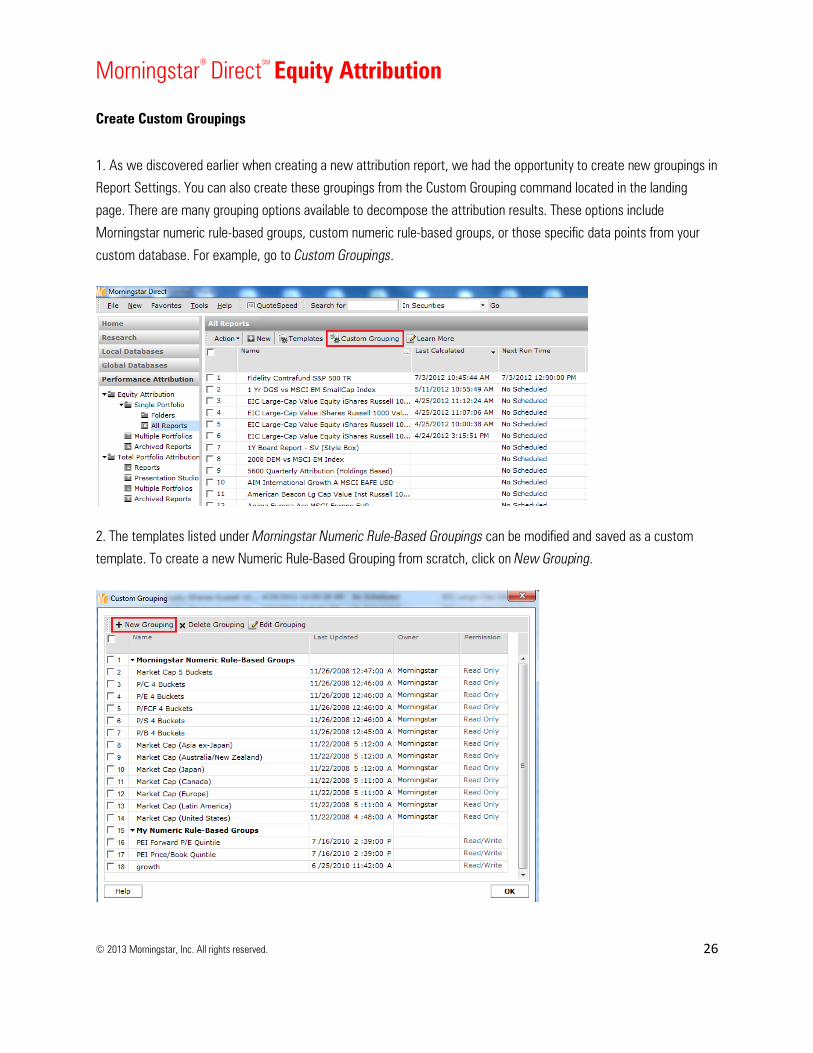
Create Custom Groupings 1. As we discovered earlier when creating a new attribution report, we had the opportunity to create new groupings in Report Settings. You can also create these groupings from the Custom Grouping command located in the landing page. There are many grouping options available to decompose the attribution results. These options include Morningstar numeric rule-based groups, custom numeric rule-based groups, or those specific data points from your custom database. For example, go to Custom Groupings.
2. The templates listed under Morningstar Numeric Rule-Based Groupings can be modified and saved as a custom template. To create a new Numeric Rule-Based Grouping from scratch, click on New Grouping.
Morningstar® DirectSM Equity Attribution
© 2013 Morningstar, Inc. All rights reserved.
27
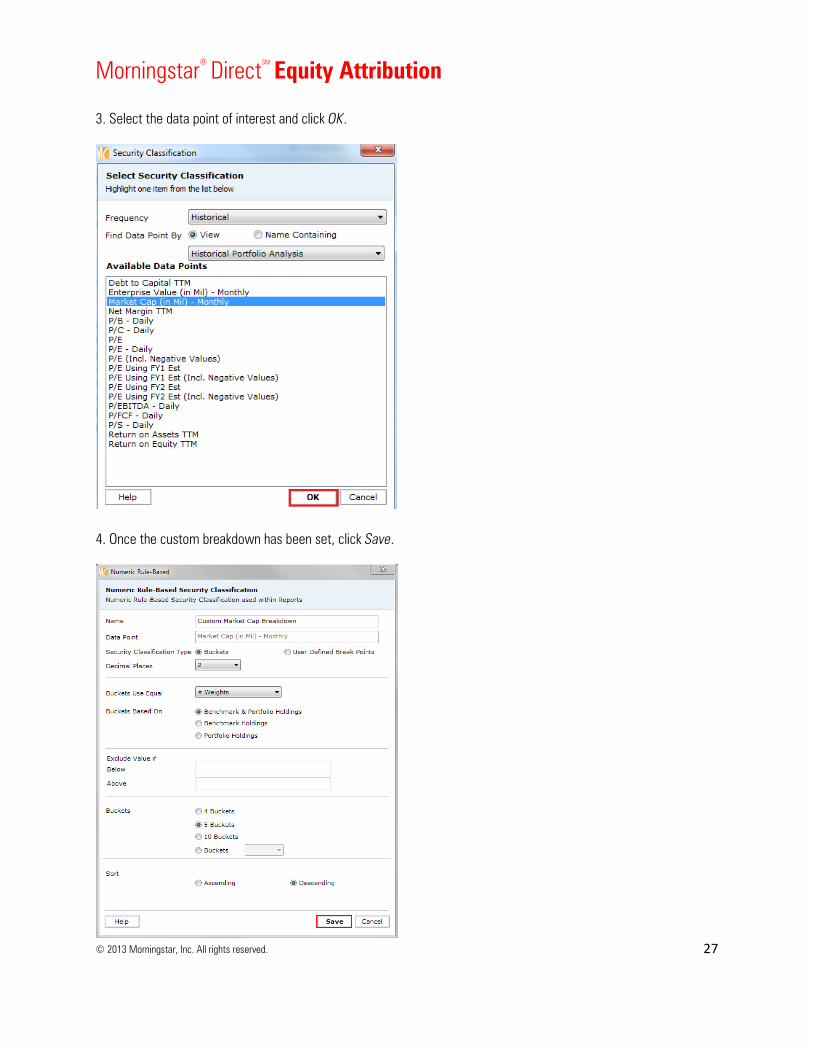
3. Select the data point of interest and click OK.
4. Once the custom breakdown has been set, click Save.
Morningstar® DirectSM Equity Attribution
© 2013 Morningstar, Inc. All rights reserved.
28
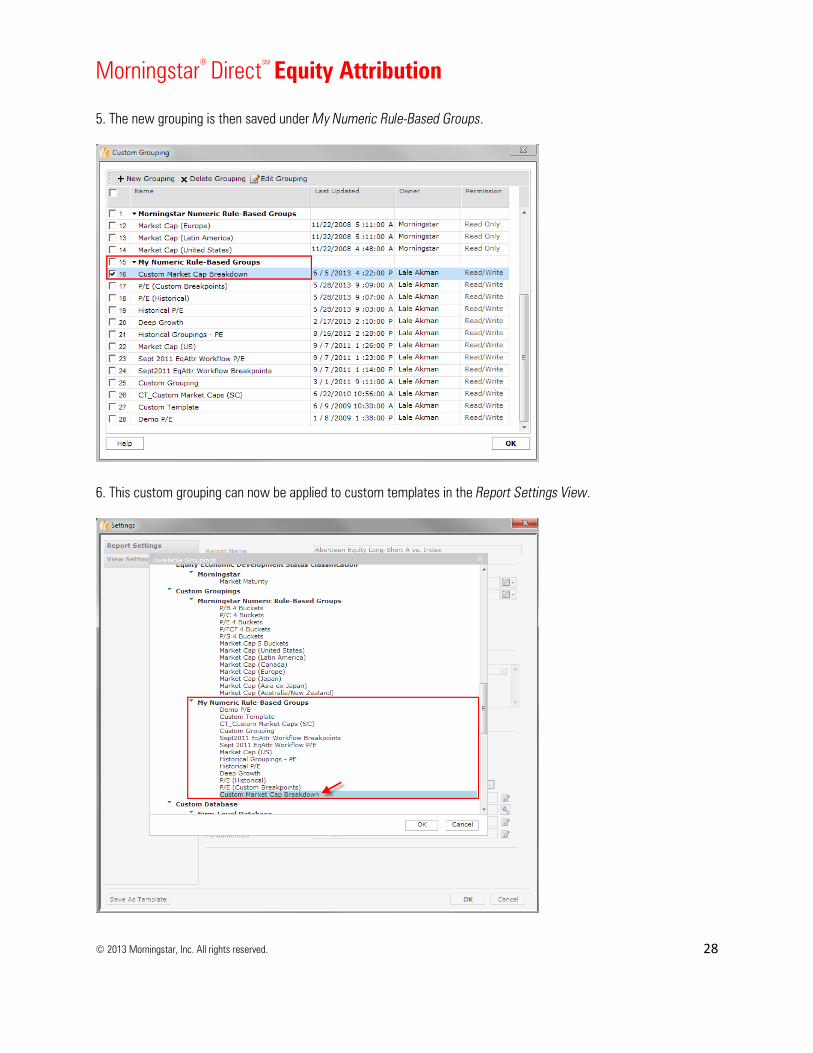
5. The new grouping is then saved under My Numeric Rule-Based Groups.
6. This custom grouping can now be applied to custom templates in the Report Settings View.

Morningstar® DirectSM Equity Attribution
© 2013 Morningstar, Inc. All rights reserved.
29
Create Multiple Portfolio Equity Attribution 1. Earlier, we discovered how to create single Equity Attribution reports. In this section, we will discover the ability to create multiple equity attribution reports where you can integrate Performance Reporting components, active share along with additional data points, and the many right click options such as formatting, filtering, highlighting, detailed attribution, and more. Let's begin. Go to Multiple Portfolios.
2. Click New.

Morningstar® DirectSM Equity Attribution
© 2013 Morningstar, Inc. All rights reserved.
30
3. You will be taken to the Select Multiple Portfolio window. Select your investments from the various Universes.
4. You can also locate your investments from existing files from My List. Click OK, once your selection is complete.

Morningstar® DirectSM Equity Attribution
© 2013 Morningstar, Inc. All rights reserved.
31
5. You will then be taken to the Group Settings window which is very similar to the Group Settings feature in performance reporting. Go to Available Grouping.
6. Change the Morningstar Category default to Morningstar Institutional Category to group your list of investments by Morningstar Institutional Category.
Morningstar® DirectSM Equity Attribution
© 2013 Morningstar, Inc. All rights reserved.
32
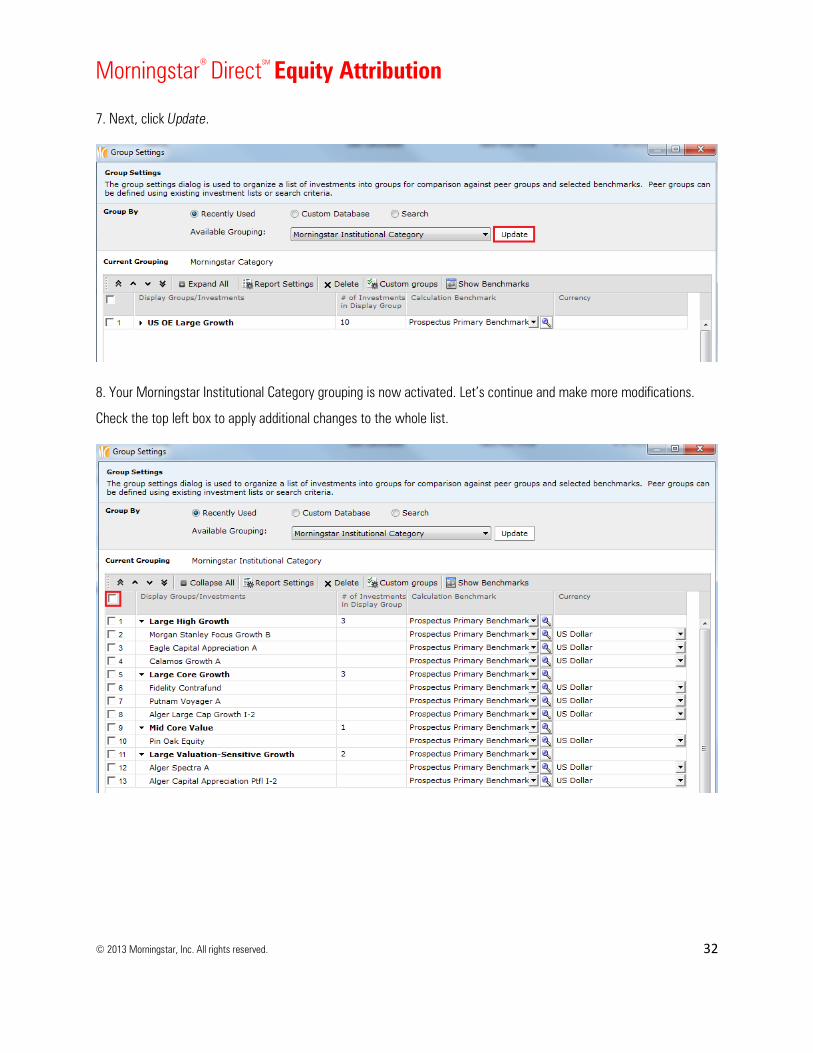
7. Next, click Update.
8. Your Morningstar Institutional Category grouping is now activated. Let’s continue and make more modifications. Check the top left box to apply additional changes to the whole list.
Morningstar® DirectSM Equity Attribution
© 2013 Morningstar, Inc. All rights reserved.
33
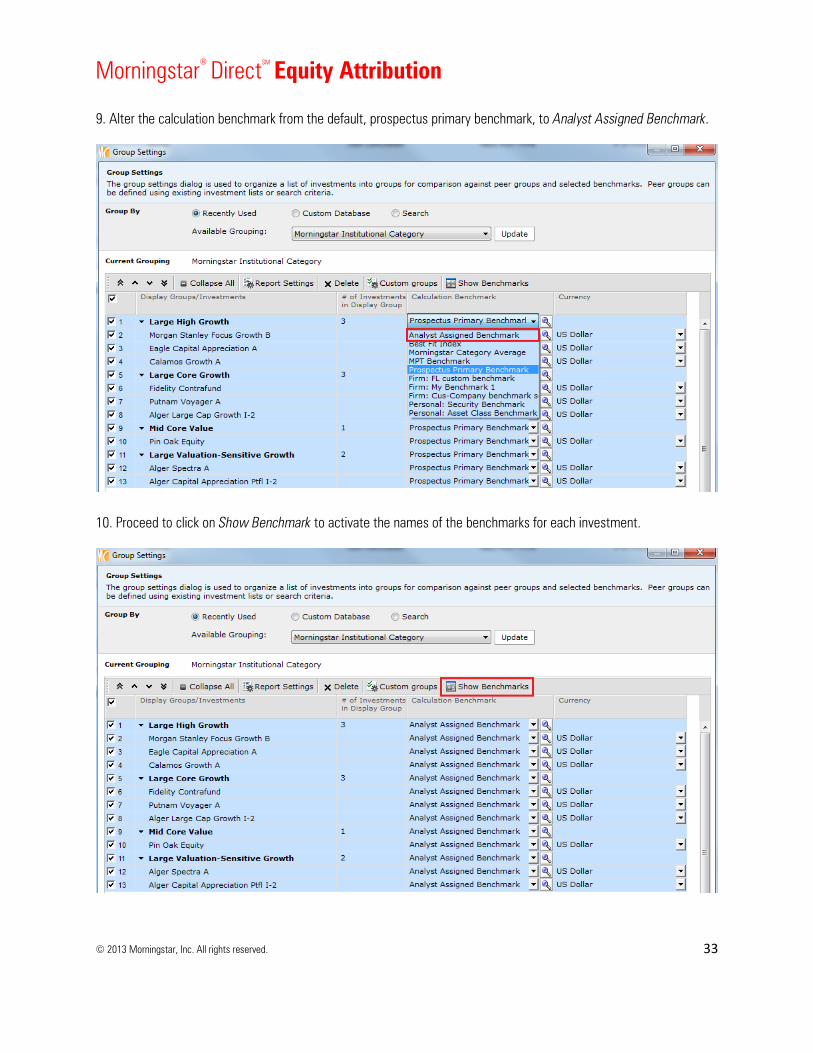
9. Alter the calculation benchmark from the default, prospectus primary benchmark, to Analyst Assigned Benchmark.
10. Proceed to click on Show Benchmark to activate the names of the benchmarks for each investment.
Morningstar® DirectSM Equity Attribution
© 2013 Morningstar, Inc. All rights reserved.
34
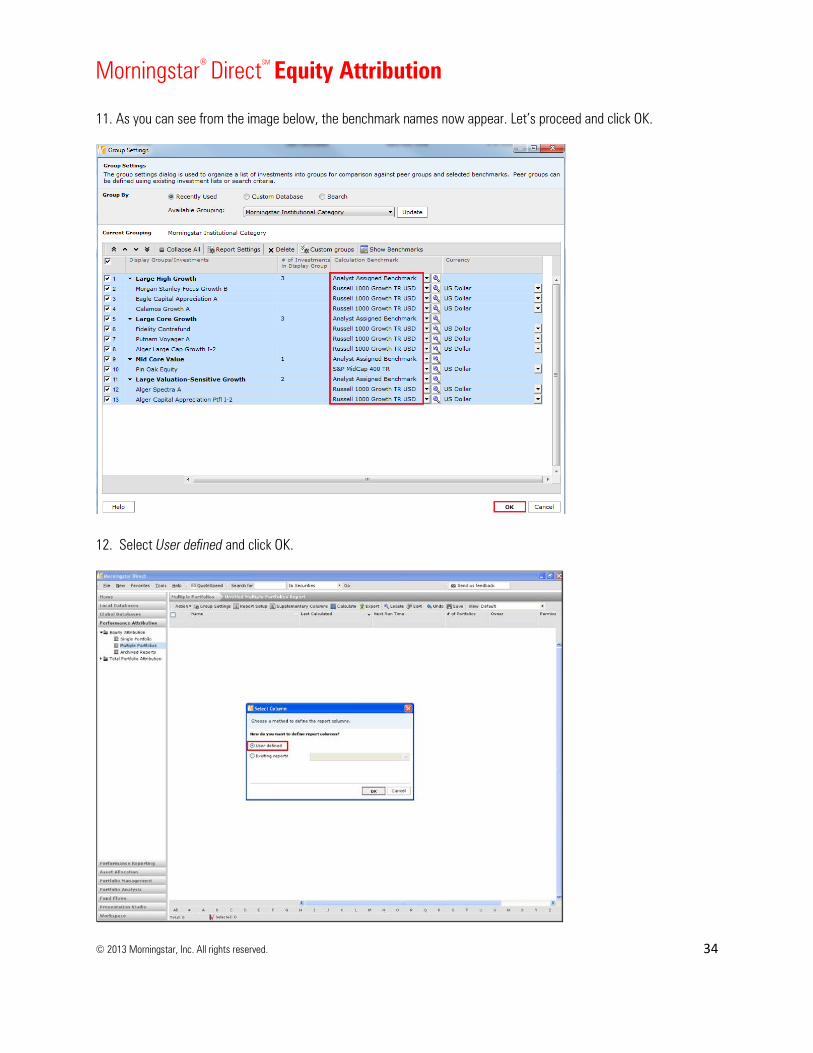
11. As you can see from the image below, the benchmark names now appear. Let’s proceed and click OK.
12. Select User defined and click OK.
Morningstar® DirectSM Equity Attribution
© 2013 Morningstar, Inc. All rights reserved.
35
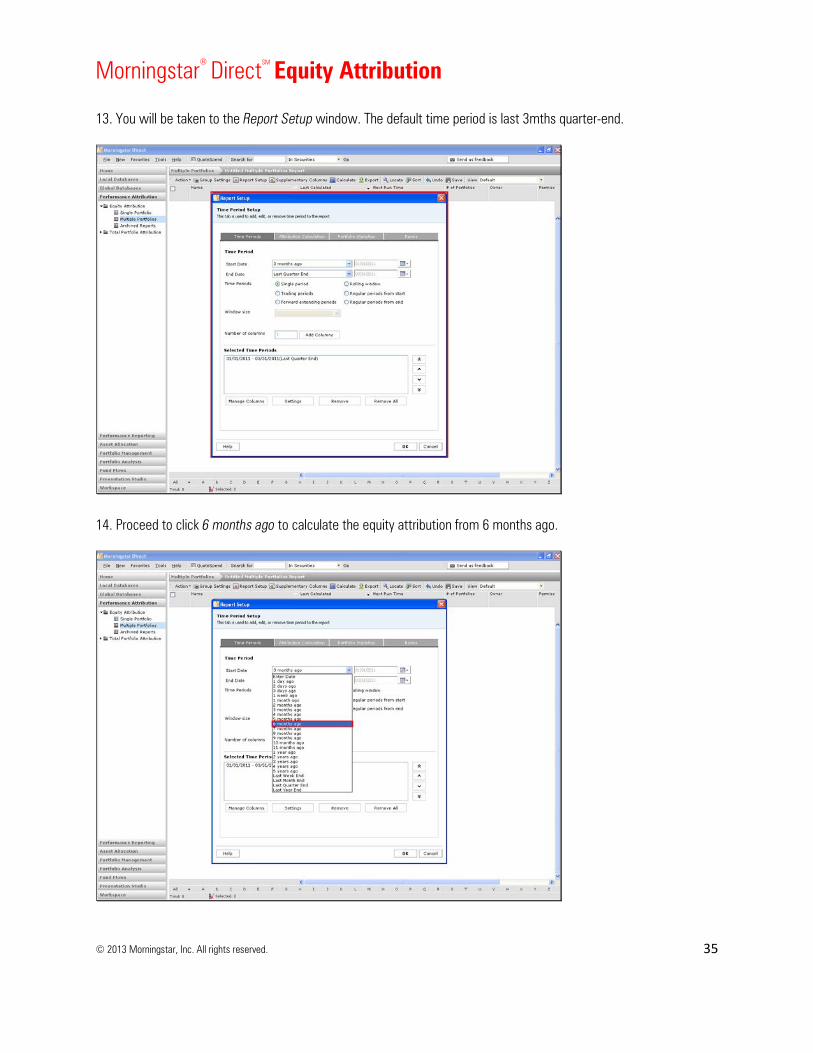
13. You will be taken to the Report Setup window. The default time period is last 3mths quarter-end.
14. Proceed to click 6 months ago to calculate the equity attribution from 6 months ago.

Morningstar® DirectSM Equity Attribution
© 2013 Morningstar, Inc. All rights reserved.
36
15. Let’s also add the “1 year ago” time period. You now have three time periods.
16. At any point, you can change the display name. For example, double-click the 3 months ago time period.
Morningstar® DirectSM Equity Attribution
© 2013 Morningstar, Inc. All rights reserved.
37
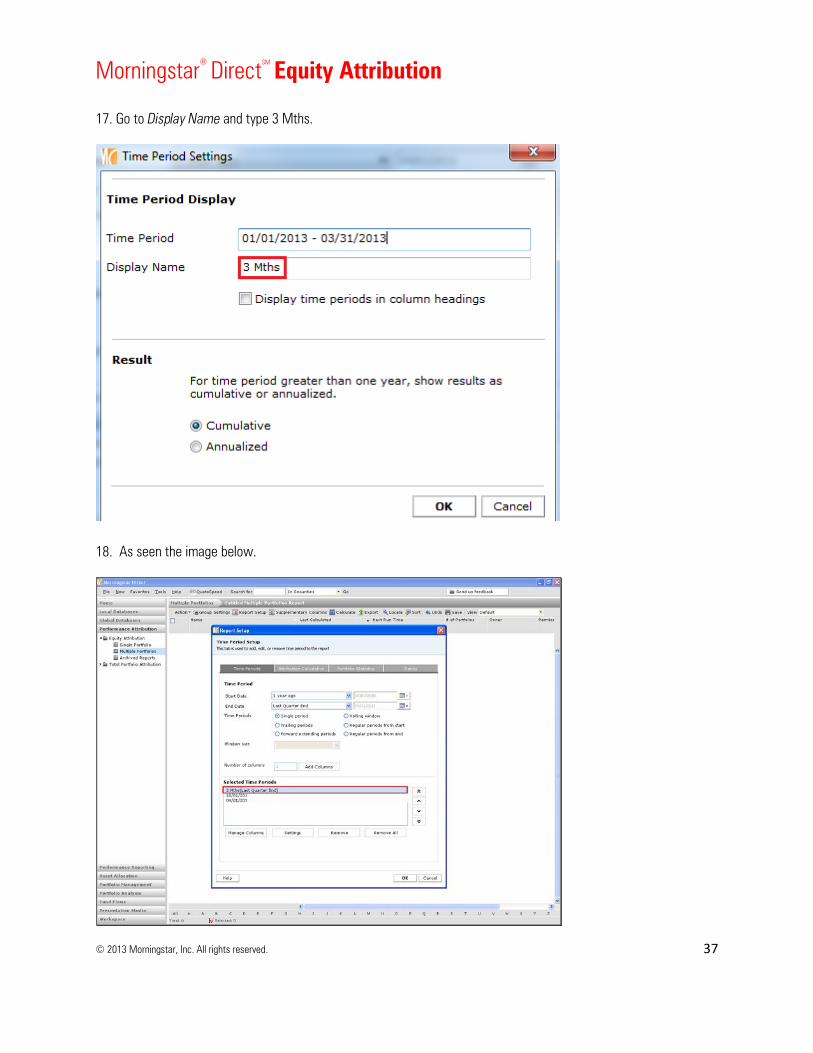
17. Go to Display Name and type 3 Mths.
18. As seen the image below.
Morningstar® DirectSM Equity Attribution
© 2013 Morningstar, Inc. All rights reserved.
38
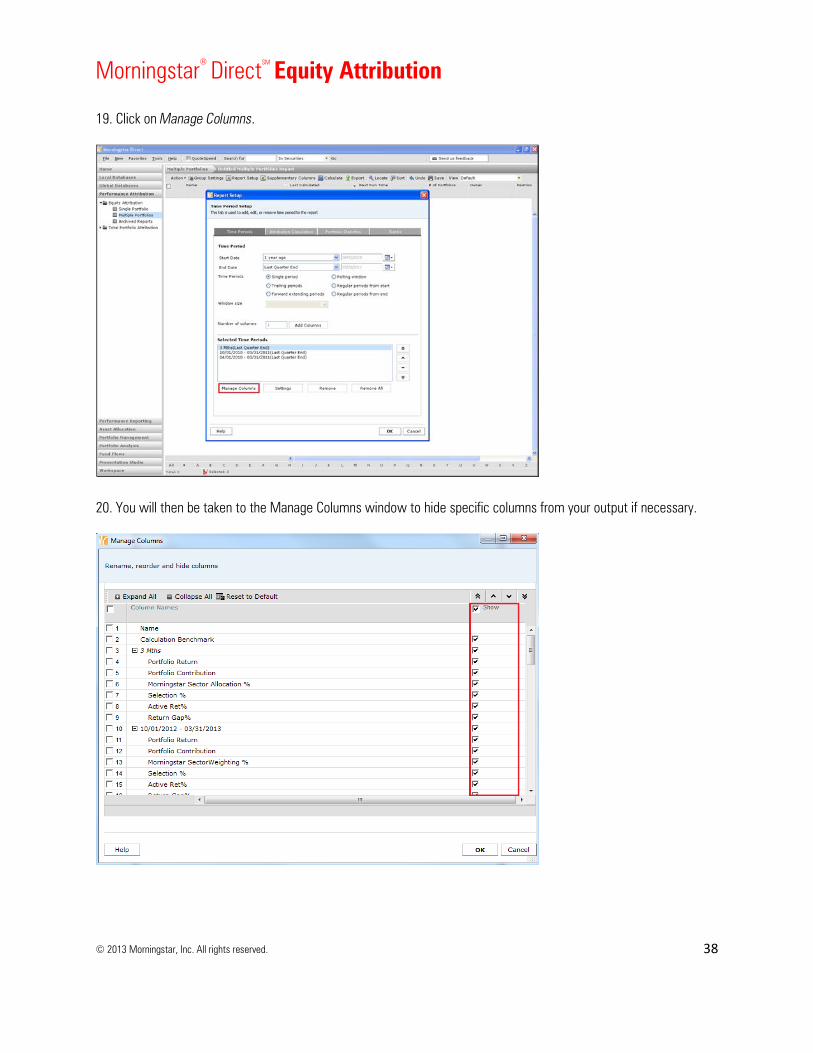
19. Click on Manage Columns.
20. You will then be taken to the Manage Columns window to hide specific columns from your output if necessary.
Morningstar® DirectSM Equity Attribution
© 2013 Morningstar, Inc. All rights reserved.
39
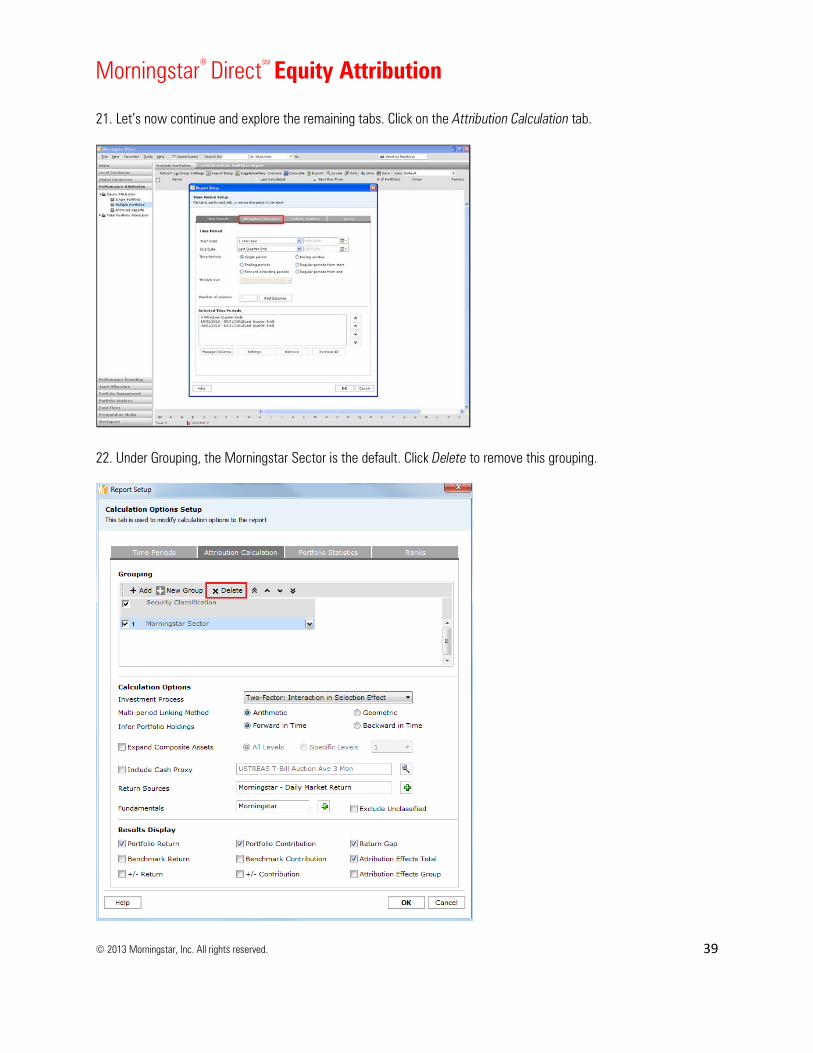
21. Let’s now continue and explore the remaining tabs. Click on the Attribution Calculation tab.
22. Under Grouping, the Morningstar Sector is the default. Click Delete to remove this grouping.
Morningstar® DirectSM Equity Attribution
© 2013 Morningstar, Inc. All rights reserved.
40
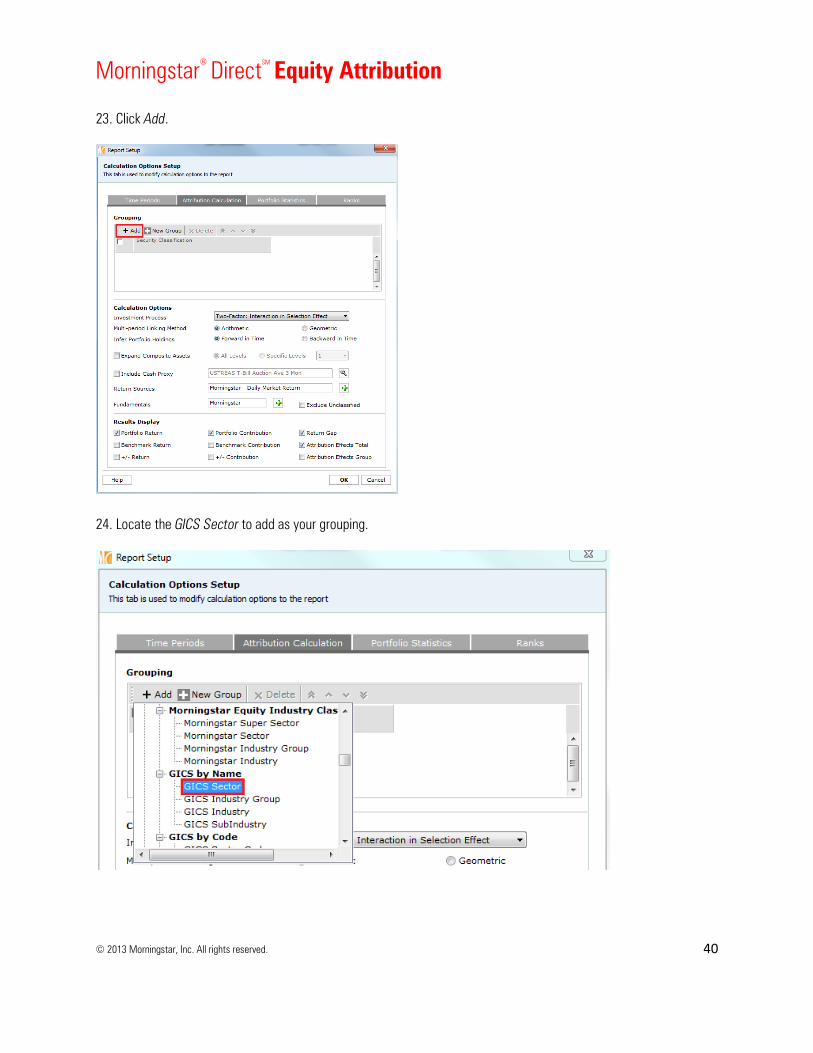
23. Click Add.
24. Locate the GICS Sector to add as your grouping.
Morningstar® DirectSM Equity Attribution
© 2013 Morningstar, Inc. All rights reserved.
41
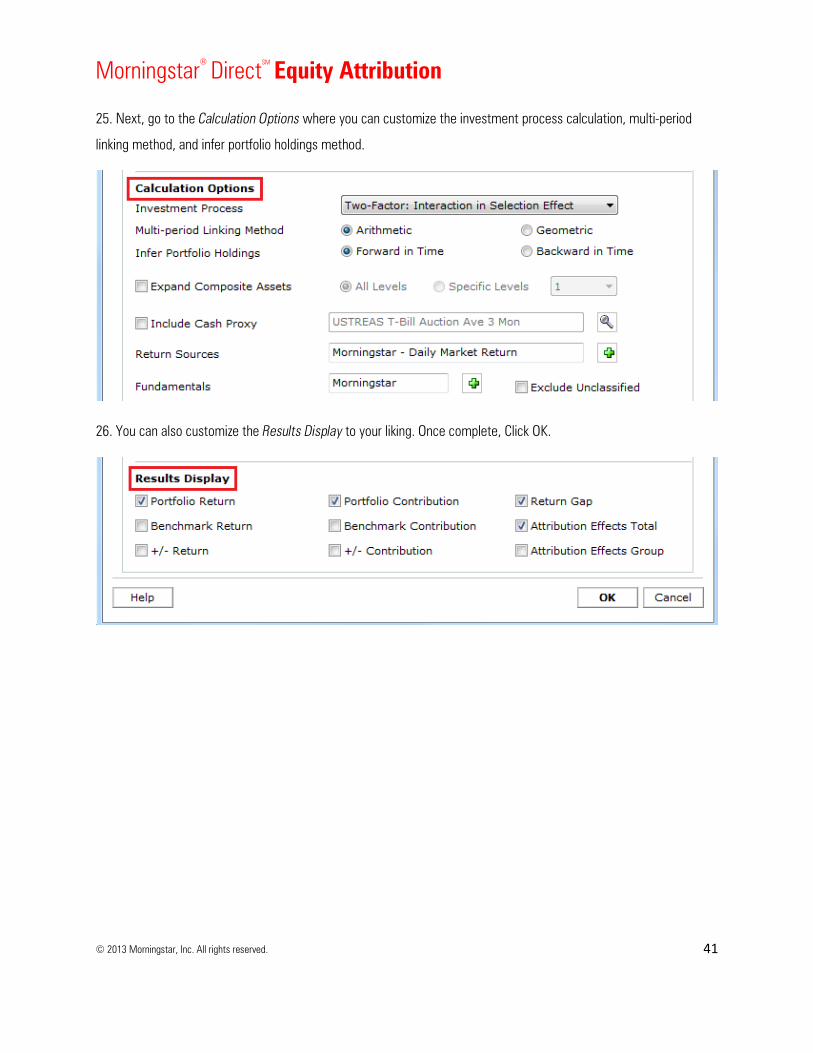
25. Next, go to the Calculation Options where you can customize the investment process calculation, multi-period linking method, and infer portfolio holdings method.
26. You can also customize the Results Display to your liking. Once complete, Click OK.
Morningstar® DirectSM Equity Attribution
© 2013 Morningstar, Inc. All rights reserved.
42
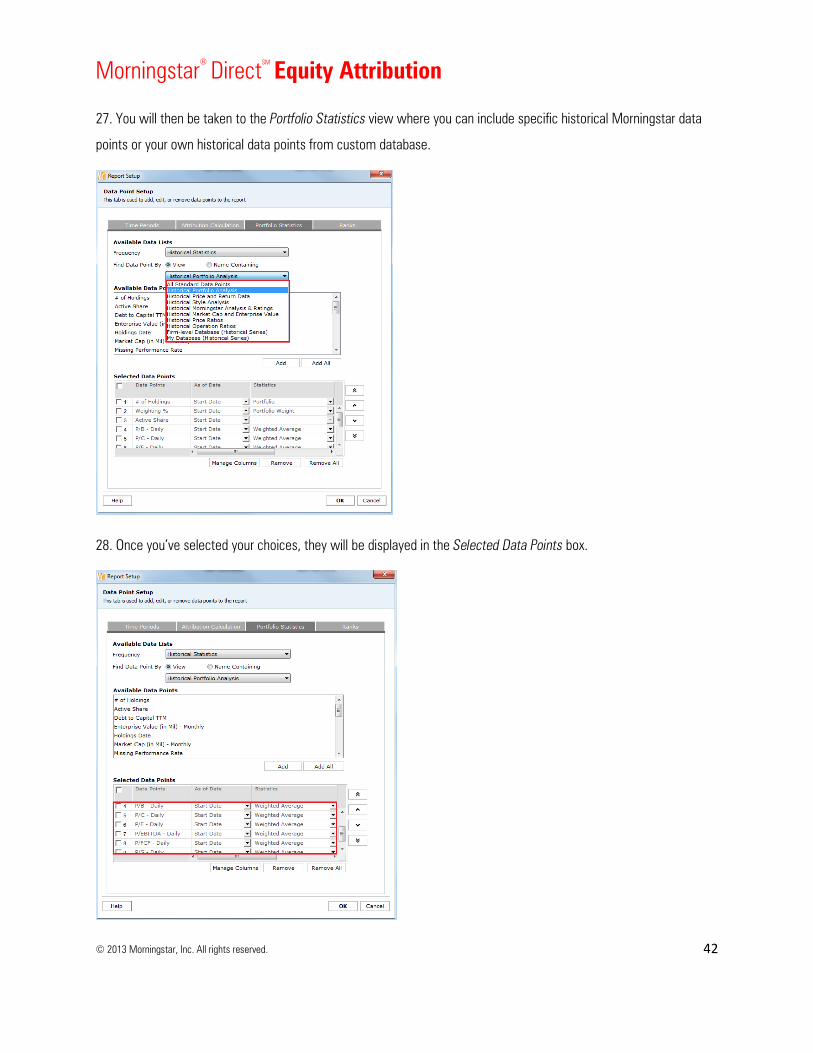
27. You will then be taken to the Portfolio Statistics view where you can include specific historical Morningstar data points or your own historical data points from custom database.
28. Once you’ve selected your choices, they will be displayed in the Selected Data Points box.

Morningstar® DirectSM Equity Attribution
© 2013 Morningstar, Inc. All rights reserved.
43
29. Notice that you can add the Active Share data point to compare the holdings of the portfolio to the benchmark.
30. Next, go to the As of Date column to select a specific “as of date.”
Morningstar® DirectSM Equity Attribution
© 2013 Morningstar, Inc. All rights reserved.
44
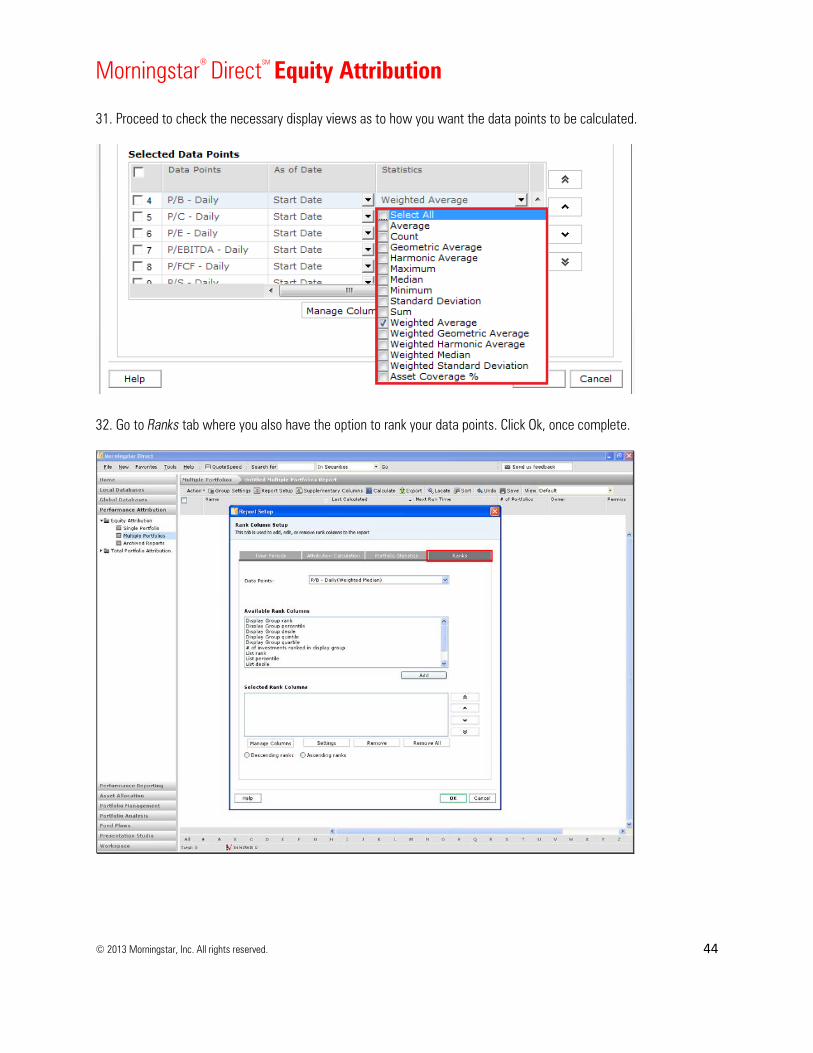
31. Proceed to check the necessary display views as to how you want the data points to be calculated.
32. Go to Ranks tab where you also have the option to rank your data points. Click Ok, once complete.
Morningstar® DirectSM Equity Attribution
© 2013 Morningstar, Inc. All rights reserved.
45
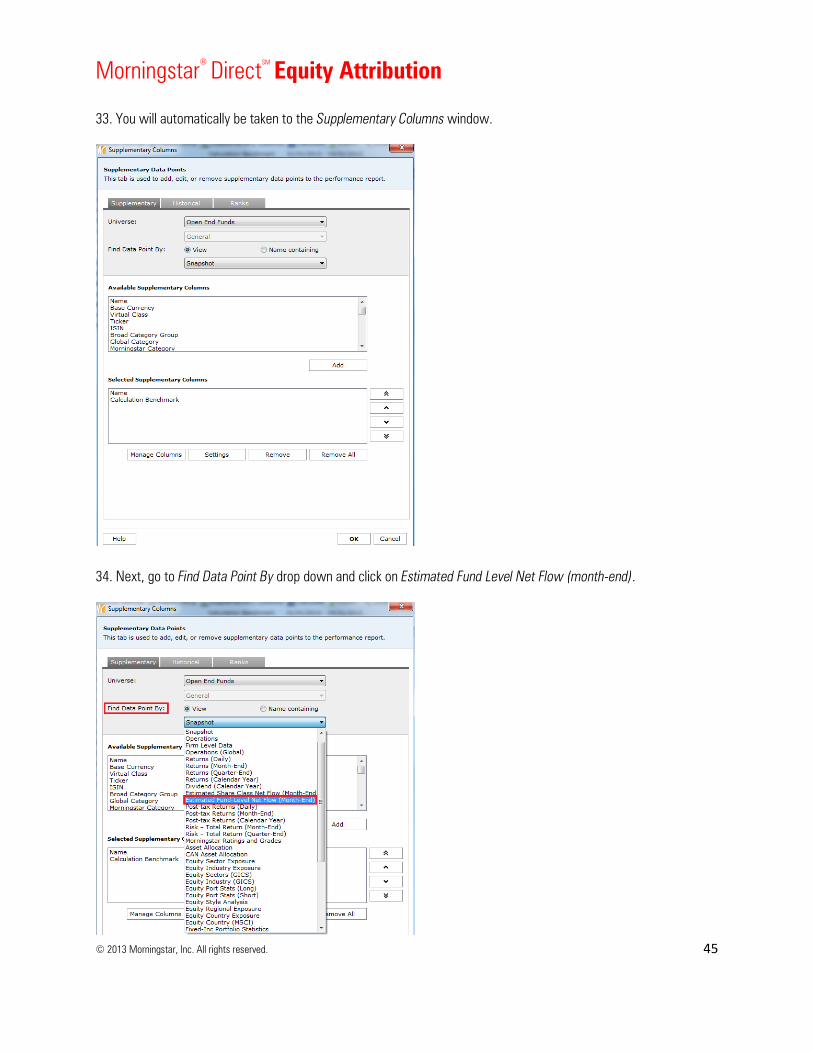
33. You will automatically be taken to the Supplementary Columns window.
34. Next, go to Find Data Point By drop down and click on Estimated Fund Level Net Flow (month-end).
Morningstar® DirectSM Equity Attribution
© 2013 Morningstar, Inc. All rights reserved.
46
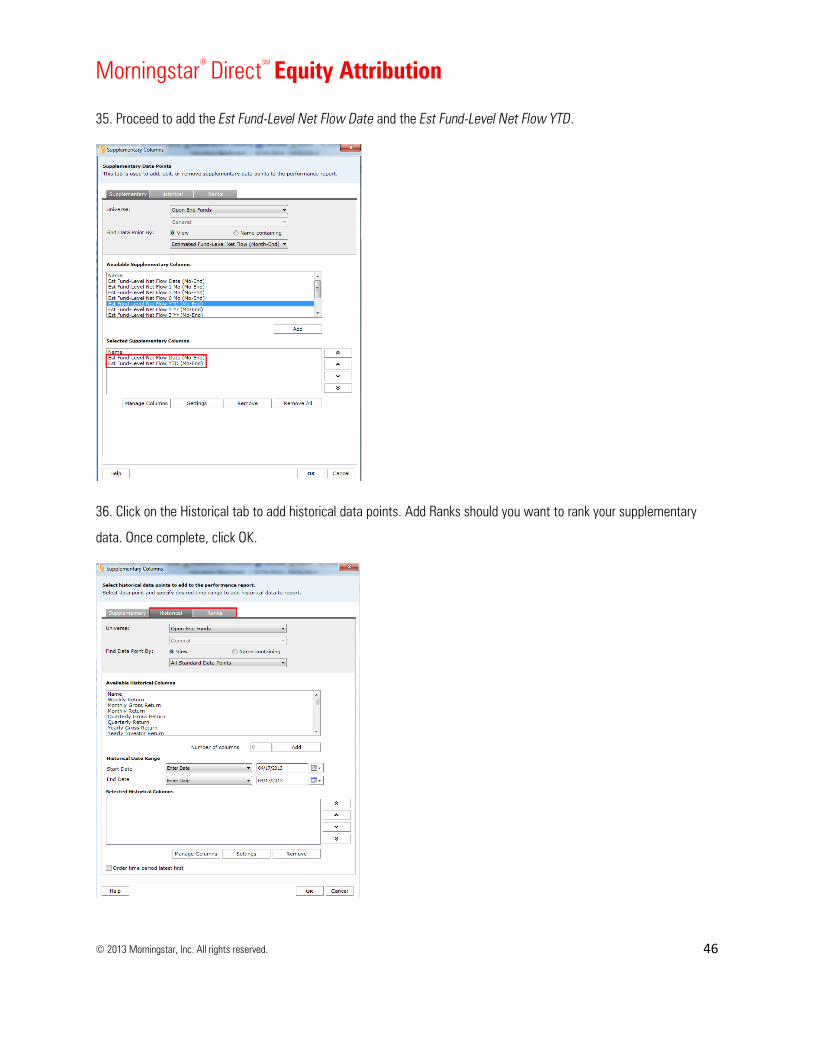
35. Proceed to add the Est Fund-Level Net Flow Date and the Est Fund-Level Net Flow YTD.
36. Click on the Historical tab to add historical data points. Add Ranks should you want to rank your supplementary data. Once complete, click OK.
Morningstar® DirectSM Equity Attribution
© 2013 Morningstar, Inc. All rights reserved.
47
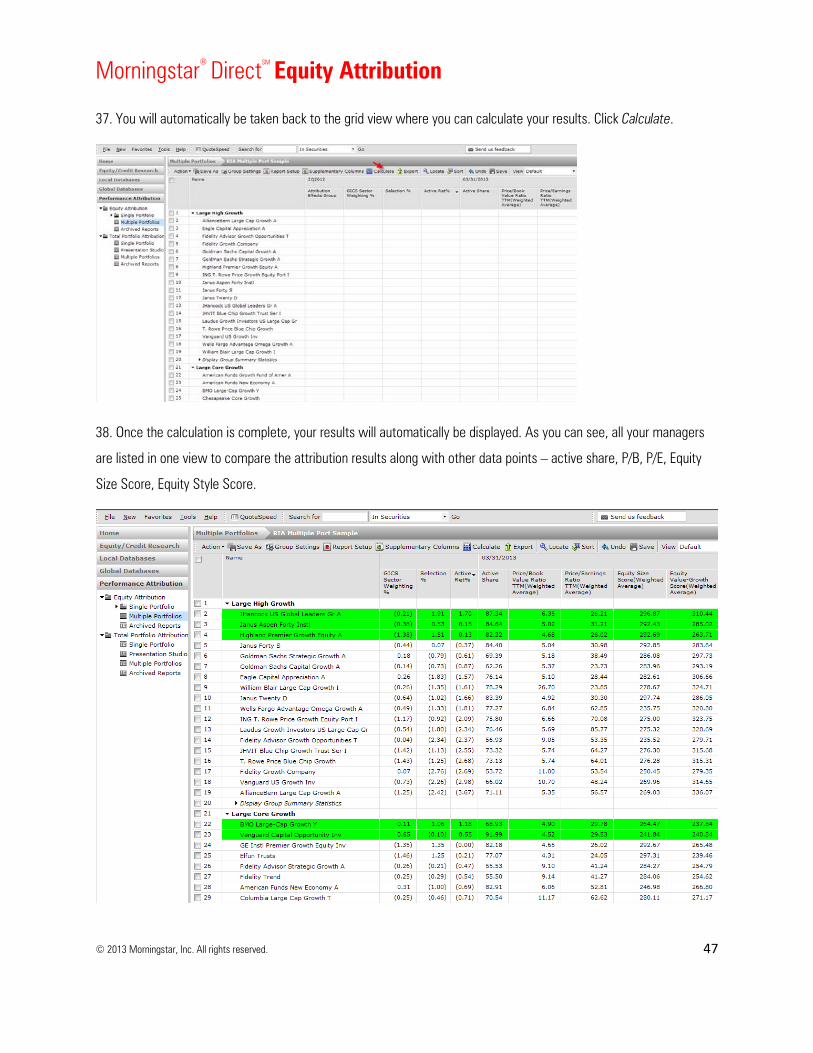
37. You will automatically be taken back to the grid view where you can calculate your results. Click Calculate.
38. Once the calculation is complete, your results will automatically be displayed. As you can see, all your managers are listed in one view to compare the attribution results along with other data points – active share, P/B, P/E, Equity Size Score, Equity Style Score.
Morningstar® DirectSM Equity Attribution
© 2013 Morningstar, Inc. All rights reserved.
48
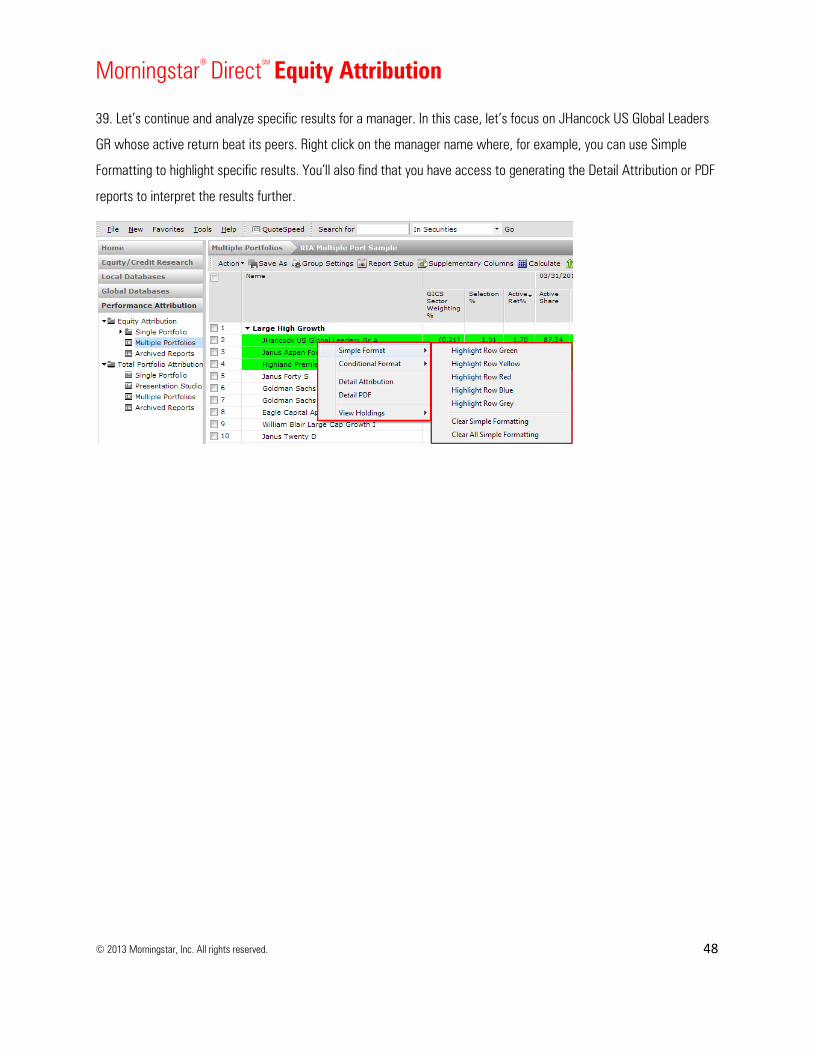
39. Let’s continue and analyze specific results for a manager. In this case, let’s focus on JHancock US Global Leaders GR whose active return beat its peers. Right click on the manager name where, for example, you can use Simple Formatting to highlight specific results. You’ll also find that you have access to generating the Detail Attribution or PDF reports to interpret the results further.