morphodynamics and sedimentary structures of · pdf filemorphodynamics and sedimentary...
TRANSCRIPT
1
Running head: Dynamics and structures of supercritical-flow bedforms 1
2
Morphodynamics and sedimentary structures of 3
bedforms under supercritical-flow conditions: new 4
insights from flume experiments 5
6
MATTHIEU J.B. CARTIGNY*, DARIO VENTRA, GEORGE POSTMA 7
and JAN H. VAN DEN BERG 8
9
Faculty of Geosciences, Utrecht University, P.O. box 80021, 10
3508TA Utrecht, The Netherlands 11
* Corresponding author current address: National Oceanography Centre, European Way, 12 Southampton, Hampshire, UK SO14 3ZH (E-mail: [email protected]) 13
14
15
16
17
18
19
20 21 22 Keywords Supercritical flow, cyclic steps, antidunes, hydraulic jump, chutes-and-pools, 23
flume experiments 24
25 26
2
ABSTRACT 27
Supercritical flow phenomena are fairly common in modern sedimentary environments, yet their 28
recognition and analysis remain difficult in the stratigraphic record. This fact is commonly 29
ascribed to the poor preservation potential of deposits from high-energy supercritical flows. 30
However, the number of flume datasets on supercritical flow dynamics and sedimentary 31
structures is very limited in comparison with available data for subcritical flows, which hampers 32
the recognition and interpretation of such deposits. The results of systematic flume experiments 33
spanning the full range of supercritical flow bedforms (antidunes, chutes-and-pools, cyclic steps) 34
developed in mobile sand beds of variable grain sizes are presented. Flow character and 35
related bedform patterns are constrained through time-series measurements of bed 36
configurations, flow depths, flow velocities and Froude numbers. The results allow the 37
refinement and extension of some widely used bedform stability diagrams in the supercritical-38
flow domain, clarifying in particular the morphodynamic relations between antidunes and cyclic 39
steps. The onset of antidunes is controlled by flows exceeding passing a threshold Froude 40
number. The transition from antidunes to cyclic steps in fine- to medium-grained sand occurs at 41
a threshold mobility parameter. Sedimentary structures associated with supercritical bedforms 42
developed under variable aggradation rates are revealed by means of combining flume results 43
and synthetic stratigraphy. The sedimentary structures are compared with examples from field 44
and other flume studies. Aggradation rate is seen to exert an important control on the geometry 45
of supercritical flow structures and should be considered when identifying supercritical bedforms 46
in the sedimentary record. 47
(A) INTRODUCTION 48
Primary sedimentary structures reflect the complex interactions between sediment load and 49
carrying flows, as widely demonstrated by research in fluid mechanics, sedimentary geology 50
and engineering in natural, experimental and numerical settings (Kennedy, 1963; Leeder, 1983; 51
3
Allen, 1985; Best, 1993, 1996). Bedforms and sedimentary structures formed in unidirectional 52
subcritical, oscillatory and combined flows are fairly well understood after a long history of 53
experimental research, and owing to their ubiquitous presence and recognition in present-day 54
sedimentary environments and in the rock record. However, significant gaps remain in our 55
knowledge of the origin and dynamics of bedforms produced by unidirectional supercritical flows 56
(see reviews by Yagishita, 1992, and Fielding, 2006). Flume experiments and numerical 57
modelling have shown consistent bedform patterns arising from supercritical flows over sandy 58
beds. Numerous observations from modern environments show that such phenomena are 59
common (e.g. McKee et al., 1967; Waters & Fisher, 1971; Augustinus, 1980; Wells & 60
Dohrenwend, 1985; Barwis & Hayes, 1985; Blair, 1987; Langford & Bracken, 1987; Alexander & 61
Fielding, 1997; Carling & Breakspear, 2007; Duller et al., 2008). 62
The sedimentary record, therefore, should preserve many examples of structures and 63
facies formed by such flows, but their recognition and analysis remain sparse in the literature. 64
This is ascribed to the supposedly poor preservation potential of deposits from ephemeral, high-65
energy events. However, because documented flume datasets on the sedimentology of 66
supercritical flows over sand beds are limited in number (Middleton, 1965; Simons & 67
Richardson, 1966; Jopling & Richardson, 1966; Hand, 1974; Cheel, 1990; Best & Bridge, 1992; 68
Alexander et al., 2001; Yokokawa et al., 2010), the inability to identify and interpret the resulting 69
deposits might actually be due to insufficient understanding of these structures and facies 70
(Fielding, 2006). 71
This paper aims to: 1) describe the results of systematic flume experiments in the 72
Eurotank Flume Laboratory (Utrecht University), exploring changes in flow character and related 73
bedform patterns with increasing flow energy over mobile sand beds of different grain sizes; 2) 74
expand the classical bedform stability diagrams in order to include a wider range of 75
supercritical-flow bedforms; 3) study grain-size effects on the formation of supercritical 76
bedforms; 4) interpret morphodynamic relations between different types of supercritical-flow 77

4
bedforms; and 5) describe and analyse the sedimentary structures, comparing them with 78
previous flume experiments and outcrop studies. Since bedforms developing from supercritical 79
flow have received relatively little attention from sedimentologists, the following section provides 80
a concise introductory review of terminology, supercritical flow processes (e.g. types of 81
hydraulic jumps, surges, roll waves) and their interactive relation with bedforms as a function of 82
Froude or Vedernikov numbers. 83
84
(A) SUPERCRITICAL FLOWS AND THEIR BEDFORMS: GENERAL 85
OVERVIEW 86
In supercritical flows, inertia dominates over gravity; this is expressed by the Froude number (87
ghUFr = ) exceeding unity, where U is the flow velocity, h is the flow depth and g is the 88
acceleration of gravity. Such flows can be further characterised (Fig. 1) by: 1) a Reynolds 89
number (νUhe =R , where ν is kinematic viscosity), distinguishing between turbulent and 90
laminar flows (Robertson & Rouse, 1941) and 2) the Vedernikov number, which distinguishes 91
stable uniform flows from unstable non-uniform ones (Ven Te Chow, 1959; Koloseus & 92
Davidian, 1966). The Vedernikov number for wide channels is defined as Ve = xFr (Ven Te 93
Chow, 1959), where the coefficient x describes the dependency of flow velocity on flow depth as 94
used in the uniform flow formula (Chézy, x = 1/2 or Manning, x = 2/3). This statement implies a 95
transition from stable to unstable flow at Fr = 1.5-2. In stable, uniform flows (Ve < 1), free-96
surface waves (waves on the upper interface of the flow) will be suppressed, while in unstable 97
uniform flows (Ve > 1) free-surface waves are amplified, leading to breaking waves that develop 98
into roll waves (periodic surges) at higher Froude numbers (Cornish, 1910; Koloseus & 99
Davidian, 1966; Brock, 1969; Karcz & Kersey,1980). Stable versus unstable flow behaviour has 100

5
been well studied for laminar conditions (Karcz & Kersey,1980; DeVauchelle et al., 2010) and 101
for flows over non-erodible beds (Brock, 1969). 102
A similar transition between stable and unstable flow has been found for turbulent 103
supercritical flow over mobile beds, where the onset of unstable flow triggers the formation of 104
free-surface waves and antidunes, while periodic fluctuating flows at higher Froude numbers are 105
accompanied by chutes-and-pools and cyclic steps (Guy et al., 1966; Alexander et al., 2001; 106
Spinewine et al., 2009). The influence of an erodible bed on the transition between stable flows 107
and unstable supercritical turbulent flows is still poorly constrained; in particular the 108
morphodynamic relations between supercritical flows and bedforms typical for these flows are 109
poorly understood. 110
(B) Characteristics of supercritical flow 111
Free surfaces of turbulent supercritical flows are characterized by waves, hydraulic jumps and 112
surges (Brock, 1969; Alexander et al., 2001, Taki & Parker, 2005). Waves at the free surface of 113
supercritical flows are triggered by internal flow instabilities (Jeffreys, 1925; Vedernikov, 1945, 114
1946). If wavelengths considerably exceed the flow depth, the velocity of wave propagation 115
relative to flow velocity is given by gh (e.g. Lighthill, 1978). The ratio of flow velocity to wave 116
propagation velocity (expressed by the Froude number) determines whether waves can migrate 117
upstream. This fact implies that if a flow is supercritical in its upstream portion and subcritical 118
downstream, waves in the subcritical portion of the flow can travel upstream until they reach the 119
point where flow velocity equals the velocity of wave propagation (Fr = 1). At this point, a 120
physical transition between supercritical and subcritical flow forms a hydraulic jump, 121
characterized by an abrupt increase in flow depth and a decrease in flow velocity, accompanied 122
by substantial energy loss. If fluid and/or sediment entrainment over the jump is neglected, then 123
the strength of hydraulic jumps is defined by the ratio of the outgoing subcritical-flow depth 124
behind the jump and incoming supercritical-flow depth in front of the jump (conjugated depths), 125

6
and can be related to the energy loss (ΔH) over the hydraulic jump by solving a mass and 126
momentum balance over the incoming and outgoing flows (Bélanger,1828; Fig. 2A). 127
Experiments have shown that the geometric configuration of hydraulic jumps varies with 128
their strength (Bradley & Peterka, 1955; Ven Te Chow, 1959; Lennon & Hill, 2006). Undular 129
jumps (Fig. 2B) form at conjugated depth ratios close to unity (Fig. 2A), corresponding to minor 130
energy losses, and are typical for incoming Froude numbers between 1 and 1.7 (although there 131
is variability within these values, depending on channel geometry and bed roughness; Montes, 132
1986). As the incoming Froude number increases, the leading wave of the undular jump starts 133
to break and re-circulating cells (rollers) form at the free-surface (Fig. 2C; weak jump). 134
Turbulence and internal friction within rollers are responsible for most of the energy dissipation 135
at the hydraulic jump. At incoming Froude numbers between 2 and 4, hydraulic jumps become 136
very unstable (Fig. 2D); the incoming flow (jet) tends to detach from the bed (MacDonald et al., 137
2009) and allows the formation of re-circulation cells between bed and main flow, strongly 138
reducing local shear stress at the bed in oscillating jumps. Further increases in the Froude 139
number of the incoming supercritical flow stabilize the jump morphology (Fig. 2E-F) and trigger 140
even greater turbulence, vorticity and energy dissipation (Long et al., 1991). Hydraulic jumps 141
occurring at slope breaks (α; see Fig. 2G) have been classified according to their position 142
relative to the slope break (Fig.2G-I; Rajaratnam, 1967; Hager, 1992). 143
Where there is an imbalance between upstream and downstream forces, hydraulic 144
jumps tend to migrate, and are referred to as surges. Surges are said to be positive if the wave 145
front advances, and negative if it retreats (irrespective of the general flow direction; cf. Chanson, 146
2004). Periodic positive surges propagating in the flow direction over fixed or poorly mobile beds 147
under unstable supercritical flows are called roll waves or Cornish waves (Cornish, 1910; Brock, 148
1969). The experiments reported here were carried out over mobile sand beds, which led 149
supercritical bedforms to suppress the formation of roll waves (Balmforth & Vakil, 2012). 150
(B) Supercritical-flow bedforms 151

7
Supercritical flows over mobile sediment beds lead to a great variety of bed morphologies 152
(Gilbert, 1914; Simons et al., 1965; Allen, 1982), depending on flow conditions and sediment 153
grain size (Guy et al., 1966). Bedforms in unidirectional flow are traditionally divided into upper 154
flow-regime and lower flow-regime (Simons et al., 1965), depending on Froude number, flow 155
viscosity and grain mobility (Van den Berg & Van Gelder, 1998; Van den Berg & Nio, 2010). 156
Upper-flow-regime bedforms are commonly considered to be characterized by in-phase 157
relations between the free water surface and the bed interface (Simons et al., 1965; Middleton & 158
Southard, 1984), although recent research has shown that in-phase relations do not hold for all 159
kinds of supercritical-flow bedforms (Alexander et al., 2001; Yokokawa et al., 2009). An 160
alternative subdivision can be made between free-surface-dependent and free-surface-161
independent bedforms (Middleton & Southard, 1984). 162
Experiments in unidirectional open-channel flows have consistently shown the 163
development of characteristic bedform sequences with increasing flow energies: ripples, dunes, 164
upper-stage plane bed, antidunes, chutes-and-pools and cyclic steps (e.g. Gilbert, 1914; 165
Simons et al., 1965; Alexander et al., 2001; Taki & Parker, 2005). In the case of pipe flows, 166
which lack a free surface, experiments have shown that only part of this sequence forms, 167
spanning from ripples to upper-stage plane beds (Newitt, 1955; Fredsøe & Engelund, 1975; 168
Saunderson, 1982). Hence, ripples, dunes and upper-stage plane beds can form independently 169
of a free-surface, whereas antidunes, chutes-and-pools and cyclic steps are tied to the 170
presence of a free surface and to the associated development of waves, surges and hydraulic 171
jumps. Free-surface dependent bedforms fromed under superciritical flow include: antidunes, 172
chutes-and-pools and cyclic steps. 173
Antidunes are bedforms geometrically and dynamically in-phase with non-breaking 174
surface waves, and show variable rates of upstream or downstream migration depending on 175
flow energy and grain size (Gilbert, 1914; Kennedy, 1961; Simons et al., 1965; Middleton, 1965; 176
Hand, 1974; Langford & Bracken, 1987; Alexander & Fielding, 1996; Alexander et al., 2001; 177
8
Carling and Schvidchenko, 2002; Yokokawa et al., 2010). Experimental observations often 178
describe the development of ‘trains’ of antidunes (Kennedy, 1961; Simons et al., 1965; Guy et 179
al., 1966; Yokokawa et al., 2010) that tend to migrate downstream, independently of the 180
direction of migration of the individual bedforms; antidunes at the upstream end of the train are 181
scoured away by the incoming flow, while new antidunes form at the downstream end 182
(Kennedy, 1961). 183
At higher Froude numbers, in-phase relations between bed and free surfaces no longer 184
hold, as surface waves start to steepen and break. Bedforms associated to these breaking 185
surface waves have been termed breaking antidunes (Simons & Richardson, 1966) because of 186
the water surface wave that breaks over the antidune. Kennedy (1961) showed a positive 187
correlation between Froude number and wave breaking, and also observed a threshold value in 188
the ratio of wave height over wave length (0.14) required to trigger the breaking of surface 189
waves. The combination of these observations suggests a positive correlation between wave 190
amplitude and Froude number. This wave breaking leads to cyclic destruction and regeneration 191
of antidune bedforms (Gilbert, 1914; Kennedy, 1961; Middleton, 1965; Guy et al., 1966; 192
Langford & Bracken, 1987; Blair, 1987). The observed processes during wave breaking differ 193
widely, depending on the interaction between the dynamics of the surges and the bed 194
morphology: 1) breaking waves leading to positive surges forming new antidunes upstream of 195
the old ones (Middleton, 1965); 2) breaking waves forming new antidunes downstream of the 196
old ones (Guy et al., 1966); 3) breaking waves leading to stretches of flat bed separating 197
adjacent antidunes (Kennedy, 1961; Schumm et al.,1982); and/or 4) antidunes disappearing 198
without wave breaking (Kennedy, 1961). 199
Chutes-and-pools consist of reaches where the flow rapidly accelerated (chutes), 200
ending in a hydraulic jump followed by a long pool where the flow is tranquil, but accelerating 201
(Simons et al., 1965). Chutes-and-pools have been observed to migrate upstream (Simons et 202
al., 1965; Guy et al., 1966) with velocities close to or higher than those of accompanying 203
9
antidunes (Middleton, 1965). Chutes have also been shown to be followed downstream by 204
antidunes associated with breaking surface waves (Middleton, 1965; Guy et al., 1965) or large 205
standing waves (Guy et al., 1966) closely resembling those observed in the field observations of 206
Langford and Bracken (1986) and backwash ripples on beaches (Broome & Komar, 1979). 207
Hand (1974) described how breaking antidune waves form in a pool just downstream of a 208
hydraulic jump before a new set of antidunes form to replace the pool. Alexander et al. (2001) 209
observed chute-and-pool structures being separated by areas of relative plane bed. 210
Cyclic steps are very similar to chute-and-pool structures and have been described as 211
a series of slowly upstream-migrating steps, where each step is manifested as a zone of steeply 212
dropping supercritical flow bounded at the downstream end by a hydraulic jump (Parker, 1996). 213
Similar repeating step-like phenomena have also been described by Winterwerp et al., (1992) 214
as cascade of upstream migrating sand bars with nearly horizontal terraces covered by 215
subcritical flows. The distinction of cyclic steps with chutes-and-pools is not always clear, since 216
cyclic steps also involve an erosive lee side (chute) and a depositional stoss side (pool). 217
Following Fukuoka et al. (1982), Taki and Parker (2005) proposed to distinguish chute-and-pool 218
structures as a limiting case of cyclic steps for which the steepest bed slope realised just 219
upstream of the hydraulic jump is still rather mild. 220
Experiments have shown that all free-surface-dependent bedforms develop in a similar 221
manner at equal Froude numbers in density flows like turbidity currents (Hand, 1974; Spinewine 222
et al., 2009). In such setting, cyclic steps are morphologically associated with sediment waves 223
(Fildani et al., 2006; Lamb et al., 2008; Cartigny et al., 2011; Kostic, 2011). Coarse-grained 224
sediment waves in submarine canyons have also been interpreted as antidunes (Normark et al., 225
1980) or cyclic steps (Cartigny et al., 2011) formed by turbidity currents in a manner similar to 226
the experiments of Spinewine et al. (2009). 227
The morphodynamic relations between different types of supercritical-flow bedforms are 228
still poorly constrained, mainly because most experimental work so far has focused on single 229
10
bedform types or covered only part of the bedform spectrum (Fig. 1). The study presented here 230
considers a wide range of free-surface-dependent bedforms in fine to medium sand, from 231
antidunes to cyclic steps, with a focus on the morphodynamic relations between such bedforms 232
and their sedimentological signatures in turbulent flows. 233
(A) METHODS 234
Experiments were conducted at the Eurotank Flume Laboratory (Utrecht University) using a 235
flume (12 m long, 0.48 m wide, 0.6 m deep) in which water and sediment were both 236
recirculated. The flume was filled with about 1.5 m3 of sediment, resulting in a sedimentary bed 237
of ~0.2 m deep. Twenty-one runs (Table 1) of varying discharges were carried out on sand beds 238
of well-sorted fine to medium sands (D50= 160 μm , D50= 265 μm, D50= 350 μm). Flow was 239
recirculated for several hours at the start of each run, to establish a low time-averaged 240
sedimentation rate and to check that no scours to the non-erodible floor of the flume occurred. 241
Most runs lasted approximately one hour, allowing for development and migration of a 242
substantial number of bedforms. 243
Discharge was measured by an electromagnetic discharge meter in the recirculation 244
pipe. A monochrome camera was positioned at the side of the flume at approximately 7 m 245
downstream of the inlet, where it captured bulk flow configurations and sedimentary processes 246
through the glass wall at a rate of 10 pictures per second. Panoramic overviews of bedforms 247
were obtained by collecting vertical pixel columns from each image, and subsequently plotting 248
them against time. Image analysis techniques were used to detect the level of the bed and 249
water interface on each image to determine the flow depth. By combining flow depth from the 250
images and discharge measurements, time series of flow velocity and related parameters were 251
established, thereby neglecting any non-uniformity in the discharge over the length of the flume. 252
To facilitate comparisons of runs and previously published data, several other 253
parameters were calculated (Table 1). Velocity and water depth time-series were combined to 254
11
establish Froude-number time-series. The 50th (median) and 90th percentiles from the Froude 255
time series are indicated as Fr50 and Fr90 in Table 1. Following the Fr90 definition, also peak 256
velocities (U90), minimum flow depth (h10) are determined to calculate the (grain) mobility 257
parameter (θ’90) used by Van den Berg and Van Gelder (1993) in their bedform stability diagram 258
as: 259
( )( ) 50
2/90
290/
90DC
U
s ρρ
ρθ
−= ( 1 ) 260
Where ρs and ρ are the density of quartz and water respectively, D50 is the median grain size 261
and D90 is the 90th percentile grain size and with the ninety-percentile grain-roughness Chézy 262
coefficient (C’90) defined as: 263
=
90
10/90
4log18
Dh
C ( 2 ) 264
Dimensional peak grain-shear stresses were calculated as proposed by Van Rijn (1984a): 265
( )2'
90
290/
90C
ugρτ = ( 3 ) 266
In their bedform stability diagrams Van Rijn (1984b) and Van den Berg and Van Gelder (1993) 267
used the dimensionless grain size D* as defined by Bonnefille (1963): 268
( ) 3
1
2*
−
=ρν
ρρ gD s ( 4 ) 269
where ν is the kinematic viscosity of the fluid. 270
Time-average sedimentation rates (Table 1) were determined by fitting a linear least-271
square trend line on the measured bed-level time series, and hence show the sedimentation 272
rate on a time range of at least one order of magnitude larger than the time required for a single 273
bedform to migrate past the measuring point. To study the wave lengths of the different 274
bedforms spectral density estimates were made of the time-series of bed level and free surface 275

12
by a Welch overlapping segmented averaging method (Welch, 1967). The time-series were 276
divided into fourteen 50%-overlapping Hanning-windowed segments before applying a discrete 277
Fourier analyses. Confidence intervals were calculated by assuming a chi-squared distribution 278
with 70 equivalent degrees of freedom (Emery & Thomson, 1998). 279
The evolution of sedimentary structures was studied by capturing the geometry of bed 280
interfaces over the entire image width through time; successive geometries were projected on 281
top of each other to trace the internal structure of the evolving bedform by superposition of 282
different bed interfaces through time. The resulting association of timelines did not necessarily 283
correspond to the internal geometry of sedimentary structures; if no internal stratification was 284
formed, timeline successions would actually not appear in the real deposits. If a new bed 285
interface cut into a previous one due to local erosion, the eroded portion was removed and 286
replaced by the outline of the new bed interface. 287
Time series of bed interfaces were also used to construct sedimentary sequences by 288
application of a synthetic aggradation technique (Corea, 1978; Southard et al., 1990; Dumas et 289
al., 2005). This technique plots bed interfaces in a similar way to that described above, but it 290
performs synthetic aggradation by shifting the sedimentary interface upward before analysing 291
successive image frames. The upward shift corresponds to an imposed synthetic aggradation 292
rate, here corresponding to values of 0.03 mm/s, 0.12 mm/s and 0.24 mm/s. Although the 293
technique neglects the influence of additional sediment carried by the flow to accomplish such 294
aggradation rate, it provides qualitative insights on the variability of vertical sequences of 295
sedimentary structures as a function of combined aggradation rates and bedform types. A 296
comparison between the direct observations and the synthetic aggradation result can be seen in 297
four movies in the supporting information (Movie S1-S4). 298
299

13
(A) RESULTS: MORPHODYNAMICS AND INTERNAL SEDIMENTARY 300
STRUCTURES OF SUPERCRITICAL BEDFORMS 301
The experiments showed the evolution of antidunes to cyclic steps with increasing flow energy. 302
To clarify the terminology used here, which has conflicting meanings in the literature, a bedform 303
classification scheme based both on existing terminology and on the observations is presented 304
here. 305
Figure 3 shows four vertically exaggerated, schematized, upstream-migrating bedform 306
configurations formed with continuously increased Froude numbers, from A to D, based on the 307
observations presented here. The first stage (Fig. 3A) consisted of antidunes with non-breaking 308
in-phase surface waves. To distinguish these from antidunes with breaking surface waves, they 309
are here called stable antidunes. The term stable does not exclude migration or amplitude 310
fluctuations of the waves in either time or space. In contrast, unstable antidunes (Fig. 3B), are 311
characterized by the occurrence of breaking surface waves (in time or space) and the 312
associated cycles of antidune formation, wave breaking, destruction and rebuilding. At higher 313
energy levels, a long-wavelength bedform (comparised to antidunes) dominated the 314
morphology, consisting of upstream migrating chutes that end downstream in a series of 315
unstable antidunes. These features and their related hydraulic jumps and surges are here called 316
chutes-and-pools (Fig. 3C). Only if the chutes were followed by a persistent stable hydraulic 317
jump, where stable again does not exclude migration or strength fluctuations in either in time or 318
space, are bedforms here referred to as cyclic steps (Fig. 3D). The morphodynamics and 319
internal two-dimensional architecture, derived from synthetis stratigraphy, are described below. 320
(B) Stable antidunes 321
Morphodynamics - Long trains of stable antidunes (run 11) are characterized by surface waves 322
fully in-phase with undulations developed at the sediment bed interface (Fig. 3A; Movie S1). 323
Stable antidunes migrate upcurrent by erosion of the downstream side (lee side) and deposition 324

14
at the upstream side (stoss side). Downcurrent migration was not observed during any of the 325
runs performed. Figure 4A shows six photographs from the monochrome camera. Black lines 326
represent the evolution of laminae (successive bed interfaces without synthetic aggradation) 327
and set boundaries through time. Their stacking shows that the bed aggraded under higher-328
amplitude antidunes (t1-t5), and degraded under lower-amplitude antidunes at the tail of a full 329
antidune train (t6). 330
Figure 4B shows the antidunes as they migrated and passed the camera over the first 331
1200 s of the run. The position of the images shown in Figure 4A is indicated by their time 332
values (t1, t2,...). The panoramic image shows that the bed interface and the free surface were 333
in-phase, and that the amplitudes of the perturbations on both interfaces remained proportional. 334
The amplitude of the antidunes varied with time; high-amplitude antidunes were generally 335
followed by series of increasingly lower-amplitude antidunes, giving rise to bedform trains. 336
Although the corresponding Froude numbers plotted in Fig. 4C remained above one, 337
their values varied over individual antidunes. High-amplitude antidunes associated with strong 338
fluctuations in Froude numbers were subsequently damped and lower-amplitude antidunes 339
were established until the onset of the next series of high-amplitude antidunes. When 340
considering a series of several antidunes, the average Froude number correlates negatively to 341
the height of the bed surface (Fig. 4A-C). Observations over the length of the flume showed that 342
antidunes changed their aspect ratio both in time and space. 343
The characteristics of the full run are shown in the remaining panels. In Figure 4D, the 344
sediment bed interface (continuous black) and the flow surface (dashed grey) are plotted for the 345
entire run (45900 data points, 4590 s, ~75 min). This time series shows the consistent in-phase 346
relation between bed interface and flow surface over longer-period fluctuations in wave 347
amplitude. Most antidune trains show cycles of abrupt increase in amplitude, followed by a 348
gradual decrease (Fig. 4D; 300, 500, 850 and 2000 s); however, the antidune train centred on 349
3500 s shows a gradual increase and decrease. From the spectral analysis (Fig. 4F), it is 350

15
evident that undulations with a periodicity of ~60 s, which correspond to antidunes, dominate 351
the spectrum. Amplitude fluctuations of longer periodicity, which would characterize differences 352
in amplitude of subsequent antidune trains, are not recognizable in this analysis. Figure 4E plots 353
the distribution of Froude number time series and the 50th and 90th percentile. 354
Observed bedform architecture - Superimposed on the overall sedimentation rate, which was 355
kept as low as possible (here -0.5 mm/hr), sedimentary architectures result from differential 356
aggradation and erosion of different portions of the sediment interface on shorter time scales, 357
controlled by the formation and migration of antidunes. The connection between the process 358
and the internal evolution of antidune deposits is highlighted by dark lines in Figure 4A. As 359
expected from counter-current migration, each antidune leaves behind a stack of backsets 360
whose preservation depended primarily on the amplitude of successive antidunes reworking the 361
sediment top, and secondarily on the rate of aggradation. Longer-period bed undulations (trains 362
of antidunes) induce first aggradation (stacking basal structures of high-amplitude antidunes), 363
then degradation (as antidunes progressively reduce in amplitude). High-amplitude antidunes 364
thus formed thicker backsets, with a maximum of approximately one third of the antidune 365
amplitude (see images at t1, t2 and t3). Afterward, lower-amplitude antidunes left much thinner 366
sets (t4 and t5), and eventually the whole deposit was reworked by the successive high-367
amplitude antidunes (t6). 368
Synthetic bedform architecture - The resulting architecture, shown in Figure 5B to D, was 369
obtained by the synthetic aggradation technique, and hence was not directly observed during 370
the run. The top panel (Fig. 5A) shows the coupled evolution of the free surface and of the 371
underlying depositional interface (see also Fig. 4D). The lower panels show internal architecture 372
obtained at different synthetic aggradation rates (vertical scale not distorted; except Fig. 5E). 373
Timelines of bed configuration are in time increments of 4 s, within the same time framework as 374
along the horizontal axis of the top panel. 375

16
The overall structure is given by stacked lamina sets with subhorizontal to gently inclined 376
boundaries and a generally conformable geometry (see also vertically exaggerated drawing in 377
Fig. 3A). Internally, subhorizontal to low-angle backset laminae (dipping upcurrent), show low-378
angle to tangential terminations to the lower set boundary, depending on the sinusoidal 379
geometry of the forming antidune. The succession is composed of bundles of lamina sets, each 380
corresponding to progressive sedimentation from a train of antidunes; most bundles are 381
characterized by a thinning-upward trend due to the decreasing amplitude of antidunes within a 382
train (e.g., the train of antidunes at ~0-250 s, indicated by the grey square). 383
The geometry of each lamina is strongly dependent on the preserved set thickness. Thin 384
sets preserve only the lower portions of laminae, merging with the basal set boundary at a very 385
low angle; consequently, preserved lamination shows a subhorizontal to very low-angle dip 386
upstream. The structures of very thin or only partially preserved lamina sets resemble plane-387
parallel lamination. In thicker sets, the upper portions of single laminae, which dip at higher 388
angles, were more frequently preserved; the resulting backset geometry is thus much more 389
evident because the average upcurrent dip of laminae is distinctly higher. 390
Aggradation rate is another variable that controls the preservation of lamina sets, and 391
thus the internal geometry of the whole deposit. At relatively high aggradation rates (Fig. 5B), 392
superimposed lamina sets are more distinctly recognizable due to their greater thickness and 393
better preservation. Thicker lamina sets imply: 1) an overall higher dip of backset laminae, as 394
noted above, although this also depends on the antidune amplitude; 2) greater lateral continuity 395
for each set; 3) reduced relative variability in thickness between different lamina sets. The latter 396
two characteristics naturally result from the lower impact of small variations in the depth of 397
erosion, caused by fluctuations in antidune amplitude, on the overall geometry of thick sets. By 398
contrast, lower aggradation rates imply: 1) laminae with approximately planar, subhorizontal 399
geometry; 2) greatly reduced thickness of lamina sets; 3) reduced and more variable lateral 400
continuity of lamina sets, with preservation of lensoidal lamina sets in the extreme. 401

17
402
(B) Unstable antidunes 403
Morphodynamics - At slightly higher flow energies (Fr90=1.34), irregular trains of in-phase 404
antidune waves turned into more regular, shorter trains antidunes with breaking waves and 405
subsequently non-breaking waves (Run 3). The process of wave breaking is shown in Figures 406
3B, 6A (images t1-t4) and in Movie S2. As the upstream flank of the antidune wave became 407
oversteepened, flow over the antidune crests started to slide back against the incoming flow, 408
producing rollers or breaking waves that migrated upstream as positive surges (Fig. 6A, t1). The 409
positive surge was directly followed by a cloud of suspended sediment that extended almost 410
over the entire water column (t2). As the surge migrated upstream into the adjacent antidune 411
trough, its velocity and amplitude decreased (t2) and suspended sediment started to settle. The 412
surge amplitude quickly abated while the propagation velocity of the surge decreased soon after 413
the surge was flushed downstream as a negative surge (t3) while supercritical flow was locally 414
re-established over the aggraded bed (t4). The new bed morphology was less undulating than in 415
the previous phases, because the surge caused filling of the trough with sediment (as indicated 416
by set boundaries in black). The process repeated with the formation of a new antidune and a 417
new lamina set (t5-t7). After several cycles of wave breaking at the head of the antidune trains, 418
the process became less pronounced in the subsequent part of the train and seemed to be 419
mainly driven by fluctuations in discharge caused by more violent breaking waves over the 420
antidunes upstream. These wave breaking events at the head of the train were associated with 421
deep scours, followed by a longer period (~100 s) of bed aggradation and a general increase in 422
Froude number (t8-t9). This sequence of events was followed by a more stable, erosive flow 423
(initial chute) at the tail of the train, which degraded the bed down to its previous level before 424
starting a new train (t10). A panoramic view of the first 1200 s of Run 3 shows a vague repetitive 425
pattern of trains of unstable antidunes (Fig. 6B). Flow domains undergoing aggradation were 426

18
characterised by breaking surface waves, accompanied by suspension clouds and irregular 427
peaks at the free-surface, and alternated with flatter-bed domains dominated by erosive, 428
supercritical flows (initial chutes). Wave trains formed quite regularly, but showed random 429
patterns in amplitude and related erosion depth of the chute. 430
The Froude numbers plotted in Figure 6C show a vague saw-tooth-like pattern, where 431
steep declines to subcritical conditions (for example at ~380 s), associated with surges, were 432
followed by gentle fluctuating rises into the supercritical regime (between ~400-600 s), up to the 433
next decline to subcritical flow (at ~620 s). Breaking waves superimposed on this signal were 434
characterized by shorter wavelengths and smaller amplitude fluctuations. The spectrum of the 435
bed interface showed a peak around 200-250 seconds associated with the antidune cycles 436
(saw-tooth-like pattern). A much smaller barely significant peak in the bed interface graph is 437
shown around 100 seconds(Fig. 6F), but there is no obvious process associated to it. The free-438
surface spectrum shows a similar peak around 200-250 seconds and a region of insignificant 439
irregularities over a range of periods between 25-100 seconds. Individual antidunes and 440
breaking waves as seen on Fig. 6B-C must contribute to this region. These irregular insignificant 441
range of irregularities are in contrast to the sharp significant peak of the stable antidunes (Fig. 442
4F). The differences between stable and unstable antidunes are expressed by higher Fr90 and 443
lower Fr50 values for the unstable antidunes. 444
Observed bedform architecture - In contrast to the more continuous lamina sets formed by 445
stable antidunes, deposits from unstable antidunes consisted of discontinuous lenticular beds 446
with variable internal architecture, varying from backset to foreset (Fig. 3B & 6A; t8-t9). Lenticular 447
structures formed as suspended sediment settled behind a migrating surge and filled the 448
upstream trough. Depending on the maximum upstream position reached by the surge relative 449
to the deepest point of the trough, sediment was either mainly deposited on the stoss side of the 450
antidune, forming backsets (t5-7), or it settled on the lee side of the next antidune upstream 451
forming low-angle foresets, while the surge migrated further upstream. If sediment settled 452

19
around the middle portion of the trough, sets of curved symmetrical laminae were formed, 453
conformable to the set boundary (t1-4). The process of wave breaking and the resulting positive 454
surge was often associated with detachment of the high-velocity core of the incoming flow (jet) 455
from the bed (as shown in oscillating jump; Fig. 2A). The sediment bed directly behind the surge 456
was subject to strongly reduced traction, or even to reverse traction when a roller formed 457
between the bed and the jet (Fig. 3B). Direct suspension fall-out within these regions of minor 458
traction led to the accumulation of structureless deposits. Traction was gradually regained as 459
the surge reduced in strength and migrated further upstream. Consequently, lenticular sets are 460
structureless (massive) at the base, and grade vertically into more stratified deposits. 461
Synthetic bedform architecture - The obtained synthetic architecture of unstable antidune 462
deposits is characterized by stacked lamina sets with undulating boundaries and internal 463
laminae that join set boundaries tangentially (Fig. 7B-D). Compared with the deposits of stable 464
antidunes, deposits of unstable antidunes show a larger variety of dip directions. It is possible to 465
distinguish bundles of lamina sets corresponding to cycles of unstable antidunes (for example 466
40-250 s; Fig. 7, shown in grey). They consist of thicker, undular lamina sets showing variable 467
dipping directions overlain by more regular, thinner lamina sets consisting of backset laminae. 468
The more wavy basal sets represent surges triggered by waves breaking on the leading 469
antidunes. Often the first breaking waves of an antidune train triggered the most violent surges 470
that travel farthest upstream, and were most likely to form foreset laminae or laminae 471
conformable to set boundaries, which therefore are most likely found at the base of sets. These 472
violently breaking waves were then followed by more stable antidunes, which were reflected by 473
more regular lamina sets composed of subhorizontal backsets. Images (Fig. 6A, t8-9) show that 474
stable antidunes follow the unstable antidunes described above. Deposits of stable antidunes 475
were poorly preserved, because they are more likely to be eroded by the erosive higher Froude 476
number flow (chute) at the end of the antidune train, even at high aggradation rates (0.24 477
mm/s). 478
20
Successive time lines of bed development are plotted (4 s) in Fig. 7B-D. The wider 479
separation of time lines, as seen in the wavy basal deposits, implies high aggradation rates due 480
to en-mass fall-out of sediment behind the surge in the absence of traction. This makes the 481
internal structures indicated by the time lines at the base of wavy layers less likely to be 482
recognizable in the deposit. As surges slow down and start to be flushed downstream (negative 483
surge), traction was restored (Fig. 3B), making the internal structure at the top of wavy sets 484
more recognizable. Wavy basal laminas thus consisted of less pronounced laminae that tended 485
to form foresets or boundary-conformable sets, grading vertically into more pronounced 486
backsets. 487
Higher aggradation rates led to better preservation of the entire unstable antidune 488
sequence, from the development of basal wavy sets to subhorizontal backset beds at the top. 489
The convex bounding surfaces at the top of wavy sets were also better preserved at higher 490
aggradation rates. Similar to stable antidune deposits, thicker sets had laminae dipping at 491
higher angles and were characterized by greater lateral continuity than those formed at lower 492
aggradation rates. 493
(B) Chutes-and-pools 494
Morphodynamics - Runs that were characterized by higher Fr90 in comparison with the runs 495
described above, like Run 14 described here (see also Movie S3), show the formation of more 496
pronounced trains of unstable antidunes and chutes (chutes-and-pools). As described above, in 497
the case of unstable antidunes, positive surges slowed down and were flushed back 498
downstream (negative surges) over a restored flat bed, before starting a new cycle. By contrast, 499
in the presence of chutes-and-pools, positive surges slowed down and formed a hydraulic jump 500
(temporarily stationary; Fig. 8A, t1-t2) until they were gradually replaced by a supercritical flow 501
initiating a new surge (t3-t4). A positive relief was locally built up by massive settling of 502
suspended sediment downstream of the hydraulic jump (t1-t2). Such rapid aggradation, in turn, 503

21
further limited the flow depth and forced a return from a hydraulic jump to supercritical flow 504
conditions (t2). The renewed supercritical flow started to break again over a wavy bed to form a 505
new surge, thus repeating the process (t3). 506
Although the process transition between unstable antidunes and chutes-and-pools was 507
gradual, some clear distinctions can be made. First, as mentioned above, surges were no 508
longer flushed downstream, probably due to the rapid build-up of localized sediment 509
accumulation directly downstream of the surge (t1-t2). Secondly, the undulating relief, formed by 510
en-masse sediment fall-out directly behind surges or hydraulic jumps, replaced the leading 511
unstable antidunes which were strongly associated with free-surface waves. 512
Compared with unstable antidunes (Fig. 6B), chutes-and-pools (Fig. 8B) were dominated 513
by longer cycles (chutes-and-pools) over shorter wavelength cycles (antidunes). Strongly 514
erosive chutes were directly followed by strong aggradation downstream of hydraulic jumps or 515
surges. Between these chute-and-pools, slow aggradation occurred below antidunes and less 516
strong surges. The saw-tooth-like signal in Froude number (Fig. 8C) was more pronounced than 517
in the two former antidune cases (Fig. 4-6C) and can be subdivided into an upstream, mainly 518
subcritical part immediately downstream of the decline in Froude number related to the surge or 519
jump, followed further downstream by an almost uninterrupted supercritical part, although 520
superimposed smaller fluctuations remain numerous. Comparing the morphological evolution of 521
sedimentary interfaces over full runs of unstable antidunes and chutes-and-pools showed a 522
similar periodicity (~200 s), but the antidune amplitudes (~0.02 m) became smaller relative to 523
the chute-and-pool amplitudes (~0.1 m; Fig. 8). 524
Due to the hydraulic jumps and subsequent subcritical flow regions, the Fr50 here (Fr50= 525
1.19) was not much higher than for unstable antidunes (1.09), while the Fr90 increased from 526
1.34 to 1.62 (Fig. 8E). The general shape in the spectral plots (Fig. 8F) resembled those found 527
for unstable antidunes for the long wavelength cycles (around 200 seconds), but here the 528

22
shorter period peak (around 80 seconds) was more pronounced and focussed in comparison 529
with the unstable antidune spectrum. 530
Observed bedform architecture - Deposits formed by chutes-and-pools (Figs. 3C, 8A) 531
represented a continuation of the trend seen at the transition from stable antidunes to unstable 532
antidunes. The wavy geometry of set boundaries was enhanced and lenticular sets dominated 533
the sequence, with the thicker lamina sets showing more variability in the dip of laminae. The 534
variability is ascribed to the stepwise migration of the surge (Fig. 8A). As the surge moves 535
upstream (t3), its velocity decreased and instead of being flushed downstream the surge 536
converted into a stationary hydraulic jump (t1, t4-5). Just downstream of the hydraulic jump (t1-2, 537
t4-5), thick lenticular beds were formed, which were structureless in their basal parts, having 538
formed under conditions of rapid deposition from suspension and the absence of traction (t1, t4). 539
As local aggradation forced the flow to reaccelerate over the lens (t2, t5), the top of the lenticular 540
unit was reworked into foreset laminae (t5) by tractive sediment transport. As the leading edge of 541
the chute-and-pool migrated further upstream, the interstratified layer of lenticular sets was 542
draped by a swaley-like stratified layer formed by traction in an accelerating flow. At the crest of 543
the chute-and-pool the flow was supercritical and only slightly depositional, leaving behind 544
regular antidune backsets (t9). Eventually, all sediment was reworked by the chute (t10). 545
Synthetic bedform architecture - The overall structure, when developed under high aggradation 546
rates, closely resembles hummocky cross-stratification. However, synthetic aggradation 547
sequences (Fig. 9B to D) suggested that preservation of an entire chute-and-pool structure in 548
the rock record required very high aggradation rates. Basal wavy sets were dominant and the 549
wide spacing between time lines indicates that most of the preserved sediment was deposited 550
by rapid particle deposition, resulting in structureless, lenticular sand lenses. The thicker 551
undulatory sets showed again a variety of dip directions, whereas thinner ones were mainly 552
represented by backsets. Dip directions grade vertically from backsets (related to the surge 553
stage) to boundary-conform (hydraulic-jump stage), ending in reworked foresets (supercritical 554
23
flow stage), and thereby showing an opposite trend to that observed under unstable antidunes 555
(foreset-boundary conform-backset). 556
With increasing aggradation rate, greater portions of the structural sequence were 557
preserved, producing thin, swaley-like sets between lenticular units. The preservation potential 558
of the convex tops was severely limited at low aggradation rates. At the lowest aggradation 559
rates adopted here, many lenticular sets were replaced by stacked internal scours, which 560
prevented the recognition of the hummocky-like chute-and-pool sequences. At higher 561
aggradation rates (0.12 & 0.24 mm/s), chute-and-pool sequences (t = 40-220 s, shown in grey) 562
can be recognizable by more continuous, erosional surfaces at the scale of antidune 563
dimensions. It is worth noting that the lowest aggradation rate also led to the most massive 564
(structureless) character to the deposits, which can be ascribed to the preferential preservation 565
of the basal wavy sets. 566
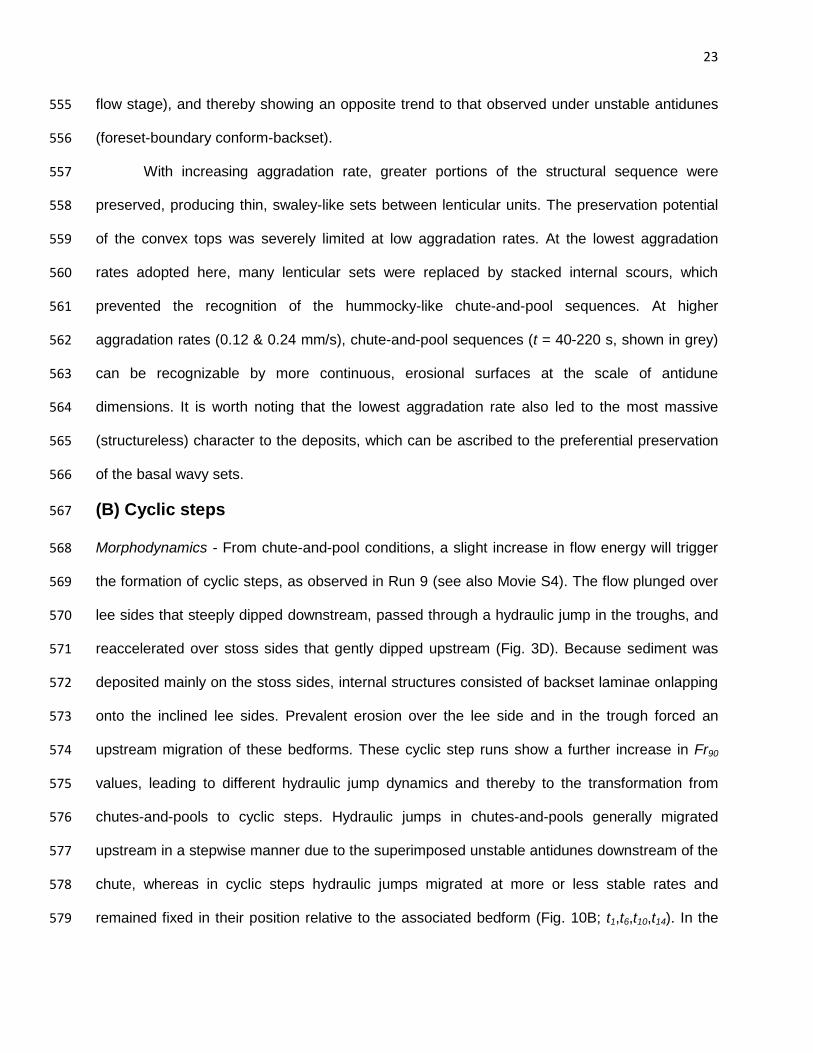
(B) Cyclic steps 567
Morphodynamics - From chute-and-pool conditions, a slight increase in flow energy will trigger 568
the formation of cyclic steps, as observed in Run 9 (see also Movie S4). The flow plunged over 569
lee sides that steeply dipped downstream, passed through a hydraulic jump in the troughs, and 570
reaccelerated over stoss sides that gently dipped upstream (Fig. 3D). Because sediment was 571
deposited mainly on the stoss sides, internal structures consisted of backset laminae onlapping 572
onto the inclined lee sides. Prevalent erosion over the lee side and in the trough forced an 573
upstream migration of these bedforms. These cyclic step runs show a further increase in Fr90 574
values, leading to different hydraulic jump dynamics and thereby to the transformation from 575
chutes-and-pools to cyclic steps. Hydraulic jumps in chutes-and-pools generally migrated 576
upstream in a stepwise manner due to the superimposed unstable antidunes downstream of the 577
chute, whereas in cyclic steps hydraulic jumps migrated at more or less stable rates and 578
remained fixed in their position relative to the associated bedform (Fig. 10B; t1,t6,t10,t14). In the 579

24
wake of the hydraulic jump, particles settled rapidly from suspension, producing massive 580
deposits just as in chutes-and-pools; however, the hydraulic jump seemed no longer directly 581
influenced by these deposits, because it migrated continuously upstream and away from the 582
point of greatest deposition. The process is shown in Figure 10A, where a hydraulic jump 583
migrated upstream (t1) directly followed by a suspension cloud (t2). The deposits that followed 584
the hydraulic jump aggraded progressively and forced the subcritical flow to accelerate (t4-t5). As 585
the flow accelerated it became erosive again and eroded the chute (t5) leading to a successive 586
hydraulic jump, where the process was repeated (t6-t10). The overall morphology of the cyclic 587
step (Fig. 10B) shows that, although the process is fairly regular, the position of the hydraulic 588
jump between individual bedforms varied. At some cyclic steps the hydraulic jump was located 589
on to the lee side (submerged hydraulic jump; Fig: 2I) (80, 400, 500 s), whereas other cyclic 590
steps presented hydraulic jumps in the deepest part of the trough (100, 300, 550, 650, 700, 800 591
s). 592
Froude numbers showed a much more regular saw-tooth-like pattern than measured for 593
unstable antidunes and chutes-and-pools. Observed fluctuations were very small, because 594
irregular surges have been replaced by steadily migrating stable hydraulic jumps with long 595
periods of subcritical flow downstream of the jump, which led to reduced median Froude number 596
values (Fr50=0.95). However, Fr90 (2.18) was still higher than in chutes-and-pools (Fr90=1.62). 597
The spectral plot (Fig. 10F) shows a dominant period of ~80-120 s, which corresponds well to 598
the average cyclic step period. The amplitude of cyclic steps varied over time (Fig. 10B and D). 599
Considering the two cyclic steps around ~800 s (Fig. 10B), it seems that high Froude numbers 600
along the chute of cyclic step at t = 800 s reduced the wavelengths of the cyclic step 601
immediately downstream, because high Froude numbers were conjugated by the hydraulic jump 602
to lower subcritical Froude numbers. 603

25
Observed bedform architecture - Cyclic step architecture consisted of backset laminae with a 604
massive basal part, formed from direct particle fall-out downstream of the hydraulic jumps, and 605
graded vertically into more stratified backsets (t4-5, t8-9). Lamina thickness and dip were 606
proportional to sedimentation rate. Some of the tows of the backsets consisted of boundary-607
conform sets. This geometric variability resulted from the distance between the deepest part of 608
the trough and the position of the hydraulic jump. If the deepest part of the trough was close to 609
the hydraulic jump (Fig. 10A; t1, t6), as was the case for flushed and normal jumps (Fig. 2G-H), 610
backset laminae were formed (t3,t8). In case of submerged (Fig. 2I) hydraulic jumps (t10, t14), the 611
distance between the jump and the deepest part of the trough was much larger, which caused 612
sediments to drape the trough and to form laminae conformable to the lower boundary (t12-13). 613
The position of the hydraulic jump relative the geometry of the cyclic step was controlled by flow 614
thickness, by the height of the stoss side pushing the hydraulic jump upstream, and by the 615
kinetic energy of the flow along the bedform lee side pushing the hydraulic jump downstream. 616
Cyclic steps with low amplitudes generally had hydraulic jumps close to the point of maximum 617
scour, while increasing bedform amplitudes tended to submerge the hydraulic jump on the lee 618
side, producing more draping geometries and boundary-conform laminae. 619
Synthetic bedform architecture - The deposits of cyclic steps consisted of very elongated, 620
generally concave lenses that truncated each other at low angles (see also vertically 621
exaggerated Fig. 3D & 11). Synthetic aggradation sequences showed that structures were 622
generally continuous, but interrupted by nested, elongate internal scours of much larger scale 623
than shown on the images used to construct the sequences (Fig. 11). The erosional basal 624
surfaces traced variations in incision depth of the trough through time. Erosional surfaces 625
commonly started upstream with relatively steep angles (t12), and extended downstream with a 626
more gentle dip upcurrent, forming a curved, spoon-shaped geometry which indicates that 627
incision depths changed through time as bedforms migrate. 628

26
Timelines in Figure 11B-D have been traced at closer intervals (2 s) than in previous 629
examples (4 s) in order to ensure the stacking of sufficient timelines to produce a clear 630
structure. Notwithstanding these shorter time intervals, the vertical spacing of these lines is 631
large, showing that the lamina sets formed under even higher local deposition rates than in 632
previous bedforms. This high aggradation rate made traction stratification even more 633
uncommon. 634
The role of aggradation rate was less pronounced in cyclic step bedforms in comparison 635
with the other bedforms. Thinner units formed in response to low aggradation rates and were 636
more elongate than those formed at high aggradation rates, which made them difficult to 637
distinguish from other bedforms. Dip angles were also reduced at low aggradation rates, 638
because of the tangential toes of laminae. Furthermore, high aggradation rates were more likely 639
to preserve backsets on top of the structureless basal layer. 640
(A) DISCUSSION 641
(B) Stability diagram 642
Bedform stability diagrams are a powerful tool linking sedimentary structures to flow parameters 643
(Simons & Richardon, 1966; Vanoni, 1974; Van Rijn, 1984; Southard & Boguchwal, 1990; Van 644
den Berg & Van Gelder, 1993), and can now be extended further into the supercritical flow 645
regime by plotting the data presented here as well as data from the literature. The stability 646
diagrams of Southard and Boguchwal (1990) and Van den Berg and Van Gelder (1993; 1998) 647
are used as a basis. 648
Simple inclusion of supercritical-bedform data into one of the existing bedform diagrams 649
is not obvious due to strongly fluctuating flow conditions over the bedforms. For bedforms in the 650
subcritical regime, depth and time averaged flow properties such as flow velocity or Froude 651
number can be plotted against grain size. In the supercritical regime, however, strong 652
27
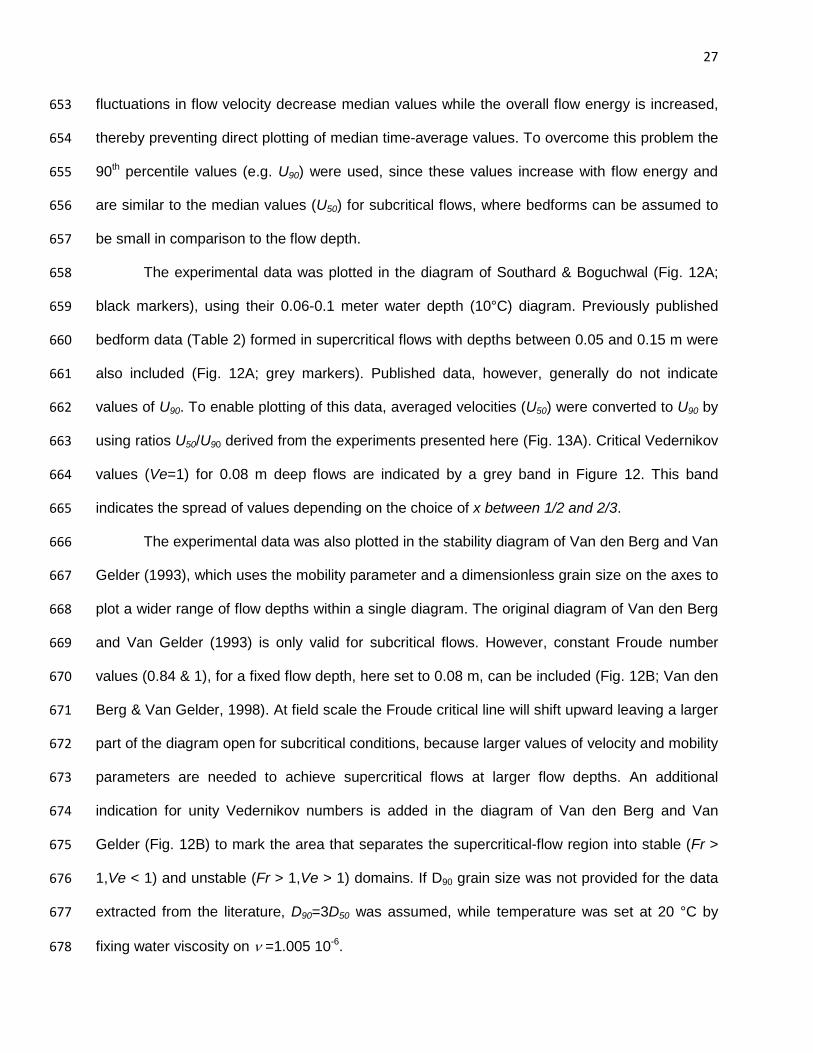
fluctuations in flow velocity decrease median values while the overall flow energy is increased, 653
thereby preventing direct plotting of median time-average values. To overcome this problem the 654
90th percentile values (e.g. U90) were used, since these values increase with flow energy and 655
are similar to the median values (U50) for subcritical flows, where bedforms can be assumed to 656
be small in comparison to the flow depth. 657
The experimental data was plotted in the diagram of Southard & Boguchwal (Fig. 12A; 658
black markers), using their 0.06-0.1 meter water depth (10°C) diagram. Previously published 659
bedform data (Table 2) formed in supercritical flows with depths between 0.05 and 0.15 m were 660
also included (Fig. 12A; grey markers). Published data, however, generally do not indicate 661
values of U90. To enable plotting of this data, averaged velocities (U50) were converted to U90 by 662
using ratios U50/U90 derived from the experiments presented here (Fig. 13A). Critical Vedernikov 663
values (Ve=1) for 0.08 m deep flows are indicated by a grey band in Figure 12. This band 664
indicates the spread of values depending on the choice of x between 1/2 and 2/3. 665
The experimental data was also plotted in the stability diagram of Van den Berg and Van 666
Gelder (1993), which uses the mobility parameter and a dimensionless grain size on the axes to 667
plot a wider range of flow depths within a single diagram. The original diagram of Van den Berg 668
and Van Gelder (1993) is only valid for subcritical flows. However, constant Froude number 669
values (0.84 & 1), for a fixed flow depth, here set to 0.08 m, can be included (Fig. 12B; Van den 670
Berg & Van Gelder, 1998). At field scale the Froude critical line will shift upward leaving a larger 671
part of the diagram open for subcritical conditions, because larger values of velocity and mobility 672
parameters are needed to achieve supercritical flows at larger flow depths. An additional 673
indication for unity Vedernikov numbers is added in the diagram of Van den Berg and Van 674
Gelder (Fig. 12B) to mark the area that separates the supercritical-flow region into stable (Fr > 675
1,Ve < 1) and unstable (Fr > 1,Ve > 1) domains. If D90 grain size was not provided for the data 676
extracted from the literature, D90=3D50 was assumed, while temperature was set at 20 °C by 677
fixing water viscosity on ν =1.005 10-6. 678

28
Both stability diagrams (Fig. 12) show the transition from upper-flow-regime plane bed, 679
through antidunes and chute-and-pools, to cyclic steps as flow energy, mobility parameter or 680
depth-average velocity, increases. The stability diagram based on the mobility parameter 681
indicates more consistent boundaries between different bedforms than the stability diagram 682
based on flow velocity, probably as a result of the non-dimensional parameters. The onset of 683
the stability fields for upper-stage plane bed is distinct in both diagrams (Fig. 12) for Froude 684
numbers between 0.84 and 1, keeping in mind the variability in flow depths, followed by 685
antidunes as flows become supercritical. For fine and medium sand the transition to unstable 686
bedforms (chutes-and-pools and cyclic steps) is reasonably well defined by Vedernikov 687
numbers around unity. For coarse sand the transition to unstable flows starts to deviate from 688
Ve=1 and occurs only at higher flow energy. In fine sand, a slight increase in flow energy 689
transforms antidunes almost directly to cyclic steps, while for the coarser grain sizes this 690
transition is more gradual, thus expanding the transitional phase of chutes-and-pools and 691
unstable antidunes. The final transition from chutes-and-pools to antidunes occurs around 692
mobility parameters of ~3. To gain more insight into the transition, the mobility parameter was 693
plotted against Froude numbers in Figure 13C. Here upper flat bed and antidunes differ from 694
chutes-and-pools and cyclic steps in their relation to the Froude number. The formation of flat 695
beds and antidunes is well correlated to Froude numbers, indicating a driving mechanism 696
mainly related to fluid properties, rather than grain size. This is in contrast to the unstable 697
bedforms (chutes-and-pools and cyclic steps), which form almost independently from Froude 698
numbers after exceeding the Vedernikov threshold, while a rather clear distinction is seen on 699
the basis of the mobility parameter, pointing to a more important role for particle-flow 700
interactions. 701
The overall changes in hydraulic jump strength, described above, are confirmed by 702
Figure 13B, where ratios of h90/h10 are plotted against Fr90. Figure 13B shows that the ratio of 703
flow depths, indicative of hydraulic jump strength, increases going from antidunes to chutes-704

29
and-pools and spans a range from undular jumps to oscillating jumps. The antidune and chutes-705
and-pool data give a reasonable fit (Fig. 13B, α = 0°) with the theoretical relation between 706
incoming Froude number and conjugated depths of Bélanger (1928) as shown in Figure 2. The 707
transition from chutes-and-pools to cyclic steps indicates a decreasing conjugated depth ratio. 708
This decrease can be explained by the increasing importance of the slope break between lee 709
and stoss side, which forces a change from normal jumps to submerged jumps. Empirical 710
relations for submerged hydraulic jumps on slope breaks (Fig. 13B, α=5-15°) point to 711
decreasing conjugated depth ratios with increasing slope break angles (α; Hager, 1992). 712
(B) Grain-size effects 713
Only within the cyclic- step runs did grain size appear to have a significant effect on bedform 714
morphology. Figure 14 compares two cyclic step runs formed at different grain sizes, discharges 715
and mobility parameters, but similar Froude numbers (Table 1). The cyclic steps in fine sand 716
(Fig. 14A) had a more gentle stoss side and a considerably steeper lee side than those 717
developed in coarser sand (Fig. 14B). In the coarse-sand run most sediment settled quickly 718
downstream of the hydraulic jump, whereas the settling rate of fine sand was lower, and was 719
more continuously distributed over the whole stoss side, leading to gentler stoss sides. 720
Deposition on the stoss sides of fine-grained cyclic steps commonly took place from 721
direct suspension fall-out (sensu Lowe, 1988) in the proximity of the hydraulic jump forming a 722
basal flow layer of high-sediment concentration (traction carpet) further downstream, as traction 723
was gradually restored on the bed. As shown in the panoramic image taken during the fine-sand 724
run (Fig. 14A), the top interface of the basal traction-carpet layer strongly fluctuated over time; 725
pulses of suspended sediment from the hydraulic jump settled to form traction carpets that 726
strongly varied in thickness depending on the sediment fed from the hydraulic jump and the 727
deposition rate below the traction carpet on the stoss side of the bedform. By contrast, 728
deposition on coarse-grained cyclic steps mainly took place directly downstream of the hydraulic 729

30
jump, forming the steepest part of the stoss side, followed quickly by minor aggradation from 730
continuous bedload transport over the remaining portion of the stoss side. 731
These distinctive processes resulted in different deposits. Cyclic steps formed in fine-732
grained sand produce intervals of structureless sand deposited from direct particle fall-out 733
immediately downstream of the hydraulic jump (Leclair & Arnott, 2003; Postma et al., 2009) 734
grading into traction-carpet deposits a little further downstream. These traction carpet deposits 735
are characteristically faintly (or diffusely) banded (Lowe, 1982; Postma et al. 1983; Sohn, 1997; 736
Leclair & Arnott, 2005; Sumner et al., 2008; Cartigny, 2012). Cyclic steps formed in medium to 737
coarse-grained sand produce transitions from structureless hydraulic jump deposits to thinner, 738
planar laminae as backset bedding. 739
Besides the gentler stoss sides, cyclic steps formed in fine sand were characterized by 740
steeper lee sides with slopes well above the angle of repose (Fig. 15A). In the absence of 741
sediment cohesion, such steep slopes under fast flows are often related to breaching where 742
erosion is counteracted by negative pore pressure due to shear dilatancy (Meyer & Van Os, 743
1976; Van den Berg et al., 2002, Mastbergen & Van den Berg, 2003; Eke et al., 2011; You et 744
al., 2012). At high shear stresses over beds of low permeability, bed deformation is associated 745
with negative pore pressures within the sediment bed, allowing the formation of slopes beyond 746
the angle of repose (Meyer and Van Os, 1976). Conditions like this replace grain-to-grain 747
erosion by progressive slide failures (Van Rhee & Bezuijen, 1998; You et al., 2012), which 748
transform down slope into slumps and fluidized flows, as frequently observed on the steep lee 749
sides of cyclic steps in fine sand. Figure 15A shows a sequence of images that capture this 750
process. First, the lee side of the cyclic step steepened (t1-2), triggering a small-scale flow slide 751
failure (t3-4). Part of this failure disintegrates into a dense suspension cloud, while the remaining 752
sediment transformed from a slide into a rotational slump, which formed a convex sedimentary 753
structure in the adjacent trough (t4-6). As erosion continued on the lee side, the slump deposit 754
became isolated from the lee side, then was overrun by the hydraulic jump and draped and 755
31
preserved by rapid suspension fall-out (t7-8). As the flow continued, the lens-shaped slump and 756
its structureless deposit originating from the rapid suspension fall out was aggraded by more 757
regular backsets (t9-10). These slump deposits were highlighted in grey in the synthetic 758
aggradation profile of Figure 15C, where spoon-shaped lamina sets similar to those developed 759
in coarse sand were interstratified with ‘banana-shaped’ slump deposits. 760
761
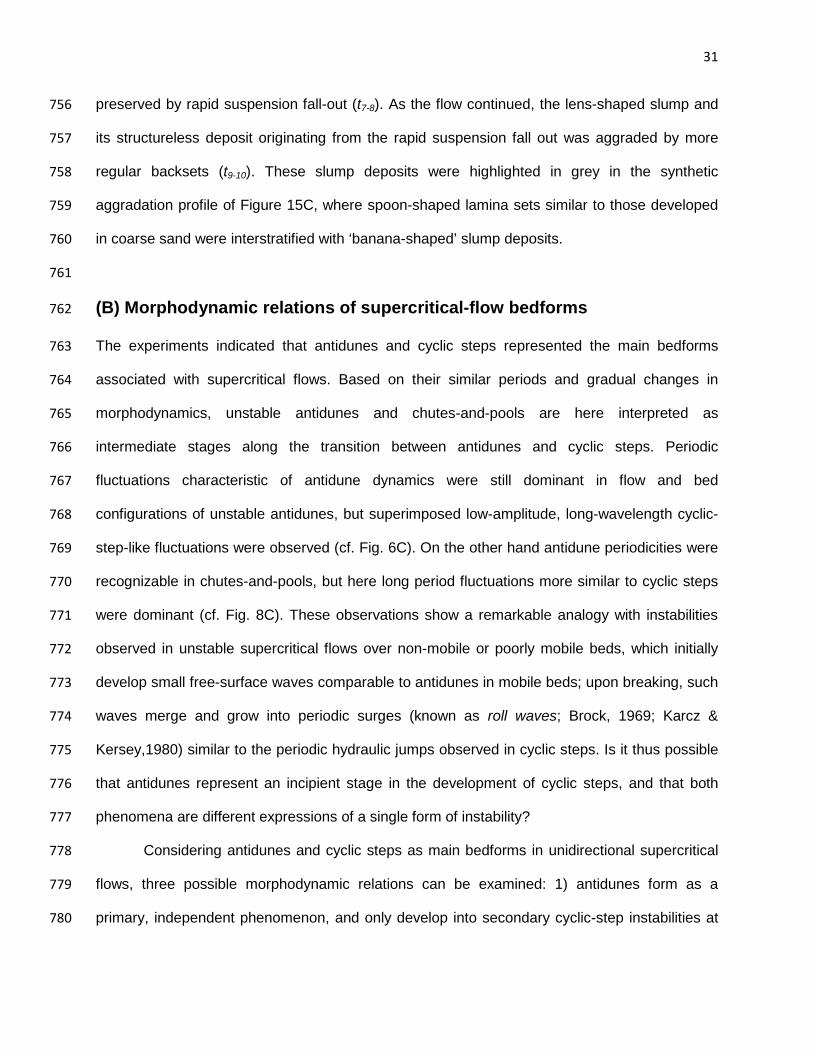
(B) Morphodynamic relations of supercritical-flow bedforms 762
The experiments indicated that antidunes and cyclic steps represented the main bedforms 763
associated with supercritical flows. Based on their similar periods and gradual changes in 764
morphodynamics, unstable antidunes and chutes-and-pools are here interpreted as 765
intermediate stages along the transition between antidunes and cyclic steps. Periodic 766
fluctuations characteristic of antidune dynamics were still dominant in flow and bed 767
configurations of unstable antidunes, but superimposed low-amplitude, long-wavelength cyclic-768
step-like fluctuations were observed (cf. Fig. 6C). On the other hand antidune periodicities were 769
recognizable in chutes-and-pools, but here long period fluctuations more similar to cyclic steps 770
were dominant (cf. Fig. 8C). These observations show a remarkable analogy with instabilities 771
observed in unstable supercritical flows over non-mobile or poorly mobile beds, which initially 772
develop small free-surface waves comparable to antidunes in mobile beds; upon breaking, such 773
waves merge and grow into periodic surges (known as roll waves; Brock, 1969; Karcz & 774
Kersey,1980) similar to the periodic hydraulic jumps observed in cyclic steps. Is it thus possible 775
that antidunes represent an incipient stage in the development of cyclic steps, and that both 776
phenomena are different expressions of a single form of instability? 777
Considering antidunes and cyclic steps as main bedforms in unidirectional supercritical 778
flows, three possible morphodynamic relations can be examined: 1) antidunes form as a 779
primary, independent phenomenon, and only develop into secondary cyclic-step instabilities at 780
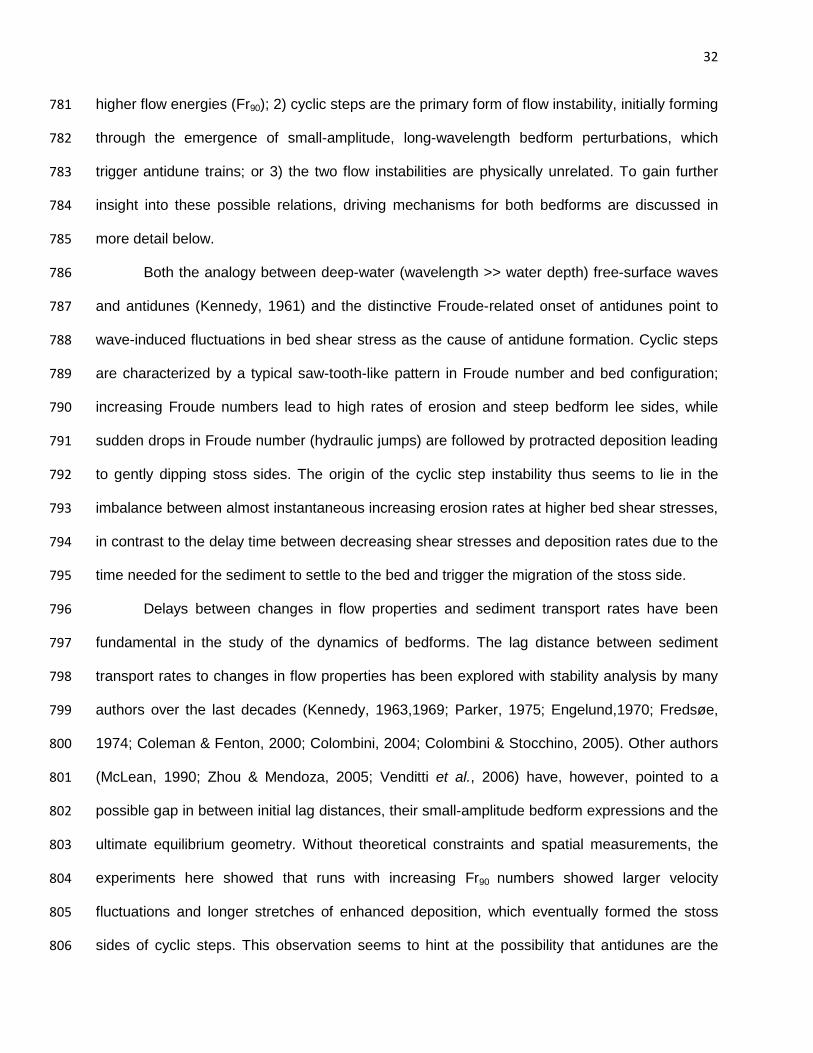
32
higher flow energies (Fr90); 2) cyclic steps are the primary form of flow instability, initially forming 781
through the emergence of small-amplitude, long-wavelength bedform perturbations, which 782
trigger antidune trains; or 3) the two flow instabilities are physically unrelated. To gain further 783
insight into these possible relations, driving mechanisms for both bedforms are discussed in 784
more detail below. 785
Both the analogy between deep-water (wavelength >> water depth) free-surface waves 786
and antidunes (Kennedy, 1961) and the distinctive Froude-related onset of antidunes point to 787
wave-induced fluctuations in bed shear stress as the cause of antidune formation. Cyclic steps 788
are characterized by a typical saw-tooth-like pattern in Froude number and bed configuration; 789
increasing Froude numbers lead to high rates of erosion and steep bedform lee sides, while 790
sudden drops in Froude number (hydraulic jumps) are followed by protracted deposition leading 791
to gently dipping stoss sides. The origin of the cyclic step instability thus seems to lie in the 792
imbalance between almost instantaneous increasing erosion rates at higher bed shear stresses, 793
in contrast to the delay time between decreasing shear stresses and deposition rates due to the 794
time needed for the sediment to settle to the bed and trigger the migration of the stoss side. 795
Delays between changes in flow properties and sediment transport rates have been 796
fundamental in the study of the dynamics of bedforms. The lag distance between sediment 797
transport rates to changes in flow properties has been explored with stability analysis by many 798
authors over the last decades (Kennedy, 1963,1969; Parker, 1975; Engelund,1970; Fredsøe, 799
1974; Coleman & Fenton, 2000; Colombini, 2004; Colombini & Stocchino, 2005). Other authors 800
(McLean, 1990; Zhou & Mendoza, 2005; Venditti et al., 2006) have, however, pointed to a 801
possible gap in between initial lag distances, their small-amplitude bedform expressions and the 802
ultimate equilibrium geometry. Without theoretical constraints and spatial measurements, the 803
experiments here showed that runs with increasing Fr90 numbers showed larger velocity 804
fluctuations and longer stretches of enhanced deposition, which eventually formed the stoss 805
sides of cyclic steps. This observation seems to hint at the possibility that antidunes are the 806
33
primary bedforms related to flow instabilities caused by free-surface waves of supercritical 807
flows, and with increasing energy, these instabilities trigger longer, incipient cyclic-step 808
instabilities as lag distances start to exceed antidune wavelengths. 809
Recent numerical work, however, has shown that cyclic steps could be considered the 810
primary instability for flows exceeding Fr = 1 (Balmforth & Vakil, 2012). These numerical 811
simulations revealed secondary instabilities that resemble antidunes in wavelength and 812
dynamics, pointing to cyclic steps as the primary bedform. Therefore, numerical simulations 813
seem to suggest that antidunes could be a secondary form of flow instability triggered by 814
variations in Froude number resulting from incipient cyclic steps. In the framework of this 815
alternative hypothesis, trains of surface waves (antidunes) separated by areas of upper-stage 816
plane beds could be considered as undulating jumps on very low-amplitude, incipient cyclic 817
steps. This hypothesis has the advantage of explaining the initial variations in antidune 818
amplitude (trains), which remain unexplained by the first hypothesis above. However, the flume 819
measurements showed that antidunes indeed formed under continuous supercritical flow, which 820
contradicts the second hypothesis. More detailed measurements over time and along the entire 821
flow length, instead of measurements at fixed positions, are necessary to further address this 822
aspect. 823
824
(B) Implications for recognition in the rock record 825
Sedimentary structures linked to supercritical-flow bedforms have been observed in outcrops 826
and present-day environments from a wide range of depositional settings, such as alluvial and 827
fluvial systems (e.g. Blair, 1999, 2000; Fielding, 2006, Van den Berg et al., 2007), proglacial 828
systems (e.g. Duller et al., 2008), glaciolacustrine subaqueous fans (e.g. Postma et al., 1983; 829
Russell & Arnott, 2003; Hornung et al., 2007; Russell et al., 2007), turbidite systems (e.g. Prave 830
& Duke, 1990; Fildani et al., 2006; Heiniö & Davies, 2009; Straub & Mohrig, 2009; Mulder et al., 831

34
2009; Paull et al., 2011; Gong et al., 2012) often referred to as hummocky cross stratified like 832
structures (Mulder et al. 2009; Prave & Duke, 1990) and volcanic environments (e.g. Schminke 833
et al., 1973; Sisavath et al., 2011). Process interpretations of bedforms and structures have 834
been supported by previous experimental work (Middleton, 1965; Hand, 1974; Alexander et al., 835
2001; Yokokawa et al., 2010). Figure 16 provides a comparative simplified overview of outcrop-836
based classification schemes and experimental work discussed in the literature. Most of this 837
work has recognized antidunes and chutes-and-pools, but cyclic steps started to be mentioned 838
only recently (e.g. Duller et al., 2008; Heiniö & Davies, 2009); due to a lack of experimental work 839
on their sedimentary structures the recognition of this latter bedform has been very uncertain to 840
date. 841
Even though observations from this variety of environmental settings differ substantially, 842
some general trends in facies architectures can be recognized. Starting from cross-bedded 843
foreset beds associated with dunes and ripples in subcritical flows, and moving into higher 844
energy settings, the remaining general architectural trend is divided in six general classes of 845
stratal architectures, which will be discussed separately: 1) subhorizontal plane beds; 2) scours 846
filled with planar to sigmoidal foresets; 3) plane beds interstratified with lenticular bedding and a 847
mix of foreset and backset bedding; 4) lenticular bedding with pronounced convex-up tops and 848
associated backsets; 5) elongated lenticular bedding with diffusely banded sediments, grading 849
vertically or downflow into more distinctly laminated deposits, 6) large-scale, steep-sided scours 850
with structureless basal infills, grading into more diffusely banded deposits. This sequence of 851
increasing flow energy is usually associated with coarsening upward grain-size trends. 852
853
(C) 1. Subhorizontal plane beds 854
Subhorizontal to low-angle planar mm-stratification and meter-scale lateral continuity is well 855
known to be characteristic of upper-stage (subcritical) plane beds (Paola et al., 1989; Cheel, 856

35
1990; Best and Bridge, 1992). Such planar lamination has been experimentally shown to 857
correspond to low-relief bedwaves (Bridge & Best, 1988). Alternatively, plane beds consisting of 858
sandy-gravelly couplets have also been interpreted as violent washout of breaking antidunes 859
immediately followed by reworking under less turbulent conditions, based on both field and 860
flume evidence (Blair, 1999, 2000; Iseya & Ikeda, 1987). It is noted here that these plane beds 861
are very similar to those produced by stable antidunes under low aggradation rates (Run 11, 862
Fig. 5D), making their genetic interpretation difficult. 863
864
(C) 2. Scours filled with planar to sigmoidal foresets 865
Scours filled with sigmoidal foreset laminae can be interpreted as the product of downstream-866
migrating antidunes (Barwis & Hayes, 1985; Cheel, 1990; Blair, 1999; Duller et al., 2008) or of 867
dunes with distinctly rounded tops (humpback dunes), which are known to form at flow 868
transitions between dunes and upper-stage plane beds (e.g. Saunderson & Lockett, 1983; Røe, 869
1987; Fielding, 2006). Downstream-dipping laminae have been observed to result from rapid 870
downstream migration of asymmetrical bedforms generated immediately after the breaking of 871
surface waves (Alexander et al., 2001). The experimental observations reported here suggest 872
two additional explanations for the occurrence of sigmoidal foreset laminae under supercritical-873
flow conditions. Firstly, as previously mentioned, basal lamina sets from unstable antidunes 874
showed variable dip, depending on the extent of upstream migration of the positive surge 875
triggered by breaking waves. Sigmoidal foresets here have been observed mainly in deeper 876
incised troughs (Fig. 6A, t1-4) related to the most violent wave-breaking events, and thereby to 877
surges reaching farthest upstream. Low-angle sigmoidal foresets produced by this mechanism 878
tend to be conformable to set boundaries (e.g. lenticular and tabular bed sets of Duller et al., 879
2008; Fig. 16). Secondly, reworking of symmetric convex-up structures typical for chutes-and-880
pools lead to sigmoidal foresets (Fig. 8A, t5-6). 881

36
(C) 3. Lenticular sets filled with boundary-conformable laminae 882
Lenticular units consisting of associated foreset and backset laminae are characteristic of both 883
unstable antidunes and chutes-and-pools (Middleton, 1965; Hand, 1974; Alexander et al., 2001; 884
Fielding, 2006; Duller et al., 2008). Chute-and-pool deposits however can be distinguished from 885
those of unstable antidunes by their prevalent lack of internal structure and lamination 886
(Alexander et al., 2001). Sedimentary structures described here have confirmed these 887
observations, and have shown also that chutes-and-pools can produce convex, conformable 888
lamina sets at high aggradation rates (Fig. 9B & C). 889
890
(C) 4. Lenticular sets with convex tops 891
Lenticular lamina sets with convex tops have been recognized in outcrops (e.g. Schminke et al., 892
1973; Fielding, 2006), as well as in experimental work. Alexander et al. (2001) observed convex 893
laminae associated with stationary surface waves. The experiments of the present paper 894
confirmed this observation and showed that pronounced convex-top lamina sets increased in 895
curvature at higher flow energies, reaching a maximum in chute-and-pool structures. The 896
synthetic aggradation technique indicated that preservation of these convex tops is only likely at 897
high aggradation rates. Outcrop examples of convex lamina sets (Fielding, 2006) indicated that 898
high aggradation rates should not be uncommon under supercritical flow conditions in natural 899
settings, in contrast to the commonly held opinion that such flows should be expected to be 900
mainly erosive or non-depositional. The resemblance of unstable antidune deposits and 901
hummocky cross-stratification has been previously discussed in the literature concerning 902
turbidity current deposits (e.g. Pickering & Hiscott, 1985; Prave & Duke, 1990; Mutti et al., 1996; 903
Myrow et al., 2008; Alexander et al., 2001; Mulder et al., 2009; Tinterri, 2011) and is confirmed 904
by the experiments described in this paper to become even stronger for chute-and-pool 905
37
structures formed under high aggradation rates, where sets of swaley laminae are observed 906
(Fig. 8, t5-7). 907
908
(C) 5. Elongated lenticular scours filled with diffusely banded sediment 909
Elongated, lenticular and spoon-shaped scours filled by diffusely banded sediments which 910
grade vertically or downstream into distinctly laminated deposits have been associated with 911
chute-and-pool structures or cyclic steps in outcrop observations (Fielding, 2006; Duller et al., 912
2008). Experiments by Yokokawa et al. (2009) showed that cyclic steps form lens-shaped units 913
with low aspect-ratios that are filled with both massive sand and backset laminae. These 914
descriptions match the observations reported here. The internal geometry of these elongated 915
units varies with the flow processes associated with cyclic step formation. Next to backset 916
lamination observed by Yokokawa et al. (2009) and in the above experiments, laminae more 917
distinctly conformable to set boundaries were observed in cases where the hydraulic jump was 918
positioned farthest upstream on the lee side of the cyclic step, at its maximum distance from the 919
trough. Transitions of structureless deposits to diffusely banded or more distinctly laminated 920
deposits (see Postma et al., 1983, for examples) could correspond to the formation of either 921
collapsing traction carpets or continuous bedload layers. 922
923
(C) 6. Steep-sided scours with structureless basal fills grading into diffusely 924
banded deposits 925
The preservation of steep-sided scours is often associated with the infill of topographic 926
depressions or to flow scouring around obstacles (Massari, 1996; Duller et al., 2008). ,The 927
observations of the present study showed that lee sides of cyclic steps can acquire very steep 928
angles, due to the dilatant properties of fine sand. However, as seen in the experiments, the 929
preservation potential of steep lee sides was very low. Thus, topographic depressions or 930
obstacle scours are a more reasonable interpretation. The steep-sided, U-shaped channels with 931

38
structureless basal fills were explained by Postma et al. (1983) to originate from local slumping 932
and subsequent plugging by the resultant liquefied sand flow; in a similar way slumping 933
processes observed in fine-sand cyclic steps (Fig. 15) could lead to the preservation of steep-934
sided scours. 935
936
(A) CONCLUSIONS 937
Flume experiments were conducted to investigate the morphodynamics and sedimentary 938
structures of bedforms under supercritical-flow conditions. The following insights were gained 939
from a combination of qualitative and quantitative observations on supercritical-flow bedforms 940
developing in the complete range from incipient antidunes to cyclic steps: 941
1) Antidunes, unstable antidunes, chutes-and-pools and cyclic steps are mutually 942
transitional bedforms. With increasing peak Froude numbers, short-wavelength bedforms of 943
antidunes gradually transform into longer-wavelength bedforms, called cyclic steps. The 944
unstable antidunes and chutes-and-pools represent a superposition of both bedforms, with 945
antidunes being dominant in the unstable antidunes runs, and cyclic steps being dominant in the 946
chutes-and-pools runs. 947
2) Classical bedform stability diagrams have been expanded to include the various kinds 948
of supercritical bedforms observed under different flow conditions. In these diagrams, the onset 949
of antidunes shows a Froude-number-related threshold, while the onset of cyclic steps is related 950
to a modified particle-mobility parameter threshold. The latter indicates a dominant role for flow-951
particle interactions, in contrast to the onset of antidunes, which is only related to flow 952
properties. 953
3) Sediment grain size has a significant impact on the geometry of cyclic steps and on 954
the processes regulating cyclic step dynamics. Fine sand leads to gently sloping stoss sides 955
formed under tractionless sediment settling due to the hydraulic jump gradually transforming 956
downstream into depositional high-density basal layers, while the lee sides are steep under the 957

39
influence of shear dilatancy. Medium sand leads to initially steeper stoss sides formed under 958
settling conditions similar to those for fine sand, but followed downstream by more gently 959
sloping stoss sides formed under normal bed-load conditions. By contrast, the dynamics of 960
antidunes do not show any dependence on grain size. 961
4) The analysis of synthetic bedform architectures highlights the importance of varying 962
aggradation rates for the geometry and preservation of supercritical-flow structures, and thus for 963
their identification in successions formed under different conditions. Whereas cyclic steps 964
appear to be relatively less sensitive to this variable, the internal architecture of antidunes and 965
chute-and-pool structures is relatively dampened or amplified with changes from low to high 966
aggradation rates. For example, antidunes developed under particularly low aggradation rates 967
may morphologically resemble plane beds; chute-and-pool structures aggraded under high 968
depositional rates may be misinterpreted as hummocky cross-stratification, whereas they may 969
resemble unstable-antidune deposits or trough cross-bedding when formed at low aggradation 970
rates. 971
972
ACKNOWLEDGEMENTS 973
This research was supported by NWO (Netherlands Organization for Scientific Research) grant 974
816.01.006. D. Ventra was supported by grant NWO-ALW 815.01.012. The authors thank 975
Wouter Poos for carrying out part of the experimental work. Thony van der Gon Netscher and 976
Henk van der Meer are thanked for their technical support at the Eurotank Laboratory. Poppe de 977
Boer and Leo van Rijn are gratefully acknowledged for their critical reading of an earlier version 978
of the manuscript. We also thank Jan Alexander, Paul Carling, Suzanne Leclair and associate 979
editor Jeremy Venditti for their constructive reviews. 980
981
REFERENCES 982

40
Alexander, J. and Fielding, C. (1997) Gravel antidunes in the tropical Burdekin River, Queensland, 983
Australia. Sedimentology, 44, 327-337. 984
Alexander, J., Bridge, J.S., Cheel, R.J. and Leclair, S.F. (2001) Bedforms and associated sedimentary 985
structures formed under water flows over aggrading sand beds. Sedimentology, 48, 133-152. 986
Allen, J.R.L. (1968) The nature and origin of bed-form hierarchies. Sedimentology, 10, 161-182. 987
Allen, J.R.L. (1982) Sedimentary Structures. Their Character and Physical Basis, Vol. 1. Elsevier, 988
Amsterdam, 593 pp. 989
Allen, J.R.L. (1985) Loose-boundary hydraulics and fluid mechanics: selected advances since 1961. In: 990
Sedimentology – Recent Developments and Applied Aspects (Eds P.J. Brenchley and B.P.J. Williams), 991
Geol. Soc. London, Spec. Publ., 18, 7-28. 992
Augustinus, P.G.E.F. (1980) Actual development of the Chenier Coast of Suriname. Sed. Geol., 26, 91-993
113. 994
Balmforth, N.J. and Mandre, S. (2004) Dynamics of roll waves. J. Fluid Mech., 514, 1-33. 995
Balmforth, N.J. and Vakil, A. (2012) Cyclic steps and roll waves in shallow water flow over an erodible 996
bed. J. Fluid Mech., 695, 35-62. 997
Barwis, J.H. and Hayes, M.O. (1985) Antidunes on modern and ancient washover fans. J. Sed. Petrol., 998
55, 907-916. 999
Belanger, J.B. (1828) Essai sur la solution numérique de quelques problèmes relatifs au mouvement 1000
permanent des eaux courantes. Carilian-Goeury, Paris, France. 1001
Bennett, S.J., Bridge, J.S. and Best, J.L. (1998) Fluid and sediment dynamics of upper stage plane 1002
beds. J. Geophys. Res., 103 C1, 1239-1274. 1003
Best, J.L. (1993) On the Interactions Between Turbulent Flow Structure, Sediment Transport and 1004
Bedform Development: Some Considerations From Recent Experimental Research. In: Turbulence: 1005
Perspectives on Flow and Sediment Transport (Eds N.J. Clifford, J.R. French and J. Hardisty), pp. 61-92. 1006
John Wiley & Sons, Chichester, UK. 1007
Best, J.L. (1996) The fluid dynamics of small-scale alluvial bedforms. In: Advances in Fluvial Dynamics 1008
and Stratigraphy (Eds P.A. Carling and M.R. Dawson), pp. 67-125. John Wiley & Sons Ltd., Chichester, 1009
UK. 1010

41
Best, J. and Bridge, J. (1992) The morphology and dynamics of low amplitude bedwaves upon upper 1011
stage plane beds and the preservation of planar laminae. Sedimentology, 39, 737-752. 1012
Blair, T.C. (1987) Sedimentary processes, vertical stratification sequences, and geomorphology of the 1013
Roaring River alluvial fan, Rocky Mountain National Park, Colorado. J. Sed. Petrol., 57, 1-18. 1014
Blair, T.C. (1999) Sedimentary processes and facies of the waterlaid Anvil Spring Canyon alluvial fan, 1015
Death Valley, California. Sedimentology, 46, 913-940. 1016
Blair, T.C. (2000) Sedimentology and tectonic unconformities of the sheetflood-dominated Hell’s Gate 1017
alluvial fan, Death Valley, CA. Sed. Geol., 132, 233–262. 1018
Bonnefille, R. (1963) Essais de synthese des lois du début d'entrainement des sédiments sous l’action 1019
d'un courant en regime continu. Bull. du Centre de Rech. et d'ess. de Chatou, 5, 17-22. 1020
Bradley J.N. and Peterka A.J. (1955) Research study on stilling basins, energy dissipators and 1021
associated appurtenances. U.S. Bureau of Reclamation, Hydraulic Laboratory Report, HYD-399. 1022
Bridge, J.S. and Best, J.L. (1988) Flow, sediment transport and bedform dynamics over the transition 1023
from dunes to upper-stage plane beds: implications for the formation of planar laminae, Sedimentology, 1024
35(5), 753-763. 1025
Brock, R.R. (1967) Development of roll waves in open channels.W. M. Keck Laboratory of Hydraulic and 1026
Water Research, California Institute of Technology, Report KH-R-16, 226 pp. 1027
Broome, R. and Komar, P.D. (1979) Undular hydraulic jumps and the formation of backlash ripples on 1028
beaches. Sedimentology, 26(4), 543-559. 1029
Carling, P.A. and Breakspear, R.M.D. (2007) Gravel dunes and antidunes in fluvial systems. In: River, 1030
Coastal and Estuarine Morphodynamics: RCEM 2007 (Eds C.M. Dohmen-Janssen and S.J.M.H. 1031
Hulscher), pp. 1015-1020. Taylor & Francis Group, London. 1032
Carling, P.A. and Schvidchenko, A.B. (2002) A consideration of the dune-antidune transition in fine 1033
gravel. Sedimentology, 49, 1269-1282. 1034
Cartigny, M.J.B., Postma, G., Van Den Berg, J.H. and Mastbergen D.R. (2011) A comparative study of 1035
sediment waves and cyclic steps based on geometries, internal structures and numerical modeling. Mar. 1036
Geol., 280, 40-56. 1037

42
Cartigny, M.J.B. (2012) Morphodynamics of supercritical high-density turbidity currents. Utrecht Studies 1038
in Earth Sciences, 10. 1039
Chanson, H. (2002) The hydraulics of open channel flow. Butterworth-Heinemann, Oxford. 1040
Chanson, H. (2009) Current knowledge in hydraulic jumps and related phenomena. a survey of 1041
experimental results. Eur. J. Mech. B – Fluids, 28, 191–210. 1042
Cheel, R.J. (1990) Horizontal lamination and the sequence of bed phases and stratification under upper-1043
flow-regime conditions. Sedimentology, 37, 517-529. 1044
Coleman, S. E. and Fenton, J. D. (2000) Potential-flow instability theory and alluvial stream bed forms. J. 1045
Fluid Mech., 418, 101–117. 1046
Colombini, M. (2004) Revisiting the linear theory of sand dune formation. J. Fluid Mech., 502, 1–16. 1047
Colombini, M. and Stocchino, A. (2005) Coupling or decoupling bed and flow dynamics: fast and slow 1048
sediment waves at high Froude numbers. Phys. Fluids, 17, 036602. 1049
Corea, W. C. (1978) A method for synthesizing sedimentary structures generated by migrating bedforms. 1050
Unpublished S.M. thesis, Boston, Massachusetts Institute of Technology, 58 pp. 1051
Cornish, V. (1910) Waves of the sea and other water waves. Unwin, London. 1052
Devauchelle, O., Malverti, L., Lajeunesse, E., Josserand, C., Lagrée, P.Y. and Métivier, F. (2010a) 1053
Rhomboid beach pattern: A laboratory investigation. J. Geophys. Res., series F, 115, F02017, 1054
doi:10.1029/2009JF001471. 1055
Devauchelle, O., Malverti, L., Lajeunesse, E., Lagrée, P.Y., Josserand C. and Nguyen Thu-Lam, 1056
K.D. (2010b) Stability of bedforms in laminar flows with free-surface: from bars to ripples. J. Fluid Mech., 1057
642, 329-348. 1058
Duller, R.A., Mountney, N.P., Russell, A.J. and Cassidy N.C. (2008) Architectural analysis of a 1059
volcaniclastic jökulhlaup deposit, southern Iceland: sedimentary evidence for supercritical flow. 1060
Sedimentology, 55, 939-964. 1061
Dumas, S., Arnott, R.W.C. and Southard, J.B. (2005) Experiments on oscillatory-flow and combinedflow 1062
bed forms: Implications for interpreting parts of the shallow marine rock record. J. Sed. Res., 75, 501–1063
513. 1064

43
Eke, E., Viparelli, E. and Parker, G. (2011) Field-scale numerical modeling of breaching as a mechanism 1065
for generating continuous turbidity currents. Geosphere, 7(5), 1063-1076. 1066
Emery, W.J. and Thomson, R.E. (1998) Data analysis methods in physical oceanography. pp. 634, 1067
Pergamon, Oxford, UK. 1068
Engelund, F. (1970) Instability of erodible beds. J. Fluid Mech., 42, 225–244. 1069
Fagherazzi, S. and Sun., T. (2003) Numerical simulations of transportational cyclic steps. Comput. 1070
Geosci., 29, 1143-1154. 1071
Fielding, C.R. (2006) Upper flow regime sheets, lenses and scour fills: Extending the range of 1072
architectural elements for fluvial sediment bodies. Sed. Geol., 190, 227-240. 1073
Fildani, A., Normark, W.R, Kostic, S. and Parker, G. (2006) Channel formation by flow stripping: large-1074
scale scour features along the Monterey East Channel and their relation to sediment waves. 1075
Sedimentology, 53, 1265-1287. 1076
Fralick, P. (1999) Paleohydraulics of chute-and-pool structures in a Paleoproterozoic fluvial sandstone. 1077
Sed. Geol., 125, 129-134. 1078
Fredsøe, J. (1974) On the development of dunes in erodible channels. J. Fluid Mech., 64, 1–16. 1079
Fredsøe J. and Engelund F. (1975) Bed configuration in open and closed alluvial channels. Ser. Pap. 1080
Inst. Hydrodynamics Hydraul. Eng. Tech. Univ. Denmark 8, 1–39. 1081
Fukuoka, S., Okutsu, K. and Yamasaka, M. (1982) Dynamics and kinematic features of sand waves in 1082
upper regime. (In Japanese) Proc. Jpn Soc. Civ. Eng, 323, 77-89. 1083
Gilbert, G. K. (1914) The transportation of débris by running water. U.S. Geol. Surv. Prof. Pap., 86, 263 1084
pp. 1085
Gong, C., Wang, Y., Peng, X., Li, W., Qiu, Y. and Xu, S. (2012) Sediment waves on the South China 1086
Sea Slope off southwestern Taiwan: Implications for the intrusion of the Northern Pacific Deep Water into 1087
the South China Sea, Mar. Petrol. Geol., 32(1), 95-109. 1088
Guy, H. P., Simons, D. B. and Richardson, E. V. (1966) Summary of alluvial channel data from flume 1089
experiments 1956–1961. U.S. Geol. Surv. Prof. Paper, 462-I 1090
Hager,W.L., (1992) Energy dissipators and hydraulic jumps, Kluwer academic pubilishers, Dordrecht. 1091
Hand, B.M. (1974) Supercritical flow in density currents. J. Sed. Petrol., 44, 637–648. 1092
44
Harms, J.C. and Fanhestock, R.R. (1965) Stratification, bedforms and flow phenomena (with an 1093
example from the Rio Grande). In: Primary Sedimentary Structures and their Hydrodynamic Interpretation 1094
(Ed. G.V. Middleton), SEPM Spec. Publ., 12, 84-115. 1095
Heinio, P. and Davies, R.J. (2009) Trails of depressions and sediment waves along submarine channels 1096
on the continental margin of Espirito Santo Basin, Brazil. Geol. Soc. Am. Bull., 121, 698–711. 1097
Hornung, J.J., Asprion, U. and Winsemann, J. (2007) Jet-efflux deposits of a subaqueous ice-contact 1098
fan, glacial Lake Rinteln, northwestern Germany. Sed. Geol., 193, 167–192. 1099
Iseya, F. and Ikeda, H. (1987) Pulsation in bedload transport rates induced by a longitudinal sediment 1100
sorting: a flume study using sand and gravel mixtures. Geogr. Ann., 69, 15–27. 1101
Jeffreys, H. J. (1925) The flow of water in an inclined channel of rectangular section. Phil. Mag., 6, 793-1102
807. 1103
Jopling, A.V. and Richardson, E.V. (1966) Backset bedding developed in shooting flow in laboratory 1104
experiments. J. Sed. Petrol., 36, 821-825. 1105
Karcz, I. and Kersey, D. (1980) Experimental study of free-surface flow instability and bedforms in 1106
shallow flows. Sed. Geol., 27, 263–300. 1107
Kennedy, J.F. (1961) Stationary Waves and Antidunes in Alluvial Channels. W.M. Keck Laboratory of 1108
Hydraulics and Water Research, California Institute of Technology, Report KH-R-2, 146pp. 1109
Kennedy, J. F. (1963) The mechanics of dunes and antidunes in erodible-bed channels, J. Fluid Mech., 1110
16, 521–544. 1111
Kennedy, J. F. (1969) The formation of sediment ripples, dunes and antidunes. Ann. Rev. Fluid Mech., 1, 1112
147–168. 1113
Koloseus, H.J. and Davidian, J. (1966) Free surface instabilities correlations. U.S. Geol. Surv. Water-1114
Sup. Pap., 1592-C, 72 pp. 1115
Komar, P.D. (1996) Entrainment of Sediments from Deposits of Mixed Grain Sizes and Densities. In: 1116
Advances in Fluvial Dynamics and Stratigraphy (Eds P.A. Carling and M.R. Dawson), pp. 127-181. John 1117
Wiley & Sons Ltd., Chichester, UK. 1118
Kostic, S. (2011) Modeling of submarine cyclic steps: Controls on their formation, migration, and 1119
architecture. Geosphere, 7, 294-304. 1120
45
Kostic, S. and Parker, G. (2006) The response of turbidity currents to a canyon-fan transition: hydraulic 1121
jumps and depositional signatures. J. Hydraul. Res., 44, 631-653. 1122
Kostic, S., Sequeiros, O., Spinewine, B. and Parker G. (2010) Cyclic steps: A phenomenon of 1123
supercritical shallow flow from the high mountains to the bottom of the ocean. J. Hydro-environ. Res., 3, 1124
167-172. 1125
Lamb, M.P., Parsons, J.D., Mullenbach, B.L., Finlayson, D.P., Orange, D.L. and Nittrouer C.A. (2008) 1126
Evidence for superelevation, channel incision, and formation of cyclic steps by turbidity currents in Eel 1127
Canyon, California. Geol. Soc. Am. Bull., 120, 463-475. 1128
Langford, R. and Bracken, B. (1987) Medano Creek, Colorado, a model for upper-flow-regime fluvial 1129
deposition. J. Sed. Petrol., 55, 863-870. 1130
Leclair, S.F. and Arnott, R.W.C. (2003) Coarse-tail graded, structureless strata: indicators of an internal 1131
hydraulic jump. In: Shelf Margin Deltas and Linked Down Slope Petroleum Systems: Global Significance 1132
and Future Exploration Potential (Eds. H.H. Roberts, N.C. Rosen, R.H. Filion, and J.B. Anderson) SEPM, 1133
Gulf Coast Section, Houston, 817–836. 1134
Leclair, S.F. and Arnott, R.W.C. (2005) Parallel lamination formed by high-density turbidity currents. J. 1135
Sed. Res.,75(1), 1-5. 1136
Leeder, M.R. (1983) On the interactions between turbulent flow, sediment transport and bedform 1137
mechanics in channelized flows. In: Modern and Ancient Fluvial Systems (Eds. J.D.Collinson and 1138
J.Lewin), Int. Assoc. Sedimentol. Sp. Publ., 6, 5-18. 1139
Lennon, J.M., and Hill, D.F. (2006) Particle image velocimetry measurements of undular and hydraulic 1140
jumps." J. Hydr. Eng., 132, 1283-1294. 1141
Lighthill, J. (1978) Waves in fluids. Cambridge University Press, 516 pp. 1142
Long, D., Steffler, P.M., Rajaratnam, N. and Smy, P. (1991) Structure of flow in hydraulic jumps. J. 1143
Hydraul. Res., 29, 293–308. 1144
Lowe, D.R. (1982) Sedimentary gravity flows: II. Depositional models with special reference to the 1145
deposits of high density turbidity currents. J. Sed. Petrol., 52, 279-297. 1146
Lowe, D.R. (1988) Suspended-load fall-out rate as an independent variable in the analysis of current 1147
structures. Sedimentology, 35, 765-776. 1148

46
MacDonald, R.G., Alexander, J., Bacon, J.C. and Cooker, M.J.(2009) Flow patterns, sedimentation and 1149
deposit architecture under a hydraulic jump on a non-eroding bed: defining hydraulic-jump unit bars. 1150
Sedimentology, 56, 1346–1367. 1151
Massari, F. (1996) Upper-flow-regime stratification types on steep-face, coarse-grained, Gilbert-type 1152
progradational wedges. J. Sed. Res., 66, 364-375. 1153
Mastbergen, D.R. and Winterwerp, J.C. (1987) Het gedrag van zand-watermengselstromingen boven 1154
water: Verslag experimentele vervolg studie. Report Z46-02, Delft Hydraulics, Delft, The Netherlands. 1155
Mastbergen, D.R. and Van den Berg, J.H. (2003) Breaching in fine sands and the generation of 1156
sustained turbidity currents in submarine canyons. Sedimentology, 50, 625-637. 1157
McKee, E.D., Crosby, E.J. and Berryhill, H.L. (1967) Flood deposits, Bijou Creek, Colorado, June 1965. 1158
J. Sed. Petrol., 37, 829-851. 1159
McLean, S.R. (1990) The stability of ripples and dunes. Earth-Sci. Rev., 19, 131-144. 1160
Meyer, K.L. and Van Os, A.G. (1976) Pore pressures near moving underwater slope. J. Geotech. Eng. 1161
Div. Am. Soc. Civ. Eng., 102, 361-372. 1162
Middleton, G.V. (1965) Antidune cross-bedding in a large flume. J. Sed. Petrol., 35, 922-927. 1163
Middleton, G. V. and Southard, J. B. (1984) Mechanics of sediment movement. Society of Economic 1164
Paleontologists and Mineralogists Short Course 3, 401 pp. 1165
Montes J.S. (1986) A Study of the Undular Jump Profile. Proc. 9th Australasian Fluid Mechanics 1166
Conference AFMC, Auckland, New Zealand, 148-151. 1167
Mulder, T., Razin, P. and Faugères, J.C. (2009) Hummocky cross-stratification-like structures in deep-1168
sea turbidites: upper Cretaceous Basque basins (Western Pyrenees, France). Sedimentology, 56, 997–1169
1015. 1170
Mutti, E., Davoli, G., Tinterri, R., and Zavala, C. (1996) The importance of ancient fluvio-deltaic systems 1171
dominated by catastrophic flooding in tectonically active basins. Sci. Geol. Mem., 48, 232-291. 1172
Myrow, P.M., Lukens, C., Lamb, M.P., Houck, K. and Strauss, J. (1998) Dynamics of a transgressive 1173
prodeltaic system: implications for geography and climate within a Pennsylvanian intracratonic basin, 1174
Colorado, USA. J. Sed. Res., 78, 512- 1175

47
Normark, W.R., Hess, G.R., Stow, D.A.V. and Bowen, A.J. (1980) Sediment waves on the Monterey 1176
Fan levee: a preliminary physical interpretation. Mar. Geol., 37, 1–18. 1177
Newitt, D.M., Richardson, J.F., Abbott, M. and Turtle, R.B. (1955) Hydraulic conveying of solids in 1178
horizontal pipes. Trans. Inst. Chem. Engrs., 33, 93-113. 1179
Paola, C., Wiele, S.M. and Reinhart, M.A. (1989) Upper-regime parallel lamination as the result of 1180
turbulent sediment transport and low-amplitude bedforms. Sedimentology, 36, 47-59. 1181
Parker, G. (1975) Sediment inertia as cause of river antidunes. J. Hydraul. Div. ASCE, 101, 211–221. 1182
Parker, G. (1996) Some speculations on the relation between channel morphology and channel-scale 1183
flow structures. In: Coherent flow structures in open channels (Eds P.J. Ashworths S.J. Bennett, J.L. Best 1184
and S.J. McLelland), John Wiley & sons, 423-458. 1185
Paull, C.K., Caress, D.W., Ussler, W., Lundsten, E. and Meiner-Johnson, M. (2011) High-resolution 1186
bathymetry of the axial channels within Monterey and Soquel submarine canyons, offshore central 1187
California, Geosphere, 7(5), 1077-1101. 1188
Pickering, K. T. and Hiscott, R. N. (1985) Contained (reflected) turbidity currents from the Middle 1189
Ordovician Cloridorme Formation, Quebec Canada: an alternative to the antidune hypothesis. 1190
Sedimentology, 32, 373–394. 1191
Røe, S. L. (1987) Cross-strata and bedforms of probable transitional dune to upper-stage plane-bed 1192
origin from a Late Precambrian fluvial sandstone, northern Norway. Sedimentology, 34, 89–101. 1193
Postma, G., Roep, T.B. and Ruegg, G.H.J. (1983) Sandy-gravelly mass-flow deposits in an ice-marginal 1194
lake (Saalian, Leuvenumsche Beek valley, Veluwe, the Netherlands), with emphasis on plug-flow 1195
deposits. Sed. Geol., 34, 59–82. 1196
Postma, G., Cartigny, M.J.B. and Kleverlaan, K. (2009) Structureless, coarse-tail graded Bouma Ta 1197
formed by internal hydraulic jump of the turbidity current? Sed. Geol., 219, 1–6. 1198
Prave, A.R. and Duke, W.L. (1990) Small-scale hummocky crossstratification in turbidites: a form of 1199
antidune stratification? Sedimentology, 37, 531–539. 1200
Rajaratnam, N. (1967) Hydraulic jumps. Adv. Hydrosci., 4, 197-280. 1201
Robertson, J.M. and Rouse, H. (1941) On the four regimes of open-channel flow. Civ. Eng. (N.Y.), 11, 1202
169-171. 1203

48
Russell, H.A.J. and Arnott, R.W.C. (2003) Hydraulic jump and hyperconcentrated flow deposits of a 1204
glacigenic subaqueous fan: Oak Ridges Moraine, southern Ontario, Canada. J. Sed. Res., 73, 887–905. 1205
Russell, H.A.J., Sharpe, D.R. and Bajc, A.F. (2007) Sedimentary signatures of the Waterloo Moraine, 1206
Ontario, Canada. In: Glacial Sedimentary Processes and Products (Eds M.J. Hambrey, P. Christoffersen, 1207
N.F. Glasser and B. Hubbard), Int. Assoc. Sedimentol. Spec. Publ., 39, 85-108. 1208
Saunderson, H.C. (1982) Bed Form Diagrams and the Interpretation of Eskers. Research in Glacial, 1209
Glacio-Fluvial and Glacio-Lacustrine Systems. Proceedings 6th Guelph Symposium on Geomorphology, 1210
1980, 139-150. 1211
Saunderson, H.C. and Lockett, F.P. (1983) Flume experiments on bedforms and structures at the dune-1212
plane bed transition. In: Modern and Ancient Fluvial Systems (Eds J.D. Collinson and J. Lewin), Int. 1213
Assoc. Sedimentol. Spec. Publ., 6, 49-58. 1214
Schmincke, H.U., Fisher, R.V. and Waters, A.C. (1973) Antidune and chute and pool structures in the 1215
base surge deposits of Laacher See area, Germany. Sedimentology, 20, 553-574. 1216
Schumm, S. A., Bean, D. W. and Harvey M. D. (1982) Bed-form-dependent pulsating flow in Medano 1217
Creek, Southern Colorado. Earth Surf. Proc. Landf., 7, 17–28. 1218
Simons, D.B. and Richardson, E.V. (1966) Resistance to Flow in Alluvial Channels. US Geol. Surv. 1219
Prof. Pap., 422-J, 61 pp. 1220
Simons, D. B., Richardson, E. V. and Nordin, C. F. (1965) Sedimentary structures generated by flow in 1221
alluvial channels. In: Primary Sedimentary Structures and Their Hydrodynamic Interpretation (Ed. G.V. 1222
Middleton), SEPM Spec. Publ., 12, 34–52. 1223
Sisavath, E., Babonneau, N., Saint-Ange, F., Bachèlery, P., Jorry, S.J., Deplus, C., De Voogd, B. 1224
and Savoye, B. (2011) Morphology and sedimentary architecture of a modern volcaniclastic turbidite 1225
system: The Cilaos fan, offshore La Réunion Island, Mar. Geol., 288(1), 1-17. 1226
Sohn, Y. K. (1997) On traction carpet sedimentation. J. Sed. Res., 67, 502–509. 1227
Southard, J.B. and Boguchwal, L.A. (1990) Bed configurations in steady unidirectional flows: Part 2. 1228
Synthesis of flume data, J. Sed. Petrol., 60, 658–679. 1229

49
Southard, J.B., Lambie, J.M., Federico, D.C., Pile, H.T. and Weidman, C.R. (1990) Experiments on 1230
bed configurations in fine sands under bidirectional purely oscillatory flow, and the origin of hummocky 1231
cross-stratification. J. Sed. Petrol., 60, 1–17. 1232
Spinewine, B., Sequeiros, O.E., Garcia, M.H., Beaubouef, R.T., Sun., T., Svoye, B. and Parker, G. 1233
(2009) Experiments on wedge-shaped deep sea sedimentary deposits in minibasins and/or on channel 1234
levees emplaced by turbidity currents. Part II. Morphodynamic evolution of the wedge and of the 1235
associated bedforms. J. Sed. Res., 79, 608-628. 1236
Straub, K.M. and Mohrig, D. (2009) Constructional canyons built by sheet-like turbidity currents: 1237
observations from offshore Brunei Darussalam. J. Sed. Res., 79, 24-39. 1238
Sumner, E.J., Amy, L.A. and Talling, P.J. (2008) Deposit structure and processes of sand deposition 1239
from decelerating sediment suspensions.J. Sed. Res.,78(8), 529-547. 1240
Taki, K. and Parker, G. (2005) Transportational cyclic steps created by flow over an erodible bed. Part 1. 1241
Experiments. J. Hydraul. Res., 43, 488-501. 1242
Tinterri, R. (2011) Combined flow sedimentary structures and the genetic link between sigmoidal- and 1243
hummocky-cross stratification. GeoActa, 10. 1-43. 1244
Van den Berg, J.H. and Van Gelder, A. (1993) A new bedform stability diagram, with emphasis on the 1245
transition of ripples to plane bed in flows over fine sands and silt. In: Alluvial Sedimentation (Eds M. 1246
Marzo and C. Puigdefabregas), Int. Ass. Sedimentol. Sp. Publ., 17, 11–21. 1247
Van den Berg, J.H. and Van Gelder, A. (1998) Discussion: Flow and sediment transport over large 1248
subaqueous dunes: Fraser River, Canada. Sedimentology, 45, 217-221. 1249
Van den Berg, J.H., Van Gelder, A. and Mastbergen, D.R. (2002) The importance of breaching as a 1250
mechanism of subaqueous slope failure in fine sand. Sedimentology, 49, 81-95. 1251
Van den Berg, J.H., Boersma, J.R. and Van Gelder, A. (1997) Diagnositc sedimentary structures of the 1252
fluvial-tidal transition zone – Evidence form deposits of the Rhine and Meuse. Geol. Mijnbouw, 86, 287-1253
306. 1254
Van den Berg, J.H. and Nio, S.D. (2010) Sedimentary structures and their relation to bedforms and flow 1255
conditions. EAGE Publications, Houten, 138 pp. 1256
Vanoni, V.A. (1974) Factors determining bed forms of alluvial stream. J.of Hydr. Div, 100(3), 363-377. 1257
50
Van Rijn, L. C. (1984a) Sediment transport, Part I: Bed load transport. J. Hydraul. Eng., ASCE, 110, 1258
1431-1456. 1259
Van Rijn, L. C. (1984b) Sediment transport, Part III: Bed forms and alluvial roughness. J. Hydraul. Eng., 1260
ASCE, 110, 1733-1754. 1261
Van Rhee, C. and Bezuijen, A. (1998) The breaching of sand investigated in large-scale model tests. 1262
Proceedings of the International Coastal Engineering Conference. Copenhagen. Am. Soc. Civ. Eng., 3, 1263
2509-2519. 1264
Vedernikov, V.V. (1945) Conditions at the front of a translation wave disturbing a steady motion of real 1265
fluid. Dokl. Acad. Sci. USSR, 48, 239-242. 1266
Vedernikov, V.V. (1946) Characteristic features of a liquid flow in open channel. Dokl. Acad. Sci. USSR, 1267
52, 207-210. 1268
Venditti, J.G., Church, M. and Bennett, S.J.(2006) On interfacial instability as a cause of transverse 1269
subcritical bed forms. Water resource. res., 42(7), W07423. 1270
Ven Te Chow (1959) Open-channel Hydraulics, McGraw-Hill Book, New York. 1271
Waters, A.C. and Fisher, R.V. (1971) Base surges and their deposits: Capelinhos and Taal volcanoes. J. 1272
Geophys. Res., 76, 5596-5614. 1273
Welch, P.D. (1967) The use of fast fourier transform for the estimation of power spectra: A method based 1274
on time averaging over short, modified periodograms. IEEE Trans. Audio and Electro., 15, 70-73. 1275
Wells, S.G. and Dohrenwend, J.C. (1985) Relict sheetflood bed forms on late Quaternary alluvial-fan 1276
surfaces in the southwestern United States. Geology, 13, 512-516. 1277
Winterwerp, J.C., Bakker, W.T., Mastbergen, D.R. and Van Rossum, H. (1992) Hyperconcentrated 1278
sand-water mixture flows over erodible bed. J. Hydraul. Engin., 118, 1508-1525. 1279
Yagishita, K. (1992) Recent Studies on Some Sedimentary Structures Formed under Upper-flow-regime 1280
Conditions: Review and Discussion. Ann. Rep. Fac. Educ., Iwate University, 52, 85-95. 1281
Yagishita, K., Ashi, J., Ninomiya, S. and Taira, A. (2004) Two types of plane beds under upper-flow-1282
regime in flume experiments: evidence from grain fabric. Sed. Geol., 163, 229-236. 1283

51
Yokokawa, M., Hasegawa, K., Kanbayashi, S. and Endo, N. (2010) Formative conditions and 1284
sedimentary structures of sandy 3D antidunes: an application of the gravel step-pool model to fine-1285
grained sand in an experimental flume. Earth Surf. Proc. Landf., 35, 17201729. 1286
Yokokawa, M., Okuno, K., Nakamura, A., Muto, T., Miyata, Y. and Naruse, H. (2009) Aggradational 1287
cyclic steps: sedimentary structures found in flume experiments. Proceedings 33rd IAHR Congress, 1288
Vancouver, pp. 5547-5554. 1289
You, Y., Flemming, P. and Mohrig, D. (2012) Dynamics of dilative slope failure. Geology, 40(7), 663-1290
666. 1291
Zhou, D. and Mendoza, C. (2005) Growth model for sand wavelets. J. Hydraul. Eng., 131(10), 866-876. 1292
1293
FIGURE AND TABLE CAPTIONS 1294
Table 1. Experimental conditions for individual experimental runs. Subscripts indicate the percentile of 1295
time-series measurements: 50 equals median, and 90 equals ninetieth percentile (value surpassed by 1296
10% of the measurements). Bed level and water level time series have not been constructed for Runs 21-1297
23 and therefore overall sedimentation rates are not available (NA) for these runs. 1298
Table 2. References and data of literature used in Fig. 12. 1299
Fig. 1. Conceptual subdivision of supercritical-flow phenomena on the basis of Reynolds number and 1300
Vedernikov number; the mobility of the sedimentary bed provides an additional criterion. 1301
Fig. 2. Geometric and dynamic configurations of hydraulic jumps. (A) The central diagram shows the 1302
theoretical relations between outgoing Froude number (Fr2), the dimensionless energy loss expressed in 1303
meters of water column (ΔH/h1) and the ratio of conjugated depths (h2/h1) as a function of the incoming 1304
Froude number (Fr1). Experiments have shown that different kinds of hydraulic jumps (B-F) occur at 1305
different incoming Froude numbers (Bradley & Peterka, 1955; Ven Te Chow, 1959; Lennon & Hill, 2006). 1306
(G) Hydraulic jumps occurring at a slope break (normal jump, kinematic energy equals potential energy), 1307
(H) downstream of a slope break (flushed jump, kinematic > potential), or (I) upstream of the slope break 1308
(submerged jump, kinematic<potential). More detailed classifications can be found in Rajaratnam (1967) 1309
and Hager (1992). 1310

52
Fig. 3. Representative idealized overview of four stages in unidirectional supercritical flows, 1311
corresponding to the development of the four kinds of bed configurations presented and defined here 1312
(flow directed from right to left; vertical scale exaggerated for clarity). Additional insets for unstable 1313
antidunes and chutes-and-pools illustrate the dynamics of associated cyclic processes. 1314
Fig. 4. Morphodynamics of stable antidune bedforms. (A) Photographs of the flow through the flume 1315
sidewall. Time t, indicated in white, corresponds to the times on the horizontal axes of graphs in B, C and 1316
D; flow direction is to the left and internal structures are indicated by black time lines. (B) Time series of 1317
vertical pixel rows extracted from the first 12000 images, plotted as a spatial panorama of the sediment 1318
bed interface and the free surface (note that flow direction is here from the right to the left, due to 1319
upstream migration). The darkest area corresponds to the background, the lightest horizontally striped 1320
area to the erodible bed and the grey area in between represents the flowing fluid. (C) Froude numbers 1321
time-series at a fixed position, corresponding to the panoramic view in B. Critical Froude number is shown 1322
by the dashed line. (D) The bed interface (continuous black) and free surface (dashed grey) comparable 1323
to B, but over the full length of the run. Correlation between the first 1200 s and the rest of the run is 1324
indicated by vertical dashed lines. E) Distribution of Froude number measured over the entire run; 1325
stippled lines show the median and 90th percentile of the Froude number distribution. (F) Plot of the 1326
spectrum of the bed interface (continuous black) and the free flow surface (dashed grey). 1327
Fig. 5. Sedimentary structures of stable antidunes produced by synthetic aggradation. (A) Depth 1328
variations of sediment bed interface (continuous black) and free flow surface (dashed grey) plotted 1329
against time. (B-D) Sedimentary structures (no vertical exaggeration) developed by the flow shown in A. 1330
Flow is from right to left. Run times indicated on the left correspond to the horizontal time axis in A. 1331
Synthetic aggradation rates are 0.24 mm/s in B, 0.12 mm/s in C and 0.03 mm/s in D. (E) Reproduction of 1332
the basal succession shown in D with a 4x vertical exaggeration. 1333
Fig. 6. Morphodynamics of unstable antidunes. Set up and methodology identical to Figure 4. (A) Camera 1334
images. Arrows indicate flow direction. (B) Time series of unstable antidunes migrating upstream. (C) Plot 1335
of the Froude number (subcritical values are marked in grey). (D) Graph of the bed interface (continuous 1336
black) and free flow surface (dashed grey line) is comparable to B, but for the full length of the run. (E) 1337
53
Distribution of Froude number over the entire flow. (F) Plot of the spectrum of both the sediment bed 1338
interface (continuous black) and the free flow surface (dashed grey). 1339
Fig. 7. Sedimentary structures of unstable antidunes produced by synthetic aggradation. (A) Depth 1340
variations of sediment bed interface (continuous black) and free surface (dashed grey) plotted against 1341
time intervals of 4 s. (B-D) Sedimentary structures developed by the flow shown in A. Flow is from right to 1342
left. Run times indicated on the left correspond to the horizontal time axis in A. Synthetic aggradation 1343
rates are 0.24 mm/s in B, 0.12 mm/s in C and 0.03 mm/s in D. (E) Reproduction of the basal succession 1344
shown in D with a 4x vertical exaggeration. 1345
Fig. 8. Morphodynamics of chutes-and-pools. Set up and methodology identical to Figure 4. (A) Camera 1346
images; arrows indicate flow direction. (B) Time series of migrating chutes-and-pools. (C) Plot of the 1347
Froude number. (D) Graph of the bed interface (continuous black) and free surface (dashed grey) is 1348
comparable to B, but for the full length of the run. (E) Distribution of Froude number over the entire flow. 1349
(F) Plot of the spectrum of both the sediment bed interface (continuous black) and the free flow surface 1350
(dashed grey). 1351
Fig. 9. Sedimentary structures of chutes-and-pools produced by synthetic aggradation. (A) Depth 1352
variations of sediment bed interface (continuous black) and free flow surface (dashed grey) plotted 1353
against time. (B-D) Sedimentary structures developed by the flow shown in A. flow is from right to left. 1354
Run times indicated on the left correspond to the horizontal time axis in A. Synthetic aggradation rates 1355
are 0.24 mm/s in B, 0.12 mm/s in C and 0.03 mm/s in D. 1356
Fig. 10. Morphodynamics of cyclic steps; set up and methodology identical to Figure 4. (A) Camera 1357
images; arrows indicate flow direction. (B) Time series of cyclic steps migrating upstream. (C) Plot of the 1358
Froude number. (D) Graph of the bed interface (continuous black) and free flow surface (dashed grey) is 1359
comparable to B, but for the full length of the run. (E) Distribution of Froude number over the entire flow. 1360
(F) Plot of the spectrum of both the sediment bed interface (continuous black) and the free flow surface 1361
(dashed grey). 1362
Fig. 11. Sedimentary structures of cyclic steps produced by synthetic aggradation. (A) Depth variations of 1363
sediment bed interface (continuous black) and free flow surface (dashed grey) plotted against time. (B-D) 1364
Sedimentary structures developed by the flow shown in A. Flow is from right to left. Run times indicated 1365

54
on the left correspond to the horizontal time axis in A. Synthetic aggradation rates are 0.24 mm/s in B, 1366
0.12 mm/s in C and 0.03 mm/s in D. 1367
Fig. 12. Extended bedform stability diagrams of (A) The diagram of Southard and Boguchwal (1990; for a 1368
0.06-0.1 m water depth and water temperature of 10 0C) and (B) Van den Berg and Van Gelder (1998). 1369
Data from this study are plotted in black. Converted literature data are added in grey (see table 2 for 1370
references). Lines added in this study are waterdepth dependent and only valid for waterdepth of 0.08 m. 1371
Symbols correspond to the different bedforms as shown in the middle of the figure. 1372
Fig. 13. (A) Ratios of U50/U90 and h10/h50 plotted per bedform and used to translate U50 and h50 indicated 1373
in the literature to U90 and h10 necessary to plot this data in Figure 12. Symbols are as defined in Figure 1374
12. (B) Comparison between the ratio h90/h10 (here interpreted as a ratio of conjugated depths h2/h1) and 1375
theoretical (Bélanger, 1928) and empirical data for hydraulic jumps on horizontal beds and submerged 1376
jumps on slope breaks of angle α (Fig. 2B; Hager, 1992). (C) Values of Fr90 plotted against θ’90 for all data 1377
points; data trends in upper-stage plane beds and antidunes versus chutes-and-pools and cyclic steps 1378
are indicated by solid grey lines. 1379
Fig. 14. (A) On the left, panorama of a cyclic step developed during run 1, in fine sand; on the right, an 1380
image of the flow over the stoss side of the same cyclic step, showing strong stratification in sediment 1381
load (traction carpet). (B) On the left, panorama of a cyclic step developed during run 9, in medium sand 1382
(detail of Fig. 11B); on the right; an image of the flow over the stoss side of the same cyclic step, showing 1383
continuous bedload transport. In all images, flow direction is from the left to the right. 1384
Fig. 15. Link between flow dynamics and sedimentary architecture for cyclic-step bedforms. (A) Series of 1385
images showing the development of sedimentary structures formed by slump failures on the steep lee 1386
side of a cyclic step formed during Run 1. Time t, indicated in white, corresponds to the times indicated in 1387
the panorama view in B. Flow direction is from the right to the left. (B) Panorama of an active cyclic step 1388
in fine sand, showing a sequence of slumps developing on the lee side. The flow pattern is indicated by 1389
white arrows. (C) Synthetic sedimentary structures developed over the first 2000 s of Run 1, with an 1390
aggradation rate of 0.5 mm/s. ‘Banana-shaped’ deposits related to slump, triggered by liquefaction, either 1391
internally deformed or structureless, are highlighted in dark grey. 1392

55
Fig. 16. Sedimentary structures in the literature on supercritical-flow bedforms, from previous 1393
experimental work and outcrop examples from alluvial (Fielding, 2006), proglacial (Duller et al., 2008) and 1394
volcanic settings (Schminke et al., 1973). The bottom panel in shows sedimentary structures associated 1395
with supercritical flows including structures formed by supercritical saline underflows over crushed coal 1396
beds (Hand, 1974), antidunes and chutes-and-pools formed by supercritical flows on sand beds 1397
(Middleton,1965; Yokokawa et al., 2010; Alexander et al., 2001). 1398
Movie S1. Comparison between the direct observations and the synthetic architecture for stable 1399
antidunes. 1400
Movie S2. Comparison between the direct observations and the synthetic architecture for unstable 1401
antidunes. 1402
Movie S3. Comparison between the direct observations and the synthetic architecture for chutes-and-1403
pools. 1404
Movie S4. Comparison between the direct observations and the synthetic architecture for cyclic steps. 1405
1406
1407