morphology and detection of corrosion on stainless steel
TRANSCRIPT

University of South Florida University of South Florida
Scholar Commons Scholar Commons
Graduate Theses and Dissertations Graduate School
June 2019
Morphology and Detection of Corrosion on Stainless Steel Morphology and Detection of Corrosion on Stainless Steel
Reinforcement in Concrete Reinforcement in Concrete
Julio J. Saire Yanez University of South Florida, [email protected]
Follow this and additional works at: https://scholarcommons.usf.edu/etd
Part of the Civil Engineering Commons
Scholar Commons Citation Scholar Commons Citation Saire Yanez, Julio J., "Morphology and Detection of Corrosion on Stainless Steel Reinforcement in Concrete" (2019). Graduate Theses and Dissertations. https://scholarcommons.usf.edu/etd/7922
This Thesis is brought to you for free and open access by the Graduate School at Scholar Commons. It has been accepted for inclusion in Graduate Theses and Dissertations by an authorized administrator of Scholar Commons. For more information, please contact [email protected].
Morphology and Detection of Corrosion on Stainless Steel Reinforcement in Concrete
by
Julio J Saire Yanez
A thesis submitted in partial fulfillment of the requirements for the degree of Master of Science in Civil Engineering
with a concentration in Structures Department of Civil and Environmental Engineering
College of Engineering University of South Florida
Co-Major Professor: Alberto A. Sagüés, Ph.D. Co-Major Professor: Christopher L. Alexander, Ph.D.
Rajan Sen, Ph.D.
Date of Approval: June 21, 2019
Keywords: Corrosion Resistant Alloys, Reinforced Concrete, Electrochemistry, Propagation Stage, Durability
Copyright © 2019, Julio J Saire Yanez

DEDICATION
Dedicated to my parents Aurora Yanez and Julian Saire, family, Peruvian nation,
Quechua Culture, the Inca Empire legacy, and friends with gratitude for inspiring the idea
of exploring the world, and breaking barriers.

ACKNOWLEDGEMENTS
The author is indebted to the co-major professors: distinguished professor Alberto
Sagüés Ph.D. and Christopher Alexander Ph.D. for their continual guidance and
encouragement. I would also like to express my gratitude to professor Rajan Sen, Ph.D.
for his invaluable advice, and time.
In addition, I would like to thank my parents Aurora and Julian whom encouraged
me to follow my dreams.
The author thanks the Peruvian Government for sponsoring students to study
abroad and expand their knowledge.
The literature review as well its findings were a collaborative work Drs. Sagües and
Alexander Ph.D. as a part of a research project supported by the Florida Department of
Transportation.
The opinions, findings, and conclusions expressed in this document are those of
the author and not necessarily those of any supporting organization.
i
TABLE OF CONTENTS TABLE OF CONTENTS
List of Tables……. .................................................................................................... v
List of Figures…… ...................................................................................................vii
Abstract………….. .................................................................................................... x
Chapter 1: Introduction ..............................................................................................1
1.1. Overview .................................................................................................1
1.2. Objective Statement .................................................................................4
1.3. Approach .................................................................................................4
1.4. Corrosion Process in Reinforced Concrete Structures.................................5
1.4.1. Electrochemical Reactions ...........................................................6
1.4.1.1. Anodic Reaction .............................................................6
1.4.1.2. Cathodic Reaction ..........................................................7
1.4.2. Corrosion Morphology of Concrete Reinforcement .........................7
1.4.2.1. Uniform Corrosion...........................................................7
1.4.2.2. Localized Corrosion ........................................................7
1.4.3. Penetration Rate .........................................................................8
1.5. Steel Reinforcement in Concrete ...............................................................9
1.5.1. Stainless Steel ............................................................................9
1.5.1.1. Chemistry of the Corrosion Resistant Alloys ................... 10
1.5.1.2. Estimation of the Corrosion Resistance of SS ................. 10
1.5.1.3. Martensitic Stainless Steel ............................................ 11
1.5.2. Carbon Steel ............................................................................. 11
1.6. Service Life of a Concrete Structure ........................................................ 12
1.6.1. Corrosion Initiation Stage (CIS) .................................................. 13
1.6.1.1. Concrete Cover Thickness (X) ....................................... 13
1.6.1.2. Diffusion Coefficient (D) ................................................ 13
1.6.1.3. Chloride Threshold (CT) ................................................ 14
1.6.1.4. Surface Concentration Chloride (Cs) .............................. 14
1.6.2. Corrosion Propagation Stage (CPS) ........................................... 14
1.6.2.1. Critical Concrete Cover (Xcrit) ....................................... 14
1.6.2.2. Duration of Corrosion Propagation Stage (TP) ................ 15
1.7. Electrochemical Corrosion Techniques .................................................... 15
1.7.1. Half-cell Potential Method .......................................................... 16
1.7.1.1. Potential Maps.............................................................. 16
1.7.2. Electrochemical Impedance Spectroscopy (EIS) .......................... 17
1.7.2.1. Equivalent Electric Circuit for Steel Reinforcements in Concrete..................................................................... 18
1.7.2.2. Corrosion Rates by Using EIS ....................................... 19
ii
1.7.3. Resistivity of Concrete ............................................................... 20
Chapter 2: Review of Propagation Stage Literature for SS ......................................... 22
2.1. SS Reinforcement in Actual Structural Service ......................................... 23
2.1.1. Progreso Pier, Mexico................................................................ 25
2.1.1.1. Background .................................................................. 25
2.1.1.2. Investigations of Corrosion Performance at the Progreso Pier ................................................................. 27
2.1.1.3. Summary ..................................................................... 32
2.1.2. Bridge S03 of WB I-696 over Lenox Road, Michigan .................... 35
2.1.2.1. Summary ..................................................................... 35
2.1.3. I-295 over Arena Drive Bridge (Southbound), Trenton, New Jersey ........................................................................................... 36
2.1.3.1. Summary ..................................................................... 36
2.1.4. Mullet Creek Bridge, Ontario Canada .......................................... 36
2.1.4.1. Summary ..................................................................... 37
2.1.5. Millennium Bridge, South Africa .................................................. 37
2.1.5.1. Summary ..................................................................... 38
2.1.6. Bridge A6059 in Grundy County, Missouri ................................... 38
2.1.6.1. Summary ..................................................................... 39
2.1.7. Doniphan County and Mission Creek Bridge, Kansas................... 39
2.1.7.1. Summary ..................................................................... 40
2.1.8. Ceiling and Air Channels Collapsed in Swimming Pool ................ 40
2.1.8.1. Uster, Switzerland 1985 ................................................ 40
2.1.8.2. Steenwijk, The Netherlands, 2001.................................. 41
2.1.8.3. Tilburg, The Netherlands 2011....................................... 41
2.1.8.4. Summary ..................................................................... 41
2.2. Exposure of SS-Reinforced Concrete Samples to External/Service Environments ......................................................................................... 41
2.2.1. British Building Research Establishment (BBRE) Investigations ................................................................................ 41
2.2.1.1. Langstone Harbour, England ......................................... 42
2.2.1.2. Beckton, East London ................................................... 43
2.2.1.3. Beckton, East London (Continued) and Hurst Castle ....... 45
2.2.2. Treat Island, ME, USA ............................................................... 46
2.2.3. Durban Bluff Coastal Site, South Africa ....................................... 48
2.2.4. Highway A13 Tunnel – Switzerland............................................. 49
2.2.5. Florida Ponded SS-Reinforced Concrete Exposed Outdoors ........ 50
2.3. SS in Concrete or Simulated Pore Solutions in Controlled Laboratory Conditions .............................................................................................. 50
2.3.1. Pit Growth on SS Rebar in Simulated Pore Water and Propagation Stage Modeling........................................................... 50
2.3.2. Initiation/Propagation Stages of SS-reinforced Concrete .............. 53
2.3.3. Completion of Propagation Stage in Florida Ponded SS-Reinforced Concrete ...................................................................... 55
2.3.3.1. The First Exposure Class .............................................. 55
2.3.3.2. The Second Exposure Class ......................................... 56

iii
2.3.3.3. The Third Exposure Class ............................................. 57
2.3.4. Performance of Austenitic and Duplex SS in Cracked Concrete ....................................................................................... 59
Chapter 3: Experimental Methodology...................................................................... 61
3.1. Overview ............................................................................................... 61
3.2. Materials................................................................................................ 62
3.2.1. Reinforcing Steel ....................................................................... 62
3.2.2. Concrete ................................................................................... 63
3.3. Specimen Preparation ............................................................................ 64
3.4. Measurements ....................................................................................... 69
3.4.1. Potential Maps .......................................................................... 69
3.4.2. Electrochemical Impedance Spectroscopy (EIS) .......................... 70
3.4.3. Resistivity of Concrete ............................................................... 71
Chapter 4: Results .................................................................................................. 73
4.1. Overview ............................................................................................... 73
4.2. Potential Maps ....................................................................................... 73
4.3. Electrochemical Impedance Spectroscopy ............................................... 82
4.4. Resistivity of Concrete ............................................................................ 96
Chapter 5: Discussion ............................................................................................. 98
5.1. Overview ............................................................................................... 98
5.2. Discussion Based on Literature Review ................................................... 98
5.2.1. Observations on Duration of the Corrosion Propagation Stage ............................................................................................ 98
5.2.1.1. SS Rebar in Bridges in Service ...................................... 98
5.2.1.2. Environmental Exposure ............................................. 101
5.2.1.3. SS Laboratory Investigations ....................................... 103
5.2.2. Observations on Methods of Detection and Measurement of Corrosion of SS Reinforcement .................................................... 105
5.3. Discussion Based on Experimental Results............................................ 107
5.3.1. Discussion on Potential Maps Results....................................... 107
5.3.2. Discussion on Electrochemical Impedance Spectroscopy Results ....................................................................................... 108
5.3.3. Discussion on Resistivity of Concrete Results ........................... 110
5.3.4. Recommendations for Future Work .......................................... 111
Chapter 6: Conclusions ......................................................................................... 113
References…….. .................................................................................................. 115
Appendix A: Selected Research Publications on SS Rebar in Concrete - .Chronological Order ........................................................................... 123
Appendix B: Bridges & Related Structures Reinforced with SS ................................ 126

iv
Appendix C: American European Steel Grade Designations .................................... 129 About the Author………………………………………………………………...........End Page
v
LIST OF TABLES
Table 1.1 Criteria to Evaluate the Corrosion Potential Results.................................... 16
Table 1.2 Criteria to Evaluate Concrete Resistivity Results ........................................ 21
Table 2.1 Accelerated Chloride Ingress Tests ........................................................... 56
Table 3.1 Investigated Steels................................................................................... 62
Table 3.2 Chemical Composition of Stainless Steel (Weight Percent). ........................ 62
Table 3.3 Chemical Composition of Carbon Steel (Weight Percent)............................ 62
Table 3.4 Concrete Class IV - FDOT Design Requirements ....................................... 63
Table 3.5 Chloride Free Concrete - Mix Proportions .................................................. 63
Table 3.6 Chloride Contaminated Concrete - Mix Proportions .................................... 64
Table 4.1 Impedance Parameters: AISI1018 CS in Concrete for CSA ........................ 92
Table 4.2 Impedance Parameters: AISI1018 CS in Concrete for CSB ........................ 92
Table 4.3 Impedance Parameters: AISI1018 CS in Concrete for CSC ........................ 92
Table 4.4 Impedance Parameters: UNSS41000 SS in Concrete for SS01................... 93
Table 4.5 Impedance Parameters: UNSS41000 SS in Concrete for SS02................... 93
Table 4.6 Impedance Parameters for UNSS41000 SS in Concrete for SS03............... 93
Table 4.7 Nominal Duration of CPS for AISI1018 CS in Concrete for CSA .................. 94
Table 4.8 Nominal Duration of CPS for AISI1018 CS in Concrete for CSB .................. 94
Table 4.9 Nominal Duration of CPS for AISI1018 CS in Concrete for CSC .................. 94
Table 4.10 Nominal Duration of CPS for UNSS41000 SS in Concrete for SS01 .......... 95
Table 4.11 Nominal Duration of CPS for UNSS41000 SS in Concrete for SS02 .......... 95
Table 4.12 Nominal Duration of CPS for UNSS41000 SS in Concrete for SS03 .......... 95
vi
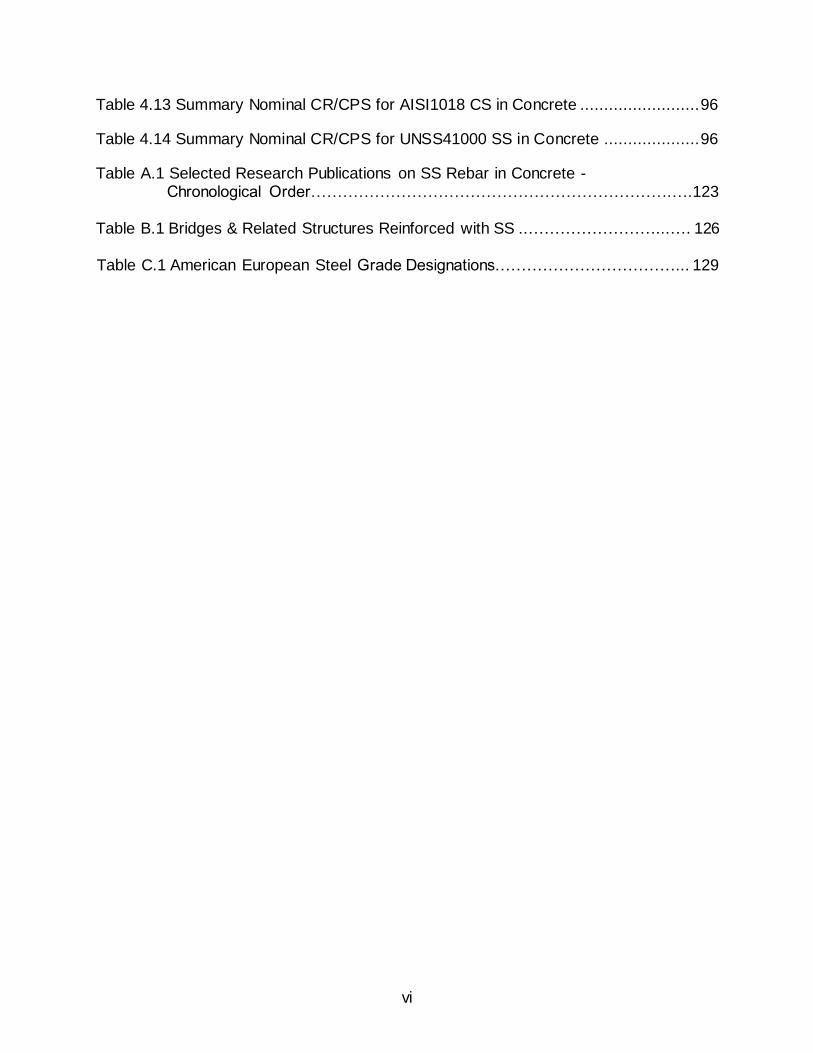
Table 4.13 Summary Nominal CR/CPS for AISI1018 CS in Concrete ......................... 96
Table 4.14 Summary Nominal CR/CPS for UNSS41000 SS in Concrete .................... 96
Table A.1 Selected Research Publications on SS Rebar in Concrete - Chronological Order…………………………………………………………..….123 Table B.1 Bridges & Related Structures Reinforced with SS ..……………………...…. 126
Table C.1 American European Steel Grade Designations.……………………………... 129
vii
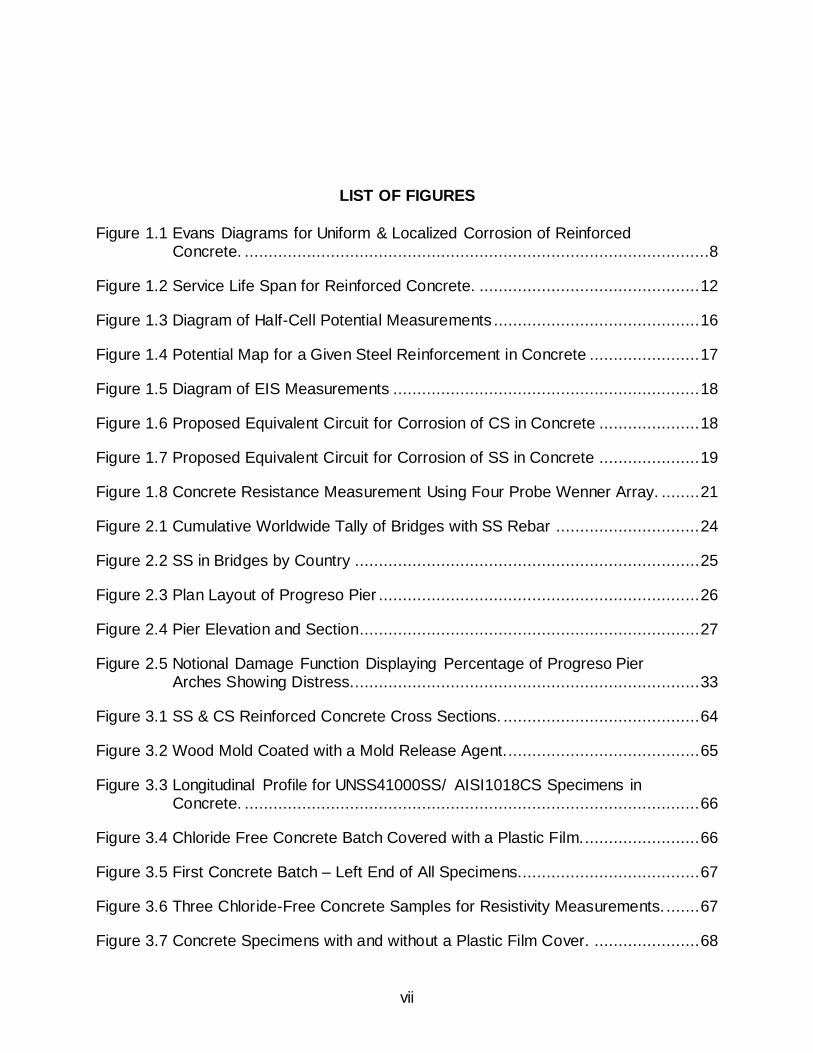
LIST OF FIGURES
Figure 1.1 Evans Diagrams for Uniform & Localized Corrosion of Reinforced Concrete. .................................................................................................8
Figure 1.2 Service Life Span for Reinforced Concrete. .............................................. 12
Figure 1.3 Diagram of Half-Cell Potential Measurements ........................................... 16
Figure 1.4 Potential Map for a Given Steel Reinforcement in Concrete ....................... 17
Figure 1.5 Diagram of EIS Measurements ................................................................ 18
Figure 1.6 Proposed Equivalent Circuit for Corrosion of CS in Concrete ..................... 18
Figure 1.7 Proposed Equivalent Circuit for Corrosion of SS in Concrete ..................... 19
Figure 1.8 Concrete Resistance Measurement Using Four Probe Wenner Array. ........ 21
Figure 2.1 Cumulative Worldwide Tally of Bridges with SS Rebar .............................. 24
Figure 2.2 SS in Bridges by Country ........................................................................ 25
Figure 2.3 Plan Layout of Progreso Pier ................................................................... 26
Figure 2.4 Pier Elevation and Section....................................................................... 27
Figure 2.5 Notional Damage Function Displaying Percentage of Progreso Pier Arches Showing Distress......................................................................... 33
Figure 3.1 SS & CS Reinforced Concrete Cross Sections. ......................................... 64
Figure 3.2 Wood Mold Coated with a Mold Release Agent......................................... 65
Figure 3.3 Longitudinal Profile for UNSS41000SS/ AISI1018CS Specimens in Concrete. ............................................................................................... 66
Figure 3.4 Chloride Free Concrete Batch Covered with a Plastic Film......................... 66
Figure 3.5 First Concrete Batch – Left End of All Specimens...................................... 67
Figure 3.6 Three Chloride-Free Concrete Samples for Resistivity Measurements. ....... 67
Figure 3.7 Concrete Specimens with and without a Plastic Film Cover. ...................... 68
viii
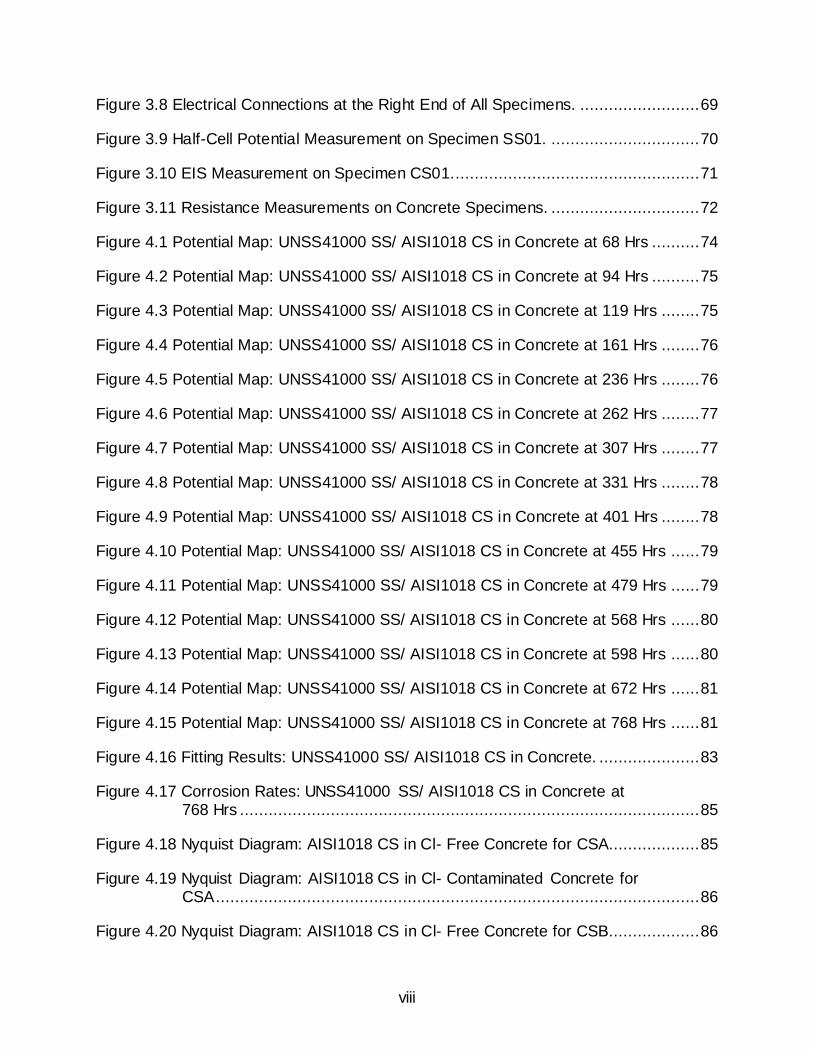
Figure 3.8 Electrical Connections at the Right End of All Specimens. ......................... 69
Figure 3.9 Half-Cell Potential Measurement on Specimen SS01. ............................... 70
Figure 3.10 EIS Measurement on Specimen CS01.................................................... 71
Figure 3.11 Resistance Measurements on Concrete Specimens. ............................... 72
Figure 4.1 Potential Map: UNSS41000 SS/ AISI1018 CS in Concrete at 68 Hrs .......... 74
Figure 4.2 Potential Map: UNSS41000 SS/ AISI1018 CS in Concrete at 94 Hrs .......... 75
Figure 4.3 Potential Map: UNSS41000 SS/ AISI1018 CS in Concrete at 119 Hrs ........ 75
Figure 4.4 Potential Map: UNSS41000 SS/ AISI1018 CS in Concrete at 161 Hrs ........ 76
Figure 4.5 Potential Map: UNSS41000 SS/ AISI1018 CS in Concrete at 236 Hrs ........ 76
Figure 4.6 Potential Map: UNSS41000 SS/ AISI1018 CS in Concrete at 262 Hrs ........ 77
Figure 4.7 Potential Map: UNSS41000 SS/ AISI1018 CS in Concrete at 307 Hrs ........ 77
Figure 4.8 Potential Map: UNSS41000 SS/ AISI1018 CS in Concrete at 331 Hrs ........ 78
Figure 4.9 Potential Map: UNSS41000 SS/ AISI1018 CS in Concrete at 401 Hrs ........ 78
Figure 4.10 Potential Map: UNSS41000 SS/ AISI1018 CS in Concrete at 455 Hrs ...... 79
Figure 4.11 Potential Map: UNSS41000 SS/ AISI1018 CS in Concrete at 479 Hrs ...... 79
Figure 4.12 Potential Map: UNSS41000 SS/ AISI1018 CS in Concrete at 568 Hrs ...... 80
Figure 4.13 Potential Map: UNSS41000 SS/ AISI1018 CS in Concrete at 598 Hrs ...... 80
Figure 4.14 Potential Map: UNSS41000 SS/ AISI1018 CS in Concrete at 672 Hrs ...... 81
Figure 4.15 Potential Map: UNSS41000 SS/ AISI1018 CS in Concrete at 768 Hrs ...... 81
Figure 4.16 Fitting Results: UNSS41000 SS/ AISI1018 CS in Concrete. ..................... 83
Figure 4.17 Corrosion Rates: UNSS41000 SS/ AISI1018 CS in Concrete at ..768 Hrs ................................................................................................ 85
Figure 4.18 Nyquist Diagram: AISI1018 CS in Cl- Free Concrete for CSA................... 85
Figure 4.19 Nyquist Diagram: AISI1018 CS in Cl- Contaminated Concrete for ..CSA ..................................................................................................... 86
Figure 4.20 Nyquist Diagram: AISI1018 CS in Cl- Free Concrete for CSB................... 86
ix
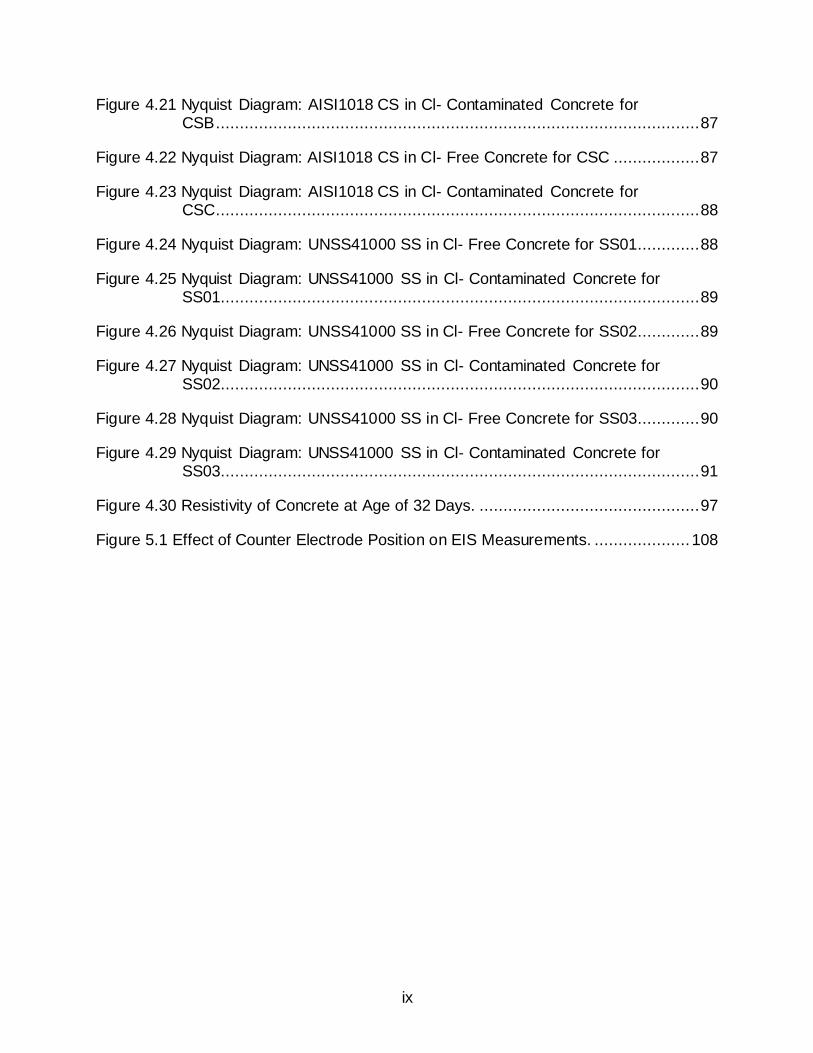
Figure 4.21 Nyquist Diagram: AISI1018 CS in Cl- Contaminated Concrete for ..CSB ..................................................................................................... 87
Figure 4.22 Nyquist Diagram: AISI1018 CS in Cl- Free Concrete for CSC .................. 87
Figure 4.23 Nyquist Diagram: AISI1018 CS in Cl- Contaminated Concrete for ..CSC ..................................................................................................... 88
Figure 4.24 Nyquist Diagram: UNSS41000 SS in Cl- Free Concrete for SS01............. 88
Figure 4.25 Nyquist Diagram: UNSS41000 SS in Cl- Contaminated Concrete for ..SS01.................................................................................................... 89
Figure 4.26 Nyquist Diagram: UNSS41000 SS in Cl- Free Concrete for SS02............. 89
Figure 4.27 Nyquist Diagram: UNSS41000 SS in Cl- Contaminated Concrete for ..SS02.................................................................................................... 90
Figure 4.28 Nyquist Diagram: UNSS41000 SS in Cl- Free Concrete for SS03............. 90
Figure 4.29 Nyquist Diagram: UNSS41000 SS in Cl- Contaminated Concrete for ..SS03.................................................................................................... 91
Figure 4.30 Resistivity of Concrete at Age of 32 Days. .............................................. 97
Figure 5.1 Effect of Counter Electrode Position on EIS Measurements. .................... 108
x
ABSTRACT
Stainless steel (SS) has emerged as an alternative corrosion-resistant
reinforcement in concrete instead of the commonly used carbon steel (CS). The biggest
advantage of SS is that it takes more time for corrosion to initiate than for CS. An
additional benefit from the use of SS in concrete may be derived from the period after the
corrosion started until the concrete structure reaches a limit state. This period is called
corrosion propagation stage (CPS) and it has been hardly studied in SS reinforced
structures. The duration of this period could be related, among other factors, to the
morphology of corrosion of stainless steel in concrete. In some instances, the corrosion
detection methods for CS have been used on SS reinforced structures to estimate the
corrosion condition. However, there is uncertainty if these methods can detect corrosion
in SS reinforced structures properly. This investigation was organized in two parts:
literature review and experimental work.
The literature review indicated among other findings that the duration of the CPS
of SS’s embedded in concrete may be estimated to be in the order of several decades.
High-grade SS’s would have a longer duration of the CPS. The review also indicated that
even localized corrosion of SS reinforcement may induce concrete cracking. The
literature also suggested that the corrosion detection on SS reinforced concrete may
require a combination of conventional methods (half-cell potential) and advanced
electrochemical techniques such as Electrochemical Impedance Spectroscopy,
Electrochemical noise, etc.
xi
The experimental work focused on further determining whether corrosion of SS in
concrete can be detected by methods traditionally used for CS reinforcement, and to what
extent localization of corrosion of SS compares with that of CS in concrete. The
experiments consisted in accelerated corrosion testing of controlled anodic regions along
concrete beams, for which tests were designed and initiated.
Martensitic UNS S41000 SS bars were partially embedded in chloride
contaminated concrete (5.84% by weight of cement) to cause active corrosion. AISI 1018
CS was also used for comparison purposes. Traditional half-cell potential measurements
on the reinforced concrete specimens were evaluated in comparison to that of advanced
electrochemical impedance spectroscopy. Additional concrete resistivity monitoring gave
an indication of the degree of the pore structure formation.
The traditional half-cell potential measurements on AISI 1018 CS reinforced
concrete specimens appeared to be suitable to estimate the corrosion state of the
reinforcement. However, there was uncertainty on the interpretation of the half-cell
potential results and thus the corrosion state of UNS S41000 SS reinforced concrete
specimens.
Low-dispersion corrosion rates values were found over large areas on SS and CS
bars in concrete, but that SS embedded in concrete also seemed to develop instances of
corrosion rate peaks. Among other findings, the duration of CPS of CS in concrete was
estimated to be in the interval [6-59] years. Assuming that the CPS had been reached,
SS specimens in concrete appeared to have a much longer duration of CPS than CS,
with an interval [57-253] years. However, this assumption is likely not valid and more work
is required to assess the CPS of SS reinforced concrete.
1
CHAPTER 1: INTRODUCTION
1.1. Overview
Stainless steel (SS) reinforced concrete has become an alternative corrosion-
resistant solution instead of the traditional carbon steel (CS) in concrete. The corrosion
process involves two stages: initiation and propagation. During the initiation stage,
aggressive substances (e.g., chloride ions) penetrate the concrete cover from the outside
and accumulate at the steel surface, eventually triggering the start of active steel
corrosion. During the propagation stage, the corrosion of the concrete reinforcement
creates expansive corrosion products that cause cracking of the concrete and associated
structural deterioration. The service life span of the reinforced concrete can then be
viewed as the sum of the durations of the initiation and the propagation stages.
Stainless steels in concrete have a much longer corrosion initiation stage (CIS)
than carbon steel in concrete [1, 2]. However, there is uncertainty about the duration of
the corrosion propagation stage (CPS) of SS. The duration of the CPS may depend on,
but not limited to, corrosion that is uniform or localized [3]. Uniform corrosion of carbon
steel often results in cracking of concrete due to accumulation of expansive corrosion
products. However, if the corrosion of SS is localized, tensile failure of the reinforcement
due to loss of cross sectional area could possibly occur before concrete cracking.
For several decades now, the corrosion of carbon steel reinforcement in concrete
has been traditionally detected by using half-cell potential measurements standardized in
the document ASTM C876 [4]. This method quantifies the electric potential shift between
2
the corroding spots on the steel surface and a given reference electrode [5]. The output
data may give the localization of corrosion, an indication of the state of corrosion, but no
indication of corrosion rate is given. A common application of the previous method is
potential mapping, which uses several half-cell potential measurements over large
concrete surfaces (e.g. concrete decks, columns) [6].
Half-cell potential method may be limited when the corrosion is localized because
potential readings can be influenced by the concrete cover depth and resistivity of
concrete [7]. The potential difference becomes smaller as the concrete cover increases.
In low resistivity concrete, (e.g. wet concrete) the difference in potential developed by
localized corrosion is pronounced and it is easy to detect. However, in high resistivity
concrete (e.g. dry concrete), localized corrosion does polarize small surrounding areas
and the difference in potential is difficult to detect. This technique has also been used on
SS reinforced structures in some instances [7]. Nevertheless, the corrosion morphology
may be localized on stainless steel [3], and the half-cell potential method might fail to
detect highly negative corrosion potentials. Fortunately, specialized electrochemical
impedance spectroscopy method may serve for verification of the information gained from
half-cell potential measurements.
The corrosion rate can be estimated from electrochemical impedance
spectroscopy (EIS) measurements [8]. This non-destructive method is convenient among
others when complicating factors such as (non-uniform corrosion, presence of interfacial
capacitance) are present [9]. In addition, EIS method can be performed in either
galvanostatic or potentiostatic mode. EIS measurements in potentiostatic mode are more
often performed on corrosion-resistant materials. These materials have a higher
3
impedance, and then the application of an electric excitation (usually 10 mV) results in a
smaller response. Conversely, in a low- impedance material, the application of the electric
excitation may change the corrosion state of the specimen [10]. As a result, such
technology may merit exploration to achieve the objectives of this investigation.
Currently, Oregon DOT and Virginia DOT are incorporating SS in their concrete
structures to reach longer durations of the corrosion initiation stage than that of carbon
steel. However, a major concern of using SS is its susceptibility to localized corrosion,
which may or may not induce concrete cracking [11]. The degree of corrosion is uncertain
but estimated to be localized in SS compared to CS embedded in concrete, which may
be uniform. Therefore, research is required to quantify the corrosion morphology of
stainless steel in concrete.
Although other methods can be used to estimate corrosion rates, this study uses
the EIS method in the potentiostatic mode for the reasons previously described.
Additionally, chloride contaminated concrete was used to accelerate the reinforcement
corrosion and to study the corrosion propagation stage on both types of steel. Finally, the
structure of this investigation is divided into 6 chapters. Chapter 1 describes the concepts
related to the investigation. Chapter 2 discusses the literature review outlining cases
where SS was used as a concrete reinforcement in three exposure conditions: structural
service, controlled external exposure, and laboratory conditions. Chapter 3 explains the
experimental work carried out in the project. Chapter 4 lists the results of the investigation.
Chapter 5 discusses the results outlined in the previous chapter and chapter 6 lists the
conclusions of the investigation.
4
1.2. Objective Statement
The objectives of this investigation are: first, to find scholarly evidence on the
duration of the corrosion propagation stage of stainless steel in concrete, associated
corrosion morphology and, methods of detection. Second, to determine whether the
corrosion of stainless steel in concrete can be detected by methods traditionally used for
carbon steel reinforcement, and to what extent localization of corrosion of stainless steel
compares to that of carbon steel in concrete.
1.3. Approach
To address the objectives, the following tasks were conducted:
1. A literature review was conducted to determine in which investigations of
SS in concrete, the end of the corrosion initiation stage was reached, and if
so, whether the end of the propagation stage had been reached as well.
Three different test exposures were considered: actual structural service,
test specimens under controlled external environments, and SS specimens
in concrete or in simulated pore solutions under laboratory conditions. The
literature review also examined the available evidence on how the onset of
corrosion of SS can be detected by methods traditionally used for carbon
steel rebar.
2. Experiments consisting of concrete beams were designed and initiated to
address the second and third objective. Steel reinforced concrete
specimens of dimensions (5 cm wide, 6.4 cm height and ~180 cm long)
were prepared in the corrosion laboratory at the University of South Florida.
Specimens were reinforced with ~6-feet long, 0.5” diameter, UNS S41000

5
SS and type AISI 1018 CS round bars. Each specimen was partially
embedded in chloride free concrete (at the ends of the specimens) and
chloride contaminated concrete (at the central area of the specimens)
containing 1% (by weight of concrete) of admixed chloride. AISI 1018 CS
was studied for comparison purposes. Additional concrete resistivity
monitoring gave an indication of the degree of the pore structure formation.
The chloride admixed concrete was used to facilitate the initiation of active
corrosion of the reinforcement and thus to study the corrosion propagation
stage.
3. Half-cell potential measurements, traditionally used for carbon steel
reinforcement, were evaluated in comparison to that of electrochemical
impedance spectroscopy to examine if corrosion of stainless steel can be
detected by this method.
4. Corrosion rate measurements as well as half-cell potential measurements
were performed on reinforced concrete specimens as a function of position
to study the extent at which the localization of corrosion of stainless steel
compares with that of carbon steel in concrete.
1.4. Corrosion Process in Reinforced Concrete Structures
Concrete deterioration can occur due to the surrounding environment (e.g.
temperature changes), its constituent elements (e.g. aggregates or cement) and by the
corrosion of reinforcing steel [12]. Carbon steel reinforcement in concrete (high alkalinity
environment [13]) develops an oxide layer also known as a passive film in response to
the corrosion process. The reinforcing steel corrodes when the passive film is destroyed
6
mainly by the chloride attack or concrete carbonation [14]. Chloride-related deterioration
is commonly seen in the structures exposed to marine environment conditions.
The necessary components for corrosion of the steel reinforcement are: electrolyte
(pore water in the paste), an electronic path (reinforcing steel), and two electrochemical
reactions: anodic reaction sustained in the corroding areas and cathodic reaction located
in the non-corroding areas [12]. These two electrochemical reactions will be explained in
section 1.4.1.
1.4.1. Electrochemical Reactions
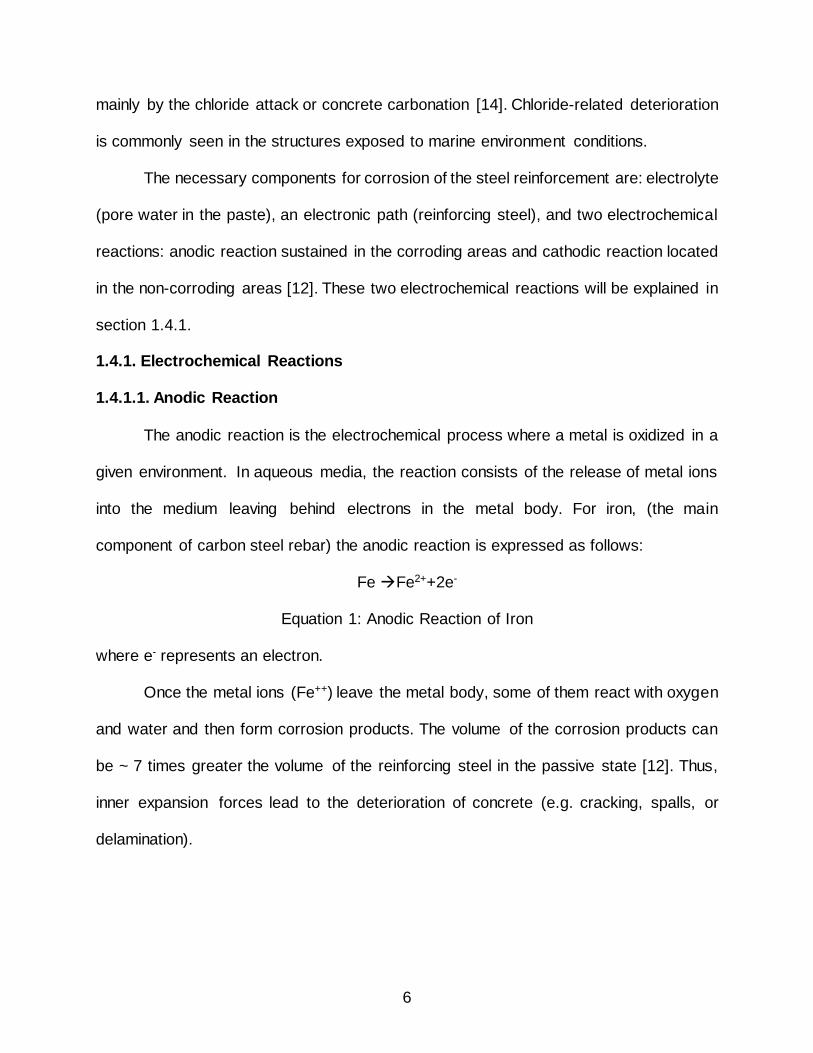
1.4.1.1. Anodic Reaction
The anodic reaction is the electrochemical process where a metal is oxidized in a
given environment. In aqueous media, the reaction consists of the release of metal ions
into the medium leaving behind electrons in the metal body. For iron, (the main
component of carbon steel rebar) the anodic reaction is expressed as follows:
Fe Fe2++2e-
Equation 1: Anodic Reaction of Iron
where e- represents an electron.
Once the metal ions (Fe++) leave the metal body, some of them react with oxygen
and water and then form corrosion products. The volume of the corrosion products can
be ~ 7 times greater the volume of the reinforcing steel in the passive state [12]. Thus,
inner expansion forces lead to the deterioration of concrete (e.g. cracking, spalls, or
delamination).
7
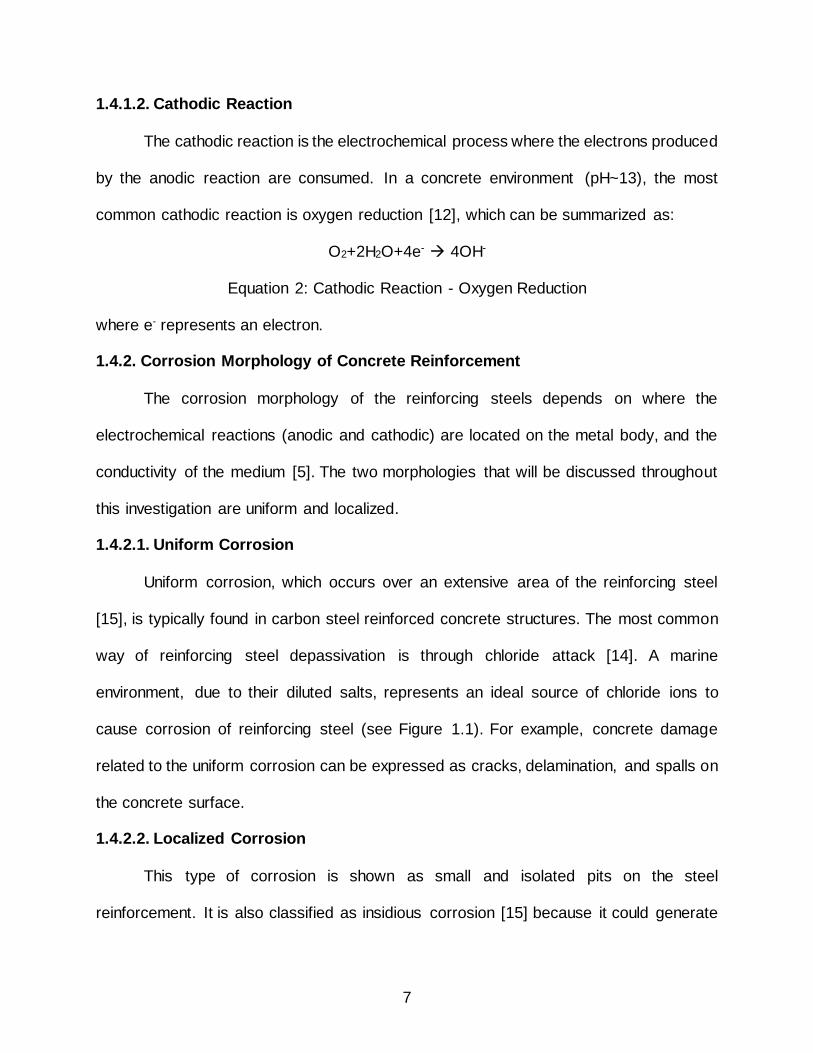
1.4.1.2. Cathodic Reaction
The cathodic reaction is the electrochemical process where the electrons produced
by the anodic reaction are consumed. In a concrete environment (pH~13), the most
common cathodic reaction is oxygen reduction [12], which can be summarized as:
O2+2H2O+4e- 4OH-
Equation 2: Cathodic Reaction - Oxygen Reduction
where e- represents an electron.
1.4.2. Corrosion Morphology of Concrete Reinforcement
The corrosion morphology of the reinforcing steels depends on where the
electrochemical reactions (anodic and cathodic) are located on the metal body, and the
conductivity of the medium [5]. The two morphologies that will be discussed throughout
this investigation are uniform and localized.
1.4.2.1. Uniform Corrosion
Uniform corrosion, which occurs over an extensive area of the reinforcing steel
[15], is typically found in carbon steel reinforced concrete structures. The most common
way of reinforcing steel depassivation is through chloride attack [14]. A marine
environment, due to their diluted salts, represents an ideal source of chloride ions to
cause corrosion of reinforcing steel (see Figure 1.1). For example, concrete damage
related to the uniform corrosion can be expressed as cracks, delamination, and spalls on
the concrete surface.
1.4.2.2. Localized Corrosion
This type of corrosion is shown as small and isolated pits on the steel
reinforcement. It is also classified as insidious corrosion [15] because it could generate
8
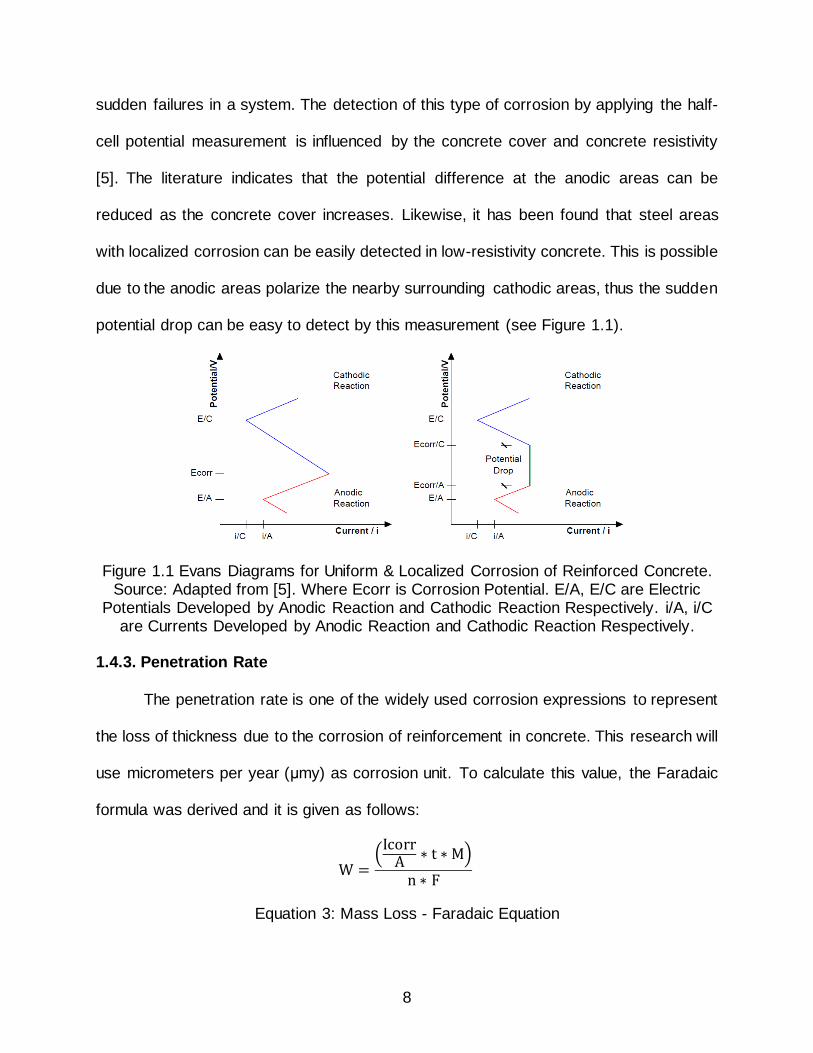
sudden failures in a system. The detection of this type of corrosion by applying the half-
cell potential measurement is influenced by the concrete cover and concrete resistivity
[5]. The literature indicates that the potential difference at the anodic areas can be
reduced as the concrete cover increases. Likewise, it has been found that steel areas
with localized corrosion can be easily detected in low-resistivity concrete. This is possible
due to the anodic areas polarize the nearby surrounding cathodic areas, thus the sudden
potential drop can be easy to detect by this measurement (see Figure 1.1).
Figure 1.1 Evans Diagrams for Uniform & Localized Corrosion of Reinforced Concrete. Source: Adapted from [5]. Where Ecorr is Corrosion Potential. E/A, E/C are Electric
Potentials Developed by Anodic Reaction and Cathodic Reaction Respectively. i/A, i/C are Currents Developed by Anodic Reaction and Cathodic Reaction Respectively.
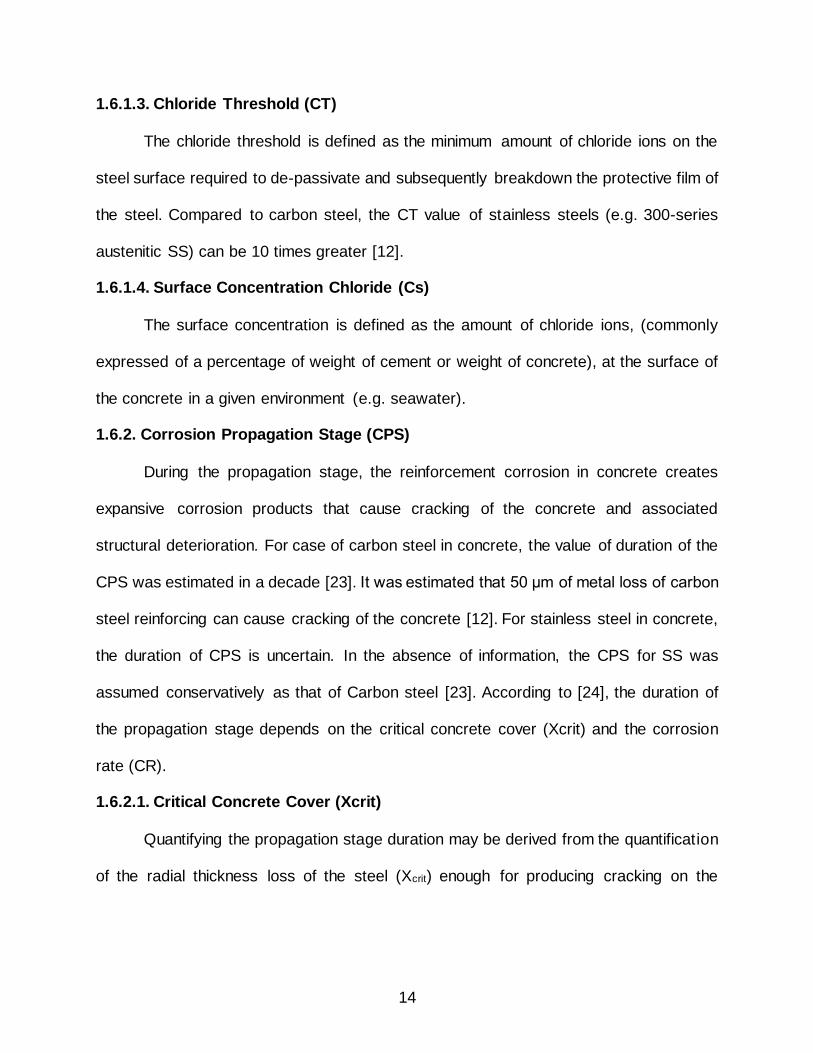
1.4.3. Penetration Rate
The penetration rate is one of the widely used corrosion expressions to represent
the loss of thickness due to the corrosion of reinforcement in concrete. This research will
use micrometers per year (μmy) as corrosion unit. To calculate this value, the Faradaic
formula was derived and it is given as follows:
W =(
IcorrA ∗ t ∗ M)
n ∗ F
Equation 3: Mass Loss - Faradaic Equation

9
CR =W ∗ 104
d
Equation 4: Corrosion Rate Equation with Units in μmy
where: “W” is the mass loss (g), “Icorr” is the current density in the anodic reaction
(A/cm2). “A” is the estimated anodic area on the reinforcing steel in concrete (cm2). “t” is
the time and it is given per one year (s). “n” Valence of the metal and it is assumed n=2
for Iron (Fe). “F” is the Faraday constant F=96500 (coulombs per mole of electrons). “d”
is the density of the metal it is assumed d= 55.85 (g/cm3) for iron.
For a better understanding of the conversion from corrosion density to penetration
rate, examples for corrosion of carbon steel are given: 1μA/cm2 ≅ 0.45 mpy≅ 11.58 μmy.
Where, “mpy” is an additional penetration rate unit that means mils per year.
1.5. Steel Reinforcement in Concrete
1.5.1. Stainless Steel
Stainless steel is being used as reinforcement in concrete, since aggressive
environments limit the durability of carbon steel reinforced concrete. The cost of stainless
steel rebar can be five times more than that of carbon steel rebar. As a result, its use in
concrete structures has been restricted to critical elements, in which the corrosion attack
on the reinforcement is imminent (e.g. piles, decks). Specifications of stainless steel
reinforcements for concrete are stated in ASTM A955 [16].
Based on the ASTM specification [16], ferrous alloys with more than 10.5 % of
chromium content by mass, and less than 1.2 % of carbon content by mass are
considered stainless steel. It was found that the high chromium content in these alloys
promotes the formation of the protective passive layer on the steel surface under certain
10
exposure conditions. It was also found that under basic or neutral exposure conditions,
stainless steel might develop localized corrosion [17].
In this section of the investigation, three main topics on corrosion resistant steels
will be discussed. The first point seeks to describe the relationship between the
composition and the corrosion-resistant properties of the alloys. The second point
describes an approach to quantify the corrosion resistance of the alloys as a function of
their chemical components. Third, the properties of martensitic stainless steel will be
described.
1.5.1.1. Chemistry of the Corrosion Resistant Alloys
Stainless steels contain different elements that influence their corrosion resistance
properties. Chromium is the main element that increases the corrosion resistance
property of the alloy. A chromium oxide film also called passive film forms on the steel
surface protecting it from corrosion. In presence of oxygen, this passive film can auto
regenerate. [18]. Elements such as Molybdenum, Copper, and Silicon also increase the
corrosion resistance of the alloys. Others elements are added to increase their strength,
formability and weldability such as, the Carbon, Nickel and Nitrogen [19].
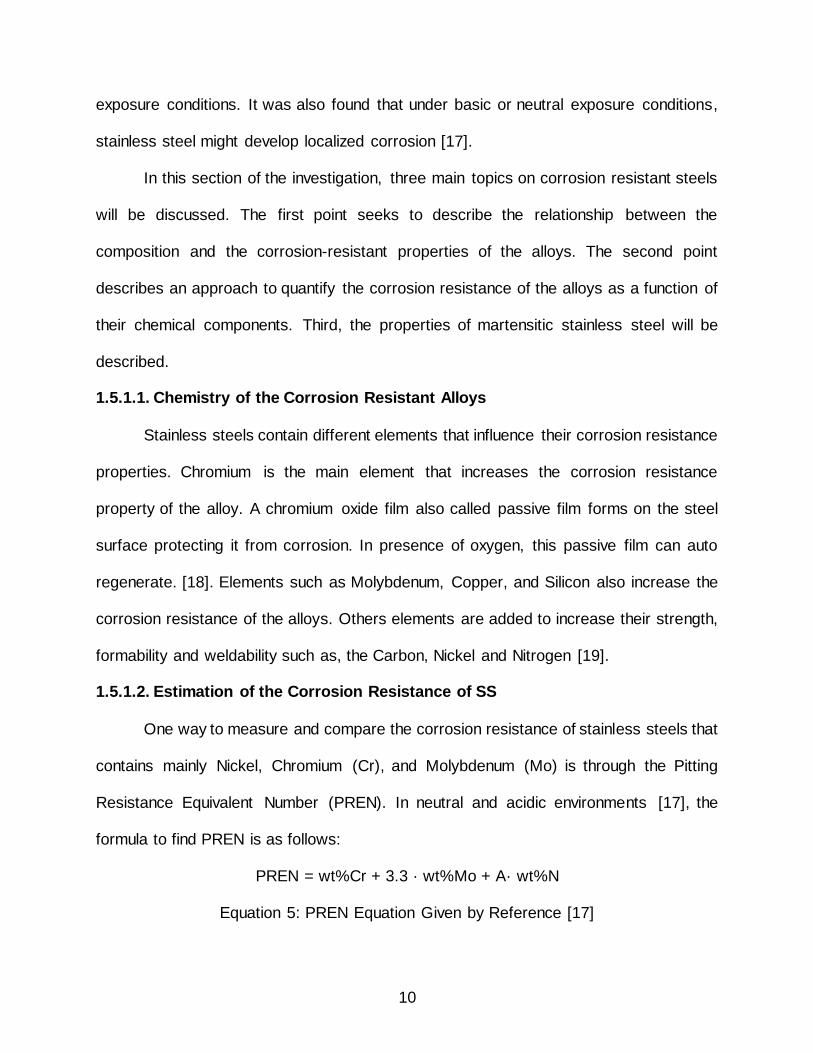
1.5.1.2. Estimation of the Corrosion Resistance of SS
One way to measure and compare the corrosion resistance of stainless steels that
contains mainly Nickel, Chromium (Cr), and Molybdenum (Mo) is through the Pitting
Resistance Equivalent Number (PREN). In neutral and acidic environments [17], the
formula to find PREN is as follows:
PREN = wt%Cr + 3.3 · wt%Mo + A· wt%N
Equation 5: PREN Equation Given by Reference [17]

11
where “A” is commonly used as 16 [17]. Typical values of PREN for different stainless
steels are listed in Appendix C. The PREN of UNSS41000 SS used in this investigation,
was calculated by substituting its element contents in the Equation 5 as follows:
PREN of UNS S41000 SS = 11.6+3.3(0.011) +16*(0.031) = 12.13
1.5.1.3. Martensitic Stainless Steel
Martensitic steels are alloys that have been developed with high percentages of
carbon and chromium. Due to the minimum 12% of chromium content in the alloy, these
steels have some corrosion resistant properties. In addition, the amount of carbon in this
type of alloy allows them to be hardened and strengthened by heat treatment as in the
case of carbon steels. The heat treatment provides an optimum corrosion performance
to the martensitic stainless steels. Some other elements are added to the alloy (e.g. Nickel
and Nitrogen) to increase the weldability and corrosion resistance.
Although some high-grade allows (e.g. 300 series) may be more resistant to the
onset of corrosion [19], martensitic steels could provide a more economical concrete
reinforcement option that meets the common durability benchmark of 75 years. For this
investigation, the Martensitic SS used was UNS S41000. This alloy includes Chromium,
Nickel, and Nitrogen in the following percentages 11.66%, 0.11%, and 0.031%
respectively.
1.5.2. Carbon Steel
Carbon steel has been used as a concrete reinforcement for many decades. The
steel reinforcement provides strength to concrete elements. Specifications for carbon
steel reinforcements for concrete are stated in ASTM A615 [20]. Its application in concrete
structures has been decimated when it is exposed to chloride attack. The chloride

12
threshold value for carbon steel has been found around 0.4 % by weight of the cement
content [12]. Technical documentation for the Florida Department of Transportation
suggests the use of cement content of 658 pounds per cubic yard (pcy) for corrosion-
resistant concrete applications (Type IV) [21]. For this type of concrete, the amount of
chloride ion at the steel surface to initiate corrosion is given by the formula:
CT= 0.4% CF = 0.4% (658) = 2.63 pcy
Equation 6: Chloride Threshold for Carbon Steel
1.6. Service Life of a Concrete Structure
The durability of reinforced concrete structures has been summarized with a
simple model presented in Figure 1.2. The durability model for reinforced concrete has
two stages that define its service life span [14]. The first stage is called the corrosion
initiation stage (CIS) and the second is called the corrosion propagation stage (CPS). The
time needed for a reinforced concrete structure to reach its limits states is given by adding
the durations of the corrosion initiation stage and the corrosion propagation stage. Often,
limits states for reinforced concrete are concrete cracking, and concrete delamination [5].
Figure 1.2 Service Life Span for Reinforced Concrete. Source: Adapted from [14]. Where CIS is Corrosion Initiation Stage, CPS is Corrosion Propagation Stage and SLS is Service Life Span. Circles Represent the End of Each
Stage. The Red Box Highlights the Uncertainty of the Duration of CPS of SS in Concrete.
13
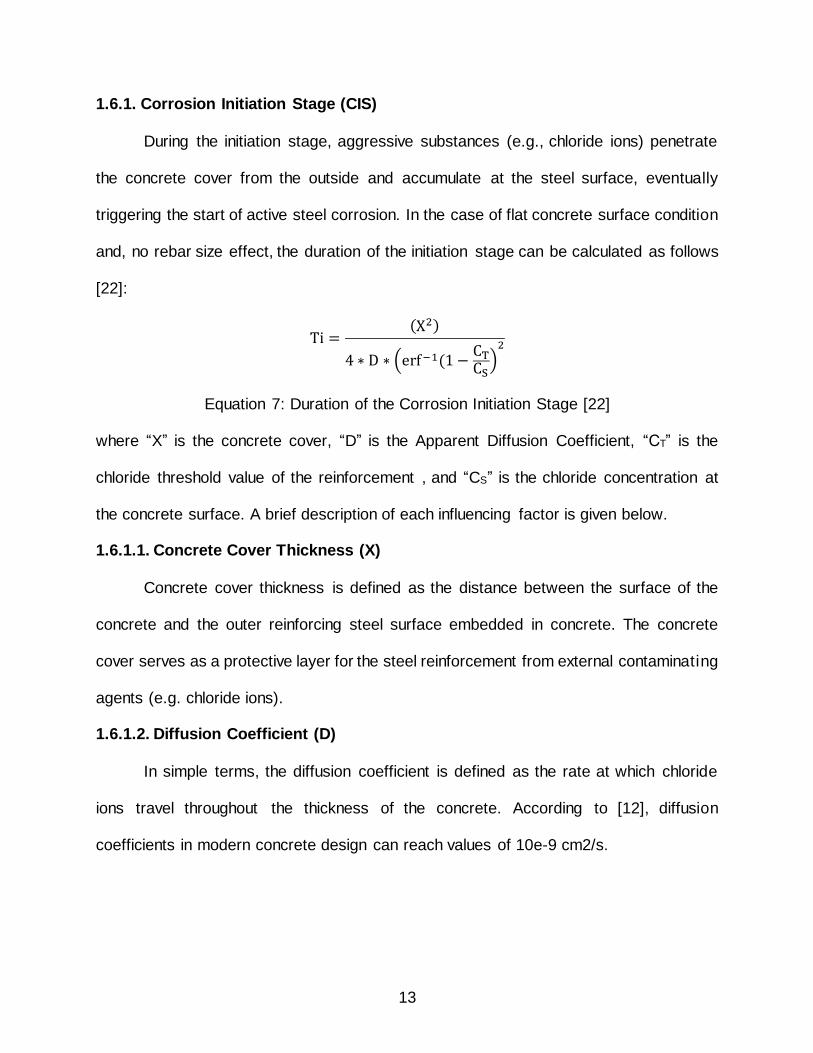
1.6.1. Corrosion Initiation Stage (CIS)
During the initiation stage, aggressive substances (e.g., chloride ions) penetrate
the concrete cover from the outside and accumulate at the steel surface, eventually
triggering the start of active steel corrosion. In the case of flat concrete surface condition
and, no rebar size effect, the duration of the initiation stage can be calculated as follows
[22]:
Ti =(X2)
4 ∗ D ∗ (erf −1(1 −CT
CS)
2
Equation 7: Duration of the Corrosion Initiation Stage [22]
where “X” is the concrete cover, “D” is the Apparent Diffusion Coefficient, “CT” is the
chloride threshold value of the reinforcement , and “CS” is the chloride concentration at
the concrete surface. A brief description of each influencing factor is given below.
1.6.1.1. Concrete Cover Thickness (X)
Concrete cover thickness is defined as the distance between the surface of the
concrete and the outer reinforcing steel surface embedded in concrete. The concrete
cover serves as a protective layer for the steel reinforcement from external contaminating
agents (e.g. chloride ions).
1.6.1.2. Diffusion Coefficient (D)
In simple terms, the diffusion coefficient is defined as the rate at which chloride
ions travel throughout the thickness of the concrete. According to [12], diffusion
coefficients in modern concrete design can reach values of 10e-9 cm2/s.
14
1.6.1.3. Chloride Threshold (CT)
The chloride threshold is defined as the minimum amount of chloride ions on the
steel surface required to de-passivate and subsequently breakdown the protective film of
the steel. Compared to carbon steel, the CT value of stainless steels (e.g. 300-series
austenitic SS) can be 10 times greater [12].
1.6.1.4. Surface Concentration Chloride (Cs)
The surface concentration is defined as the amount of chloride ions, (commonly
expressed of a percentage of weight of cement or weight of concrete), at the surface of
the concrete in a given environment (e.g. seawater).
1.6.2. Corrosion Propagation Stage (CPS)
During the propagation stage, the reinforcement corrosion in concrete creates
expansive corrosion products that cause cracking of the concrete and associated
structural deterioration. For case of carbon steel in concrete, the value of duration of the
CPS was estimated in a decade [23]. It was estimated that 50 μm of metal loss of carbon
steel reinforcing can cause cracking of the concrete [12]. For stainless steel in concrete,
the duration of CPS is uncertain. In the absence of information, the CPS for SS was
assumed conservatively as that of Carbon steel [23]. According to [24], the duration of
the propagation stage depends on the critical concrete cover (Xcrit) and the corrosion
rate (CR).
1.6.2.1. Critical Concrete Cover (Xcrit)
Quantifying the propagation stage duration may be derived from the quantification
of the radial thickness loss of the steel (Xcrit) enough for producing cracking on the
15
concrete. A previous investigation [24] has derived a relationship for quantifying this loss
and it is described below:
Xcrit = 0.0111 ∗ (C
Ø) ∗ (
C
L+ 1)
2
Equation 8: Empirical Radial Thickness Loss [24]
where “C” is the concrete cover, “Ø” is the reinforcing steel diameter, and “L” is the length
of the anodic region. For this investigation, C= 1.5 cm, Ø=1.27 cm and L=1 cm (nominal
average value derived from data in the reference [19]).Then, Xcrit is calculated as follows:
Xcrit = 0.0111 ∗ (1.5
1.27) ∗ (
1.5
1+ 1)
2
= 81 𝜇𝑚
1.6.2.2. Duration of Corrosion Propagation Stage (TP)
The duration of the corrosion propagation state is given by the ratio of “Xcrit” and
the corrosion rate “CR” of the steel [24] (See sections 1.4.3 and 1.7.2.2).
Tp =Xcrit
CR
1.7. Electrochemical Corrosion Techniques
This investigation has applied three electrochemical techniques to estimate the
corrosion behavior of the reinforcing steel in concrete. The first technique is half-cell
potential and it is considered as a qualitative test of the corrosion state of the steel
reinforcement in concrete. The second technique is called electrochemical impedance
spectroscopy (EIS). This technique allows to determining corrosion rates, which gives
quantitative measurements of the state of corrosion. The third technique is resistivity of
concrete that indirectly studies the probability of steel corrosion and give an indication of
the degree of the pore structure formation.

16
1.7.1. Half-cell Potential Method
In reinforced concrete, the steel reinforcement is balanced with its ions and the
potential developed is the electrical interaction between the anodic reaction (steel
oxidation) and cathodic reaction (oxygen reduction). Once the active corrosion takes
place, the migration of positive metal ions to the environment gets faster and the electrical
potential in the metal body becomes more negative.
The difference in potential in the circuit can be measured by using a voltmeter and
a reference electrode as shown in Figure 1.3. This technique has been standardized in
ASTM C-876 [4] and it is limited to estimate the probability of corrosion. Further
descriptions of probability of corrosion are given in Table 1.1. No indication of corrosion
rates is given by this methodology [25].
Figure 1.3 Diagram of Half-Cell Potential Measurements
Table 1.1 Criteria to Evaluate the Corrosion Potential Results
PROBABILITY OF CORROSION CSE (mV) SCE (mV)
90% - High V < -350 V < -276
Uncertain -200<V< -350 -124< V <-276
10% - Low -200<V -124<V where “V” is Electrical Potential. Source: Adapted from [4].
1.7.1.1. Potential Maps
The potential mapping technique is an application of the half-cell potential method
to estimate the corrosion state of reinforcing steel in concrete [6]. This a non-destructive
17
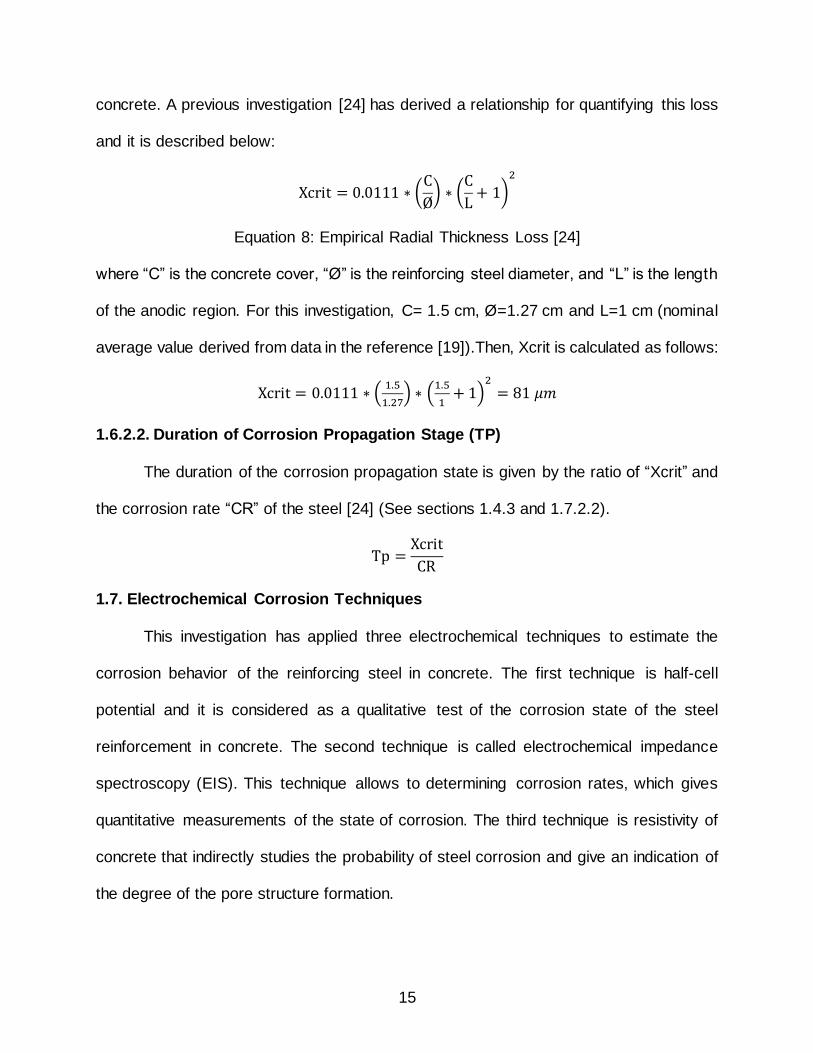
technique that does not provide information on corrosion rates. To display the results
using this technique, potential profiles or potential maps can be used as shown in Figure
1.4. For this investigation, the potential profiles were chosen due the geometry of the
specimens prepared (~ six feet). To be an application of the Half – cell potential method,
this technique also follows the criteria to evaluate the corrosion potential results given by
ASTM C876 [4].
Figure 1.4 Potential Map for a Given Steel Reinforcement in Concrete
1.7.2. Electrochemical Impedance Spectroscopy (EIS)
The EIS measurements are used to obtain the corrosion rates of a system through
the estimation of the value of the polarization resistance [9]. This technique consists in
the application of a sinusoidal disturbance of the electrical potential produced by a given
alternating current to a circuit. Meanwhile, the potential response of the system (amplitude
and phase angle) is measured and the impedance is computed at each frequency of the
established range (typically 1 mHz to 1Khz) [25]. The impedance “Z” is established by the
ratio frequency-dependent potential and the frequency-dependent current. An estimated
diagram for the EIS measurements performed in this investigation is shown in Figure 1.5
18
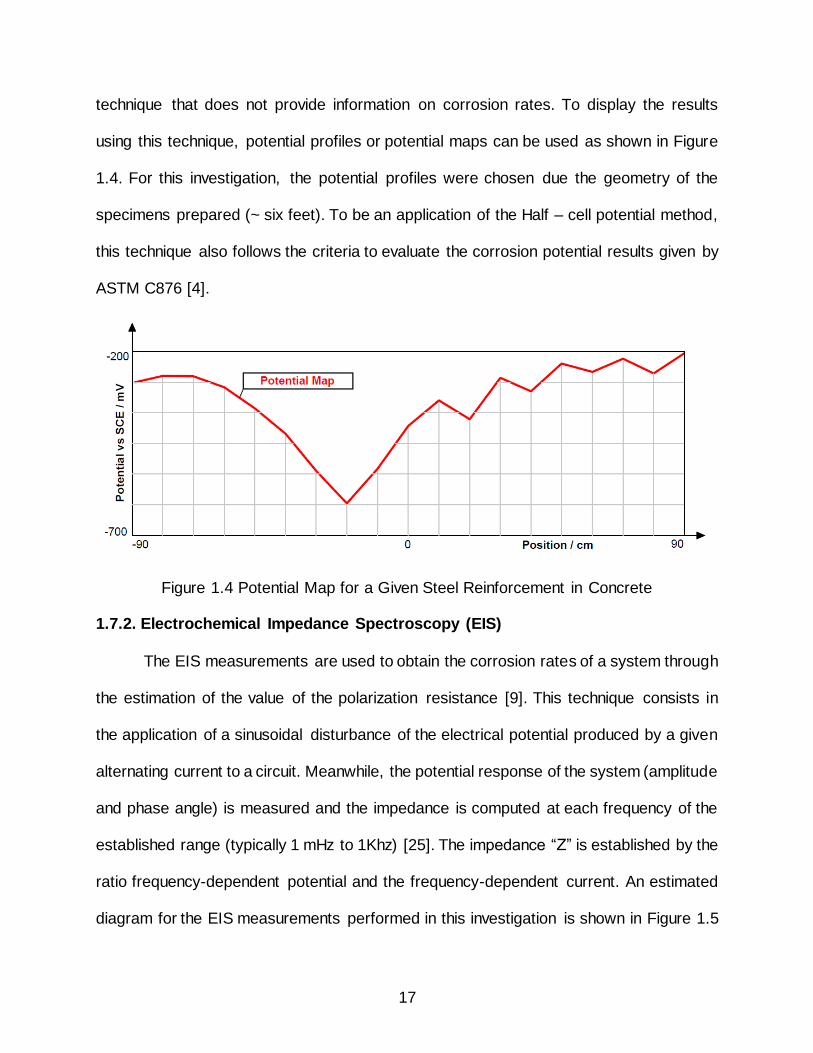
The polarization resistance of steel reinforcement in concrete can be estimated by
fitting equivalent electrical circuits to the impedance spectrum [26]. Thus, the corrosion
rates can be calculated by using the Stern-Geary equation.
Figure 1.5 Diagram of EIS Measurements
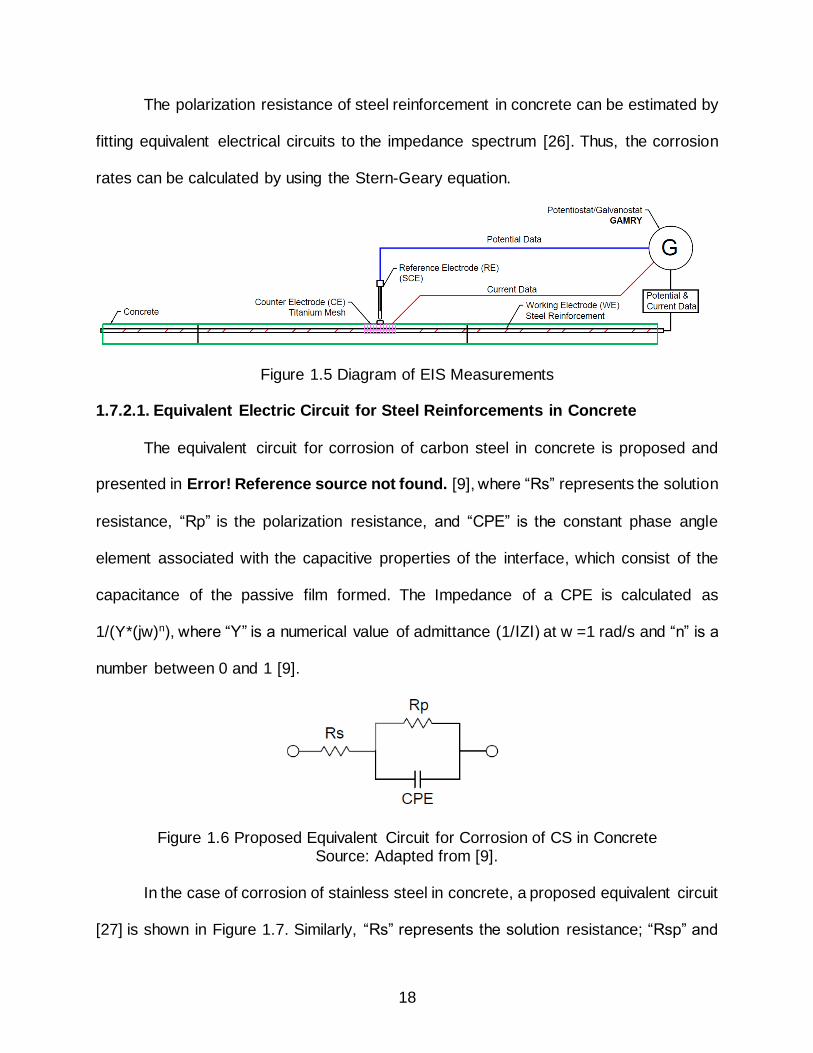
1.7.2.1. Equivalent Electric Circuit for Steel Reinforcements in Concrete
The equivalent circuit for corrosion of carbon steel in concrete is proposed and
presented in Error! Reference source not found. [9], where “Rs” represents the solution
resistance, “Rp” is the polarization resistance, and “CPE” is the constant phase angle
element associated with the capacitive properties of the interface, which consist of the
capacitance of the passive film formed. The Impedance of a CPE is calculated as
1/(Y*(jw)n), where “Y” is a numerical value of admittance (1/ΙZΙ) at w =1 rad/s and “n” is a
number between 0 and 1 [9].
Figure 1.6 Proposed Equivalent Circuit for Corrosion of CS in Concrete Source: Adapted from [9].
In the case of corrosion of stainless steel in concrete, a proposed equivalent circuit
[27] is shown in Figure 1.7. Similarly, “Rs” represents the solution resistance; “Rsp” and

19
CPE2 are attributed to the metal surface areas protected by the passive layer. “Rp” is the
polarization resistance, “CPE1” is the constant phase angle element associated with the
double charge layer capacitance between the SS surface and the solution.
Figure 1.7 Proposed Equivalent Circuit for Corrosion of SS in Concrete Source: Adapted from [27].
1.7.2.2. Corrosion Rates by Using EIS
EIS measurements can provide estimates of the polarization resistance. The
Stern-Geary equation uses polarization resistance values and Stern-Geary constant to
calculate corrosion rates. For the purpose of this investigation, the corrosion current was
calculated assuming a value of Stern-Geary constant (B) for iron (Fe) equal to B= 26 mV.
I corr =B
Rp
Equation 9: Modified Stern-Geary Equation [9]
where “Icorr” is the corrosion current (A). “B” is the Stern-Geary constant for steel (V) and
“Rp” is the polarization resistance (Ohms). Then, the value of “icorr” current density
(A/cm2) can be determined as follows:
icorr =Icorr
A
where “Icorr” is the corrosion current (A), “A” is the nominal polarizing area (cm2). Finally,
the penetration rate (μmy) using Faraday’s law is compute as follows [12]:
20
CR = icorr ∗ K
where “icorr” is the corrosion density (μA/cm2) and “K” is a conversion factor
(for Iron K = 11.58e+6)
1.7.3. Resistivity of Concrete
Electrical Resistivity is a non-destructive method to estimate indirectly the
probability of reinforcement corrosion in concrete [28]. No indication of corrosion rate is
given by this methodology [25]. The literature points out that a high value of electrical
resistivity of concrete may indicate a low probability of corrosion of reinforcing steel. It has
been found that the concrete resistivity depends, among other factors, on the water
cement ratio [25]. The greater the amount of water, the faster the cathodic reaction will
be.
To measure the resistivity of cylindrical concrete samples according to the Werner
array probe technique (4-probes) [28], a cylindrical concrete specimen should have four
probes spaced at a distance “a” (Figure 1.8). Then, a given current (I) in Amps is induced
at the two external probes, and the potential difference “V” (in volts) is measured at the
internal probes. The equation to compute concrete resistivity is as follows:
ρ app = 2 ∗ π ∗ a ∗V
I
Equation 10: Apparent Concrete Resistivity [28]
According to [28], the Equation 10 must be corrected by a geometrical correction
factor "K" when a small cylindrical concrete sample is tested.
ρ corrected =ρapp
K
Equation 11: Geometric Correction of Concrete Resistivity Equation [28]

21
Figure 1.8 Concrete Resistance Measurement Using Four Probe Wenner Array. A Given Impressed Current Flow from One of the Outer Probe to the Other I1,I2.. The
Potential Difference is measured at the Two Inner Probes Va, Vb.
The following table shows criteria to evaluate the resistivity measurements in
concrete according to [25]
Table 1.2 Criteria to Evaluate Concrete Resistivity Results
PROBABILITY OF CORROSION RESISTIVITY MEASUREMENTS
High ρ< 20 kΩ.cm
Medium 100 > ρ >20 kΩ.cm
Low ρ > 100 kΩ.cm
where “ρ” is resistivity. Source: Adapted from [25].
22
CHAPTER 2: REVIEW OF PROPAGATION STAGE LITERATURE FOR SS
Sources accessed are listed in references, and further classified in Appendix A
where it is indicated whether the work concerned one or more of the following categories:
1. SS reinforcement in actual structural service.
2. Exposure of SS-reinforced concrete samples to external/service
environments.
3. SS in concrete or simulated pore solutions in controlled laboratory
conditions.
The listing in Appendix A includes also indication as to whether for any of the SS
evaluated the end of the corrosion initiation stage was reached and if so whether the end
of the propagation stage had been reached as well. That latter attribute was of special
interest to this project and those investigations were selected for detailed discussion, in
particular if related to a structure in service (one instance as interpreted by the
investigators cited) or natural/test yard exposures.
Appendix B is a listing of structures in service (mostly bridges) that incorporate SS
reinforcement, noting details on construction year, location, dimensions, and quantity and
type of SS used. Both Appendices A and B as well as the following Sections contain
references to SS types that are variously named depending on the literature source. To
facilitate comparisons, Appendix C is a table of approximate equivalence between the
various SS designations.
23
The following Section 2 reviews relevant work in each of the three investigation
categories noted above. In the following frequent reference is made to the Pitting
Resistance Equivalence Number (PREN) index, a merit figure of a SS’s ability to resist
pitting corrosion. The index is usually computed as PREN = wt%Cr + 3.3·wt%Mo +
16·wt%N [17], although there is some variability of multiplier factors among users.
The review is not intended to be exhaustive but rather highlights the most notable
work among those listed in Appendix A. Moreover, given the scope of this work as noted
in the introduction and the availability of recent detailed reviews on the performance of
SS reinforcement during the initiation stage [17, 29, 30, 2, 31] , conclusions on issues
pertaining primarily to that stage and related alloy rankings will not be repeated here. It is
also noted that this review is limited mostly to the behavior of SS rebar that has been
thoroughly descaled and freed or surface contamination by pickling and/or so-called
passivation procedures [32, 33]. Moreover, with few exceptions the review considers only
solid SS rebar that is normally commercially available. The reader is referred to other
sources [34, 35, 36, 37] for work on the propagation stage of SS-clad rebar, which is not
currently available commercially. The review also focuses on the use of the rebar as
reinforcement. SS applications to pre or post-tensioned applications are emerging issue
that has been considered elsewhere [38].
2.1. SS Reinforcement in Actual Structural Service
The listing in Appendix 2 shows that more than 100 bridges and related structures
or sizable parts of structures have been built with SS reinforcement during the last 80
years. As shown in Figure 2.1, the pace of utilization of SS has increased during the last
two decades without sign of abatement. This fast growing tendency of the SS usage in

24
structures emerged as designers become more persuaded of the potential economic
benefits of corrosion resistant rebar, and the greater commercial availability of SS rebar.
Current implementation of SS rebar in the field is evolving with various levels of
quality assurance and control of rebar condition [39], [40]. Economic considerations are
often a determining factor in the selection of rebar materials [41].
Figure 2.1 Cumulative Worldwide Tally of Bridges with SS Rebar
Appendix B classified SS-reinforced structures by country of origin. As shown in
Figure 2.2, the U.S. leads with Europe and Canada filling much of the rest.
Progreso Pier Mexico
0
20
40
60
80
100
120
1920 1940 1960 1980 2000 2020
Num
ber of str
uctu
res
Year

25
Figure 2.2 SS in Bridges by Country
Per Appendix B, the oldest major structure with SS reinforcing is located in Mexico
(Progreso pier), having been the subject of several notable investigations. That work is
detailed next, followed with a sampling of experience from other structures. It is noted
that while there is abundant literature on the use of SS rebar in new structures, there are
relatively few reports on actual performance evaluation after the structures were in service
for an appreciably long period. The selection of cases discussed, accordingly limited, is
presented in the following subsections.
2.1.1. Progreso Pier, Mexico
2.1.1.1. Background
The Progreso pier is part of the installations of the Port of Progreso in the Yucatan
peninsula, located at Progreso, State of Yucatan, Mexico, latitude +21° 20' and longitude
89° 40' on the Gulf of Mexico. The yearly average temperature is 26 °C and water Cl-
content is ~ 20,000 ppm [42]. The initial request for bids by the Mexican Government
26
specified a structure with “low corrosion-induced damage” [43]. The Danish company
Christiani & Nielsen, who developed the successful bid, addressed that requirement by
specifying the use of mass concrete and SS rebar and built the pier during the period
1937 – 1941.
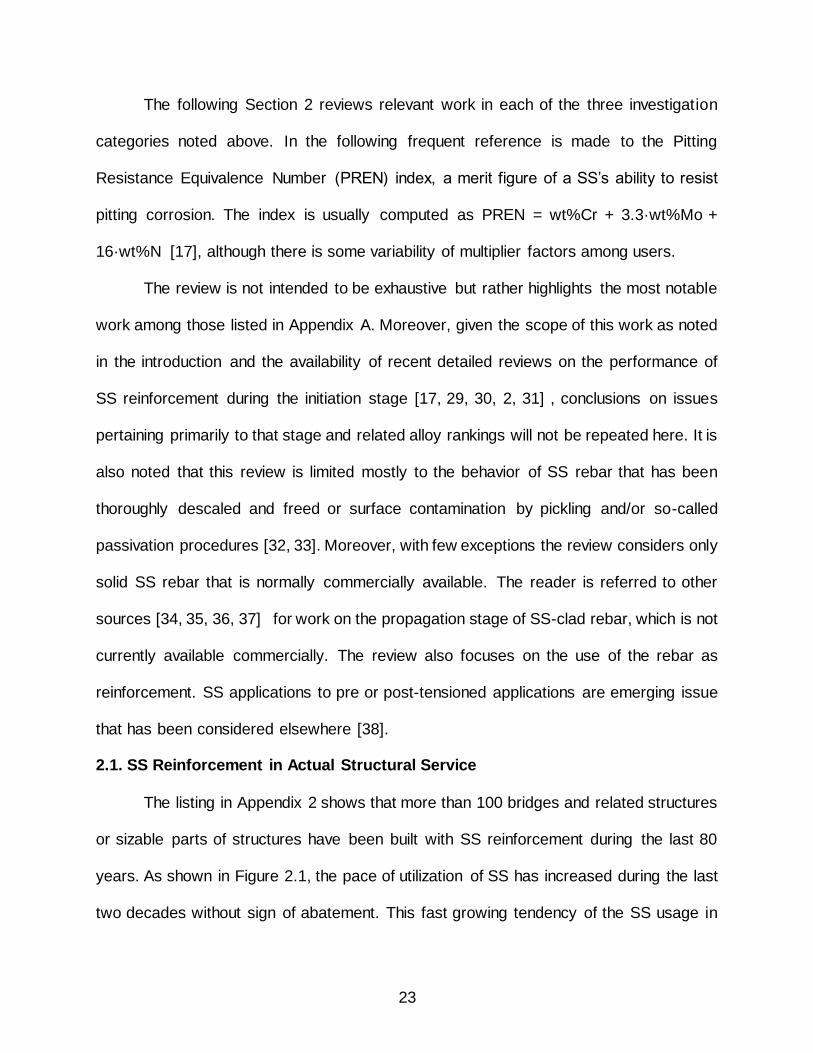
The original 1941 pier includes three parts (Figure 2.3): the embankment, the
viaduct, and the pier head. The entire structure is ~2.1 km long, 9.5 m wide in the viaduct
and 50 m wide in the pier head.
Figure 2.3 Plan Layout of Progreso Pier
Based on the as-built report prepared by Christiani & Nielsen, the cross beams
were cast with vibrated mass concrete and reinforced with type 304 SS rebar (SS)
(UNS30400). The SS reinforcement was used to control cracks due to shrinkage and
temperature in this structure [43]. According to recent evaluations, [44], the concrete
cover in the cross girders in the S-N direction is ~ 20 cm and in the W-E direction is
~8 cm.
This structure contains ~200,000 kg of SS type 304. This roughly means a steel
quantity of ~825 kg per beam or 14 #10 (30 mm) diameter type 304 SS rebar. Rebar,
whenever exposed in recent investigations, was reported to be smooth with no
corrugations. Additional information of the concrete elements in a section of the Progreso
Pier is presented in Figure 2.4.

27
Figure 2.4 Pier Elevation and Section
2.1.1.2. Investigations of Corrosion Performance at the Progreso Pier
In the late 1990s a consulting firm performed an evaluation of the SS reinforcement
of two arches (spans 8 and 9) and a column between spans 9 and 10. Results were
published in a 1999 report [42]. The evaluation also included visual superficial
examination of spans 1 to 7. Methods used included concrete cover and chloride content
measurements, petrographic analysis, evaluation of corrosion extent, optical emission
spectroscopy, and chemical and metallographic analysis of the SS.
Author’s conclusions and observations (quotation marks for special wording by
authors) and comments include:
1. Despite the saline and subtropical environment combined with the use of
concrete with relatively high porosity and some cast defects, no significant
corrosion problems associated with embedded reinforcement were
observed after 60-year service for the SS type 304 reinforcement. The tone
of the findings follows that theme.

28
2. Visual examination revealed a few longitudinal cracks (width <1mm) but
with no visible signs of corrosion.
3. At two spots in pier N-09 short segments of rebar (ends of hairpins) were
directly exposed to the environment, without any cover, presumably due to
previous mechanical damage. There was “serious laminated corrosion on
the visible reinforcement and the reinforcement area was reduced to
approximately 60-70%”.
4. In pier N-09 “breakups” of the concrete were made to examine embedded
rebar. In a breakup by one of the two exposed rebar hairpins rebar cover
was 18 mm and about 5% of the bar corrosion showed light corrosion. A
breakup by the other hairpin revealed cover of 28 mm with <20% of the bar
showing light corrosion. At two other spots in pier N-09 concrete was
removed exposing cover of 32 mm (bar mostly “glossy”, only about 5% of
the surface showing some light corrosion) and 105 mm (bar “glossy”, no
corrosion).
5. Chloride penetration profiles were essentially flat, with near-saturation
levels (typically ~ 1% Cl- by weight of concrete, with as much to 1.92%) up
to a depth of ~100 mm. There was no significant evidence corrosion on the
bars despite chloride contents that are an order of magnitude greater than
what is normally regarded as critical for initiation of corrosion on ordinary
carbon steel.
In 2002, the Progreso pier was inspected again by an academic-government
interdisciplinary team to verify the state of the pier, toward outlining maintenance action
29
for extending the pier’s service life. Findings were published in a 2002 journal paper
[45].The experimental procedure involved concrete carbonation, resistivity and chloride
content measurements, as well as electrochemical techniques such as half-cell potential,
corrosion rate, and metallographic analysis. Some of the findings were further stated in
another publication in 2004 [46].
Concrete cores where extracted from a selected girder edge surface (at Pier 9) to
test for carbonation depth, chloride content, and 11
The author’s conclusions and our observations include:
1. Chloride contamination levels were very high (1% to 2.5% of concrete
weight, nearly flat profiles), in agreement with the findings above [5]. Those
values were interpreted as being at or above the corrosion threshold for
type 304 SS. Carbonation depth was only < 1.5 mm, typical of low elevation
marine exposure.
2. Concrete resistivity measurements showed values ranging from 0.6 kΩ-cm
to 2.5 kΩ-cm in the entire girder surface, consistent with highly permeable
concrete and high chloride content (both evidenced by the high and nearly
flat chloride profiles).
3. Some half-cell potentials were highly negative (as much as -553 mV CSE
(Copper Sulfate Electrode)) suggestive of active corrosion in progress.
4. Corrosion rates estimated from linear polarization measurements with a
guard ring counter electrode ranged from 0.1 μA/cm2 (nearly passive) to
0.87 μA/cm2 (active corrosion).
30
5. Inspection of a core containing embedded rebar, near a part of the rebar
that had been previously directly exposed to the environment, showed “a
few rusty spots” identified as pitting.
6. The above findings were interpreted as providing “enough quantitative
information to suspect that the SS bars from the girders are exposed to a
high chloride concentration that is possibly causing their depassivation”.
This work has an overall more conservative tone than that of the previous
entry. Concrete porosity and density.
In 2005, a study was conducted by IMT (Mexican Institute of Transport) and
CINVESTAV-Merida (Research Institute from IPN–National Polytechnic Institute) on the
Progreso pier to describe its condition, translated title: “Study of the pier head´s durability
and load testing of three arches in the pier viaduct of Progreso.” This work includes two
parts: condition assessment of the pier head [47] and load capacity of three arches of the
pier viaduct [48] . Tests conducted included carbonation depth, chloride content, and
resistivity for concrete, half-cell potential, and polarization resistance for the SS bar.
Cores supplementing earlier investigations were taken from cross beams Piers 9, 12, 13,
30, 34, and 164
The author’s conclusions and our observations include:
1. Confirmed high chloride content on South face of Pier 9 found in previous
surveys, consistent with assumption of corrosion there.
2. Results found variability in chloride content, with more chloride on the
surfaces facing South and West, and less on the other faces due to
preferential rain washout.

31
3. Chloride content in Piers 12,13, 30, and 34 at rebar depth was high but
below the assumed 1% of concrete mass threshold for type 304 SS, so
“null” risk of corrosion was reported for those locations
4. The survey of pier viaduct revealed multiple cracks. They were assumed as
structural cracks.
5. Cracks observed in the pier head (at cross beams at arches 161, 163,164,
and 165) were deemed to be the result of rebar corrosion. That identification
appears to be inferred from: 1) observations of high chloride content (~ 1.5
% of concrete mass) at rebar depth in three cores extracted from No. 164;
2) cracks observed were parallel to the SS bar and during core extraction
at cracks, water used for the drill bit flow easily and reached bottom cracks,
also parallel to the SS bar. Concrete discoloration was noticed along the
crack as well.
6. Spalls and concrete damage in the cross girders of the pier head zone,
where SS bars were found to be exposed, were apparently produced by
lateral loads and boat impact and not by corrosion.
7. It was recommended to control corrosion of the SS bars by applying
galvanic cathodic protection.
8. Carbonation was negligible.
In 2018 IMT published a compilation report of work to assess the durability,
structural load capacity, and CFRP reinforcement of the Progreso pier viaduct. The report
is entitled (translated) as “Progreso pier viaduct. The first concrete structure built with
32
stainless steel.” [44] This report included yearly visual inspection records of the Progreso
pier for 2002-13.
The surveys showed increasing cracking incidence, to the extent that it was
deemed that the structure has reached the end of its service life for heavy loads. It was
recommended that heavy load traffic should be discontinued. The structure had been
subject to repairs including CFRP strips at arches and pile wrapping reinforcement, but
cracks had developed on some of it afterwards. It is noted that the deterioration was
ascribed primarily to increasing traffic load on account of a pier extension having been
built at the end of the 1980s. Corrosion of reinforcement was mentioned, but not identified
as the primary cause of the deterioration.
2.1.1.3. Summary
This structure is the main exponent and most potentially informative source of the
performance of SS rebar in aggressive corrosion conditions. The information is of special
interest given that the pier rebar material is type 304 austenitic SS, somewhat less
corrosion resistant than the type 316L SS commonly specified at present, but still sharing
many mutual characteristics. The pier presents significant structural deterioration, but
generally ascribed to enhanced loading and not the primary result of corrosion damage
of the rebar.
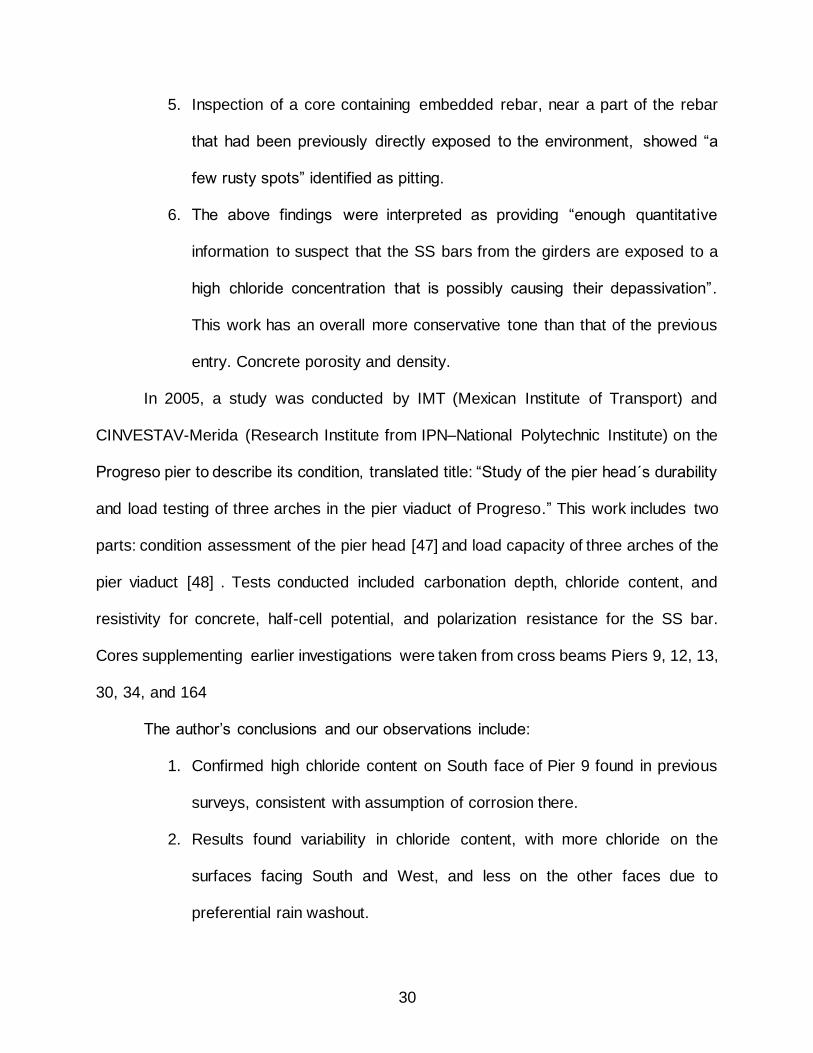
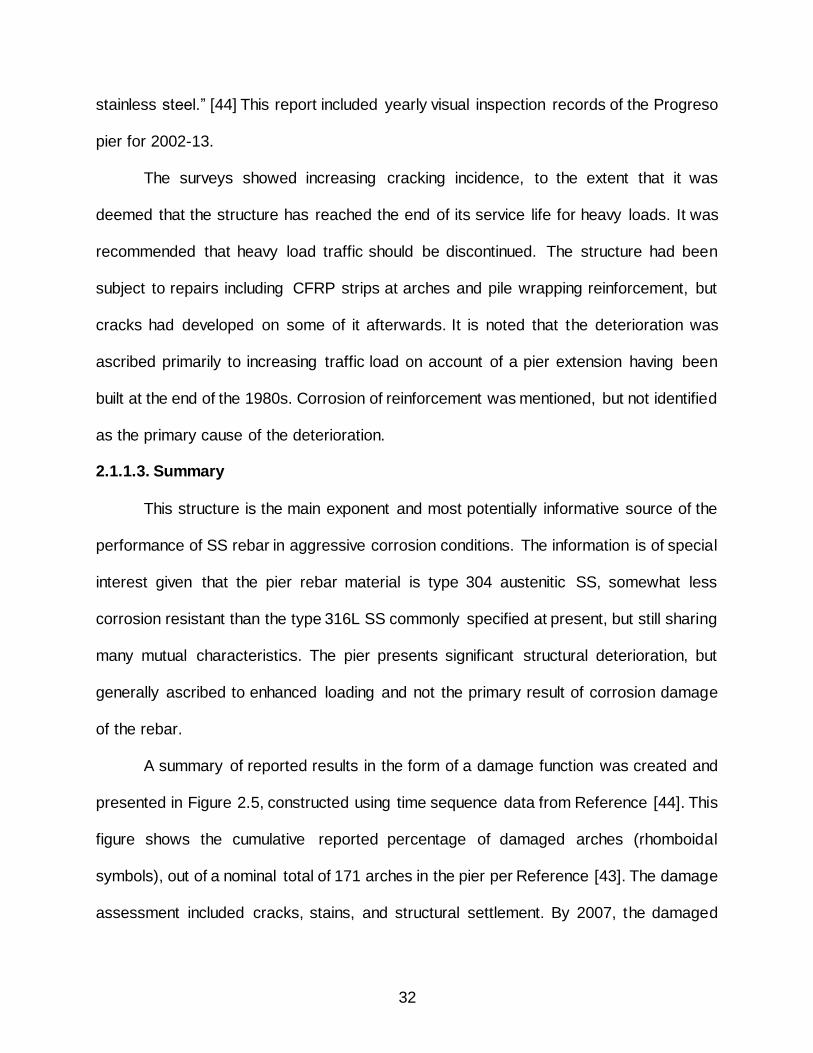
A summary of reported results in the form of a damage function was created and
presented in Figure 2.5, constructed using time sequence data from Reference [44]. This
figure shows the cumulative reported percentage of damaged arches (rhomboidal
symbols), out of a nominal total of 171 arches in the pier per Reference [43]. The damage
assessment included cracks, stains, and structural settlement. By 2007, the damaged
33
arch tally reached 100 %. Four cross beams (161,163,164,165) out of a nominal total of
172 presented cracks that were attributed to corrosion, based on indirect evidence, per
Reference [44] (red circle).
Figure 2.5 Notional Damage Function Displaying Percentage of Progreso Pier Arches Showing Distress.
Crossbeams with Cracking Attributed to Corrosion Damage, as a Function of Structure Age since Construction Completion in 1941 are Presented as Well.
In general, there is no direct evidence that cracking of the concrete cover was
caused anywhere by expansive products of the SS bars: no external corrosion stains
were observed, only concrete discoloration along the crack. There is some very limited
direct observation of embedded rebar corrosion (the 2002 study, apparently limited to
only one specimen, and the 1999 investigation referring to discoloration in a few

34
specimens) but without indication that the extent of corrosion was sufficient to cause
concrete cracks, or to have resulted in the appearance of corrosion products at the
external concrete surface. Indirect evidence includes some instances of corrosion rates
(from linear polarization tests) that have values comparable to those that, for carbon steel
rebar, would eventually cause concrete cracking. There were also half-cell potential
measurements negative enough to have been, for carbon steel rebar, indicators of severe
corrosion eventually leading to concrete cracking.
Finally, there were also instances of chloride content values at the rebar depth
what would meet or exceed proposed values (>1% of concrete mass) of the chloride
threshold for 304 SS rebar, a situation encountered for one case of concrete cracking and
thought to exist at other 3 comparable locations. There were two cases of SS rebar that
had corroded severely, but that was at two locations where the rebar cover was locally
missing for a short distance (a few inches) and where the SS had been directly exposed
to seawater for a period that may have been decades long. The evidence was not
indicative that the cover missing was from a corrosion spall or other corrosion-induced
result, but from an external impact (probably from a ship docking).
To help achieving the objectives of the present investigation, it is essential to seek
direct evidence linking the extent of corrosion of the SS bars with manifestations of having
reached a limit state. To that end, it would be highly desirable to obtain concrete cores,
intersecting and containing rebar segments, from the cracked region of arches such as
No. 161, 163,164, and 165 where suspected corrosion induced cracks had developed.
The rebar in the cores would be examined in detail to ascertain the extent, morphology,
microstructure and composition of any existing corrosion products. That information

35
should then be processed to obtain appropriate input parameters for the service life
forecasting models to be developed in subsequent stages of this project.
2.1.2. Bridge S03 of WB I-696 over Lenox Road, Michigan
Constructed in 1983, it is Bridge S03 of WB I-696, located over Lenox road,
Michigan. This bridge deck contains type 304 Solid SS Rebar. The SS weight was
approximately 63,000 pounds. [49]
This structure was inspected two times. The first inspection was carried out in 1993
(10 years after construction), when a visual and coring inspection (cores containing SS,
on- and off-crack) took place. Chloride content at rebar depth was 0.54 percent by weight
of cement and some minor corrosion stains were reported for the rebar surface. Thermal
and shrinkage cracks were detected. Tests conducted included concrete cover, chloride
content, and metallographic analysis. The second inspection took place in 2008 (26
years). That visual inspection reported no cracks of deterioration resulting from corrosion
of SS reinforcement. [50]
The authors concluded that:
1. No delamination was detected, but cracks due to thermal and shrinkage
effects were found.
2. Concrete covers were 72,150 and 165 mm.
3. No damage to the concrete caused by corrosion was observed in either on-
or off-crack cores.
2.1.2.1. Summary
SS performance in this structure appears to be adequate after 26-year service,
which is among the longest periods documented for actual structures.
36
2.1.3. I-295 over Arena Drive Bridge (Southbound), Trenton, New Jersey
Constructed in 1983, this bridge deck contains type 304 SS - Clad Rebar.
(Approximately 44,000 pounds) [49] [29].Crack and delamination surveys including four
corings were performed in 1993 at age 10 years. Chloride content measurements were
performed as well.
The authors concluded that:
1. The chloride content of concrete at the level of the reinforcing bars was low,
ranging from 0.009 to 0.013 percent by weight of concrete, below the
corrosion threshold for black steel in concrete.
2. Corrosion of clad bar was detected only under a plastic end cap where the
carbon steel core was exposed. Probably related to a low pH environment
under the protective end cap, which would prevent passivation of the steel
and allow corrosion to occur.
3. Extracted nine bars were in excellent condition with no corrosion.
2.1.3.1. Summary
The reported performance after 10 years’ service is good, although not surprising
given the mild conditions present at the time of examination. It is noted that the report
concerns SS clad bar, suggesting that cladding defects (if any) were not an important
liability at least in these exposure conditions.
2.1.4. Mullet Creek Bridge, Ontario Canada
Constructed in 1996, it is located over the Highway 407 Ontario, Canada. The
bridge deck and barrier walls contain type 316 LN SS. An estimated of 11,000 Kilograms
37
(# 4) rebar of this corrosion resistant reinforcement was included. Specified concrete
cover was 80 mm ± 20 mm [51].
Two early age condition evaluations (<1 year) were made for this structure.
Evaluations included visual inspection, concrete cover, half-cell potential, chloride content
measurements and corrosion rate by linear polarization resistance (LPR).The first
evaluation was performed after three months of concrete placement. Concrete cover was
found to meet specifications. No deck cracks were noted and minor cracking elsewhere
was ascribed to normal shrinkage. The half-cell potentials were -0.41 V (CSE) on average
(authors reported values as positive numbers), suggesting that the SS surface had not
yet achieved a fully passive condition, and confirmed by LPR results. The second
evaluation was performed when the structure was 1 year old. By that time half-cell
potentials had reached -0.14 to -0.26 V (CSE), indicative of having reached a passive
condition.
2.1.4.1. Summary
While indicative of good performance, this is a very short-term evaluation. It is
included given the small overall number of actual performance evaluations found in the
literature examined. The investigators in this and some of the other cases reported next
used potentials surveys a means to detect corrosion condition, effectively assuming that
half-cell potential measurements provide the necessary information. The appropriateness
of that method for SS diagnostics will be examined in the present investigation.
2.1.5. Millennium Bridge, South Africa
Constructed in 1999, it is located over the M41 highway in Umhlanga Rocks,
approximately 1 km from the Umhlanga Rocks marine shoreline. While this bridge uses

38
structural SS shapes (no SS rebar), it merits attention given the aggressive environment
and partial use of low Cr steel. The superstructure of the bridge consists in a type 304 SS
pipe arch and 3CR12 (12% Cr) for the vertical spines. [52]
In April 2017 (18 years after placement), a visual inspection took place (no
experimental procedure included) and the authors concluded that:
1. Over the 18 years, regular flaking of the paint on the galvanized railings,
due to paint damage and under-film creep, has resulted in significant
corrosion, necessitating repainting on two or three occasions.
2. In contrast the SS components have shown no corrosion whatsoever, even
where damage to the paint has occurred.
3. The type 3CR12 SS was a viable option as it is a cost effective structural
steel in highly corrosive coastal environment.
2.1.5.1. Summary
The report is encouraging given the 18-year service time of a basic low Cr stainless
steel in an aggressive environment.
2.1.6. Bridge A6059 in Grundy County, Missouri
Constructed in 2001, the bridge deck contains type 316 LN rebar [53]. A nearby
conventional comparison bridge deck (Bridge A6060) was built with epoxy-coated rebar.
A condition survey was performed in July 2006, 5 years after concrete placement.
Tests conducted included visual inspection, crack mapping, chloride content
measurements, concrete coring, and half-cell potential.

39
The authors concluded that:
1. There was no delamination or spalling found on the surface of either bridge
deck.
2. Very little cracking damage on either the SS or the conventional deck.
3. Chloride data obtained by drilling showed only one location well above the
black bar corrosion threshold at the level of the SS bars
4. Half-cell maps were not conclusive because they are not calibrated for
316LN steel, but suggest a more corrosive environment than in the first
inspection in 2001 but not rebar corrosion.
5. The chloride ions in the deck already would have caused corrosion to black
steel and it was beneficial to have the SS reinforcement.
2.1.6.1. Summary
Service experience is limited (5 years) but reported performance of type 316 LN
steel is encouraging given that carbon steel threshold has been already exceeded.
2.1.7. Doniphan County and Mission Creek Bridge, Kansas
These bridges built in 2004 are respectively, No. 7-22-18.21(004), on K-7 over the
Wolf River in Northeast Kansas, 249-ft. long, and No. 4-89-4.58(281) on K-4 over Mission
Creek in Shawnee County, Kansas, 90-ft long. The decks both contain type 2205 SS,
with pickled surface condition and a top clear cover of 2.6 in. [54]. Conditions were
monitored by half-cell potential mapping over a 4-year period following construction. In
addition, test slabs simulating the bridge rebar layout and curing conditions were exposed
for the same period to chloride ponding on an outdoor test yard.
40
For both bridges potentials shortly after casting were in the range from -0.050 V to
-200 V (CSE), interpreted as being indicative of a passive condition. Four years after
casting potential measurements in the central regions of the decks were still more positive
that -0.2 V. However, potentials near the soil-buried abutments tended to be more
negative (as much as -0.5 V). That drop was attributed not necessarily to corrosion but
rather to restricted access of oxygen in locations where the concrete deck is in contact
with soil, combined with contact with mild steel forms leftover from construction in that
region.
2.1.7.1. Summary
While service period reported is short, the positive reported performance is of
interest since it documents service of a duplex stainless steel, a category for which
experience has been less reported than for austenitic stainless steel.
2.1.8. Ceiling and Air Channels Collapsed in Swimming Pool
These structures are not bridges nor in marine service, but are included here given
the high visibility of the events, which were catastrophic and involved loss of human life
in two instances.
2.1.8.1. Uster, Switzerland 1985
SS hangers in the roof construction fell down and promoted swimming pool’s roof
elements and ceiling collapse in Uster, Switzerland 1985. Environmental assisted
cracking (EAC) of SS elements in the roof supports was identified as the cause of this
accident (see 2.1.8.3). Twelve people were killed and 19 were injured [55].

41
2.1.8.2. Steenwijk, The Netherlands, 2001
SS threaded bars broke up and promoted a swimming pool’s ceiling and air
channels collapse in Steenwijk, 2001. EAC was identified as the cause. Fortunately, this
event took place during closing time and no fatalities were reported [55].
2.1.8.3. Tilburg, The Netherlands 2011
SS bolts broke up and promoted two-speaker boxes and a speaker frame to fall in
a heated swimming pool in Tilburg, The Netherlands 2011. An infant was killed and the
mother was injured. [55]. As well as for the other failures, the author concluded that EAC
of SS bolts was the cause of this accident. The likely corrosion agent for this and the other
failures was identified as volatile chlorine compounds (originating from the heated pool
water) that condensate on the SS surface (which is often at relatively mild temperatures,
not previously 2.3.2) associated with EAC), forming hydrochloric acid.
2.1.8.4. Summary
The modes of failure cited are ascribed to chlorine compounds (not chloride), and
are more likely to affect steel of higher strength than that normally used for regular rebar
service, but highlight the need to keep unexpected results in mind when replacing
traditional materials with advanced alternatives.
2.2. Exposure of SS-Reinforced Concrete Samples to External/Service
Environments
2.2.1. British Building Research Establishment (BBRE) Investigations
This extensive set of investigations provides some of the most revealing
information of the damage-taking place during the corrosion propagation stage of
stainless steel in concrete under non-accelerated exposure.
42
2.2.1.1. Langstone Harbour, England
A 12.5-year study analyzed the corrosion resistance of round bars (# 4) of type
316 SS, and carbon steel embedded in concrete. It was not reported whether mill scale
was present on the SS, but most of the surface appeared to have been machined.
Concrete blocks were exposed to two immersion settings: full immersion (depth 0.6 m)
in Langstone Harbour near Portsmouth on the South Coast of England, and intermittent
or subject to tidal immersion exposure on a bank in the Harbour. The steel exposure
conditions were the following: embedded in concrete, stagnant seawater, and flowing
seawater on one end of the steel. Results were published in the 1988-document “The
resistance of stainless steel partly embedded in concrete to corrosion by seawater” [56]
Twenty concrete specimens were evaluated. The specimens were in the form of
blocks 100 mm x 100 mm and 203 mm long, with a 3 mm gap in the center to stimulate
localized corrosion. The concrete blocks were made with Ordinary Portland cement
(OPC, 420 kg/m3, w/c=0.42) and Sulfate–resistant Portland cement (SRPC, 355 kg/m3,
w/c=0.45).In total 42 SS bars and 18 carbon steel bars were used (three same material
bars per specimen). The rod bar lengths were 150 mm, 200 mm and 250 mm. Concrete
covers were 12, 18, and 40 mm.
The authors concluded:
1. After 1-year exposure, the SS rods showed a corrosion-free surface at both
immersion settings. Carbon steel specimens suffered more active corrosion
attack in longer specimens and intermittent condition immersion than in the
smaller specimens and full immersion conditions.

43
2. After 3 1/2-year exposure, patches of dull appearance were shown on the
SS rod surfaces at both immersion settings. No apparent effect on strength
or elongation properties was found.
3. After 7-year exposure, concrete specimens at the tidal zone with SS
embedded showed more corrosion attack evidence than the concrete
specimens at the full immersion condition. However, after rust removal, the
corrosion attack was found to be only superficial. Additionally, concrete with
SRPC was found to be more prone to have SS corrosion than concrete with
OPC under both immersion conditions.
4. After 12.5-year exposure, all SS specimens embedded in OPC and SRPC
concrete developed rust staining on the surface. The most severe attack on
SS bars was found on a single SRPC concrete block at full immersion
condition. Pitting corrosion took place in the junction of the steel and
concrete. The corrosion was spread downwards of the steel into the
concrete body. However, no corrosion-induced crack or damage on the
concrete surface was noted.
5. The authors concluded that the area of SS external to the concrete should
be minimized to avoid adverse macrocell conditions. Crevice corrosion,
which was initially thought to be a concern, developed on only one
specimen after 12 years exposure.
2.2.1.2. Beckton, East London
A 10-year-exposure study evaluated the performance of various SS type
reinforcements embedded in concrete. These industrial environment exposures took
44
place in Beckton, East London, U.K., using specimens with chloride-admixed concrete.
Types of steel included: weathering steel, galvanized steel, ferritic SS: 405, 430, and
austenitic SS: 302, 315, and 316. The steel surface for ferritic and austenitic SS was
descaled. Results were published in the 1989-document “Durability of corrosion resisting
steel in concrete” [11]
The experimental procedure involved 550 prisms. Concrete covers were low, 10
mm and 20 mm. The concrete mixes examined (1:6 and 1:8 cement: aggregates mixes)
contained a range of added chloride to enhance corrosion activity. [11] The chloride
additions by weight of cement were 0%, 0.32%, 0.96 % 1.92%, and 3.2%. Tests
performed included visual inspection, crack mapping, and concrete carbonation.
The authors concluded:
1. The ferritic SS had more corrosion resistance than the carbon steel bars at
all chloride levels; the latter experienced many instances of cracking
including some for 0% chloride specimens by the end of the test period,
However, cracking of concrete with type 405 SS took place in one instance
even at the 0.32% Cl level.
2. The ferritic steel bars, type 405 and 430, showed quite low corrosion
resistance in concretes containing high chloride levels (1.92%). The
corrosive attack there was pitting, typically seriously concentrated on a few
points on the metal body. Although very localized, that attack was enough
to cause cracking of the concrete as well.
3. In contrast, the austenitic SSs showed very high corrosion resistance in all
the environments tested. No serious corrosion was noted on any of the
45
austenitic test bars although slight pitting occurred on type 302 steel. The
authors concluded that the austenitic SS remained passive despite very
high concentrations of chloride in concrete.
4. Concrete carbonation had taken place to depths ranging from ~2 mm to
near the 10-mm concrete cover, but not fully to the design bar depth. Thus,
a few bars displaced from their design cover when casting might have been
in contact with thoroughly carbonated concrete. Overall, however that was
not the case so the aggravated condition of combined carbonation and
chloride load was not fully assessed in this investigation. This issue pointed
out by the authors merits consideration in future work.
2.2.1.3. Beckton, East London (Continued) and Hurst Castle
Twelve of the type 316 SS prism specimens exposed at the industrial site at
Beckton (previous section [11]) were left in place for exposure continued until a 22-year
period was reached at which type examinations took place. In addition, 23 other
specimens were prepared in the form of concrete beams reinforced with types 302 (basic
18-8 composition, no added Mo), 315 (modest Mo content) and 316 SS bars, 15 or 30
mm clear cover. The beams were held together in pairs with pivot spacers and stressing
bolts to create a permanent bending moment and cracking of the concrete. Chloride
contents by weight of cement of 0%, 0.32%, and 0.96% were admixed in the beams.
Twenty of the beams were exposed at the Beckton site, and 3 (initially with 0% chloride)
were exposed at the splash zone on a marine site at Hurst Castle, U.K. The exposure
period at Hurst Castle was 22 years as well. Results were published in the 1996-
document “The long-term performance of austenitic stainless steel in chloride

46
contaminated concrete” [57]. Test performed included visual inspections and chloride
content measurements.
The observations included:
1. 22-year exposure at Beckton with as much as 3.2% chloride resulted in no
observed corrosion for types 302, 315 and 316 SS. This applied to both
prisms and cracked beam samples.
2. After splash zone exposure at the marine site for 22 years, there were no
signs of corrosion for the same three alloys. Minor pitting attack occurred at
the point where the bars emerged from the concrete in one bar each of the
three alloys, but the pits were only ~ 20 μm deep. It is noted that chloride
content at the bar depths at the marine site at the end of the exposure were
typically only ~1% (per wt. cement).
3. The authors concluded that results indicated that austenitic stainless steel
were a suitable reinforcement chloride contaminated concrete.
2.2.2. Treat Island, ME, USA
This recent study included 2-year field-exposure experiments of ~11 mm diameter
SS rebars embedded in mortar with very low cover (~7mm) as well as bare bars, to a
high-tide marine environment near Bay of Fundy which also features ~ 100 freeze-thaw
cycles per year. The metal surface condition was sandblasted. Four SS grades were used
in this investigation: Austenitic SSs 304, 316LN, XM-28 (a Mn-austenitized SS), and
Duplex 2205. For control low alloy steels (carbon rebar as well as A1035 (MMFX)) were
evaluated as well. Results were published in the 2018 document “Corrosion resistance of
chromium-steel and stainless steel reinforcement in concrete” [58]. Tests performed
47
included visual inspections, half-cell potential, and corrosion rate by LPR. Among the
findings:
1. Mortar specimens with low alloy steel showed cracking and extensive bar
corrosion on autopsy. Mortar specimens of the other alloys had no external
sign of rust stains or spalling. On autopsy, XM-28 showed indications of
minor pitting, but no deterioration was reported for the other SS alloys.
2. Bare bars of the low alloy steels showed clear signs of extensive corrosion
damage. XM-28 showed clear signs of pitting over the general specimen
area, being the only SS material that received a degraded visual rating.
Type 304 SS showed a few pits over a very limited area. Types 316LN and
2205 showed no signs of corrosion.
3. 2205, 316 LN and 304 exhibited half-cell potentials between -100 mV and -
200 mV (SSC) (Ag/AgCl/Saturated KCl) after two years of exposure.
Moreover, the corrosion rate measured by LPR for these three SS grades
were less than 0.1 A/cm2 after two years of exposure.
4. Based on the field tests and concurrent lab tests the authors concluded that
results indicate that 316LN and 2205 “provide true immunity to corrosion
over long service-lives required for critical projects (100+ years), even in
cracked concrete conditions”.
5. PREN values were found to be not suitable to rank the corrosion resistance
of SS in alkaline environments.
6. The authors found the “chloride threshold value” concept to have weak
predictability for these applications.
48
2.2.3. Durban Bluff Coastal Site, South Africa
Ferritic SS type 3CR12 (low cost straight Cr SS, 10.5-12.5% Cr content, akin to
type 409 SS) was analyzed in two different programs. The first program involved a pickled
and passivated SS condition, with exposure in a lab facility to a simulated severe marine
exposure for 54 months. The second program, also 54 months, involved a hot rolled SS
condition (with mill scale) and two different types of exposures: One was the same
simulated environment as in the first setting, and the other was exposure in a wooden
rack placed 50 m inland from the high marine water mark of the Durban Bluff Coastal
Site. The authors deemed that the simulated exposure was much more severe than the
actual field exposure. Carbon steel rebar was evaluated for comparison as well.
Published in 1993 as “Performance of a 12% chromium steel in concrete in severe marine
environments (4 ½ years)” [59]
The first program involved 80 prisms and the second 924 prisms. Prisms were
100 x 100 x 500 mm, and 15 mm diameter SS rebars were cast with concrete cover of
12, 25, or 40 mm. Among the findings:
1. After 4.5 years of the first exposure condition in the simulated environment,
the SS had a corroded area reaching ~ 1% of the rebar surface. The
corrosion appearance was superficial. There was no cracking of any of the
concrete prisms evaluated.
2. Under the second exposure setting, the type 3CR12 SS showed pitting
corrosion signs within the first year of exposure. Carbon steel corroded
severely.
3. Pickled and passivated type 3CR12 is a viable concrete reinforcing steel.
49
2.2.4. Highway A13 Tunnel – Switzerland
Ferritic TOP12 (akin to 3CR12) and Duplex 1.4462 (akin to 318-LN or 2205) SS
were exposed for 3 years embedded in a concrete block to the deicing-salt splash zone
between two columns of a Swiss tunnel (Galerie Cianca Presella, Highway A13). Control
carbon steel rebar was evaluated as well. Published in the 2004 paper “Initiation and
corrosion propagation of stainless steel reinforcements in concrete structures” [60]. The
setting involved eight prisms 100 x 30 x 20 cm, 10 & 16 mm diameter SS rebar and 10
mm concrete cover. Tests performed included half-cell potentials, macro cell corrosion
rates or mass loss, and chloride content measurements
The authors concluded:
1. The mean half-cell potential for duplex SS was ~160 mV VS (SCE). TOP
12 SS exhibited corrosion potentials between -0.04 mV of ~320 mV VS
(SCE).
2. A mass loss of 0.06 to 0.22 mg/day was found for type TOP12 SS.
3. At rebar depth, the chloride content exceeded 1.5 % of wt. of cement.
4. Per half-cell measurements, the carbon steel bars showed corrosion
initiation after about 1 year, as well as appreciable macrocell corrosion
rates. The TOP12 bars started to show corrosion initiation after about 1.5
years and macrocell currents about 1/5 those of carbon steel, as well as
more corrosion localization than that for the carbon steel. The duplex SS
showed no signs of corrosion initiation over the entire period. Parallel lab
tests suggested that the duplex SS is resistant up to a chloride
concentration of at least 3 mol/l.

50
2.2.5. Florida Ponded SS-Reinforced Concrete Exposed Outdoors
For consistency of presentation with other parts of that work this investigation is
detailed in Section 2.3.3
2.3. SS in Concrete or Simulated Pore Solutions in Controlled Laboratory
Conditions
There are numerous laboratory investigations on the performance of SS rebar in
concrete, with a thorough sampling of those summarized in Appendix A. Many of those
have focused on the corrosion initiation stage and have been reviewed in prior documents
so will not be addressed here. The following discusses a limited selection, which throws
light on the propagation stage issues that are the focus of the present project.
2.3.1. Pit Growth on SS Rebar in Simulated Pore Water and Propagation Stage
Modeling
Of particular note is the 2007-2013 work by Hurley and Scully [3] [34] [61], which
specifically attempted to obtain information on the rate of corrosion and anticipated
duration of the propagation stage. The threshold chloride concentrations for solid 316LN
SS, 316L SS clad, 2101 LDX duplex SS, MMFX-2 (Fe-9%Cr), and carbon steel control
(ASTM A615) rebars were determined through laboratory tests in saturated Ca(OH)2 +
NaCl solutions. In its basic form the method used acceleration by anodically polarizing
the samples above the normal half-cell potential, to +200 mV SCE, and increasing Cl
concentration until a sharp increase in anodic current, indicative of passivity breakdown
was detected. A nominal chloride threshold CT, expressed as a [Cl]/[OH] ratio was thus
obtained, with the qualification that it would represent an extreme oxidizing condition
seldom encountered in concrete. Bounding CT values for carbon steel were ~0.3,
51
consistent with typical literature values. CT values for alloys in the clean, pickled
conditions increased with PREN number, to values of ~4 for MMFX-2 (again consistent
with other sources), ~10 for 2101, and ~ 50 for 316LN. The presence of mill scale strongly
degraded the CT values for the high chromium alloys, an observation consistent with other
literature as well.
Importantly, the CT potentiostatic experiments served as a base to obtain insight
on the propagation stage behavior. The anodic current evolution on passivity breakdown
was monitored for 2000 seconds, upon which the potentiostatic setting was lowered (e.g.,
by 100 mV) and the resulting current monitored for 2000s as well. The process was
repeated until the current demand vanished, indicative of having reached a repassivation
potential. The characteristic current value at each of the potentials evaluated was found
to be approximately linearly dependent on the potential value, indicating dominant ohmic
control of the anodic process in agreement with expectations on the prevalent pit
geometry and electrolyte composition. Examination of the time evolution of the polarizing
current on reaching the breakdown potential showed a fractional power time dependence
(~t1/3) of the current. Combining the above observations with an assumption of
hemispherical pit shape yielded an expression for the corrosion penetration (as pit radius)
as function of time and potential of the form
r (E.t) = k (E) t 1/3
Equation 12: Corrosion Penetration - Hemispherical Pit [3]
where E is the applied potential and k is a function of the applied potential characteristic
of each rebar material and its service environment. The function k(E) was determined

52
experimentally for each material in the saturated Ca(OH)2 + NaCl solution used, with a
concentration of NaCl equal to the CT value determined earlier.
To translate the liquid solution results into those that may apply to concrete, the
observation that pit growth was mainly ohmic-controlled was used to convert the k (E)
function measured in solution into a function kC(E) that would rule behavior in concrete,
via the anticipated difference between medium resistivities. The conversion took into
account the resistivity of each liquid solution (depending on their NaCl content) and the
anticipated resistivity formation factor (from literature data) between each liquid solution
and concrete with pore water of the same composition as the liquid solution.
The kC(E) functions were then used to calculate r(t, 0V) projections, where an
applied potential of 0V (SCE) was assumed as a nominal likely operating mixed potential
of SS rebar with pits active and the rest of the assembly in the passive condition. A
concrete cover cracking limit state criterion was proposed, reached after pit depth was
equal to a critical value XCRIT. The value of XCRIT was estimated for each material based
on plausible assumed pit size/concrete cover ratios using a literature empirical
relationship [24], where the SS rebars were assumed to result in more localized pitting
than the low alloy materials. Thus, a duration of the propagation stage tp was projected
for each material, yielding 1.1y, 1.82y, 8.9y and 24.4y respectively for carbon steel,
MMFX, 2101 and 316 LN respectively.
While based on numerous working assumptions, this approach is a promising first
step in rational forecasting of the duration of the propagation stage of SS rebar in
concrete, and it appears to be the most advanced model available to date. Areas of
improvement, to be explored and developed in the present project whenever feasible,
53
include (but not limited to) use of the experimental evidence on duration of that stage
found in this review as a validation and calibration of the inputs to the model, improving
the treatment of the relationship between pit geometry, critical corrosion penetration and
concrete cover, the application of the model to limit states other than cover cracking, and
extension to the case of preexisting concrete cracking.
2.3.2. Initiation/Propagation Stages of SS-reinforced Concrete
While focused on corrosion threshold determination methodology, this very recent
2018 publication [62] also includes an approach to quantify the length of the corrosion
propagation stage. Alloys examined were austenitic types 304L, 316L, and duplex 2001,
2304 and 2205. These were placed in concrete with ~30 mm cover, ponded with a 1 M
Cl solution at the top. Cl ingress was accolated by creating a top-to bottom electric field
with polarity to drive Cl downwards, using an electrode at the pond and another at the
bottom of the concrete specimen, leaving the bar at open circuit conditions. The
procedure is similar to that described for one of the exposure conditions next subsection,
with the difference of partial masking of the rebar surface to minimize obscuring stray
current effects. The authors propose that this procedure avoids artifacts, leading to a
more precise determination of the chloride threshold and of corrosion rates (by
polarization resistance measurements) after the threshold is reached and the steel is
allowed to corrode undisturbed at the prevalent Cl level at the bar surface (measured by
subsequent autopsy). Tests were conducted with six specimens of each alloy; not all
specimens achieved stable depassivation so the thresholds were interpreted in statistical
terms. Threshold values were found to increase with PREN value, Threshold values (for
50% probability of depassivation) ranged from ~2.5% cement wt for PREN=~19 (type
54
2201) to ~4.5 % for PREN =~37 (type 2205). Corrosion rates (as icorr) were correlated
with prevalent chloride content for each specimen that achieved depassivation, fitting to
an empirical functional relationship that had been proposed earlier for carbon steel rebar
corrosion in concrete [63]:
ln (icorr) = A + B ln(CCl-)
Equation 13: Corrosion Rate as Function of Cl-Content [62]
where A and B are constants for each alloy and CCl- is the chloride content in wt % cement
at the rebar surface measured for each specimen of the group. Combining Equation 13
with an estimate of the amount of chloride at the bar surface as function of time (choosing
a simple diffusional chloride penetration scenario) yields a forecast of corrosion rate as a
function of time. That forecasting approach is interesting as it mathematically integrates
both the initiation and propagation stages. Using probabilistic estimates from the
regression used to evaluate the data from multiple specimens, and assuming a pitting
factor of 10, thought to be representative of corrosion of SS in concrete, the authors
developed for each alloy forecasts of the amount of corrosion penetration as function of
service time in a typical marine application. Results, exemplified for a 2 mm corrosion
limit state penetration at 10% probability, project service life of 10 years for carbon steel,
>25 years for 304L, > 30 years for 2001, 45 years for 2304, 85 years for 316-L and ≫ 100
years for 2005. This type of analysis needs careful examination to separate the effects
from increased threshold from those of decreased propagation rate, and such
examination should be conducted in follow-up within the present project. Some indication
can be obtained however from graphic representations of results as shown in the paper.
Those suggest propagation stage damage rates that are smaller than those of carbon
55
steel by factors of 2-3 times for types 304L and 2001, ~ 4-10 times for types 316L and
2304, and ≫10 times for type 2205.
2.3.3. Completion of Propagation Stage in Florida Ponded SS-Reinforced Concrete
Another recent investigation representing major findings in documenting the
completion of the propagation stage was documented by Presuel-Moreno in a 2013 report
to FDOT [31] [30], for work performed at Florida Atlantic University (FAU). That work
resulted in heretofore-rare evidence of concrete cracking induced by SS rebar corrosion
in 3 classes of exposure.
2.3.3.1. The First Exposure Class
Concerned an outdoors test yard exposure (listed here instead of in Section 2.3
for consistency with presentation of the other two classes in this work). This exposure, a
legacy from prior work [64] was near the seashore at Boca Raton, FL, of 15 wt% NaCl-
ponded reinforced concrete prisms containing two rebar mats, the upper mat beneath the
pond with 1-inch concrete cover having a 1/16 inch wide opening simulating a transversal
crack. Two concrete admixtures were used for preparing the deck specimens. The first
admixture included 300 kg/m3 of cement, water-cement ratio of 0.41. The second
admixture had 213 kg/m3 of cement and a water-cement ratio of 0.5. Testing was
performed in triplicate (six specimens for each condition). Solid bar of SS types 304, 316,
2304 and 3CR12 were evaluated. The first three categories were exposed for periods of
3.6, 10 and 8 years respectively without any signs of concrete cover cracking in any type
of concrete. The last, 3CR12, showed cover cracking that had developed to the side of
the initial simulated crack in two specimens of w/c=0.5 after 5.2 years. One of those
specimens was autopsied revealing an extensive accumulation of corrosion products on
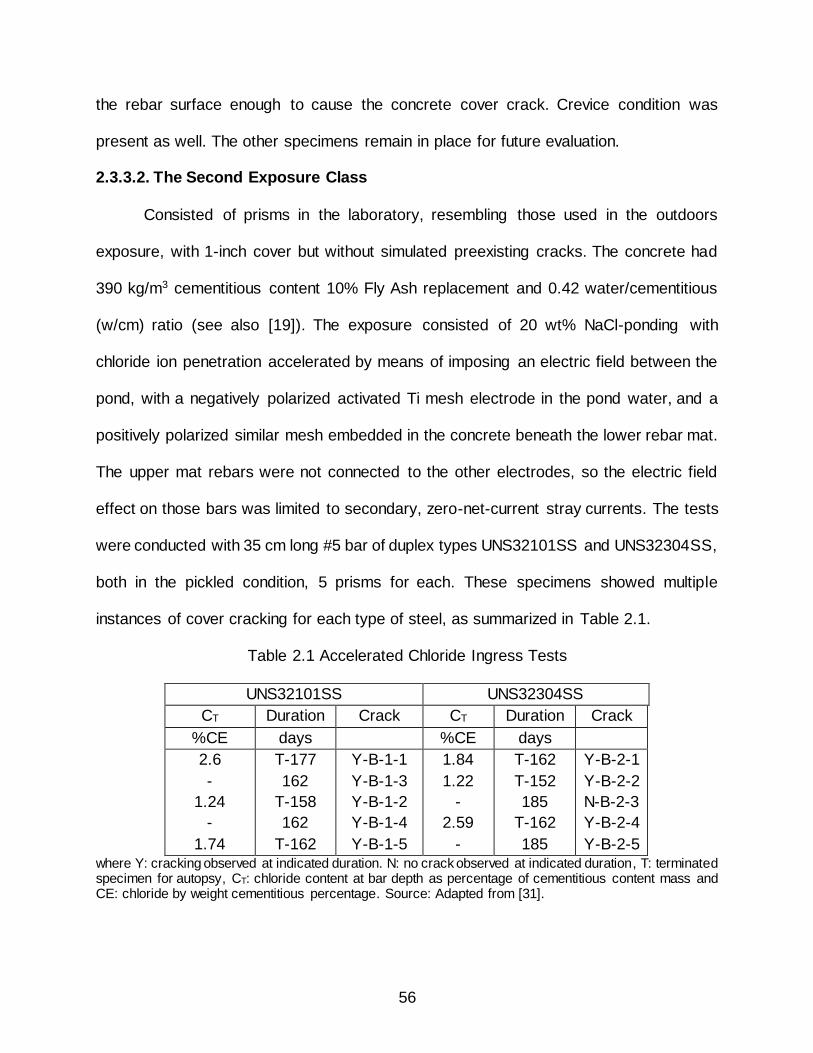
56
the rebar surface enough to cause the concrete cover crack. Crevice condition was
present as well. The other specimens remain in place for future evaluation.
2.3.3.2. The Second Exposure Class
Consisted of prisms in the laboratory, resembling those used in the outdoors
exposure, with 1-inch cover but without simulated preexisting cracks. The concrete had
390 kg/m3 cementitious content 10% Fly Ash replacement and 0.42 water/cementitious
(w/cm) ratio (see also [19]). The exposure consisted of 20 wt% NaCl-ponding with
chloride ion penetration accelerated by means of imposing an electric field between the
pond, with a negatively polarized activated Ti mesh electrode in the pond water, and a
positively polarized similar mesh embedded in the concrete beneath the lower rebar mat.
The upper mat rebars were not connected to the other electrodes, so the electric field
effect on those bars was limited to secondary, zero-net-current stray currents. The tests
were conducted with 35 cm long #5 bar of duplex types UNS32101SS and UNS32304SS,
both in the pickled condition, 5 prisms for each. These specimens showed multiple
instances of cover cracking for each type of steel, as summarized in Table 2.1.
Table 2.1 Accelerated Chloride Ingress Tests
UNS32101SS UNS32304SS
CT Duration Crack CT Duration Crack
%CE days %CE days
2.6
-
1.24
-
1.74
T-177
162
T-158
162
T-162
Y-B-1-1
Y-B-1-3
Y-B-1-2
Y-B-1-4
Y-B-1-5
1.84
1.22
-
2.59
-
T-162
T-152
185
T-162
185
Y-B-2-1
Y-B-2-2
N-B-2-3
Y-B-2-4
Y-B-2-5 where Y: cracking observed at indicated duration. N: no crack observed at indicated duration, T: terminated specimen for autopsy, CT: chloride content at bar depth as percentage of cementitious content mass and CE: chloride by weight cementitious percentage. Source: Adapted from [31].

57
The chloride content observed on autopsy (shortly after crack appearance) was
relatively modest compared with the threshold values often reported for SS in concrete,
suggesting that residual stray currents may have been a major driver of the corrosion
damage.
There was significant rust development in the bars from autopsied specimens.
Mass loss as little as 0.65 gr caused a surface crack on specimens with UNS32304. The
smallest mass loss observed on UNS32101 was ~1.4 gr, but it is likely that a crack
appeared when corrosion mass loss had not been as pronounced. It is noted that for the
specimen dimensions used, a 1 gr mass loss would nominally correspond to an average
radius loss of ~ 8 m. However, if all the corrosion would be concentrated in only a 2.5
cm length of the bar, the average radius loss for 1 gr mass loss there would be ~100 m.
That value would exceed the value of XCRIT ~ 60 m estimated for that level of corrosion
localization using the empirical relationship by Torres [24] developed for carbon steel
rebar thus forecasting cracking. Since that is as observed, the results are not inconsistent
with a proposition that the XCRIT value for SS is comparable to that of carbon steel. The
authors of the report analyzed the matter further; while recognizing uncertainty in the
effective size of the corroded zone, they concluded that XCRIT for SS could be
significantly greater than for carbon steel if the corrosion is limited to only one side of the
rebar surface and further localized by pitting.
2.3.3.3. The Third Exposure Class
Consisted of evaluating #4 bars of type 304 SS as well as #5 bars of duplex types
2304SS and 2101SS under strong natural acceleration: very low cover (~1 cm), mortar
with high w/c (0.5), and high chloride solution (15% NaCl, ~ 2M Cl) ponding, initially
58
continuous wet then alternating wet/dry. The bars were evaluated in three conditions: C:
as-received pickled, H: with lab-induced mill scale by air oven heating at 1000 C for 1 hr,
and S: lab mill-scaling followed by sandblasting. Half-cell potentials and linear polarization
resistance (LPR) were monitored as function of time for 700 days. Additional tests, not
discussed here, involved specimens with 0.41 w/c and longer exposures with tests still in
progress.
“C” specimens of type 304 SS and 2304 tended to retain potentials in the order of
-200 mV SCE over much of the test period, while the 2101 SS experienced a significant
potential drop by day 200. LPR results tended to give results (relatively high values)
consistent with the OCP data, and supporting the use of the latter as corrosion monitoring
method. The H and S conditions tended to show, starting early in the exposure and for all
3 alloys, OCP values that were more negative, and LPR values smaller, than for the C
condition. Several specimens were terminated by about day 300, and visual examination
of the rebar surface trace showed appearance consistent with the indications of the
electrochemical data. The results supported the greater corrosion resistance of types 304
and 2304 compared with 2101, and clearly confirmed the detrimental effect of mill scale
presence, also favoring the interpretation that abrasive blasting does not provide sufficient
mitigation of that effect. Importantly, after 300 days exposure one each of the H and S
type 2101SS specimens had visible ponded surface cracking. None of the other
conditions of either alloy showed cracking at that time. Chloride content analysis of rebar
traces in the terminated specimens suggested that a lower bound for the corrosion
threshold (general observations for all surface conditions) was >~5.9% for types 2101SS
and 2304SS and >~4.7% for type 304SS. The authors warn that those figures might have

59
been subject to overestimation in the case of type 2101 because of late preferential
chloride ingress at the cracks noted above.
2.3.4. Performance of Austenitic and Duplex SS in Cracked Concrete
This investigation, led by Hansson was published in a 2015 paper [7] and
addresses an important target area where specification of SS reinforcement is a mean of
controlling corrosion in the face of a concrete deficiency that is essentially inevitable.
Three austenitic types (304 SS, 316SS and S24100 (a Mn-austenitized grade with
samples from 2 suppliers)) and 3 duplex (2101, 2205, 2304) were evaluated, including
carbon steel bar controls bars were sizes #5 - #6, presumably in an as-received pickled
condition, placed in ponded concrete prisms with 25 mm cover, made with cement + slag
(297 + 98 kg/m3 respectively, 0.4 w/c. Both transversal and longitudinal cracks were
created, leaving also control conditions with no cracks. Aggressive brine with near-
saturated chloride content was continuously placed in the pond. OCP and galvanostatic
pulse tests were regularly conducted. Specimens were autopsied after 400-550 days
exposure.
Results showed no significant corrosion in sound concrete of any of the SS or even
the carbon steel. In contrast, for all the SSs (with the possible exception of some of the
type 2205 samples) some corrosion was observed at the intersection of bars and the
cracks. Initiation was thought to take place early in the test exposure but neither OCP nor
current density tests yielded consistent enough results to assess a precise moment of
corrosion initiation. Indeed, the authors concluded that the recommendations of ASTM
876 for interpretation of corrosion potentials of carbon steel bar cannot be applied freely
to SS rebar, and more detailed guidelines for that are needed.

60
Corrosion morphology was uneven, with some indication that corrosion and its
products often migrated along the surface of the rebar and away from the intersection of
the rebar and a transversal crack. The duplex grades tended to outperform the austenitic
grades, not surprising for S24100 given its low PREN, but unusual for the type 316SS
which fared low in the corrosion product visual examination. Surface flaws on the latter
were mentioned by the authors as a possible cause, which might be eliminated with more
strict surface control in production.
The authors concluded that structural cracks in concrete are a major concern in
corrosion vulnerability. It was noted however that test exposure conditions (very high
chloride concentrations with low cover and at lab temperatures much lower than those
normal in deicing salt regimes) were particularly harsh. With the cover thicknesses
present in actual field conditions some crack healing or blocking by corrosion products
would be expected and provide corresponding mitigation. Some reduction in corrosion
rate with time was observed in the tests possibly due to those mitigating effects.

61
CHAPTER 3: EXPERIMENTAL METHODOLOGY
3.1. Overview
Concrete specimens reinforced with UNS S41000 SS and AISI1018 CS were
prepared to determine whether corrosion of stainless steel in concrete can be detected
by methods traditionally used for carbon steel reinforcement, and to what extent
localization of corrosion of stainless steel compares with that of carbon steel in concrete.
The geometry of specimens was 5 cm wide, 6.4 cm height, and ~180 cm long as
shown in Figure 3.1 and Figure 3.3. Both types of steel were round bars with ~6-feet long,
0.5-inch diameter. Concrete specimens were made in triplicate per type of reinforcing
steel. Two types of concrete mix design were used: Chloride-free concrete and chloride
contaminated concrete admixed with 5.84% of chloride ions by weight of cement. All
specimens were prepared at the corrosion laboratory at the University of South Florida.
The surface condition of the reinforcement was annealed in the case of SS and
cold rolled for CS. Both reinforcements were cleaned with acetone before concrete
placement. Preliminary half-cell potential measurements were performed with a saturated
calomel reference electrode (SCE) on the concrete specimens as a function of time and
position (Potential Mapping). Furthermore, preliminarily electrochemical impedance
spectroscopy (EIS) and concrete resistivity measurements were applied regularly as well.
The specimens were not terminated since future studies will be derived from this
investigation.
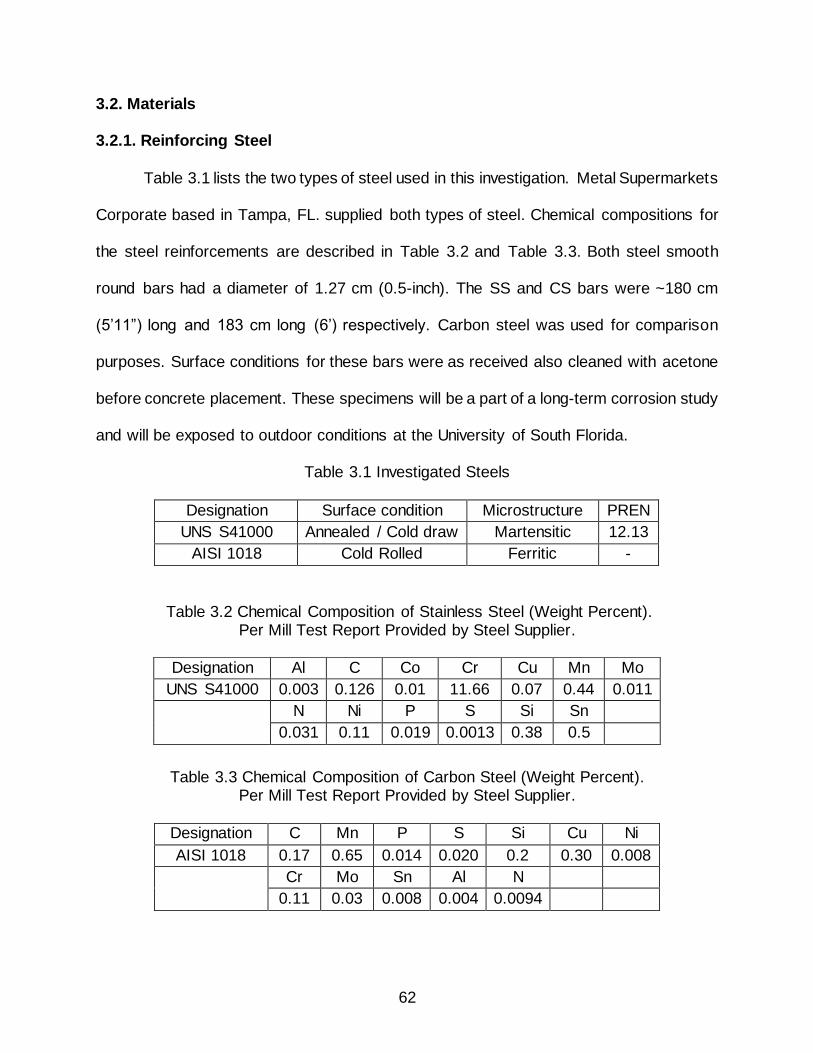
62
3.2. Materials
3.2.1. Reinforcing Steel
Table 3.1 lists the two types of steel used in this investigation. Metal Supermarkets
Corporate based in Tampa, FL. supplied both types of steel. Chemical compositions for
the steel reinforcements are described in Table 3.2 and Table 3.3. Both steel smooth
round bars had a diameter of 1.27 cm (0.5-inch). The SS and CS bars were ~180 cm
(5’11”) long and 183 cm long (6’) respectively. Carbon steel was used for comparison
purposes. Surface conditions for these bars were as received also cleaned with acetone
before concrete placement. These specimens will be a part of a long-term corrosion study
and will be exposed to outdoor conditions at the University of South Florida.
Table 3.1 Investigated Steels
Designation Surface condition Microstructure PREN
UNS S41000 Annealed / Cold draw Martensitic 12.13
AISI 1018 Cold Rolled Ferritic -
Table 3.2 Chemical Composition of Stainless Steel (Weight Percent). Per Mill Test Report Provided by Steel Supplier.
Table 3.3 Chemical Composition of Carbon Steel (Weight Percent).
Per Mill Test Report Provided by Steel Supplier.
Designation C Mn P S Si Cu Ni
AISI 1018 0.17 0.65 0.014 0.020 0.2 0.30 0.008
Cr Mo Sn Al N
0.11 0.03 0.008 0.004 0.0094
Designation Al C Co Cr Cu Mn Mo
UNS S41000 0.003 0.126 0.01 11.66 0.07 0.44 0.011
N Ni P S Si Sn
0.031 0.11 0.019 0.0013 0.38 0.5

63
3.2.2. Concrete
Two concrete mix designs were used, for chloride free and chloride contaminated
concrete respectively. The chloride-free concrete mix design was prepared to approach
the technical requirements given by the FDOT for the Class IV concrete [21] summarized
in Table 3.4. The chloride free concrete proportions for this investigation are summarized
in Table 3.5. The nominal volume of chloride-free concrete used was 20.2 liters. The
coarse aggregate was Florida limestone with nominal maximum size (3/8 in), 2.28-bulk
specific gravity in saturated surface dry (SSD) condition and 7.42% absorption capacity
following the ASTM C127. The fine aggregate was standard silica sand per FDOT grading
requirements.
Table 3.4 Concrete Class IV - FDOT Design Requirements
Criteria Minimum Requirement
Cement content 658 pcy
Water to cement ratio 0.41
Source: Adapted from [21].
Table 3.5 Chloride Free Concrete - Mix Proportions
Material pcy kg/m3 Batch (kg)
Cement 658 390 7.88
Water 270 160 3.23
Fine aggregate (SSD) 1428 847 17.09
3/8 Coarse Aggregate (SSD) 1486 881 17.79
Total Weight 3841 2279 45.99
The chloride-contaminated concrete included 5.84 % of chloride ions by weight of
cement to accelerate the onset of corrosion and allow the study the CPS of SS in
concrete. Certified Sodium Chloride (NaCl) from Fisher Scientific CO LLC was used to
reach the anticipated chloride content. Previous investigations found that chloride ions
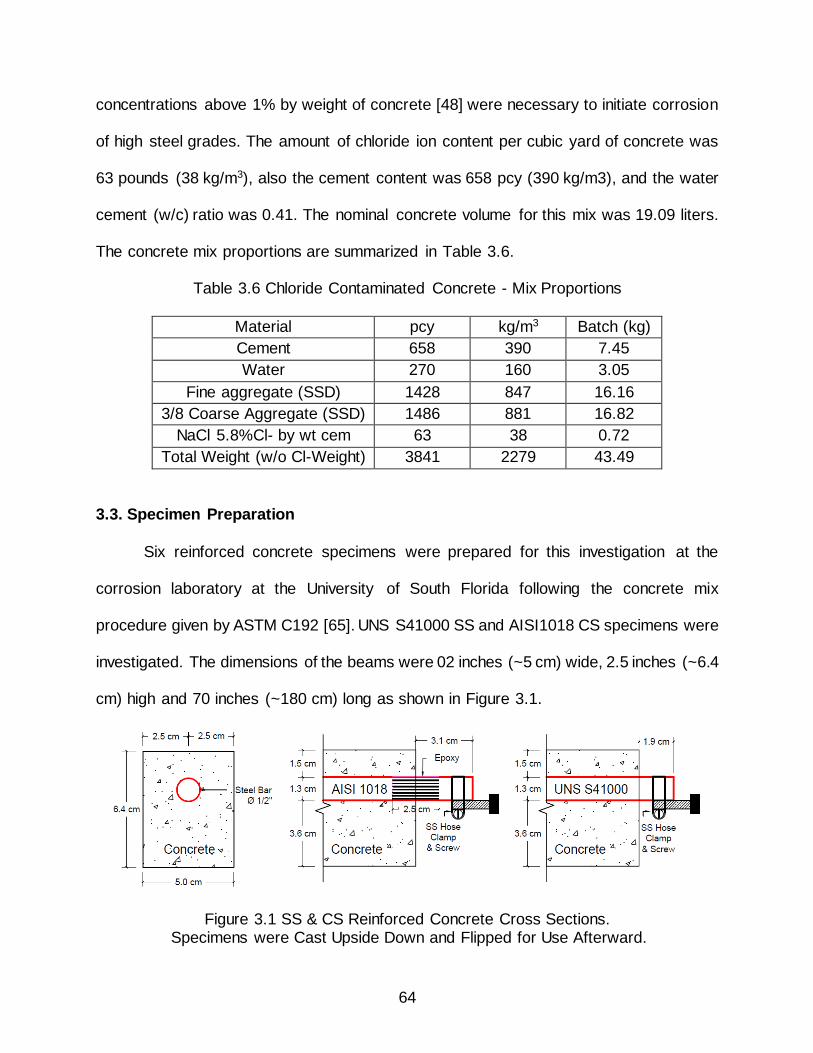
64
concentrations above 1% by weight of concrete [48] were necessary to initiate corrosion
of high steel grades. The amount of chloride ion content per cubic yard of concrete was
63 pounds (38 kg/m3), also the cement content was 658 pcy (390 kg/m3), and the water
cement (w/c) ratio was 0.41. The nominal concrete volume for this mix was 19.09 liters.
The concrete mix proportions are summarized in Table 3.6.
Table 3.6 Chloride Contaminated Concrete - Mix Proportions
Material pcy kg/m3 Batch (kg)
Cement 658 390 7.45
Water 270 160 3.05
Fine aggregate (SSD) 1428 847 16.16
3/8 Coarse Aggregate (SSD) 1486 881 16.82
NaCl 5.8%Cl- by wt cem 63 38 0.72
Total Weight (w/o Cl-Weight) 3841 2279 43.49
3.3. Specimen Preparation
Six reinforced concrete specimens were prepared for this investigation at the
corrosion laboratory at the University of South Florida following the concrete mix
procedure given by ASTM C192 [65]. UNS S41000 SS and AISI1018 CS specimens were
investigated. The dimensions of the beams were 02 inches (~5 cm) wide, 2.5 inches (~6.4
cm) high and 70 inches (~180 cm) long as shown in Figure 3.1.
Figure 3.1 SS & CS Reinforced Concrete Cross Sections. Specimens were Cast Upside Down and Flipped for Use Afterward.

65
As shown in Figure 3.1, the SS specimens and CS bars are projecting out
approximately 3.1 cm and 1.9 cm respectively from the concrete block at one of the ends.
Figure 3.1 also shows in the CS-reinforced specimen cross section, that the steel bar was
epoxy-coated at both ends, at outside and inside of the concrete contact area
approximately 0.5 inches.
All specimens were reinforced with either UNS S41000 SS bars or AISI 1018 CS
bars per triplicate as shown in Figure 3.8. Specimens were cast upside down and flipped
for use afterward. Initially, the reinforcement was located at the bottom surface of the
specimen with a concrete rebar cover of 1.5 cm measured from the bottom surface of the
specimen to the steel. Mold release agent was applied to the wood form before concrete
placement. These six specimens were cast in the same wood mold as displayed in Figure
3.2.
Figure 3.2 Wood Mold Coated with a Mold Release Agent. Polystyrene Foam and 3D Printed Spacers were in Place to Keep the Concrete Cover
Continuous.
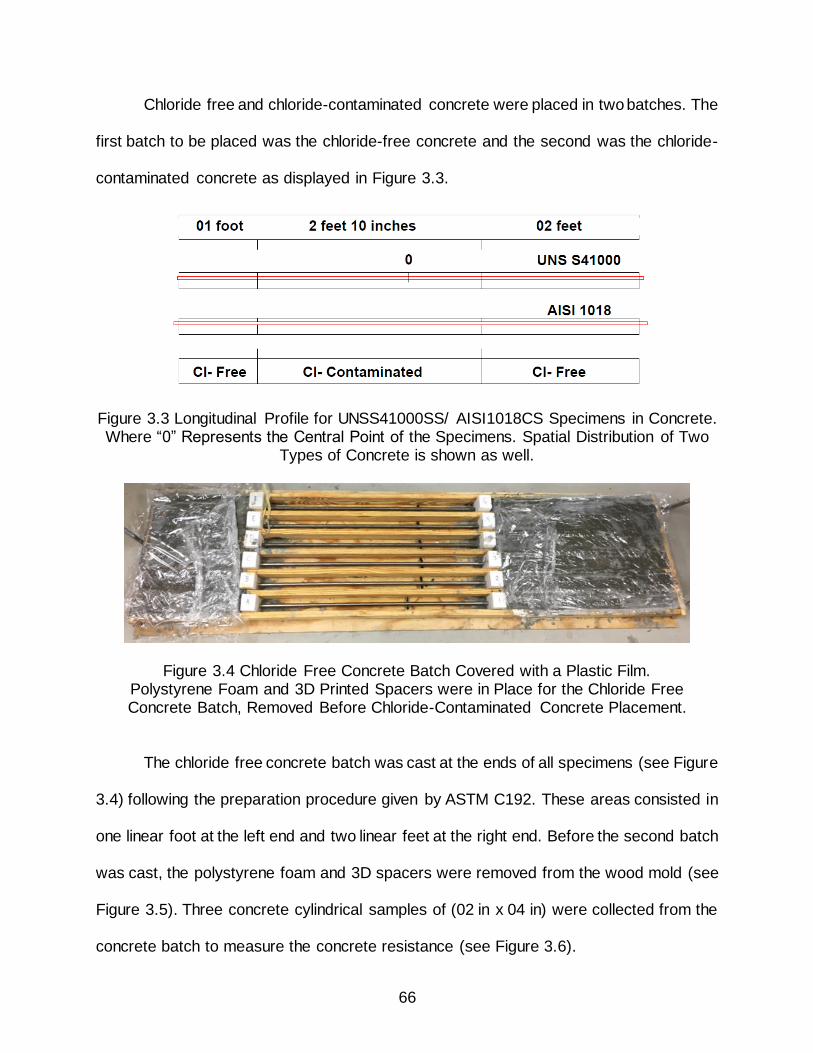
66
Chloride free and chloride-contaminated concrete were placed in two batches. The
first batch to be placed was the chloride-free concrete and the second was the chloride-
contaminated concrete as displayed in Figure 3.3.
Figure 3.3 Longitudinal Profile for UNSS41000SS/ AISI1018CS Specimens in Concrete. Where “0” Represents the Central Point of the Specimens. Spatial Distribution of Two
Types of Concrete is shown as well.
Figure 3.4 Chloride Free Concrete Batch Covered with a Plastic Film. Polystyrene Foam and 3D Printed Spacers were in Place for the Chloride Free Concrete Batch, Removed Before Chloride-Contaminated Concrete Placement.
The chloride free concrete batch was cast at the ends of all specimens (see Figure
3.4) following the preparation procedure given by ASTM C192. These areas consisted in
one linear foot at the left end and two linear feet at the right end. Before the second batch
was cast, the polystyrene foam and 3D spacers were removed from the wood mold (see
Figure 3.5). Three concrete cylindrical samples of (02 in x 04 in) were collected from the
concrete batch to measure the concrete resistance (see Figure 3.6).

67
Figure 3.5 First Concrete Batch – Left End of All Specimens.
Figure 3.6 Three Chloride-Free Concrete Samples for Resistivity Measurements. Three Concrete Samples were Collected from the Chloride-Contaminated Concrete
Batch as well.
Following the preparation procedure given by ASTM C192, three days later, the
second concrete batch (chloride-contaminated concrete) was placed containing 5.84%
chloride ions by weight of cement, in the central section of the specimens (between the
chloride-free concrete ends) approximately 2’10” long. Three concrete cylindrical samples
of 02 in x 04 in were also collected from the concrete batch to measure concrete
resistance.
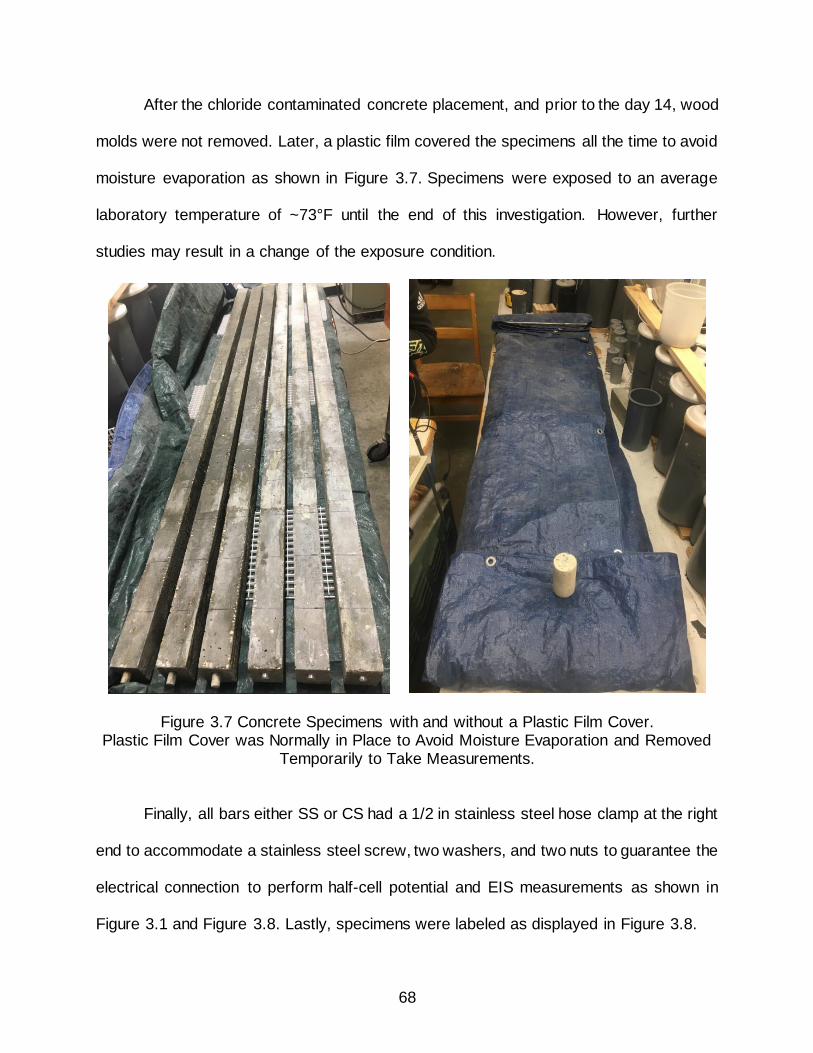
68
After the chloride contaminated concrete placement, and prior to the day 14, wood
molds were not removed. Later, a plastic film covered the specimens all the time to avoid
moisture evaporation as shown in Figure 3.7. Specimens were exposed to an average
laboratory temperature of ~73°F until the end of this investigation. However, further
studies may result in a change of the exposure condition.
Figure 3.7 Concrete Specimens with and without a Plastic Film Cover. Plastic Film Cover was Normally in Place to Avoid Moisture Evaporation and Removed
Temporarily to Take Measurements.
Finally, all bars either SS or CS had a 1/2 in stainless steel hose clamp at the right
end to accommodate a stainless steel screw, two washers, and two nuts to guarantee the
electrical connection to perform half-cell potential and EIS measurements as shown in
Figure 3.1 and Figure 3.8. Lastly, specimens were labeled as displayed in Figure 3.8.
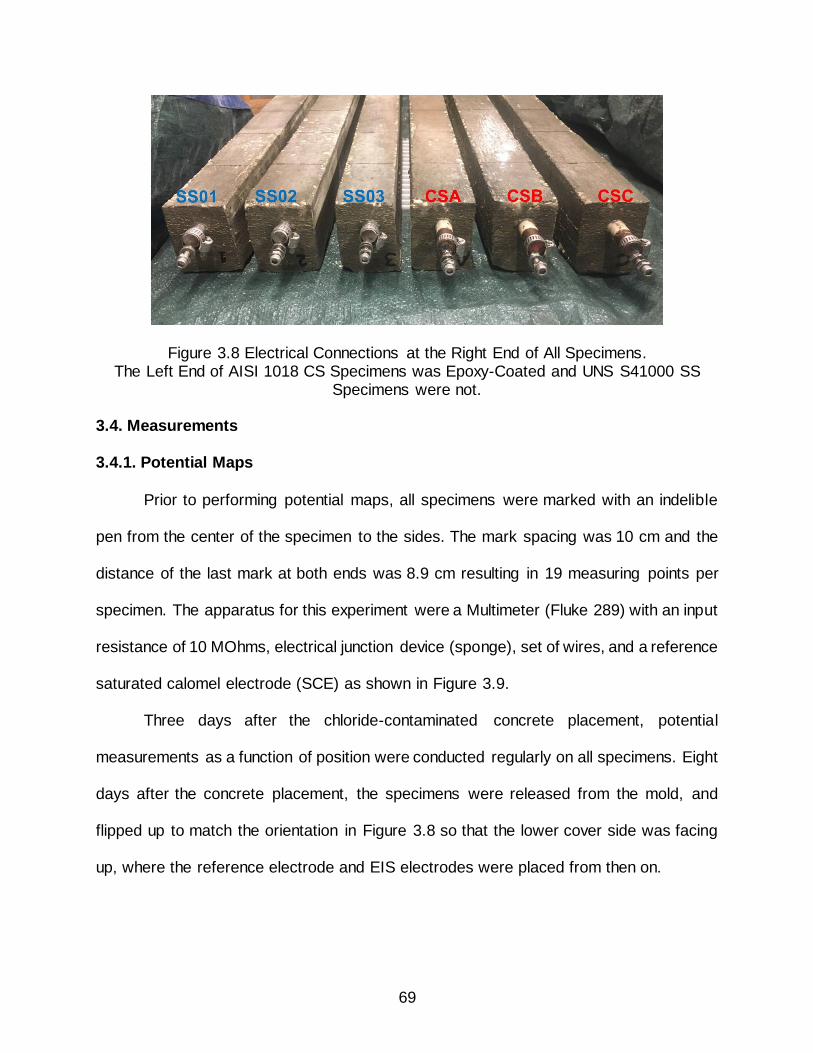
69
Figure 3.8 Electrical Connections at the Right End of All Specimens. The Left End of AISI 1018 CS Specimens was Epoxy-Coated and UNS S41000 SS
Specimens were not.
3.4. Measurements
3.4.1. Potential Maps
Prior to performing potential maps, all specimens were marked with an indelible
pen from the center of the specimen to the sides. The mark spacing was 10 cm and the
distance of the last mark at both ends was 8.9 cm resulting in 19 measuring points per
specimen. The apparatus for this experiment were a Multimeter (Fluke 289) with an input
resistance of 10 MOhms, electrical junction device (sponge), set of wires, and a reference
saturated calomel electrode (SCE) as shown in Figure 3.9.
Three days after the chloride-contaminated concrete placement, potential
measurements as a function of position were conducted regularly on all specimens. Eight
days after the concrete placement, the specimens were released from the mold, and
flipped up to match the orientation in Figure 3.8 so that the lower cover side was facing
up, where the reference electrode and EIS electrodes were placed from then on.

70
Figure 3.9 Half-Cell Potential Measurement on Specimen SS01. Reference Electrode (SCE), Electrical Junction Device (Yellow Sponge).
3.4.2. Electrochemical Impedance Spectroscopy (EIS)
EIS measurements were applied regularly to obtain the value of the polarization
resistance and then to estimate the values of corrosion rates as a function of position.
The apparatus for this experiment were a potentiostat/galvanostat device suitable for
applications in corrosion (Gamry Reference 600+), electrical junction device (sponge),
set of wires, a saturated calomel electrode (SCE), and a titanium mesh as shown in Figure
3.10. The EIS method commonly requires three electrodes to execute measurements
[10]: A working electrode (SS/CS reinforced sample), a counter electrode (Titanium
mesh), and a reference electrode (SCE).
The frequency range used in this investigation was from 100 kHz to 10 mhz, a
potential disturbance of +10 mV generated by an alternating current was applied on the
open circuit potential. Ten EIS measurements took place within one decade of frequency.
Previous pen marks on the specimens served as a reference to take EIS measurements.
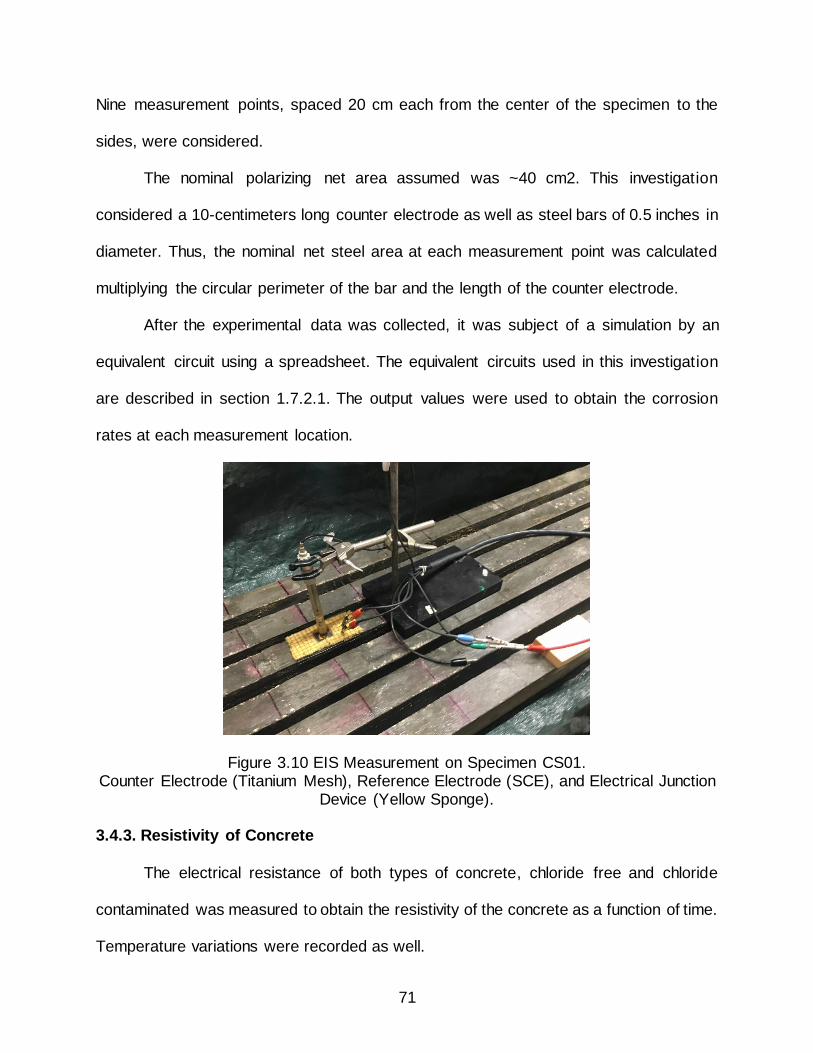
71
Nine measurement points, spaced 20 cm each from the center of the specimen to the
sides, were considered.
The nominal polarizing net area assumed was ~40 cm2. This investigation
considered a 10-centimeters long counter electrode as well as steel bars of 0.5 inches in
diameter. Thus, the nominal net steel area at each measurement point was calculated
multiplying the circular perimeter of the bar and the length of the counter electrode.
After the experimental data was collected, it was subject of a simulation by an
equivalent circuit using a spreadsheet. The equivalent circuits used in this investigation
are described in section 1.7.2.1. The output values were used to obtain the corrosion
rates at each measurement location.
Figure 3.10 EIS Measurement on Specimen CS01. Counter Electrode (Titanium Mesh), Reference Electrode (SCE), and Electrical Junction
Device (Yellow Sponge).
3.4.3. Resistivity of Concrete
The electrical resistance of both types of concrete, chloride free and chloride
contaminated was measured to obtain the resistivity of the concrete as a function of time.
Temperature variations were recorded as well.
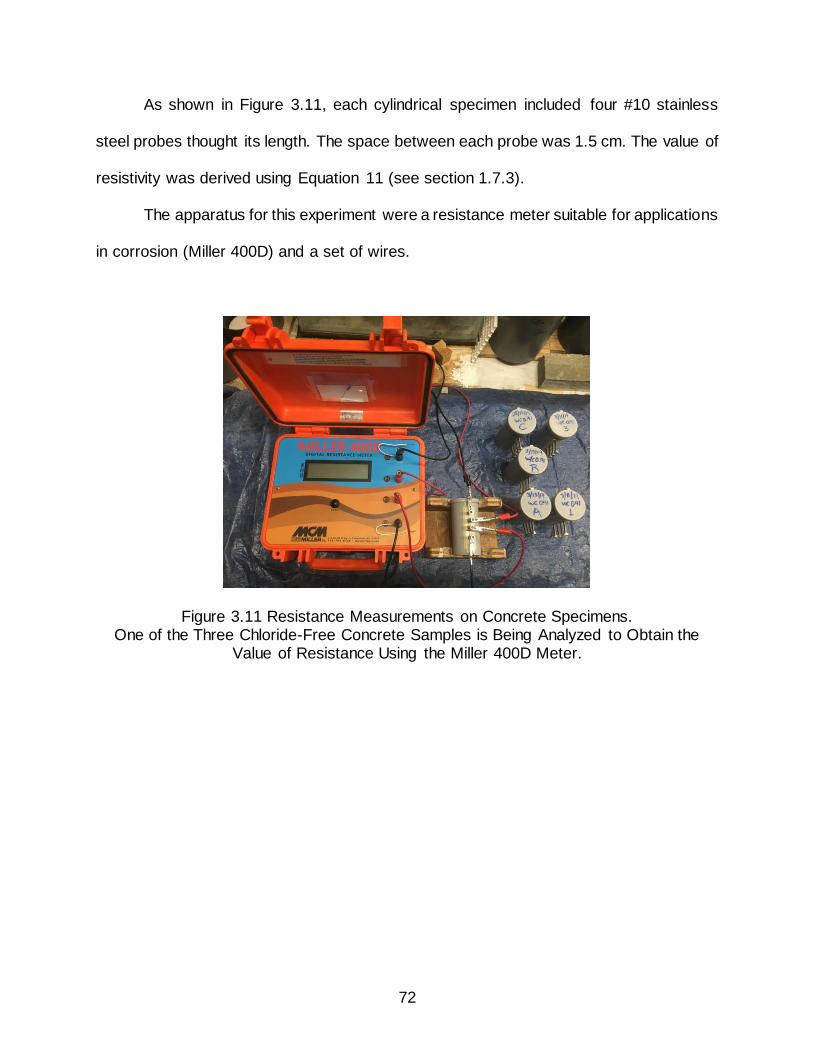
72
As shown in Figure 3.11, each cylindrical specimen included four #10 stainless
steel probes thought its length. The space between each probe was 1.5 cm. The value of
resistivity was derived using Equation 11 (see section 1.7.3).
The apparatus for this experiment were a resistance meter suitable for applications
in corrosion (Miller 400D) and a set of wires.
Figure 3.11 Resistance Measurements on Concrete Specimens. One of the Three Chloride-Free Concrete Samples is Being Analyzed to Obtain the
Value of Resistance Using the Miller 400D Meter.

73
CHAPTER 4: RESULTS
4.1. Overview
This chapter discusses the results of the initial testing procedure (half-cell
potential, EIS, and resistivity of concrete) along with the complete set of results outlined
in Chapter 3.
4.2. Potential Maps
The electrical potential measurements were performed by using a reference
saturated calomel electrode (SCE) as a function of time and position. Each measurement
was spaced 10 centimeters from each other resulting in 19 points of data per specimen.
The average and standard deviation (±) of the potential measurements were calculated
within the three specimens reinforced with the same type of steel at each measurement
point. The average potentials were plotted in potential maps. The standard deviation
represented by error bars was included as well.
After 32 days of the chloride-contaminated concrete cast, an average potential of
-380 mV ± 101 mV was developed on CS reinforced specimens in the chloride-free
concrete areas. The average potential at the chloride-free ends of the CS reinforced
specimens were -350 mV at the left end (one-foot long) and -398 mV at the right end (two-
feet long). Meanwhile, the chloride-contaminated area developed an average potential of
-571 mV ± 33 mV.
Similarly, stainless bars were embedded in two types of concrete admixtures.
Those SS areas exposed to chloride-free concrete developed an average electrical
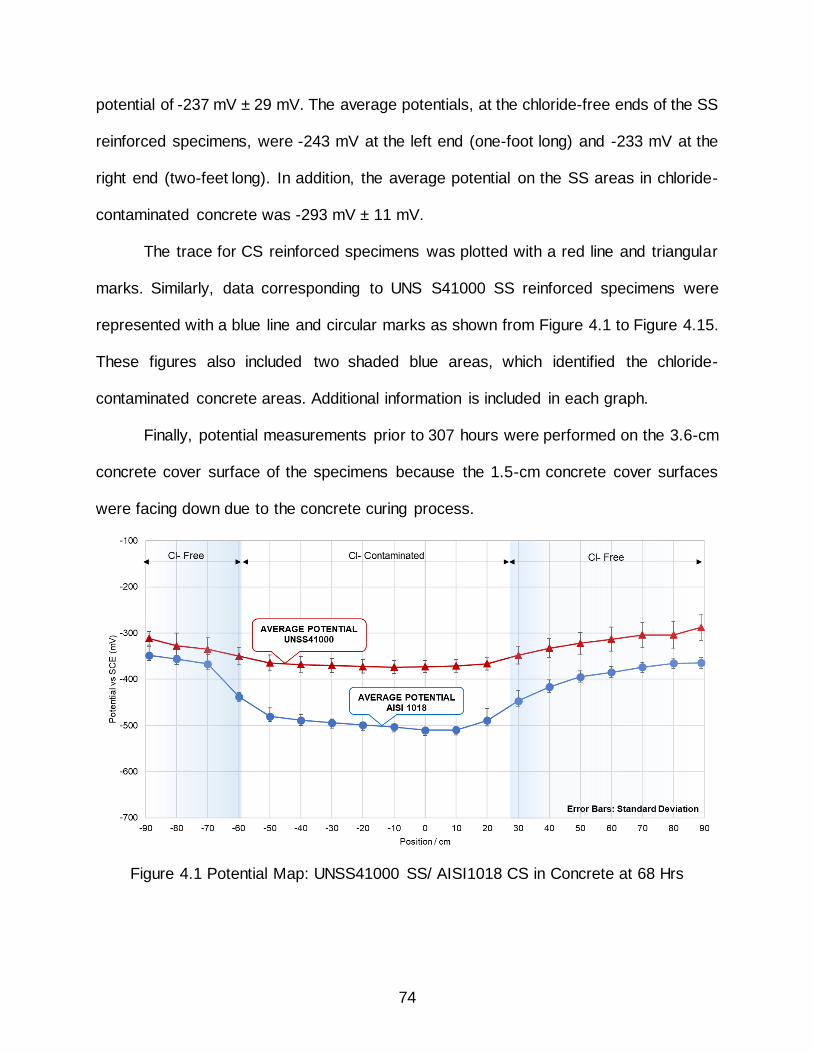
74
potential of -237 mV ± 29 mV. The average potentials, at the chloride-free ends of the SS
reinforced specimens, were -243 mV at the left end (one-foot long) and -233 mV at the
right end (two-feet long). In addition, the average potential on the SS areas in chloride-
contaminated concrete was -293 mV ± 11 mV.
The trace for CS reinforced specimens was plotted with a red line and triangular
marks. Similarly, data corresponding to UNS S41000 SS reinforced specimens were
represented with a blue line and circular marks as shown from Figure 4.1 to Figure 4.15.
These figures also included two shaded blue areas, which identified the chloride-
contaminated concrete areas. Additional information is included in each graph.
Finally, potential measurements prior to 307 hours were performed on the 3.6-cm
concrete cover surface of the specimens because the 1.5-cm concrete cover surfaces
were facing down due to the concrete curing process.
Figure 4.1 Potential Map: UNSS41000 SS/ AISI1018 CS in Concrete at 68 Hrs
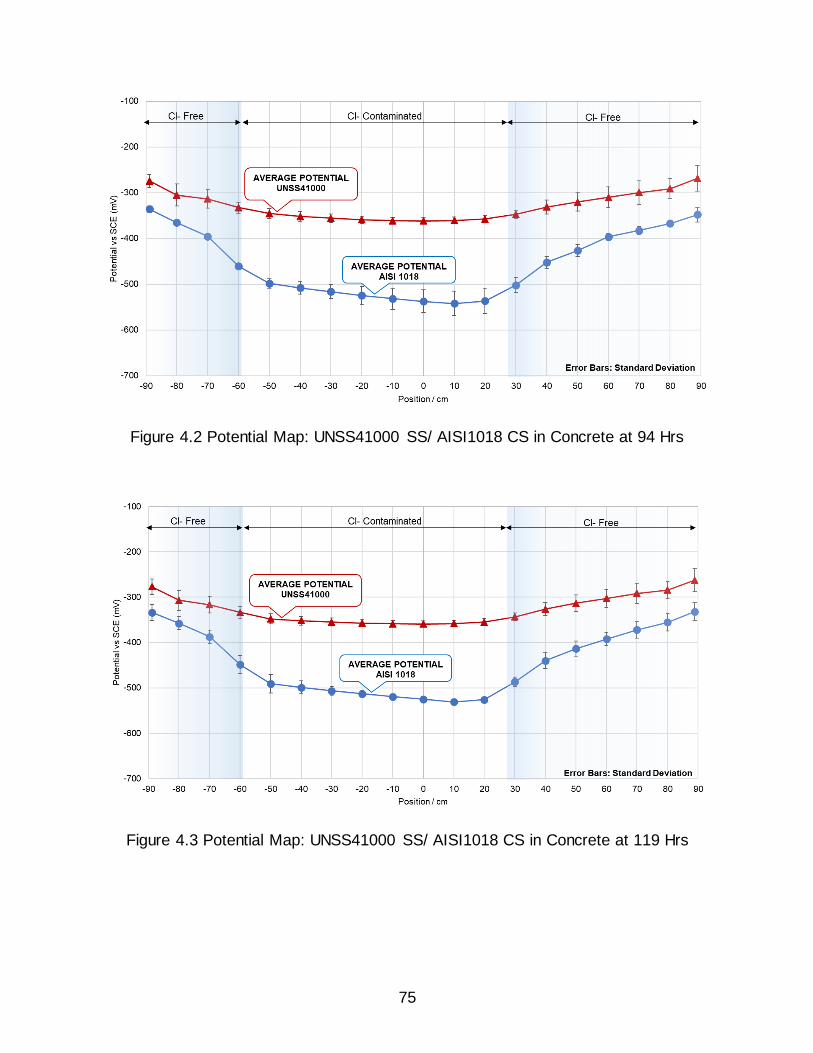
75
Figure 4.2 Potential Map: UNSS41000 SS/ AISI1018 CS in Concrete at 94 Hrs
Figure 4.3 Potential Map: UNSS41000 SS/ AISI1018 CS in Concrete at 119 Hrs
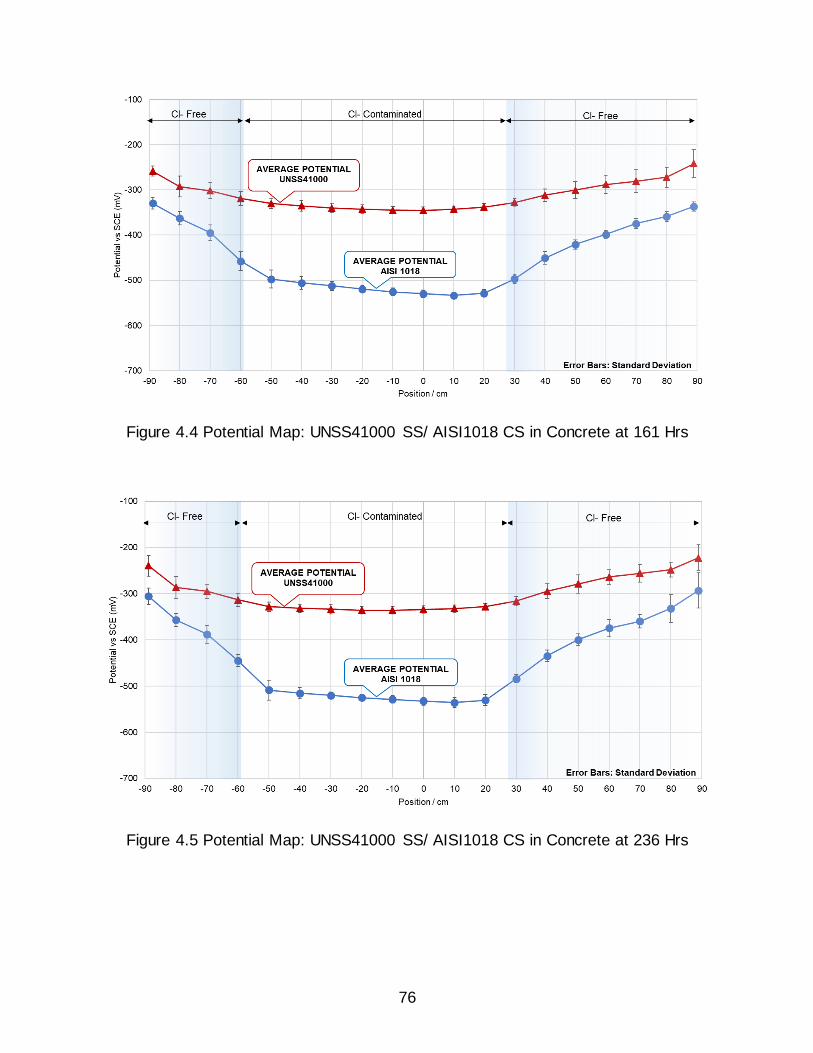
76
Figure 4.4 Potential Map: UNSS41000 SS/ AISI1018 CS in Concrete at 161 Hrs
Figure 4.5 Potential Map: UNSS41000 SS/ AISI1018 CS in Concrete at 236 Hrs
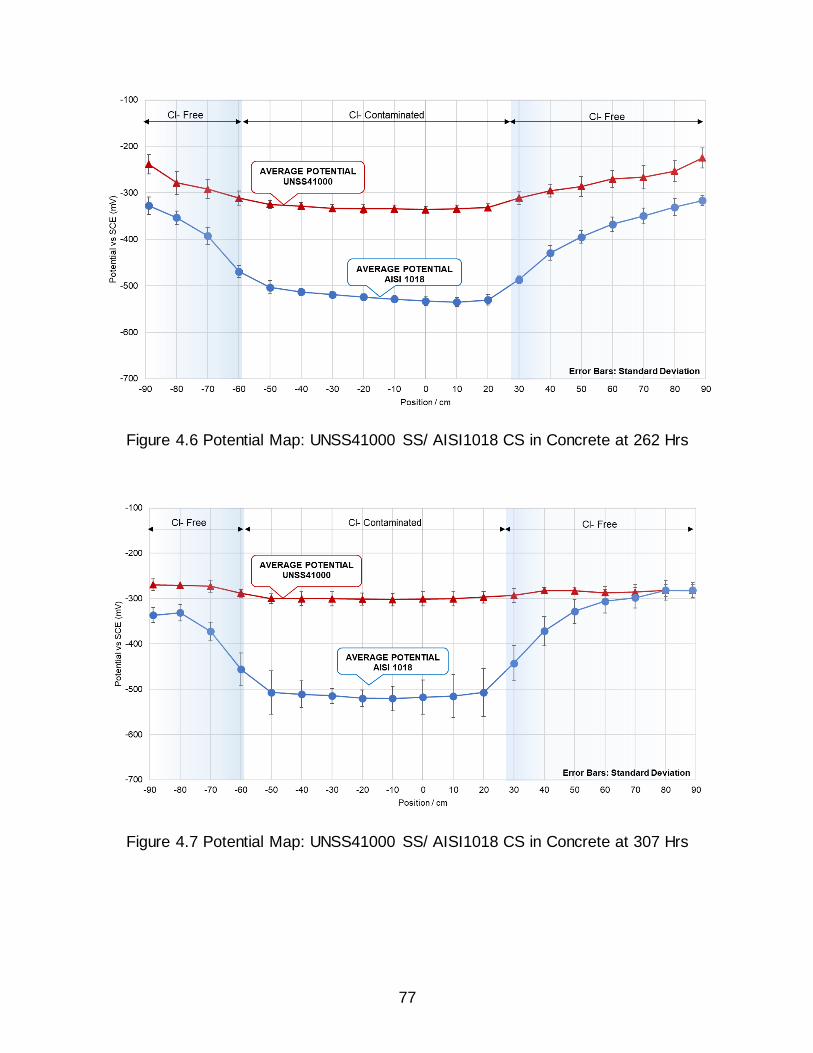
77
Figure 4.6 Potential Map: UNSS41000 SS/ AISI1018 CS in Concrete at 262 Hrs
Figure 4.7 Potential Map: UNSS41000 SS/ AISI1018 CS in Concrete at 307 Hrs
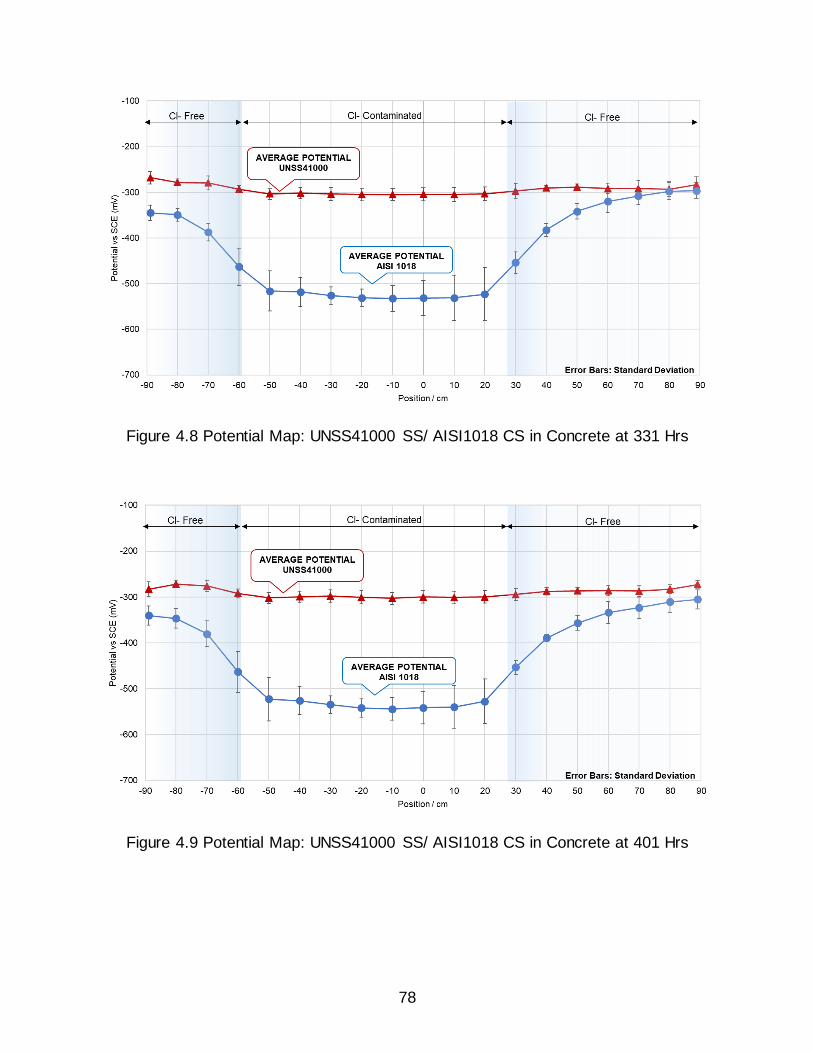
78
Figure 4.8 Potential Map: UNSS41000 SS/ AISI1018 CS in Concrete at 331 Hrs
Figure 4.9 Potential Map: UNSS41000 SS/ AISI1018 CS in Concrete at 401 Hrs
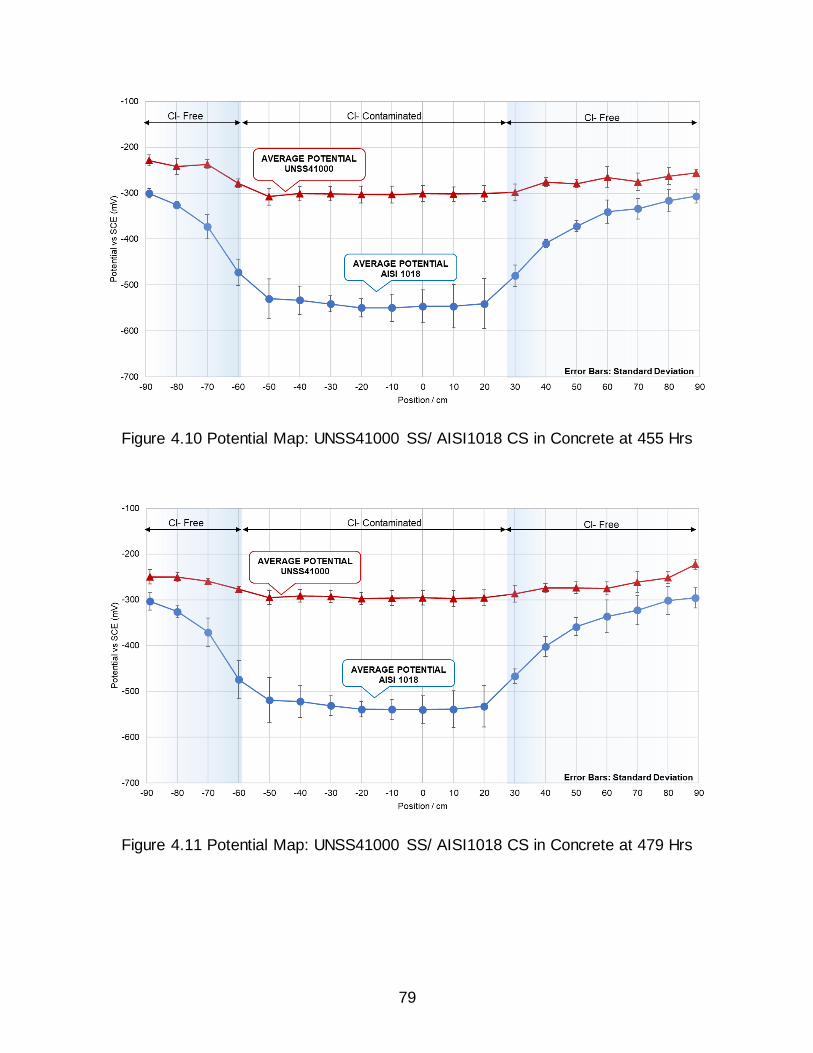
79
Figure 4.10 Potential Map: UNSS41000 SS/ AISI1018 CS in Concrete at 455 Hrs
Figure 4.11 Potential Map: UNSS41000 SS/ AISI1018 CS in Concrete at 479 Hrs
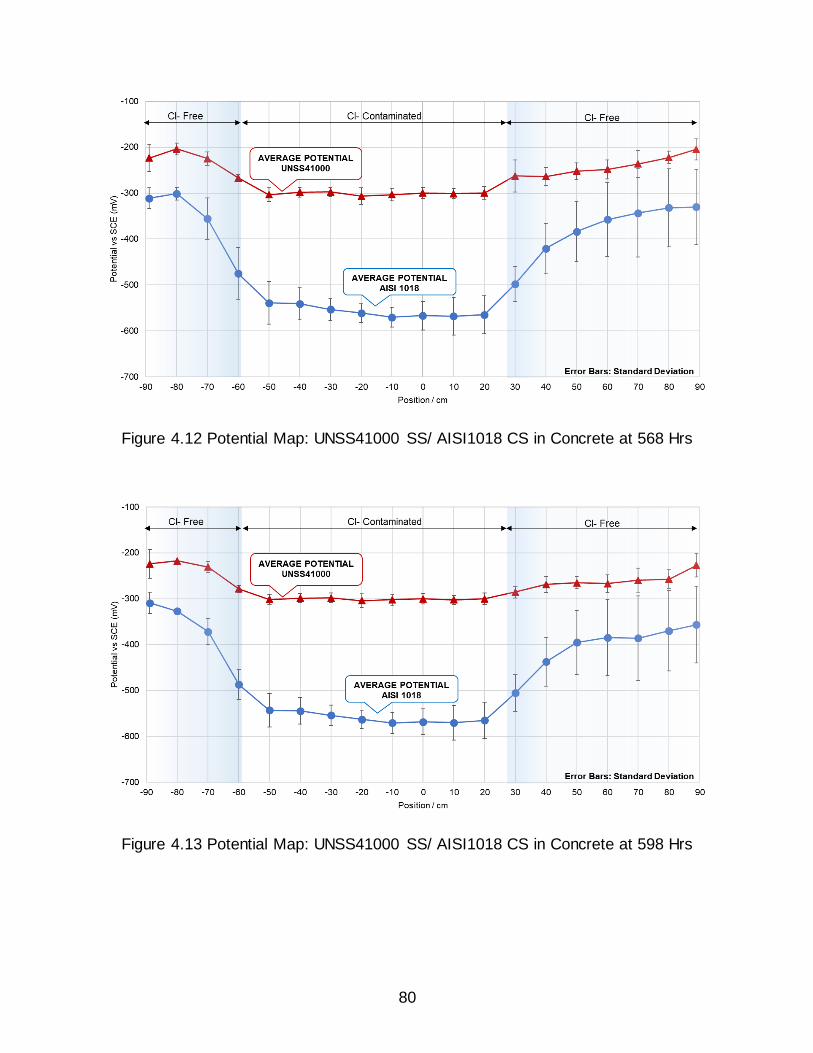
80
Figure 4.12 Potential Map: UNSS41000 SS/ AISI1018 CS in Concrete at 568 Hrs
Figure 4.13 Potential Map: UNSS41000 SS/ AISI1018 CS in Concrete at 598 Hrs
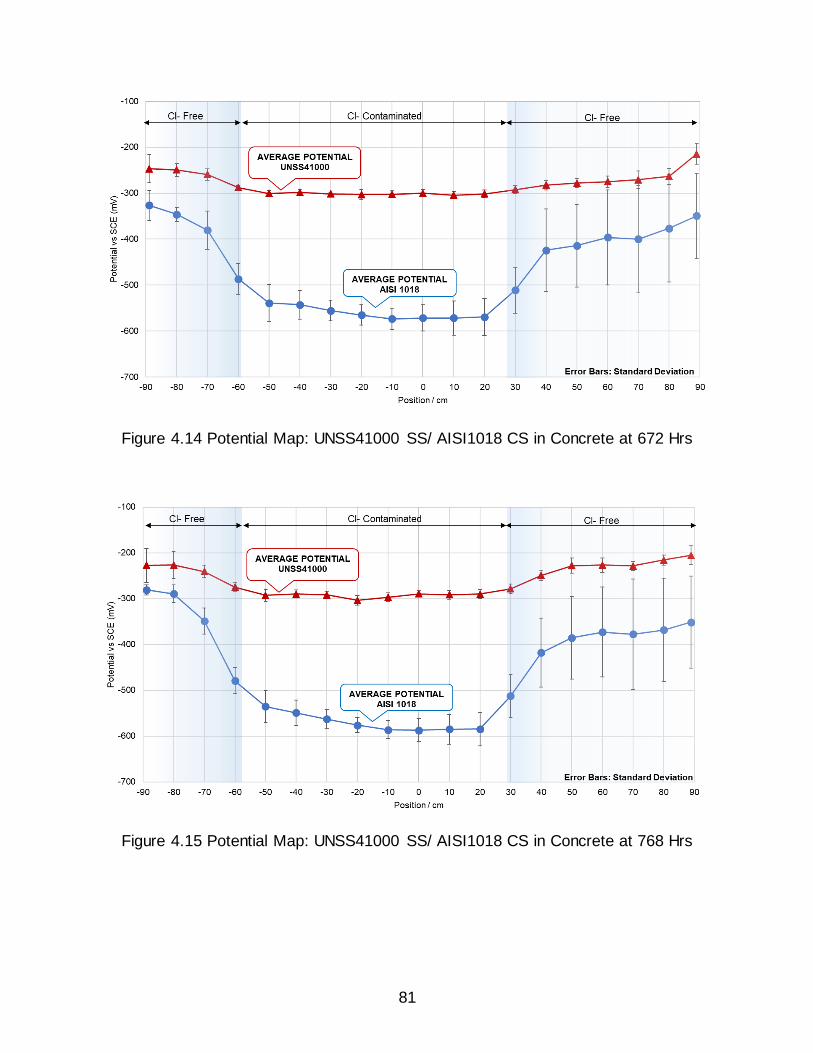
81
Figure 4.14 Potential Map: UNSS41000 SS/ AISI1018 CS in Concrete at 672 Hrs
Figure 4.15 Potential Map: UNSS41000 SS/ AISI1018 CS in Concrete at 768 Hrs
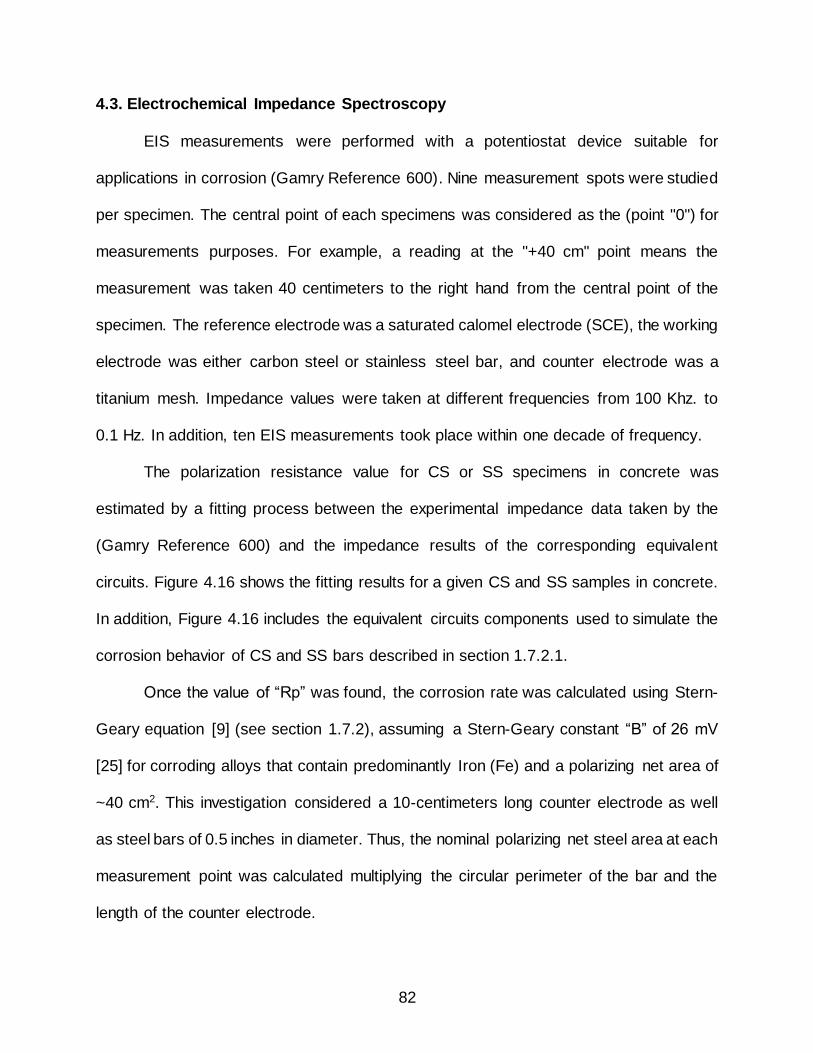
82
4.3. Electrochemical Impedance Spectroscopy
EIS measurements were performed with a potentiostat device suitable for
applications in corrosion (Gamry Reference 600). Nine measurement spots were studied
per specimen. The central point of each specimens was considered as the (point "0") for
measurements purposes. For example, a reading at the "+40 cm" point means the
measurement was taken 40 centimeters to the right hand from the central point of the
specimen. The reference electrode was a saturated calomel electrode (SCE), the working
electrode was either carbon steel or stainless steel bar, and counter electrode was a
titanium mesh. Impedance values were taken at different frequencies from 100 Khz. to
0.1 Hz. In addition, ten EIS measurements took place within one decade of frequency.
The polarization resistance value for CS or SS specimens in concrete was
estimated by a fitting process between the experimental impedance data taken by the
(Gamry Reference 600) and the impedance results of the corresponding equivalent
circuits. Figure 4.16 shows the fitting results for a given CS and SS samples in concrete.
In addition, Figure 4.16 includes the equivalent circuits components used to simulate the
corrosion behavior of CS and SS bars described in section 1.7.2.1.
Once the value of “Rp” was found, the corrosion rate was calculated using Stern-
Geary equation [9] (see section 1.7.2), assuming a Stern-Geary constant “B” of 26 mV
[25] for corroding alloys that contain predominantly Iron (Fe) and a polarizing net area of
~40 cm2. This investigation considered a 10-centimeters long counter electrode as well
as steel bars of 0.5 inches in diameter. Thus, the nominal polarizing net steel area at each
measurement point was calculated multiplying the circular perimeter of the bar and the
length of the counter electrode.
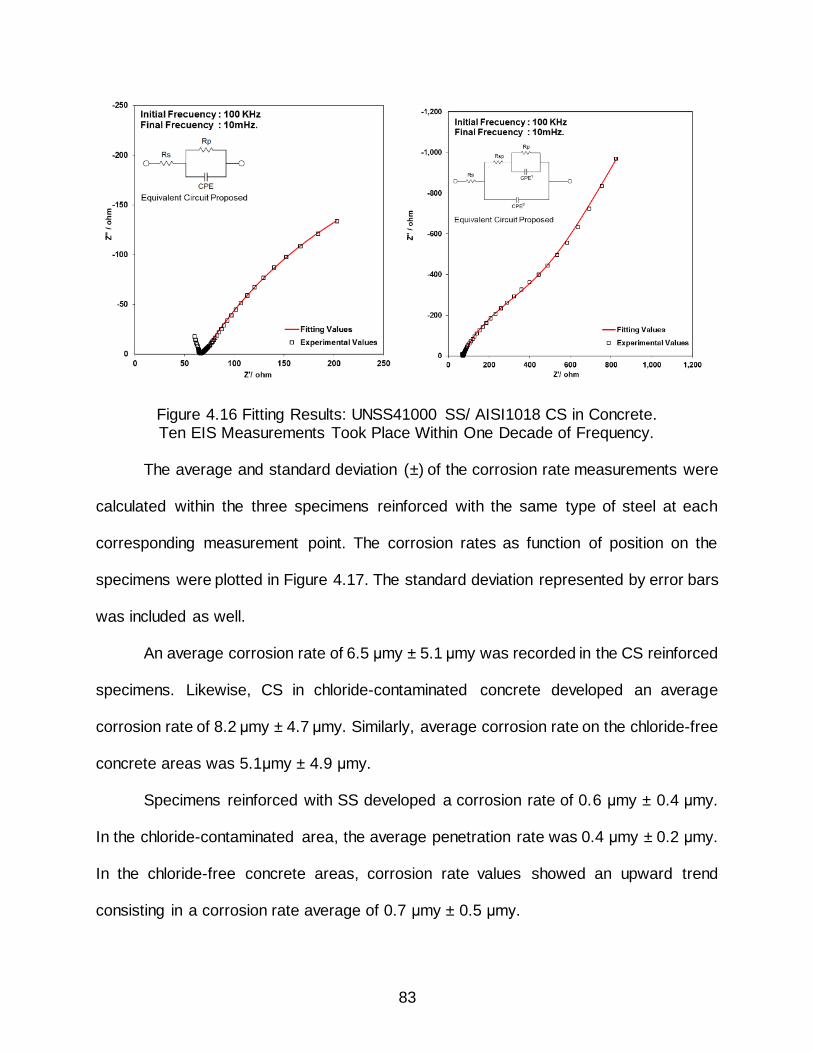
83
Figure 4.16 Fitting Results: UNSS41000 SS/ AISI1018 CS in Concrete. Ten EIS Measurements Took Place Within One Decade of Frequency.
The average and standard deviation (±) of the corrosion rate measurements were
calculated within the three specimens reinforced with the same type of steel at each
corresponding measurement point. The corrosion rates as function of position on the
specimens were plotted in Figure 4.17. The standard deviation represented by error bars
was included as well.
An average corrosion rate of 6.5 μmy ± 5.1 μmy was recorded in the CS reinforced
specimens. Likewise, CS in chloride-contaminated concrete developed an average
corrosion rate of 8.2 μmy ± 4.7 μmy. Similarly, average corrosion rate on the chloride-free
concrete areas was 5.1μmy ± 4.9 μmy.
Specimens reinforced with SS developed a corrosion rate of 0.6 μmy ± 0.4 μmy.
In the chloride-contaminated area, the average penetration rate was 0.4 μmy ± 0.2 μmy.
In the chloride-free concrete areas, corrosion rate values showed an upward trend
consisting in a corrosion rate average of 0.7 μmy ± 0.5 μmy.

84
The corrosion rate average per type of reinforcing steel as a function of position
was plotted in a semi-log diagram following a color coding system. The Y-axis was in log-
scale corresponding to the corrosion rates and the X-axis corresponded to the position.
The error bars were included and represent the standard deviation of the results of the
three samples as shown in Figure 4.17. In addition, summary tables with corrosion rates
for both types of steel are included in Table 4.13 and Table 4.14.
Nyquist diagrams were included to display the impedance measurements results
per each reinforced concrete specimen as shown from Figure 4.18 to Figure 4.29.
Concrete specimens reinforced with UNS S41000 SS were labeled with the following
system code (SS#Number). Similarly, AISI 1018 CS reinforced specimens were labeled
with the system code (CS#Letter).
Five EIS measuring spots were considered on the chloride-free concrete area;
three of them were taken in the two-foot long region and two measurements on the one-
foot long area. Similarly, the contaminated concrete region was examined at four
measuring points. The nominal resulting parameters of the equivalent circuits obtained
through the fitting process are summarized from Table 4.1 to Table 4.6 per specimen.
Finally, the nominal duration of the corrosion propagation stage was calculated according
to section 1.6. Results were summarized in Table 4.13 and Table 4.14. It is emphasized
that those duration estimates are only nominal in nature, and subject to uncertainty
especially for the case of SS bars, as noted in the discussion section.
85
Figure 4.17 Corrosion Rates: UNSS41000 SS/ AISI1018 CS in Concrete at 768 Hrs
.
Figure 4.18 Nyquist Diagram: AISI1018 CS in Cl- Free Concrete for CSA
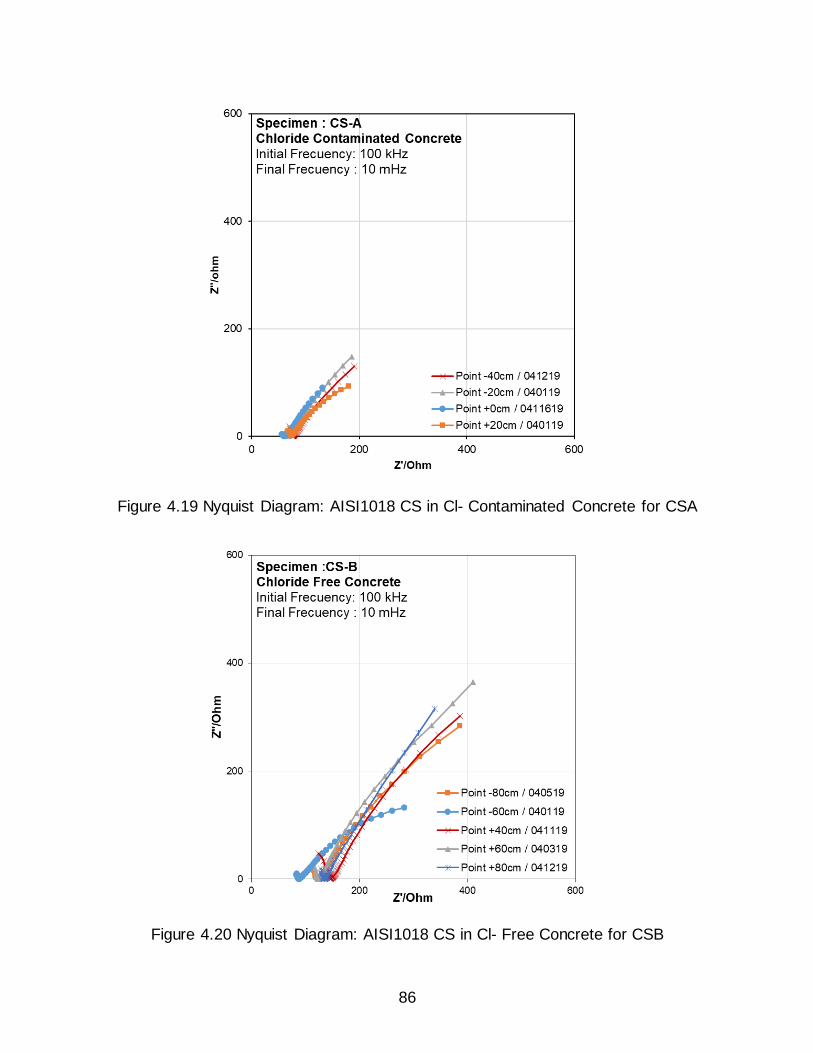
86
Figure 4.19 Nyquist Diagram: AISI1018 CS in Cl- Contaminated Concrete for CSA
Figure 4.20 Nyquist Diagram: AISI1018 CS in Cl- Free Concrete for CSB

87
Figure 4.21 Nyquist Diagram: AISI1018 CS in Cl- Contaminated Concrete for CSB
Figure 4.22 Nyquist Diagram: AISI1018 CS in Cl- Free Concrete for CSC
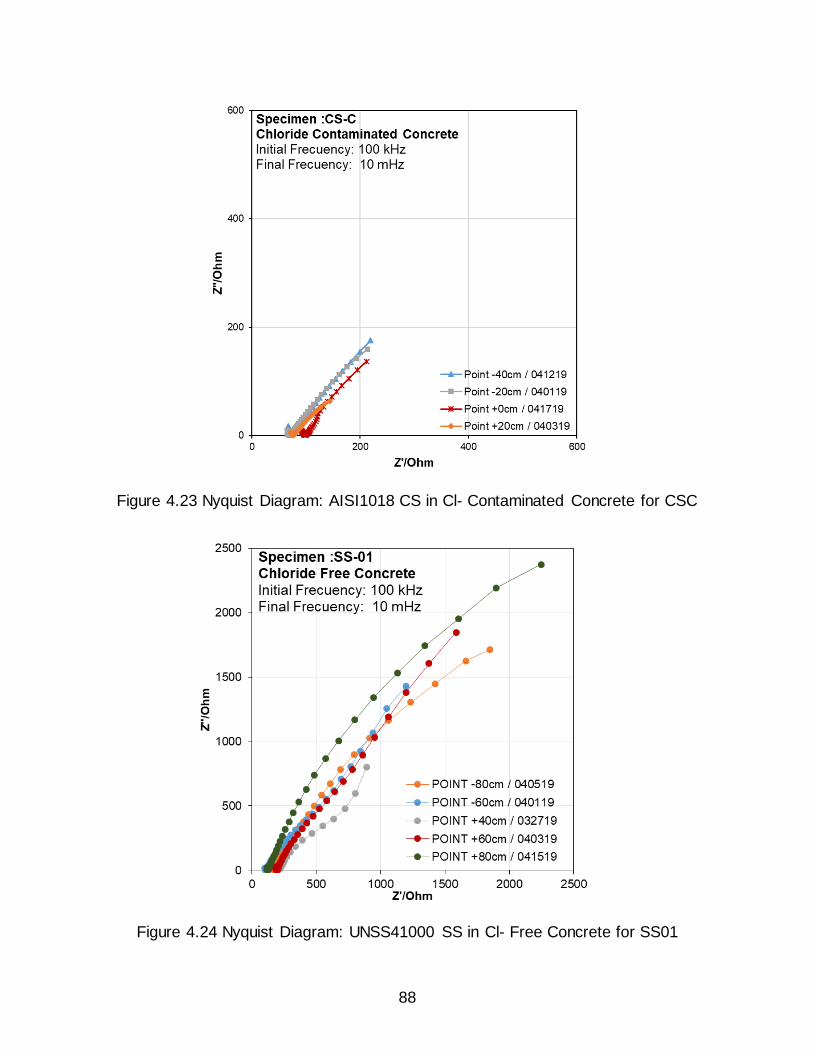
88
Figure 4.23 Nyquist Diagram: AISI1018 CS in Cl- Contaminated Concrete for CSC
Figure 4.24 Nyquist Diagram: UNSS41000 SS in Cl- Free Concrete for SS01
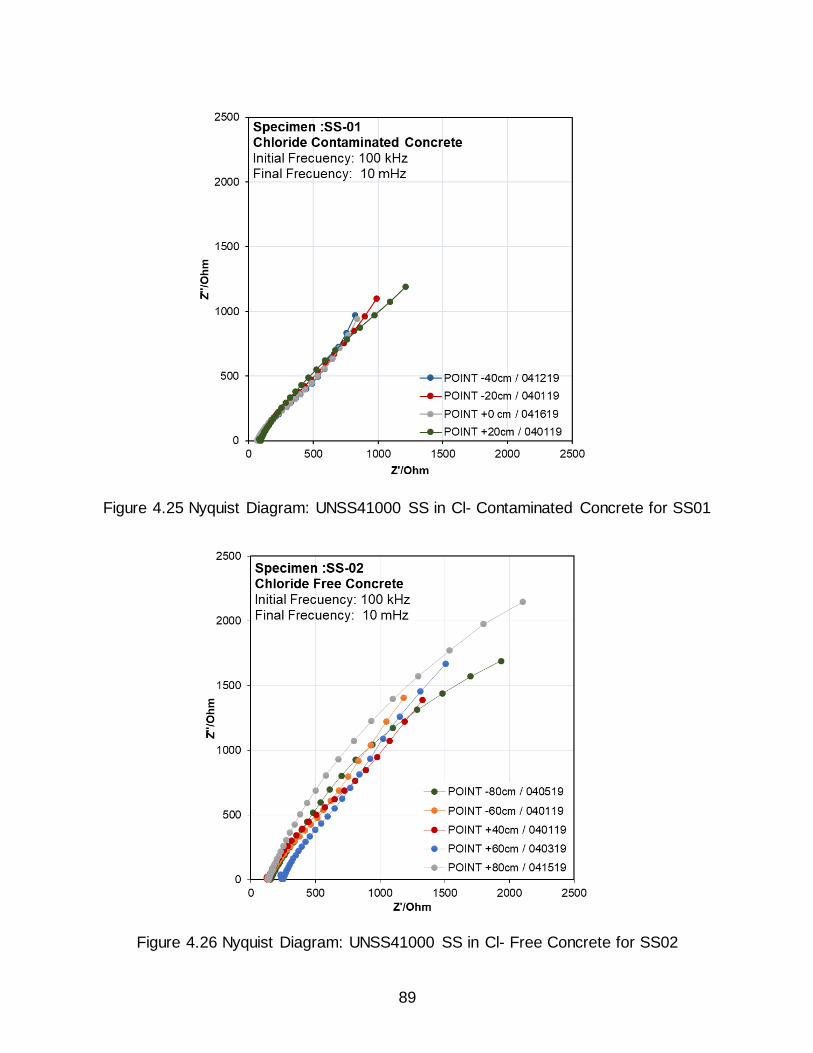
89
Figure 4.25 Nyquist Diagram: UNSS41000 SS in Cl- Contaminated Concrete for SS01
Figure 4.26 Nyquist Diagram: UNSS41000 SS in Cl- Free Concrete for SS02

90
Figure 4.27 Nyquist Diagram: UNSS41000 SS in Cl- Contaminated Concrete for SS02
Figure 4.28 Nyquist Diagram: UNSS41000 SS in Cl- Free Concrete for SS03
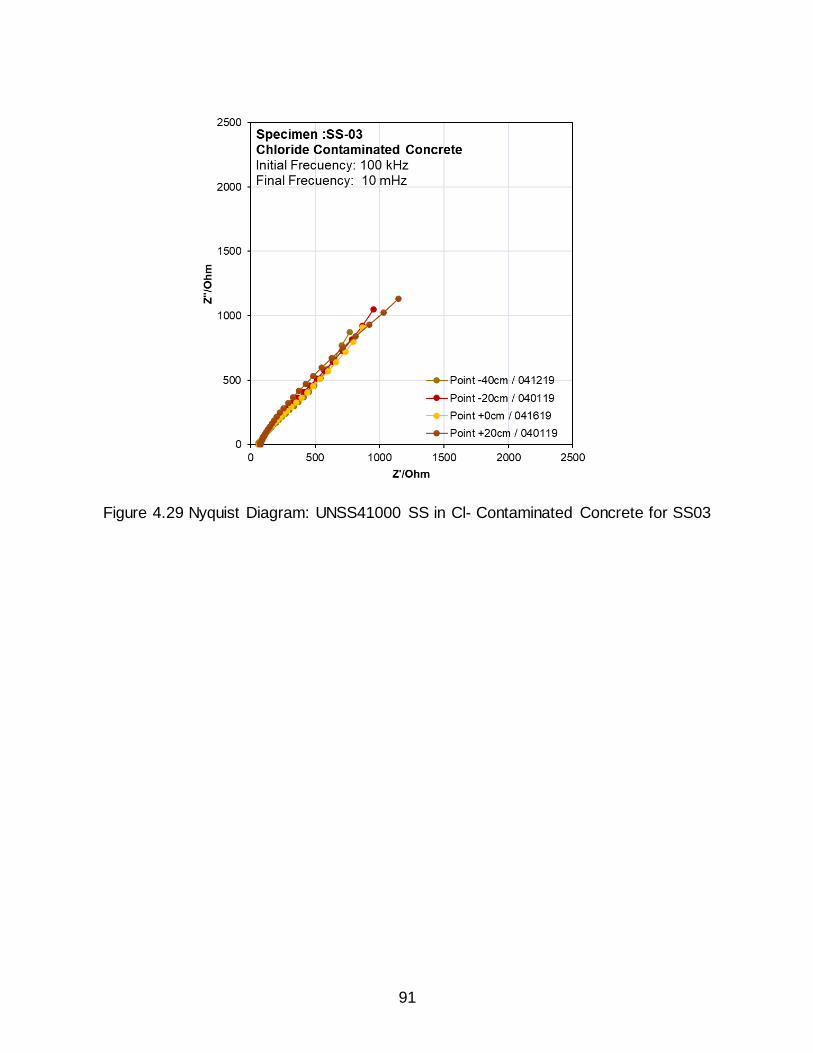
91
Figure 4.29 Nyquist Diagram: UNSS41000 SS in Cl- Contaminated Concrete for SS03
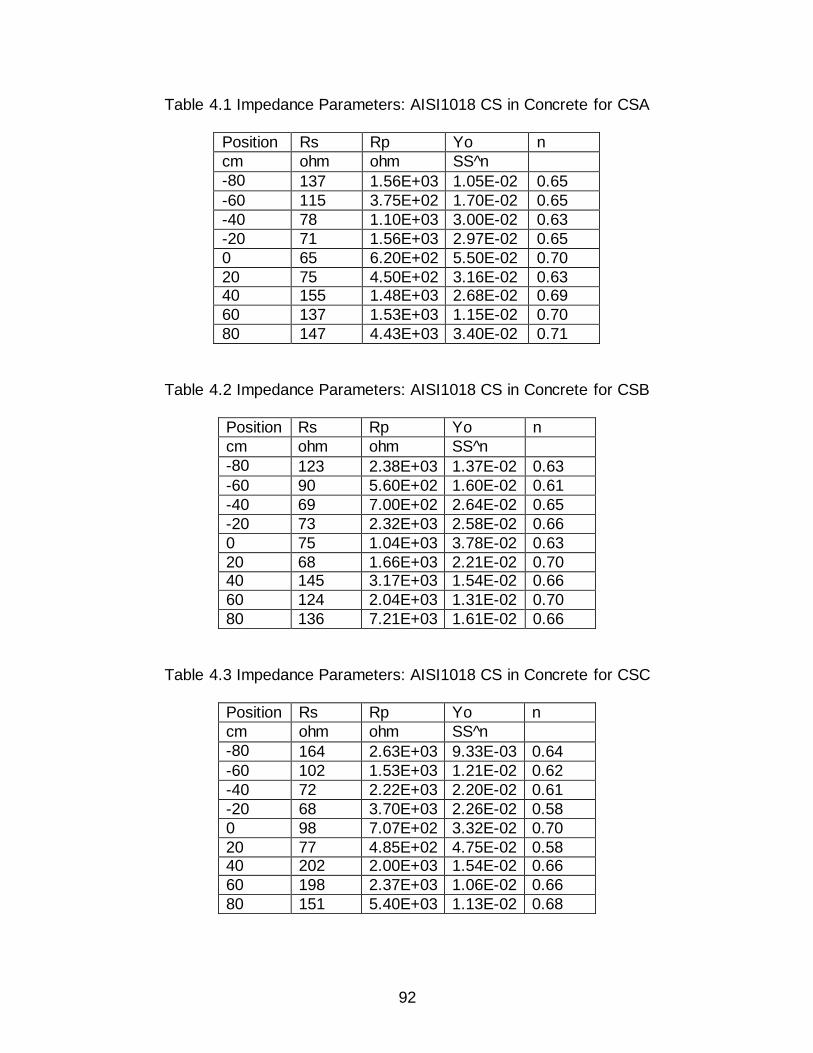
92
Table 4.1 Impedance Parameters: AISI1018 CS in Concrete for CSA
Position Rs Rp Yo n
cm ohm ohm SS^n
-80 137 1.56E+03 1.05E-02 0.65
-60 115 3.75E+02 1.70E-02 0.65
-40 78 1.10E+03 3.00E-02 0.63
-20 71 1.56E+03 2.97E-02 0.65
0 65 6.20E+02 5.50E-02 0.70
20 75 4.50E+02 3.16E-02 0.63 40 155 1.48E+03 2.68E-02 0.69
60 137 1.53E+03 1.15E-02 0.70
80 147 4.43E+03 3.40E-02 0.71
Table 4.2 Impedance Parameters: AISI1018 CS in Concrete for CSB
Position Rs Rp Yo n
cm ohm ohm SS^n
-80 123 2.38E+03 1.37E-02 0.63
-60 90 5.60E+02 1.60E-02 0.61
-40 69 7.00E+02 2.64E-02 0.65
-20 73 2.32E+03 2.58E-02 0.66
0 75 1.04E+03 3.78E-02 0.63
20 68 1.66E+03 2.21E-02 0.70 40 145 3.17E+03 1.54E-02 0.66
60 124 2.04E+03 1.31E-02 0.70
80 136 7.21E+03 1.61E-02 0.66
Table 4.3 Impedance Parameters: AISI1018 CS in Concrete for CSC
Position Rs Rp Yo n
cm ohm ohm SS^n
-80 164 2.63E+03 9.33E-03 0.64
-60 102 1.53E+03 1.21E-02 0.62
-40 72 2.22E+03 2.20E-02 0.61
-20 68 3.70E+03 2.26E-02 0.58
0 98 7.07E+02 3.32E-02 0.70
20 77 4.85E+02 4.75E-02 0.58 40 202 2.00E+03 1.54E-02 0.66
60 198 2.37E+03 1.06E-02 0.66
80 151 5.40E+03 1.13E-02 0.68

93
Table 4.4 Impedance Parameters: UNSS41000 SS in Concrete for SS01
Position Rs Rsp Rp Yo n0 Y1 n1
cm Ohm ohm ohm SS^n
SS^n
-80 171 1018 5.84E+03 1.89E-03 0.74 6.50E-04 0.65
-60 107 1837 1.42E+04 2.26E-03 0.69 2.78E-03 0.81
-40 72 888 1.98E+04 2.65E-03 0.73 5.23E-03 0.77
-20 77 951 1.61E+04 2.43E-03 0.72 3.20E-03 0.68
0 69 652 2.30E+04 2.46E-03 0.74 4.19E-03 0.67
20 88 883 3.33E+04 2.34E-03 0.74 1.52E-03 0.46 40 216 936 2.53E+04 2.77E-03 0.77 1.03E-02 0.87
60 193 1175 2.51E+04 1.82E-03 0.75 1.42E-03 0.63
80 123 1653 7.19E+03 1.94E-03 0.75 9.99E-05 0.73
Table 4.5 Impedance Parameters: UNSS41000 SS in Concrete for SS02
Position Rs Rsp Rp Yo n0 Y1 n1
cm ohm ohm ohm SS^n SS^n
-80 150 1637 4.64E+03 1.90E-03 0.71 5.89E-04 0.75
-60 129 2013 8.68E+03 2.47E-03 0.70 3.37E-03 0.90
-40 69 658 1.25E+04 2.50E-03 0.73 5.18E-03 0.72
-20 72 1150 1.05E+04 2.56E-03 0.72 4.41E-03 0.76
0 108 674 1.23E+04 6.93E-03 0.59 1.50E-03 0.76
20 77 945 1.21E+04 2.57E-03 0.77 2.19E-03 0.55 40 132 2120 1.37E+04 2.20E-03 0.75 4.95E-03 0.84
60 244 948 1.60E+04 1.98E-03 0.78 2.02E-03 0.68
80 134 967 9.36E+03 2.00E-03 0.76 1.43E-04 0.71
Table 4.6 Impedance Parameters for UNSS41000 SS in Concrete for SS03
Position Rs Rsp Rp Yo n0 Y1 n1
cm ohm ohm ohm SS^n SS^n
-80 136 1358 5.48E+03 1.89E-03 0.75 8.75E-04 0.67
-60 122 1295 2.03E+04 2.40E-03 0.74 2.92E-03 0.73
-40 63 631 5.25E+04 2.61E-03 0.74 4.48E-03 0.66
-20 72 745 5.60E+04 2.44E-03 0.77 3.16E-03 0.61
0 68 602 6.44E+04 2.44E-03 0.76 3.54E-03 0.59
20 74 604 3.81E+04 2.33E-03 0.78 1.70E-03 0.46 40 126 1520 5.62E+04 2.34E-03 0.74 6.55E-03 0.72
60 148 958 4.02E+04 1.93E-03 0.79 2.05E-03 0.66
80 127 1832 6.16E+03 1.99E-03 0.75 6.50E-05 0.68
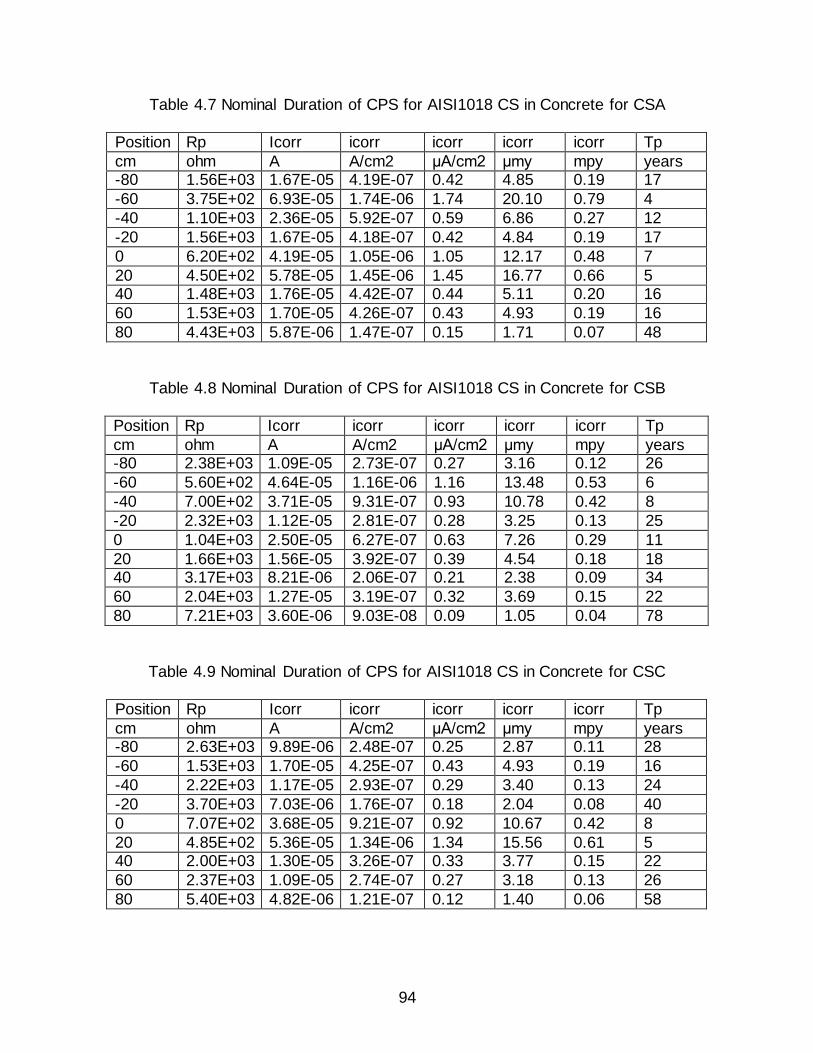
94
Table 4.7 Nominal Duration of CPS for AISI1018 CS in Concrete for CSA
Position Rp Icorr icorr icorr icorr icorr Tp
cm ohm A A/cm2 μA/cm2 μmy mpy years -80 1.56E+03 1.67E-05 4.19E-07 0.42 4.85 0.19 17
-60 3.75E+02 6.93E-05 1.74E-06 1.74 20.10 0.79 4
-40 1.10E+03 2.36E-05 5.92E-07 0.59 6.86 0.27 12
-20 1.56E+03 1.67E-05 4.18E-07 0.42 4.84 0.19 17
0 6.20E+02 4.19E-05 1.05E-06 1.05 12.17 0.48 7
20 4.50E+02 5.78E-05 1.45E-06 1.45 16.77 0.66 5 40 1.48E+03 1.76E-05 4.42E-07 0.44 5.11 0.20 16
60 1.53E+03 1.70E-05 4.26E-07 0.43 4.93 0.19 16
80 4.43E+03 5.87E-06 1.47E-07 0.15 1.71 0.07 48
Table 4.8 Nominal Duration of CPS for AISI1018 CS in Concrete for CSB
Position Rp Icorr icorr icorr icorr icorr Tp
cm ohm A A/cm2 μA/cm2 μmy mpy years -80 2.38E+03 1.09E-05 2.73E-07 0.27 3.16 0.12 26
-60 5.60E+02 4.64E-05 1.16E-06 1.16 13.48 0.53 6
-40 7.00E+02 3.71E-05 9.31E-07 0.93 10.78 0.42 8
-20 2.32E+03 1.12E-05 2.81E-07 0.28 3.25 0.13 25
0 1.04E+03 2.50E-05 6.27E-07 0.63 7.26 0.29 11
20 1.66E+03 1.56E-05 3.92E-07 0.39 4.54 0.18 18 40 3.17E+03 8.21E-06 2.06E-07 0.21 2.38 0.09 34
60 2.04E+03 1.27E-05 3.19E-07 0.32 3.69 0.15 22
80 7.21E+03 3.60E-06 9.03E-08 0.09 1.05 0.04 78
Table 4.9 Nominal Duration of CPS for AISI1018 CS in Concrete for CSC
Position Rp Icorr icorr icorr icorr icorr Tp
cm ohm A A/cm2 μA/cm2 μmy mpy years -80 2.63E+03 9.89E-06 2.48E-07 0.25 2.87 0.11 28
-60 1.53E+03 1.70E-05 4.25E-07 0.43 4.93 0.19 16
-40 2.22E+03 1.17E-05 2.93E-07 0.29 3.40 0.13 24
-20 3.70E+03 7.03E-06 1.76E-07 0.18 2.04 0.08 40
0 7.07E+02 3.68E-05 9.21E-07 0.92 10.67 0.42 8
20 4.85E+02 5.36E-05 1.34E-06 1.34 15.56 0.61 5 40 2.00E+03 1.30E-05 3.26E-07 0.33 3.77 0.15 22
60 2.37E+03 1.09E-05 2.74E-07 0.27 3.18 0.13 26
80 5.40E+03 4.82E-06 1.21E-07 0.12 1.40 0.06 58
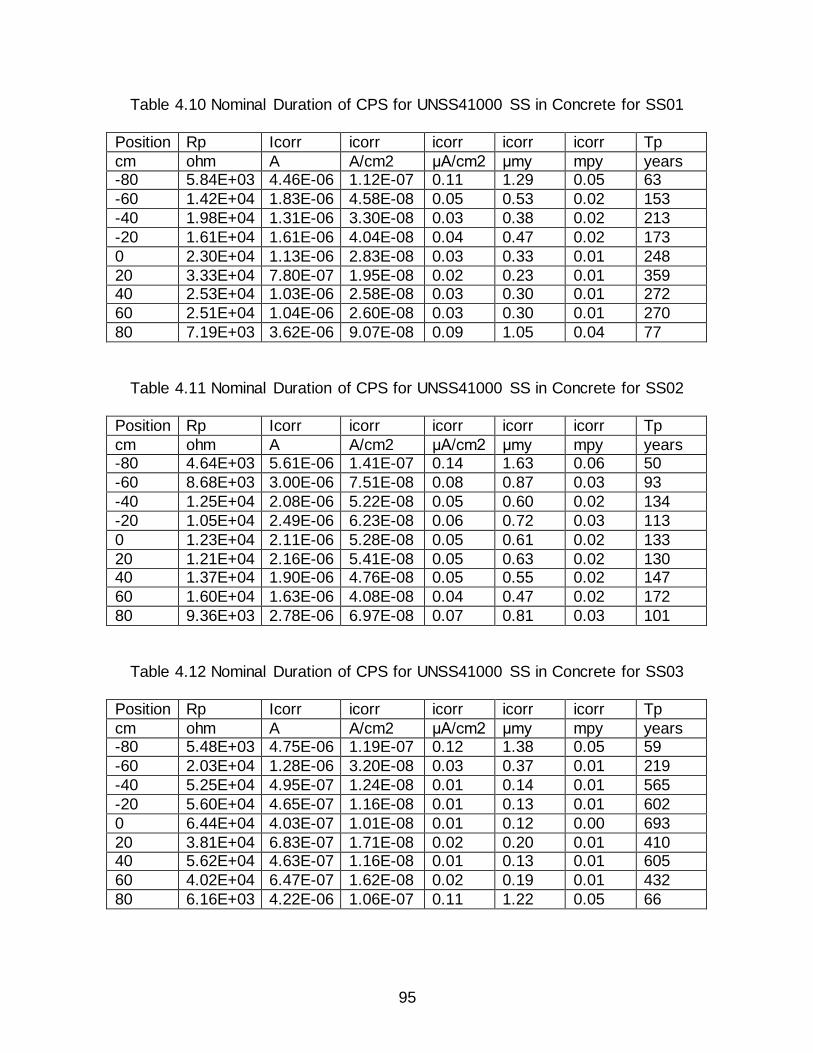
95
Table 4.10 Nominal Duration of CPS for UNSS41000 SS in Concrete for SS01
Position Rp Icorr icorr icorr icorr icorr Tp
cm ohm A A/cm2 μA/cm2 μmy mpy years -80 5.84E+03 4.46E-06 1.12E-07 0.11 1.29 0.05 63
-60 1.42E+04 1.83E-06 4.58E-08 0.05 0.53 0.02 153
-40 1.98E+04 1.31E-06 3.30E-08 0.03 0.38 0.02 213
-20 1.61E+04 1.61E-06 4.04E-08 0.04 0.47 0.02 173
0 2.30E+04 1.13E-06 2.83E-08 0.03 0.33 0.01 248
20 3.33E+04 7.80E-07 1.95E-08 0.02 0.23 0.01 359 40 2.53E+04 1.03E-06 2.58E-08 0.03 0.30 0.01 272
60 2.51E+04 1.04E-06 2.60E-08 0.03 0.30 0.01 270
80 7.19E+03 3.62E-06 9.07E-08 0.09 1.05 0.04 77
Table 4.11 Nominal Duration of CPS for UNSS41000 SS in Concrete for SS02
Position Rp Icorr icorr icorr icorr icorr Tp
cm ohm A A/cm2 μA/cm2 μmy mpy years -80 4.64E+03 5.61E-06 1.41E-07 0.14 1.63 0.06 50
-60 8.68E+03 3.00E-06 7.51E-08 0.08 0.87 0.03 93
-40 1.25E+04 2.08E-06 5.22E-08 0.05 0.60 0.02 134
-20 1.05E+04 2.49E-06 6.23E-08 0.06 0.72 0.03 113
0 1.23E+04 2.11E-06 5.28E-08 0.05 0.61 0.02 133
20 1.21E+04 2.16E-06 5.41E-08 0.05 0.63 0.02 130 40 1.37E+04 1.90E-06 4.76E-08 0.05 0.55 0.02 147
60 1.60E+04 1.63E-06 4.08E-08 0.04 0.47 0.02 172
80 9.36E+03 2.78E-06 6.97E-08 0.07 0.81 0.03 101
Table 4.12 Nominal Duration of CPS for UNSS41000 SS in Concrete for SS03
Position Rp Icorr icorr icorr icorr icorr Tp
cm ohm A A/cm2 μA/cm2 μmy mpy years -80 5.48E+03 4.75E-06 1.19E-07 0.12 1.38 0.05 59
-60 2.03E+04 1.28E-06 3.20E-08 0.03 0.37 0.01 219
-40 5.25E+04 4.95E-07 1.24E-08 0.01 0.14 0.01 565
-20 5.60E+04 4.65E-07 1.16E-08 0.01 0.13 0.01 602
0 6.44E+04 4.03E-07 1.01E-08 0.01 0.12 0.00 693
20 3.81E+04 6.83E-07 1.71E-08 0.02 0.20 0.01 410 40 5.62E+04 4.63E-07 1.16E-08 0.01 0.13 0.01 605
60 4.02E+04 6.47E-07 1.62E-08 0.02 0.19 0.01 432
80 6.16E+03 4.22E-06 1.06E-07 0.11 1.22 0.05 66

96
Table 4.13 Summary Nominal CR/CPS for AISI1018 CS in Concrete
Position icorr icorr icorr Average Std. Dev
Avg Tp
cm μmy μmy μmy μmy μmy years CSA CSB CSC
-80 4.85 3.16 2.87 3.63 0.87 22
-60 20.10 13.48 4.93 12.84 6.21 6
-40 6.86 10.78 3.40 7.01 3.02 12
-20 4.84 3.25 2.04 3.38 1.15 24
0 12.17 7.26 10.67 10.03 2.06 8 20 16.77 4.54 15.56 12.29 5.50 7
40 5.11 2.38 3.77 3.76 1.11 22
60 4.93 3.69 3.18 3.93 0.74 21
80 1.71 1.05 1.40 1.38 0.27 59
Table 4.14 Summary Nominal CR/CPS for UNSS41000 SS in Concrete
Position icorr icorr icorr Average Std. Dev
Avg Tp
cm μmy μmy μmy μmy μmy Years SS01 SS02 SS03
-80 1.29 1.63 1.38 1.43 0.14 57
-60 0.53 0.87 0.37 0.59 0.21 138
-40 0.38 0.60 0.14 0.38 0.19 216
-20 0.47 0.72 0.13 0.44 0.24 184 0 0.33 0.61 0.12 0.35 0.20 231
20 0.23 0.63 0.20 0.35 0.20 232
40 0.30 0.55 0.13 0.33 0.17 248
60 0.30 0.47 0.19 0.32 0.12 253
80 1.05 0.81 1.22 1.03 0.17 79 where CR : Corrosion Rate and Tp : Nominal Duration of Corrosion Propagation Stage.
4.4. Resistivity of Concrete
The electrical resistance of both types of concrete used in this investigation was
monitored for 32 days. The electrical resistance measurements were performed on
concrete cylindrical samples of 2 inches in diameter and 4 inches high in triplicate. To
obtain the resistivity of the samples, the data obtained by the resistance meter was
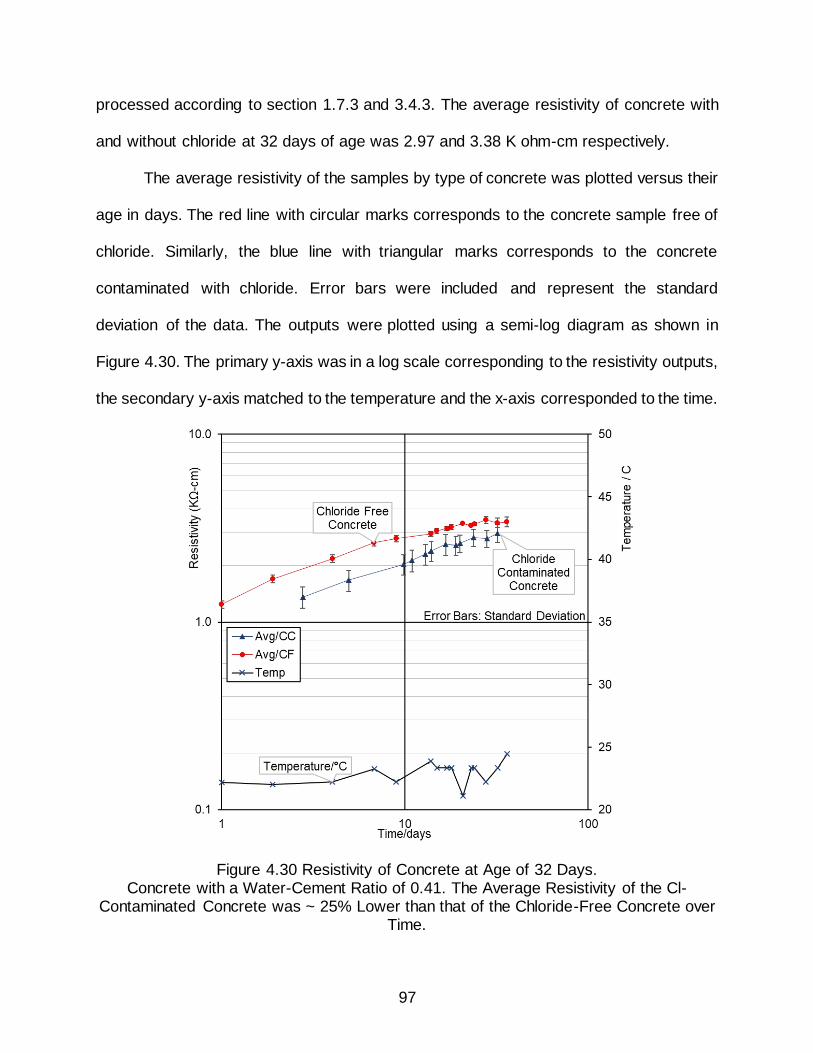
97
processed according to section 1.7.3 and 3.4.3. The average resistivity of concrete with
and without chloride at 32 days of age was 2.97 and 3.38 K ohm-cm respectively.
The average resistivity of the samples by type of concrete was plotted versus their
age in days. The red line with circular marks corresponds to the concrete sample free of
chloride. Similarly, the blue line with triangular marks corresponds to the concrete
contaminated with chloride. Error bars were included and represent the standard
deviation of the data. The outputs were plotted using a semi-log diagram as shown in
Figure 4.30. The primary y-axis was in a log scale corresponding to the resistivity outputs,
the secondary y-axis matched to the temperature and the x-axis corresponded to the time.
Figure 4.30 Resistivity of Concrete at Age of 32 Days. Concrete with a Water-Cement Ratio of 0.41. The Average Resistivity of the Cl-
Contaminated Concrete was ~ 25% Lower than that of the Chloride-Free Concrete over Time.
98
CHAPTER 5: DISCUSSION
5.1. Overview
This chapter provides a narrative of the findings in the literature review and the
experimental procedure concerning to the duration of the corrosion propagation stage of
SS in concrete, corrosion morphology, and the methods for its detection.
5.2. Discussion Based on Literature Review
Findings of the literature review are divided into two parts. The first part discusses
the observations on the duration of the propagation stage of corrosion in three different
test exposures. The second part deals with the observations on methods of detection and
measurement of corrosion of stainless steel reinforcement.
5.2.1. Observations on Duration of the Corrosion Propagation Stage
This section organizes findings on the duration of the corrosion propagation stage
of stainless steel in concrete based on the following types of test exposures, structures in
actual service, environmental controlled exposure, and laboratory conditions
5.2.1.1. SS Rebar in Bridges in Service
For SS rebar in bridges in service this review did not uncover any fully documented
evidence of SS rebar reaching the end of the corrosion propagation stage in any bridge
case examined. The closest situation found was for the Progreso pier. There, a few
instances of external concrete cracking examined at 60 years structure age were
attributed to corrosion of the type 304 SS rebar, presumably with associated formation of
expansive products. The attribution was based on the location and orientation of the

99
cracks (present where bars were placed, and aligned with embedded bars) as well as on
chloride content of the concrete (exceeding the assumed threshold value for type 304
SS) and electrochemical measurements consistent with ongoing corrosion of the steel.
However, direct evidence in the form of samples actually showing corrosion of the bars
at those locations as well as presence of expansive corrosion products, is not yet
available. Assuming that the observed cracking was indeed due to corrosion of the SS
rebar a rough estimate of the length of the corrosion propagation stage may be made by
noting that the chloride penetration profiles in the bridge at age 60+ years were nearly flat
over a depth of ~10-20 cm, indicative of high effective chloride diffusivity. That condition
suggests that near-surface chloride concentrations (are approximately 1% by weight of
concrete) might have been present at the rebar cover depth (around 10 cm in some
locations) at most after a time of ~1/2 of the age at the time of inspection (~60 years),
suggesting that the propagation stage in those cases started some 30 years earlier. That
rough estimate, together with the rarity of observations of cracking that could be attributed
to corrosion of the SS rebar (~3% of beams affected after 60+ years) suggests that the
length of the propagation stage for a cracked-concrete-cover limit state has been at least
in the order of several decades. That value far exceeds the typical value of only several
years recognized for carbon steel rebar, and if confirmed by further evidence would
represent a substantial added benefit of using SS bars for marine applications.
All the other evidence examined for bridges in service with SS rebar was limited
(longest structure age 26 years, most other investigations much shorter) but invariably
indicative of minimal or non-existing corrosion distress of SS reinforcement. Such
performance may be ascribed in some of those cases to early bridge age and consequent
100
low chloride content at the rebar depth, but in other cases the chloride content at rebar
depth had already exceeded the threshold for carbon steel bar, or preexisting cracks in
the concrete could have allowed deep local chloride ingress. While that evidence attests
to good corrosion initiation resistance of SS bars in general, it does not provide added
field evidence to either support or contradict the rough estimate made above for the length
of the propagation stage made from the Progreso pier results. A note of caution applies
from the swimming pool incidents, in that the EAC failures serve a reminder that
unexpected modes of failure often accompany the introduction of a new material class to
an established application. EAC from chlorine is not anticipated in the concrete
environment and in the moderate strength class usually associated with reinforcing steel.
However, chloride-induced stress corrosion cracking (SCC) of SS rebar might still be an
issue, especially in warm temperature marine service and perhaps as a final fracture even
in a cross section previously reduced and made irregular by deep pitting. One instance
of corrosion of exposed rebar at the Progreso pier has been tentatively identified as
exhibiting SCC [47] and examinations of future sampling should carefully search for any
other similar evidence. Any further observations of that type would be an indication that
a limit state alternative to concrete cracking may need to be considered.
As indicated in the summary comments on Progreso pier, it is essential to seek
direct evidence linking the extent of corrosion of the SS bars with manifestations of having
reached a limit state, and collaborative work of USF with the Mexican Institute of
Transport to obtain and analyze material is required.

101
5.2.1.2. Environmental Exposure
For environmental exposures two sets of tests merit special attention: the 10-year
BBRE Beckton exposure (Item 2.2.1.2), and the 5 to 10-year Florida outdoors ponded
tests (2.2.3/2.2.4). Those studies were the only cases found in this review were full direct
evidence showed that outdoor exposure resulted in corrosion-induced cracking of
concrete with stainless steel embedded in concrete. In both of these instances of having
reached the end of the propagation stage, the SSs involved where ferritic straight-Cr
alloys with low PREN values (~11 to ~17), placed at very low cover depths (~10 mm) in
the Beckton tests and low cover (25 mm) plus intersecting simulated wide preexisting
cracks in the Florida tests, and with high chloride loads. For those conditions and
materials, corrosion was in the form of severe pitting not unlike that found in accelerated
exposure of type ASTM 1035 (MMFX) 9-Cr steel. Strong corrosion localization is
expected to mitigate cracking [38], but in these cases it was not sufficient to prevent
corrosion induced concrete cracks from forming and propagating to the outer surface.
The duration of the propagation stage in these cases was short, no more than 5 years in
the Florida tests and likely to be of that order in the Beckton tests as well. Such duration
is comparable to that expected for carbon steel bar under normally sound and thicker
cover, so propagation duration might have been longer in these low PREN SS tests if
cover would not have been so shallow or without preexisting concrete deficiencies.
However, the expected difference in the case of these alloys here was not extreme
enough to anticipate a multi-decade improvement on propagation stage duration over that
for carbon steel, in contrast with the consideration made for type 304 SS from the
Progreso pier experience.
102
More promising performance of straight Cr (~12%) ferritic steel was obtained at
natural/field environments at the South Africa and Swiss sites (items 2.2.2 and 2.2.3). In
both instances, the end of the corrosion initiation stage was reported, for exposure times
as small as 1.5 years. However, corrosion rates were much less (by a factor of 5 in one
case) than for carbon steel controls, and no instances of completion of the corrosion
propagation stage were reported for the entire test durations (up to 4.5 years).
The other environmental test exposures by BBRE (the other test at Beckton/Hurst
Castle and at Langstone Harbor, over a period of up to 22 years) highlighted the large
improvement in corrosion resistance that can be achieved by increasing the alloy content
of those components associated with an increase in PREN. Even the basic type 302 SS
showed excellent performance over the long term, including when placed in previously
cracked concrete. In most instances, the initiation stage itself appeared not to have been
completed. In a few cases minor superficial corrosion as well one case each, in single
specimens, of localized corrosion were noted indicating the onset of the corrosion
propagation stage but at a very low rate. Similar outstanding performance by Ni-
containing austenitic and for duplex SS was found at the Treat Island site and the Swiss
highway location. At treat Island there was indication of corrosion initiation at type 304SS
after <2 years in low-cover mortar, but corrosion rates were extremely small. Types 304,
316 and 2205 SS did not appear to have completed the initiation stage. In contrast, a Mn-
austenitized SS showed significant discoloration and some pitting. While the authors were
critical of using the PREN index as a predictor of corrosion performance, the results of all
these natural exposures tend to indicate that the index is at least a reasonable first
indicator of expected behavior. Overall, the field/natural exposure experience albeit
103
limited suggests that the corrosion propagation progression on stainless grades is
somewhat slower than for carbon steel for the lesser, ferritic grades or low PREN
Manganese-austenitized SS, and much slower than carbon steel for the higher PREN
regular austenitic and duplex SS grades.
5.2.1.3. SS Laboratory Investigations
The laboratory investigations show attempts to quantify the rate of corrosion in the
propagation stage based on basic principles and interpretation of experimental data, Item
2.3.1 [3] [61] [34], or more empirical approaches as in Item 2.3.2 [62] [63]. Both attempts
result in propagation stage forecasts that parallel the observations from bridges in service
and field exposures, whereby low PREN alloys yield moderate increases over carbon or
low alloy (akin to MMFX) while high PREN alloys such as high alloy austenitic stainless
and duplex steels exhibit order-of-magnitude increases. Comparable observations have
been made in a recent review of corrosion resistant rebar [17]. Those investigations
provide potentially powerful approaches to create rational models for propagation stage
durability forecasts. Those models are expected to provide an initial base for the
development of rational propagation stage forecasts in the remainder of this project.
Laboratory investigations that actually have reached the end of the propagation
stage for specimens in concrete are rare, and this survey identified only two, both from
the FAU ponded tests (Item 2.3.3). Both are notable in that they did not involve low PREN
straight chromium alloys as the cases noted for the environmental exposure cases in
Section 2.2, but rather duplex alloys with PREN~26. One of the two experiments, where
both types 2101 and 2304 showed cracking, involved Cl penetration acceleration by
imposed electric field as described in 2.3.2 but without masking mitigation of stray
104
currents. Therefore, it is possible that the cracking on a relatively short time (~ 6 mo)
reflected unrepresentatively high corrosion rates not easy to measure accurately. While
the experiment could not yield useful propagation rate information, the results still
provided some indication that the value of the critical penetration for through-the-cover
cracking was comparable or exceeded that for carbon steel cases.
The other FAU laboratory experiment, with less extreme acceleration other than
use of very shallow cover and high permeability mortar, resulted in cracking after ~ 2
years induced by the corrosion of type 2101 duplex SS bars. The bars affected however
had vulnerable surface condition, one with high temperature scale, the other descaled
only by abrasive blasting. Given the low cover and permeability of the mortar, a test under
similar conditions with carbon steel bar would have been expected to show some form of
cracking in about the same time frame. Thus, this experiment served to indicate that
deficiently descaled duplex SS rebar can indeed corrode enough to result in concrete
cover cracking, and that the resulting rates of corrosion may be in the same order as
those involving carbon steel. Parallel specimens from the same exposure families are still
being exposed in the same laboratory, as are also some of the test yard specimens in the
same program, discussed in Section 2.3 Specimens from this site are potential highly
productive targets for characterization of corrosion morphology, corrosion products, and
concrete crack development. To complement findings of this investigation it is
recommend to include legacy specimens from other previous FDOT investigations [64]
The findings from the investigation concerning performance of SS rebar in
previously cracked concrete (Item 2.3.4) highlighted an area of application of SS that is
often the justification for the use of that material, namely as a primary defense barrier
105
against corrosion in the case of local concrete deficiency. The results complement the
findings from the FAU external exposure (Item 2.3.3, first exposure class) yard test,
whereby a high PREN rating is critical as otherwise, the corrosion initiation stage is
essentially bypassed and corrosion rates too high. It can therefore be concluded that the
remainder of the work under this project needs to address in each application area the
performance of SS rebar under local concrete deficiencies as an integral - and critical-
issue in quantitative durability forecasting of the system.
5.2.2. Observations on Methods of Detection and Measurement of Corrosion of SS
Reinforcement
Many of the investigations discussed in the previous subsection used half-cell
potential mapping (per ASTM C-876 or modifications thereof) as a method of detection of
the corrosion condition of SS reinforcement. In principle, any passive material that
experiences local stable passivity breakdown, with the formation of a local anode, is
expected to experience a drop on open circuit potential as the result. That should be the
case as much of the surface responsible for the cathodic reaction remains more or less
the same as before, and the only way to transact the greater number of electrons released
by the anode is through a drop of potential. The effect is strong for carbon steel rebar,
given the high rates of corrosion at play in that case. Stainless steel, at least in the pickled
condition anticipated for successful rebar service, is a poorer anode than carbon steel
[66] [67] so for a given local anode the potential drop could be even greater than for
carbon steel. However, as was discussed in Section 5.2.1, at least in the more corrosion
resistant SSs the anodes tend to be much localized and involve sometimes much smaller
currents than for carbon steel. The overall balance of those opposite factors, especially
106
for the best performing steels, is not apparent beforehand and should be examined
carefully.
A more reliable electrochemical way of assessing corrosion condition is by means
of transient electrochemical techniques such as LPR, but those tests are more laborious
and time consuming than potential mapping so they are used less frequently. In some of
the work reviewed here, both mapping and LPR were used permitting some examination
of the former. Other considerations were reported elsewhere as well, with mixed results.
In the Progreso pier investigations (Item 2.1.1.2 ) relatively good correlation was reported
between half-cell mapping and LPR. Half-cell data were used for the A6059 bridge
surveys (Item 2.1.6) but confidence on the results was limited. Good correlation between
low corrosion rates and less negative potentials was reported for the Treat Island field
exposure (Item 2.2.1). The laboratory investigations tended to report reasonable
correlations between half-cell potentials and passivity condition, with some reservations.
Notable among those is the cracked concrete investigation reviewed in Item 2.3.4, where
the authors expressly questioned the direct application of ASTM C-876 to SS rebar in
concrete. In summary, this matter should be reviewed more thoroughly in the remainder
of this investigation. A strategy being considered for the experimental methodology is to
determine if potential mapping (ASTM C-876) on CS can be used to estimate the
corrosion state on low grade SS embedded in concrete.
Supplemental spot assessment by polarization methods may serve for verification
of half-cell corrosion indications. Moreover, the recent advent of impedance measurement
methods that do not require contact with the rebar assembly [8], perhaps may enable
107
more rapid surveys with less uncertainty on the interpretation of the results. Such
technology may merit exploration in the remainder of this project.
5.3. Discussion Based on Experimental Results
5.3.1. Discussion on Potential Maps Results
The half-cell potential measurements suggested that the carbon steel
reinforcement was in the corrosion propagation phase, while results for the SS
reinforcement were inconclusive. Concrete specimens reinforced with type AISI 1018 CS
developed high negative potentials uniformly distributed over large areas. The recorded
electric potentials were as low as -700 mV, after 32 days of concrete cast. According to
section 1.7.1, potential measurements indicated that there was 90% probability that active
corrosion took place and thus the onset of the corrosion propagation stage. Finally, the
most positive average potentials on CS bars were found on the chloride-free concrete
areas.
Half-cell potential measurements on the SS-reinforced specimens seemed to be
more positive than that of CS reinforced specimens. The average potential distribution
values appeared to be uniform over large areas, and sudden potential drops were not
recorded. Based on criteria given in ASTM C-876 [4], the average potential value of -300
mV at the chloride contaminated the concrete area would indicate a 90% probability that
active corrosion took place. However, recommendations of ASTM C-876 for interpretation
of corrosion potentials were developed for CS in concrete. Therefore, there is uncertainty
if using this criterion can give a reliable estimation of the corrosion state of SS in concrete.
A long-term monitoring period of half-cell potential measurements and autopsy of SS-
reinforced specimens are required to make a contrast between the results.

108
5.3.2. Discussion on Electrochemical Impedance Spectroscopy Results
The values of the nominal polarizing net area and Stern-Geary constant (B) are
required to estimate the corrosion rates from the EIS data (see section 1.7.2.2.). In
addition, the value of the corroding spot length (L) is needed to determine (Xcrit) and thus,
the nominal duration of the CPS (Tp) (see section 1.6.2.2). However, these values were
only estimates and subject to uncertainty.
The nominal polarizing net area assumed was ~40 cm2. This investigation
considered a 10-centimeters long counter electrode as well as steel bars of 0.5 inches in
diameter. Thus, the nominal net steel area at each measurement point was calculated by
multiplying the circular perimeter of the bar and the length of the counter electrode. On
the other hand, the current flow would depend on the counter electrode position on the
specimen. Measurement spots located at the ends of the specimens may involve smaller
polarizing net areas, which could increase the value of the corrosion rates (see Figure
5.1). Conversely, EIS measurements in the middle part of specimens may involve bigger
polarized areas resulting in lower values of corrosion rates. Implementing a computer
model of this phenomenon would clarify this assumption.
Figure 5.1 Effect of Counter Electrode Position on EIS Measurements. Polarizing Steel Area at One End (A) Would be Smaller that of in the Central Part of the
Specimen (B).
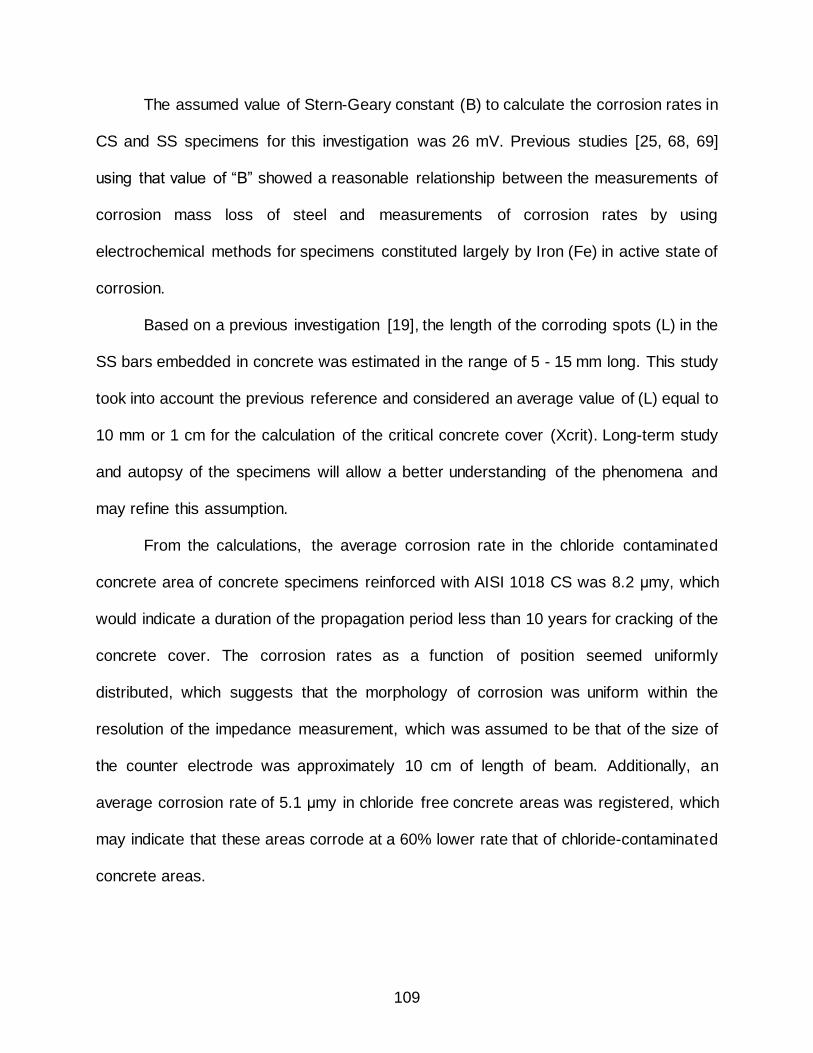
109
The assumed value of Stern-Geary constant (B) to calculate the corrosion rates in
CS and SS specimens for this investigation was 26 mV. Previous studies [25, 68, 69]
using that value of “B” showed a reasonable relationship between the measurements of
corrosion mass loss of steel and measurements of corrosion rates by using
electrochemical methods for specimens constituted largely by Iron (Fe) in active state of
corrosion.
Based on a previous investigation [19], the length of the corroding spots (L) in the
SS bars embedded in concrete was estimated in the range of 5 - 15 mm long. This study
took into account the previous reference and considered an average value of (L) equal to
10 mm or 1 cm for the calculation of the critical concrete cover (Xcrit). Long-term study
and autopsy of the specimens will allow a better understanding of the phenomena and
may refine this assumption.
From the calculations, the average corrosion rate in the chloride contaminated
concrete area of concrete specimens reinforced with AISI 1018 CS was 8.2 μmy, which
would indicate a duration of the propagation period less than 10 years for cracking of the
concrete cover. The corrosion rates as a function of position seemed uniformly
distributed, which suggests that the morphology of corrosion was uniform within the
resolution of the impedance measurement, which was assumed to be that of the size of
the counter electrode was approximately 10 cm of length of beam. Additionally, an
average corrosion rate of 5.1 μmy in chloride free concrete areas was registered, which
may indicate that these areas corrode at a 60% lower rate that of chloride-contaminated
concrete areas.
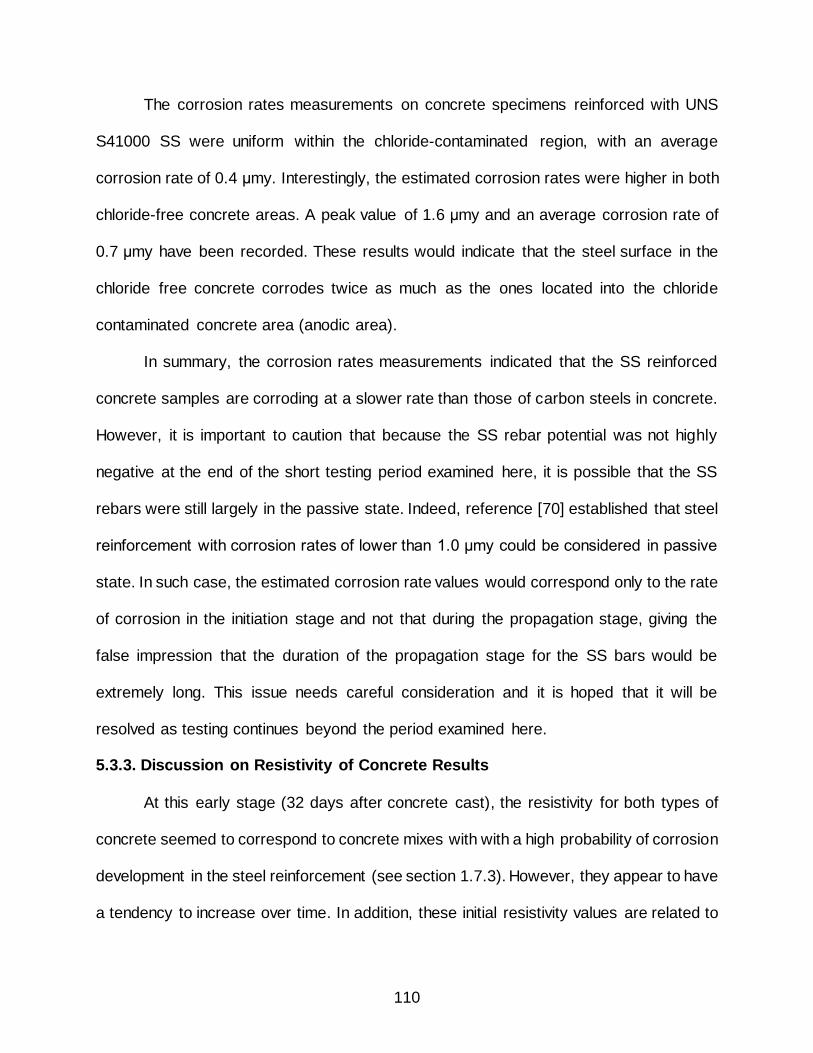
110
The corrosion rates measurements on concrete specimens reinforced with UNS
S41000 SS were uniform within the chloride-contaminated region, with an average
corrosion rate of 0.4 μmy. Interestingly, the estimated corrosion rates were higher in both
chloride-free concrete areas. A peak value of 1.6 μmy and an average corrosion rate of
0.7 μmy have been recorded. These results would indicate that the steel surface in the
chloride free concrete corrodes twice as much as the ones located into the chloride
contaminated concrete area (anodic area).
In summary, the corrosion rates measurements indicated that the SS reinforced
concrete samples are corroding at a slower rate than those of carbon steels in concrete.
However, it is important to caution that because the SS rebar potential was not highly
negative at the end of the short testing period examined here, it is possible that the SS
rebars were still largely in the passive state. Indeed, reference [70] established that steel
reinforcement with corrosion rates of lower than 1.0 μmy could be considered in passive
state. In such case, the estimated corrosion rate values would correspond only to the rate
of corrosion in the initiation stage and not that during the propagation stage, giving the
false impression that the duration of the propagation stage for the SS bars would be
extremely long. This issue needs careful consideration and it is hoped that it will be
resolved as testing continues beyond the period examined here.
5.3.3. Discussion on Resistivity of Concrete Results
At this early stage (32 days after concrete cast), the resistivity for both types of
concrete seemed to correspond to concrete mixes with with a high probability of corrosion
development in the steel reinforcement (see section 1.7.3). However, they appear to have
a tendency to increase over time. In addition, these initial resistivity values are related to
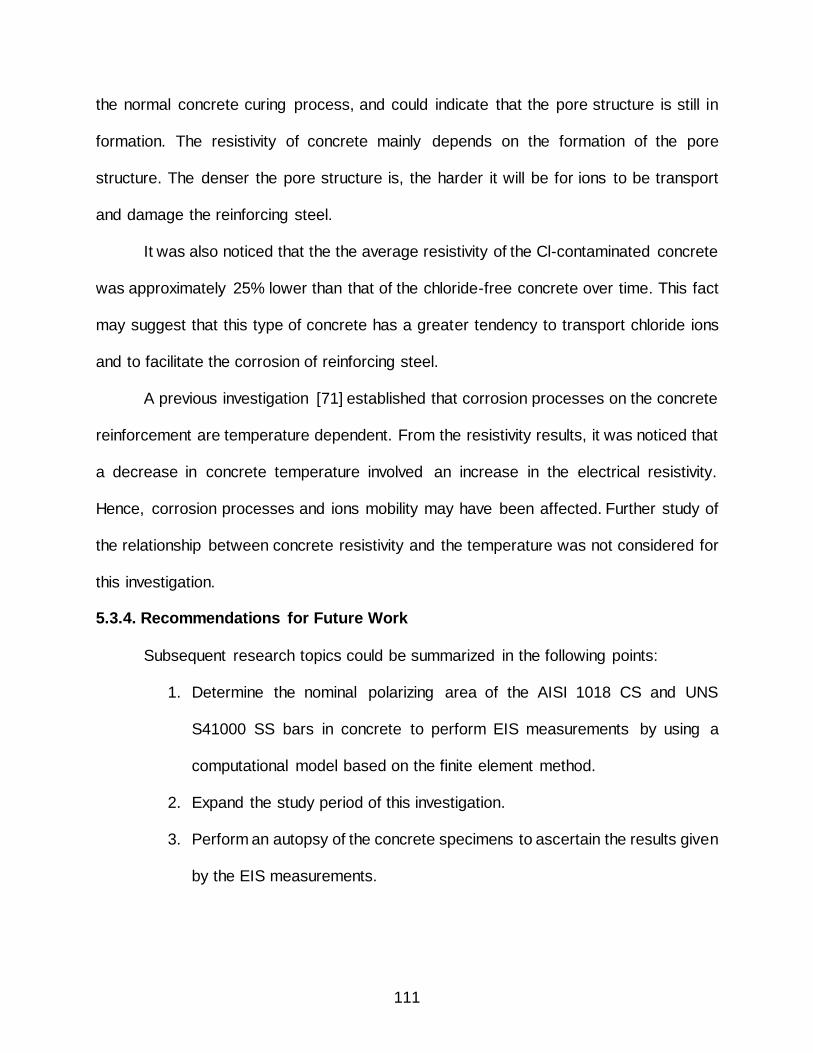
111
the normal concrete curing process, and could indicate that the pore structure is still in
formation. The resistivity of concrete mainly depends on the formation of the pore
structure. The denser the pore structure is, the harder it will be for ions to be transport
and damage the reinforcing steel.
It was also noticed that the the average resistivity of the Cl-contaminated concrete
was approximately 25% lower than that of the chloride-free concrete over time. This fact
may suggest that this type of concrete has a greater tendency to transport chloride ions
and to facilitate the corrosion of reinforcing steel.
A previous investigation [71] established that corrosion processes on the concrete
reinforcement are temperature dependent. From the resistivity results, it was noticed that
a decrease in concrete temperature involved an increase in the electrical resistivity.
Hence, corrosion processes and ions mobility may have been affected. Further study of
the relationship between concrete resistivity and the temperature was not considered for
this investigation.
5.3.4. Recommendations for Future Work
Subsequent research topics could be summarized in the following points:
1. Determine the nominal polarizing area of the AISI 1018 CS and UNS
S41000 SS bars in concrete to perform EIS measurements by using a
computational model based on the finite element method.
2. Expand the study period of this investigation.
3. Perform an autopsy of the concrete specimens to ascertain the results given
by the EIS measurements.
112
4. Identify the corrosion morphology of AISI 1018 CS and UNS S41000 SS
using advanced three-dimensional measurements.
5. Identify and quantify the corrosion products for both steel reinforcements.
113
CHAPTER 6: CONCLUSIONS
1. The literature review indicated among other findings that the duration of the
CPS of SS’s embedded in concrete may be estimated to be in the order of
several decades. High-grade SS’s would have a longer duration of the CPS.
The review also indicated that even localized corrosion of SS reinforcement
may induce concrete cracking. The literature also suggested that the
corrosion detection on SS reinforced concrete may require a combination
of conventional methods (half-cell potential) and advanced electrochemical
techniques such as Electrochemical Impedance Spectroscopy,
Electrochemical noise, etc.
2. The traditional half-cell potential measurements on AISI 1018 CS reinforced
concrete specimens appeared to be suitable to estimate the corrosion state
of the reinforcement. However, there was uncertainty on the interpretation
of the half-cell potential results and thus the corrosion state of UNS S41000
SS reinforced concrete specimens.
3. The EIS measurements provided an estimation of the corrosion rates on the
surface averaged of either SS or CS bars in concrete. Low-dispersion
corrosion rates values were found over large areas on SS and CS bars in
concrete, but that SS embedded in concrete also seemed to develop
instances of corrosion rate peaks.
114
4. The duration of the CPS of CS in concrete was estimated to be in the
interval [6, 59] years. Assuming that the CPS had been reached, SS
specimens in concrete appeared to have a much longer duration of CPS
than CS, with an interval [57, 253] years. However, this assumption is likely
not valid and more work is required to assess the CPS of SS reinforced
concrete.

115
REFERENCES
REFERENCES
[1] A. A. Sagüés, "Modeling the Effects of Corrosion on the Lifetime of Extended Reinforced Concrete Structures," Corrosion, vol. 59, p. 854, 2003.
[2] F. Lollini, M. Carsana, M. Gastaldi and E. Redaelli, "Corrosion Behaviour of Stainless Steel Reinforcement in Concrete," Corrosion Reviews, vol. 37, no. 1, pp.
3-19, 2019.
[3] M. F. Hurley and J. R. Scully, "Lateral and radial corrosion propagation behavior of 9-21% Cr and 18% Cr + 2.8% Mo stainless steel reinforcing materials in simulated concrete environments," Materials and Corrosion, vol. 64, no. 9, pp. 752-
763, 2013.
[4] ASTM Designation: C876-15, "Standard Test Method for Corrosion Potentials of Uncoated Reinforcing Steel in Concrete," ASTM International, West Conshohocken, PA, 2015, www.astm.org.
[5] B. Elsener, C. Andrade, J. Gulikers, R. Polder and M. Raupach, "Half-cell Potential Measurements – Potential Mapping on Reinforced Concrete Structures," Materials and Structures, vol. 36, no. 7, pp. 461-471, 2003.
[6] Y. Schiegg, M. Buchler and M. Brem, "Potential Mapping Technique for the Detection of Corrosion in Reinforced Concrete Structures: Investigation of Parameters Influencing the Measurement and Determination of the Reliability of the Method," Y Schiegg; M Buchler; M Brem, vol. 60, no. 2, pp. 79-86, 2009.
[7] D. Hansson, C. Van Niejenhuis and S. Walbridge, "The Performance of Austenitic and Duplex Stainless Steels in Cracked Concrete Exposed to Concentrated Chloride Brine," Journal of Materials Science, vol. 51, no. 1, pp. 362-374, 2016.
[8] Giatec Scientific, "Giatec Scientific Inc," [Online]. Available: https://www.giatecscientific.com/education/a-new-technique-for-rebar-corrosion-rate-measurement-in-concrete/. [Accessed 29 01 2019].
[9] A. A. Sagüés, Class Lecture, Topic: "Notes on Electrochemical Impedance Spectroscopy." CGN6720, Tampa, FL: College of Engineering,University of South
Florida, 2018.
[10] Gamry Instruments, "Potentiostat Fundamentals," Gamry Instruments, [Online]. Available: https://www.gamry.com/application-notes/instrumentation/potentiostat-fundamentals/. [Accessed 15 May 2019].
[11] K. W. J. Treadaway, R. N. Cox and B. L. Brown, "Durability of Corrosion Resisting Steels in Concrete.," Proceedings of the Institution of Civil Engineers (London). Part 1 - Design & Construction, vol. 86, pp. 305-331, 1989.
[12] A. A. Sagüés, Class Lecture, Topic: "Structural Life Prediction" CES6841, Tampa:
College of Engineering, University of South Florida, 2017.
116
[13] P. J. Gellings, Introduction to Corrosion Prevention and Control, Fairfax,VA: Delft University Press, 1985.
[14] K. Tuutti, Corrosion of Steel in Concrete, Stockholm: Swedish Cement and Concrete Research Institute, 1982.
[15] M. Fontana, Corrosion Engineering, Thrid Edition, United States of America: McGraw-Hill, 1987.
[16] ASTM Designation: A955, "Standard Specification for Deformed and Plain Stainless-Steel Bars for Concrete Reinforcement," ASTM International, West Conshohocken, PA, 2007, www.astm.org.
[17] NACE International TG 057 Technical Committee, "State of the Art Report on Corrosion-Resistant Reinforcement," to appear in 2019, NACE International, Houston, 2019.
[18] U. Nurnberger, "Stainless Steel Reinforcement - A Survey," Otto-Graf-Journal, vol.
16, pp. 111-138, 2005.
[19] F. Gutierrez Trellez, Corrosion Initiation and Propagation on Corrosion Resistant Alloys Embedded in Concrete by Accelerated Chloride Transport, Boca Raton: Florida Atlantic University, 2013.
[20] ASTM Designation: A615, "Standard Specification for Deformed and Plain Carbon-Steel Bars for Concrete Reinforcement," ASTM International, West Conshohocken, PA, 2018, www.astm.org.
[21] Florida Department of Transportation, "Standard Specifications for Road and Bridge Construction," Florida Department of Transportation , Tallahassee, Florida , 2019.
[22] A. A. Sagüés, S. C. Kranc, F. Presuel-Moreno, D. Rey, Torres-Acosta A. and L. Yao, "Corrosion Forecasting for 75-Year Durability Design of Reinforced Concrete, Final Report No. 99700-3515-020, WPI 0510805, Contract No. BA502," Florida Department of Transportation, Tampa, FL, 2001.
[23] A. A. Sagüés, J. B. Lee, X. Chang, H. Pickering, E. Nystrom, W. Carpenter, S. C. Kranc, T. Simmons, B. Boucher and S. Hierholzer, "Corrosion of Epoxy-Coated Rebar in Florida Bridges. Final Report WPI No. 0510603, State Job No. 99700-7556-010," University of South Florida, Tampa,FL, 1994.
[24] A. Torres-Acosta and A. Sagüés, "Concrete Cracking by Localized Steel Corrosion - Geometry," ACI Materials Journal, vol. 101, no. 6, pp. 501-507, 2004.
[25] A. A. Sagüés, "Corrosion Measurement Techniques for Steel in Concrete," in NACE annual conference and Corrosion Show, Houston,Texas, 1993.
[26] P. Gu, S. Elliott, J. J. Beaudoin and B. Arsenault, "Corrosion Resistance of Stainless Steel in Chloride Contaminated Concrete," Cement and Concrete Research, vol. 26, no. 8, pp. 1151 - 1156, 1996.
[27] R. G. Duarte, A. S. Castela, R. Neves, L. Freire and M. F. Montemor, "Corrosion Behavior of Stainless Steel Rebars Embedded in Concrete: an Electrochemical Impedance Spectroscopy Study," Electrochimica Acta, vol. 124, pp. 218-224,
2014.
117
[28] W. Morris, E. Moreno and A. A. Sagüés, "Practical Evaluation of Resistivity of Concrete in Test Cylinders Using a Wenner Array Probe," Cement and Concrete Research, vol. 26, no. 12, pp. 1779-1787, 1996.
[29] W. H. Hartt, R. G. Powers, V. Leroux and D. K. Lysogorski, "A Critical Literature Review of High-Performance Corrosion Reinforcements in Concrete Bridge Applications. Report No. (FHWA-HRT-04-093)," Federal Highway Administration, Virginia, 2004.
[30] F. Presuel-Moreno and F. Gutierrez, "Corrosion Initiation and Propagation of Two Duplex Stainless Steels Embedded in Concrete. NACE-2014-4359," in CORROSION 2014. NACE International., San Antonio, Texas, USA, 2014.
[31] F. Presuel-Moreno, F. Gutierrez, J. Zielske, V. Casas and Y.-Y. Wu, "Analysis and Estimation of Service Life of Corrosion Prevention Materials Using Diffusion, Resistivity and Accelerated Curing for New Bridge Structures - Volume 1: Corrosion Prevention Materials (Monitoring and Forensic Examination) (No. BDK79-977-02).," Florida Atlantic University, Florida Department of Transportation, Florida, 2013.
[32] ASTM Designation: A 380 – 06, "Standard Practice for Cleaning, Descaling, and Passivation of Stainless Steel Parts, Equipment, and Systems," ASTM International, West Conshohoken, 2006.
[33] ASTM Designation: A 967 – 05, "Standard Specification for Chemical Passivation Treatments for Stainless Steel Parts," ASTM International, West Conshohoken, 2005.
[34] M. F. Hurley and J. R. Scully, "Threshold Chloride Concentrations of Selected Corrosion-Resistant Rebar Materials Compared to Carbon Steel," Corrosion, vol.
69, no. 10, pp. 892-904, 2006.
[35] F. Cui and A. Sagüés, "Exploratory Assessment of Corrosion Behavior of Stainless Steel Clad Rebar - I: Experimental," Corrosion, vol. 62, p. 822, 2006.
[36] F. Cui and A. Sagüés, "Exploratory Assessment of Corrosion Behavior of Stainless Steel Clad Rebar - II: Modeling of Galvanic Corrosion at Cladding Breaks," Corrosion, vol. 62, p. 918, 2006.
[37] G. G. Clemena, D. N. Kukreja and C. S. Napier, "Trial Use of a Stainless Steel-clad Steel Bar in a New Concrete Bridge Deck in Virginia (VTRC 04-R5)," Federal Highway Administration, Virginia, 2003.
[38] G. Mullins, R. Sen and A. Sagüés, "Design and construction of precast piles with stainless reinforcing steel (BDK84 977-07)," Civil & Environmental Engineering, USF, Tampa, 2014.
[39] W. H. Hartt, R. G. Powers, D. K. Lysogorski, M. Paredes and Y. P. Virmani, "Job Site Evaluation of Corrosion-Resistant Alloys for Use as Reinforcement in Concrete. Report No. (FHWA-HRT-06-078)," Federal Highway Administration, Virginia, 2006.
[40] S. Mameng, C. Tigerstrand, T. Larsson, G. Gedge and J. McCray, "Experience of duplex stainless steels as construction materials in bridges: Results of seven inspections," in IABSE Symposium Vancouver 2017: Engineering the Future,
Sweden,London., 2017.

118
[41] F. Presuel-Moreno, J. Scully and S. Sharp, "Literature Review of Commercially Available Alloys That Have Potential as Low-Cost, Corrosion-Resistant Concrete Reinforcement," Corrosion, vol. 66, no. 8, pp. 086001-1 - 086001-13, 2010.
[42] Arminox Stainless, "Research and Development , Pier in Progreso, Mexico.," Arminox Stainless, Progreso, Mexico., 1999.
[43] A. Christensen, "Pier at Progreso," in 50 Years of Civil Engineering, 1904 - 1954,
Copenhagen,Denmark, Christiani & Nielsen, 1954, pp. 39-54.
[44] A. A. Torres-Acosta, "Viaducto de Arcos de Progreso,Yucatan: Primera Obra de Concreto Construida con Acero Inoxidable.," Instituto Mexicano del Transporte, Mexico., 2018.
[45] P. Castro-Borges, O. Troconis, E. Moreno, A. A. Torres-Acosta, M. Martinez-Madrid and A. Knudsen, "Performance of a 60-year-old concrete pier with stainless steel reinforcement," Materials Performance, vol. 41, no. 10, pp. 50-55, 2002.
[46] E. I. Moreno, A. Torres-Acosta and P. Castro Borges, "Construccion del Muelle de Progreso," Ingeniería Revista Academica, vol. 8, no. 1, pp. 61- 66, 2004.
[47] A. Torres-Acosta, P. Castro and M. Martinez, "Estudio de la Durabilidad del Antiguo Muelle Fiscal y Pruebas de Carga de Tres Arcos del Viaducto. Primer Informe," Instituto Mexicano del Transporte, Mexico, 2005.
[48] A. Torres-Acosta, P. Castro and M. Martinez, "Estudio de la Durabilidad del Antiguo Muelle Fiscal y Pruebas de Carga de Tres Arcos del Viaducto. Segundo Informe," Instituto Mexicano de Transporte, Mexico, 2005.
[49] D. McDonald, M. Sherman, D. Pfeifer and Y. Virmani, "Stainless Steel Reinforcing as Corrosion Protection," Concrete International, vol. 17, no. 5, pp. 65-70, 1995.
[50] S. Kahl, "Stainless and Stainless-Clad Reinforcement for Highway Bridge Use. Final Report (RC-1560)," Michigan Deparment of Transportation, Michigan, 2012.
[51] A. Ip, F. Pianca and B. Hope, "Application of stainless steel reinforcement for highway bridges in Ontario," in Concrete under severe conditions 2, Proc. 2nd International conference on concrete under severe conditions, Volume 2, London,
1998.
[52] SASSDA, "South Africa Stainless Steel Development Association," March 2018. [Online]. Available: https://sassda.co.za/millennium-bridge-thriving-after-18-years/.
[53] J. D. Wenzlick, "Evaluation of Stainless Steel Reinforcement In Bridge Decks Report (Report OR08-011)," Missouri Department of Transportation, Missouri, 2007.
[54] L. Xing, D. Drawin and J. Browning, "Evaluation of Multiple Corrosion Protection Systems and Corrosion Inhibitors for Reinforced Concrete Bridge Decks (Contract No. DTFH61-03-C-00131)," The University of Kansas Center for research, Lawrence, Kansas, 2010.
[55] Heselmans, Jan; Vermeij, Peter., "Fatal Accident in Dutch Swimming Pool caused by Environmentally Cracked Bolts., Paper No. 2331," in Corrosion 2013, NACE International, Houston, 2013.
119
[56] G. N. Flint and R. N. Cox, "The Resistance of Stainless Steel Partly Embedded In Concrete to Corrosion by Seawater," Magazine of Concrete Research, vol. 40, pp.
13-27, 1988.
[57] R. Cox and J. Oldfield, "The Long-Term Performance of Austenitic Stainless Steel in Chloride Contaminated Concrete.," SPECIAL PUBLICATION-ROYAL SOCIETY OF CHEMISTRY, vol. 183, no. 1, pp. 662-669, 1996.
[58] A. Fahim, A. E. Dean, M. D. A. Thomas and E. G. Moffatt, "Corrosion Resistance of Chromium-steel and Stainless Steel Reinforcement in Concrete (DOI: 10.1002/maco.201709942)," Materials and Corrosion, vol. 69, no. 2, pp. 1-17,
2018.
[59] B. Callaghan, "Performance of a 12% chromium steel in concrete in severe marine environments," Corrosion Science, vol. 35, no. 5 -8 pt 2, pp. 1535-1541, 1993.
[60] Y. Schiegg, C. -H. Voute, H. Peter, S. Hasler and U. Urlau, "Initiation and Corrosion Propagation of Stainless Steel Reinforcements in Concrete Structures," in European Corrosion Conference: Long Term Prediction and Modelling of Corrosion, EUROCORR 2004, September 12, 2004 - September 16, Nice, France,
2004.
[61] J. Scully and M. Hurley, "Investigation of the corrosion propagation characteristics of new metalics reinforcing bars. Final Contract Report (VTRC 07-CR 09)," Virginia Department of Transportation, Virginia, 2007.
[62] A. Pachón-Montaño, J. Sánchez-Montero, C. Andrade , J. Fullea , E. Moreno and V. Matres , "Threshold Concentration of Chlorides in Concrete for Stainless Steel Reinforcement: Classic Austenitic and New Duplex Stainless Steel," Construction and Building Materials, vol. 186, p. 495–502, 2018.
[63] C. Alonso, C. Andrade, M. Castellote and P. Castro, "Chloride Threshold Values to Depassivate Reinforcing Bars Embedded in a Standardized OPC Mortar," Cement and Concrete Research, vol. 30, no. 7, pp. 1047-1055, 2000.
[64] W. H. Hartt, R. G. Powers, D. K. Lysogorski, V. Liroux and Y. P. Virmani, "Corrosion Resistant Alloys for Reinforced Concrete. Report No. (FHWA-HRT-07-039)," Florida Atlantic University and Florida Department of Transportation, Florida, July 2007.
[65] ASTM Designation: C192 / C192M-18, "Standard Practice for Making and Curing Concrete Test Specimens in the Laboratory," ASTM International, West Conshohocken, PA, 2018, www.astm.org.
[66] F. Cui and A. Sagüés, "Cathodic Behavior of Stainless Steel 316LN Reinforcing Bars In Simulated Concrete Pore Solutions. Paper No. 08323," in Corrosion 2008, NACE International, Houston, 2008.
[67] L. Bertolini, F. Bolzoni, T. Pastore and P. Pedeferri, "Behaviour of Stainless Steel in Simulated Concrete Pore Solution," British Corrosion Journal, vol. 31, no. 3, pp.
218-222, 1996.
[68] M. Garcia-Alonso, M. L. Escudero, J. M. Miranda, M. I. Vega, F. Capilla, M. J. Correia, M. Salta, A. Bennani and J. A. Gonzalez, "Corrosion behaviour of new stainless steels reinforcing bars embedded in concrete," Cement and Concrete Research, vol. 37, no. 10, pp. 1463-1471, 2007.
120
[69] J. A. Gonzalez and C. Andrade, "Effect of Carbonation, Chlorides and Relative Ambient Humidity on the Corrosion of Galvanized Rebars Embedded in Concrete," British Corrosion Journal, vol. 17, no. 1, pp. 21-28, 1982.
[70] C. Andrade and M. Alonso, "Values of Corrosion Rate of Steel in Concrete to Predict Service Life of Concrete Structures," in in Application of Accelerated Corrosion Tests to Service Life Prediction of Materials, ed. G. Cragnolino and N. Sridhar, West Conshohocken, PA, ASTM International, 1994, pp. 282-295.
[71] M. Dugarte and A. Sagüés, "Accounting for Temperature Effects on an Evolving Galvanic Anode Cathodic Protection System for Steel in Concrete," Corrosion , vol.
72, no. 11, pp. 1462-1469, 2016.
[72] B. Sørensen, P. B. Jensen and E. Maahn, "The Corrosion Properties of Stainless Steel Reinforcement.," in Corrosion of Reinforcement in Concrete, London, UK,
Elsevier Applied Science, 1990, pp. 601-610.
[73] F. H. Rasheeduzzafar, F. H. Dakhil, M. A. Bader and M. M. Khan, "Performance of Corrosion Resisting Steels in Chloride-bearing Concrete.," ACI Materials Journal,
vol. 89, no. 5, pp. 439-448, 1992.
[74] P. Gu, S. Elliott, J. J. Beaudoin and B. Arsenault, "Corrosion resistance of stainless steel in chloride contaminated concrete," Cement and Concrete Research, vol. 26,
no. 8, pp. 1151 - 1156, 1996.
[75] J. MccGrun, "Stainless Steel Reinforcing Bars in Concrete," in Proceedings of the International Conference of Corrosion and Rehabilitation of Reinforced Concrete Structures, Orlando, FL, FHWA, Orlando, Florida, 1997.
[76] M. Rosso, G. Melotti, D. Gyppaz and M. Cornoglio, "Corrosion Behaviour of Duplex Stainless Steels for Concrete Reinforcement Application," in Duplex Stainless Steels 97 - 5th World Conference, Italy, 1997.
[77] D. McDonald, D. Pfeifer and P. Virmani, "Corrosion - Resistant Reinforcing Bars Findings of a 5-years FHWA Study," in Proceedings of International Conference on Corrosion and Rehabilitation of Reinforced Concrete Structures,
Orlando,Florida, 1999.
[78] D. McDonald, D. Pfeifer and M. Sherman, "Corrosion Evaluation of Epoxy-Coated, Metallic-Clad and Solid Reinforcing Bars in Concrete. Final Contract Report (FHWA-RD-98-153)," Federal Highway Administration, Virginia, 1998.
[79] L. Bertolini, M. Gastaldi, M. Pedeferri and P. Pedeferri, "Stainless Steel in Concrete," in European Comission, COST521 Action Corrosion of steel in reinforced concrete structures, Workshop proceedings, Tampere, Finland, 2000.
[80] Y. Tadokoro, M. Kojima and N. Otsuki, "Corrosion Propagation Behavior of Stainless Steel Reinforcing Bars in Concrete.," Corrosion Engineering / Zairyo to Kankyo., vol. 59, no. 5, pp. 126-135, 2010.
[81] B. Elsener, D. Addari, S. Coray and A. Rossi, "Stainless Steel Reinforcing Bars - Reason for their High Pitting Corrosion Resistance.," Materials and Corrosion, vol.
69, no. 2, pp. 111-119, 2011.

121
[82] M. Serdar, L. V. Žulj and D. Bjegović, "Long-term corrosion behaviour of stainless reinforcing steel in mortar exposed to chloride environment," Corrosion Science,
vol. 69, pp. 149-157, 2013.
[83] M. Gastaldi and L. Bertolini, "Effect of Temperature on the Corrosion Behaviour of Low-nickel Duplex Stainless Steel Bars in Concrete," Cement and Concrete Research, vol. 56, p. 52–60, 2014.
[84] Nickel Institute, "Stainless Steel Reinforcement," 2015. [Online]. Available: https://www.nickelinstitute.org/~/media/Files/TechnicalLiterature/Ni_StainlessSteel-Rebar-LD.ashx. [Accessed 15 01 2019].
[85] ISSF, International Stainless Steel Forum, "Stainless Steel Rebar Application," 2018. [Online]. Available: http://www.stainlesssteelrebar.org/applications/. [Accessed 17 11 2018].
[86] E. Jouannais, "Stainless Steel in Bridges and Footbridges," 2004. [Online]. Available: http://www.constructalia.com/repository/Publications/Stainless%20Bridges%20and%20Footbridges/stainlesssteelbridges_EN.pdf.
[87] IMOA, "International Molybdenum Association," 2007. [Online]. Available: https://www.imoa.info/download_files/stainless-steel/StainlessSteelReinforcement.pdf. [Accessed 21 12 2018].
[88] F. N. Smith, "Stainless Steel Reinforcement for Concrete Construction," in 12th Middle East, Corrosion conference & Exhibition, Bahrain, 2008.
[89] N. Baddoo and A. Kosmač, "Sustainable Duplex Stainless Steel Bridges," The Steel Construction Institute,Euro Inox, 2010. [Online]. Available: http://www.worldstainless.org/Files/issf/non-image-files/PDF/Sustainable_Duplex_Stainless_Steel_Bridges.pdf. [Accessed 14 01 2019].
[90] ISSF, "International Stainless Steel," 07 05 2016. [Online]. Available: http://www.worldstainless.org/Files/issf/non-image-files/PDF/ISSF_Stainless_Steel_in_Infrastructure_English.pdf. [Accessed 15 12 2018].
[91] D. Cochrane, "Success for Stainless Steel, Concrete in, on and Under Water.," Concrete, pp. 26-28, 2003.
[92] G. Gedge, Structural uses of stainless steel — buildings and civil engineering, vol.
64, 2008, pp. 1194-1198.
[93] Arminox Stainless , "American Arminox, Inc," 2016. [Online]. Available: http://americanarminox.com/.
[94] Cedinox - Stainless Steel , "Stainless Steel Spanish Association," 2014. [Online]. Available: http://www.cedinox.es/en/acero-inoxidable/application/02.-civil-engineering/.
[95] Iron Boar Labs Ltd, "MakeItFrom," [Online]. Available: https://www.makeitfrom.com/. [Accessed 01 May 2019].
122
[96] British Stainless Steel Association, "Pitting Corrosion & PRE Numbers," [Online]. Available: https://www.bssa.org.uk/topics.php?article=111. [Accessed 01 May 2019].
[97] ATI Metals, "Products," [Online]. Available: https://www.atimetals.com/. [Accessed 01 May 2019].
[98] Gualstainless, S.L., "Interesting Articles," [Online]. Available: http://www.gual.es/?I. [Accessed 01 May 2019].

123
APPENDIX A: SELECTED RESEARCH PUBLICATIONS ON SS REBAR IN CONCRETE - CHRONOLOGICAL ORDER
Table A.1 Selected Research Publications on SS Rebar in Concrete - Chronological Order
YEAR AUTHOR SS TEST ENVIRONMENT DURA
TION (y)
STAGE COMPLETED
COMMENTS REF A D F STR EXT
LAB I P
CEM LIQ
1941 Christensen A5 Progreso
Pier,
Mexico
See section 2.1.1.1 [43]
1988 Flint A9
Langstone
Harbour, U.K.
12.5 ✔ X See Section 2.2.1.1 [56]
1989 Treadaway A4 A8 A9
F1 F5
Beckton, London,
UK.
10 ✔ ✔ See Section 2.2.1.2 [11]
1990 Sørensen A5 A9
✔ ✔ X Corrosion threshold > 10 times higher for SS than for mild steel.
[72]
1992 Rasheeduzzafar A5 Dharhan,
Saudi
Arabia.
7 X X Threshold 24 times higher for type 304 than for Black Bar.
[73]
1993 Callaghan F4
Durban Bluff,
South Africa.
✔ 4.5 ✔ X See Section 2.2.3 [59]
1995 McDonald A5
Bridge over Lenox
Rd., Michigan
9 X X See Section 2.1.2 [49]
1995 McDonald A9
I-295 Bridge,
New Jersey
9 X X See Section 2.1.3 [49]
1996 Bertolini
A5 A6 A7 A9
A10
F6 ✔ 48 hrs ✔ X Type 304 and 316 resistant to pitting corrosion in alkaline solutions, but pit at lowered pH.
[67]
1996 Gu A2 ✔ 2 X X Corrosion rate of SS in Cl contaminated concrete <50 times lower than for Black Bar - but initiation stage for SS appears not to have been completed..
[74]
KEY A: Austenitic D: Duplex F: Ferritic
STR: Part of field structure EXT: RC in weather/highway/marine exposure LAB: Lab. tests in cementitious solid (CEM) or liquid sol.(LIQ)
I: Initiation stage. P: Propagation stage.
See App. C for key to specific alloys within each category.
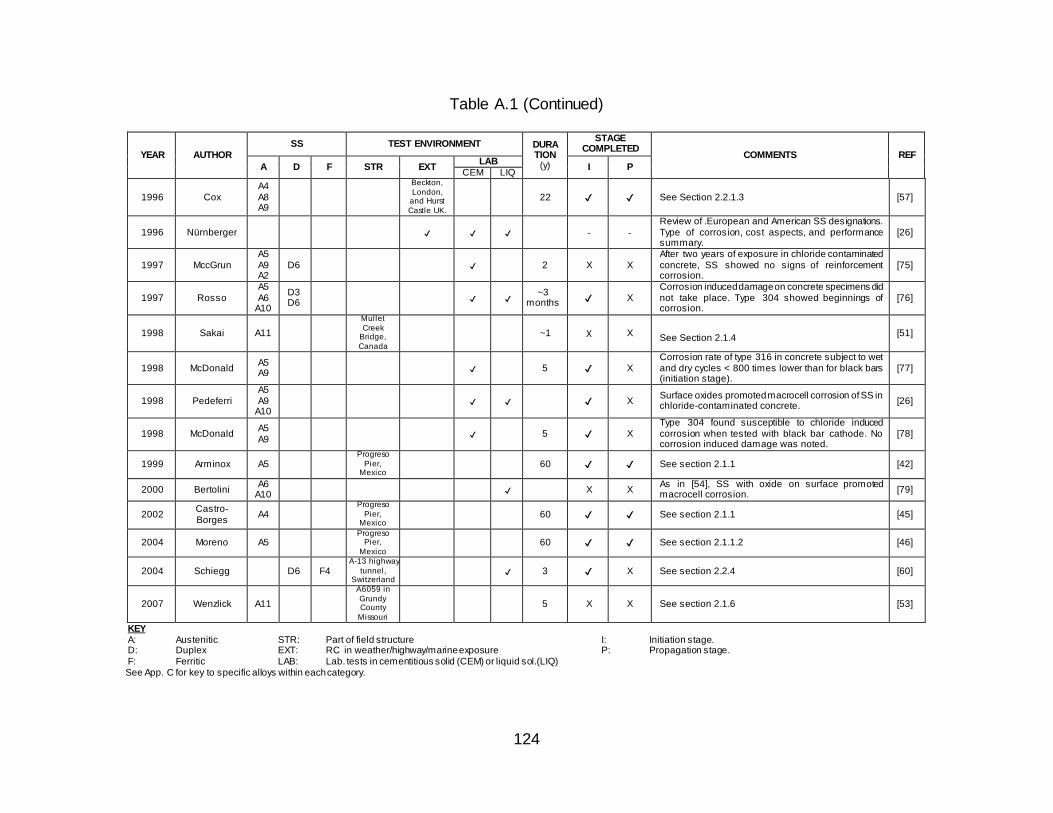
124
Table A.1 (Continued)
YEAR AUTHOR SS TEST ENVIRONMENT DURA
TION (y)
STAGE COMPLETED
COMMENTS REF A D F STR EXT
LAB I P
CEM LIQ
1996 Cox A4 A8 A9
Beckton,
London, and Hurst
Castle UK.
22 ✔ ✔ See Section 2.2.1.3 [57]
1996 Nürnberger ✔ ✔ ✔ - -
Review of .European and American SS designations. Type of corrosion, cost aspects, and performance summary.
[26]
1997 MccGrun A5 A9 A2
D6 ✔ 2 X X After two years of exposure in chloride contaminated concrete, SS showed no signs of reinforcement corrosion.
[75]
1997 Rosso A5 A6
A10
D3 D6
✔ ✔ ~3
months ✔ X Corrosion induced damage on concrete specimens did not take place. Type 304 showed beginnings of corrosion.
[76]
1998 Sakai A11
Mullet
Creek Bridge,
Canada
~1 X X See Section 2.1.4
[51]
1998 McDonald A5 A9
✔ 5 ✔ X Corrosion rate of type 316 in concrete subject to wet and dry cycles < 800 times lower than for black bars (initiation stage).
[77]
1998 Pedeferri A5 A9
A10 ✔ ✔ ✔ X
Surface oxides promoted macrocell corrosion of SS in chloride-contaminated concrete.
[26]
1998 McDonald A5 A9
✔ 5 ✔ X Type 304 found susceptible to chloride induced corrosion when tested with black bar cathode. No corrosion induced damage was noted.
[78]
1999 Arminox A5 Progreso
Pier, Mexico
60 ✔ ✔ See section 2.1.1 [42]
2000 Bertolini A6
A10 ✔ X X
As in [54], SS with oxide on surface promoted macrocell corrosion.
[79]
2002 Castro-Borges
A4 Progreso
Pier, Mexico
60 ✔ ✔ See section 2.1.1 [45]
2004 Moreno A5 Progreso
Pier,
Mexico
60 ✔ ✔ See section 2.1.1.2 [46]
2004 Schiegg D6 F4 A-13 highway
tunnel, Switzerland
✔ 3 ✔ X See section 2.2.4 [60]
2007 Wenzlick A11
A6059 in
Grundy County
Missouri
5 X X See section 2.1.6 [53]
KEY A: Austenitic D: Duplex F: Ferritic
STR: Part of field structure EXT: RC in weather/highway/marine exposure LAB: Lab. tests in cementitious solid (CEM) or liquid sol.(LIQ)
I: Initiation stage. P: Propagation stage.
See App. C for key to specific alloys within each category.
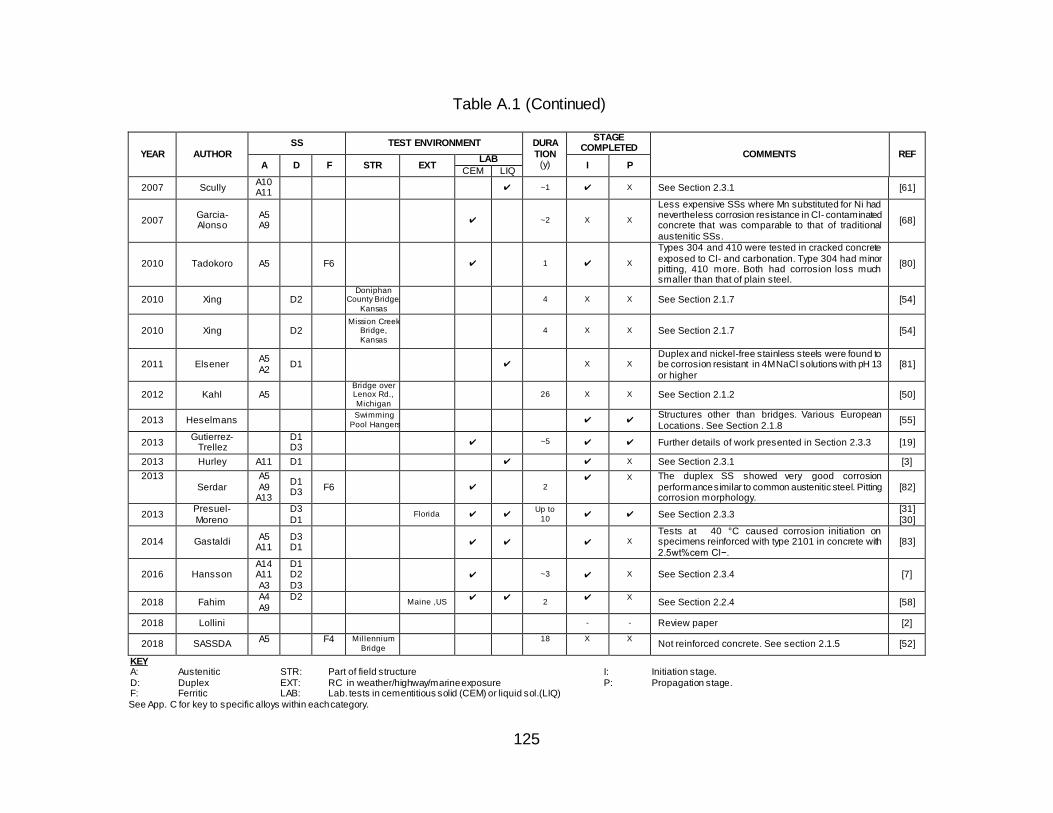
125
Table A.1 (Continued)
YEAR AUTHOR SS TEST ENVIRONMENT DURA
TION (y)
STAGE COMPLETED
COMMENTS REF A D F STR EXT
LAB I P
CEM LIQ
2007 Scully A10 A11
✔ ~1 ✔ X See Section 2.3.1 [61]
2007 Garcia-Alonso
A5 A9
✔ ~2 X X
Less expensive SSs where Mn substituted for Ni had nevertheless corrosion resistance in Cl- contaminated concrete that was comparable to that of traditional austenitic SSs.
[68]
2010 Tadokoro A5 F6 ✔ 1 ✔ X
Types 304 and 410 were tested in cracked concrete exposed to Cl- and carbonation. Type 304 had minor pitting, 410 more. Both had corrosion loss much smaller than that of plain steel.
[80]
2010 Xing D2 Doniphan
County Bridge,
Kansas
4 X X See Section 2.1.7 [54]
2010 Xing D2 Mission Creek
Bridge,
Kansas
4 X X
See Section 2.1.7
[54]
2011 Elsener A5 A2
D1 ✔ X X
Duplex and nickel-free stainless steels were found to be corrosion resistant in 4M NaCl solutions with pH 13 or higher
[81]
2012 Kahl A5 Bridge over Lenox Rd.,
Michigan
26 X X See Section 2.1.2 [50]
2013 Heselmans Swimming
Pool Hangers ✔ ✔
Structures other than bridges. Various European Locations. See Section 2.1.8
[55]
2013 Gutierrez-
Trellez
D1 D3
✔ ~5 ✔ ✔ Further details of work presented in Section 2.3.3 [19]
2013 Hurley A11 D1 ✔ ✔ X See Section 2.3.1 [3]
2013
Serdar
A5 A9
A13
D1 D3
F6 ✔ 2
✔
X
The duplex SS showed very good corrosion performance similar to common austenitic steel. Pitting corrosion morphology.
[82]
2013 Presuel-Moreno
D3 D1
Florida ✔ ✔ Up to
10 ✔ ✔ See Section 2.3.3
[31] [30]
2014 Gastaldi A5
A11 D3D1
✔ ✔ ✔ X
Tests at 40 °C caused corrosion initiation on specimens reinforced with type 2101 in concrete with 2.5wt%cem Cl−.
[83]
2016 Hansson A14 A11 A3
D1 D2 D3
✔ ~3 ✔ X See Section 2.3.4 [7]
2018 Fahim A4 A9
D2
Maine ,US ✔
✔
2
✔
X
See Section 2.2.4 [58]
2018 Lollini - - Review paper [2]
2018 SASSDA A5
F4
Millennium
Bridge
18
X
X
Not reinforced concrete. See section 2.1.5 [52]
KEY A: Austenitic D: Duplex F: Ferritic
STR: Part of field structure EXT: RC in weather/highway/marine exposure LAB: Lab. tests in cementitious solid (CEM) or liquid sol.(LIQ)
I: Initiation stage. P: Propagation stage.
See App. C for key to specific alloys within each category.
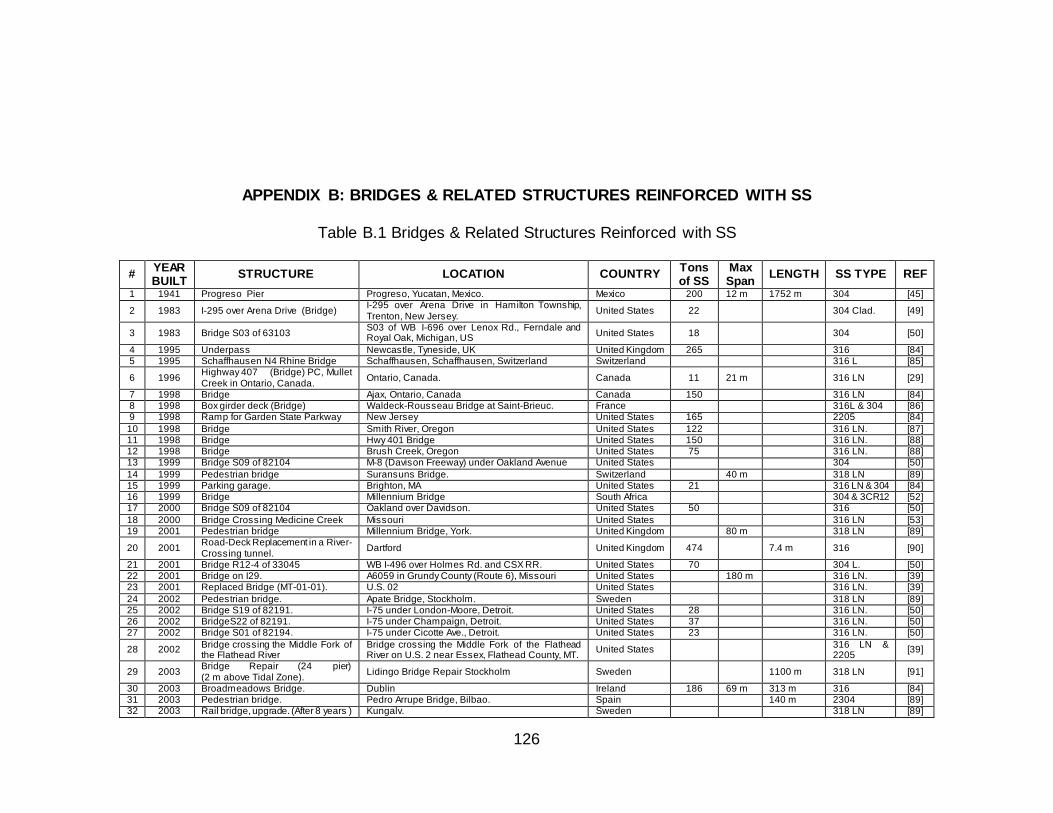
126
APPENDIX B: BRIDGES & RELATED STRUCTURES REINFORCED WITH SS
Table B.1 Bridges & Related Structures Reinforced with SS
# YEAR BUILT
STRUCTURE LOCATION COUNTRY Tons of SS
Max Span
LENGTH SS TYPE REF
1 1941 Progreso Pier Progreso, Yucatan, Mexico. Mexico 200 12 m 1752 m 304 [45]
2 1983 I-295 over Arena Drive (Bridge) I-295 over Arena Drive in Hamilton Township, Trenton, New Jersey.
United States 22 304 Clad. [49]
3 1983 Bridge S03 of 63103 S03 of WB I-696 over Lenox Rd., Ferndale and Royal Oak, Michigan, US
United States 18 304 [50]
4 1995 Underpass Newcastle, Tyneside, UK United Kingdom 265 316 [84] 5 1995 Schaffhausen N4 Rhine Bridge Schaffhausen, Schaffhausen, Switzerland Switzerland 316 L [85]
6 1996 Highway 407 (Bridge) PC, Mullet Creek in Ontario, Canada.
Ontario, Canada. Canada 11 21 m 316 LN [29]
7 1998 Bridge Ajax, Ontario, Canada Canada 150 316 LN [84] 8 1998 Box girder deck (Bridge) Waldeck-Rousseau Bridge at Saint-Brieuc. France 316L & 304 [86] 9 1998 Ramp for Garden State Parkway New Jersey United States 165 2205 [84]
10 1998 Bridge Smith River, Oregon United States 122 316 LN. [87] 11 1998 Bridge Hwy 401 Bridge United States 150 316 LN. [88] 12 1998 Bridge Brush Creek, Oregon United States 75 316 LN. [88] 13 1999 Bridge S09 of 82104 M-8 (Davison Freeway) under Oakland Avenue United States 304 [50]
14 1999 Pedestrian bridge Suransuns Bridge. Switzerland 40 m 318 LN [89] 15 1999 Parking garage. Brighton, MA United States 21 316 LN & 304 [84] 16 1999 Bridge Millennium Bridge South Africa 304 & 3CR12 [52] 17 2000 Bridge S09 of 82104 Oakland over Davidson. United States 50 316 [50]
18 2000 Bridge Crossing Medicine Creek Missouri United States 316 LN [53] 19 2001 Pedestrian bridge Millennium Bridge, York. United Kingdom 80 m 318 LN [89]
20 2001 Road-Deck Replacement in a River-Crossing tunnel.
Dartford United Kingdom 474 7.4 m 316 [90]
21 2001 Bridge R12-4 of 33045 WB I-496 over Holmes Rd. and CSX RR. United States 70 304 L. [50] 22 2001 Bridge on I29. A6059 in Grundy County (Route 6), Missouri United States 180 m 316 LN. [39] 23 2001 Replaced Bridge (MT-01-01). U.S. 02 United States 316 LN. [39]
24 2002 Pedestrian bridge. Apate Bridge, Stockholm. Sweden 318 LN [89] 25 2002 Bridge S19 of 82191. I-75 under London-Moore, Detroit. United States 28 316 LN. [50] 26 2002 BridgeS22 of 82191. I-75 under Champaign, Detroit. United States 37 316 LN. [50] 27 2002 Bridge S01 of 82194. I-75 under Cicotte Ave., Detroit. United States 23 316 LN. [50]
28 2002 Bridge crossing the Middle Fork of the Flathead River
Bridge crossing the Middle Fork of the Flathead River on U.S. 2 near Essex, Flathead County, MT.
United States 316 LN & 2205
[39]
29 2003 Bridge Repair (24 pier) (2 m above Tidal Zone).
Lidingo Bridge Repair Stockholm Sweden 1100 m 318 LN [91]
30 2003 Broadmeadows Bridge. Dublin Ireland 186 69 m 313 m 316 [84] 31 2003 Pedestrian bridge. Pedro Arrupe Bridge, Bilbao. Spain 140 m 2304 [89] 32 2003 Rail bridge, upgrade. (After 8 years ) Kungalv. Sweden 318 LN [89]
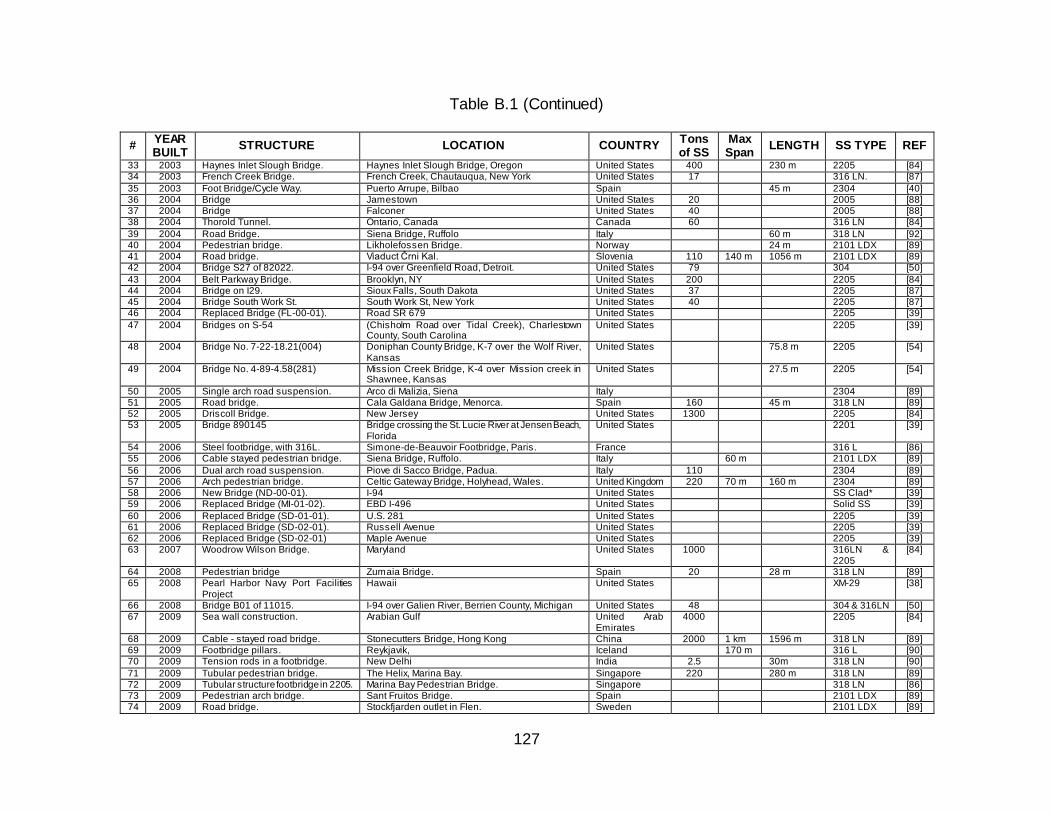
127
Table B.1 (Continued)
# YEAR BUILT
STRUCTURE LOCATION COUNTRY Tons of SS
Max Span
LENGTH SS TYPE REF
33 2003 Haynes Inlet Slough Bridge. Haynes Inlet Slough Bridge, Oregon United States 400 230 m 2205 [84] 34 2003 French Creek Bridge. French Creek, Chautauqua, New York United States 17 316 LN. [87]
35 2003 Foot Bridge/Cycle Way. Puerto Arrupe, Bilbao Spain 45 m 2304 [40] 36 2004 Bridge Jamestown United States 20 2005 [88] 37 2004 Bridge Falconer United States 40 2005 [88] 38 2004 Thorold Tunnel. Ontario, Canada Canada 60 316 LN [84]
39 2004 Road Bridge. Siena Bridge, Ruffolo Italy 60 m 318 LN [92] 40 2004 Pedestrian bridge. Likholefossen Bridge. Norway 24 m 2101 LDX [89] 41 2004 Road bridge. Viaduct Črni Kal. Slovenia 110 140 m 1056 m 2101 LDX [89] 42 2004 Bridge S27 of 82022. I-94 over Greenfield Road, Detroit. United States 79 304 [50]
43 2004 Belt Parkway Bridge. Brooklyn, NY United States 200 2205 [84] 44 2004 Bridge on I29. Sioux Falls, South Dakota United States 37 2205 [87] 45 2004 Bridge South Work St. South Work St, New York United States 40 2205 [87] 46 2004 Replaced Bridge (FL-00-01). Road SR 679 United States 2205 [39]
47 2004 Bridges on S-54 (Chisholm Road over Tidal Creek), Charlestown County, South Carolina
United States 2205 [39]
48 2004 Bridge No. 7-22-18.21(004) Doniphan County Bridge, K-7 over the Wolf River, Kansas
United States 75.8 m 2205 [54]
49 2004 Bridge No. 4-89-4.58(281) Mission Creek Bridge, K-4 over Mission creek in Shawnee, Kansas
United States 27.5 m 2205 [54]
50 2005 Single arch road suspension. Arco di Malizia, Siena Italy 2304 [89] 51 2005 Road bridge. Cala Galdana Bridge, Menorca. Spain 160 45 m 318 LN [89] 52 2005 Driscoll Bridge. New Jersey United States 1300 2205 [84] 53 2005 Bridge 890145 Bridge crossing the St. Lucie River at Jensen Beach,
Florida United States 2201 [39]
54 2006 Steel footbridge, with 316L. Simone-de-Beauvoir Footbridge, Paris. France 316 L [86] 55 2006 Cable stayed pedestrian bridge. Siena Bridge, Ruffolo. Italy 60 m 2101 LDX [89]
56 2006 Dual arch road suspension. Piove di Sacco Bridge, Padua. Italy 110 2304 [89] 57 2006 Arch pedestrian bridge. Celtic Gateway Bridge, Holyhead, Wales. United Kingdom 220 70 m 160 m 2304 [89] 58 2006 New Bridge (ND-00-01). I-94 United States SS Clad* [39] 59 2006 Replaced Bridge (MI-01-02). EBD I-496 United States Solid SS [39]
60 2006 Replaced Bridge (SD-01-01). U.S. 281 United States 2205 [39] 61 2006 Replaced Bridge (SD-02-01). Russell Avenue United States 2205 [39] 62 2006 Replaced Bridge (SD-02-01) Maple Avenue United States 2205 [39] 63 2007 Woodrow Wilson Bridge. Maryland United States 1000 316LN &
2205 [84]
64 2008 Pedestrian bridge Zumaia Bridge. Spain 20 28 m 318 LN [89] 65 2008 Pearl Harbor Navy Port Facilities
Project Hawaii United States XM-29 [38]
66 2008 Bridge B01 of 11015. I-94 over Galien River, Berrien County, Michigan United States 48 304 & 316LN [50] 67 2009 Sea wall construction. Arabian Gulf United Arab
Emirates 4000 2205 [84]
68 2009 Cable - stayed road bridge. Stonecutters Bridge, Hong Kong China 2000 1 km 1596 m 318 LN [89] 69 2009 Footbridge pillars. Reykjavik, Iceland 170 m 316 L [90] 70 2009 Tension rods in a footbridge. New Delhi India 2.5 30m 318 LN [90]
71 2009 Tubular pedestrian bridge. The Helix, Marina Bay. Singapore 220 280 m 318 LN [89] 72 2009 Tubular structure footbridge in 2205. Marina Bay Pedestrian Bridge. Singapore 318 LN [86] 73 2009 Pedestrian arch bridge. Sant Fruitos Bridge. Spain 2101 LDX [89] 74 2009 Road bridge. Stockfjarden outlet in Flen. Sweden 2101 LDX [89]
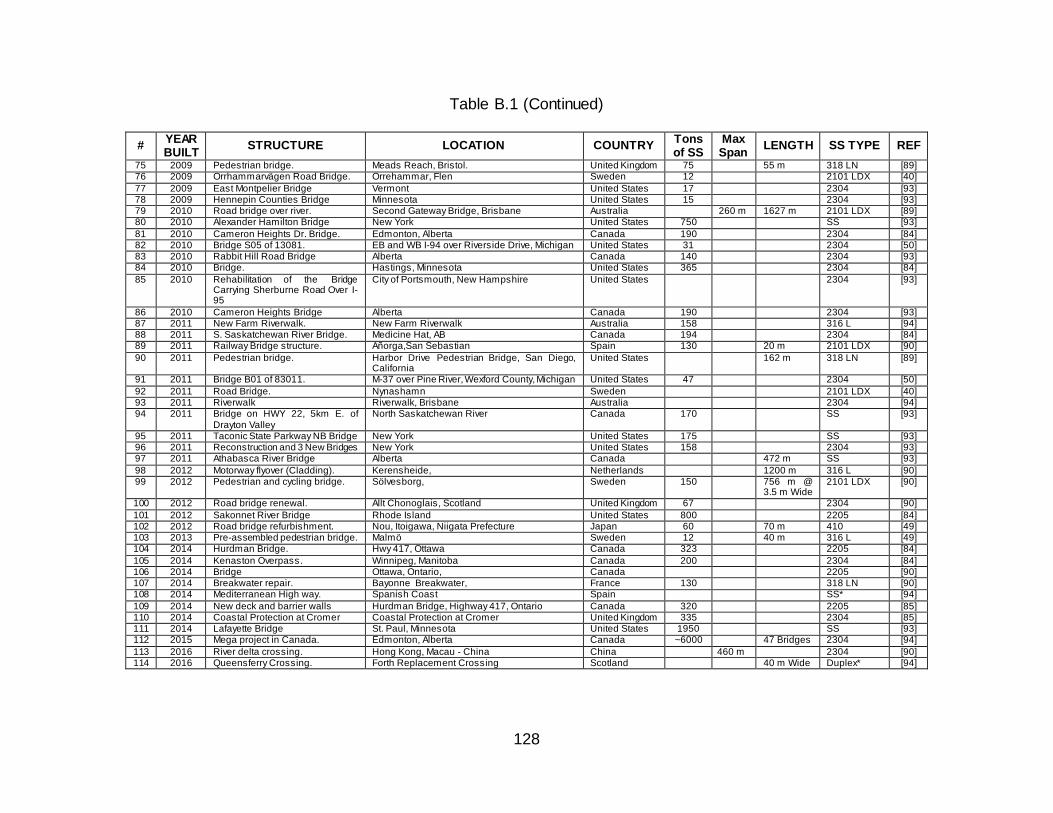
128
Table B.1 (Continued)
# YEAR BUILT
STRUCTURE LOCATION COUNTRY Tons of SS
Max Span
LENGTH SS TYPE REF
75 2009 Pedestrian bridge. Meads Reach, Bristol. United Kingdom 75 55 m 318 LN [89] 76 2009 Orrhammarvägen Road Bridge. Orrehammar, Flen Sweden 12 2101 LDX [40]
77 2009 East Montpelier Bridge Vermont United States 17 2304 [93] 78 2009 Hennepin Counties Bridge Minnesota United States 15 2304 [93] 79 2010 Road bridge over river. Second Gateway Bridge, Brisbane Australia 260 m 1627 m 2101 LDX [89] 80 2010 Alexander Hamilton Bridge New York United States 750 SS [93]
81 2010 Cameron Heights Dr. Bridge. Edmonton, Alberta Canada 190 2304 [84] 82 2010 Bridge S05 of 13081. EB and WB I-94 over Riverside Drive, Michigan United States 31 2304 [50] 83 2010 Rabbit Hill Road Bridge Alberta Canada 140 2304 [93] 84 2010 Bridge. Hastings, Minnesota United States 365 2304 [84]
85 2010 Rehabilitation of the Bridge Carrying Sherburne Road Over I-95
City of Portsmouth, New Hampshire United States 2304 [93]
86 2010 Cameron Heights Bridge Alberta Canada 190 2304 [93] 87 2011 New Farm Riverwalk. New Farm Riverwalk Australia 158 316 L [94] 88 2011 S. Saskatchewan River Bridge. Medicine Hat, AB Canada 194 2304 [84] 89 2011 Railway Bridge structure. Añorga,San Sebastian Spain 130 20 m 2101 LDX [90]
90 2011 Pedestrian bridge. Harbor Drive Pedestrian Bridge, San Diego, California
United States 162 m 318 LN [89]
91 2011 Bridge B01 of 83011. M-37 over Pine River, Wexford County, Michigan United States 47 2304 [50]
92 2011 Road Bridge. Nynashamn Sweden 2101 LDX [40] 93 2011 Riverwalk Riverwalk, Brisbane Australia 2304 [94] 94 2011 Bridge on HWY 22, 5km E. of
Drayton Valley North Saskatchewan River Canada 170 SS [93]
95 2011 Taconic State Parkway NB Bridge New York United States 175 SS [93] 96 2011 Reconstruction and 3 New Bridges New York United States 158 2304 [93] 97 2011 Athabasca River Bridge Alberta Canada 472 m SS [93]
98 2012 Motorway flyover (Cladding). Kerensheide, Netherlands 1200 m 316 L [90] 99 2012 Pedestrian and cycling bridge. Sölvesborg, Sweden 150 756 m @
3.5 m Wide 2101 LDX [90]
100 2012 Road bridge renewal. Allt Chonoglais, Scotland United Kingdom 67 2304 [90]
101 2012 Sakonnet River Bridge Rhode Island United States 800 2205 [84] 102 2012 Road bridge refurbishment. Nou, Itoigawa, Niigata Prefecture Japan 60 70 m 410 [49] 103 2013 Pre-assembled pedestrian bridge. Malmö Sweden 12 40 m 316 L [49] 104 2014 Hurdman Bridge. Hwy 417, Ottawa Canada 323 2205 [84]
105 2014 Kenaston Overpass. Winnipeg, Manitoba Canada 200 2304 [84] 106 2014 Bridge Ottawa, Ontario, Canada 2205 [90] 107 2014 Breakwater repair. Bayonne Breakwater, France 130 318 LN [90] 108 2014 Mediterranean High way. Spanish Coast Spain SS* [94]
109 2014 New deck and barrier walls Hurdman Bridge, Highway 417, Ontario Canada 320 2205 [85] 110 2014 Coastal Protection at Cromer Coastal Protection at Cromer United Kingdom 335 2304 [85] 111 2014 Lafayette Bridge St. Paul, Minnesota United States 1950 SS [93] 112 2015 Mega project in Canada. Edmonton, Alberta Canada ~6000 47 Bridges 2304 [94]
113 2016 River delta crossing. Hong Kong, Macau - China China 460 m 2304 [90] 114 2016 Queensferry Crossing. Forth Replacement Crossing Scotland 40 m Wide Duplex* [94]
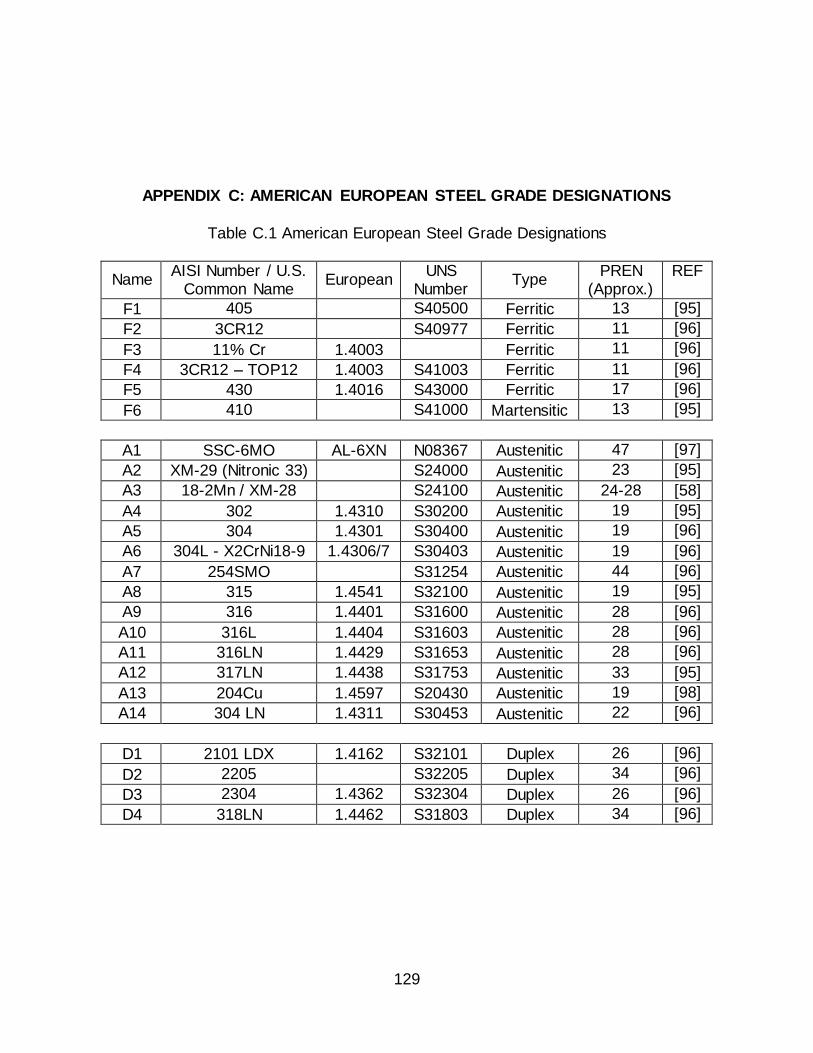
129
APPENDIX C: AMERICAN EUROPEAN STEEL GRADE DESIGNATIONS
Table C.1 American European Steel Grade Designations
Name AISI Number / U.S.
Common Name European
UNS Number
Type PREN
(Approx.) REF
F1 405 S40500 Ferritic 13 [95]
F2 3CR12 S40977 Ferritic 11 [96]
F3 11% Cr 1.4003 Ferritic 11 [96]
F4 3CR12 – TOP12 1.4003 S41003 Ferritic 11 [96]
F5 430 1.4016 S43000 Ferritic 17 [96]
F6 410 S41000 Martensitic 13 [95]
A1 SSC-6MO AL-6XN N08367 Austenitic 47 [97]
A2 XM-29 (Nitronic 33) S24000 Austenitic 23 [95]
A3 18-2Mn / XM-28 S24100 Austenitic 24-28 [58]
A4 302 1.4310 S30200 Austenitic 19 [95]
A5 304 1.4301 S30400 Austenitic 19 [96]
A6 304L - X2CrNi18-9 1.4306/7 S30403 Austenitic 19 [96]
A7 254SMO S31254 Austenitic 44 [96]
A8 315 1.4541 S32100 Austenitic 19 [95]
A9 316 1.4401 S31600 Austenitic 28 [96]
A10 316L 1.4404 S31603 Austenitic 28 [96]
A11 316LN 1.4429 S31653 Austenitic 28 [96]
A12 317LN 1.4438 S31753 Austenitic 33 [95]
A13 204Cu 1.4597 S20430 Austenitic 19 [98]
A14 304 LN 1.4311 S30453 Austenitic 22 [96]
D1 2101 LDX 1.4162 S32101 Duplex 26 [96]
D2 2205 S32205 Duplex 34 [96]
D3 2304 1.4362 S32304 Duplex 26 [96]
D4 318LN 1.4462 S31803 Duplex 34 [96]

ABOUT THE AUTHOR
Julio J. Saire Yanez is a Professional Civil Engineer in Peruvian territory,
Engineering Intern in the United States and entrepreneur. He received his B.S. degree in
civil engineering from the Andean University of Cusco and M.S. degree in civil
engineering with concentration in structures from the University of South Florida.
Mr. Saire’s research and publications have been in the areas of structural engineering,
durability of structures, repair, and rehabilitation of structures.
His work experience has been with government institutions, and the private sector.
His professional background includes seismic-resistant design of structures for high-risk
earthquake countries in South America. He also performed structural engineering
calculations for commercial and residential buildings in the United States. He executed
structural onsite inspections on projects for Mining companies in South America.
Additionally, his entrepreneurship also drove him to start his own design and construction
firm in Peru.
Julio Saire has received numerous research awards and leadership awards,
including the Peruvian President of Republic scholarship, the Annual Undergrad Thesis
Competition award by the Andean University of Cusco, and being the President of the
civil engineering student government at the Andean University of Cusco. He is student
member of the American Society of Civil Engineers and the American Concrete Institute.