morphostructural characterization of the black creole goat
TRANSCRIPT

animals
Article
Morphostructural Characterization of the BlackCreole Goat Raised in Central Mexico, a CurrentlyThreatened Zoogenetic Resource
Juan Carlos Silva-Jarquin 1 , Sergio Iván Román-Ponce 2, Marina Durán-Aguilar 3,Héctor Raymundo Vera-Ávila 3, Víctor Hugo Cambrón-Sandoval 4 andHéctor Mario Andrade-Montemayor 3,*
1 Doctorado en Ciencias Biológicas, Facultad de Ciencias Naturales, Universidad Autónoma de Querétaro.Avenida de las Ciencias S/N Juriquilla, Delegación Santa Rosa Jáuregui, Querétaro, C.P. 76230, México
2 Centro Nacional de Investigación Disciplinaria en Fisiología y Mejoramiento Animal. INIFAP—SADER. Km.1 Carretera a Colón, Ajuchitlán, Querétaro, C.P. 76280, México
3 Licenciatura en Medicina Veterinaria y Zootecnia, Facultad de Ciencias Naturales, Universidad Autónomade Querétaro. Avenida de las Ciencias S/N Juriquilla, Delegación Santa Rosa Jáuregui, Querétaro,C.P. 76230, México
4 Licenciatura en Horticultura Ambiental, Facultad de Ciencias Naturales, Universidad Autónoma deQuerétaro. Avenida de las Ciencias S/N Juriquilla, Delegación Santa Rosa Jáuregui, Querétaro,C.P. 76230, México
* Correspondence: [email protected]; Tel.: +52-44-2446-8347
Received: 24 June 2019; Accepted: 15 July 2019; Published: 19 July 2019�����������������
Simple Summary: The need to characterize and document local animal populations has graduallygained global importance. This is because these populations represent a genetic pool, and beforedeveloping strategies for their conservation, they need to be evaluated. The Black Creole goat, whichis distributed mainly in the central region of Mexico, represents one of the first Creole populations,derived from goat cattle introduced 500 years ago by Spanish colonizers. However, morphologicaland racial standards have not been established for this population, even though the quality of theirmilk and the social importance they represent in semi-desert areas are known. In the present study,the morphostructure of the Black Creole goat was evaluated using morphometric variables thatdescribe the body conformation of the animals. The results showed a homogeneous population andconfirmed the zootechnical purpose of the animals. These results represent the first morphologicalstudy carried out on the Black Creole goat and could be the basis for establishing its racial standard.
Abstract: In order to evaluate the morphostructural variability of the Black Creole goat (BCG),the present study was carried out in a population of 226 animals from eight localities and 14morphometric variables were taken. Descriptive statistics for the variables were obtained and 10 ofthese presented variation coefficients of less than 10%. The degree of harmony in the morphology ofthe population was determined by the number of positive correlations with significant differences(p < 0.05), including a correlation test using Spearman’s method. In order to reduce the matrix ofvariables, a principal components analysis was performed, and it was evaluated based on Kaiser’scriteria (eigenvalue > 1). Finally, a hierarchical analysis of conglomerates using Ward’s method wasperformed using the Euclidean distance to evaluate the distances among localities. Morphometricvariables were also included to visualize the relationship among the localities and their average pervariable. The results showed that the animals evaluated presented a certain degree of homogeneityand maintained a highly harmonic model. The BCG population showed a high aptitude for milkproduction, which confirmed the zootechnical purpose of the breed. The BCG populations evaluatedmaintain similar morphostructural profiles specific to them that can distinguish this population fromother animal breeds.
Animals 2019, 9, 459; doi:10.3390/ani9070459 www.mdpi.com/journal/animals
Animals 2019, 9, 459 2 of 12
Keywords: Creole goat; morphology; zoometry; characterization
1. Introduction
Currently, the different species of livestock raised have different production purposes to contributeto the family economy. For this reason, many of the most vulnerable people often maintain a diversityof species in their production systems [1]. With regard to the aforementioned benefits, the goat is noexception. Since its domestication, it has provided man with meat, milk, and skin, coupled with itsvalue for its adaptability and resilience [2]. With great easiness, goats adapt to extreme temperatures,undernourishment, high altitudes, long walking distances, and long periods of drought [3,4].
Mexico has more than 8.7 million goats [5], most of which are kept in semi-extensive systems withminimal resources and represent a multifunctional asset that has a great impact on the livelihood ofpeople living in marginalized communities [6,7].
In addition, the importance that these goats have in local populations lies in their role as reservoirsfor genetic diversity given the future challenges that humanity could face, for example, climate change,increasing world population, and increasing demand for food, among others [8]. A representativesample of these local populations as evidence of zoogenetic resources in Mexico is the Black Creole goat(BCG) that has endured for more than 500 years in the traditional production systems of the centralregion [9]. Currently, the importance of the BCG is based on the quality of its milk, which compared toother breeds (Alpine and Nubian), has higher solids contents and, therefore, a higher cheese yield,which translates into greater economic gains for the producer. In addition to this benefit, it is alsoimportant to emphasize the great capacity of adaptation and resistance that the BCG has developedin environments with scarce forage, such as the semi-desert of central Mexico [10]. However, in thesame way as other Creole populations in the rest of the world, their existence is threatened by theimportation of animals of specialized breeds.
A decade ago, it was reported that traditional production systems require multipurpose animalsthat, while appearing less productive, may contain valuable functional traits [11]. As a result,interest has emerged in characterizing and documenting the particularities of local animals, with theaim of establishing proper management practices and the conservation of diversity [7]. A typicaltool in the description of local populations is zoometry, a tool that allows knowing the productivecapacities of domestic ruminants or their inclination towards a certain productive aptitude, throughthe interpretation of functional indices for each individual [12,13]. Similarly, the analysis of theprincipal components of zoometric measurements provides useful information for racial diagnosis, thedetermination of somatic states, or to determine the sexual dimorphism of a race, among others [14].
The objective of this study is the morphostructural characterization of the BCG, providing anobjective description of the body shape and structure of this population.
2. Materials and Methods
This project was approved by the Bioethics Committee of the Natural Sciences Department ofthe Autonomous University of Queretaro under registry number 22FCN2016. The measurementswere made considering animal welfare and health, according to the Mexican Official NormNOM-051-ZOO-1995 and Mexican Federal Law DOF 25-07-2007.
2.1. Sampling
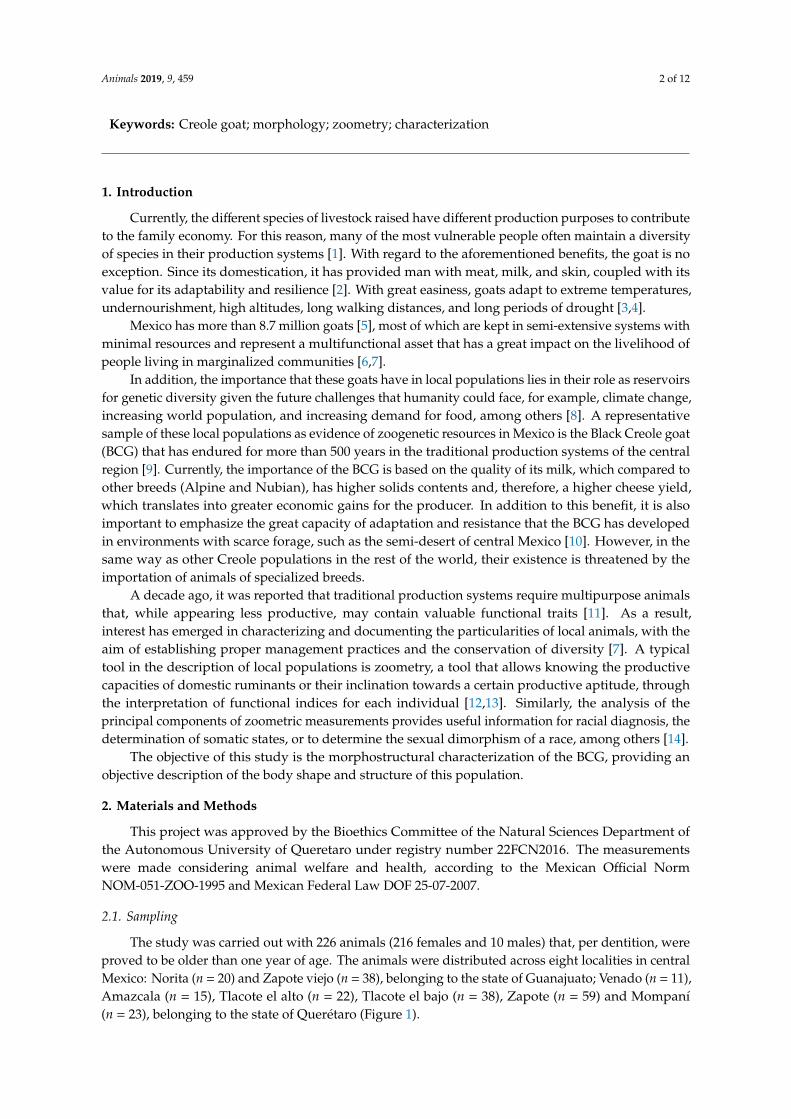
The study was carried out with 226 animals (216 females and 10 males) that, per dentition, wereproved to be older than one year of age. The animals were distributed across eight localities in centralMexico: Norita (n = 20) and Zapote viejo (n = 38), belonging to the state of Guanajuato; Venado (n = 11),Amazcala (n = 15), Tlacote el alto (n = 22), Tlacote el bajo (n = 38), Zapote (n = 59) and Mompaní(n = 23), belonging to the state of Querétaro (Figure 1).
Animals 2019, 9, 459 3 of 12
Animals 2019, 9, x 3 of 12
𝑛 = 𝑧𝑚 𝑝 1 − 𝑝 (1)
where: z is the value of z obtained from the cumulative probability values table for the standard normal distribution (1.64 for a 90% confidence level); m is the margin of error (0.05 = ±5%), and p is the estimated value of the proportion of the sample that will respond to the survey in the same sense, for this case, it was considered 0.3 [15]. The choice of herds included in the study was made by the non-probabilistic snowball method, where each herd owner was asked for a reference to others that met the target population, having these references suggest the following members of the sample, and so on until completing the total sample [16].
Figure 1. Localities where the herds included in the study were located.
2.2. Morphometric Variables
The variables analyzed were: head width (HW), which indicates the distance between the most lateral points of the zygomatic arches; head length (HL), the distance from the occipital protuberance to the upper lip; face length (FL), which indicates the measurement of the midpoint of the zygomatic arches to the upper lip; wither height (WH), which is the distance from the ground to the highest point of the cross region; chest girth (CG), which measures the contour of the thorax, passing through the subesternal hollow and the process of the 7th–8th dorsal vertebrae; body length (BL), from the region of the stop to the tip of the buttock; bicostal width (BW), which indicates the distance from one side to the other at the elbows; chest depth (CD), from the lowest point of the wither region to the sternum; shoulder width (SW), the measurement of the thickness of the chest at the front of the animal; rump length (RL), from the tip of the haunch to the tip of the buttock; rump width (RW), indicating the distance among the two external iliac tuberosities; haunch width (HW), measures the distance between the hip joints; rump height (RH), from the ground to the highest point of the rump; cannon bone perimeter (CBP), measures the circumference of the middle third of the metacarpal bone [14,17] (Figure 2). Measurements were taken using a caliper (Haglöf Mantax Blue®) as a zoometric cane and a flexible tape measure following the Food and Agriculture Organization of the United Nations (FAO) methodology [18].
Figure 1. Localities where the herds included in the study were located.
The sample size (n) was determined using the following equation:
n =( z
m
)2p(1− p) (1)
where: z is the value of z obtained from the cumulative probability values table for the standardnormal distribution (1.64 for a 90% confidence level); m is the margin of error (0.05 = ±5%), and p isthe estimated value of the proportion of the sample that will respond to the survey in the same sense,for this case, it was considered 0.3 [15]. The choice of herds included in the study was made by thenon-probabilistic snowball method, where each herd owner was asked for a reference to others thatmet the target population, having these references suggest the following members of the sample, andso on until completing the total sample [16].
2.2. Morphometric Variables
The variables analyzed were: head width (HW), which indicates the distance between the mostlateral points of the zygomatic arches; head length (HL), the distance from the occipital protuberanceto the upper lip; face length (FL), which indicates the measurement of the midpoint of the zygomaticarches to the upper lip; wither height (WH), which is the distance from the ground to the highestpoint of the cross region; chest girth (CG), which measures the contour of the thorax, passing throughthe subesternal hollow and the process of the 7th–8th dorsal vertebrae; body length (BL), from theregion of the stop to the tip of the buttock; bicostal width (BW), which indicates the distance from oneside to the other at the elbows; chest depth (CD), from the lowest point of the wither region to thesternum; shoulder width (SW), the measurement of the thickness of the chest at the front of the animal;rump length (RL), from the tip of the haunch to the tip of the buttock; rump width (RW), indicatingthe distance among the two external iliac tuberosities; haunch width (HW), measures the distancebetween the hip joints; rump height (RH), from the ground to the highest point of the rump; cannonbone perimeter (CBP), measures the circumference of the middle third of the metacarpal bone [14,17](Figure 2). Measurements were taken using a caliper (Haglöf Mantax Blue®) as a zoometric cane and a

Animals 2019, 9, 459 4 of 12
flexible tape measure following the Food and Agriculture Organization of the United Nations (FAO)methodology [18].Animals 2019, 9, x 4 of 12
Figure 2. Morphometric variables analyzed: head width (HW), head length (HL), face length (FL), wither height (WH), chest girth (CG), body length (BL), bicostal width (BW), chest depth (CD), shoulder width (SW), rump length (RL), rump width (RW), haunch width (HW), rump height (RH), and cannon bone perimeter (CBP).
Four indices of ethnological interest were also included: corporal index (COI = BL × 100/CG); thoracic index (THI = BW × 100/CD); cephalic index (CEI = HW × 100/HL); pelvic index (PEI = RW × 100/RL). Five indices of productive interest were also calculated: proportionality index (PRI = WH × 100/BL); metacarpal–thoracic index (MTI = CBP × 100/CG); relative depth of thorax index (RDI = CD × 100/WH); transversal pelvic index (TPI = RW × 100/WH); longitudinal pelvic index (LPI = RL × 100/WH) [14,17].
2.3. Statistical Analysis
The descriptive statistics (mean, standard deviation, coefficient of variation, maximums and minimums) were calculated for the morphometric variables and the nine zoometric indices included in the study.
The morphological harmony of the BCG was determined by the number of positive correlations with significant differences (p < 0.05), including a correlation test by the Spearman method because the data did not follow a normal distribution (Kolmogorov–Smirnov p < 0.05 normal test). A highly harmonic model is where the number of correlations exceeds 50%, a medium harmonic model is when they are close to 50%, and a low harmonic model is when 25% of the correlations are significant and positive [19].
A principal components analysis (PCA) was performed to reduce the matrix of morphometric variables to a small number of non-correlated variables called components. The main components obtained were evaluated based on Kaiser’s criterion (eigenvalue > 1) [20].
Finally, a hierarchical analysis of conglomerates using Ward’s method was carried out using the Euclidean distance to construct a dendrogram and to evaluate the distances among localities. Morphometric variables were also included in this analysis and a heatmap was generated to visualize the relationship among the localities and their average per variable. All statistical analyses were performed using the statistical programming language R [21].
3. Results
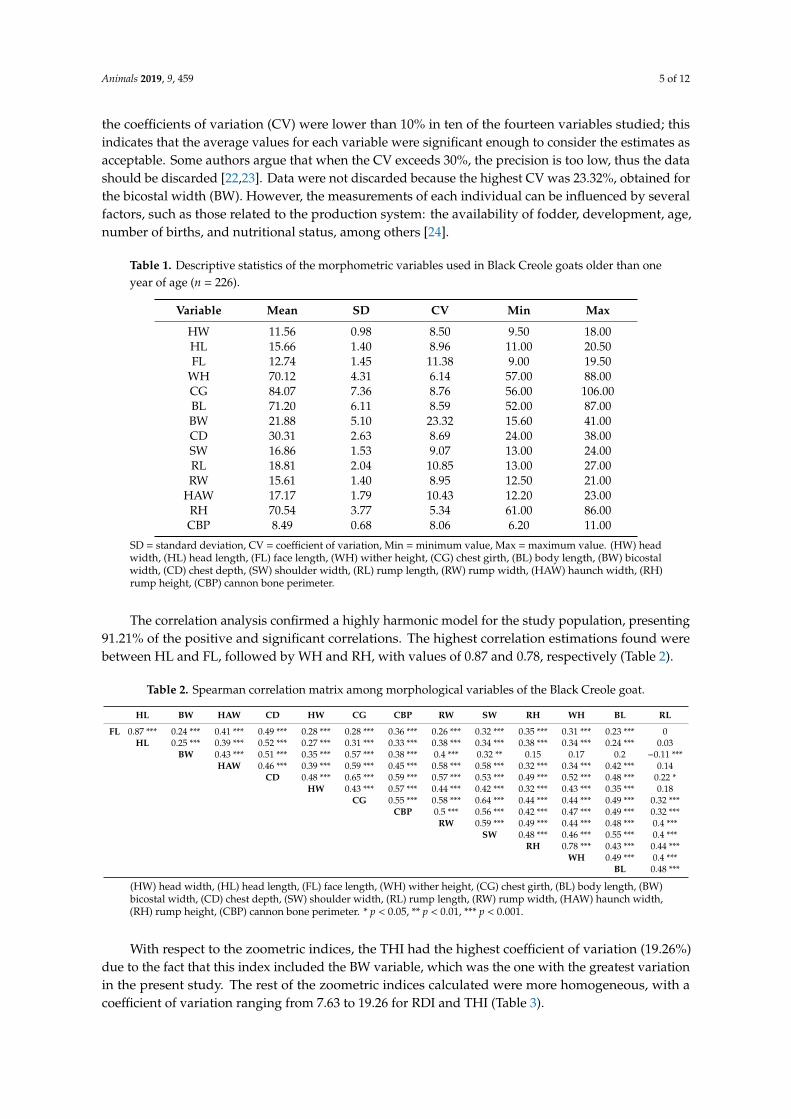
The descriptive statistics for the fourteen morphometric variables are shown in Table 1. The obtained results show that the evaluated animals are homogeneous in most of the variables when the coefficients of variation (CV) were lower than 10% in ten of the fourteen variables studied; this indicates that the average values for each variable were significant enough to consider the estimates as acceptable. Some authors argue that when the CV exceeds 30%, the precision is too low, thus the
Figure 2. Morphometric variables analyzed: head width (HW), head length (HL), face length (FL),wither height (WH), chest girth (CG), body length (BL), bicostal width (BW), chest depth (CD), shoulderwidth (SW), rump length (RL), rump width (RW), haunch width (HW), rump height (RH), and cannonbone perimeter (CBP).
Four indices of ethnological interest were also included: corporal index (COI= BL× 100/CG); thoracicindex (THI = BW × 100/CD); cephalic index (CEI = HW × 100/HL); pelvic index (PEI = RW × 100/RL).Five indices of productive interest were also calculated: proportionality index (PRI =WH × 100/BL);metacarpal–thoracic index (MTI = CBP × 100/CG); relative depth of thorax index (RDI = CD × 100/WH);transversal pelvic index (TPI = RW × 100/WH); longitudinal pelvic index (LPI = RL × 100/WH) [14,17].
2.3. Statistical Analysis
The descriptive statistics (mean, standard deviation, coefficient of variation, maximums and minimums)were calculated for the morphometric variables and the nine zoometric indices included in the study.
The morphological harmony of the BCG was determined by the number of positive correlationswith significant differences (p < 0.05), including a correlation test by the Spearman method becausethe data did not follow a normal distribution (Kolmogorov–Smirnov p < 0.05 normal test). A highlyharmonic model is where the number of correlations exceeds 50%, a medium harmonic model is whenthey are close to 50%, and a low harmonic model is when 25% of the correlations are significant andpositive [19].
A principal components analysis (PCA) was performed to reduce the matrix of morphometricvariables to a small number of non-correlated variables called components. The main componentsobtained were evaluated based on Kaiser’s criterion (eigenvalue > 1) [20].
Finally, a hierarchical analysis of conglomerates using Ward’s method was carried out usingthe Euclidean distance to construct a dendrogram and to evaluate the distances among localities.Morphometric variables were also included in this analysis and a heatmap was generated to visualizethe relationship among the localities and their average per variable. All statistical analyses wereperformed using the statistical programming language R [21].
3. Results
The descriptive statistics for the fourteen morphometric variables are shown in Table 1. Theobtained results show that the evaluated animals are homogeneous in most of the variables when
Animals 2019, 9, 459 5 of 12
the coefficients of variation (CV) were lower than 10% in ten of the fourteen variables studied; thisindicates that the average values for each variable were significant enough to consider the estimates asacceptable. Some authors argue that when the CV exceeds 30%, the precision is too low, thus the datashould be discarded [22,23]. Data were not discarded because the highest CV was 23.32%, obtained forthe bicostal width (BW). However, the measurements of each individual can be influenced by severalfactors, such as those related to the production system: the availability of fodder, development, age,number of births, and nutritional status, among others [24].
Table 1. Descriptive statistics of the morphometric variables used in Black Creole goats older than oneyear of age (n = 226).
Variable Mean SD CV Min Max
HW 11.56 0.98 8.50 9.50 18.00HL 15.66 1.40 8.96 11.00 20.50FL 12.74 1.45 11.38 9.00 19.50
WH 70.12 4.31 6.14 57.00 88.00CG 84.07 7.36 8.76 56.00 106.00BL 71.20 6.11 8.59 52.00 87.00BW 21.88 5.10 23.32 15.60 41.00CD 30.31 2.63 8.69 24.00 38.00SW 16.86 1.53 9.07 13.00 24.00RL 18.81 2.04 10.85 13.00 27.00RW 15.61 1.40 8.95 12.50 21.00
HAW 17.17 1.79 10.43 12.20 23.00RH 70.54 3.77 5.34 61.00 86.00CBP 8.49 0.68 8.06 6.20 11.00
SD = standard deviation, CV = coefficient of variation, Min = minimum value, Max = maximum value. (HW) headwidth, (HL) head length, (FL) face length, (WH) wither height, (CG) chest girth, (BL) body length, (BW) bicostalwidth, (CD) chest depth, (SW) shoulder width, (RL) rump length, (RW) rump width, (HAW) haunch width, (RH)rump height, (CBP) cannon bone perimeter.
The correlation analysis confirmed a highly harmonic model for the study population, presenting91.21% of the positive and significant correlations. The highest correlation estimations found werebetween HL and FL, followed by WH and RH, with values of 0.87 and 0.78, respectively (Table 2).
Table 2. Spearman correlation matrix among morphological variables of the Black Creole goat.
HL BW HAW CD HW CG CBP RW SW RH WH BL RL
FL 0.87 *** 0.24 *** 0.41 *** 0.49 *** 0.28 *** 0.28 *** 0.36 *** 0.26 *** 0.32 *** 0.35 *** 0.31 *** 0.23 *** 0HL 0.25 *** 0.39 *** 0.52 *** 0.27 *** 0.31 *** 0.33 *** 0.38 *** 0.34 *** 0.38 *** 0.34 *** 0.24 *** 0.03
BW 0.43 *** 0.51 *** 0.35 *** 0.57 *** 0.38 *** 0.4 *** 0.32 ** 0.15 0.17 0.2 −0.11 ***HAW 0.46 *** 0.39 *** 0.59 *** 0.45 *** 0.58 *** 0.58 *** 0.32 *** 0.34 *** 0.42 *** 0.14
CD 0.48 *** 0.65 *** 0.59 *** 0.57 *** 0.53 *** 0.49 *** 0.52 *** 0.48 *** 0.22 *HW 0.43 *** 0.57 *** 0.44 *** 0.42 *** 0.32 *** 0.43 *** 0.35 *** 0.18
CG 0.55 *** 0.58 *** 0.64 *** 0.44 *** 0.44 *** 0.49 *** 0.32 ***CBP 0.5 *** 0.56 *** 0.42 *** 0.47 *** 0.49 *** 0.32 ***
RW 0.59 *** 0.49 *** 0.44 *** 0.48 *** 0.4 ***SW 0.48 *** 0.46 *** 0.55 *** 0.4 ***
RH 0.78 *** 0.43 *** 0.44 ***WH 0.49 *** 0.4 ***
BL 0.48 ***
(HW) head width, (HL) head length, (FL) face length, (WH) wither height, (CG) chest girth, (BL) body length, (BW)bicostal width, (CD) chest depth, (SW) shoulder width, (RL) rump length, (RW) rump width, (HAW) haunch width,(RH) rump height, (CBP) cannon bone perimeter. * p < 0.05, ** p < 0.01, *** p < 0.001.
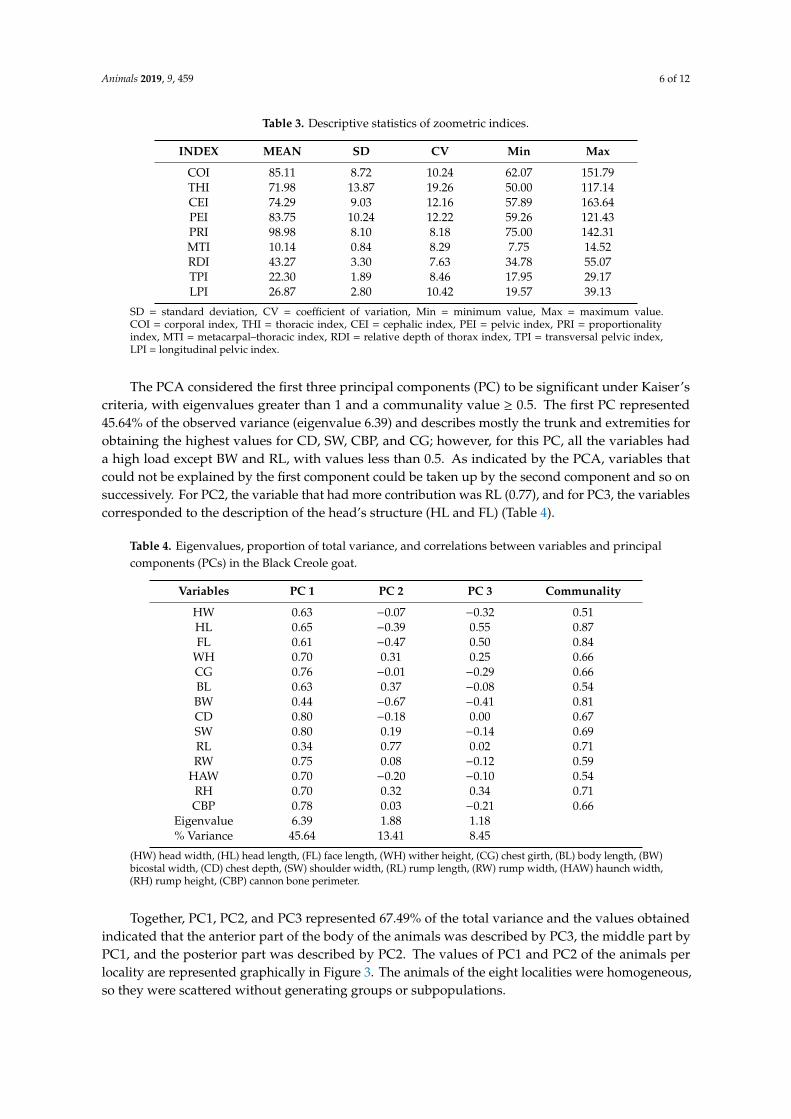
With respect to the zoometric indices, the THI had the highest coefficient of variation (19.26%)due to the fact that this index included the BW variable, which was the one with the greatest variationin the present study. The rest of the zoometric indices calculated were more homogeneous, with acoefficient of variation ranging from 7.63 to 19.26 for RDI and THI (Table 3).
Animals 2019, 9, 459 6 of 12
Table 3. Descriptive statistics of zoometric indices.
INDEX MEAN SD CV Min Max
COI 85.11 8.72 10.24 62.07 151.79THI 71.98 13.87 19.26 50.00 117.14CEI 74.29 9.03 12.16 57.89 163.64PEI 83.75 10.24 12.22 59.26 121.43PRI 98.98 8.10 8.18 75.00 142.31MTI 10.14 0.84 8.29 7.75 14.52RDI 43.27 3.30 7.63 34.78 55.07TPI 22.30 1.89 8.46 17.95 29.17LPI 26.87 2.80 10.42 19.57 39.13
SD = standard deviation, CV = coefficient of variation, Min = minimum value, Max = maximum value.COI = corporal index, THI = thoracic index, CEI = cephalic index, PEI = pelvic index, PRI = proportionalityindex, MTI = metacarpal–thoracic index, RDI = relative depth of thorax index, TPI = transversal pelvic index,LPI = longitudinal pelvic index.
The PCA considered the first three principal components (PC) to be significant under Kaiser’scriteria, with eigenvalues greater than 1 and a communality value ≥ 0.5. The first PC represented45.64% of the observed variance (eigenvalue 6.39) and describes mostly the trunk and extremities forobtaining the highest values for CD, SW, CBP, and CG; however, for this PC, all the variables hada high load except BW and RL, with values less than 0.5. As indicated by the PCA, variables thatcould not be explained by the first component could be taken up by the second component and so onsuccessively. For PC2, the variable that had more contribution was RL (0.77), and for PC3, the variablescorresponded to the description of the head’s structure (HL and FL) (Table 4).
Table 4. Eigenvalues, proportion of total variance, and correlations between variables and principalcomponents (PCs) in the Black Creole goat.
Variables PC 1 PC 2 PC 3 Communality
HW 0.63 −0.07 −0.32 0.51HL 0.65 −0.39 0.55 0.87FL 0.61 −0.47 0.50 0.84
WH 0.70 0.31 0.25 0.66CG 0.76 −0.01 −0.29 0.66BL 0.63 0.37 −0.08 0.54BW 0.44 −0.67 −0.41 0.81CD 0.80 −0.18 0.00 0.67SW 0.80 0.19 −0.14 0.69RL 0.34 0.77 0.02 0.71RW 0.75 0.08 −0.12 0.59
HAW 0.70 −0.20 −0.10 0.54RH 0.70 0.32 0.34 0.71CBP 0.78 0.03 −0.21 0.66
Eigenvalue 6.39 1.88 1.18% Variance 45.64 13.41 8.45
(HW) head width, (HL) head length, (FL) face length, (WH) wither height, (CG) chest girth, (BL) body length, (BW)bicostal width, (CD) chest depth, (SW) shoulder width, (RL) rump length, (RW) rump width, (HAW) haunch width,(RH) rump height, (CBP) cannon bone perimeter.
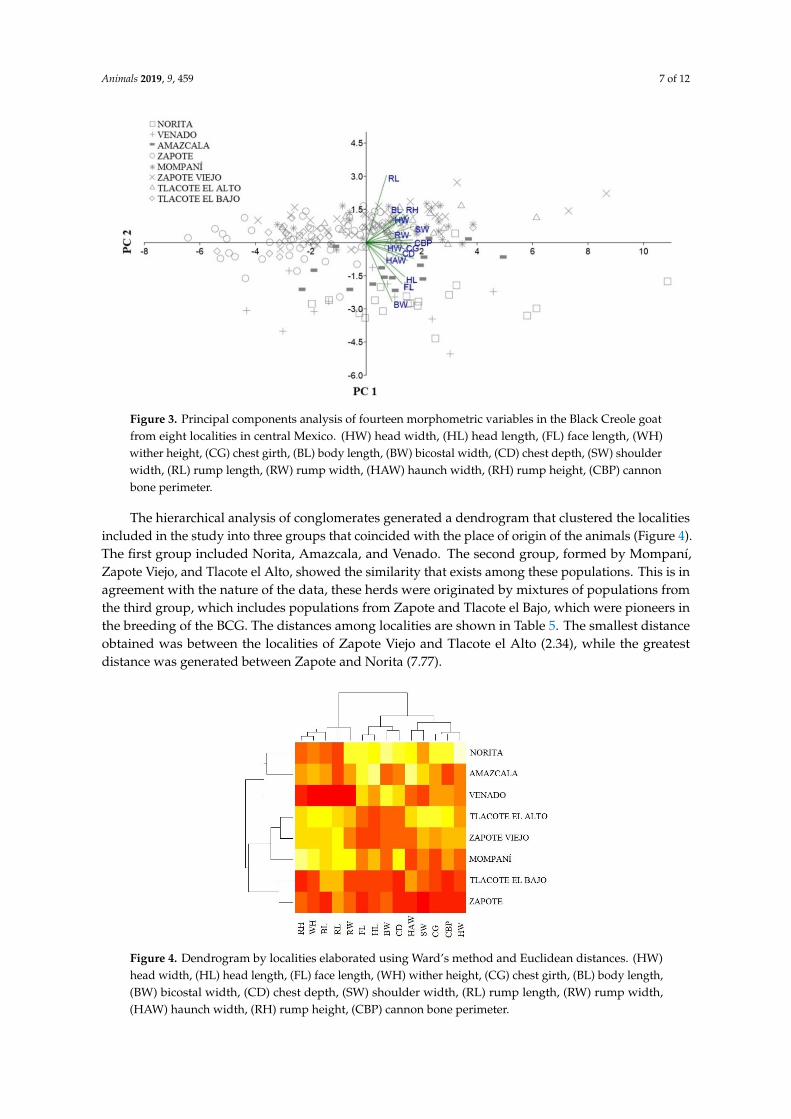
Together, PC1, PC2, and PC3 represented 67.49% of the total variance and the values obtainedindicated that the anterior part of the body of the animals was described by PC3, the middle part byPC1, and the posterior part was described by PC2. The values of PC1 and PC2 of the animals perlocality are represented graphically in Figure 3. The animals of the eight localities were homogeneous,so they were scattered without generating groups or subpopulations.
Animals 2019, 9, 459 7 of 12
Animals 2019, 9, x 7 of 12
Together, PC1, PC2, and PC3 represented 67.49% of the total variance and the values obtained indicated that the anterior part of the body of the animals was described by PC3, the middle part by PC1, and the posterior part was described by PC2. The values of PC1 and PC2 of the animals per locality are represented graphically in Figure 3. The animals of the eight localities were homogeneous, so they were scattered without generating groups or subpopulations.
. Figure 3. Principal components analysis of fourteen morphometric variables in the Black Creole goat from eight localities in central Mexico. (HW) head width, (HL) head length, (FL) face length, (WH) wither height, (CG) chest girth, (BL) body length, (BW) bicostal width, (CD) chest depth, (SW) shoulder width, (RL) rump length, (RW) rump width, (HAW) haunch width, (RH) rump height, (CBP) cannon bone perimeter.
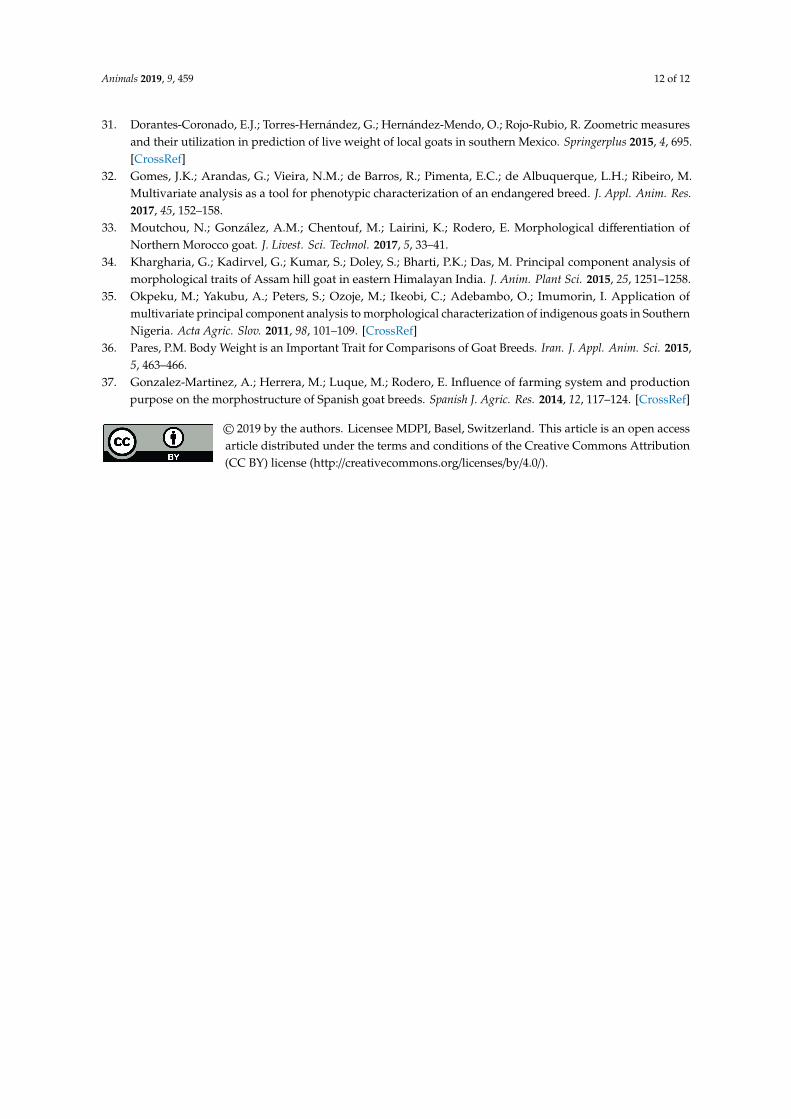
The hierarchical analysis of conglomerates generated a dendrogram that clustered the localities included in the study into three groups that coincided with the place of origin of the animals (Figure 4). The first group included Norita, Amazcala, and Venado. The second group, formed by Mompaní, Zapote Viejo, and Tlacote el Alto, showed the similarity that exists among these populations. This is in agreement with the nature of the data, these herds were originated by mixtures of populations from the third group, which includes populations from Zapote and Tlacote el Bajo, which were pioneers in the breeding of the BCG. The distances among localities are shown in Table 5. The smallest distance obtained was between the localities of Zapote Viejo and Tlacote el Alto (2.34), while the greatest distance was generated between Zapote and Norita (7.77).
Table 5. Matrix of Euclidean distances among studied localities.
Norita Venado Amazcala Zapote Mompaní Z. Viejo T. Alto Venado 5.11 -
Amazcala 4.81 5.23 -
Zapote 7.77 4.91 6.07 -
Mompaní 6.04 6.60 4.71 5.70 -
Z. Viejo 5.88 5.81 4.77 4.79 3.25 -
T. Alto 5.55 6.64 4.50 6.43 4.03 2.34 - T. Bajo 7.03 4.92 4.82 2.60 5.17 3.68 4.97
Figure 3. Principal components analysis of fourteen morphometric variables in the Black Creole goatfrom eight localities in central Mexico. (HW) head width, (HL) head length, (FL) face length, (WH)wither height, (CG) chest girth, (BL) body length, (BW) bicostal width, (CD) chest depth, (SW) shoulderwidth, (RL) rump length, (RW) rump width, (HAW) haunch width, (RH) rump height, (CBP) cannonbone perimeter.
The hierarchical analysis of conglomerates generated a dendrogram that clustered the localitiesincluded in the study into three groups that coincided with the place of origin of the animals (Figure 4).The first group included Norita, Amazcala, and Venado. The second group, formed by Mompaní,Zapote Viejo, and Tlacote el Alto, showed the similarity that exists among these populations. This is inagreement with the nature of the data, these herds were originated by mixtures of populations fromthe third group, which includes populations from Zapote and Tlacote el Bajo, which were pioneers inthe breeding of the BCG. The distances among localities are shown in Table 5. The smallest distanceobtained was between the localities of Zapote Viejo and Tlacote el Alto (2.34), while the greatestdistance was generated between Zapote and Norita (7.77).
Animals 2019, 9, x 8 of 12
Figure 4. Dendrogram by localities elaborated using Ward’s method and Euclidean distances. (HW) head width, (HL) head length, (FL) face length, (WH) wither height, (CG) chest girth, (BL) body length, (BW) bicostal width, (CD) chest depth, (SW) shoulder width, (RL) rump length, (RW) rump width, (HAW) haunch width, (RH) rump height, (CBP) cannon bone perimeter.
4. Discussion
The results obtained show that the use of morphometric variables represents a first approximation in the characterization of populations and sets precedent for the management of animal genetic resources, even though some authors have considered that they are more sensitive to environmental and human factors [25].
Of the fourteen variables included in the study, ten (HW, HL, WH, CG, BL, CD, SW, RL, RW, CBP) had been considered in the morphostructural evaluation of Spanish goat breeds. The BCG obtained values similar to those reported for the Granadina and Malagueña breeds, with the exception of the HL, RL, and SW variables, where these breeds presented higher values. This gives us an indication of the origin of the BCG and its morphological similarity with the Granadina breed, maintaining morphological characteristics of Spanish dairy goats [26]. With respect to local goats from Mexico, this type of study has been carried out mostly with goats from the Mixteca region. In the present study, the populations of BCGs obtained values similar to those reported for the Creole goats of the state of Puebla, Mexico, with respect to the variables HW, HL, WH, RH, and CD; however, it is noted that the BCG presents a larger size for CG, RW, and RL, which shows that this is an animal with greater thoracic capacity and greater development of the rump [27].
The number of significant positive correlations among body measurements (91.21%) showed a high degree of morphological harmony in the BCG. This model is based on the fact that the increase or decrease in one of the variables will mean an increase or decrease for another; however, the relation among variables must be kept in proportion to the first one in order for the fundamental structure to be maintained too [19].
Taking into account these results and the CV obtained, it can be stated that the BCG is an animal adapted to the conditions of the environment where it develops, in this way it maintains its homogeneous morphostructure.
With respect to the zoometric indices, the COI shows the proportionality of the breed and allows to classify the animals according to baronian systematics in brevilinear (≤85), mesolinear (>86 and <88) or longilinear (≥90). The value obtained in the present study (85.11) indicates that the BCG has a brevilinear profile, with transversal measures predominating over length measures. The THI shows the variations in the shape of the thorax, which is greater or circular in meat cattle (≥89), and smaller or elliptical in dairy cattle (≤85). The THI obtained for the BCG suggests that it is a dairy type animal
Figure 4. Dendrogram by localities elaborated using Ward’s method and Euclidean distances. (HW)head width, (HL) head length, (FL) face length, (WH) wither height, (CG) chest girth, (BL) body length,(BW) bicostal width, (CD) chest depth, (SW) shoulder width, (RL) rump length, (RW) rump width,(HAW) haunch width, (RH) rump height, (CBP) cannon bone perimeter.

Animals 2019, 9, 459 8 of 12
Table 5. Matrix of Euclidean distances among studied localities.
Norita Venado Amazcala Zapote Mompaní Z. Viejo T. Alto
Venado 5.11 -Amazcala 4.81 5.23 -
Zapote 7.77 4.91 6.07 -Mompaní 6.04 6.60 4.71 5.70 -Z. Viejo 5.88 5.81 4.77 4.79 3.25 -T. Alto 5.55 6.64 4.50 6.43 4.03 2.34 -T. Bajo 7.03 4.92 4.82 2.60 5.17 3.68 4.97
4. Discussion
The results obtained show that the use of morphometric variables represents a first approximationin the characterization of populations and sets precedent for the management of animal geneticresources, even though some authors have considered that they are more sensitive to environmentaland human factors [25].
Of the fourteen variables included in the study, ten (HW, HL, WH, CG, BL, CD, SW, RL, RW, CBP)had been considered in the morphostructural evaluation of Spanish goat breeds. The BCG obtainedvalues similar to those reported for the Granadina and Malagueña breeds, with the exception of theHL, RL, and SW variables, where these breeds presented higher values. This gives us an indicationof the origin of the BCG and its morphological similarity with the Granadina breed, maintainingmorphological characteristics of Spanish dairy goats [26]. With respect to local goats from Mexico, thistype of study has been carried out mostly with goats from the Mixteca region. In the present study,the populations of BCGs obtained values similar to those reported for the Creole goats of the state ofPuebla, Mexico, with respect to the variables HW, HL, WH, RH, and CD; however, it is noted thatthe BCG presents a larger size for CG, RW, and RL, which shows that this is an animal with greaterthoracic capacity and greater development of the rump [27].
The number of significant positive correlations among body measurements (91.21%) showed ahigh degree of morphological harmony in the BCG. This model is based on the fact that the increase ordecrease in one of the variables will mean an increase or decrease for another; however, the relationamong variables must be kept in proportion to the first one in order for the fundamental structure tobe maintained too [19].
Taking into account these results and the CV obtained, it can be stated that the BCG is ananimal adapted to the conditions of the environment where it develops, in this way it maintains itshomogeneous morphostructure.
With respect to the zoometric indices, the COI shows the proportionality of the breed and allowsto classify the animals according to baronian systematics in brevilinear (≤85), mesolinear (>86 and<88) or longilinear (≥90). The value obtained in the present study (85.11) indicates that the BCG has abrevilinear profile, with transversal measures predominating over length measures. The THI showsthe variations in the shape of the thorax, which is greater or circular in meat cattle (≥89), and smaller orelliptical in dairy cattle (≤85). The THI obtained for the BCG suggests that it is a dairy type animal [14].Similar values were obtained for the breeds Blanca of Rasquera and Colorada Pampeana, which showa short and wide animal with an elliptical thorax [28].
Because of the somation of cephalic variables (HW and HL) included for the CEI which arenot influenced by environmental or management factors, this index is important for the racialcharacterization of the animals. The CEI measures the proportionality of the head and classifies it asbrachycephalic (CEI > 100), mesocephalic (CEI = 100), and dolichocephalic (CEI < 100), resulting indolichocephalous for the BCG (74.29), which is similar to that reported for the Majorera and Tinerifeñabreeds, as well as the semi-wild goat [29].

Animals 2019, 9, 459 9 of 12
The PEI indicates that the ratio of pelvic width to pelvic length is related to reproductive fitness.The result shows convexilinear animals (PEI < 100), where the rump length predominates over thewidth [14].
Proportionality index (PRI) has a special focus on the shape of animals, indicating that at a lowervalue, the shape of the animal resembles a rectangle—the predominant shape in meat-suitable animals.The PRI in the BCG showed low meat suitability, represented in square form, characteristic of dairycattle, higher than the Creole goat of the central valleys of Oaxaca, Mexico [30].
Metacarpal–thoracic index (MTI) establishes the relationship between the mass of the animaland the members that support it, classifying animals as hypermeter (>11), eumeter (>10 and <11)or ellipometric (<10), with higher value in meat breeds. The value obtained in this study (10.14)indicates that the population has a eumometric tendency, similar to the Colorada Pampeana goat ofArgentina [28].
The RDI shows the relationship between chest depth and leg length, with values greater than 50in short-legged animals with a tendency to a meat phenotype. The BCG has low meat suitability and ismostly oriented towards milk production.
As regards to the TPI and LPI, these are an estimate for the meat suitability of the breed. A TPIgreater than 33 and an LPI less than 37 are indicators of meat breeds. The BCG population showed lowvalues for the TPI (22.30) and LPI (26.87), which means that it has a medium tendency that gives it theopportunity to develop muscle tissue as well. These last three indices are similar to those reported forthe Creole goat of the central valleys of Oaxaca, Mexico [30].
With respect to the PCA, three components were significant and explain 67.50% of the totalvariance. A similar percentage (67.80%) of explanation of the total variance was also obtained in localgoats from the south of the state of Mexico, taking into account the first three components and tenvariables [31]. The same percentage (67.82%) was obtained for the Brazilian breed Canindé, usingfour components and eleven morphometric variables, and like the BCG, only three components hadeigenvalues greater than one [32]. Goats from northern Morocco with 16 variables also obtained similarvalues for the percentage of variance, with three components explaining 66.96% of the variance [33]. InIndian goats, using 11 morphometric variables, four components were significant, which explained85.84% of the total variance [34]. In another work with local goats, using only four morphometricvariables, it was found that the first two components explained a large percentage of the total variance(94.15% in females and 97.65% in males); however, only the first component was significant [35].Although the number of variables was not so small, the first components can explain more than 90% ofthe total variance [36].
Head length (HL) and face length (FL) were the variables of greater contribution for the threecomponents, because their variance is better explained by the components (87% and 84%, respectively).The contribution of cephalic variables has been described in other studies, demonstrating that thesecharacteristics are important to describe the race and define the cephalic profile of the animals [32].
The influence of each variable can change from one population to another and it is difficult tocompare among populations. This is the case for the CBP, which for the Canindé breed is the variablethat has the least contribution in the model (18.5%) [32], compared with the BCG (66%) and local goatsin India (87%) [34]. As reported by other authors, the variation shown is the result of the absence ofselection or it is also produced because different parts of the body are more affected by the environmentthan by other factors. However, head length is important in several studies due to its close relationshipwith the cranial bone, which is not strongly influenced by other factors [12].
Hierarchical cluster analysis demonstrates the relationships between morphometric variablesand the localities included in the study. The RH, WH, BL, RL, and RW variables that help to describethe height and length of the animals had the greatest effect in grouping the localities of Tlacote elAlto, Zapote viejo, and Mompaní in a single cluster. The relationship among these variables (RH,WH, and BL) has also been observed for Canindé goats [32]. The cluster formed by the localitiesof Norita, Amazcala, and Venado was influenced by having higher values for the variables FL, HL,

Animals 2019, 9, 459 10 of 12
BW, and CD, which are shown in lighter colors in the heatmap (Figure 4). A third group (Tlacoteel bajo and Zapote) comprises the lowest measurements for most of the variables, mainly for CG,CBP, and HW (more intense colors in the heatmap). Other works show the effects of the variablesfor classification by locality; however, it is emphasized that the genetic relationship cannot be easilyderived from phenotypic similarity because genotypes can be mostly related to productive traits [25].Since it has been proven that environmental factors in different production systems have an effect onthe morphostructure of animals, it would be useful to include these elements in further characterizationstudies [37].
5. Conclusions
The evaluated herds of Black Creole goat represent a morphologically homogeneous population,preserving a high harmonic model. This indicates that it is a population adapted to the conditionsof the environment and the production system, taking into account that these factors, environmentand management, mainly influence the morphostructural development of the animals. Based on themorphostructure, the Black Creole goat is dolichocephalic, with an elliptical thorax characteristic ofdairy animals. The indices of productive interest also indicate in their majority an animal orientedto milk production; however, the potential of these animals is still unknown, a reason for why theproduction of meat cannot totally be discarded.
Finally, the present study could be the basis for future decisions on Black Creole goat’smanagement, improvement, and conservation, considering that a genetic analysis would complementthe characterization of the breed.
Author Contributions: Conceptualization, J.C.S.-J. and H.M.A.-M.; formal analysis, J.C.S.-J., H.M.A.-M., S.I.R.-P.and M.D.-A.; funding acquisition, J.C.S.-J., H.M.A.-M. and V.H.C.-S.; investigation, J.C.S.-J. and H.M.A.-M.;methodology, J.C.S.-J., H.M.A.-M. and S.I.R.-P.; project administration, H.M.A.-M.; resources, J.C.S.-J., H.M.A.-M.and V.H.C.-S.; supervision, H.M.A.-M., S.I.R.-P., M.D.-A. and H.R.V.-A.; Visualization, J.C.S.-J. and H.M.A.-M.;Writing—original draft, J.C.S.-J., H.M.A.-M., S.I.R.-P., M.D.-A., H.R.V.-A. and V.H.C.-S.; Writing—review andediting, J.C.S.-J., H.M.A.-M., S.I.R.-P., M.D.-A., H.R.V.-A. and V.H.C.-S.
Funding: This research received no external funding.
Acknowledgments: We sincerely thank the owners of the herds included in the study. We express our sinceregratitude to the Secretariat of Agricultural Development of the State of Querétaro, Mexico (SEDEA) for theirsupport and collaboration. We thank the National Council of Science and Technology (CONACYT) and theAutonomous University of Querétaro (UAQ) for the academic support received.
Conflicts of Interest: The authors declare no conflict of interest.
References
1. Rege, J.E.O.; Marshall, K.; Notenbaert, A.; Ojango, J.M.K.; Okeyo, A.M. Pro-poor animal improvement andbreeding - What can science do? Livest. Sci. 2011, 136, 15–28. [CrossRef]
2. Taberlet, P.; Coissac, E.; Pansu, J.; Pompanon, F. Conservation genetics of cattle, sheep, and goats. Comptes.Rendus. Biol. 2011, 334, 247–254. [CrossRef] [PubMed]
3. Boyazoglu, J.; Hatziminaoglou, I.; Morand-Fehr, P. The role of the goat in society: Past, present andperspectives for the future. Small Rumin. Res. 2005, 60, 13–23. [CrossRef]
4. Pereira, F.; Queirós, S.; Gusmão, L.; Nijman, I.J.; Cuppen, E.; Lenstra, J.A.; Consortium, E.; Davis, S.J.M.;Nejmeddine, F.; Amorim, A. Tracing the history of goat pastoralism: New clues from mitochondrial and ychromosome DNA in North Africa. Mol. Biol. Evol. 2009, 26, 2765–2773. [CrossRef] [PubMed]
5. FAO Statistics Database. Available online: http://www.fao.org/faostat/es/#data/QA (accessed on8 March 2019).
6. Boza, J. Papel del ganado caprino en las zonas desfavorecidas. Available online: http://www.ovinos-caprinos.com/MANEJO/47%20-%20Ganado%20Caprino%20en%20zonas%20desfavorecidas.pdf (accessedon 22 March 2019).
7. FAO La situación de los recursos zoogenéticos mundiales para la alimentación y la agricultura. Availableonline: http://www.fao.org/3/a1250s/a1250s00.htm (accessed on 19 March 2019).

Animals 2019, 9, 459 11 of 12
8. FAO Coping with climate change - the roles of genetic resources for food and agriculture. Available online:http://www.fao.org/news/story/en/item/275041/icode/ (accessed on 30 April 2019).
9. Montaldo, H.H.; Torres-Hernández, G.; Valencia-Posadas, M. Goat breeding research in Mexico. Small Rumin.Res. 2010, 89, 155–163. [CrossRef]
10. Andrade, H.M.; Silva, J.C.; Escalante, I.; Vera, H.R. la cabra criolla negra, un recurso zoogenético en peligro:Bases del programa de recuperación en el bajío mexicano. Rev. Mex. Agroecosistemas 2017, 4, 29–41.
11. FAO Global plan of action for animal genetic resources and the interlaken declaration. Available online:http://www.fao.org/3/a1404e/a1404e00.htm (accessed on 10 April 2019).
12. Mavule, B.S.; Muchenje, V.; Bezuidenhout, C.C.; Kunene, N.W. Morphological structure of Zulu sheep basedon principal component analysis of body measurements. Small Rumin. Res. 2013, 111, 23–30. [CrossRef]
13. Ogah, D.M. Assessing Size and Conformation of the Body of Nigerian Indigenous Turkey. Slovak J. Anim.Sci. 2011, 44, 21–27.
14. Parés, P.M. Zoometría. In Valoración morfológica de los animales domésticos; Sañudo, C., Ed.; Ministerio deMedio Ambiente y Medio Rural y Marino: Madrid, España, 2009; pp. 171–198.
15. FAO Realización de encuestas y seguimiento de los recursos zoogenéticos. Available online: http://www.fao.org/3/ba0055s/ba0055s00.htm (accessed on 10 April 2019).
16. Angulo, Y. Muestreo. In Estadística para las ciencias sociales, del comportamiento y de la salud, 3rd ed.;Pérez-Tejada, H.E., Ed.; Cengage Learning: Distrito Federal, México D.F., 2008; pp. 182–200.
17. Hernández, J.S.; Franco, F.J.; Herrera, M.; Rodero, E.; Sierra, A.C.; Bañuelos, A.; Delgado, J.V. Estudio de losrecursos genéticos de México: Características morfológicas y morfoestructurales de los caprinos nativos dePuebla. Arch. Zootec. 2002, 51, 53–64.
18. FAO Phenotypic characterization of animal genetic resources. Available online: http://www.fao.org/3/i2686e/
i2686e00.htm (accessed on 12 December 2018).19. Herrera, M.; Luque, M. Morfoestructura y sistemas para el futuro en la valoración morfológica. In Valoración
morfológica de los animales domésticos; Sañudo, C., Ed.; Ministerio de Medio Ambiente y Medio Rural y Marino:Madrid, España, 2009; pp. 83–102.
20. Kaiser, H.F. The aplication of electronic computers to factor analysis. Educ. Psychol. Meas. 1960, 141–151.[CrossRef]
21. R Core Team. A Language and Environment for Statistical Computing 2017. Available online: https://www.r-project.org/ (accessed on 11 October 2018).
22. Gordón-Mendoza, R.; Camargo-Buitrago, I. Selección de estadísticos para la estimación de la precisiónexperimental en ensayos de maíz. Agron. Mesoam. 2015, 26, 55–63. [CrossRef]
23. Mohammadi, K.; Beygi Nassiri, M.T.; Fayazi, J.; Roshanfekr, H. Investigation of environmental FactorsInfluence on Pre-Weaning Grow Traits in Zandi Lambs. J. Anim. Vet. Adv. 2010, 9, 1011–1014.
24. Dudhe, S.D.; Yadav, S.B.S.; Nagda, R.K.; Pannu, U.; Gahlot, G.C. Genetic and non-genetic factors affectingmorphometry of Sirohi goats. Vet. World. 2015, 8, 1356–1363. [CrossRef] [PubMed]
25. Hassen, H.; Baum, M.; Rischkowsky, B.; Tibbo, M. Phenotypic characterization of Ethiopian indigenous goatpopulations. African J. Biotechnol. 2012, 11, 13838–13846. [CrossRef]
26. Herrera, M.; Rodero, E.; Gutierrez, M.J.; Peña, F.; Rodero, J.M. Application of multifactorial discriminantanalysis in the morphostructural differentiation of Andalusian caprine breeds. Small Rumin. Res. 1996, 22,39–47. [CrossRef]
27. Vargas, S.; Larbi, A.; Sánchez, M. Analysis of size and conformation of native Creole goat breeds andcrossbreds used in smallholder agrosilvopastoral systems in Puebla, Mexico. Trop Anim Heal. Prod. 2007,279–286. [CrossRef]
28. Bedotti, D.; Gómez, A.G.; Sánchez, M.; Martos, J. Caracterización morfológica y faneróptica de la cabracolorada pampeana. Arch. Zootec. 2004, 261–271.
29. Morales-delaNuez, A.; Rodríguez, C.; Santana, M.; Hernandez-Castellano, L.E.; Niño, T.; Reyes-Chacón, R.J.;Moreno-indias, I.; Castro, N.; Capote, J. Morphological measurements and indexes as a tool to supportmolecular genetic studies: An example in Canary Islands. J. Appl. Anim. Res. 2012, 40, 215–221. [CrossRef]
30. Fuentes-Mascorro, G.; Martínez, M.S.; Alejandre, M.E.; Chirinos, Z.; Ricardi, L.C. zoometría y distribución departos de la cabra criolla de los Valles Centrales de Oaxaca. Actas Iberoam. Conserv. Anim. 2013, 3, 150–154.
Animals 2019, 9, 459 12 of 12
31. Dorantes-Coronado, E.J.; Torres-Hernández, G.; Hernández-Mendo, O.; Rojo-Rubio, R. Zoometric measuresand their utilization in prediction of live weight of local goats in southern Mexico. Springerplus 2015, 4, 695.[CrossRef]
32. Gomes, J.K.; Arandas, G.; Vieira, N.M.; de Barros, R.; Pimenta, E.C.; de Albuquerque, L.H.; Ribeiro, M.Multivariate analysis as a tool for phenotypic characterization of an endangered breed. J. Appl. Anim. Res.2017, 45, 152–158.
33. Moutchou, N.; González, A.M.; Chentouf, M.; Lairini, K.; Rodero, E. Morphological differentiation ofNorthern Morocco goat. J. Livest. Sci. Technol. 2017, 5, 33–41.
34. Khargharia, G.; Kadirvel, G.; Kumar, S.; Doley, S.; Bharti, P.K.; Das, M. Principal component analysis ofmorphological traits of Assam hill goat in eastern Himalayan India. J. Anim. Plant Sci. 2015, 25, 1251–1258.
35. Okpeku, M.; Yakubu, A.; Peters, S.; Ozoje, M.; Ikeobi, C.; Adebambo, O.; Imumorin, I. Application ofmultivariate principal component analysis to morphological characterization of indigenous goats in SouthernNigeria. Acta Agric. Slov. 2011, 98, 101–109. [CrossRef]
36. Pares, P.M. Body Weight is an Important Trait for Comparisons of Goat Breeds. Iran. J. Appl. Anim. Sci. 2015,5, 463–466.
37. Gonzalez-Martinez, A.; Herrera, M.; Luque, M.; Rodero, E. Influence of farming system and productionpurpose on the morphostructure of Spanish goat breeds. Spanish J. Agric. Res. 2014, 12, 117–124. [CrossRef]
© 2019 by the authors. Licensee MDPI, Basel, Switzerland. This article is an open accessarticle distributed under the terms and conditions of the Creative Commons Attribution(CC BY) license (http://creativecommons.org/licenses/by/4.0/).