mors: an approximate fault modelling framework for reduced
TRANSCRIPT

MoRS: An Approximate Fault ModellingFramework for Reduced-Voltage SRAMs
Ismail Emir Yuksel‡, Behzad Salami†, Oguz Ergin‡, Osman S. Unsal†, Adrian Cristal Kestelman†§‡ TOBB University of Economics and Technology (TOBB ETU) † Barcelona Supercomputing Center (BSC) §
Universitat Politecnica de Catalunya (UPC)
Abstract—On-chip memory (usually based on Static RAMs-SRAMs) are crucial components for various computing devicesincluding heterogeneous devices, e.g, GPUs, FPGAs, ASICs toachieve high performance. Modern workloads such as DeepNeural Networks (DNNs) running on these heterogeneous fabricsare highly dependent on the on-chip memory architecture forefficient acceleration. Hence, improving the energy-efficiency ofsuch memories directly leads to an efficient system. One of thecommon methods to save energy is undervolting i.e., supplyvoltage underscaling below the nominal level. Such systems canbe safely undervolted without incurring faults down to a certainvoltage limit. This safe range is also called voltage guardband.However, reducing voltage below the guardband level withoutdecreasing frequency causes timing-based faults.
In this paper, we propose MoRS, a framework that generatesthe first approximate undervolting fault model using real faultsextracted from experimental undervolting studies on SRAMs tobuild the model. We inject the faults generated by MoRS intothe on-chip memory of the DNN accelerator to evaluate theresilience of the system under the test. MoRS has the advantage ofsimplicity without any need for high-time overhead experimentswhile being accurate enough in comparison to a fully randomly-generated fault injection approach. We evaluate our experimentin popular DNN workloads by mapping weights to SRAMs andmeasure the accuracy difference between the output of the MoRSand the real data. Our results show that the maximum differencebetween real fault data and the output fault model of MoRSis 6.21%, whereas the maximum difference between real dataand random fault injection model is 23.2%. In terms of averageproximity to the real data, the output of MoRS outperforms therandom fault injection approach by 3.21x.
Index Terms—Modeling, Fault-injection, Neural Networks,Undervolting, SRAM.
I. INTRODUCTION
SRAMS are traditionally the building block of differ-ent components in different computing systems such as
branch predictor (in CPUs), register files (in GPUs), on-chipbuffer memory (in hardware accelerators like FPGAs andASICs), thanks to the low-latency access time of such memo-ries. However, the power consumption of SRAMs significantlycontributes to the total system power. For instance, prior workson GPUs [1] show that register file in GPUs consumes 15-20% of the total power. Another work on modern out-of-ordercores [2] estimates that the SRAM-dominated front-end of themicroprocessor consumes up to 33% of the total power of theCPU. Other work on DNN accelerators on FPGAs [3] showsthat on-chip SRAMs consume 27% of the total power.
Since the total power consumption of any underlying hard-ware is directly related to its supply voltage, voltage under-scaling is an effective solution to save power [4], [5]. This
technique is widely used in various devices such as CPUs [6]–[10], GPUs [11] FPGAs [3], [12]–[15], and ASICs [16]–[18]as well as DRAMs [19]–[21], HBMs [22], SRAMs [23], [24],and Flash Disks [25]–[28]. However, while performing voltageunderscaling, reliability issues can arise due to the increasedcircuit delay at reduced voltage levels. In most commercialdevices, there is a timing-fault free guardband between nomi-nal voltage and minimum safe voltage, i.e., Vmin. Below thisvoltage guardband, faults occur as a consequence of circuitdelays.
Although further aggressive voltage underscaling belowVmin can achieve more reduction in power consumption, itcompromises system reliability through undervolting faults.This particular region between Vmin and the lowest operationalvoltage level, i.e., Vcrash, still operational but with faultsis called the critical area [3]. Several prior fault mitigationtechniques were proposed [3], [16], [17], [29], [30]. However,these techniques need either high-effort engineering [3], [30]or totally random fault injection campaigns [16], [17]. Theseapproaches are either impractical or not accurate. Our solutionoffers the advantages of both random fault injection andempirical experiments.
In this study, we propose MoRS, a framework that generatesthe first approximate voltage underscaled model for SRAMs.MoRS consists of three steps: 1) Experiment, 2) BehaviorExtraction, and 3) Model Generation. In the Experiment step,MoRS uses publicly available undervolted fault map data [31]of SRAMs based on our prior work [3]. In the BehaviorExtraction step, we extract the characteristic fault behavior fea-tures of undervolted SRAM blocks. We establish and confirmthat undervolting based faults do not occur randomly. Thesefaults are correlated with each other in space. We examine thefaults of row-based and column-based approaches and see thedistance between consecutively faulty bitcells, the number ofeach bit-fault in both rows and columns, and the total numberof faulty rows and columns per SRAM block are not uniformlydistributed. These fine-grained features show characteristicbehaviors. In this step, we extract characteristic features andcategorize them into two profiles: coarse-grained and fine-grained profiling. The reason behind these categorizing isthat random fault injection studies use only coarse-grainedfeatures, the number of bit faults, and the number of faultySRAM blocks. The output of MoRS that we term MixedModel uses both fine-grained and coarse-grained features andapplies probabilistic custom modeling algorithm to achieve anapproximate model as the last step.
© 2021 IEEE. Personal use of this material is permitted. Permission from IEEE must be obtained for all other uses, in any current or future media, including reprinting/republishing this material for advertising or promotional purposes,creating new collective works, for resale or redistribution to servers or lists, or reuse of any copyrighted component of this work in other works. DOI 10.1109/TCAD.2021.3120073

2
In recent years, the power consumption of SRAMs on DNNsis increasing drastically [3], [16], [17]. We evaluate MoRS forDNN accelerators where on-chip SRAMs play an importantrole. MoRS generates fault models that are not limited to acertain domain and can be potentially used in many domainssuch as branch prediction units, register files, caches, andany other memories based on SRAM, unlike the other priorstudies. To evaluate MoRS, we generate a baseline model byapplying a uniform random distribution function to coarse-grained features. This baseline, which we term as RandomModel, is a standard fault injection scheme and used in priorstudies [16], [17], [32], [33]. Besides, we process empiricaldata to see the difference in accuracy between each artificialmodel (Random Model and Mixed Model) and real data.
In our evaluation methodology, we map weights to SRAMblocks. When we map weights to SRAM blocks, there canbe different mapping options such as MSB mapping, LSBmapping, the first half of bits MSB the other half of bitsLSB mapping, and the first half of bits LSB the other halfof bits MSB mapping. Another method to save energy onDNNs is quantization. Our quantization method is reducingthe precision of weights from 32-bit to 16-bit, 8-bit, 4-bit,and 1-bit, respectively. While performing undervolting, someunwanted bits can be flipped, and then the correspondingvalue becomes infinity or NaN. To avoid these values maskingtechniques are used [34]. We mask infinity or NaN value to1 or 0. We examine the behavior of different weight map-pings, quantizations, and masking options. We evaluate ourexperiments on trained LeNeT-5 [35] and cuda-convnet [36]DNNs in the classification stage. We examine the classificationaccuracy for each voltage level. Our experiments show thatgenerated artificial model has similar behavior with the realdata on different DNN benchmarks with an accuracy of 96.4%.We also see that Random Model is not close enough with realdata with the difference in accuracy up to 23%. We find that onaverage our Mixed Model has 3.6% difference with real dataand on average 3x up to 7x closer than the baseline randommodel.
Our contributions are as follows:
• We propose a framework, MoRS that generates an artifi-cial model that can realistically emulate real undervoltingfault data with a difference in the accuracy of 3.6% onaverage. To the best of our knowledge, this study providesthe first reasonably accurate model for SRAM blocksunder low-voltage conditions.
• We evaluate our models and real data on state-of-the-artDNNs to see how different weight mappings, quantiza-tion, and value maskings affect the accuracy of inference.We find the similar observation with prior works [37],[38] that if we continue to reduce the precision ofweights, DNNs become more resilient to undervolting.At the lowest reduced voltage level 8-bit LeNeT accuracyis 14% while 4-bit LeNeT accuracy is 60%. Even inthis unlikely situation, our Mixed Model shows similarbehavior to real data.
The remainder of this paper is structured as follows. In SectionII, we introduce the most important concepts used in this paper.
In Section III, we propose our approximate fault modelingframework, MoRS. Section IV describes the methodology thatwe perform our experiments. Section V detail the experimentalresults. Related works are introduced in Section VI. Finally,Section VII concludes this paper.
II. BACKGROUND
A. Undervolting SRAM based on-chip MemoriesCMOS is the dominant circuit technology for current
computing devices. The power consumption of CMOS-basedSRAMs is the sum of two parts: the first is dynamic power,also called active power, and the other one is leakage power,also called static power. Earlier studies [39]–[41] show thatthe power consumption of SRAMs is dominated by dynamicpower.
Dynamic power i.e., Pdyn, is dissipated when there isswitching activity at some nodes in transistors. Leakage poweri.e., Pleak, is dissipated by the leakage currents flowing evenwhen the device is not active. Mathematically, these powerequations are given by,
Pdyn ∝ f × V 2dd (1)
Pleak = kdesign × n× Ileak × Vdd (2)
Here Vdd shows the supply voltage, f shows the operatingfrequency in Equation 1. Further, n denotes the number oftransistors, kdesign is the design-dependent parameter, andIleak shows the leakage current a technology-dependent pa-rameter in Equation 2. From Equation 1, dynamic powerconsumption can be reduced by adjusting the supply voltageand operating frequency. Likewise, from Equation 2, leakagepower consumption can be reduced by underscaling the supplyvoltage and reducing the total number of transistors. Totalpower consumption can be reduced by underscaling the supplyvoltage.
Voltage underscaling is a widely used technique for energy-efficient applications. From Equation 1, dynamic power con-sumption is reduced quadratically by underscaling the supplyvoltage. This technique can achieve nominal voltage level i.e.,Vnom performance due to the operating frequency not beingchanged. However, further aggressive undervolting below theminimum safe voltage i.e., Vmin may cause reliability issuesas the result of timing faults. Between Vnom and Vmin iscalled voltage guardband. This guardband is to provide anassurance of correct functionality even in the worst environ-mental case. Prior works achieve by applying undervoltingthat power consumption reduces; 39% on FPGA on-chipmemories [3], 20% in GPUs [42], and 16% in DRAMs [19]without any timing-related errors. Also, recent studies showthat undervolting internal components of FPGAs [12] lead toaround 3x power-efficiency and underscaling supply voltage ofHBMs [22] achieve a total of 2.3x power savings. In Minerva[16], lowering SRAM voltages achieves a total of 2.7x powersavings.
B. Fault InjectionThe fault injection mechanism is a way to examine the
behavior of systems under different circumstances. Prior works

3
on fault injection study for reduced-voltage SRAMs areapplied on branch prediction units [32], [43], caches [44],[45], and FPGA on-chip memories [33]. There are severalapproaches for the fault injection with having a trade-off on theengineering effort and accuracy. i) The first one is applyingrandom faults to random locations without any informationused from empirical experiments. ii) Another one is directlyusing the empirical data as a fault map. iii) The last one isthe approximate modeling that is based on real data fromempirical experiments and close enough to empirical data.Table I gives a summary of comparison of these three faultinjection techniques in terms of effort and how close they areto real data. The accuracy percentage is from the results ofthis study.
TABLE I: Comparison of fault injection techniques in termsof engineering effort and accuracy of representing real data
Fault Injection Method Engineering Effort Accuracy (Min)
Random Fault Injection Low 77%MoRS Low 94%
Empirical Data High 100%
C. Deep Neural Networks
Deep Neural Networks (DNNs) are widely used as aneffective solution for object recognition, classification andsegmentation, and many other areas. MNIST [46] and CIFAR-10 [47] datasets are widely used by the ML community toshowcase the latest technology advancements in DNNs. DNNsperform in two phases: training and prediction (inference). Thefirst process is training that weights of DNNs are fitted to data.The training phase is mainly performed in high-performancecomputing platforms like CPUs or GPUs. The second phaseis the inference phase, DNN models, trained in the first phase,are used to extract unknown output from input data. Usually,the training phase performs once whereas the prediction phaseperforms repeatedly. The inference phase consists of mainlythree elements: input, weights, and output.
Fig. 1: A high level abstraction of one layer of DNNs.
Figure 1 shows a high-level abstraction of one inferencelayer. Each inference layer of the network consists of weights,an input matrix, and an output matrix. Weights of these layersare stored in on-chip memories. Due to their large size andcomputational intensity, DNNs consume power; while they
are fault-tolerant to some extend. Some studies improve thepower-efficiency and reduce the total power consumption ofDNNs by applying voltage underscaling [3], [12], architecturaltechniques [48]–[55], and hardware-level techniques [56]–[58].
Quantization is an architectural optimization technique thatreduces the precision of data types. This technique can im-prove performance and energy-efficiency. Recent studies [16],[59]–[62] show that quantization to some extent does notsignificantly affect the accuracy of DNN models. In our study,we reduce weights precisions to 16-bit half-precision floatingpoint, 8-bit(Q4.4), 4-bit(Q2.2) in fixed-point format, and 1-bitbinary values.
III. MORS FRAMEWORK
We propose MoRS, a framework to generate approximateartificial reduced-voltage SRAM fault models. This mecha-nism is the first framework based on real fault maps. MoRSstands between fully hardware and fully software fault in-jection techniques. This framework generates an approximatemodel that is close enough to real data compared to the fullysoftware fault injection mechanism. Also, MoRS does not re-quire high-effort engineering in comparison to a fully hardwareapproach that uses real data from empirical experiments.
As shown in Figure 2 MoRS consists of three steps: ¶ Ex-periment, · Behavior Extraction, and ¸ Model Generation.We first explain the first step existing experiment that providesreal fault maps from real SRAM blocks in Section 3.1. InSection 3.2 we extract the behavior of fault maps as fine-grained and coarse-grained profiles by using the output of thefirst step. In fine-grained profiling extract the row and columnbehaviors of SRAM blocks in terms of physical distance, thenumber of each bit-faults in rows and columns, and the numberof faulty rows and columns per block. Coarse-grained profilingis a shallow approach generally used in prior fault injectionstudies. In coarse-grained profiling, we extract only the totalnumber of bit-faults and faulty SRAM blocks. In Section 3.3we generate an artificial model with outputs of the secondsteps.
At the endpoint, we provide Mixed Model which is anapproximate model to real data. It is generated by applyingprobabilistic modeling on both fine-grained and coarse-grainedfault profiles. Figure 2 provides an overview of the three stepsof the MoRS.
Fig. 2: Overview of the MoRS

4
Board Name VC707 ZC702 KC705Technology Node 28nm 28nm 28nmNominal Voltage 1V 1V 1VOperating Temperature 50◦C 50◦C 50◦CMinimum Voltage Level 0.54V 0.53V 0.54VNumber of SRAM Block 2060 280 890
TABLE II: The summary of deployed FPGA boards
A. Experiment
Voltage underscaling, i.e., undervolting is a widely usedtechnique to save energy. We study undervolting for modernSRAM blocks. Each SRAM block is a matrix of bitcellsformed of rows and columns. Also, each SRAM block is16 Kbits with 1024 rows and 16 columns. We perform thisempirical study on SRAM blocks available in the off-the-shelf Xilinx FPGAs, i.e., VC707, ZC702, and two identicalsamples of KC705 (referred as KC705-A and KC705-B).Table II shows the detail of deployed FPGAs. This experimentconsists of two parts. The first part is the monitor SRAMblocks to see undervolting faults. The second part is adjustingthe supply voltage of SRAM blocks by using a power man-agement unit of FPGAs. FPGAs have a power managementbus (PMBUS) a voltage regulator that monitors and adjustsvoltage rails on FPGAs. This bus uses PMBUS standardand has an I2C protocol to execute commands. The supplyvoltage of SRAM blocks of FPGAs is named VCCBRAM .By reducing VCCBRAM through PMBUS, only the powerconsumption of SRAM blocks reduces. Since this situationdoes not affect any other logic parts (DSPs, LUTs, etc..) theeffect of undervolting on SRAM blocks is seen clearly. Thesetup of this methodology is shown in Figure 3. The method
Fig. 3: The methodology of empirical experiment
of this experiment follows an algorithm that as a first stepwrites data to SRAMs after in the second step analyzes thefaults in terms of rate and location, in the third step reducesthe supply voltage by 10mV , finally repeat these steps untilFPGA crashes.
When undervolting is applied below the voltage guardbandi.e., Vmin, the fault rate exponentially increases. Voltagecan be reduced until the voltage that FPGA stops operatingi.e., Vcrash. Between Vmin and Vcrash faults occur due to
timing failures while the power consumption significantlyreduces. SRAM-based real fault maps significantly vary evenfor different FPGAs of the same platform as the result of theprocess variation. Besides, the study shows that the patternof faults is mostly permanent. Also, we observe that the faultrate and location for different run are mostly the same. Mostimportantly, undervolting faults are not uniformly distributedover different SRAMs.
We use the publicly available data [31] of the prior work [3]as the output of the first stage (Experimental Data) to generateartificial fault maps. We use 2000 SRAM blocks for extractingbehavior and 950 SRAM blocks for testing our framework,2060 SRAM blocks from VC707 and 890 SRAM blocks fromKC705. We make the methodology of MoRS reliable by usingdifferent data set to create and also to test our artificial model.
At Vcrash the fault rate, up to 0.06% and 0.005% per 1Mbits for VC707 and KC705-B, respectively. It should benoted that faults appear in between Vmin = 0.6V, Vcrash =0.54V for VC707 and Vmin = 0.59V, Vcrash = 0.53V forKC705-B. As the prior work [3] mentioned VC707 has themost bit-faults among the other three boards. At the lowestvoltage level, VC707 has 10.2% faulty SRAMs with 23706bit-faults. We refer [3] to more detailed information about thisprior work.
B. Behavior Extraction
As we mentioned in Section 3.1 voltage underscaling faultshave patterns and these fault patterns i.e., fault maps, aremostly the same. There are features that affect the prob-ability of bit-faults. In this step, we profile the behaviorof undervolting-related bit-faults to extract such importantfeatures. We perform the profiling in two steps: coarse-grainedprofiling and fine-grained profiling. A summary of all features,profiling types, and which model they are used in can be foundin Table III.
Coarse-grained profiling consists of two features. The firstone is the percentage of bit-faults in all SRAMs bitcell i.e.,PF . The second one is the percentage of faulty SRAMs in allSRAM blocks i.e., PS . For VC707, at Vcrash, total bit-faultsare 0.07% and the percentage of faulty SRAMs is 10.2%.
Fine-grained profiling comprises two parts: row-based,column-based. Both row-based and column-based have threefeatures. The first one is the percentage of faulty rows i.e.,PSR0..1024
and faulty columns PSC0..16in faulty SRAM blocks.
The second one is the percentage of each bit-faults in rowsi.e., PFR0..16 , or columns i.e., PFC0..1024 . The last one is thepercentage of physical distance between consecutively faultybitcells i.e., bitcell-distances, in the same row i.e., PFDR1..15
,or column i.e., PFDC1..1023
. We discover that these twofeatures for row and column are not randomly or uniformlydistributed.
At Vcrash,• The percentage of each bit-faults
– In terms of row concentrates at 2-bit faults (PFR2)
and no faults (PFR0).
– In terms of column it concentrates no faults to 10-bitfaults (PFC0..10
).

5
TABLE III: Features and which model they are used in
Profiling Type Features ModelsName Percentage Mixed-Model Random-Model
Coarse-grained Total number of bit-faults PF 3 3Total number of faulty SRAM blocks PS 3 3
Fine-grained
Total number of faulty rows per SRAM block PSR0..1024 3 7Total number of faulty columns per SRAM block PSC0..16 3 7Number of each bit-fault in rows PFR0..15
3 7Number of each bit-fault in columns PFC0..1023
3 7Distance between consecutively faulty bitcells in rows PFDR1..15
3 7Distance between consecutively faulty bitcells in columns PFDC1..1023 3 7
• The percentage of bitcell-distances between consecutivelyfaulty bitcells
– In terms of row concentrates at 8-bit distance(PFDR8 ).
– For rows that there is no such bitcell-distance is morethan 8-bitcells (PFDR9..15
).– For the columns, it is concentrated in even numbers
in decreasing orderPFDC0..2..1024, 2-bitcells distance
(PFDC2) has the highest percentage while 1022-
bitcells distance (PFDC1022) has the lowest in evennumbers.
– Also, for columns, the bitcell-distances in odd num-bers (PFDC1..3..1023
) are stuck between 0 and 4.
Fig. 4: Physical features on a faulty SRAM block as anexample
As an illustration, we show the fault behavior of an 8 ∗ 8SRAM block in Figure 4. In this example, the column-baseddistance between cell A and cell B is 6-bitcells. For cell C andcell D, the row-based distance is 5-bitcells. When we examinethis example in Figure 4 in terms of bit-fault for both row-based and column-based, a column that contains cell C has2-bit faults. Also, cell A’s row has 4-bit faults. One of the
coarse-grained profile features is the percentage of total bit-faults (PF ). It can be calculated by dividing the total numberof faulty cells by all cells. Hence, for Figure 4’s SRAM blockPF is 28.125%.
As we extract the behavior of this example in Figure 4,we performed this process for experimental data. When theprofiling step is done, we start generating models by usingthese coarse-grained and fine-grained profiles with probabilis-tic modeling and uniform random distribution.
Algorithm 1 Generate Mixed Model
Require: n← #ofSRAMblocksbitfaults← n× 1024× 16× PF
faultyS ← n× PS
while faultyS > 0 and bitfaults > 0 doblock ← randomfaultyBlock ← SRAMblocks[block]faultyrows← selectfrom(FSR0..16
)while faultyrows > 0 dorow ← randomcolumn← randombitfaultsinrow ← selectfrom(FFR0..16)while bitfaultsinrow > 0 do
distance← selectfrom(FFDR1..15)
column← column+ distancefaultyBlock[row][column]← faultbitfaultsinrow ← bitfaultsinrow − 1
end whilefaultyrows← faultyrows− 1
end whileArtificialCF ← ColumnFeatures(faultyBlock)RealCF ← ColumnFeatures(RealData)if Similarity(ArtificialCF,RealCF ) > 80% thenSRAMblocks[block]← faultyBlockfaultyS ← faultyS − 1bitfaults← bitfaults−#offaults(faultyBlock)
end ifend while
C. Model Generation
Probabilistic modeling [34] and uniform random distribution[17], [34], [43], [63] are widely used in many modeling studiesto generate fault maps and to inject faults. For an approximate

6
model i.e., Mixed Model, we use both fine-grained and coarse-grained features with custom probabilistic modeling function.In addition to these, we need the number of SRAM blocksthat will generate.
To generate Mixed Model we follow the method shownin Algorithm 1. The input of Algorithm 1 is the numberof SRAM blocks and the output is faulty SRAM data, alsocalled fault map. First, in Algorithm 1, faulty SRAM blocksare determined. After that, by using PF value, the number offaulty cells are calculated. First, we randomly select faultySRAMs in all SRAM blocks. Then, we inject faults cor-responding cells in faulty SRAMs. This injection algorithmuses fine-grained features. This process is performed in twostages: row-based fault injection and column-based controlmechanism. The row-based fault injection uses row-basedfeatures. We determine how many rows will be faulty by usingthe probability of the number of faulty rows per SRAM blocki.e., FSR0..1024 derivating from PSR0..1024 . Then according tothe probability of the number of each bit-faults in rows i.e.,FFR0..16
derivating from PFR0..16we inject bit-faults to the
corresponding row. To inject more than one fault in a row weuse the probability of physical distance between consecutivelyfaulty bitcells in rows FFDR1..15 derivating from PFDR1..15 .In the second step of this algorithm, first, we extract column-based features of each artificial fault map.
Fig. 5: The running time overhead and accuracy difference be-tween real data and the generated artificial model for differentsimilarity threshold levels
After extraction, we compare these features with fine-grained column-based features extracted from the second step.If an artificial faulty SRAM has a lower than 80% of similaritywith experimental real data, we perform these steps again untilthe similarity is 80% or higher. We select the 80% similaritythreshold as a good trade-off between the run-time (to generatethe fault models) and accuracy (of the generated fault models).As shown in Figure 5, if we increase the threshold level, therun time of MoRS increases drastically. However, increasingthe threshold is not achieve significant accuracy compared tothe optimal threshold. Below this threshold, the approximatemodel converges to the Random Model that do not have anacceptable accuracy.
IV. EXPERIMENTAL METHODOLOGY
MoRS is a general framework that generates approximatefault maps for undervolted SRAM blocks. In this study, we
test MoRS on state-of-the-art Deep Neural Networks. Ourexperiments are based on injecting faults into weights oftrained DNNs. To evaluate how precise MoRS is we use Caffe[64]. Also, we perform different quantizations (precisions), bit-mappings, and value masking to diversify our experiments.The summary of these options is in Table IV.
TABLE IV: Different options for evaluation
Options Name
Precision
32-bit single-precision floating point16-bit half-precision floating point8-bit fixed point (Q4.4)4-bit fixed point (Q2.2)1-bit (Binary)
Bit-Mapping
MSBLSBFirst half MSB and other half LSBFirst half LSB and other half MSB
Value Masking Infinity or NaN to 1Infinity or NaN to 0
The experiment is performed for each voltage level betweenVmin and Vcrash, precision, mapping, and masking option.To compare artificial models with real data we also processthis methodology for real data. Artificial Models are RandomModel and Mixed Model. Random Model is a naive randombaseline used in prior works to inject faults. Mixed Model isan approximate model, the output of the MoRS. Real Data isthe experimental data [31] extracted from the prior empiricalstudy [3]. To evaluate real data, we select the required amountof SRAM blocks randomly from real data. Instead of ArtificialModels, we process real data to evaluate in Figure 6.
Fig. 6: Overall Methodology
The methodology consists of four parts as shown in Figure6: ¶ MoRS & Experiment, · Bit-Precision & Bit-MappingUnit, 3 ¸ Fault Injection Unit (Weights to SRAM Mapping)and ¹ DNN Inference. In the first step, we acquire artificialmodels from MoRS that are explained in Section 3. In thesecond step, the Fault Injection Unit changes healthy weights

7
into updated weights by performing mapping and precisionoptions. In the third step, with the outputs of the first andsecond steps, we generate faulty weights. In the last step, weobtain the final accuracy percentage.
1. MoRS & Experiment. In this step, we choose whichSRAM data is sent to Fault Injection Unit. To evaluateMoRS, we generate a baseline model, i.e., Random Model.Random Model is generated by uniform random distributionwith coarse-grained features. We process every step in MoRSdescribed in Section II. However, we apply a directly randomdistribution function to only coarse-grained features insteadof applying custom probabilistic modeling and algorithm tocoarse-grained and fine-grained features.
In Random Model, first, with a given number of SRAMblocks we determine which and how many blocks are faultyby using PS value. Then, using PF value we calculate howmany cells are going to be faulty. When it is calculated, werandomly inject faults in cells of randomly selected faultySRAM blocks. Because of the uniform random distribution,every cell in faulty blocks has the same probability. Thedifferences between Mixed Model and Random Model aresummarized in Table III.
In Figure 6, we call Mixed Model and Random Model Ar-tificial Models. To understand how accurate our approximatemodel we evaluate empirical data also called Real Data. Sinceevaluated networks utilize 850 SRAM blocks at maximum, werandomly choose the required amount of SRAM blocks.
2. Bit-Precision & Bit-Mapping Unit. Quantization andundervolting are both effective techniques to improve the en-ergy efficiency of DNNs. However, they may lead to accuracyloss with aggressive exploitation. MoRS enables us to exploretheir correlation to find an optimal operating point.
In this step, we change weights according to precision andmapping options. Caffe’s weights are 32-bit single-precisionfloating points. Since each row of SRAM block has 16-bit, westore those weights in two rows when precision is not reduced.
We use four fixed point precisions: 16-bit half-precisionfloating point, 8-bit (Q.4.4), 4-bit (Q2.2), and binary. To enablefixed-precision options we use a prior study [65] an adaptedversion of the original Caffe with limited numerical precisionof weights. For 16-bit half-precision floating point, we useNVCaffe [66], NVIDIA-maintained Caffe that supports 16-bit half-precision floating point train and inference. Whenprecision is reduced to X − bit, we store 16/X weights inone row consecutively. Therefore, by reducing precision, theusage of SRAM blocks and power consumption decrease witha cost of accuracy loss.
In addition to precision options, we change the mapping ofweights to SRAM blocks. There are four mapping options:MSB, LSB, the first half of bit MSB, and another half of bitsLSB, the first half of bits LSB, and another half of bit MSB.MSB means the most significant bit of weights maps to thefirst cell of a row whereas LSB means the least significant bitof weights maps to the first cell of a row.
3. Fault Injection Unit (Weights to SRAM Mapping). Af-ter precision and mapping options we obtain updated weights.In this step, we use artificial models to inject faults in updatedweights. Each cell of artificial models contains either faulty
TABLE V: Details of evaluated neural networks
NN Model LeNeT-5 [35] cuda-convnet [36]Dataset Name MNIST [46] CIFAR-10 [47]# of Weights 430500 89440# of SRAM Blocks Utilized 850 180Inference Accuracy (%) 99.05% 79.59%
or healthy information. If a bit of weight is mapped in thefaulty cell, we flip its value. Else, the value is not changed.When this bit-flip operation performs, sometimes the value ofweights could be infinity or NaN. To prevent this situation wemask these values to either one or zero. The masking operationis only performed for 32-bit single-precision and 16-bit half-precision floating point. Because fixed point does not have anymantissa or exponent parts to converge NaN or infinite value.In our study, the largest fixed point representation is Q4.4 andits maximum value is 15.
4. DNN Inference. After injecting faults to the weights,we use Caffe Framework to measure the accuracy of neuralnetworks. Our most accurate baseline is Real Data. We trainour model based on part of real data and we test it usinganother of that data. To diversify we have four different bit-mapping, three different precision, and two different maskingoptions for each voltage level.
V. EXPERIMENTAL RESULTS
As we mentioned in the previous section we use Caffe[64], a deep learning framework, and test the output ofMoRS and random fault injection model on two differentneural network models: LeNeT-5 [35] with MNIST dataset[46] and cuda-convnet [36] with CIFAR-10 dataset [47]. Weperform different bit-mappings and value maskings for eachneural network architecture. In addition to these tests, we alsoperform reduced precision tests on LeNeT-5. Details of eachevaluated benchmark are summarized in Table V.
A. Overall Resilience
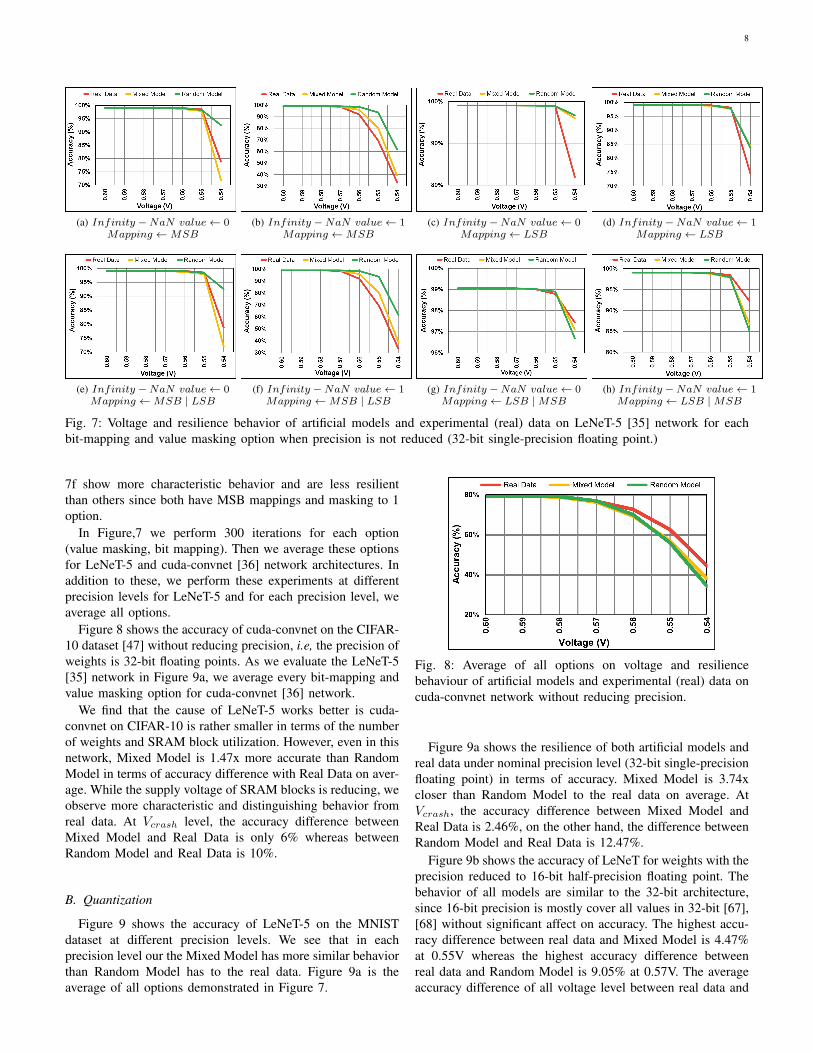
Figure 7 shows the accuracy of LeNeT-5 [35] on the MNISTdataset [46] with different bit-mapping and value maskingoptions. We observe that in all options Mixed Model is moreprecise than Random Model. Also, if the application becomesless resilient, Mixed Model is closer to the real data and thegap between the baseline and Mixed Model is increasing interms of how close they are to the real data.
We observe that that if we mask infinity and NaN valueto 0, the LeNeT-5 network is more resilient than masking to1. We think that the cause of this situation is in the MNISTdataset hand-written digits are represented by one and the restof the background is represented by zero. Therefore, ones moreimpact than zeros when it comes to classification.
We see that MSB and MSB | LSB mapping cause morefaults and are less resilient than LSB and LSB | MSBmapping. We find that the cause of this is undervolting-based faults generally occur in first cells. Since MSB meansthe most significant bit, when bit-flips happen it affects thecorresponding value more than others. Figure 7b and Figure
8
(a) Infinity −NaN value← 0Mapping ←MSB
(b) Infinity −NaN value← 1Mapping ←MSB
(c) Infinity −NaN value← 0Mapping ← LSB
(d) Infinity −NaN value← 1Mapping ← LSB
(e) Infinity −NaN value← 0Mapping ←MSB | LSB
(f) Infinity −NaN value← 1Mapping ←MSB | LSB
(g) Infinity −NaN value← 0Mapping ← LSB |MSB
(h) Infinity −NaN value← 1Mapping ← LSB |MSB
Fig. 7: Voltage and resilience behavior of artificial models and experimental (real) data on LeNeT-5 [35] network for eachbit-mapping and value masking option when precision is not reduced (32-bit single-precision floating point.)
7f show more characteristic behavior and are less resilientthan others since both have MSB mappings and masking to 1option.
In Figure,7 we perform 300 iterations for each option(value masking, bit mapping). Then we average these optionsfor LeNeT-5 and cuda-convnet [36] network architectures. Inaddition to these, we perform these experiments at differentprecision levels for LeNeT-5 and for each precision level, weaverage all options.
Figure 8 shows the accuracy of cuda-convnet on the CIFAR-10 dataset [47] without reducing precision, i.e, the precision ofweights is 32-bit floating points. As we evaluate the LeNeT-5[35] network in Figure 9a, we average every bit-mapping andvalue masking option for cuda-convnet [36] network.
We find that the cause of LeNeT-5 works better is cuda-convnet on CIFAR-10 is rather smaller in terms of the numberof weights and SRAM block utilization. However, even in thisnetwork, Mixed Model is 1.47x more accurate than RandomModel in terms of accuracy difference with Real Data on aver-age. While the supply voltage of SRAM blocks is reducing, weobserve more characteristic and distinguishing behavior fromreal data. At Vcrash level, the accuracy difference betweenMixed Model and Real Data is only 6% whereas betweenRandom Model and Real Data is 10%.
B. Quantization
Figure 9 shows the accuracy of LeNeT-5 on the MNISTdataset at different precision levels. We see that in eachprecision level our the Mixed Model has more similar behaviorthan Random Model has to the real data. Figure 9a is theaverage of all options demonstrated in Figure 7.
Fig. 8: Average of all options on voltage and resiliencebehaviour of artificial models and experimental (real) data oncuda-convnet network without reducing precision.
Figure 9a shows the resilience of both artificial models andreal data under nominal precision level (32-bit single-precisionfloating point) in terms of accuracy. Mixed Model is 3.74xcloser than Random Model to the real data on average. AtVcrash, the accuracy difference between Mixed Model andReal Data is 2.46%, on the other hand, the difference betweenRandom Model and Real Data is 12.47%.
Figure 9b shows the accuracy of LeNeT for weights with theprecision reduced to 16-bit half-precision floating point. Thebehavior of all models are similar to the 32-bit architecture,since 16-bit precision is mostly cover all values in 32-bit [67],[68] without significant affect on accuracy. The highest accu-racy difference between real data and Mixed Model is 4.47%at 0.55V whereas the highest accuracy difference betweenreal data and Random Model is 9.05% at 0.57V. The averageaccuracy difference of all voltage level between real data and

9
(a) 32-bit single-precisionfloating point
(b) 16-bit half-precision floatingpoint
(c) 8-bit fixed point (Q4.4) (d) 4-bit fixed point (Q2.2) (e) 1-bit (Binary)
Fig. 9: Average of all options on voltage and resilience behaviour of artificial models and experimental (real) data on LeNeT-5network with different precisions.
Mixed Model is 2.25% whereas between real data and RandomModel is 4.84%, which is 2.15x worse than Mixed Model interms of similarity of the behavior of real data.
Figure 9c shows the accuracy of LeNeT with 8-bit precisionfor weights. We see that compared to 32-bit, the network areless resilient to undervolting faults. On average, Mixed Modelis 7x better than Random Model in terms of approximation toreal data. At 560mV , the accuracy gap between Mixed Modeland Real Data is 4% while the difference between RandomModel and Real Data is 23%.
Figure 9d shows the accuracy of both artificial modelsand real data when the precision of weights reduces to 4-bit. We see that reducing the precision of weights 8-bit to4-bit network become more resilient and more fault-tolerantto errors based on voltage underscaling. Although, at Vnom,8-bit LeNeT is more accurate than 4-bit LeNeT, at Vcrash,8-bit accuracy is 14% whereas 4-bit accuracy is 62%. Evenin this unexpected situation, artificial models of the MoRSframework have similar behavior to real data. On average,Mixed Model is 2x closer to real data than Random Model.At 550mV , the difference in accuracy between Mixed Modeland real data is around 1.5%, while the difference in accuracybetween Random Model and real data is 3%.
Figure 9e shows the accuracy of LeNeT when precisionreduces to 1-bit. In 1-bit tests, we map weights to threedifferent value sets. First one is {-1,1}, second is {-1,0}and the last one is {0,1}. However, we have not observedmuch difference between value sets. As we see in 4-bit, 1-bit LeNeT network becomes more resilient to faults. Thedifference between Vnom accuracy and Vcrash accuracy is0.79%. Both artificial models have the same behavior anddo not have significant difference in accuracy. Mixed Modelhas 0.03% difference in accuracy, whereas Random Model is0.02%. Because of these negligible statistics, we do not add1-bit LeNeT to Figure 10.
To point out the resilience of reduced precision networks,we examine the accuracy drop between Vnom and Vcrash. Thedrop is 68.4%, 12.9% and 0.79% for 8-bit, 4-bit and 1-bitLeNet, respectively.
Table VI shows the SRAM utilization and accuracy invarious precision levels of weights. Inference accuracy rep-resents the accuracy at nominal voltage level (Vnom). 32-bitFP denotes the 32-bit single-precision floating point, 16-bitHalf FP stands for 16-bit half-precision floating points.
LeNeT-5 Precision SRAM Utilization Accuracy32-bit FP 850 99.05%
16-bit Half FP 425 97.03%8-bit (Q4.4) 213 82.79%4-bit (Q2.2) 107 74.75%
1-bit (Binary) 27 49.59%
TABLE VI: LeNeT-5 SRAM Block Utilization and InferenceAccuracy(at Vnom) under different precisions
C. Comparison of Artificial Models
Figure 10 shows the accuracy gap between Real Data andboth two artificial models. We see that on the average ofall benchmarks, Mixed Model is 3.21x closer than RandomModel on average. For most of the benchmarks, the maximumdifference in accuracy between Mixed Model and Real Modelis under 5%. However, for the Random Model, the maximumdifference in accuracy is 23.2%.
We conclude that the proposed model not only has the samebehavior with real data against undervolting effects but alsocan imitate real data with a tolerable difference in terms ofaccuracy. Most importantly, if the system is not resilient tofaults, randomized fault injection does not show the behaviorof real data. To be precise in how undervolting affects systems,it has to profile the real data in fine-grained. Coarse-grainedfeatures are insufficient to model real SRAM behavior whenundervolting is performed.
VI. RELATED WORK
To the best of our knowledge, this study provides thefirst approximate fault modeling framework and injection involtage underscaled SRAMs. In this section, we discuss relatedwork on fault injection and modeling on undervolted systemsand the resilience of DNNs.
Resilience of DNNs. DNNs are inherently reliable to faults.However, in harsh environments, process variations, voltageunderscaling can cause significant accuracy loss. Reagen et al.[16] propose Minerva a fault mitigation mechanism to mitigatelow-voltage SRAM faults effects in DNN accelerators. Salamiet al. [3] study undervolting SRAM-based FPGA on-chipmemories and present intelligently-constrained BRAM place-ment to mitigate undervolting faults in the NN classificationlayer. Torres-Huitzil et al. [29] present a comprehensive review

10
Fig. 10: The accuracy difference between Real Data and eachartificial model for all benchmarks.
on fault and error tolerance in neural networks and mentionmitigation and fault injection techniques. They also mentionthat more realist/novel fault models need to be developed tounderstand the effects of faults on neural networks deeplyas an open challenge. Deng et al. [30] present a retraining-based mitigation technique for neural networks to becomemore resilient.
Fault injection. Fault injection is a widely used technique inresilience studies. Also, fault injection is used as bit-flip-basedadversarial weight attacks also called bit-flip attacks(BFA)[69]–[71] and fault-injection attacks [72], [73]. Many studiesfocus on the reliability and resilience of systems on soft-errors, noise [63], [74]–[76], and voltage underscaling byinjecting faults. Koppula et al. [34] propose a framework,EDEN, that proposes combining training on profiled DRAMfaults in terms of timing violations and voltage underscalingwith mitigation strategies and mappings. EDEN provides fourdifferent error models since uniform random distribution doesnot cover whole DRAMs. Chatzidimitrou et al. [32], [43] injectfaults randomly to branch prediction units to examine theeffects of voltage underscaling. Chandramoorthy et al. [17]study the undervolting faults in different layers of networksby injecting faults to SRAMs randomly and do not takeaccount of the patterns or spatial distribution of bit errors.Stutz et al. [77] propose random bit error training assumedvoltage underscaled SRAMs faults distribute randomly. Salamiet al. [33] study the resilience of RTL NN Acceleratorsand fault characterization and mitigation. To characterize andmitigate they assume that each bitcell of SRAMs has the sameprobability. Yang et al. [23] study energy-efficient CNNs byperforming voltage scaling on SRAMs. To study the effect ofbit errors they hypothesize that errors in SRAM are roughlyuniformly distributed. The prior work [78] on Near-ThresholdVoltage FinFET SRAMs presents a fault model for SRAMsbased on uniform random distribution. Givaki et al. [79] studythe resilience of DNNs under reduced voltage SRAM-basedFPGA on-chip memories by using directly the experimentaldata to examine the training phase of DNNs.
All of these undervolted on-chip fault injection studies
perform injection randomly and do not take into accountfine-grained profiling such as spatial distances between cells,row-based and column-based approaches. Randomly injectingfaults approach can cause misleading to understand how thesystem works under the low-voltage domain. As we mentionedin Section 4, if the system does not have much resilience tovoltage underscaling, the Mixed Model of MoRS is 7x closerthan the randomly injected model to the real data.
VII. CONCLUSION
In this paper, we propose MoRS, a framework that generatesthe first approximate fault injection model i.e., artificial faultmaps. The advantage of the proposed framework is to injecterrors into various systems including heterogeneous computingdevices. We evaluated the accuracy of the proposed frameworkfor state-of-the-art DNN applications. To evaluate our pro-posed model, we measure the difference in accuracy betweenartificial error models and real data. We show that comparedto random model-based error injections, the proposed modelcan provide 3.21x on average closer than to the real data.
ACKNOWLEDGEMENT
This work is partially funded by Open Transprecision Com-puting (OPRECOM) project, Summer of Code 2020.
REFERENCES
[1] H. Jeon, G. S. Ravi, N. S. Kim, and M. Annavaram, “Gpu register filevirtualization,” in Proceedings of the 48th International Symposium onMicroarchitecture, ser. MICRO-48. New York, NY, USA: Associationfor Computing Machinery, 2015, p. 420–432. [Online]. Available:https://doi.org/10.1145/2830772.2830784
[2] J. Haj-Yihia, A. Yasin, Y. B. Asher, and A. Mendelson, “Fine-grainpower breakdown of modern out-of-order cores and its implicationson skylake-based systems,” ACM Trans. Archit. Code Optim., vol. 13,no. 4, Dec. 2016. [Online]. Available: https://doi.org/10.1145/3018112
[3] B. Salami, O. S. Unsal, and A. C. Kestelman, “Comprehensive evalua-tion of supply voltage underscaling in fpga on-chip memories,” in 201851st Annual IEEE/ACM International Symposium on Microarchitecture(MICRO). IEEE, 2018, pp. 724–736.
[4] G. Papadimitriou, A. Chatzidimitriou, D. Gizopoulos, V. J. Reddi,J. Leng, B. Salami, O. S. Unsal, and A. C. Kestelman, “Exceeding con-servative limits: A consolidated analysis on modern hardware margins,”IEEE Transactions on Device and Materials Reliability, vol. 20, no. 2,pp. 341–350, 2020.
[5] D. Gizopoulos, G. Papadimitriou, A. Chatzidimitriou, V. J. Reddi,B. Salami, O. S. Unsal, A. C. Kestelman, and J. Leng, “Modern hardwaremargins: Cpus, gpus, fpgas recent system-level studies,” in 2019 IEEE25th International Symposium on On-Line Testing and Robust SystemDesign (IOLTS). IEEE, 2019, pp. 129–134.
[6] A. Bacha and R. Teodorescu, “Using ecc feedback to guide voltagespeculation in low-voltage processors,” in 2014 47th Annual IEEE/ACMInternational Symposium on Microarchitecture, 2014, pp. 306–318.
[7] G. Papadimitriou, A. Chatzidimitriou, and D. Gizopoulos, “Adaptivevoltage/frequency scaling and core allocation for balanced energy andperformance on multicore cpus,” in 2019 IEEE International Symposiumon High Performance Computer Architecture (HPCA), 2019, pp. 133–146.
[8] K. Parasyris, P. Koutsovasilis, V. Vassiliadis, C. D. Antonopoulos,N. Bellas, and S. Lalis, “A framework for evaluating software on reducedmargins hardware,” in 2018 48th Annual IEEE/IFIP International Con-ference on Dependable Systems and Networks (DSN), 2018, pp. 330–337.
[9] G. Papadimitriou, M. Kaliorakis, A. Chatzidimitriou, D. Gizopoulos,P. Lawthers, and S. Das, “Harnessing voltage margins for energy effi-ciency in multicore cpus,” in 2017 50th Annual IEEE/ACM InternationalSymposium on Microarchitecture (MICRO), 2017, pp. 503–516.

11
[10] A. Bacha and R. Teodorescu, “Dynamic reduction of voltage marginsby leveraging on-chip ecc in itanium ii processors,” SIGARCH Comput.Archit. News, vol. 41, no. 3, p. 297–307, Jun. 2013. [Online]. Available:https://doi.org/10.1145/2508148.2485948
[11] A. Zou, J. Leng, X. He, Y. Zu, C. D. Gill, V. J. Reddi, andX. Zhang, “Voltage-stacked gpus: A control theory driven cross-layersolution for practical voltage stacking in gpus,” in Proceedings of the51st Annual IEEE/ACM International Symposium on Microarchitecture,ser. MICRO-51. IEEE Press, 2018, p. 390–402. [Online]. Available:https://doi.org/10.1109/MICRO.2018.00039
[12] B. Salami, E. B. Onural, I. E. Yuksel, F. Koc, O. Ergin, A. C. Kestel-man, O. S. Unsal, H. Sarbazi-Azad, and O. Mutlu, “An experimentalstudy of reduced-voltage operation in modern fpgas for neural networkacceleration,” 2020.
[13] B. Salami, O. S. Unsal, and A. C. Kestelman, “Evaluating built-in eccof fpga on-chip memories for the mitigation of undervolting faults,” in2019 27th Euromicro International Conference on Parallel, Distributedand Network-Based Processing (PDP). IEEE, 2019, pp. 242–246.
[14] B. Salami, O. Unsal, and A. Cristal, “Fault characterization throughfpga undervolting,” in 2018 28th International Conference on FieldProgrammable Logic and Applications (FPL). IEEE, 2018, pp. 85–853.
[15] B. Salami, “Aggressive undervolting of fpgas: power & reliability trade-offs,” 2018.
[16] B. Reagen, P. Whatmough, R. Adolf, S. Rama, H. Lee, S. K. Lee,J. M. Hernandez-Lobato, G. Wei, and D. Brooks, “Minerva: Enablinglow-power, highly-accurate deep neural network accelerators,” in 2016ACM/IEEE 43rd Annual International Symposium on Computer Archi-tecture (ISCA), 2016, pp. 267–278.
[17] N. Chandramoorthy, K. Swaminathan, M. Cochet, A. Paidimarri, S. El-dridge, R. V. Joshi, M. M. Ziegler, A. Buyuktosunoglu, and P. Bose,“Resilient low voltage accelerators for high energy efficiency,” in 2019IEEE International Symposium on High Performance Computer Archi-tecture (HPCA), 2019, pp. 147–158.
[18] J. Zhang, K. Rangineni, Z. Ghodsi, and S. Garg, “Thundervolt: enablingaggressive voltage underscaling and timing error resilience for energyefficient deep learning accelerators,” in Proceedings of the 55th AnnualDesign Automation Conference, 2018, pp. 1–6.
[19] K. K. Chang, A. G. Yaglıkcı, S. Ghose, A. Agrawal, N. Chatterjee,A. Kashyap, D. Lee, M. O’Connor, H. Hassan, and O. Mutlu,“Understanding reduced-voltage operation in modern dram devices:Experimental characterization, analysis, and mechanisms,” Proc. ACMMeas. Anal. Comput. Syst., vol. 1, no. 1, Jun. 2017. [Online]. Available:https://doi.org/10.1145/3084447
[20] H. David, C. Fallin, E. Gorbatov, U. R. Hanebutte, and O. Mutlu,“Memory power management via dynamic voltage/frequency scaling,”in Proceedings of the 8th ACM International Conference on AutonomicComputing, ser. ICAC ’11. New York, NY, USA: Associationfor Computing Machinery, 2011, p. 31–40. [Online]. Available:https://doi.org/10.1145/1998582.1998590
[21] Q. Deng, D. Meisner, L. Ramos, T. F. Wenisch, and R. Bianchini,“Memscale: Active low-power modes for main memory,” in Proceedingsof the Sixteenth International Conference on Architectural Support forProgramming Languages and Operating Systems, ser. ASPLOS XVI.New York, NY, USA: Association for Computing Machinery, 2011, p.225–238. [Online]. Available: https://doi.org/10.1145/1950365.1950392
[22] S. S. N. Larimi, B. Salami, O. S. Unsal, A. C. Kestelman, H. Sarbazi-Azad, and O. Mutlu, “Understanding power consumption and reliabilityof high-bandwidth memory with voltage underscaling,” 2020.
[23] L. Yang and B. Murmann, “Sram voltage scaling for energy-efficientconvolutional neural networks,” in 2017 18th International Symposiumon Quality Electronic Design (ISQED), 2017, pp. 7–12.
[24] L. Yang and B. Murmann, “Approximate sram for energy-efficient,privacy-preserving convolutional neural networks,” 2017 IEEE Com-puter Society Annual Symposium on VLSI (ISVLSI), pp. 689–694, 2017.
[25] Y. Cai, G. Yalcin, O. Mutlu, E. F. Haratsch, A. Crista, O. S. Unsal, andK. Mai, “Error analysis and retention-aware error management for nandflash memory.” Intel Technology Journal, vol. 17, no. 1, 2013.
[26] Y. Cai, S. Ghose, E. F. Haratsch, Y. Luo, and O. Mutlu, “Errorcharacterization, mitigation, and recovery in flash-memory-based solid-state drives,” Proceedings of the IEEE, vol. 105, no. 9, pp. 1666–1704,2017.
[27] Y. Cai, E. F. Haratsch, O. Mutlu, and K. Mai, “Error patterns in mlcnand flash memory: Measurement, characterization, and analysis,” in2012 Design, Automation Test in Europe Conference Exhibition (DATE),2012, pp. 521–526.
[28] Y. Cai, Y. Luo, S. Ghose, and O. Mutlu, “Read disturb errors in mlc nandflash memory: Characterization, mitigation, and recovery,” in 2015 45thAnnual IEEE/IFIP International Conference on Dependable Systems andNetworks, 2015, pp. 438–449.
[29] C. Torres-Huitzil and B. Girau, “Fault and error tolerance in neuralnetworks: A review,” IEEE Access, vol. 5, pp. 17 322–17 341, 2017.
[30] J. Deng, Y. Fang, Z. Du, Y. Wang, H. Li, O. Temam, P. Ienne, D. Novo,X. Li, Y. Chen, and C. Wu, “Retraining-based timing error mitigation forhardware neural networks,” in 2015 Design, Automation Test in EuropeConference Exhibition (DATE), 2015, pp. 593–596.
[31] B. Salami., “FPGA BRAMs Undervolting Study,” https://github.com/behzadsalami/FPGA-BRAMs-Undervoltig-Study, 2018.
[32] A. Chatzidimitriou, G. Papadimitriou, D. Gizopoulos, S. Ganapathy,and J. Kalamatianos, “Analysis and characterization of ultra low powerbranch predictors,” in 2018 IEEE 36th International Conference onComputer Design (ICCD), 2018, pp. 144–147.
[33] B. Salami, O. S. Unsal, and A. C. Kestelman, “On the resilienceof rtl nn accelerators: Fault characterization and mitigation,” in 201830th International Symposium on Computer Architecture and HighPerformance Computing (SBAC-PAD), 2018, pp. 322–329.
[34] S. Koppula, L. Orosa, A. G. Yaglıkcı, R. Azizi, T. Shahroodi,K. Kanellopoulos, and O. Mutlu, “Eden: Enabling energy-efficient,high-performance deep neural network inference using approximatedram,” in Proceedings of the 52nd Annual IEEE/ACM InternationalSymposium on Microarchitecture, ser. MICRO ’52. New York, NY,USA: Association for Computing Machinery, 2019, p. 166–181.[Online]. Available: https://doi.org/10.1145/3352460.3358280
[35] Y. Lecun, L. Bottou, Y. Bengio, and P. Haffner, “Gradient-based learningapplied to document recognition,” Proceedings of the IEEE, vol. 86,no. 11, pp. 2278–2324, 1998.
[36] A. Krizhevsky., “cuda-convnet,” https://github.com/akrizhevsky/cuda-convnet2, 2014.
[37] M. Sabbagh, C. Gongye, Y. Fei, and Y. Wang, “Evaluating faultresiliency of compressed deep neural networks,” in 2019 IEEE Interna-tional Conference on Embedded Software and Systems (ICESS), 2019,pp. 1–7.
[38] G. Li, S. K. S. Hari, M. Sullivan, T. Tsai, K. Pattabiraman, J. Emer,and S. W. Keckler, “Understanding error propagation in deep learningneural network (dnn) accelerators and applications,” in Proceedingsof the International Conference for High Performance Computing,Networking, Storage and Analysis, ser. SC ’17. New York, NY,USA: Association for Computing Machinery, 2017. [Online]. Available:https://doi.org/10.1145/3126908.3126964
[39] P. Upadhyay, S. Ghosh, R. Kar, D. Mandal, and S. P. Ghoshal, “Lowstatic and dynamic power mtcmos based 12t sram cell for high speedmemory system,” in 2014 11th International Joint Conference onComputer Science and Software Engineering (JCSSE), 2014, pp. 212–217.
[40] T. Azam, B. Cheng, and D. R. S. Cumming, “Variability resilientlow-power 7t-sram design for nano-scaled technologies,” in 2010 11thInternational Symposium on Quality Electronic Design (ISQED), 2010,pp. 9–14.
[41] G. Chen, D. Sylvester, D. Blaauw, and T. Mudge, “Yield-driven near-threshold sram design,” IEEE Transactions on Very Large Scale Inte-gration (VLSI) Systems, vol. 18, no. 11, pp. 1590–1598, 2010.
[42] J. Leng, A. Buyuktosunoglu, R. Bertran, P. Bose, and V. J. Reddi, “Safelimits on voltage reduction efficiency in gpus: A direct measurementapproach,” in 2015 48th Annual IEEE/ACM International Symposiumon Microarchitecture (MICRO), 2015, pp. 294–307.
[43] A. Chatzidimitriou, G. Panadimitriou, D. Gizopoulos, S. Ganapathy, andJ. Kalamatianos, “Assessing the effects of low voltage in branch pre-diction units,” in 2019 IEEE International Symposium on PerformanceAnalysis of Systems and Software (ISPASS), 2019, pp. 127–136.
[44] L. Riviere, Z. Najm, P. Rauzy, J. Danger, J. Bringer, and L. Sauvage,“High precision fault injections on the instruction cache of armv7-marchitectures,” in 2015 IEEE International Symposium on HardwareOriented Security and Trust (HOST), 2015, pp. 62–67.
[45] M. Kaliorakis, S. Tselonis, A. Chatzidimitriou, N. Foutris, and D. Gi-zopoulos, “Differential fault injection on microarchitectural simulators,”in 2015 IEEE International Symposium on Workload Characterization,2015, pp. 172–182.
[46] Y. Lecun and C. Cortes, “The MNIST database of handwritten digits.”http://yann.lecun.com/exdb/mnist/, 1999.
[47] A. Krizhevsky, V. Nair, and G. Hinton, “he CIFAR-10 dataset,” https://www.cs.toronto.edu/∼kriz/cifar.html.
[48] A. Zhou, A. Yao, Y. Guo, L. Xu, and Y. Chen, “Incremental networkquantization: Towards lossless cnns with low-precision weights,” 2017.

12
[49] S. Han, X. Liu, H. Mao, J. Pu, A. Pedram, M. A. Horowitz, andW. J. Dally, “Eie: Efficient inference engine on compressed deep neuralnetwork,” 2016.
[50] Z. Zhu, H. Sun, Y. Lin, G. Dai, L. Xia, S. Han, Y. Wang, andH. Yang, “A configurable multi-precision cnn computing frameworkbased on single bit rram,” in Proceedings of the 56th Annual DesignAutomation Conference 2019, ser. DAC ’19. New York, NY, USA:Association for Computing Machinery, 2019. [Online]. Available:https://doi.org/10.1145/3316781.3317739
[51] P. Molchanov, S. Tyree, T. Karras, T. Aila, and J. Kautz, “Pruningconvolutional neural networks for resource efficient inference,” 2017.
[52] R. Yazdani, M. Riera, J. Arnau, and A. Gonzalez, “The dark side of dnnpruning,” in 2018 ACM/IEEE 45th Annual International Symposium onComputer Architecture (ISCA), 2018, pp. 790–801.
[53] S. Han, J. Pool, J. Tran, and W. J. Dally, “Learning both weights andconnections for efficient neural networks,” 2015.
[54] Y. Shen, M. Ferdman, and P. Milder, “Escher: A cnn acceleratorwith flexible buffering to minimize off-chip transfer,” in 2017 IEEE25th Annual International Symposium on Field-Programmable CustomComputing Machines (FCCM), 2017, pp. 93–100.
[55] C. Deng, S. Liao, Y. Xie, K. K. Parhi, X. Qian, and B. Yuan, “Permdnn:Efficient compressed dnn architecture with permuted diagonal matrices,”2020.
[56] Y. Shen, M. Ferdman, and P. Milder, “Maximizing cnn acceleratorefficiency through resource partitioning,” 2018.
[57] C. Zhang, P. Li, G. Sun, Y. Guan, B. Xiao, and J. Cong, “Optimizingfpga-based accelerator design for deep convolutional neural networks,”in Proceedings of the 2015 ACM/SIGDA International Symposiumon Field-Programmable Gate Arrays, ser. FPGA ’15. New York,NY, USA: Association for Computing Machinery, 2015, p. 161–170.[Online]. Available: https://doi.org/10.1145/2684746.2689060
[58] M. Riera, J. Arnau, and A. Gonzalez, “Computation reuse in dnns by ex-ploiting input similarity,” in 2018 ACM/IEEE 45th Annual InternationalSymposium on Computer Architecture (ISCA), 2018, pp. 57–68.
[59] M. Courbariaux and Y. Bengio, “Binarynet: Training deep neuralnetworks with weights and activations constrained to +1 or -1,” CoRR, vol. abs/1602.02830, 2016. [Online]. Available: http://arxiv.org/abs/1602.02830
[60] B. Jacob, S. Kligys, B. Chen, M. Zhu, M. Tang, A. G. Howard, H. Adam,and D. Kalenichenko, “Quantization and training of neural networks forefficient integer-arithmetic-only inference,” CoRR, vol. abs/1712.05877,2017. [Online]. Available: http://arxiv.org/abs/1712.05877
[61] J. Wu, C. Leng, Y. Wang, Q. Hu, and J. Cheng, “Quantized convolutionalneural networks for mobile devices,” CoRR, vol. abs/1512.06473, 2015.[Online]. Available: http://arxiv.org/abs/1512.06473
[62] K. Ueyoshi, K. Ando, K. Hirose, S. Takamaeda-Yamazaki, J. Kadomoto,T. Miyata, M. Hamada, T. Kuroda, and M. Motomura, “Quest: A7.49tops multi-purpose log-quantized dnn inference engine stacked on96mb 3d sram using inductive-coupling technology in 40nm cmos,” in2018 IEEE International Solid - State Circuits Conference - (ISSCC),2018, pp. 216–218.
[63] B. Reagen, U. Gupta, L. Pentecost, P. Whatmough, S. K. Lee, N. Mul-holland, D. Brooks, and G. Wei, “Ares: A framework for quantifyingthe resilience of deep neural networks,” in 2018 55th ACM/ESDA/IEEEDesign Automation Conference (DAC), 2018, pp. 1–6.
[64] Y. Jia, E. Shelhamer, J. Donahue, S. Karayev, J. Long, R. Girshick,S. Guadarrama, and T. Darrell, “Caffe: Convolutional architecture forfast feature embedding,” in Proceedings of the 22nd ACM InternationalConference on Multimedia, ser. MM ’14. New York, NY, USA:Association for Computing Machinery, 2014, p. 675–678. [Online].Available: https://doi.org/10.1145/2647868.2654889
[65] M. Milde, D. Neil, A. Aimar, T. Delbruck, and G. Indiveri, “Adaption:Toolbox and benchmark for training convolutional neural networks withreduced numerical precision weights and activation,” 11 2017.
[66] NVIDIA., “NVIDIA-caffe extension,” https://github.com/NVIDIA/caffe,2017.
[67] P. Micikevicius, S. Narang, J. Alben, G. Diamos, E. Elsen, D. Garcia,B. Ginsburg, M. Houston, O. Kuchaiev, G. Venkatesh et al., “Mixedprecision training,” arXiv preprint arXiv:1710.03740, 2017.
[68] S. Markidis, S. W. Der Chien, E. Laure, I. B. Peng, and J. S. Vetter,“Nvidia tensor core programmability, performance & precision,” in 2018IEEE International Parallel and Distributed Processing SymposiumWorkshops (IPDPSW). IEEE, 2018, pp. 522–531.
[69] A. S. Rakin, Z. He, J. Li, F. Yao, C. Chakrabarti, and D. Fan, “T-bfa:Targeted bit-flip adversarial weight attack,” 2021.
[70] Z. He, A. S. Rakin, J. Li, C. Chakrabarti, and D. Fan, “Defendingand harnessing the bit-flip based adversarial weight attack,” in 2020
IEEE/CVF Conference on Computer Vision and Pattern Recognition(CVPR), 2020, pp. 14 083–14 091.
[71] A. S. Rakin, Z. He, and D. Fan, “Bit-flip attack: Crushing neural networkwith progressive bit search,” 2019.
[72] Y. Liu, L. Wei, B. Luo, and Q. Xu, “Fault injection attack on deep neuralnetwork,” in 2017 IEEE/ACM International Conference on Computer-Aided Design (ICCAD), 2017, pp. 131–138.
[73] M. S. Kelly, K. Mayes, and J. F. Walker, “Characterising a cpu faultattack model via run-time data analysis,” in 2017 IEEE InternationalSymposium on Hardware Oriented Security and Trust (HOST), 2017,pp. 79–84.
[74] G. Li, S. K. S. Hari, M. Sullivan, T. Tsai, K. Pattabiraman, J. Emer,and S. W. Keckler, “Understanding error propagation in deep learningneural network (dnn) accelerators and applications,” in Proceedingsof the International Conference for High Performance Computing,Networking, Storage and Analysis, ser. SC ’17. New York, NY,USA: Association for Computing Machinery, 2017. [Online]. Available:https://doi.org/10.1145/3126908.3126964
[75] M. A. Neggaz, I. Alouani, P. R. Lorenzo, and S. Niar, “A reliability studyon cnns for critical embedded systems,” in 2018 IEEE 36th InternationalConference on Computer Design (ICCD), 2018, pp. 476–479.
[76] A. H. Salavati and A. Karbasi, “Multi-level error-resilient neural net-works,” in 2012 IEEE International Symposium on Information TheoryProceedings, 2012, pp. 1064–1068.
[77] D. Stutz, N. Chandramoorthy, M. Hein, and B. Schiele, “Bit errorrobustness for energy-efficient dnn accelerators,” 2020.
[78] S. Ganapathy, J. Kalamatianos, K. Kasprak, and S. Raasch, “On charac-terizing near-threshold sram failures in finfet technology,” in 2017 54thACM/EDAC/IEEE Design Automation Conference (DAC), 2017, pp. 1–6.
[79] K. Givaki, B. Salami, R. Hojabr, S. R. Tayaranian, A. Khonsari,D. Rahmati, S. Gorgin, A. Cristal, and O. S. Unsal, “On the resilienceof deep learning for reduced-voltage fpgas,” in 2020 28th EuromicroInternational Conference on Parallel, Distributed and Network-BasedProcessing (PDP). IEEE, 2020, pp. 110–117.
Ismail Emir Yuksel is an MSc student and re-searcher in the Computer Engineering Departmentof TOBB University of Economics and Technology(TOBB ETU). He received his BSc in ElectricalElectronics Engineering from TOBB University ofEconomics and Technology in 2019. His researchinterests are energy-efficient heterogeneous comput-ing and low-power & fault-resilient hardware accel-erators.
Behzad Salami is a post-doctoral researcher in theComputer Science (CS) department of BarcelonaSupercomputing Center (BSC) and an affiliated re-search member of SAFARI Research Group at ETHZurich. He received his Ph.D. with honors in Com-puter Architecture from Universitat Politecnica deCatalunya (UPC) in 2018. Also, he obtained MScand BSc degrees in Computer Engineering fromAmirkabir University of Technology (AUT) andIran University of Science and Technology (IUST),respectively. He has received mutiple awards and
grants for his research. His research interests are heterogeneous systems,low-power & fault-resilient hardware accelerators, and near-data processingsystems. Contact him at: [email protected]

13
Oguz Ergin is a professor in the department of com-puter engineering in TOBB University of Economicsand Technology. He received his BS in electrical andelectronics engineering from Middle East TechnicalUniversity, MS, and Ph.D. in computer science fromthe State University of New York at Binghamton.He was a senior research scientist in Intel BarcelonaResearch Center prior to joining TOBB ETU. Heis currently leading a research group in TOBBETU working on energy-efficient, reliable, and high-performance computer architectures.
Osman Sabri Unsal is co-manager of the ParallelParadigms for Computer Architecture research groupat Barcelona Supercomputing Center (BSC). Hegot his B.S., M.S., and Ph.D. in Computer Engi-neering from Istanbul Technical University, BrownUniversity, and the University of Massachusetts,Amherst respectively. His current research interestsare in computer architecture, fault-tolerance, energy-efficiency, and heterogeneous computing. He is cur-rently leading LEGaTO EU H2020 research projecton heterogeneous energy-efficiency computing.
Adrian Cristal Kestelman received the Licen-ciatura degree in Computer Science from the Fac-ulty of Exact and Natural Sciences, Universidad deBuenos Aires, Buenos Aires, Argentina, in 1995, andthe Ph.D. degree in Computer Science from the Uni-versitat Politecnica de Catalunya (UPC), Barcelona,Spain. Since 2006, he is a co-manager of the Com-puter Architecture for Parallel Paradigms ResearchGroup at Barcelona Supercomputing Center (BSC).His current research interests include the areas ofmicroarchitecture, multicore, and heterogeneous ar-
chitectures, and programming models for multicore architectures. Currently,he is leading the architecture development of the vector processor unit in theEuropean Processor Initiative.