mortgage servicing rights (msr) - two...
TRANSCRIPT

Mortgage Servicing Rights (MSR) Primer
December 6 , 2016

Safe Harbor Statement
F O R W A R D - L O O K I N G S T A T E M EN T S
This presentation includes “forward-looking statements” within the meaning of the safe harbor provisions of the United States Private Securities Litigation Reform Act
of 1995. Actual results may differ from expectations, estimates and projections and, consequently, readers should not rely on these forward-looking statements as
predictions of future events. Words such as “expect,” “target,” “assume,” “estimate,” “project,” “budget,” “forecast,” “anticipate,” “intend,” “plan,” “may,” “will,”
“could,” “should,” “believe,” “predicts,” “potential,” “continue,” and similar expressions are intended to identify such forward-looking statements. These forward-
looking statements involve significant risks and uncertainties that could cause actual results to differ materially from expected results, including, among other things,
those described in our Annual Report on Form 10-K for the year ended December 31, 2015, and any subsequent Quarterly Reports on Form 10-Q, under the caption
“Risk Factors.” Factors that could cause actual results to differ include, but are not limited to: the state of credit markets and general economic conditions; changes in
interest rates and the market value of our assets; changes in prepayment rates of mortgages underlying our target assets; the rates of default or decreased recovery
on the mortgages underlying our target assets; the occurrence, extent and timing of credit losses within our portfolio; the concentration of credit risks we are exposed
to; declines in home prices; our ability to establish, adjust and maintain appropriate hedges for the risks in our portfolio; the availability and cost of our target assets;
the availability and cost of financing; changes in the competitive landscape within our industry; our ability to successfully implement new strategies and to diversify our
business into new asset classes; our ability to manage various operational risks and costs associated with our business; interruptions in or impairments to our
communications and information technology systems; our ability to successfully securitize or sell mortgage loans; our ability to acquire mortgage servicing rights (MSR)
and successfully operate our seller-servicer subsidiary and oversee our subservicers; the impact of any deficiencies in the servicing or foreclosure practices of third
parties and related delays in the foreclosure process; the state of commercial real estate markets and our ability to acquire or originate commercial real estate loans
or related assets; our exposure to legal and regulatory claims; legislative and regulatory actions affecting our business; the impact of new or modified government
mortgage refinance or principal reduction programs; our ability to maintain our REIT qualification; and limitations imposed on our business due to our REIT status and
our exempt status under the Investment Company Act of 1940.
Readers are cautioned not to place undue reliance upon any forward-looking statements, which speak only as of the date made. Two Harbors does not undertake or
accept any obligation to release publicly any updates or revisions to any forward-looking statement to reflect any change in its expectations or any change in events,
conditions or circumstances on which any such statement is based. Additional information concerning these and other risk factors is contained in Two Harbors’ most
recent filings with the Securities and Exchange Commission (SEC). All subsequent written and oral forward-looking statements concerning Two Harbors or matters
attributable to Two Harbors or any person acting on its behalf are expressly qualified in their entirety by the cautionary statements above.
This presentation may include industry and market data obtained through research, surveys, and studies conducted by third parties and industry publications. We
have not independently verified any such market and industry data from third-party sources. This presentation is provided for discussion purposes only and may not be
relied upon as legal or investment advice, nor is it intended to be inclusive of all the risks and uncertainties that should be considered. This presentation does not
constitute an offer to purchase or sell any securities, nor shall it be construed to be indicative of the terms of an offer that the parties or their respective affiliates
would accept.
Readers are advised that the financial information in this presentation is based on company data available at the time of this presentation and, in certain
circumstances, may not have been audited by the company’s independent auditors.
2

Two Harbors Overview

Two Harbors Investment Corp. Overview (1)
LEADING HYBRID MORTGAGE REIT FOCUSED ON DRIVING STRONG LONG -TERM
RETURNS WHILE TAKING LESS RISK
4
1) Data as of September 30, 2016.
2) Two Harbors’ total stockholder return is calculated for the period October 29, 2009 through September 30, 2016. Total stockholder return is defined as stock price appreciation including dividends. Source: Bloomberg
3) Bloomberg REIT Mortgage Index total stockholder return for the period October 29, 2009 through September 30, 2016. The Bloomberg REIT Mortgage Index tracks publicly traded REITs whose principal business consists of
originating, servicing or investing in residential mortgage interests. The index uses a modified market capitalization weighted methodology, and components are reviewed quarterly for eligibility. Source: Bloomberg..
OVERVIEW PROVEN STRATEGY
• Equity market capitalization of approximately
$3.0 billion
• Portfolio of $17.0 billion
• Target assets include Agency and non-Agency
residential mortgage-backed securities (RMBS),
MSR and commercial real estate assets
• Experienced management team with deep
expertise and experience in managing mortgage
credit, interest rate and prepayment risk
• Diversified business model takes advantage of
evolving mortgage finance landscape
• Opportunistically allocate capital to drive long-
term stockholder value
• Disciplined risk management drives high quality
returns with lower volatility
-20.0%
20.0%
60.0%
100.0%
140.0%
180.0%
TWO BBG REIT MTG Index
132%
88%
(3) (2)

11.2% 10.3%
11.3% 11.0%
13.6%
11.9% 13.0%
12.0%
0.0%
6.0%
12.0%
18.0%
2013 2014 2015 2016-YTD 2013 2014 2015 2016-YTD
… L E S S I N T E R E ST R AT E R I S K (3 ) . . .
Attractive Returns With Lower Risk
5
AT T R AC T I VE & C O M PA R A BLE D I V I D E ND Y I E L D (1 ) … W I T H LOW E R L E V E R AG E (2 ) . . .
SUPERIOR ASSET SELECTION AND RISK MANAGEMENT DRIVE RETURNS WITH LESS RISK
TWO Peer Average TWO Peer Average
TWO Peer Average
… A N D L E S S P R E PAY M E NT E X P O S U R E (4 )
TWO Peer Average Note: Two Harbors and peer financial data for Dividend Yield, Leverage, Prepayment Risk and Interest Rate Exposure on this slide is based on available financial information as of September 30, 2016 as filed with the SEC. Peers include AGNC, ANH, ARR, CMO, CYS, IVR, MFA , NLY and HTS (financial
information for HTS is included in peer financial data only for the periods ending prior to the second quarter of 2016).
1) Represents average of annualized yields on all quarterly cash dividends per respective fiscal year. Two Harbors’ first quarter 2013 dividend yield used in annual average calculation was based on cash dividend of $0.32 per share and does not include Silver Bay Realty Trust common stock distribution of
$1.01 per share. Annualized yields for each quarter are calculated by dividing annualized quarterly dividends by closing share price as of respective quarter-ends. Peer dividend data based on peer company press releases. Historical dividends may not be indicative of future dividend distributions. Our
company ultimately distributes dividends based on its taxable income per share of common stock.
2) Represents average of debt-to-equity ratios for all reportable quarters per respective fiscal year. Debt-to-equity is defined as total borrowings to fund residential mortgage-backed securities (RMBS), residential mortgage loans held-for-sale, commercial real estate assets, MSR and Agency Derivatives
divided by total equity.
3) Represents average of estimated change in equity value for theoretical +100bps parallel shift in interest rates for all reportable quarters per respective fiscal year. Change in equity market capitalization is adjusted for leverage.
4) Represents average of the constant prepayment rate (CPR) on Agency RMBS, including Agency Derivatives, for all reportable quarters per respective fiscal year.
3.2x 3.0x 3.0x
3.7x
6.9x 6.4x 6.6x
6.2x
0.0x
2.0x
4.0x
6.0x
8.0x
2013 2014 2015 2016-YTD 2013 2014 2015 2016-YTD
8.1% 7.6%
9.3% 9.2%
15.0%
11.2%
13.5% 14.3%
0.0%
5.0%
10.0%
15.0%
20.0%
2013 2014 2015 2016-YTD 2013 2014 2015 2016-YTD
1.8%
-1.0%
-3.2% -3.5%
-11.7%
-8.2%
-6.7% -6.0%
-15.0%
-10.0%
-5.0%
0.0%
5.0%
2013 2014 2015 2016-YTD 2013 2014 2015 2016-YTD

MSR PORTFOLIO AT A GLANCE (5) TOTAL PORTFOLIO COMPOSITION
Two Harbors’ Portfolio Composition
6
$17.0 BILLION PORTFOLIO AS OF SEPTEMBER 30, 2016
1) Commercial consists of senior and mezzanine commercial real estate debt and related instruments.
2) MSR includes Ginnie Mae buyout residential mortgage loans.
3) Assets in “Rates” include Agency RMBS, Agency Derivatives, MSR and Ginnie Mae buyout residential mortgage loans.
4) Assets in “Credit” include non-Agency RMBS, prime jumbo residential mortgage loans, net economic interest in securitization trusts and credit sensitive residential mortgage loans.
5) Excludes residential mortgage loans held-for-investment in securitization trusts for which the company is the named servicing administrator.
6) FICO represents a mortgage industry accepted credit score of a borrower.
Commercial(1)
$1.1b
MSR PORTFOLIO COMPRISED OF HIGH QUALIT Y, NEW ISSUE, CONVENTIONAL MSR
MSR(2)
$0.5b
Conduit
$0.9b
Rates(3) $13.1b Credit(4) $2.8b Commercial $1.1b
As of September 30, 2016
Fair value ($M) $455.6
Unpaid principal balance ($M) $55,080.9
Weighted average coupon 3.9 %
Original FICO score(6) 757
Original LTV 72 %
60+ day delinquencies 0.3 %
Net servicing spread 25.4 basis points
Vintage:
Pre-2009 0.7 %
2009-2012 28.4 %
Post 2012 70.9 %
Percent of MSR portfolio:
Conventional 99.7 %
Government FHA 0.3 %
Government VA/USDA — %
Agency
$10.3b
Non-Agency
$1.9b
Agency paired
with MSR
$2.3b

7
Webinar Executive Summary
1) Illustrative returns reflective of a duration neutral position. See slide 20 for further detail on these two illustrative portfolios.
Note: The above scenarios are intended to illustrate the potential benefits of hedging Agency RMBS with MSR. The numbers used in the scenarios above are hypothetical amounts and are not based on our financial results, nor are they projections
of our results. The above scenarios are provided for illustration purposes only and may not represent all assumptions used. Actual results of a portfolio may differ.
Expected
Gross Return
on Equity
(ROE)(1)
Debt-to-Equity Impact of 20 Basis Point
Rate Increase Impact of 20 Basis Point
RMBS Spread Widening
RMBS + Swap 8-10% 8.0 0% (9%)
RMBS + MSR 12-14% 4.2 0% 0 %
MSR ARE A NATURAL
HEDGE TO RMBS…
…HAVE HIGHER RETURN
POTENTIAL…
…WITH LOWER MORTGAGE
SPREAD RISK…
…AND LOWER LEVERAGE.
A PORTFOLIO OF RMBS AND MSR HAS HIGHER RETURN POTENTIAL, WITH LOWER
MORTGAGE SPREAD RISK, AND LOWER LEVERAGE

MSR Overview

9
What are Mortgage Servicing Rights?
MSR ARE THE CONTRACTUAL RIGHTS TO PERFORM AND CONTROL SERVIC ING OF A
MORTGAGE LOAN IN EXCHANGE FOR A SERVIC ING FEE
• Servicing responsibilities include: collecting principal and interest (P&I) payments, holding escrow funds, paying taxes and insurance
(T&I) payments
• All types of loans need servicing including: residential, commercial, student, credit card and car loans
― Focus on residential conforming MSR at Two Harbors
• High barriers to entry for becoming an MSR owner(1)
MSR ARE A NATURAL
HEDGE TO RMBS…
…HAVE HIGHER RETURN POTENTIAL…
…WITH LOWER MORTGAGE SPREAD
RISK…
…AND LOWER LEVERAGE
T YPES OF MSR ORIGINATION CHANNEL
Legacy
― Originated
pre-crisis
― Sensitive
primarily to
credit
performance
― Higher touch
and cost to
service
New Issue
― Originated
post-crisis
― Sensitive
primarily to
prepays
― Low cost to
service
Flow
― Sells MSR on a
regular basis as
it is created
― Sales are
monthly for a
period of time
― Prices are
determined daily
according to
market rates
and spreads are
reset quarterly
Bulk
― Seller
aggregates a
substantial
amount of MSR
― Sells in a single
transaction
― Price is
determined by
the market on
bid date
TWO HARBORS’ FOCUS TWO HARBORS’ FOCUS
1) Continued status as an approved servicer by the GSEs or Ginnie Mae is subject to compliance with each of their respective selling and servicing guidelines, minimum capital requirements and other conditions they may impose from time to
time at their discretion.

MSR Provide Different Benefits to Different Participants
10
Who? What? Why?
Banks New, high quality, rate-sensitive MSR,
including both GSE and Ginnie
• MSR provide a hedge to the origination
business
• When rates fall (rise), MSR values fall
(rise) but origination fees increase
(decrease)
• Financial instruments are rarely utilized
to hedge
Mortgage Companies Legacy, credit-sensitive, non-rate-
sensitive MSR
• Portfolio can be mined to extract
refinance and modification
opportunities
• No financial instruments generally
utilized to hedge
Financial Investors New, high quality, rate-sensitive, primarily
GSE MSR
• MSR provide a financial hedge to other
securities held in portfolio
• Financial instruments also used
extensively to hedge
T YPICAL MSR HOLDERS AND INVESTORS
MSR ARE A NATURAL
HEDGE TO RMBS…
…HAVE HIGHER RETURN POTENTIAL…
…WITH LOWER MORTGAGE SPREAD
RISK…
…AND LOWER LEVERAGE
TWO HARBORS’ FOCUS

11
Current Market Overview
MSR MARKET IS LARGE AND RAPIDLY EVOLVING • Volume opportunities abundant; cumulative volume of new issue MSR expected to exceed $1.0 trillion unpaid principal balance
(UPB) in 2016(1)
• The top 25 servicers of GSE-backed loans comprise roughly 80% of the entire universe(2)
• Non-bank servicers have grown significantly in recent years
• Matrix Financial Services Corporation, a wholly-owned subsidiary of Two Harbors, is ranked #18 by conventional servicing volume
TRANSACTION VOLUME (1) GSE SERVICING VOLUME (2)
$-
$0.5
$1.0
$1.5
$2.0
$2.5
$3.0
$3.5
$4.0
$4.5
$-
$200.0
$400.0
$600.0
$800.0
$1,000.0
$1,200.0
We
lls
Ch
ase
BO
A
US
B
Na
tio
nsta
r
Qu
icke
n
Pe
nn
yma
c
Dit
ech
Cit
i
La
ke
vie
w
Su
nTru
st
PN
C
PH
H
Pin
go
ra
Fre
ed
om
BB
T
Ca
lib
er
Ma
trix
Pro
vid
en
t
Fif
th T
hir
d
Se
ne
ca
Ocw
en
Ce
ntr
al
Ro
un
dp
oin
t
Am
eri
ho
me
Cu
mu
lati
ve V
olu
me
s (
$T)
Co
nve
nti
on
al a
nd
Go
vern
me
nt
Vo
lum
es (
$B
)
Conventional Government Cumulative
1) Source: Based on Two Harbors’ internal research as of September 30, 2016.
2) Source: CPR & CDR Technologies, Inc. as of October 17, 2016.
MSR ARE A NATURAL
HEDGE TO RMBS…
…HAVE HIGHER RETURN POTENTIAL…
…WITH LOWER MORTGAGE SPREAD
RISK…
…AND LOWER LEVERAGE
0
100
200
300
400
500
600
700
800
900
1,000
0
10
20
30
40
50
60
70
80
90
100
Cu
mu
lati
ve V
olu
me
($
B)
Mo
nth
ly V
olu
me
($
B)
Conventional UPB Government UPB
Cumulative Conventional UPB Cumulative Government UPB

How are MSR Made?
12
• The Net Servicing Fee for MSR is the difference between the Gross Servicing Fee less the fee paid to the
GSEs or Ginnie to guarantee the mortgage.
― Additionally, in many cases the holder of MSR has the right to receive float income on principal and interest, taxes,
insurance, late fees and ancillary income before payments are remitted to the GSEs.
MSR EXAMPLE
MSR ARE A NATURAL
HEDGE TO RMBS…
…HAVE HIGHER RETURN POTENTIAL…
…WITH LOWER MORTGAGE SPREAD
RISK…
…AND LOWER LEVERAGE
Borrower pays 3.75%
50 basis points
guarantee fee to GSEs
25 basis points
servicing fee to MSR owner
3.00% pass-through
to security holders
5 basis points
cost to service/
sub-service
20 basis points net fee held by
MSR owner

MSR Are More Than Just Interest-Only
13
• MSR are “interest-only” (IO) in the sense that when the loan goes away, the MSR goes away; the longer
the mortgage is outstanding, the longer the investor receives MSR cash flows.
• Unlike IO securities, there are “other components” that an MSR holder enjoys.
• 80-90% of MSR value is derived from the Net Servicing Fee (the IO component of the MSR cash flow).
• 10%-20% of MSR value comes from “other components”:
MSR ARE A NATURAL
HEDGE TO RMBS…
…HAVE HIGHER RETURN POTENTIAL…
…WITH LOWER MORTGAGE SPREAD
RISK…
…AND LOWER LEVERAGE
MSR Component(1) Price Interest Rate Sensitivity
Net Servicing Fee 117% 53%
Cost to Service (26%) (13%)
Taxes & Insurance (T&I) Float 10% 42%
Unscheduled Principal & Interest
(P&I) Float 2% 7%
Scheduled P&I Float 2% 3%
Compensating Interest (5%) 7%
Total 100% 100%
Pure IO
components
Other
Components
1) Table shows the relative amounts of value contained in a typical pool of MSR with 3.75% gross weighted average coupon, 25 basis points servicing fee, $7.25 per loan per month cost to service,
scheduled/scheduled remit type, and 1.5% average T&I balance. For more details, see Aldrich, Greenberg, and Payner, “A Capital Markets View of Mortgage Servicing Rights”, Journal of Fixed Income,
June 2001 (37).

Cash Flows Overview
Illustrative Treasury Cash Flow Scenarios
15
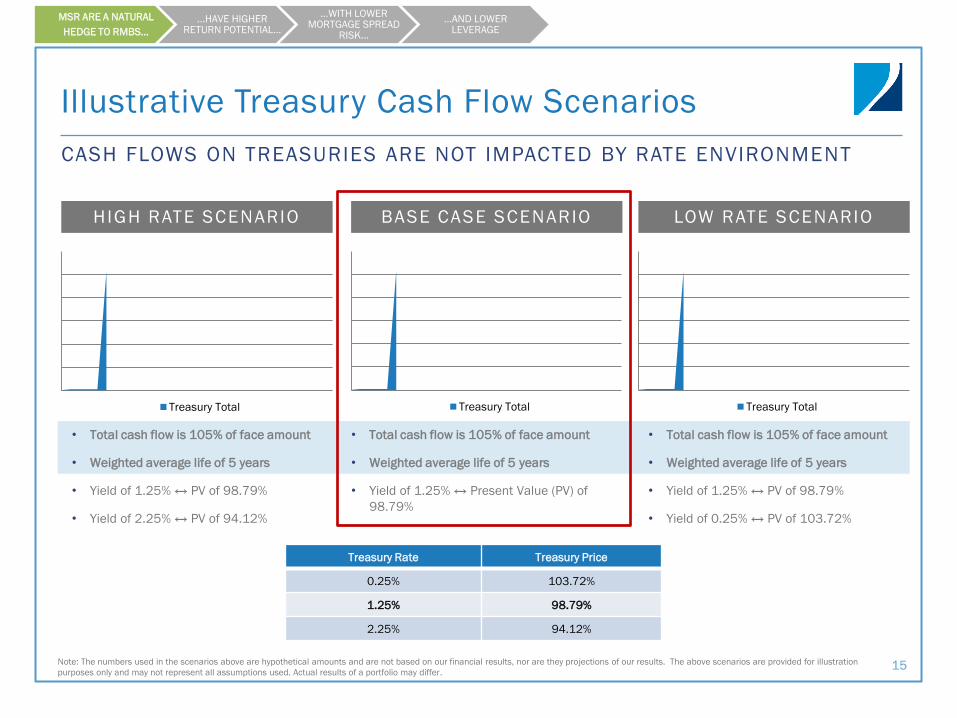
CASH FLOWS ON TREASURIES ARE NOT IMPACTED BY RATE ENVIRONMENT
HIGH RATE SCENARIO BASE CASE SCENARIO LOW RATE SCENARIO
• Total cash flow is 105% of face amount
• Weighted average life of 5 years
• Yield of 1.25% ↔ PV of 98.79%
• Yield of 2.25% ↔ PV of 94.12%
• Total cash flow is 105% of face amount
• Weighted average life of 5 years
• Yield of 1.25% ↔ Present Value (PV) of
98.79%
• Total cash flow is 105% of face amount
• Weighted average life of 5 years
• Yield of 1.25% ↔ PV of 98.79%
• Yield of 0.25% ↔ PV of 103.72%
Treasury Rate Treasury Price
0.25% 103.72%
1.25% 98.79%
2.25% 94.12%
Treasury Total Treasury Total Treasury Total
MSR ARE A NATURAL
HEDGE TO RMBS…
…HAVE HIGHER RETURN POTENTIAL…
…WITH LOWER MORTGAGE SPREAD
RISK…
…AND LOWER LEVERAGE
Note: The numbers used in the scenarios above are hypothetical amounts and are not based on our financial results, nor are they projections of our results. The above scenarios are provided for illustration
purposes only and may not represent all assumptions used. Actual results of a portfolio may differ.

Illustrative RMBS Cash Flow Scenarios
16
CHANGING RATE ENVIRONMENTS INFLUENCE AVERAGE LIFE AND YIELD OF R MBS
• Effect of changing discount rate dominates the effect of changing prepayments
HIGH RATE SCENARIO BASE CASE SCENARIO LOW RATE SCENARIO
• Total P&I is 130.0% of face amount
• Weighted average life of 10.0 years
• Yield of 2.25% ↔ PV of 106.32%
• Yield of 3.25% ↔ PV of 98.04%
• Total P&I is 119.2% of face amount
• Weighted average life of 6.4 years
• Yield of 2.25% ↔ PV of 104.24%
• Total P&I is 110.2% of face amount
• Weighted average life of 3.4 years
• Yield of 2.25% ↔ PV of 102.38%
• Yield of 1.25% ↔ PV of 105.72%
Underlying Principal Underlying Interest MSR Total Underlying Principal Underlying Interest MSR Total Underlying Principal Underlying Interest MSR Total
MBS Yield CPR RMBS Price
1.25% 24 105.72%
2.25% 12 104.24%
3.25% 6 98.04%
MSR ARE A NATURAL
HEDGE TO RMBS…
…HAVE HIGHER RETURN POTENTIAL…
…WITH LOWER MORTGAGE SPREAD
RISK…
…AND LOWER LEVERAGE
Note: The numbers used in the scenarios above are hypothetical amounts and are not based on our financial results, nor are they projections of our results. The above scenarios are provided for illustration
purposes only and may not represent all assumptions used. Actual results of a portfolio may differ.

Illustrative MSR Cash Flow Scenarios
17
CHANGING RATE ENVIRONMENTS INFLUENCE AVERAGE LIFE AND YIELD OF MSR
• Effect of changing prepayments dominates the effect of changing discount rate.
HIGH RATE SCENARIO BASE CASE SCENARIO LOW RATE SCENARIO
• Total cash flow is 2.2% of face amount
• Weighted average life of 7.8 years(1)
• Yield of 8% ↔ PV of 1.31%
• Yield of 10% ↔ PV of 1.18%
• Total cash flow is 1.4% of face amount
• Weighted average life of 5.9 years(1)
• Yield of 8% ↔ PV of 0.94%
• Total cash flow is 0.7% of face amount
• Weighted average life of 3.5 years(1)
• Yield of 8% ↔ PV of 0.54%
• Yield of 6% ↔ PV of 0.57%
MSR Service Fee MSR CTS MSR OtherMSR Service Fee MSR CTS MSR Other MSR Service Fee MSR CTS MSR Other
Note: The numbers used in the scenarios above are hypothetical amounts and are not based on our financial results, nor are they projections of our results. The above scenarios are provided for illustration
purposes only and may not represent all assumptions used. Actual results of a portfolio may differ.
1) Weighted average life for MSR is the time weighted average return of interest.
MSR Yield CPR MSR Price
6% 24 0.57%
8% 12 0.94%
10% 6 1.18%
MSR ARE A NATURAL
HEDGE TO RMBS…
…HAVE HIGHER RETURN POTENTIAL…
…WITH LOWER MORTGAGE SPREAD
RISK…
…AND LOWER LEVERAGE

Impact of Interest Rates
18
MSR AND RMBS PRICE CHANGES MOVE IN OPPOSITE DIRECTIONS, PROVIDIN G A
HEDGE FOR ONE ANOTHER IN CHANGING INTEREST RATE ENVIRONMENTS
• When interest rates rise, Treasury prices decrease. When interest rates fall, Treasury prices increase.
• When interest rates rise, RMBS prices decrease. When interest rates fall, RMBS prices increase.
• When interest rates rise, MSR prices increase. When interest rates fall, MSR prices decrease.
• Shifts in RMBS values can be hedged with MSR or with short Treasuries (or with Payer Swaps).
Hypothetical
Mortgage Rate
Treasury
Rate MBS Yield MSR Yield CPR Treasury Price RMBS Price MSR Price
3% 0.25% 1.25% 6% 24 103.72 105.72 0.57
4% 1.25% 2.25% 8% 12 98.79 104.24 0.94
5% 2.25% 3.25% 10% 6 94.12 98.04 1.18
HYPOTHETICAL IMPACT OF CHANGING INTEREST RATE SCENARIOS
MSR ARE A NATURAL
HEDGE TO RMBS…
…HAVE HIGHER RETURN POTENTIAL…
…WITH LOWER MORTGAGE SPREAD
RISK…
…AND LOWER LEVERAGE

MSR in a Portfolio Context

Portfolio With MSR Has Higher Yield Potential
20
MSR HAVE POSIT IVE Y IELD; PAYER SWAPS HAVE NEGATIVE Y IELD
Capital Asset/
Liability Yield(1)
Duration
(years)
Change per
1 basis
point shift in
rates
Agency RMBS $100 $900 2.30% 4.9 $441
Agency Repo $798 (0.75%) - -
5-year Swaps $882 (0.70%) (5.0) ($441)
Total $100 9% -
ROE: 9%(1)
Capital Asset/
Liability Yield(1)
Duration
(years)
Change per
1 basis
point shift
in rates
Agency RMBS $47 $433 2.30% 4.9 $212
Agency Repo $388 (0.75%) - -
MSR $53 $85 8.00% (25.0) ($212)
MSR Financing $32 (4.00%) - -
Total $100 13% -
ROE: 13%(1)
RMBS & SWAPS PORTFOLIO RMBS & MSR PORTFOLIO
1) Illustrative market yields/returns as of October 11, 2016. Such yields/returns do not take into account the operational costs and expenses associated with portfolio management activities or the oversight of sub-servicers.
Note: The above scenarios are intended to illustrate the potential benefits of hedging interest rates with MSR. The numbers used in the scenarios above are hypothetical amounts and are not based on our financial results, nor
are they projections of our results. The above scenarios are provided for illustration purposes only and may not represent all assumptions used. Actual results of a portfolio may differ.
MSR ARE A NATURAL
HEDGE TO RMBS…
…HAVE HIGHER RETURN POTENTIAL…
…WITH LOWER MORTGAGE SPREAD
RISK…
…AND LOWER LEVERAGE

Higher Yield of MSR Portfolio is Not Free
21
A PORTFOLIO OF RMBS + MSR IS MORE NEGATIVELY CONVEX…
1) Graph illustrates the impact of a theoretical instantaneous and parallel shift in interest rates to the portfolios detailed on slide 20.
Note: The above scenarios are intended to illustrate the potential benefits of hedging interest rates with MSR. The numbers used in the scenarios above are hypothetical amounts and are not based on our
financial results, nor are they projections of our results. The above scenarios are provided for illustration purposes only and may not represent all assumptions used. Actual results of a portfolio may differ.
R M B S + M S R (1 )
R M BS + SWA P S (1 ) I N STAN TANE OUS S H O C K (1 )
MSR ARE A NATURAL
HEDGE TO RMBS…
…HAVE HIGHER RETURN POTENTIAL…
…WITH LOWER MORTGAGE SPREAD
RISK…
…AND LOWER LEVERAGE
(50.0%)
(40.0%)
(30.0%)
(20.0%)
(10.0%)
0.0%
10.0%
20.0%
30.0%
-100 -50 0 50 100
Ch
an
ge
in
eq
uit
y %
)
MSR RMBS Total RMBS/MSR
(20.0%)
(15.0%)
(10.0%)
(5.0%)
0.0%
5.0%
10.0%
-100 -50 0 50 100
Ch
an
ge
in
eq
uit
y (%
)
Total RMBS/Swap Total RMBS/MSR
(60.0%)
(40.0%)
(20.0%)
0.0%
20.0%
40.0%
60.0%
-100 -50 0 50 100
Ch
an
ge
in
eq
uit
y (%
)
Swap RMBS Total RMBS/Swap

MSR Portfolio Generates More Revenue
22
…BUT OUTPERFORMS AN RMBS + SWAPS PORTFOLIO IN MOST SCENARIOS OVE R T IME
1) Graph illustrates the impact of a theoretical immediate parallel shift in interest rates held constant for one year to the portfolios detailed on slide 20.
Note: The above scenarios are intended to illustrate the potential benefits of hedging interest rates with MSR. The numbers used in the scenarios above are hypothetical amounts and are not based on our
financial results, nor are they projections of our results. The above scenarios are provided for illustration purposes only and may not represent all assumptions used. Actual results of a portfolio may differ.
R M B S + M S R (1 )
R M BS + SWA P S (1 ) HO RI Z O N S HO C K (1 )
MSR ARE A NATURAL
HEDGE TO RMBS…
…HAVE HIGHER RETURN POTENTIAL…
…WITH LOWER MORTGAGE SPREAD
RISK…
…AND LOWER LEVERAGE
(60.0%)
(40.0%)
(20.0%)
0.0%
20.0%
40.0%
60.0%
-100 -50 0 50 100
Ch
an
ge
in
eq
uit
y (%
)
Swap RMBS Total RMBS/Swap
(60.0%)
(40.0%)
(20.0%)
0.0%
20.0%
40.0%
60.0%
-100 -50 0 50 100
Ch
an
ge
in
eq
uit
y (%
)
MSR RMBS Total RMBS/MSR
(20.0%)
(10.0%)
0.0%
10.0%
20.0%
-100 -50 0 50 100
Ch
an
ge
in
eq
uit
y (%
)
Total RMBS/Swap Total RMBS/MSR

Enhanced MSR Portfolio Outperforms
23
…EXCESS REVENUE CAN BE USED TO PURCHASE SWAPTIONS THAT CAN HEDGE THE
NEGATIVE RETURNS IN THE -100 SCENARIO
1) Graph illustrates the impact of a theoretical immediate parallel shift in interest rates held constant for one year to the portfolios detailed on slide 20.
Note: The above scenarios are intended to illustrate the potential benefits of hedging interest rates with MSR. The numbers used in the scenarios above are hypothetical amounts and are not based on our
financial results, nor are they projections of our results. The above scenarios are provided for illustration purposes only and may not represent all assumptions used. Actual results of a portfolio may differ.
TOTA L V E R S U S E N H A N CE D (1 )
M S R , R M B S , A N D SWA P T I O NS (1 ) E N H A N CE D M S R V E R S U S R M BS P O RT FO L I O (1 )
MSR ARE A NATURAL
HEDGE TO RMBS…
…HAVE HIGHER RETURN POTENTIAL…
…WITH LOWER MORTGAGE SPREAD
RISK…
…AND LOWER LEVERAGE
(60.0%)
(40.0%)
(20.0%)
0.0%
20.0%
40.0%
60.0%
-100 -50 0 50 100
Ch
an
ge
in
eq
uit
y (%
)
MSR RMBS Swaption
(20.0%)
(10.0%)
0.0%
10.0%
20.0%
-100 -50 0 50 100
Ch
an
ge
in
eq
uit
y (%
)
Total RMBS/MSR Enhanced RMBS/MSR
(20.0%)
(10.0%)
0.0%
10.0%
20.0%
-100 -50 0 50 100
Ch
an
ge
in
eq
uit
y (%
)
Total RMBS/Swap Enhanced RMBS/MSR

MSR Portfolio Has Less Basis Risk
24
THE “RMBS + SWAPS” PORTFOLIO IS EXPOSED TO CHANGES IN THE BASIS; THE “RMBS +
MSR” PORTFOL IO IS HEDGED WITH RESPECT TO BASIS CHANGES
1) Graph illustrates the impact of a theoretical instantaneous shift in the mortgage basis to the portfolios detailed on slide 20.
Note: The above scenarios are intended to illustrate the potential benefits of hedging mortgage basis with MSR. The numbers used in the scenarios above are hypothetical amounts and are not based on our
financial results, nor are they projections of our results. The above scenarios are provided for illustration purposes only and may not represent all assumptions used. Actual results of a portfolio may differ.
RMBS + MSR (1)
RMBS + SWAPS (1 ) MORTGAGE BASIS SHOCK (1)
MSR ARE A NATURAL
HEDGE TO RMBS…
…HAVE HIGHER RETURN POTENTIAL…
…WITH LOWER MORTGAGE SPREAD
RISK…
…AND LOWER LEVERAGE
(25.0%)
(15.0%)
(5.0%)
5.0%
15.0%
25.0%
Ch
an
ge
in
eq
uit
y (%
)
Total RMBS/MSR MSR RMBS
(25.0%)
(15.0%)
(5.0%)
5.0%
15.0%
25.0%
-50 -25 0 25 50
Ch
an
ge
in
eq
uit
y (%
)
Swap RMBS Total RMBS/Swap
20, -9%
20, 0%
(25.0%)
(15.0%)
(5.0%)
5.0%
15.0%
25.0%
-50 -25 0 25 50
Ch
an
ge
in
eq
uit
y (%
)
Total RMBS/Swap Total RMBS/MSR

Portfolio With MSR Has Lower Leverage
25
MSR HAVE POSIT IVE Y IELD; PAYER SWAPS HAVE NEGATIVE Y IELD
• It’s better to get paid to hedge instead of paying to hedge
RMBS & SWAPS PORTFOLIO RMBS & MSR PORTFOLIO
1) Illustrative market yields/returns as of October 11, 2016. Such yields/returns do not take into account the operational costs and expenses associated with portfolio management activities or the oversight of sub-servicers.
Note: The above scenarios are intended to illustrate the potential benefits of hedging interest rates with MSR. The numbers used in the scenarios above are hypothetical amounts and are not based on our financial results, nor
are they projections of our results. The above scenarios are provided for illustration purposes only and may not represent all assumptions used. Actual results of a portfolio may differ.
MSR ARE A NATURAL
HEDGE TO RMBS…
…HAVE HIGHER RETURN POTENTIAL…
…WITH LOWER MORTGAGE SPREAD
RISK…
…AND LOWER LEVERAGE
Capital Asset/
Liability Yield(1)
Duration
(years)
Change per
1 basis
point shift in
rates
Agency RMBS $100 $900 2.30% 4.9 $441
Agency Repo $798 (0.75%) - -
5-year Swaps $882 (0.70%) (5.0) ($441)
Total $100 9% -
ROE: 9%(1)
Debt-to-Equity: 8.0x
Capital Asset/
Liability Yield(1)
Duration
(years)
Change per
1 basis
point shift in
rates
Agency RMBS $46 $425 2.30% 4.9 $212
Agency Repo $377 (0.75%) - -
MSR $52 $83 8.00% (25.0) ($212)
MSR Financing $31 (4.00%) - -
Swaptions $2 $2 - - $29
Total $100 13% $29
ROE: 13%(1)
Debt-To-Equity: 4.2x (8.3x on Agency / 0.6x on MSR)
26
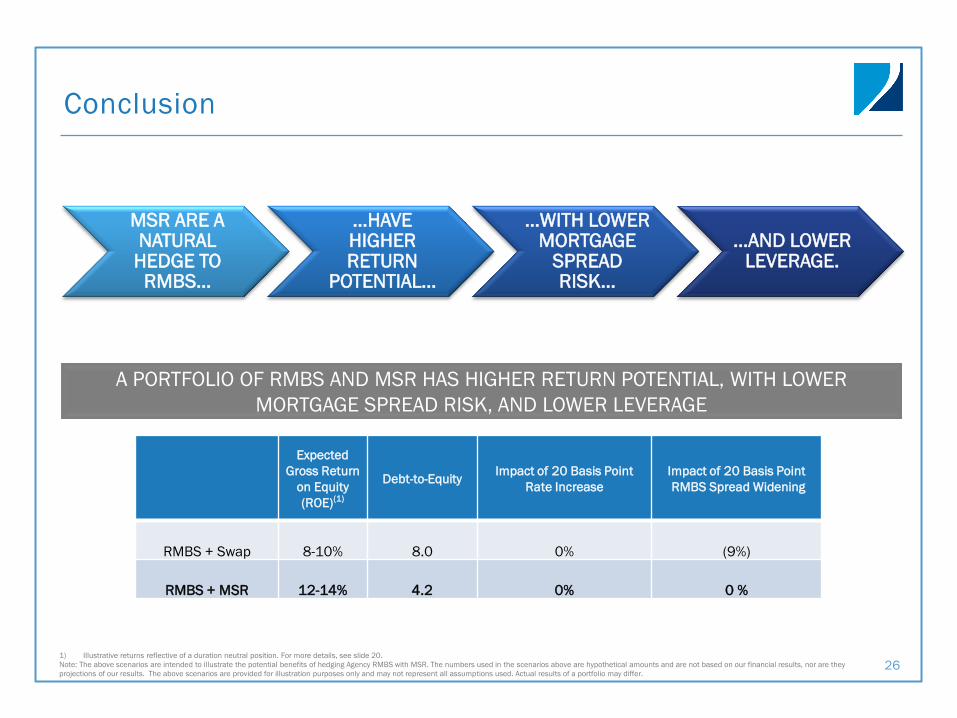
Conclusion
1) Illustrative returns reflective of a duration neutral position. For more details, see slide 20.
Note: The above scenarios are intended to illustrate the potential benefits of hedging Agency RMBS with MSR. The numbers used in the scenarios above are hypothetical amounts and are not based on our financial results, nor are they
projections of our results. The above scenarios are provided for illustration purposes only and may not represent all assumptions used. Actual results of a portfolio may differ.
Expected
Gross Return
on Equity
(ROE)(1)
Debt-to-Equity Impact of 20 Basis Point
Rate Increase Impact of 20 Basis Point
RMBS Spread Widening
RMBS + Swap 8-10% 8.0 0% (9%)
RMBS + MSR 12-14% 4.2 0% 0 %
MSR ARE A NATURAL
HEDGE TO RMBS…
…HAVE HIGHER RETURN
POTENTIAL…
…WITH LOWER MORTGAGE
SPREAD RISK…
…AND LOWER LEVERAGE.
A PORTFOLIO OF RMBS AND MSR HAS HIGHER RETURN POTENTIAL, WITH LOWER
MORTGAGE SPREAD RISK, AND LOWER LEVERAGE

Closing Remarks
27
CONTACT INFORMATION
Investor Relations
612-629-2500
