most probable number (mpn) total cell counts … · membrane filter automatic counting quantitative...
TRANSCRIPT

1
Most probable number (MPN)
Total Cell Counts
Thoma-chamber
Membrane filter
Automatic counting
Quantitative PCR
Most probable number (MPN)

2
Most probable number (MPN)
• Serial dilution of an inoculum in a liquid medium until the final tube or tubes
in the series show no growth
• The last tube showing growth should have developed from 10 or fewer cells
• Use of several replicate
tubes at each dilution
improves accuracy of the
final MPN obtained
Slurry(Sedimentaufschlämmung)
18 mL artificial seawater
+ 2 cm3 sediment
(1:10)
Microtiterplate with 96 wells
(0.9 mL medium + 0.1 mL slurry)
���� Variations in samples, medium,
substrates, etc.
A
A
B
B
C
C
D
D
3
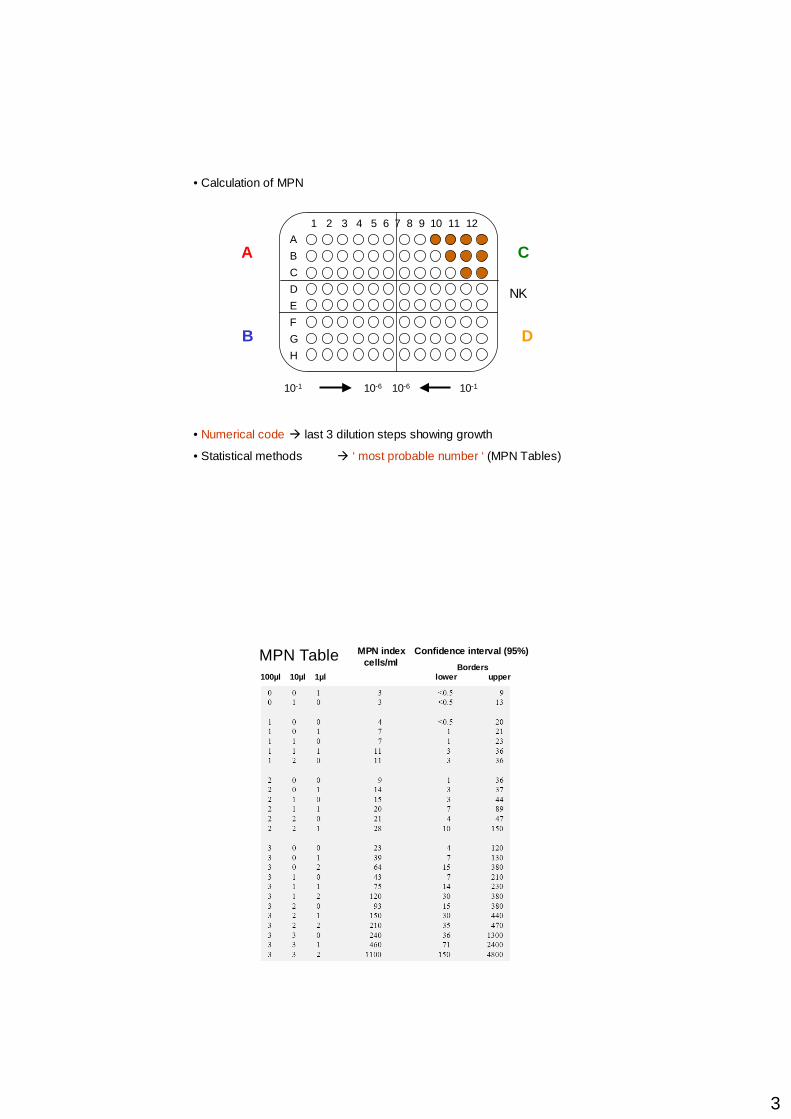
• Calculation of MPN
• Numerical code � last 3 dilution steps showing growth
• Statistical methods � ‘ most probable number ‘ (MPN Tables)
Kontrolle
Kontrolle
1 2 3 4 5 6 7 8 9 10 11 12
A
B
C
D
E
F
G
H
10-110-610-610-1
NK
A
B
C
D
MPN indexcells/ml
Confidence interval (95%)
Borderslower upper100µl 10µl 1µl
MPN Table

4
• Last 3 positive steps:
321
• MPN (de Man):
150
� 150 cells in the dilution 10-2 that contains 10 µL slurry
� 1 mL slurry: 15,000 cells
� dilution factor (medium/sediment) = 10
� cells per cm3 sediment: 150,000
Kontrolle
Kontrolle
1 2 3 4 5 6 7 8 9 10 11 12
A
B
C
D
E
F
G
H
10-110-610-610-1
NK
A
B
C
D
Kontrolle
Kontrolle
1 2 3 4 5 6 7 8 9 10 11 12A
B
C
D
E
F
G
H
10-110-610-610-1
NK
A
B
C
D

5
Kontrolle
Kontrolle
1 2 3 4 5 6 7 8 9 10 11 12A
B
C
D
E
F
G
H
10-110-610-610-1
NK
A
B
C
D
A 221 ���� 28 cells in 10 -3 (1µL slurry)���� 28,000 cells/mL slurry���� 280,000 cells/mL sediment
Kontrolle
Kontrolle
1 2 3 4 5 6 7 8 9 10 11 12A
B
C
D
E
F
G
H
10-110-610-610-1
NK
A
B
C
D
B 110 ���� 7 cells in 10 -1 (100µL slurry)���� 70 cells/mL slurry���� 700 cells/mL sediment
6
Kontrolle
Kontrolle
1 2 3 4 5 6 7 8 9 10 11 12A
B
C
D
E
F
G
H
10-110-610-610-1
NK
A
B
C
D
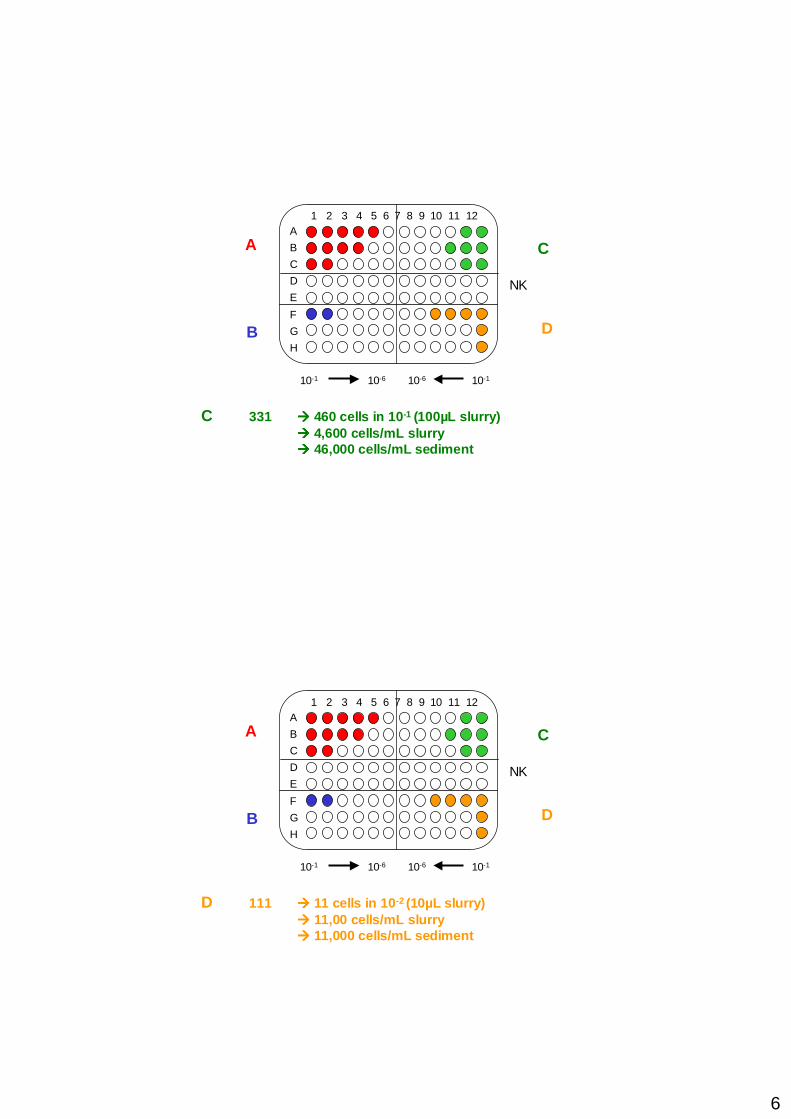
C 331 ���� 460 cells in 10 -1 (100µL slurry)���� 4,600 cells/mL slurry���� 46,000 cells/mL sediment
Kontrolle
Kontrolle
1 2 3 4 5 6 7 8 9 10 11 12A
B
C
D
E
F
G
H
10-110-610-610-1
NK
A
B
C
D
D 111 ���� 11 cells in 10 -2 (10µL slurry)���� 11,00 cells/mL slurry���� 11,000 cells/mL sediment
7
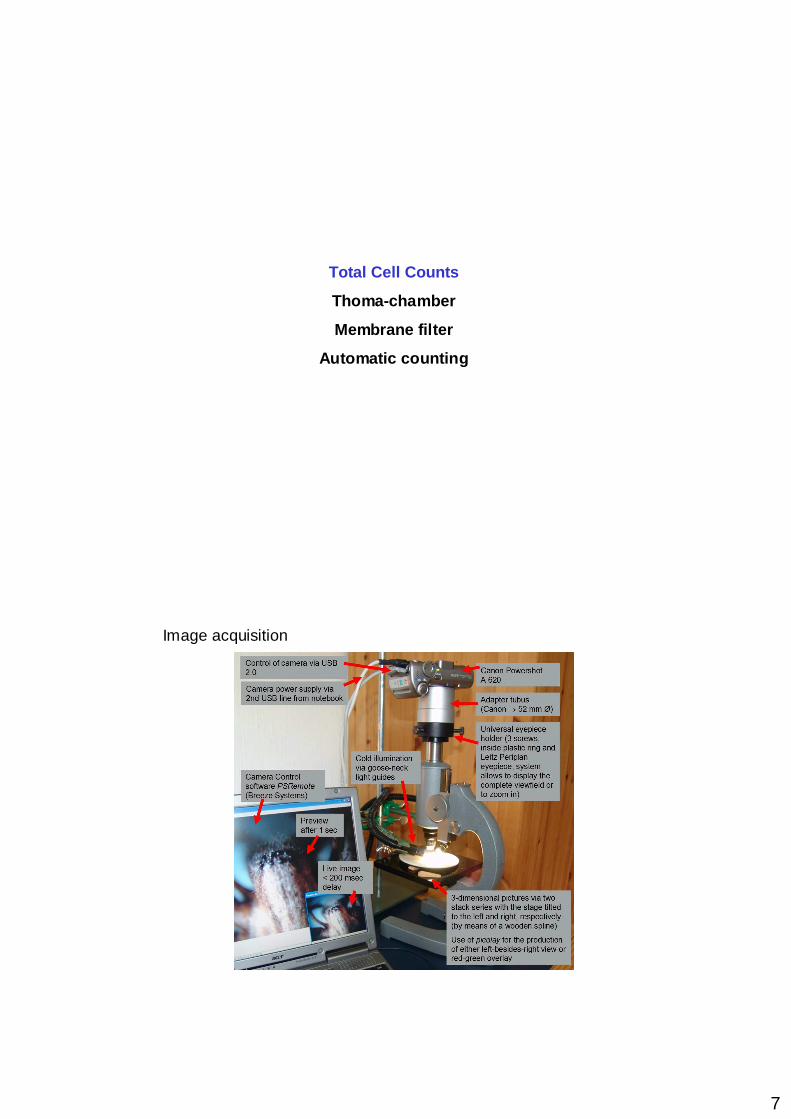
Total Cell Counts
Thoma-chamber
Membrane filter
Automatic counting
Image acquisition
8
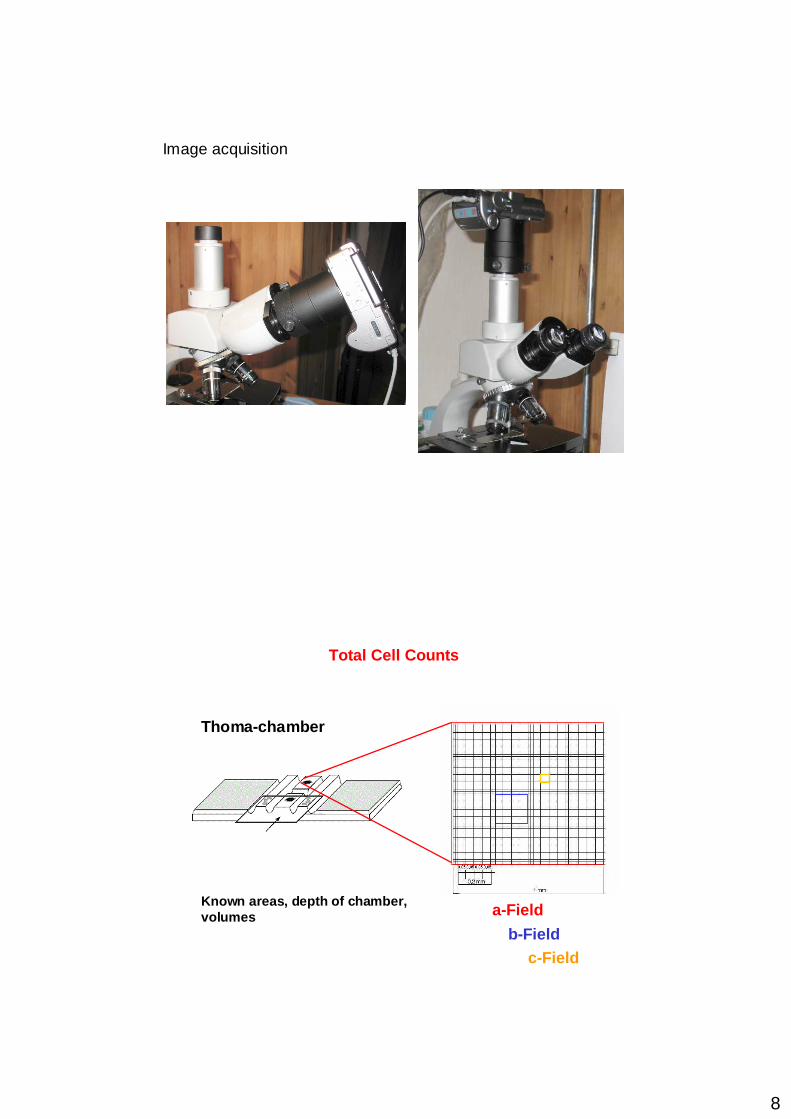
Image acquisition
Total Cell Counts
Thoma-chamber
a-Field
b-Fieldc-Field
Known areas, depth of chamber, volumes

9
b-Field
Thoma-chamber
Counting
+ on the upper and right-hand border line of a small square
- on the lower and left-hand border line of a small square
b-Field
Thoma-chamber

10
Calculation of cell counts
Cell counts/mL = Total number of all counted cells
Number of small squares counted
Volume of a small square in mLx
Volume of a small square in mL = (Length) 2 x Depth of chamber
Thoma-chamber
Membrane filter
effective Filtration-area
Counting square
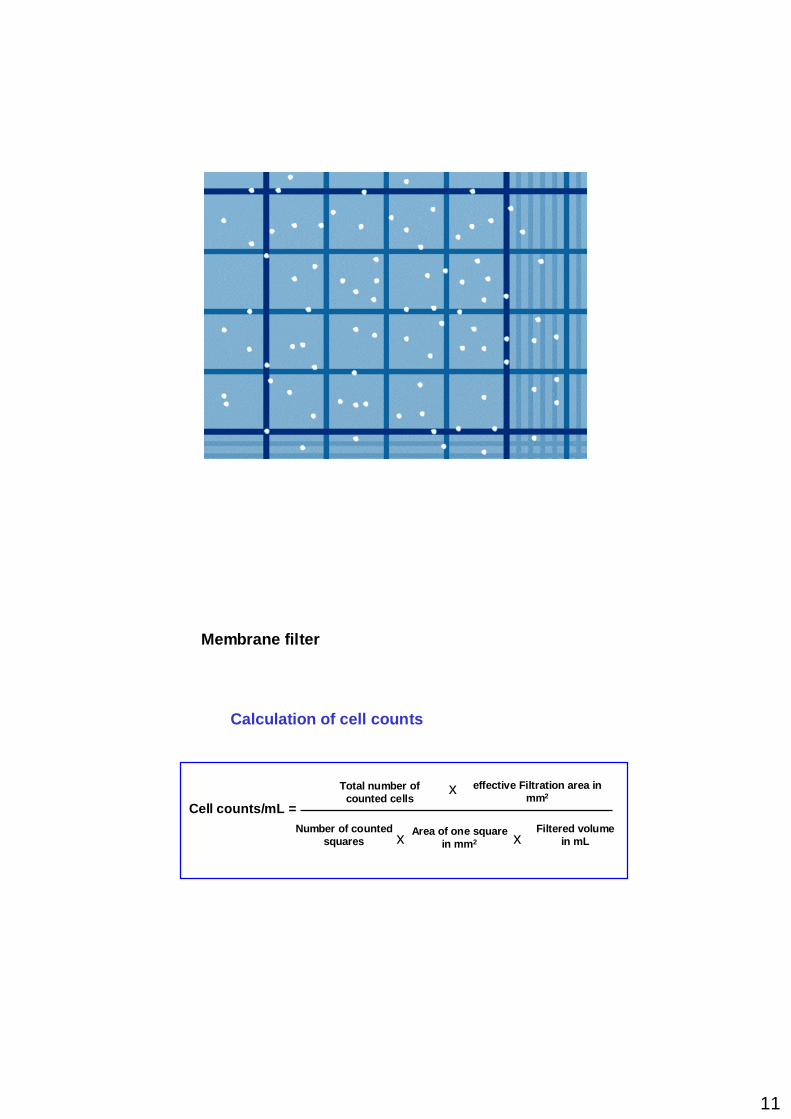
11
Membrane filter
Cell counts/mL =
Total number of counted cells
effective Filtration area in mm2
Number of counted squares
Filtered volumein mL
x
xx Area of one squarein mm 2
Calculation of cell counts
12
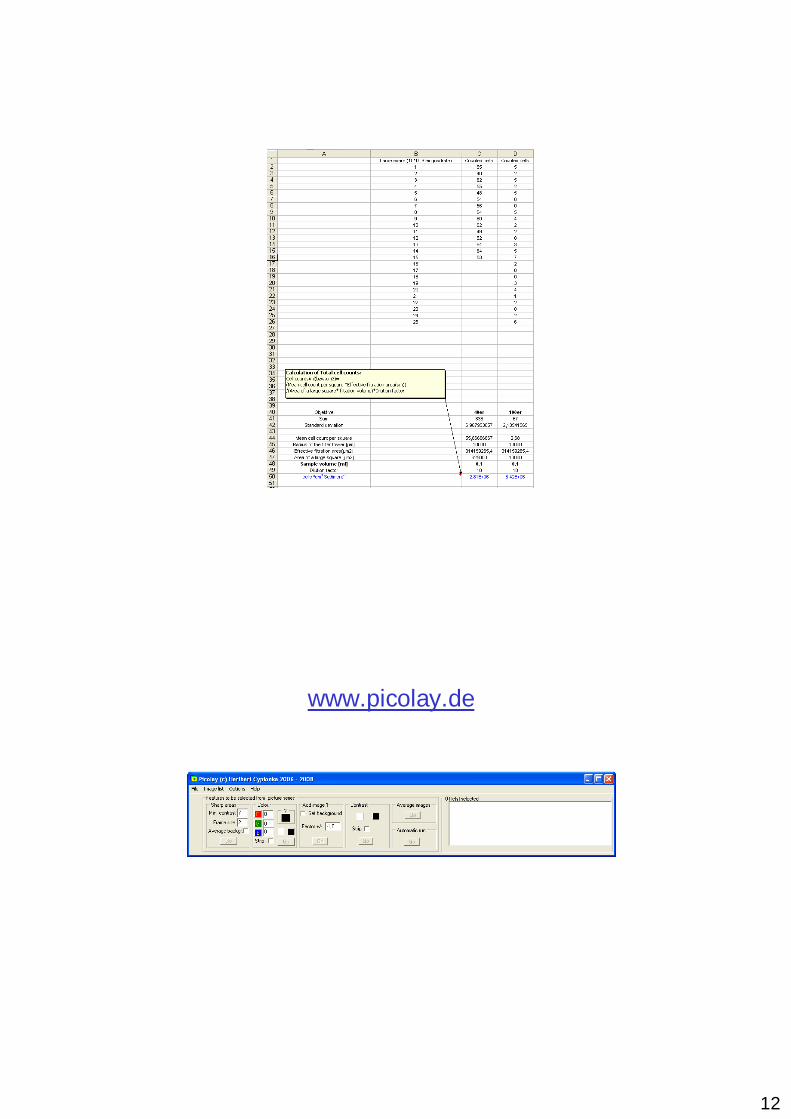
www.picolay.de
13
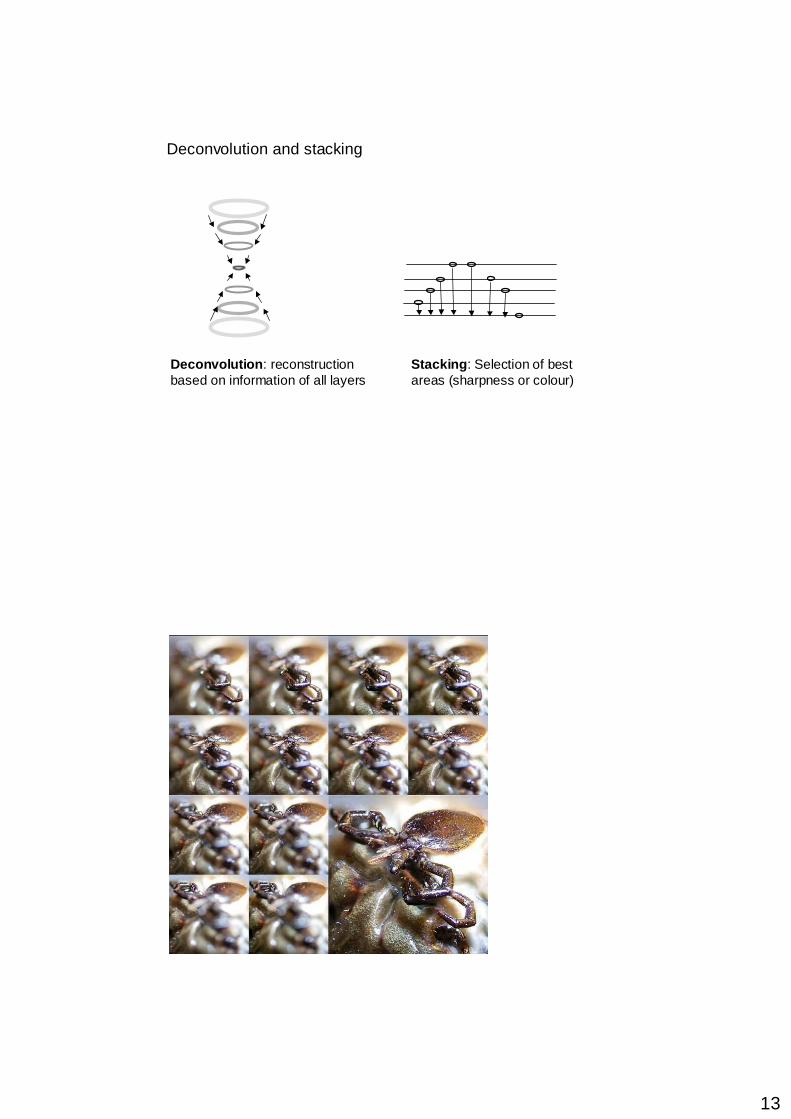
Deconvolution and stacking
Stacking : Selection of best areas (sharpness or colour)
Deconvolution : reconstructionbased on information of all layers
Tick,40x12/19 images

14
1/5 5/5
Stacked
CountThem
The most-boring job...
www.picolay.de
Quantitative PCR

15
SybrGreen technique
Amplification
5´
5´
3´
3´
5´
5´
3´
3´
5´
5´
3´
3´
5´
5´
3´
3´
5´ 3´
5´3´
⇒⇒⇒⇒ weak fluorescence
No binding on single stranded DNA
UV (497 nm)
5´ 3´
5´3´
ss DNA
⇒⇒⇒⇒ strongfluorescence
SybrGreen intercalates at double stranded DNA
5´
5´
3´
3´
UV 520 nm
ds DNA
SybrGreen technique
Advantage:• easy to establish
• less expensive than other methods
• especially usefull if different primer sets are applied
Drawback:• unspeciffic binding possible
General:• DNA extraction crucial• specificity of primers

16
Other methods
• Taq man probes• Molecular beacons
Advantages:• High specific binding with a second probe
Annealing ofTaq man probes and primers
Amplification
Release of fluorophor
Molecular beacon: Hairpin structure, fluorophor and quencher closely connected
Opening of hairpin duringannealing results in fluorescence
Rotor-Gene 2000/3000 Corbett Research Raw data
Rotor and detection units
The thermocycler

17
TheThreshold:• Level with highest rate
of amplification
The Ct-value:• The number of cycles to reach
the treshold is directly correlated to the copy number in the original sample
Standard curve:• Calculation of target concentration• Calculation of organisms per sample
(x 16S rRNA copy number)
3.8 for Bacteria, 2 for Archaea(Fogel et al. 1999)
Data aquisition and analysis