most recent annual financial report - stanford...
TRANSCRIPT


STANFORD UNIVERSITY ANNUAL FINANCIAL REPORT
MANAGEMENT’S DISCUSSION AND ANALYSIS .............................................................. 1
SELECTED FINANCIAL AND OTHER DATA ................................................................... 10
MANAGEMENT RESPONSIBILITY FOR FINANCIAL STATEMENTS ..................................... 11
INDEPENDENT AUDITOR’S REPORT .......................................................................... 12
CONSOLIDATED STATEMENTS OF FINANCIAL POSITION .............................................. 13
CONSOLIDATED STATEMENTS OF ACTIVITIES ........................................................... 14
CONSOLIDATED STATEMENTS OF CASH FLOWS ......................................................... 16
NOTES TO THE CONSOLIDATED FINANCIAL STATEMENTS ............................................ 17
1. BASIS OF PRESENTATION AND SIGNIFICANT ACCOUNTING POLICIES 2. ACCOUNTS RECEIVABLE 3. PLEDGES RECEIVABLE 4. LOANS RECEIVABLE 5. INVESTMENTS 6. INVESTMENT POOLS 7. DERIVATIVES 8. PLANT FACILITIES 9. LIABILITIES UNDER SECURITY LENDING AGREEMENTS 10. UNIVERSITY NOTES AND BONDS PAYABLE 11. HOSPITALS NOTES AND BONDS PAYABLE 12. UNIVERSITY ENDOWMENT 13. HOSPITALS ENDOWMENTS 14. UNIVERSITY GIFTS AND PLEDGES 15. FUNCTIONAL EXPENSES 16. UNIVERSITY RETIREMENT PLANS 17. HOSPITALS RETIREMENT PLANS 18. OPERATING LEASES 19. RELATED PARTY TRANSACTIONS 20. COMMITMENTS AND CONTINGENCIES 21. SUBSEQUENT EVENTS
REPORT FROM THE STANFORD MANAGEMENT COMPANY ............................................. 69

1
MANAGEMENT’S DISCUSSION AND ANALYSIS
FY14 FINANCIAL HIGHLIGHTS Stanford’s consolidated FY14 financial results continue to benefit from excellent investment performance, strong health care services revenues, and generous donor support. Consolidated operating revenues exceeded expenses by $535 million, compared to $565 million in FY13. Consolidated net assets increased $4.1 billion to end the year at $33.8 billion. These results reflect the combined financial position and results of the University and the Hospitals, including their respective entities.
Excellent investment performance. Consolidated investment returns in FY14 were $4.3 billion, equal to 16.1% of beginning of year investment balances. During FY14, U.S. public and private equity markets, particularly venture capital, delivered strong returns, bolstered by the low-interest-rate environment and ongoing economic recovery. Total consolidated investments at August 31, 2014 were $30.5 billion, up $3.5 billion over the prior year. The Merged Pool (MP) held $25.3 billion of the consolidated investments at August 31, 2014, including $23.0 billion of the University’s endowment and expendable fund assets and $2.3 billion of the Hospitals’ investments. The MP is a diversified portfolio of actively managed public and private equity, absolute return, natural resources and real estate assets. An analysis of the MP investment strategy and performance is included in the Report from the Stanford Management Company.
Strong health care services revenues. Consolidated health care services revenues represented approximately 50% of consolidated revenues in FY14. Over the last 5 years, health
care services have become a more substantial component of the consolidated enterprise. See additional discussion below. Generous donor support. Gifts to the University and the Hospitals totaled $982 million in FY14. The University’s Office of Development reported gifts benefiting the University and Stanford Health Care (SHC) of $928 million from a record number of donors for the fifth year in a row—over 82,300 alumni, parents, friends, and other supporters. This amount includes $265 million in support of the School of Medicine and SHC, but does not include $54 million of gifts raised for Lucile Packard Children’s Hospital at Stanford, which raises funds independently. These results are a testament to the direction and vision of the University and an endorsement of Stanford’s mission. Below are additional details about the University’s and Hospitals’ financial position, financial results and operations. University FY14 net assets increased 14% to $29.2 billion compared to $25.7 billion in the prior year. The University’s endowment ended the year at an all-time high of $21.4 billion, exceeding last year’s $18.7 billion.
OPERATING RESULTS The Statements of Activities include results from both operating and non-operating activities of the University. Operating activities include the revenues earned and expenses incurred in the current year to support the University’s core activities of teaching and research and other University priorities.

2
FIGURE 1 OPERATING REVENUES
$0
$200
$400
$600
$800
$1,000
$1,200
$1,400
Student income
Sponsored research support
Health care services
Current year gifts in support of operations
Net assets released from
restrictions
Investment income
distributed for
operations
Special program fees and other income
FY14
FY13
(in millions)
The University ended the year with a surplus from operations of $214 million compared to $165 million in FY13. FY14 operating revenues increased 9% compared to an increase in expenses of 8% during the same period. Non-operating activities are discussed in the Financial Position section of this analysis. OPERATING REVENUES FY14 operating revenues were $4.5 billion, reflecting a 9% increase over FY13. The University’s operating revenue categories are shown in Figure 1.
Student Income Total student income, which represents 12% of University operating revenues, increased 4% to $534 million in FY14. Total student income includes tuition and fees from undergraduate and graduate programs and room and board; this amount is partially offset by financial aid consisting of assistance in the form of scholarship and fellowship grants that cover a portion of tuition, living and other costs. Revenues from student tuition and fees increased nearly 4% in FY14 primarily as a result of undergraduate and graduate
tuition increases ranging from 3.5% to 3.9%. Revenues from room and board increased 4% in FY14 primarily due to an increase in room and board rates and higher graduate student occupancy. Average undergraduate and graduate enrollment was down .5% and up .7%, respectively, from the previous year.
Financial aid increased $7.3 million or 3% in FY14 to $249 million, slightly less than the increase in tuition rates and consistent with less need for aid based on current economic conditions. Stanford’s commitment to keeping a Stanford education affordable remains unchanged.
Stanford is committed to a policy of “need-blind” admission for eligible U.S. citizens and permanent resident undergraduate students. In FY14, approximately 50% of undergraduates were awarded need-based scholarships and grants from Stanford. In general, eligible Stanford undergraduates receive additional financial assistance in the form of other scholarships and grants, student employment and low-interest student loans.

3
Graduate student financial aid is awarded based on academic merit and the availability of aid and consists of fellowships, stipends, and trainee/assistantships. For accounting purposes, fellowships are included in financial aid, stipends in other operating expenses, and trainee/assistantships in salaries and benefits. Over 85% of graduate students receive financial support, including University, federal and privately funded fellowships, and teaching and research assistantships. Stanford participates in the Federal Perkins student loan program, available to undergraduate, graduate and professional students. Stanford also provides a gift funded institutional loan program. Student loan receivables, net of allowances for doubtful accounts, were $81 million and $78 million as of August 31, 2014 and 2013, respectively. Sponsored Research Support Sponsored research support represents 28% of the University’s operating revenues. FY14 sponsored research support increased to $1.3 billion, nearly 3% over FY13. The majority of the University’s sponsored research support (81% including the SLAC National Accelerator Laboratory—“SLAC”) is received directly or indirectly from the federal government. The largest federal sponsor, the Department of Health and Human Services, provided revenue of $412 million in FY14 compared to $414 million in the prior year, primarily through the National Institutes of Health. Most of these funds support research within the University’s School of Medicine. The U.S. Department of Energy provided the majority of the $369M in federal research support for SLAC in FY14, up 5% from FY13. Annual federal research support for the laboratory varies depending on the size and scope of construction in process. In FY14 SLAC received approximately $80M for several projects: construction of the new Scientific User Support Building, the Research Support Office Building modernization, the Large Synoptic Survey Telescope (LSST camera) and the LCLS II project, an extension/upgrade of the Linac Coherent Light Source (LCLS), the revolutionary X-ray free-electron laser which has been operational since October of 2009. When complete in 2021,
THE UNIVERSITY’S ENDOWMENT The University’s endowment is a collection of gift funds and reserves which are set aside and invested to support the University’s teaching and research missions. At August 31, 2014, the endowment totaled $21.4 billion and represented approximately 73% of the University’s net assets. The endowment, which includes endowed lands, is comprised of pure endowment funds, term endowment funds and funds functioning as endowment. Gifts and pledge payments, investment returns, and other invested funds added $3.7 billion to the endowment in FY14. Annual payout to operations from the endowment--$985 million in FY14--continues to be a significant source of operating revenue for the University, covering approximately 23% of expenses in FY14. The University’s endowment provides funding annually for a wide variety of important purposes. As shown in Figure 2, a significant portion of the endowment (approximately 80%) is restricted as to purpose. Approximately 29% funds instruction and research activities, 23% goes to student aid, 19% covers faculty salaries and support, 22% is unrestricted and the remainder is split between library support and other purposes.
UNIVERSITY ENDOWMENT BY YEAR
0
5
10
15
20
25
$ in billions

4
LCLS II will provide additional capacity for X-ray science research. In addition to payment for the direct costs of performing research, the University receives an amount from sponsors for facilities and administrative costs, known as indirect costs. This amount covers costs related to facilities, utilities and administrative costs incurred in connection with sponsored research. For FY14, the federal and non-federal indirect cost recovery increased slightly to $227 million. Health Care Services FY14 health care services revenue represented 15% of University operating revenues, increasing $74 million to $698 million. School of Medicine faculty serve as physicians for the Hospitals. Clinical revenue is billed and collected by the Hospitals, and a portion is remitted to the University as payment for these physician services. In addition, the Hospitals pay the University for other essential services such as medical direction, telecommunication, legal and internal audit services. Health care services revenues of $670 million represent the net value of services provided by the University to the Hospitals; these amounts are eliminated in consolidation. Current Year Gifts in Support of Operations and Net Assets Released from Restrictions Current year gifts in support of operations increased 18% to $212 million in FY14 due to several significant gifts. Net assets released from restrictions increased 12% to $137 million. Total Investment Income Distributed for Operations The University distributes investment income for use in operations according to policies approved by the Board. Total investment income distributed for operations represented 26% of University revenue in FY14, the second highest source of operating revenue for the University. Endowment income distributed for operations
increased 7% to $985 million in FY14. This includes payout from the University’s Merged Pool (MP) based on the Board-approved formula and income received from real estate investments outside of the MP and other invested assets. The
endowment payout as a percentage of the beginning endowment value was 5.3% for FY14 and 5.4% for FY13.
Expendable funds pools and other investment
income distributed for operations was $181 million in FY14, compared to $84 million in FY13. This category primarily includes the payout to operations from the Expendable Funds Pool (EFP) and the Endowment Income Funds Pool (EIFP), the principal investment vehicles for the University’s expendable funds.
The EFP policy provides a variable payout to
certain funds that support operations based on the prior year’s investment returns. Positive returns in both FY13 and FY12 resulted in the payouts to these funds over the past two years. Higher returns in FY13 over FY12 contributed to the increased payout in FY14. See Note 6 to the FY14 Consolidated Financial Statements.
The EIFP holds previously distributed but unspent endowment payouts. These amounts are invested in highly liquid instruments in order to preserve the principal balance. Earnings on these investments are distributed to the fund holders. See Note 6 to the FY14 Consolidated Financial Statements.
FIGURE 2 ENDOWMENT PAYOUT BY PURPOSE
UNRESTRICTED22%
FACULTY RELATED19%
INSTRUCTION and RESEARCH
29%
LIBRARY2%
STUDENT AID23%
OTHER 4%

5
OPERATING EXPENSES Total expenses increased $319 million, or 8%, to $4.3 billion in FY14. Salaries and benefits comprised 62% of the University’s total expenses; depreciation expense was 7% and other operating expenses represented 31%. Salaries and benefits increased 6% in FY14 to
$2.7 billion. The increase resulted from a combination of salary programs designed to maintain Stanford’s competitive position, higher benefit costs, and increases in headcount to support new programs, particularly within the School of Medicine.
Depreciation expense increased by 7% to $311 million in FY14 from $292 million in FY13. The increase in this category resulted from buildings recently placed in service as described in the Capital Projects section below.
Other operating expenses increased by 12% to $1.3 billion in FY14 due to additional expenses incurred to support new and existing housing, recreational facilities and infrastructure, and new programs and facilities, particularly within the School of Medicine and SLAC.
FINANCIAL POSITION The University’s Statements of Financial Position reflect strong donor support, excellent investment returns and positive operating results over the past four years. Total University assets increased $3.7 billion in FY14 to end the year at $35.2 billion. Total University liabilities increased slightly from $5.8 billion to $6.0 billion. Cash and Assets Limited as to Use The University regularly monitors liquidity required to meet its operating needs and other contractual commitments. At the same time, the University strives to maximize the investment of its available funds. At August 31, 2014, the University’s cash and cash equivalents was $630 million, a decrease of $154 million compared to the prior year. Assets limited as to use to fund construction expenditures increased $135 million as a result of the issuance of tax-exempt bonds during FY14. In addition, there were $1.7 billion in cash and cash equivalents in the University’s investments. See Note 5 to the FY14 Consolidated Financial Statements.
Investments University investments at August 31, 2014 were $27.8 billion, an increase of $3.1 billion or 13% over FY13. There are three primary categories of investments: $23.0 billion held in the MP (discussed above
under FY14 Financial Highlights). Over $3 billion of real estate investments on
Stanford’s endowed lands which have been designated for the production of income by the Board, and other real estate investments. In FY2014, these properties generated $85M in income, net of expenses and appreciated $481 million in value. In recent years, the value of these properties has benefited from strong dynamics in the local real estate market including rising investor demand for real estate; high office, hotel and apartment occupancy rates; increased office market rents; and strong retail sales.
The remaining investments are specifically invested for a variety of purposes, including donor wishes.
Capital Projects The University continues to invest heavily in its physical facilities to support key academic initiatives, housing and infrastructure. During FY14, the University invested $662 million in capital projects, bringing gross plant facilities before accumulated depreciation to $8.2 billion. Plant facilities, net of accumulated depreciation, increased $351 million to $4.6 billion. During FY14, construction was completed on the Shriram Center for Bioengineering and Chemical Engineering, the Donald Kennedy Graduate Residences, the Anderson Collection building and significant portions of the Stanford Energy System Innovations (SESI) project, including the electrical substation and the majority of the steam-to-hot water piping and building conversions. Completion and activation of the central energy facility is scheduled to occur in the spring of 2015. SESI demonstrates Stanford’s commitment to and investment in environmental sustainability and a major University initiative to reduce energy and water use, apply stringent environmental standards

6
to all new buildings, encourage sustainable living, conserve natural resources and decrease waste. As part of Stanford’s commitment to make the arts integral to a Stanford education, a new arts district is taking shape. Anchored by the Cantor Arts Center, the Memorial Auditorium, the Stanford Art Gallery, the Frost Amphitheater, and the Bing Concert Hall (which opened in 2013), the newest additions include the Anderson Collection at Stanford (which opened to the public in September 2014) and the McMurtry Art and Art History Building (scheduled to open in 2015). Debt The University’s debt policy governs the amount and type of debt Stanford may incur and is designed to preserve debt capacity, financial flexibility and access to capital markets at competitive rates. A combination of fixed and variable rate debt, of varying maturities, is used to fund academic facilities, residential housing and dining facilities, real estate investment projects, faculty and staff mortgage loans and other infrastructure projects. During FY14, the University issued $553 million in taxable and tax-exempt debt to finance various facilities and infrastructure, including additional portions of the SESI project, to refinance certain tax-exempt bonds and commercial paper notes, and to achieve savings in interest costs. The debt was issued with yields-to-maturity ranging from 1.75%-3.63% on tax-exempt bonds with maturities of 7 and 31 years and 4.25% on taxable bonds with a maturity of 40 years. The University paid down $350 million of its 2009 taxable debt upon maturity. Total debt increased $166 million to $3.3 billion as of August 31, 2014. During FY14, Standard and Poor’s, Moody’s and Fitch affirmed the University’s debt ratings in the highest rating categories for short and long-term debt. Unrestricted Net Assets In total, unrestricted net assets of the University increased $2.0 billion to $15.5 billion, with $214 million resulting from operating activities. The most significant components of non-operating changes in unrestricted net assets in FY14 were the $1.6 billion increase in realized and unrealized
investment gains and $168 million from the release of restrictions on capital and other gifts previously included in temporarily restricted net assets. Temporarily Restricted Net Assets Temporarily restricted net assets increased $1.2 billion to $7.8 billion in FY14. An increase in realized and unrealized investment gains of $1.1 billion, and new temporarily restricted gifts and pledges of $373 million were the major factors in this result. The results were partially offset by $168 million in transfers relating to capital assets placed in service and other gifts released from their restrictions and by $137 million released for operating activities. Permanently Restricted Net Assets Permanently restricted net assets increased $284 million to $5.9 billion during FY14. The increase was driven by $154 million in new gifts and pledges and a $64 million increase in realized and unrealized investment gains. Hospitals The financial results and financial position of Stanford Health Care, formerly named Stanford Hospital and Clinics and its respective entities (SHC), and Lucile Salter Packard Children’s Hospital at Stanford and its respective entities (LPCH), are combined in the FY14 Consolidated Financial Statements under the “Hospitals” column. The University is the sole member of each of the Hospitals. The University’s School of Medicine and its clinical faculty, together with SHC and LPCH, comprise and are known in the marketplace as Stanford Medicine. In FY11, the Hospitals received local government approval to rebuild and expand their principal facilities. Construction is now well underway and the facilities are expected to be completed in 2017. These improvements will assure that the Hospitals have adequate inpatient capacity in modern, technologically-advanced and patient-centered facilities, and meet state-mandated earthquake safety standards. The total estimated cost, inclusive of contingencies, is approximately $2.0 billion for SHC and $1.2 billion for LPCH. To improve and expand their services, the Hospitals have established community-based ambulatory

7
clinic organizations—SHC’s University HealthCare Alliance (UHA) and LPCH’s Packard Children’s Health Alliance (PCHA)—that support Stanford Medicine’s mission to deliver quality care to the community and conduct research and education. Working collaboratively with the Hospitals and School of Medicine faculty, these organizations have acquired multi-specialty practices in outlying communities to form a network of coordinated care throughout the Bay Area. The Hospitals continue to participate in the California Hospital Quality Assurance Fee (QAF) Program and the Hospital Fee Program. These programs are designed to provide supplemental payments to certain hospitals and support the State’s effort to maintain health care coverage for children. The following discussion summarizes the individual financial results of SHC and LPCH as shown in the FY14 Consolidated Financial Statements. STANFORD HEALTH CARE SHC generated solid operating results in FY14, resulting in income from operations of $278 million compared to $253 million in FY13. SHC’s positive operating results were due in part to strong volume, improved throughput, cost containment initiatives and growth in the number of new facilities and faculty physicians performing clinical services. Net assets grew by $432 million, or 19%, to $2.7 billion mainly due to the favorable results from operations, investment returns and fundraising commitments for the new Stanford Hospital. In October 2014, Stanford Hospital and Clinics was renamed Stanford Health Care to reflect the range and focus of its organization and commitment to healing patients. SHC encapsulates the entire health system including: Stanford Hospital; Stanford Clinics; Stanford specialty centers such as the cancer, heart and neuroscience health centers; UHA medical groups; virtual care and patient navigation offerings; and the Stanford Health Care Alliance health plan.
In September 2014, ValleyCare Health System (VCHS) and SHC signed an affiliation agreement. VCHS has provided not-for-profit health care to the Tri-Valley and surrounding communities since 1961. VCHS offers a wide range of health care services at three Bay Area medical facilities in Alameda County. Closing of the affiliation is subject to various approvals including regulatory approvals. Operating Results Operating revenues increased by 10.5% to $3.0 billion. Net patient service revenue less doubtful accounts (including capitation/premium revenue) increased $272 million or 10% from FY13 to $2.9 billion and represented 97% of operating revenues. Inpatient and outpatient, which represented 47% and 53% of net patient revenues (including capitation/premium revenue), respectively, grew significantly due to overall strong volume growth and physician recruitments, including both Stanford faculty and UHA. Revenues from the QAF and Hospital Fee Programs contributed $10 million and $50 million to the FY14 and FY13 total operating revenues, respectively. Operating expenses, including salaries and benefits, were up 10.5% to $2.7 billion in FY14, including expenses related to the QAF and Hospital Fee Programs of $8 million and $29 million in FY14 and FY13, respectively. Salaries and benefits increased in response to growth in patient volumes (including UHA) and to maintain SHC’s position in the competitive market for health care professionals. Physicians’ services and support increased 13% to $482 million. This category includes all payments to the University for services provided by the School of Medicine for its clinical services. Other operating expenses were up by 9% to $905 million as a result of costs related to increased patient activity (including UHA), enhanced IT infrastructure, and other SHC initiatives. Statement of Financial Position (Balance Sheet) SHC’s Statement of Financial Position reflected continued investments in the facilities and systems required to remain at the forefront of

8
medicine and to be the provider of choice for complex care in the communities it serves. Gross property and equipment increased $359 million to $2.5 billion during FY14. As of August 31, 2014, capital spending from inception on the new Stanford Hospital was $556 million, inclusive of $52 million of capitalized interest. Unrestricted cash and investments were $2.0 billion at the end of FY14, an increase of $238 million. Other SHC Highlights Costs of charity care and uncompensated costs including those related to services provided to patients under Medi-Cal and Medicare in excess of reimbursement, were $491 million in FY14, up 20% from FY13. UHA collaborates with Stanford Medicine and community physicians to provide primary and specialty clinical services throughout the Bay Area. UHA consists of five medical groups comprising over 200 physicians and providers, a management services organization, and an independent practice association of approximately 1,600 physicians. LUCILE SALTER PACKARD CHILDREN’S HOSPITAL AT STANFORD FY14 was a year of significant accomplishments and strong operating results for LPCH. Enterprise-wide implementation of a new information system, Epic, which provides electronic medical records and end-to-end revenue capture, billing and collection, was completed. The physician network continued to grow with the addition of six medical practices and 17 providers. At four locations throughout the San Francisco Bay Area, LPCH also opened two new ambulatory care centers and acquired two new outpatient facilities, for which construction design is underway. LPCH’s hospital expansion construction continued. In FY14, LPCH issued $200 million in fixed and variable rate tax-exempt debt as part of the overall funding plan for the hospital expansion construction. Operating Results LPCH, together with Packard Children’s Health Alliance (PCHA), the Packard Medical Group and the School of Medicine Pediatric and Obstetrics Faculty Practice Organization, comprise and are known in
the marketplace as Stanford Children’s Health. However, the legal entity reported in these financial statements, known as LPCH, includes only the operations of LPCH and PCHA. Operating revenues for LPCH increased by $47 million or 4% in FY14, excluding revenues from the QAF and Hospital Fee Programs. Revenues from those Programs contributed $15 million and $83 million to the FY14 and FY13 total operating revenues, respectively. Operating expenses increased by 10% in FY14, excluding expenses related to the QAF and Hospital Fee Programs of $5 million and $24 million for FY14 and FY13, respectively. The majority of the increase in expenses was caused by costs related to the strategic investments noted previously, including such items as training and depreciation for Epic, increased salaries and benefits and higher supply costs due in part to the mix of patients, and increased payments to the University for purchased services, including physician services. As a result, LPCH generated income from operations of $43 million in FY14 compared to $147 million in FY13, including net revenue from the QAF and Hospital Fee Programs. Net assets at August 31, 2014 were $1.9 billion, reflecting an increase of $187 million over FY13. These results reflect solid operating results, positive investment performance and strong donor support. Statement of Financial Position (Balance Sheet) LPCH’s Statement of Financial Position reflects significant donor contributions and investments in the facilities and systems required to continue to provide the highest quality children’s hospital services to the community it serves. Gross property and equipment increased $272 million during FY14, including $118 million for construction of LPCH’s portion of hospital construction. Other LPCH Highlights LPCH’s community benefits, including services to patients under Medi-Cal and other publicly sponsored programs that reimburse at amounts less than the cost of services, were $203 million

9
in FY14 compared with $169 million in FY13. The increase was primarily due to more Medi-Cal patients in relation to the total hospital patients and higher Medi-Cal charges in relation to applicable costs. These amounts also include investments LPCH makes in improving the health of the children through a range of community-based programs. Looking Forward Stanford’s strong financial position, together with renewed facilities and continued investment in our physical infrastructure, provide a solid foundation as we look to the future. The generous support of our donors and commitment of the Stanford community have been essential to building our capabilities. Each of Stanford’s principal revenue sources faces challenges looking forward: The health care system is undergoing substantial change as a result of the Affordable Care Act, consolidation of major health care providers, and increased focus by Medicare and large employers on accountable care. Although Stanford Medicine has achieved outstanding financial performance over the past few years, our future success may be challenged due to these changes. In addition, the new Stanford hospitals scheduled to open in 2017
will significantly increase fixed costs for SHC and LPCH. We expect Federal funding for sponsored research to decline in the future on an inflation-adjusted basis. Today, this funding supports graduate student education, postdoctoral scholar training, state-of-the-art facilities, and, most importantly, much of the research that has made Silicon Valley and the United States an innovation powerhouse. Stanford is seeking to replace declining Federal funding with non-Federal sponsors and philanthropy, but our historic volume of research will be challenging to sustain. Investment markets are inherently volatile, and Stanford has adopted a philosophy aimed at maximizing long-term returns with a high tolerance for short-term volatility. As a result, the downturn we experienced in 2008-09 could readily happen again. Although the United States economy is performing well, the global economy continues to be unsettled and a dramatic reversal of recent investment gains could occur at any time. Stanford addresses these risks and situations proactively, always mindful of the end goal of preserving our mission and the institution for future generations.
Randall S. Livingston M. Suzanne Calandra Vice President for Business Affairs Senior Associate Vice President for Finance and Chief Financial Officer Stanford University Stanford University
Daniel J. Morissette Dana Haering Chief Financial Officer Chief Financial Officer Stanford Health Care Lucile Salter Packard Children’s Hospital at Stanford

10
SELECTED FINANCIAL AND OTHER DATA Fiscal Years Ended August 31
2014 2013 2012 2011 2010
CONSOLIDATED STATEMENT OF ACTIVITIES HIGHLIGHTS:Total operating revenues 7,924$ 7,359$ 6,814$ 6,289$ 5,707$
Student income (A) 534 511 481 458 436 Sponsored research support 1,266 1,233 1,234 1,247 1,143 Health care services 3,942 3,734 3,245 2,902 2,542
Total operating expenses 7,389 6,794 6,298 5,774 5,345
Change in net assets from operating activities 535 565 516 515 362 Other changes in net assets 3,582 2,441 1,043 3,194 1,131
Net change in total net assets 4,117$ 3,006$ 1,559$ 3,709$ 1,493$
CONSOLIDATED STATEMENT OF FINANCIAL POSITION HIGHLIGHTS:
UniversityInvestments at fair value 27,829$ 24,703$ 22,247$ 21,189$ 17,804$ Plant facilities, net of accumulated depreciation 4,559 4,208 3,826 3,674 3,584 Notes and bonds payable 3,265 3,098 2,709 2,727 2,816 Total assets 35,227 31,540 28,981 27,698 24,553 Total liabilities 6,006 5,817 5,476 5,143 5,118 Total net assets 29,221 25,723 23,505 22,555 19,435
HospitalsInvestments at fair value 2,635 2,271 1,899 1,796 1,359 Plant facilities, net of accumulated depreciation 2,273 1,787 1,494 1,333 1,283 Notes and bonds payable 1,874 1,684 1,700 983 992 Total assets 7,319 6,448 5,803 4,283 3,658 Total liabilities 2,741 2,489 2,633 1,722 1,686 Total net assets 4,578 3,959 3,170 2,561 1,972
OTHER UNIVERSITY FINANCIAL DATA AND METRICS:
Total endowment at year end 21,446$ 18,689$ 17,036$ 16,503$ 13,851$ Endowment payout in support of operations 985 921 871 785 855 As a % of beginning of year endowment 5.3% 5.4% 5.3% 5.7% 6.8%As a % of total expenses 23.0% 23.2% 23.1% 22.4% 25.9%
Total gifts (B) 928 932 1,035 709 599
STUDENTS:ENROLLMENT: (C)Undergraduate 7,018 6,980 6,999 6,927 6,887 Graduate (D) 9,118 8,980 8,958 8,883 8,870
DEGREES CONFERRED:Bachelor degrees 1,651 1,661 1,715 1,670 1,671 Advanced degrees 3,292 3,365 3,305 3,199 3,046
FACULTY:Total Professoriate 2,043 1,995 1,934 1,903 1,910
ANNUAL UNDERGRADUATE TUITION RATE (IN DOLLARS) 42,690$ 41,250$ 40,050$ 38,700$ 37,380$
(A) Financial aid is reported as a reduction of student income in the Statements of Activities.(B) As reported by the Office of Development. Includes SHC gifts (See Note 14).(C) Enrollment for fall quarter immediately following fiscal year end.(D) Enrollment for 2010 - 2013 revised to include Master of Liberal Arts online program.
(dollars in millions)

11
MANAGEMENT RESPONSIBILITY FOR FINANCIAL STATEMENTS The University is the sole member of Stanford Health Care (formerly known as Stanford Hospital and Clinics) and Lucile Packard Children’s Hospital at Stanford (collectively, the “Hospitals”); however, each of the Hospitals has its own separate management with responsibility for its own financial reporting. Management of the University and the Hospitals is responsible for the integrity and reliability of their respective portions of these financial statements. The University oversees the process of consolidating the Hospitals’ information into the consolidated financial statements. Management of each entity represents that, with respect to its financial information, the consolidated financial statements in this annual report have been prepared in conformity with accounting principles generally accepted in the United States of America. In accumulating and controlling financial data, management of the University and the Hospitals maintains separate systems of internal accounting controls. Management of the respective entities believes that effective internal controls have been designed, implemented and maintained to provide reasonable assurance that assets are protected and that transactions and events are recorded properly. All internal control systems, however, no matter how well designed, have inherent limitations and can provide only reasonable assurance that their objectives are met. The accompanying consolidated financial statements have been audited by the University’s and Hospitals’ independent auditors, PricewaterhouseCoopers LLP. Their report expresses an informed judgment as to whether the consolidated financial statements, considered in their entirety, present fairly, in conformity with accounting principles generally accepted in the United States of America, the consolidated financial position and changes in net assets and cash flows. The independent auditor’s opinion is based on audit procedures described in their report, which include obtaining an understanding of systems, procedures and internal accounting controls, and performing tests and other audit procedures to provide reasonable assurance that the financial statements are neither materially misleading nor contain material errors. The Board of Trustees of the University and the separate Boards of Directors of the Hospitals, through their respective Audit and Compliance Committees, comprised of trustees and directors not employed by the University or the Hospitals, are responsible for engaging the independent auditors and meeting with management, internal auditors and the independent auditors to independently assess whether each is carrying out its responsibility and to discuss auditing, internal control and financial reporting matters. Both the internal auditors and the independent auditors have full and free access to the respective Audit and Compliance Committees. Both meet with the respective Audit and Compliance Committees at least annually, with and without each other, and without the presence of management representatives.
Randall S. Livingston M. Suzanne Calandra Vice President for Business Affairs Senior Associate Vice President for Finance and Chief Financial Officer Stanford University Stanford University
Daniel J. Morissette Dana Haering Chief Financial Officer Chief Financial Officer Stanford Health Care Lucile Salter Packard Children’s Hospital at Stanford
PricewaterhouseCoopers LLP, Three Embarcadero Center, San Francisco, CA 94111-4004 T: (415) 498 5000, F: (415) 498 7100, www.pwc.com/us
Independent Auditor's Report
To the Board of Trustees of the Leland Stanford Junior University
We have audited the accompanying consolidated financial statements of the Leland Stanford Junior University (“Stanford University” or the “University”) and its subsidiaries, which comprise the consolidated statements of financial position as of August 31, 2014 and 2013, and the related consolidated statements of activities and cash flows for the years then ended.
Management's Responsibility for the Consolidated Financial Statements Management is responsible for the preparation and fair presentation of the consolidated financial statements in accordance with accounting principles generally accepted in the United States of America; this includes the design, implementation, and maintenance of internal control relevant to the preparation and fair presentation of consolidated financial statements that are free from material misstatement, whether due to fraud or error.
Auditor's Responsibility Our responsibility is to express an opinion on the consolidated financial statements based on our audits. We conducted our audits in accordance with auditing standards generally accepted in the United States of America. Those standards require that we plan and perform the audit to obtain reasonable assurance about whether the consolidated financial statements are free from material misstatement.
An audit involves performing procedures to obtain audit evidence about the amounts and disclosures in the consolidated financial statements. The procedures selected depend on our judgment, including the assessment of the risks of material misstatement of the consolidated financial statements, whether due to fraud or error. In making those risk assessments, we consider internal control relevant to the University's preparation and fair presentation of the consolidated financial statements in order to design audit procedures that are appropriate in the circumstances, but not for the purpose of expressing an opinion on the effectiveness of the University's internal control. Accordingly, we express no such opinion. An audit also includes evaluating the appropriateness of accounting policies used and the reasonableness of significant accounting estimates made by management, as well as evaluating the overall presentation of the consolidated financial statements. We believe that the audit evidence we have obtained is sufficient and appropriate to provide a basis for our audit opinion.
Opinion In our opinion, the consolidated financial statements referred to above present fairly, in all material respects, the financial position of the Leland Stanford Junior University and its subsidiaries at August 31, 2014 and 2013, and the results of their activities and their cash flows for the years then ended in accordance with accounting principles generally accepted in the United States of America.
December 10, 2014
13
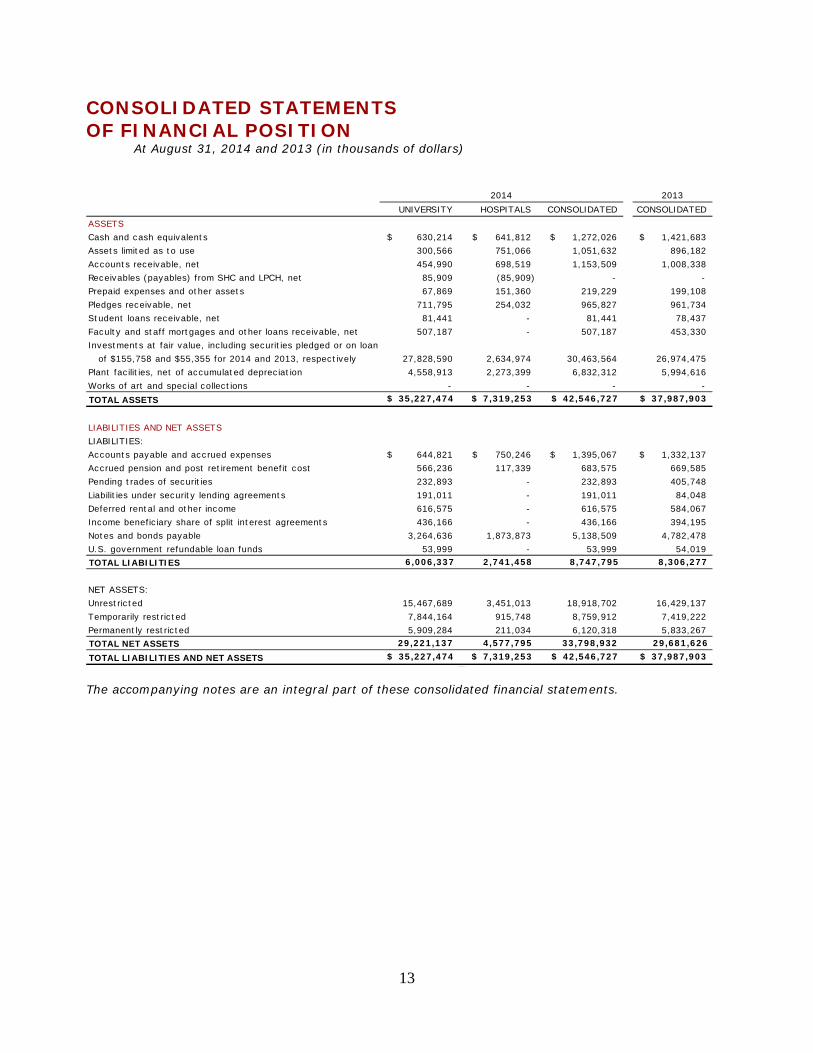
CONSOLIDATED STATEMENTS OF FINANCIAL POSITION
At August 31, 2014 and 2013 (in thousands of dollars)
2013
UNIVERSITY HOSPITALS CONSOLIDATED CONSOLIDATEDASSETSCash and cash equivalents 630,214$ 641,812$ 1,272,026$ 1,421,683$ Assets limited as to use 300,566 751,066 1,051,632 896,182 Accounts receivable, net 454,990 698,519 1,153,509 1,008,338 Receivables (payables) from SHC and LPCH, net 85,909 (85,909) - - Prepaid expenses and other assets 67,869 151,360 219,229 199,108 Pledges receivable, net 711,795 254,032 965,827 961,734 Student loans receivable, net 81,441 - 81,441 78,437 Faculty and staff mortgages and other loans receivable, net 507,187 - 507,187 453,330 Investments at fair value, including securities pledged or on loan of $155,758 and $55,355 for 2014 and 2013, respectively 27,828,590 2,634,974 30,463,564 26,974,475 Plant facilities, net of accumulated depreciation 4,558,913 2,273,399 6,832,312 5,994,616 Works of art and special collections - - - - TOTAL ASSETS $ 35,227,474 $ 7,319,253 $ 42,546,727 $ 37,987,903
LIABILITIES AND NET ASSETSLIABILITIES:Accounts payable and accrued expenses 644,821$ 750,246$ 1,395,067$ 1,332,137$ Accrued pension and post retirement benefit cost 566,236 117,339 683,575 669,585 Pending trades of securities 232,893 - 232,893 405,748 Liabilities under security lending agreements 191,011 - 191,011 84,048 Deferred rental and other income 616,575 - 616,575 584,067 Income beneficiary share of split interest agreements 436,166 - 436,166 394,195 Notes and bonds payable 3,264,636 1,873,873 5,138,509 4,782,478 U.S. government refundable loan funds 53,999 - 53,999 54,019 TOTAL LIABILITIES 6,006,337 2,741,458 8,747,795 8,306,277
NET ASSETS:Unrestricted 15,467,689 3,451,013 18,918,702 16,429,137 Temporarily restricted 7,844,164 915,748 8,759,912 7,419,222 Permanently restricted 5,909,284 211,034 6,120,318 5,833,267 TOTAL NET ASSETS 29,221,137 4,577,795 33,798,932 29,681,626 TOTAL LIABILITIES AND NET ASSETS $ 35,227,474 $ 7,319,253 $ 42,546,727 $ 37,987,903
2014
The accompanying notes are an integral part of these consolidated financial statements.

14
CONSOLIDATED STATEMENTS OF ACTIVITIES For the years ended August 31, 2014 and 2013 (in thousands of dollars)
2014 2013
UNIVERSITY HOSPITALS CONSOLIDATED CONSOLIDATEDUNRESTRICTED NET ASSETS OPERATING REVENUES:Student income:
Undergraduate programs 317,401$ -$ 317,401$ 311,027$ Graduate programs 313,824 - 313,824 297,042 Room and board 151,313 - 151,313 144,887 Student financial aid (248,848) - (248,848) (241,512)
TOTAL STUDENT INCOME 533,690 - 533,690 511,444
Sponsored research support: Direct costs - University 669,670 - 669,670 657,296 Direct costs - SLAC National Accelerator Laboratory 369,317 - 369,317 350,406 Indirect costs 227,160 - 227,160 225,500
TOTAL SPONSORED RESEARCH SUPPORT 1,266,147 - 1,266,147 1,233,202
Health care services:Patient care, net - 3,914,973 3,914,973 3,710,326 Physicians' services and support - SHC and LPCH, net 670,023 (670,023) - - Physicians' services and support - other facilities, net 27,482 - 27,482 23,250
TOTAL HEALTH CARE SERVICES 697,505 3,244,950 3,942,455 3,733,576 CURRENT YEAR GIFTS IN SUPPORT OF OPERATIONS 211,841 678 212,519 185,145
Net assets released from restrictions:Payments received on pledges 98,630 1,556 100,186 81,781 Prior year gifts released from donor restrictions 38,063 8,148 46,211 45,231
TOTAL NET ASSETS RELEASED FROM RESTRICTIONS 136,693 9,704 146,397 127,012
Investment income distributed for operations:Endowment 985,215 14,551 999,766 934,303 Expendable funds pools and other investment income 180,895 735 181,630 84,458
TOTAL INVESTMENT INCOME DISTRIBUTED FOR OPERATIONS 1,166,110 15,286 1,181,396 1,018,761
SPECIAL PROGRAM FEES AND OTHER INCOME 493,446 148,096 641,542 549,428
TOTAL OPERATING REVENUES 4,505,432 3,418,714 7,924,146 7,358,568
OPERATING EXPENSES:Salaries and benefits 2,659,610 1,689,502 4,349,112 4,029,022 Depreciation 310,958 148,185 459,143 425,585 Other operating expenses 1,321,272 1,259,750 2,581,022 2,339,137
TOTAL OPERATING EXPENSES 4,291,840 3,097,437 7,389,277 6,793,744 CHANGE IN NET ASSETS FROM OPERATING ACTIVITIES $ 213,592 $ 321,277 $ 534,869 $ 564,824
The accompanying notes are an integral part of these consolidated financial statements.

15
CONSOLIDATED STATEMENTS OF ACTIVITIES, Continued For the years ended August 31, 2014 and 2013 (in thousands of dollars)
2014 2013UNIVERSITY HOSPITALS CONSOLIDATED CONSOLIDATED
UNRESTRICTED NET ASSETS (continued)
CHANGE IN NET ASSETS FROM OPERATING ACTIVITIES $ 213,592 $ 321,277 $ 534,869 $ 564,824
NON-OPERATING ACTIVITIES:Increase in reinvested gains 1,561,670 288,009 1,849,679 1,077,779 Donor advised funds, net 29,314 - 29,314 1,930 Current year gifts not included in operations 17,673 - 17,673 2,902 Equity and fund transfers from Hospitals, net 69,018 (69,018) - - Capital and other gifts released from restrictions 167,626 380 168,006 201,483 Pension and other post employment benefit related changes other than net periodic benefit expense 11,952 5,725 17,677 178,080 Transfer to permanently restricted net assets, net (41,232) - (41,232) (37,010) Transfer to temporarily restricted net assets, net (41,028) - (41,028) (19,621) Swap interest and change in value of swap agreements (12,072) (37,532) (49,604) 120,610 Other 5,765 (1,554) 4,211 (185) NET CHANGE IN UNRESTRICTED NET ASSETS 1,982,278 507,287 2,489,565 2,090,792
TEMPORARILY RESTRICTED NET ASSETSGifts and pledges, net 372,875 88,179 461,054 441,719 Increase in reinvested gains 1,083,505 44,460 1,127,965 558,697 Change in value of split interest agreements, net 18,470 212 18,682 1,438 Net assets released to operations (136,693) (25,668) (162,361) (146,327) Capital and other gifts released to unrestricted net assets (167,626) (380) (168,006) (201,483) Gift transfers to Hospitals, net (2,575) 2,575 - - Transfer from unrestricted net assets, net 41,028 - 41,028 19,621 Transfer from permanently restricted net assets, net 25,483 - 25,483 4,744 Other (3,058) (97) (3,155) (2,149) NET CHANGE IN TEMPORARILY RESTRICTED NET ASSETS 1,231,409 109,281 1,340,690 676,260
PERMANENTLY RESTRICTED NET ASSETSGifts and pledges, net 154,068 764 154,832 164,860 Increase in reinvested gains 64,256 - 64,256 17,261 Change in value of split interest agreements, net 50,276 1,938 52,214 24,987 Transfer from unrestricted net assets, net 41,232 - 41,232 37,010 Transfer to temporarily restricted net assets, net (25,483) - (25,483) (4,744) NET CHANGE IN PERMANENTLY RESTRICTED NET ASSETS 284,349 2,702 287,051 239,374 NET CHANGE IN TOTAL NET ASSETS 3,498,036 619,270 4,117,306 3,006,426 Total net assets, beginning of year 25,723,101 3,958,525 29,681,626 26,675,200
TOTAL NET ASSETS, END OF YEAR $ 29,221,137 $ 4,577,795 $ 33,798,932 $ 29,681,626 The accompanying notes are an integral part of these consolidated financial statements.

16
CONSOLIDATED STATEMENTS OF CASH FLOWS For the years ended August 31, 2014 and 2013 (in thousands of dollars)
2014 2013UNIVERSITY HOSPITALS CONSOLIDATED CONSOLIDATED
CASH FLOW FROM OPERATING ACTIVITIESChange in net assets 3,498,036$ 619,270$ 4,117,306$ 3,006,426$ Adjustments to reconcile change in net assets to net cash
provided by (used for) operating activities:Depreciation 310,958 148,185 459,143 425,585 Amortization, loss on disposal of fixed assets and other adjustments 6,272 (2,537) 3,735 12,149 Net gains on investments and security agreements (3,667,658) (264,103) (3,931,761) (2,365,886) Net losses (gains) on derivatives 8,616 - 8,616 (34,407) Changes in split interest agreements 34,672 (2,150) 32,522 27,024 Investment income for restricted purposes (29,526) (25,693) (55,219) (27,246) Gifts restricted for long-term investments (247,716) (68,508) (316,224) (295,605) Equity and fund transfers from Hospitals (66,443) 66,443 - - Gifts of securities and properties (11,372) - (11,372) (50,025)
Premiums received from bond issuance 97,359 8,382 105,741 113,731 Changes in operating assets and liabilities:
Accounts receivable and receivables from SHC and LPCH, net (12,865) (42,827) (55,692) (49,276) Pledges receivable (107,032) - (107,032) (12,999) Prepaid expenses and other assets (3,698) (15,331) (19,029) (14,728) Accounts payable and accrued expenses 17,588 61,857 79,445 (64,911) Accrued pension and post retirement benefit costs 23,312 (9,322) 13,990 (133,960) Deferred rental and other income 32,508 - 32,508 27,339
Other - (3,780) (3,780) (3,126) NET CASH PROVIDED BY (USED FOR) OPERATING ACTIVITIES (116,989) 469,886 352,897 560,085
CASH FLOW FROM INVESTING ACTIVITIESLand, building and equipment purchases (696,511) (620,333) (1,316,844) (1,032,377) Student, faculty and other loans:
New loans made (118,134) - (118,134) (70,684) Principal collected 56,084 - 56,084 70,077
Increase in assets limited as to use (135,328) (20,117) (155,445) (167,858) Purchases of investments (25,113,421) (151,650) (25,265,071) (20,252,633) Sales and maturities of investments 25,418,479 104,460 25,522,939 19,892,351
NET CASH USED FOR INVESTING ACTIVITIES (588,831) (687,640) (1,276,471) (1,561,124)
CASH FLOW FROM FINANCING ACTIVITIESGifts and reinvested income for restricted purposes 312,701 94,782 407,483 477,155 Equity and fund transfers from Hospitals 56,453 (56,453) - - Proceeds from borrowing 623,127 200,000 823,127 496,719 Bond issuance costs and interest rate swaps (2,423) (1,284) (3,707) (2,229) Repayment of notes and bonds payable (545,210) (14,910) (560,120) (226,856) Increase (decrease) in liabilities under security lending agreements 106,963 - 106,963 (57,151) Other (20) 191 171 236 NET CASH PROVIDED BY FINANCING ACTIVITIES 551,591 222,326 773,917 687,874 INCREASE (DECREASE) IN CASH AND CASH EQUIVALENTS (154,229) 4,572 (149,657) (313,165)Cash and cash equivalents, beginning of year 784,443 637,240 1,421,683 1,734,848 CASH AND CASH EQUIVALENTS, END OF YEAR $ 630,214 $ 641,812 $ 1,272,026 $ 1,421,683
SUPPLEMENTAL DATA:Interest paid, net of capitalized interest 111,210$ 58,701$ 169,911$ 201,632$ Cash collateral received under security lending agreements 163,449$ -$ 163,449$ 57,810$ Increase (decrease) in payables for plant facilities (34,797)$ $ 14,416 (20,381)$ 67,389$
The accompanying notes are an integral part of these consolidated financial statements.

17
NOTES TO THE CONSOLIDATED FINANCIAL STATEMENTS
1. Basis of Presentation and Significant Accounting Policies
BASIS OF PRESENTATION The consolidated financial statements include the accounts of Stanford University (the “University”), Stanford Health Care (SHC), formerly known as Stanford Hospital and Clinics, as well as Lucile Salter Packard Children’s Hospital at Stanford (LPCH) and other majority-owned or controlled entities of these organizations. All significant inter-entity transactions and balances have been eliminated upon consolidation. Certain prior year amounts have been reclassified to conform to the current year’s presentation. These reclassifications had no impact on the change in net assets or total net assets. University The University is a private, not-for-profit educational institution, founded in 1885 by Senator Leland and Mrs. Jane Stanford in memory of their son, Leland Stanford Jr. A Board of Trustees (the “Board”) governs the University. The University category presented in the consolidated financial statements comprises all of the accounts of the University, including its institutes and research centers, and the Stanford Management Company.
SLAC National Accelerator Laboratory (SLAC) is a federally funded research and development center owned by the Department of Energy (DoE). The University manages and operates SLAC for the DoE under a management and operating contract; accordingly, the revenues and expenditures of SLAC are included in the University’s Statements of Activities, but SLAC’s assets and liabilities are not included in the University’s Statements of Financial Position. SLAC employees are University employees and participate in the University's employee benefit programs. The University holds some receivables from the DoE substantially related to reimbursement for employee compensation and benefits. Hospitals SHC and LPCH are California not-for-profit public benefit corporations. The University is the sole member of each of these entities. SHC and LPCH support the mission of medical education and clinical research of the University’s School of Medicine (SoM). Collectively, these entities comprise Stanford Medicine. They operate two licensed acute care and specialty hospitals on the Stanford campus and numerous physician clinics on the campus, in community settings and in association with regional hospitals in the San Francisco Bay Area and elsewhere in California. The University has partnered with SHC and LPCH, respectively, to establish physician practice management organizations to support Stanford Medicine’s mission of delivering quality care to the community and conducting research and education.
The “Hospitals” category presented in the consolidated financial statements comprises all of the accounts of SHC, LPCH, the University HealthCare Alliance and Packard Children’s Health Alliance physician practice management organizations, and a captive insurance company which SHC and LPCH jointly control. For purposes of presentation of the Hospitals’ balance sheets, statements of operations and changes in net assets and statements of cash flows in these consolidated financial statements, conforming reclassifications have been made to the Hospitals’ revenues, expenses, investment income and inter-entity receivables and payables consistent with categories in these consolidated financial statements.

18
TAX STATUS The University and the Hospitals are exempt from federal and state income taxes to the extent provided by Section 501(c)(3) of the Internal Revenue Code and equivalent state provisions, except with regard to unrelated business income which is taxed at corporate income tax rates. In accordance with the guidance on accounting for uncertainty in income taxes, management regularly evaluates its tax positions and does not believe the University or Hospitals have any uncertain tax positions that require disclosure or adjustment to the consolidated financial statements. The University and Hospitals are subject to routine audits by taxing jurisdictions. The University and Hospitals believe they are no longer subject to income tax examinations for fiscal years prior to August 31, 2010. BASIS OF ACCOUNTING The consolidated financial statements are prepared in accordance with accounting principles generally accepted in the United States of America (“U.S. GAAP”). These principles require management to make estimates and assumptions that affect the reported amounts of assets and liabilities, the disclosure of contingent assets and liabilities at the date of the consolidated financial statements and the reported amounts of revenues and expenses during the reporting period. Actual results could differ from those estimates. For financial reporting purposes, net assets and revenues, expenses, gains and losses are classified into one of three categories - unrestricted, temporarily restricted or permanently restricted.
Unrestricted Net Assets Unrestricted net assets are expendable resources which are not subject to donor-imposed restrictions. Unrestricted net assets include funds designated for operations, net investment in plant facilities, certain investment and endowment gains and funds functioning as endowment. These net assets may be designated by the University or the Hospitals for specific purposes under internal operating and administrative arrangements or be subject to contractual agreements with external parties. Donor-restricted contributions that relate to the University’s or the Hospitals’ core activities and are received and expended or deemed expended based on the nature of donors’ restrictions are classified as unrestricted. All expenses are recorded as a reduction of unrestricted net assets. The operating activities of the University and the Hospitals include the revenues earned and expenses incurred in the current year to support the University’s core activities of teaching and research or the Hospitals’ patient care, teaching and research missions. The non-operating activities of the University and Hospitals include increases in reinvested gains, current year gifts not included in operations, capital and other gifts released from restrictions, pension and other post employment benefit related changes other than net periodic benefit expense and certain other non-operating activities. Transfers from unrestricted net assets to temporarily restricted net assets and permanently restricted net assets are primarily the result of donor redesignations or matching funds that are added to donor gift funds which then take on the same restrictions as the donor gift. Temporarily Restricted Net Assets Temporarily restricted net assets include gifts and pledges that are subject to donor-imposed restrictions that expire with the passage of time, payment of pledges or specific actions to be undertaken by the University or the Hospitals, which are then released and reclassified to unrestricted net assets. In addition, appreciation and income on certain donor-restricted endowment funds are classified as temporarily restricted net assets until authorized for spending (see Notes 12 and 13). Donor-restricted resources intended for capital projects are initially recorded as temporarily restricted and released from their temporary restrictions and reclassified as unrestricted net assets when the asset is placed in service.

19
Also included in this category is the University’s net equity in split interest agreements that are expendable at maturity. Permanently Restricted Net Assets Permanently restricted net assets consist primarily of endowment, annuity and life income funds which are subject to donor-imposed restrictions requiring that the principal be invested in perpetuity. Permanently restricted net assets may also include funds reclassified from other classes of net assets as a result of donor-imposed stipulations, the University’s net equity in split interest agreements that are not expendable at maturity and net assets which by donor stipulation must be made available in perpetuity for specific purposes. CASH AND CASH EQUIVALENTS Cash and cash equivalents included in the Statements of Financial Position consist of U.S. Treasury bills, commercial paper, certificates of deposit, money market funds and all other short-term investments with original maturities of 90 days or less at the time of purchase. These amounts are carried at cost, which approximates fair value. Cash and cash equivalents that are held for investment purposes are classified as investments (see Note 5). ASSETS LIMITED AS TO USE Assets limited as to use include accounts of the University that solely hold proceeds of tax-exempt bonds issued for the benefit of the University and limited by the terms of indentures to use for qualified University capital projects. Assets limited as to use also include trustee-held accounts holding proceeds of tax-exempt bonds issued for the benefit of the Hospitals and limited by the terms of indentures to use for qualified Hospital capital projects. Assets limited as to use consist of cash and cash equivalents and short-term investments, recorded at cost, which approximates fair value. ACCOUNTS AND LOANS RECEIVABLE Accounts and loans receivable are carried at cost, less an allowance for doubtful accounts. PLEDGES RECEIVABLE Unconditional promises to give are included in the consolidated financial statements as pledges receivable and are classified as temporarily restricted or permanently restricted, depending upon donor stipulations. Pledges recognized on or after September 1, 2008 are recorded at an applicable risk-adjusted discount rate commensurate with the duration of the donor’s payment plan. Pledges recognized in periods prior to September 1, 2008 were recorded at a discount based on the U.S. Treasury rate. Conditional promises, which depend on the occurrence of a specified future and uncertain event, such as matching gifts from other donors, are recognized when the conditions are substantially met. INVESTMENTS Investments are recorded at fair value. Gains and losses (realized and unrealized) on investments are recognized in the Statements of Activities (see Note 5).

20
The investment portfolio may be exposed to various risks, including, but not limited to, interest rate, market, sovereign, concentration, counterparty, liquidity and credit risk. Fair value reporting requires management to make estimates and assumptions about the effects of matters that are inherently uncertain. Estimates developed using methods such as discounted cash flow are subjective, requiring significant judgments such as the amount and timing of future cash flows and the selection of appropriate discount rates that reflects market and credit risks. Management of the University and the Hospitals regularly assess these risks through established policies and procedures. Actual results could differ from these estimates and such differences could have a material impact on the consolidated financial statements. PLANT FACILITIES Plant facilities are recorded at cost or, for donated assets, at fair value at the date of donation. Interest expense for construction financing, net of income earned on unspent proceeds, is capitalized as a cost of construction. Depreciation is computed using the straight-line method over the estimated useful lives of the assets. The useful lives used in calculating depreciation for the years ended August 31, 2014 and 2013 are as follows:
UNIVERSITY HOSPITALSLand improvements 10-25 years 10-25 yearsBuildings and building improvements 4-50 years 7-40 yearsFurniture, fixtures and equipment 3-10 years 3-20 yearsUtilities 5-40 years N/A
WORKS OF ART AND SPECIAL COLLECTIONS Works of art, historical treasures, literary works and artifacts, which are preserved and protected for educational, research and public exhibition purposes, are not capitalized. Donations of such collections are not recorded for financial statement purposes. Purchases of collection items are recorded as operating expenses in the period in which they are acquired. Proceeds from sales of such items are used to acquire other items for the collections. DONATED ASSETS Donated assets, other than works of art and special collections as discussed above, are recorded at fair value at the date of donation. Undeveloped land, including land acquired under the original endowment from Senator Leland and Mrs. Jane Stanford, is reported at fair value at the date of acquisition. Under the terms of the original founding grant, a significant portion of University land may not be sold. DONOR ADVISED FUNDS The University receives gifts from donors under donor advised fund (DAF) agreements. These funds are owned and controlled by the University and are separately identified by donor. A significant portion of the gift must be designated to the University. At August 31, 2014 and 2013, approximately $321.3 million and $268.1 million, respectively, of DAFs may be used to support other approved charities; the donors have advisory privileges with respect to the distribution of these funds. Current year gifts under the DAF agreements are included in the Statements of Activities as “donor advised funds, net” at the full amount of the gift. Transfers of funds to other charitable organizations are included in the Statements of Activities as a reduction to “donor advised funds, net” at the time the transfer is made.

21
SPLIT INTEREST AGREEMENTS Split interest agreements consist of arrangements with donors where the University and the Hospitals have an interest in assets held by the trustee and receive benefits that are shared with other beneficiaries. Split interest agreements where the University and the Hospitals are not the trustee are recorded in the “assets held by other trustees” category of “investments” in the Statements of Financial Position as described in Note 5. The assets held under split interest agreements where the University is the trustee were $773.6 million and $679.7 million at August 31, 2014 and 2013, respectively, and were recorded in various categories in “investments”; the discounted present value of any income beneficiary interest is reported as “income beneficiary share of split interest agreements” in the Statements of Financial Position. The discount rates used, which range from 1% to 6%, are established in the year the gift was received and are based on tables established by the Internal Revenue Service. During fiscal years 2014 and 2013, the discounted present value of new gifts subject to split interest agreements where the University is the trustee, net of the income beneficiary share, were $17.9 million and $21.2 million, respectively, and were included in “gifts and pledges, net” in the Statements of Activities. Actuarial gains or losses are included in “change in value of split interest agreements, net” in the Statements of Activities.
Funds subject to donor-imposed restrictions requiring that the principal be invested in perpetuity are classified as “permanently restricted net assets” in the Statements of Financial Position; all others are classified as “temporarily restricted net assets” until the expiration of the donor-imposed restrictions, at which point they will be classified as “unrestricted net assets.” SELF-INSURANCE The University self-insures at varying levels for unemployment, disability, workers’ compensation, property losses, certain health care plans and general and professional liability losses. The Hospitals self-insure at varying levels for health care plans, workers’ compensation and, through their captive insurance company, for professional liability losses. Third-party insurance is purchased to cover liabilities above the self-insurance limits. Estimates of retained exposures are accrued. INTEREST RATE EXCHANGE AGREEMENTS The University and the Hospitals have entered into several interest rate exchange agreements to reduce the effect of interest rate fluctuation on their variable rate revenue bonds and notes. Current accounting guidance for derivatives and hedges requires entities to recognize all derivative instruments at fair value. The University and the Hospitals do not designate and qualify their derivatives for hedge accounting; accordingly, any changes in the fair value (i.e. gains or losses) flow directly to the Statements of Activities in “swap interest and change in value of swap agreements”. The settlements (net cash payments less receipts) under the interest rate exchange agreements are recorded in the Statements of Activities in “swap interest and change in value of swap agreements” for the University and in “other operating expenses” for the Hospitals. The University has entered into interest rate swaps to reduce the effect of interest rate fluctuations of certain investment positions (see Note 7).
STUDENT INCOME Financial assistance in the form of scholarship and fellowship grants that cover a portion of tuition, living and other costs is reflected as a reduction of student income.
22
PATIENT CARE AND OTHER SERVICES Health Care Services The Hospitals derive a majority of patient care revenues from contractual agreements with Medicare, Medi-Cal and other third-party payers. Payments under these agreements and programs are based on a variety of payment models. “Patient care, net” is reported in the Statements of Activities at the estimated net realizable amounts from patients, third-party payers, and others for services rendered, including estimated retroactive audit adjustments under reimbursement agreements with third-party payers and bad debts. Retroactive adjustments are estimated and recorded in the period the related services are rendered and adjusted in future periods, as final settlements are determined. Contracts, laws and regulations governing the Medicare and Medi-Cal programs are complex and subject to interpretation. As a result, it is reasonably possible that recorded estimates may change by a material amount in the near term. The Hospitals provision for doubtful accounts of $153.5 million and $123.5 million, respectively, for the years ended August 31, 2014 and 2013, is based upon management’s assessment of expected net collections considering historical experience and other collection indicators. The University has entered into various operating agreements with the Hospitals for the professional services of SoM faculty members, and for non-physician services such as telecommunications, facilities, and other services. Charity Care The Hospitals provide care to patients who meet certain criteria under their charity care policies without charge or at amounts less than their established rates. The Hospitals do not record revenue for amounts determined to qualify as charity care. The estimated cost of providing charity care was $17.4 million and $20.4 million for the years ended August 31, 2014 and 2013, respectively. This cost is estimated by calculating a ratio of total costs to gross patient service charges at established rates, and then multiplying that ratio by gross uncompensated patient service charges at established rates associated with providing care to charity patients. The Hospitals received $684 thousand and $652 thousand during the years ended August 31, 2014 and 2013, respectively, from contributions that were restricted for the care of indigent patients. The Hospitals also provide services to other patients under the Medicare, Medi-Cal and other publicly sponsored programs, which reimburse at amounts less than the cost of the services provided to the recipients. Estimated costs in excess of reimbursements for the Medicare, Medi-Cal and other publicly sponsored programs for the years ended August 31, 2014 and 2013 were $676.8 million and $557.3 million, respectively. Provider Fee The State of California enacted legislation in 2009 through 2014 which established a Hospital Quality Assurance Fee (QAF) Program and a Hospital Fee Program. These programs imposed a provider fee on certain California general acute care hospitals that, combined with federal matching funds, would be used to provide supplemental payments to certain hospitals and support the State’s effort to maintain health care coverage for children. Certain rates under these programs are pending approval from the Centers for Medicare & Medicaid Services. For the years ended August 31, 2014 and 2013, the Hospitals recorded $12.9 million and $52.6 million, respectively, in “other operating expenses” and recognized $24.1 million and $133.0 million, respectively, in “patient care, net” revenue under these programs.

23
RECENT ACCOUNTING PRONOUNCEMENTS In May 2014, the Financial Accounting Standards Board (FASB) issued an update to the Accounting Standards Codification (ASC) to improve consistency of revenue recognition practices across industries for economically similar transactions. The core principle is that an entity recognizes revenue for goods or services to customers in an amount that reflects the consideration it expects to receive in return. The guidance is effective for periods beginning after December 15, 2016. The University and Hospitals are currently evaluating the impact that this guidance will have on its consolidated financial statements.
In October 2012, the FASB issued an update to the ASC to improve consistency in the classification of cash receipts from the sale of certain donated financial assets, such as securities, in the statement of cash flows. This guidance requires an entity to classify such cash receipts consistently with cash donations received if those receipts were from the sale of donated financial assets that have no entity-imposed limitations for sale and were converted nearly immediately into cash. The guidance is effective for periods beginning after June 15, 2013. The University and Hospitals adopted this guidance in fiscal year 2014 and applied it retroactively. Accordingly, consolidated cash receipts from the sale of donated financial assets of $128.7 million and $80.7 million were classified in the operating and financing sections, respectively, in the Statement of Cash Flows for the year ended August 31, 2014. For fiscal year 2013, $158.9 million of consolidated cash receipts were reclassified from the investing section to the operating section ($52.8 million) and financing section ($106.1 million) in the Statement of Cash Flows.
In December 2011, the FASB issued an update to the ASC which expanded the required disclosures about offsetting and related arrangements of an entity’s financial assets and liabilities. The disclosures are intended to provide additional information to assist financial statement users in understanding the effect of those arrangements on the entity’s financial position. This guidance is effective for annual periods beginning after January 1, 2013. The University and Hospitals have adopted this guidance for the year ended August 31, 2014 (see Notes 5 and 7).

24
2. Accounts Receivable Accounts receivable, net of bad debt allowances, at August 31, 2014 and 2013, in thousands of dollars, are as follows:
2013UNIVERSITY HOSPITALS CONSOLIDATED CONSOLIDATED
U.S. government sponsors 82,388$ $ - 82,388$ 77,613$ Non-federal sponsors and programs 41,034 1,581 42,615 75,624 Pending trades of securities 272,243 - 272,243 194,331 Accrued interest on investments 13,059 - 13,059 8,659 Student 6,055 - 6,055 6,808 Patient and third-party payers - 799,694 799,694 704,409 Other 42,317 33,736 76,053 58,112 457,096 835,011 1,292,107 1,125,556 Less bad debt allowances (2,106) (136,492) (138,598) (117,218)ACCOUNTS RECEIVABLE, NET $ 454,990 $ 698,519 $ 1,153,509 $ 1,008,338
2014
Amounts due from Blue Cross and Blue Shield represent 21% and 12%, and 23% and 17%, of the Hospitals’ net patient accounts receivable, at August 31, 2014 and 2013, respectively. Each Hospital’s management does not believe significant credit risks exist with these payers.
3. Pledges Receivable
Pledges are recorded at applicable risk-adjusted discount rates, ranging from 1.1% to 6.0% for the University and Hospitals, commensurate with the duration of the donor’s payment plan. At August 31, 2014 and 2013, pledges receivable, net of discounts and allowances, in thousands of dollars, are as follows:
2013UNIVERSITY HOSPITALS CONSOLIDATED CONSOLIDATED
One year or less 133,942$ 24,937$ 158,879$ 159,049$ Between one year and five years 654,628 231,441 886,069 854,453 More than five years 75,315 25,348 100,663 166,342
863,885 281,726 1,145,611 1,179,844 Less discounts and allowances (152,090) (27,694) (179,784) (218,110)PLEDGES RECEIVABLE, NET $ 711,795 $ 254,032 $ 965,827 $ 961,734
2014
Conditional pledges for the University, which depend on the occurrence of a specified future and uncertain event, were $14.4 million and $9.0 million at August 31, 2014 and 2013, respectively. The Hospitals had conditional pledges of $62.6 million and $119.6 million at August 31, 2014 and 2013, respectively. The majority of these conditional pledges are related to construction or time defined milestones related to the Medical Center Renewal Project. Lucile Packard Foundation for Children’s Health is the primary community fundraising agent for LPCH and the pediatric faculty and programs at the University’s SoM.

25
4. Loans Receivable
The University’s loans receivable consist primarily of student loans receivable and faculty and staff mortgages. Management regularly assesses the adequacy of the allowance for credit losses of its loans by performing ongoing evaluations, including such factors as the differing economic risks associated with each loan category, the financial condition of specific borrowers, the economic environment in which the borrowers operate, the level of delinquent loans and the value of any collateral.
STUDENT LOANS RECEIVABLE Student loans receivable consist of institutional and federally-sponsored loans due from both current and former students. Student loans and allowance for student loan losses at August 31, 2014 and 2013, in thousands of dollars, are as follows:
2014 2013Institutional loans 22,687$ 20,144$ Federally-sponsored loans 59,465 58,838
82,152 78,982 Less allowance for student loan losses (711) (545)STUDENT LOANS RECEIVABLE, NET $ 81,441 $ 78,437
Institutional loans are funded by donor funds restricted for student loan purposes and University funds made available to meet demonstrated need in excess of all other sources of student loan borrowings.
Federally-sponsored loans are funded primarily by advances to the University primarily under the Federal Perkins Loan Program (the “Program”). Loans to students under the Program are subject to mandatory interest rates and significant restrictions, and loans issued under the Program can be assigned to the federal government in certain non-repayment situations. In these situations, the federal portion of the loan balance is guaranteed.
Amounts received under the Program are ultimately refundable to the federal government in the event the University no longer participates in the Program, and accordingly, have been reported as an obligation in the Statements of Financial Position as “U.S. government refundable loan funds”.
FACULTY AND STAFF MORTGAGES In a program to attract and retain excellent faculty and senior staff, the University provides home mortgage financing assistance, primarily in the form of subordinated loans. Notes receivable amounting to $504.6 million and $450.6 million at August 31, 2014 and 2013, respectively, from University faculty and staff are included in “faculty and staff mortgages and other loans receivable, net” in the Statements of Financial Position. These loans and mortgages are collateralized by deeds of trust on properties concentrated in the region surrounding the University. Management has determined that no allowance is necessary.

26
5. Investments
Investments held by the University and the Hospitals are measured and recorded at fair value. The valuation methodology, investment categories, fair value hierarchy, certain investment activities and related commitments for fiscal years 2014 and 2013 are discussed below. Investments held by the University and the Hospitals at August 31, 2014 and 2013, in thousands of dollars, are as follows:
2013UNIVERSITY HOSPITALS CONSOLIDATED CONSOLIDATED
Cash and cash equivalents 1,693,240$ 61,785$ 1,755,025$ 1,386,414$ Collateral held for securities loaned 163,449 - 163,449 57,810 Public equities 7,118,193 23,891 7,142,084 5,659,192 Derivatives 14,922 - 14,922 5,942 Fixed income 1,436,008 228,014 1,664,022 1,323,161 Real estate 5,926,195 - 5,926,195 5,337,236 Natural resources 2,010,161 - 2,010,161 1,796,786 Private equities 6,057,505 - 6,057,505 5,361,599 Absolute return 5,304,605 - 5,304,605 5,579,275 Assets held by other trustees 185,102 17,028 202,130 187,463 Other 217,640 5,826 223,466 279,597
30,127,020 336,544 30,463,564 26,974,475 Hospital funds invested in the University’s Merged Pool (2,298,430) 2,298,430 - -
INVESTMENTS AT FAIR VALUE $ 27,828,590 $ 2,634,974 $ 30,463,564 $ 26,974,475
2014
VALUATION METHODOLOGY To the extent available, the University’s investments are recorded at fair value based on quoted prices in active markets on a trade-date basis. The University’s investments that are listed on any U.S. or non-U.S. recognized exchanges are valued based on readily available market quotations. When such inputs do not exist, fair value measurements are based on the best available information and usually require a degree of judgment. For alternative investments, which are principally limited partnership investments in private equity, real estate, natural resources and hedge funds, the value is primarily based on the Net Asset Value (NAV) of the underlying investments. The NAV is reported by the external investment managers, including general partners, in accordance with their policies as described in their respective financial statements and offering memoranda. The most recent NAV reported is adjusted for capital calls, distributions and significant known valuation changes, if any, of its related portfolio through August 31, 2014 and 2013, respectively. These investments are generally less liquid than other investments, and the value reported may differ from the values that would have been reported had a ready market for these investments existed. The University exercises due diligence in assessing the policies, procedures, and controls implemented by its external investment managers and believes the University’s proportionate share of the carrying amount of these alternative investments is a reasonable estimate of fair value. Such due diligence procedures include, but are not limited to, ongoing communication, on-site visits, and review of information from the external investment managers as well as review of performance. In conjunction with these procedures, estimated fair value is determined by consideration of a wide range of factors, such as market conditions, redemption terms and restrictions, and risks inherent in the inputs of the external investment managers’ valuation.
27
For alternative investments which are direct investments, the University considers various factors to estimate fair value, such as the timing of the transaction, the market in which the company operates, comparable transactions, company performance and projections as well as discounted cash flow analysis. The selection of an appropriate valuation technique may be affected by the availability and general reliability of relevant inputs. In some cases, one valuation technique may provide the best indication of fair value while in other circumstances, multiple valuation techniques may be appropriate. Furthermore, the University may review the investment’s underlying portfolio as well as engage external appraisers, depending on the nature of the investment.
INVESTMENT CATEGORIES Investments are categorized by asset class and valued as described below:
Cash and cash equivalents categorized as investments include money market funds, overnight receivables on repurchase agreements and restricted cash. Overnight receivables on repurchase agreements are valued based on cost, which approximates fair value. Money market funds are valued based on reported unit values. Restricted cash includes collateral provided to or received from counterparties related to investment-related derivative contracts (see Note 7).
Collateral held for securities loaned is generally received in the form of cash and cash equivalents and is reinvested for income in cash equivalent vehicles. These investments are recorded at cost, which approximates fair value (see Note 9).
Public equities are investments valued based on quoted market prices (and exchange rates, if applicable) on the last trading date of the principal market on or before August 31. They include investments that are directly held as well as commingled funds which invest in publicly traded equities. The fair values of public equities held through alternative investments are calculated by the respective external investment managers as described under Valuation Methodology above.
Derivatives are used by the University to manage its exposure to certain risks relating to ongoing business and investment operations. Derivatives such as forward currency contracts, options, interest rate swaps and credit default swaps (CDS) are valued using models based on market verifiable inputs, or by using independent broker quotes.
Fixed income investments are valued by independent pricing sources, broker dealers or pricing models that factor in, where applicable, recently executed transactions, interest rates, bond or credit default spreads and volatility. They include investments that are actively traded fixed income securities or mutual funds.
Real estate represents directly owned real estate and other real estate interests held through limited partnerships. The fair value of real estate directly owned by the University, including the Stanford Shopping Center and the Stanford Research Park, is based primarily on discounted cash flows, using estimates from the asset manager or external investment managers, corroborated by appraisals and market data, if available. The fair value of real estate held through limited partnerships is based on NAV as reported by the external investment managers and is adjusted as described under Valuation Methodology above.
Natural resources are mostly held in commodity and energy related investments, which are valued on the basis of a combination of models, including appraisals, discounted cash flows and commodity price factors. The fair value of these types of alternative investments is based on NAV as reported by the external investment managers and is adjusted as described under Valuation Methodology above.

28
Private equities are investments primarily in venture capital and leveraged buyout strategies. Distributions from these investments are received through liquidation of the underlying asset. The fair value of these types of alternative investments is based on the NAV reported by the external investment managers and is adjusted as described under Valuation Methodology above.
Absolute return investments are typically commingled funds that employ multiple strategies to produce positive returns, regardless of the direction of the financial markets. The fair value of these types of alternative investments is valued based on NAV as reported by the external investment managers and is adjusted as described under Valuation Methodology above.
Assets held by other trustees generally represent the University’s and the Hospitals’ residual interest in split interest agreements where the University or the Hospitals are not the trustee. The residual (or beneficial) interest represents the present value of the future distributions expected to be received over the term of the agreement, which approximates fair value, and the assets are based on estimates provided by trustees.
FAIR VALUE HIERARCHY U.S. GAAP defines fair value as the price received upon sale of an asset or paid upon transfer of a liability in an orderly transaction between market participants. Current guidance establishes a hierarchy of valuation inputs based on the extent to which the inputs are observable in the marketplace. Inputs are used in applying the various valuation techniques and take into account the assumptions that market participants use to make valuation decisions. Inputs may include price information, credit data, liquidity statistics, and other factors specific to the financial instrument. Observable inputs reflect market data obtained from independent sources. In contrast, unobservable inputs reflect the entity’s assumptions about how market participants would value the financial instrument. Valuation techniques used under U.S. GAAP must maximize the use of observable inputs to the extent available.
A financial instrument’s level within the fair value hierarchy is based on the lowest level of any input that is significant to the fair value measurement. The following describes the hierarchy of inputs used to measure fair value and the primary valuation methodologies used for financial instruments measured at fair value on a recurring basis:
Level 1 – Investments whose values are based on quoted market prices in active markets for identical assets or liabilities are classified as Level 1. Level 1 investments include active listed equities and certain short term fixed income securities. Such investments are valued based upon the closing price quoted on the last trading date on or before the reporting date on the principal market, without adjustment.
Exchange-traded derivatives such as options, futures contracts and warrants using observable inputs such as the last reportable sale price or the most recent bid price are typically classified as Level 1 (see Note 7).
Level 2 – Investments that trade in markets that are not actively traded, but are valued based on quoted market prices, dealer quotations, or alternative pricing sources for similar assets or liabilities are classified as Level 2. These investments include certain U.S. government and sovereign obligations, government agency obligations, investment grade corporate bonds and certain limited marketability securities. Privately negotiated over-the-counter (OTC) derivatives such as forward currency contracts, CDS, total return swaps, and interest rate swaps are typically classified as Level 2 (see Note 7). In instances where quotations received from counterparties or valuation models are used, the value of an OTC derivative depends upon the contractual terms of the instrument as well as the availability and reliability of

29
observable inputs. Such inputs include market prices for reference securities, yield curves, and credit curves.
Level 3 – Investments classified as Level 3 have significant unobservable inputs, as they trade infrequently or not at all. The inputs into the determination of fair value of these investments are based upon the best information in the circumstance and may require significant management judgment. These investments primarily consist of the University’s alternative investments and are classified as Level 3 as the inputs are not observable. Certain alternative investments may be reclassified to Level 2 when the University has the ability to redeem them at NAV in the near term without significant restrictions on redemption.

30
The following tables summarize the University’s and the Hospitals’ investments and other assets within the fair value hierarchy and asset categories at August 31, 2014 and 2013, in thousands of dollars:
AS OF AUGUST 31, 2014 LEVEL 1 LEVEL 2 LEVEL 3
UNIVERSITY*Cash and cash equivalents 1,693,240$ 1,646,141$ 47,099$ -$ Collateral held for securities loaned 163,449 - 163,449 - Public equities 7,118,193 3,009,485 1,160,289 2,948,419 Derivatives 14,922 (45) 14,967 - Fixed income 1,436,008 837,535 594,513 3,960 Real estate 5,926,195 144,450 49,554 5,732,191 Natural resources 2,010,161 157,691 - 1,852,470 Private equities 6,057,505 17,569 - 6,039,936 Absolute return 5,304,605 - 2,242,156 3,062,449 Assets held by other trustees 185,102 - - 185,102 Other 217,640 493 - 217,147
TOTAL 30,127,020 5,813,319 4,272,027 20,041,674
HOSPITALSCash and cash equivalents 61,785 56,826 4,959 - Public equities 23,891 23,891 - - Fixed income 228,014 68,830 159,184 - Assets held by other trustees 17,028 - - 17,028 Other 5,826 - - 5,826 TOTAL 336,544 149,547 164,143 22,854
CONSOLIDATED TOTAL $ 30,463,564 $ 5,962,866 $ 4,436,170 $ 20,064,528
AS OF AUGUST 31, 2013 LEVEL 1 LEVEL 2 LEVEL 3
UNIVERSITY*Cash and cash equivalents 1,303,199$ 1,225,411$ 77,788$ -$ Collateral held for securities loaned 57,810 - 57,810 - Public equities 5,545,012 2,545,284 1,166,840 1,832,888 Derivatives 5,942 4,677 1,265 - Fixed income 1,273,525 691,323 582,202 - Real estate 5,337,236 66,910 - 5,270,326 Natural resources 1,796,786 249,617 - 1,547,169 Private equities 5,361,599 4,139 - 5,357,460 Absolute return 5,579,275 166,121 2,236,941 3,176,213 Assets held by other trustees 172,605 - - 172,605 Other 279,597 804 103 278,690
TOTAL 26,712,586 4,954,286 4,122,949 17,635,351
HOSPITALSCash and cash equivalents 83,215 78,607 4,608 - Public equities 114,180 67,407 46,773 - Fixed income 49,636 - 49,636 - Assets held by other trustees 14,858 - - 14,858 TOTAL 261,889 146,014 101,017 14,858
CONSOLIDATED TOTAL $ 26,974,475 $ 5,100,300 $ 4,223,966 $ 17,650,209
* Amounts include the Hospitals' cross investment in the University's investment pools of $2.3 billion.
* Amounts include the Hospitals' cross investment in the University's investment pools of $2.0 billion.
The University manages the majority of the Hospitals’ investments, including the Hospitals’ investment in the Merged Pool (MP), with a combined fair value of $2.3 billion and $2.0 billion at August 31, 2014 and 2013, respectively.

31
SUMMARY OF LEVEL 3 INVESTMENT ACTIVITIES AND TRANSFERS The following tables present the activities for Level 3 investments for the years ended August 31, 2014 and 2013, in thousands of dollars:
BEGINNING BALANCE AS OF SEPTEMBER 1,
2013 PURCHASES SALES AND MATURITIES
NET REALIZED AND
UNREALIZED GAINS
(LOSSES)TRANSFERS
INTRANSFERS
OUT
ENDING BALANCE AS OF
AUGUST 31, 2014
UNIVERSITY*Public equities 1,832,888$ 596,883$ (125,266)$ 417,400$ 354,641$ (128,127)$ 2,948,419$ Fixed income - 3,990 - (30) - - 3,960 Real estate 5,270,326 383,085 (622,261) 743,756 - (42,715) 5,732,191 Natural resources 1,547,169 453,478 (435,136) 286,959 - - 1,852,470 Private equities 5,357,460 599,357 (1,164,518) 1,247,637 - - 6,039,936 Absolute return 3,176,213 241,530 (595,390) 253,090 - (12,994) 3,062,449 Assets held by other trustees 172,605 - - 12,497 - - 185,102 Other 278,690 204,457 (278,335) 18,112 - (5,777) 217,147
TOTAL 17,635,351 2,482,780 (3,220,906) 2,979,421 354,641 (189,613) 20,041,674
HOSPITALSAssets held by other trustees 14,858 - - 2,170 - - 17,028 Other - 5,826 - - - - 5,826 TOTAL 14,858 5,826 - 2,170 - - 22,854
CONSOLIDATED TOTAL $ 17,650,209 $ 2,488,606 $ (3,220,906) $ 2,981,591 $ 354,641 $ (189,613) $ 20,064,528
BEGINNING BALANCE AS OF SEPTEMBER 1,
2012 PURCHASES SALES AND MATURITIES
NET REALIZED AND
UNREALIZED GAINS
TRANSFERS IN
TRANSFERSOUT
ENDING BALANCE AS OF
AUGUST 31, 2013
UNIVERSITY*Public equities 2,105,804$ 245,686$ (195,168)$ 303,566$ 13,183$ (640,183)$ 1,832,888$ Real estate 4,988,534 444,838 (556,464) 403,383 - (9,965) 5,270,326 Natural resources 1,406,981 268,981 (236,580) 100,212 9,965 (2,390) 1,547,169 Private equities 5,163,154 608,796 (775,787) 533,168 - (171,871) 5,357,460 Absolute return 3,210,949 249,629 (590,059) 441,710 87,030 (223,046) 3,176,213 Assets held by other trustees 154,462 8,485 (9,363) 19,021 - - 172,605 Other 204,045 44,393 (324,178) 354,430 - - 278,690 TOTAL 17,233,929 1,870,808 (2,687,599) 2,155,490 110,178 (1,047,455) 17,635,351
HOSPITALSAssets held by other trustees 13,604 - - 1,254 - - 14,858 TOTAL 13,604 - - 1,254 - - 14,858
CONSOLIDATED TOTAL $ 17,247,533 $ 1,870,808 $ (2,687,599) $ 2,156,744 $ 110,178 $ (1,047,455) $ 17,650,209 * Amounts include the Hospitals' cross investment in the University's investment pools.
FAIR VALUE MEASUREMENTS USING SIGNIFICANT UNOBSERVABLE INPUTS (LEVEL 3)
FAIR VALUE MEASUREMENTS USING SIGNIFICANT UNOBSERVABLE INPUTS (LEVEL 3)
* Amounts include the Hospitals' cross investment in the University's investment pools.
Net realized and unrealized gains (losses) in the tables above are included in the Statements of Activities primarily as “increase in reinvested gains” by level of restriction. For the years ended August 31, 2014 and 2013, the change in unrealized gains (losses) for Level 3 investments still held at August 31, 2014 and 2013 was $2.7 billion and $1.8 billion, respectively.
Transfers in (out) include investments which have been reclassified to Level 2 as the University has the ability to redeem these at NAV in the near term. Transfers in (out) also include situations where observable inputs have changed, such as when Level 3 investments make distributions from an underlying asset with a fair value based on quoted market prices. All transfer amounts are based on the fair value at the beginning of the fiscal year. There were no transfers between Level 1 and Level 2 during the years ended August 31, 2014 and 2013.

32
LEVEL 3 INVESTMENT VALUATION TECHNIQUES AND SIGNIFICANT UNOBSERVABLE INPUTS The following table summarizes the significant unobservable inputs and valuation methodologies for Level 3 investments as of August 31, 2014 and 2013. For each investment category and respective valuation technique, the range of the significant unobservable input is dependent on the nature and characteristics of the investment. The input range and weighted average values may vary at each balance sheet date.
MIN. MAX
2014Real estate 3,484,984$ Discounted cash flow Discount rate 4.0% 11.0% Decrease
Capitalization rate 5.0% 9.0% DecreaseNatural resources 127,077 Market comparables Weights ascribed to
market comparables 20.0% 50.0% N/AOther 217,147 Market comparables Recent transactions N/A N/A N/ATOTAL AMOUNTWITH SIGNIFICANT UNOBSERVABLE INPUTS 3,829,208
2013Real estate 2,984,011 Discounted cash flow Discount rate 5.8% 14.0% Decrease
Capitalization rate 5.0% 8.0% DecreaseNatural resources 78,285 Market comparables Weights ascribed to
market comparables 20.0% 60.0% N/AOther 278,690 Market comparables Recent transactions N/A N/A N/ATOTAL AMOUNTWITH SIGNIFICANT UNOBSERVABLE INPUTS $ 3,340,986
2 Unless otherwise noted, this column represents the directional change in the fair value of the Level 3 investments that would result from an increase to the corresponding unobservable input. A decrease to the unobservable input would have the opposite effect. Significant increases and decreases in these unobservable inputs in isolation could result in significantly higher or lower fair value measurements.
1 Level 3 investments assets of $16.2 billion and $14.3 billion at August 31, 2014 and 2013, respectively, were excluded from the above quantitative disclosure as their fair value was primarily based on the NAV reported by external investment managers as described in the Valuation Methodology section above.
INVESTMENT CATEGORIES FAIR VALUE1VALUATION TECHNIQUE
IMPACT TO VALUATION FROM AN
INCREASE IN INPUT2
SIGNIFICANT UNOBSERVABLE INPUTS
RANGE

33
INVESTMENT-RELATED COMMITMENTS The University is obligated under certain alternative investment agreements to advance additional funding up to specified levels over a period of several years. The following table presents significant terms of such agreements for all related alternative investments at August 31, 2014, in thousands of dollars:
ASSET CLASS FAIR VALUEUNFUNDED
COMMITMENTREMAINING
LIFE (YEARS) REDEMPTION TERMS AND RESTRICTIONSPublic equities 4,105,972$ 145,502$ 0 to 5 Generally, lock-up provisions ranging from 0 to 5
years. After initial lock up expires, redemptions are available on a rolling basis and require 3 to 180 days prior notification.
Real estate 2,011,107 944,653 0 to 13 Not eligible for redemptionNatural resources 1,842,172 1,208,016 0 to 15 Not eligible for redemptionPrivate equities 6,039,932 1,815,518 0 to 16 Not eligible for redemptionAbsolute return 5,304,605 1,110,148 0 to 7 Generally, lock-up provisions ranging from 0 to 6
years. After initial lock up expires, redemptions are available on a rolling basis and require 2 to 180 days prior notification.
TOTAL $19,303,788 $ 5,223,837

34
OFFSETS TO INVESTMENT-RELATED ASSETS AND LIABILITIES Financial instruments with off-balance sheet risk such as derivatives, securities lending agreements, and repurchase agreements (“repo”) are subject to counterparty credit risk. The University seeks to control this risk in various ways, such as entering into transactions with quality counterparties, establishing and monitoring credit limits, and requiring collateral in certain situations. For certain derivatives, a master netting arrangement allows the counterparty to net applicable collateral held on behalf of the University against applicable liabilities or payment obligations of the University to the counterparty. These arrangements also allow the counterparty to net any of its applicable liabilities or payment obligations to the University against any collateral previously received. The University may also enter into repo or reverse repo arrangements. When the University enters into a repo, it “sells” securities to a broker-dealer or financial institution, and agrees to purchase such securities for a predetermined price, including interest, from the broker-dealer or financial institution. Conversely, when the University enters into a reverse repo, it “buys” securities from a broker-dealer or financial institution, and agrees to sell such securities for a predetermined price, including interest, subject to the obligation of the broker-dealer or financial institution. For financial statement purposes, the University nets investment-related derivative assets and liabilities on the Statements of Financial Position. For disclosure purposes, the University does not offset assets and liabilities relating to the financial and derivative instruments that are subject to an enforceable master netting arrangement or similar agreement, or that meet the right of setoff criteria in the accounting guidance. The potential effect of offset and related arrangements associated with these financial and derivative instruments as of August 31, 2014 and 2013, in thousands of dollars, is presented in the following table:
GROSS AMOUNTS OFFSET
NET AMOUNTS OF ASSETS
AND LIABILITIES
FINANCIAL INSTRUMENTS4
CASH COLLATERAL
RECEIVED (PLEDGED)4
2014Assets:Derivatives1 46,522$ (31,600)$ 14,922$ $ - 14,922$ $ - Reverse repurchase agreements2 - - - - - - TOTAL 46,522 (31,600) 14,922 - 14,922 -
Liabilities:Derivatives1 31,600 (31,600) - - - - Securities lending3 163,449 - 163,449 163,449 - - TOTAL 195,049 (31,600) 163,449 163,449 - -
2013Assets:Derivatives1 19,254 (13,312) 5,942 - - 5,942 Reverse repurchase agreements2 82,900 - 82,900 - - 82,900
TOTAL 102,154 (13,312) 88,842 - - 88,842
Liabilities:Derivatives1 13,312 (13,312) - - - - Securities lending3 57,810 - 57,810 57,810 - - TOTAL $ 71,122 $ (13,312) $ 57,810 $ 57,810 $ - $ -
4 These amounts are limited to the derivative asset balance and accordingly, do not include any excess collateral received.
3 Refer to Note 9 for details.
GROSS AMOUNTS OF ASSETS AND LIABILITIES
AS PRESENTED IN CONSOLIDATED STATEMENTS
OF FINANCIAL POSITION
GROSS AMOUNTS NOT OFFSET IN CONSOLIDATED
STATEMENTS OF FINANCIAL POSITION
1 Gross derivative assets less gross derivative liabilities are presented as "derivatives" in the investment table above. 2 Reverse repurchase agreements are included in "Cash and cash equivalents" in the investment table above.
NET AMOUNT
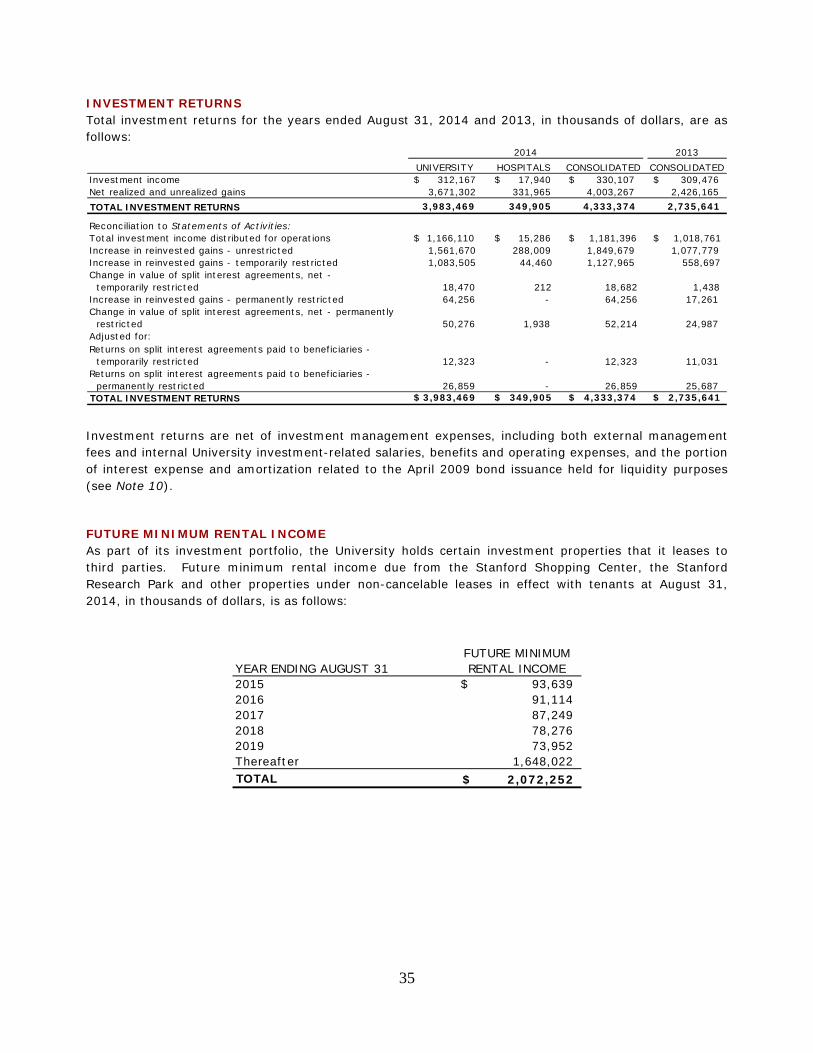
35
INVESTMENT RETURNS Total investment returns for the years ended August 31, 2014 and 2013, in thousands of dollars, are as follows:
2013UNIVERSITY HOSPITALS CONSOLIDATED CONSOLIDATED
Investment income $ 312,167 $ 17,940 $ 330,107 $ 309,476 Net realized and unrealized gains 3,671,302 331,965 4,003,267 2,426,165 TOTAL INVESTMENT RETURNS 3,983,469 349,905 4,333,374 2,735,641
Reconciliation to Statements of Activities:Total investment income distributed for operations $ 1,166,110 $ 15,286 $ 1,181,396 $ 1,018,761 Increase in reinvested gains - unrestricted 1,561,670 288,009 1,849,679 1,077,779 Increase in reinvested gains - temporarily restricted 1,083,505 44,460 1,127,965 558,697 Change in value of split interest agreements, net - temporarily restricted 18,470 212 18,682 1,438 Increase in reinvested gains - permanently restricted 64,256 - 64,256 17,261 Change in value of split interest agreements, net - permanently restricted 50,276 1,938 52,214 24,987 Adjusted for:Returns on split interest agreements paid to beneficiaries - temporarily restricted 12,323 - 12,323 11,031 Returns on split interest agreements paid to beneficiaries - permanently restricted 26,859 - 26,859 25,687 TOTAL INVESTMENT RETURNS $ 3,983,469 $ 349,905 $ 4,333,374 $ 2,735,641
2014
Investment returns are net of investment management expenses, including both external management fees and internal University investment-related salaries, benefits and operating expenses, and the portion of interest expense and amortization related to the April 2009 bond issuance held for liquidity purposes (see Note 10).
FUTURE MINIMUM RENTAL INCOME As part of its investment portfolio, the University holds certain investment properties that it leases to third parties. Future minimum rental income due from the Stanford Shopping Center, the Stanford Research Park and other properties under non-cancelable leases in effect with tenants at August 31, 2014, in thousands of dollars, is as follows:
20152016201720182019ThereafterTOTAL
YEAR ENDING AUGUST 31FUTURE MINIMUM RENTAL INCOME
93,639$
$ 2,072,252
91,114 87,249 78,276 73,952
1,648,022

36
6. Investment Pools
The University’s investments are held in various investment pools or in specific investments to comply with donor requirements as indicated in the following table, at August 31, 2014 and 2013, in thousands of dollars:
2014 2013
UNIVERSITYMerged Pool 25,330,910$ 22,600,862$ Expendable Funds Pool 3,259,707 3,181,451 Endowment Income Funds Pool 360,867 342,622 Other investment pools 99,710 86,525 Specific investments 4,696,400 4,025,199
33,747,594 30,236,659 Less:Amounts included in "cash and cash equivalents" in the Statements of Financial Position (460,888) (450,202)Funds cross-invested in investment pools (3,154,731) (3,069,263)Hospital funds invested in the University's investment pools (2,303,385) (2,013,787)
TOTAL 27,828,590 24,703,407
HOSPITALSInvestments 2,634,974 2,271,068 TOTAL 2,634,974 2,271,068 CONSOLIDATED TOTAL 30,463,564$ 26,974,475$
The MP is the primary investment pool in which endowment (see Note 12) and other long-term funds are invested. The MP is invested with the objective of optimizing long-term total return while maintaining an appropriate level of risk for the University. It is a unitized investment pool in which the fund holders purchase investments and withdraw funds based on a monthly share value.
The Expendable Funds Pool (EFP) and Endowment Income Funds Pool (EIFP) are the principal investment vehicles for the University’s expendable funds. A substantial portion of the EFP is cross-invested in the MP; the remainder is included in “cash and cash equivalents” in the Statements of Financial Position. The EIFP holds income previously distributed to holders of permanently restricted endowment funds that has not yet been expended. The EIFP is invested in highly liquid instruments and is included in the Statements of Financial Position as “cash and cash equivalents”.
The Board has established a policy for the distribution of the investment returns of the EFP. The difference between the actual return of this investment pool and the approved payout is deposited in, or withdrawn from, funds functioning as endowment (FFE) (see Note 12). For the years ended August 31, 2014 and 2013, the results of the EFP, in thousands of dollars, are as follows:
2014 2013
Total investment return of the EFP 494,121$ 336,148$ Less distributions to fund holders and operations (126,473) (60,927)AMOUNTS ADDED TO FFE $ 367,648 $ 275,221

37
7. Derivatives
The University, directly or through external investment managers on the University’s behalf, utilizes various strategies to reduce investment and credit risks, to serve as a temporary surrogate for investment in stocks and bonds, to manage interest rate exposure on the University’s debt, and/or to manage specific exposure to foreign currencies. Futures, options and other derivative instruments are used to adjust elements of investment exposures to various securities, sectors, markets and currencies without actually taking a position in the underlying asset or basket of assets. Interest rate swaps are used to manage interest rate risk. With respect to foreign currencies, the University utilizes forward contracts and foreign currency options to manage exchange rate risk. INVESTMENT-RELATED DERIVATIVES The following table presents amounts for investment-related derivatives, including the notional amount, the fair values at August 31, 2014 and 2013, and gains and losses for the years ended August 31, 2014 and 2013, in thousands of dollars:
YEAR ENDEDAUGUST 31, 2014
NOTIONAL AMOUNT1
GROSS DERIVATIVE
ASSETS2
GROSS DERIVATIVE LIABILITIES2
REALIZED AND UNREALIZED GAINS
(LOSSES)3
Interest-rate contracts 3,623,678$ 31,942$ 21,618$ (12,255)$ Foreign exchange contracts 705,701 6,697 1,957 17,440 Equity contracts 1,605,379 6,409 7,836 (17,138) Credit contracts 77,345 1,474 189 199
TOTAL $ 6,012,103 $ 46,522 $ 31,600 $ (11,754)
YEAR ENDEDAUGUST 31, 2013
NOTIONAL AMOUNT1
GROSS DERIVATIVE
ASSETS2
GROSS DERIVATIVE LIABILITIES2
REALIZED AND UNREALIZED GAINS
(LOSSES)3
Interest-rate contracts 1,644,761$ 9,394$ 8,950$ 3,164$ Foreign exchange contracts 371,433 4,546 3,483 26,521 Equity contracts 283,100 4,677 - 40,652 Credit contracts 149,454 637 879 (2,820)
TOTAL $ 2,448,748 $ 19,254 $ 13,312 $ 67,517
AS OF AUGUST 31, 2014
AS OF AUGUST 31, 2013
1 The notional amount is representative of the volume and activity of the respective derivative type during the years ended August 31, 2014 and 2013.2 Gross derivative assets less gross derivative liabilities of $14.9 million and $5.9 million as of August 31, 2014 and 2013, respectively, are presented as "derivatives" on the investment table in Note 5.3 Gains (losses) on derivatives are included in the Statements of Activities as "increase in reinvested gains" in "non-operating activities".

38
Credit Default Swaps Credit contracts in the previous table consist of both the purchases and sales of CDS. CDS are contracts under which counterparties are provided protection against the risk of default on a set of debt obligations issued by specific companies (or group of companies combined in an index). The buyer of the CDS will make payment to the seller and in return receive payment if the underlying instrument goes into default or is triggered by some other credit event. The University’s CDS transactions include both single name entities as well as index CDS. Under the index CDS, the credit events that would trigger settlement of the CDS and require the University to remit payment are generally bankruptcy and failure to pay. The table below summarizes certain information regarding the sale of CDS at August 31, 2014 and 2013, in thousands of dollars:
CREDIT RATINGS OF THE REFERENCE OBLIGATION2 LESS THAN 3 OVER 3 TOTAL
Single name credit default swaps:A- to AA+ 6,900$ 26,200$ 33,100$ 431$ BBB- to BBB+ 575 30,474 31,049 599
Total single name credit default swaps 7,475 56,674 64,149 1,030
Index credit default swaps3 - 4,900 4,900 (14)
TOTAL CREDIT DEFAULT SWAPS SOLD $ 7,475 $ 61,574 $ 69,049 $ 1,016
Single name credit default swaps:A- to AA+ 7,900$ 1,500$ 9,400$ 188$ BBB- to BBB+ 300 5,512 5,812 (431)
Total single name credit default swaps 8,200 7,012 15,212 (243)
Index credit default swaps3 - 500 500 (2) TOTAL CREDIT DEFAULT SWAPS SOLD $ 8,200 $ 7,512 $ 15,712 $ (245)
2 The credit rating is according to Standard & Poor's and represents the current performance risk of the swap.3 Index credit default swaps are linked to a basket of credit derivatives that include entities that have a Standard & Poor's rating of BBB- or higher.
2014
2013
1 The notional amount is representative of the volume and activity of the respective derivative type during the years ended August 31, 2014 and 2013.
MAXIMUM POTENTIAL PAYOUT FAIR VALUE ASSET/
(LIABILITY)
(NOTIONAL AMOUNT1) / YEARS TO MATURITY

39
DEBT-RELATED DERIVATIVES The University and SHC use interest rate exchange agreements to manage the interest rate exposure of their debt portfolios. Under the terms of the current agreements, the entities pay a fixed interest rate, determined at inception, and receive a variable rate on the underlying notional principal amount. Generally, the exchange agreements require mutual posting of collateral by the University and SHC and the counterparties if the termination values exceed a predetermined threshold dollar amount.
At August 31, 2014, the University had interest rate exchange agreements related to $97.0 million of the outstanding balance of the CEFA Series S bonds in variable rate mode (see Note 10). The agreements, which have a weighted average interest rate of 3.68%, expire November 1, 2039. The notional amount and the fair value of the exchange agreements are included in the table below. Collateral posted with various counterparties was $11.0 million at August 31, 2014 and 2013, and is included in the Statements of Financial Position. In addition, the University issued an irrevocable standby letter of credit of $15.0 million to support collateral requirements at August 31, 2014 and 2013 (see Note 10). In December 2012, the University terminated certain interest rate exchange agreements and recognized a loss of $13.0 million in “non-operating activities” in the Statements of Activities for the year ended August 31, 2013.
At August 31, 2014, SHC had interest rate exchange agreements expiring through November 2051 (see Note 11). The agreements require SHC to pay fixed interest rates to the counterparties varying from 3.37% to 4.08% in exchange for variable rate payments from the counterparties based on a percentage of the One Month London Interbank Offered Rate (LIBOR). The notional amount and the fair value of the exchange agreements are included in the table below. There was no collateral required to be posted with counterparties at August 31, 2014 and 2013. In February 2014, SHC terminated certain interest rate exchange agreements and recognized a loss of $71 thousand in “non-operating activities” in the Statements of Activities for the year ended August 31, 2014.
The following table presents amounts for debt-related derivatives including the notional amount, the fair values at August 31, 2014 and 2013, and gains and losses for the years ended August 31, 2014 and 2013, in thousands of dollars:
YEAR ENDED YEAR ENDEDAUGUST 31,
2014AUGUST 31,
2013
NOTIONAL AMOUNT 1
GROSS DERIVATIVE LIABILIT IES2
REALIZED AND UNREALIZED
LOSSES3NOTIONAL AMOUNT 1
GROSS DERIVATIVE LIABILIT IES2
REALIZED AND UNREALIZED
GAINS3
Debt- related interest-rate c ontrac ts:
University 97,000$ 30,457$ (8,617)$ 97,000$ 21,840$ 34,407$ Hospitals 577,200 155,984 (37,532) 746,100 133,255 102,928
TOTAL $ 674,200 $ 186,441 $ (46,149) $ 843,100 $ 155,095 $ 137,335
2 Fair value is measured using Level 2 inputs as defined in Note 5. Amounts are inc luded in the Statements of F inanc ial Posit ion in "ac counts payable and ac c rued expenses" and discussed more fully in Notes 10 and 11.
AS OF AUGUST 31, 2014 AS OF AUGUST 31, 2013
1 The not ional amount is representat ive of the volume and ac t ivity of the respec t ive derivat ive type during the years ended August 31, 2014 and 2013.
3 Gains (losses) on derivat ives are inc luded in the Statements of Ac t ivit ies as "swap interest and change in value of swap agreements" in "non-operat ing ac t ivit ies".

40
8. Plant Facilities
Plant facilities, net of accumulated depreciation, at August 31, 2014 and 2013, in thousands of dollars, are as follows:
2013UNIVERSITY HOSPITALS CONSOLIDATED CONSOLIDATED
Land and improvements 503,521$ 119,075$ 622,596$ 602,222$ Buildings and building improvements 5,148,947 1,429,522 6,578,469 5,925,451 Furniture, fixtures and equipment 1,531,679 1,096,230 2,627,909 2,424,358 Utilities 483,272 - 483,272 382,102 Construction in progress 486,935 1,072,877 1,559,812 1,323,225
8,154,354 3,717,704 11,872,058 10,657,358 Less accumulated depreciation (3,595,441) (1,444,305) (5,039,746) (4,662,742)PLANT FACILITIES, NET OFACCUMULATED DEPRECIATION $ 4,558,913 $ 2,273,399 $ 6,832,312 $ 5,994,616
2014
At August 31, 2014, $1.4 billion and $841.3 million of fully depreciated plant facilities were still in use by the University and the Hospitals, respectively, and were included in plant facilities and accumulated depreciation.
9. Liabilities Under Security Lending Agreements
The University receives short-term U.S. government obligations or cash and cash equivalents as collateral deposits for certain securities loaned temporarily to brokers. It is the University's policy to require receipt of collateral on securities lending contracts and repurchase agreements equal to a minimum of 102% of the fair market value of the security loaned. In addition, the University is party to certain forward sale and purchase agreements. At August 31, 2014 and 2013, these amounts, in thousands of dollars, are as follows:
Collateral deposits for certain securities loaned temporarily to brokers1, 2 163,449$ 57,810$ Forward sale and purchase agreements1 27,562 26,238
LIABILITIES UNDER SECURITYLENDING AGREEMENTS $ 191,011 $ 84,048
2014
2 The estimated fair value of securities loaned to brokers at August 31, 2014 and 2013 was $155.8 million and $55.4 million, respectively.
1 The corresponding investments are included as "investments" in the Statements of Financial Position (see Note 5).
2013

41
10. University Notes and Bonds Payable
Notes and bonds payable for the University at August 31, 2014 and 2013, in thousands of dollars, are as follows:
YEAR OF INTEREST RATE * MATURITY 2014/2013 2014 2013
Tax-exempt:CEFA Fixed Rate Revenue Bonds:
Series S 2039 5.00% 30,210$ 30,210$ Series T 2014-2039 4.00% - 5.00% 188,900 361,310 Series U 2021-2045 5.00% - 5.25% 996,855 593,760
CEFA Variable Rate Revenue Bonds and Notes: Series L 2015-2022 0.03%/0.06% 83,818 83,818 Series S 2039-2050 0.10%-0.13%/0.17%-0.20% 141,200 141,200 Commercial Paper 2015 0.06%/0.08% 50,994 72,070
Taxable:Fixed Rate Notes and Bonds:
Stanford University Bonds 2024 6.88% 150,000 150,000 Medium Term Note 2026 7.65% 50,000 50,000 Stanford University Series 2009A 2014-2019 3.63% - 4.75% 650,000 1,000,000 Stanford University Series 2012A 2042 4.01% 143,235 143,235 Stanford University Series 2013A 2044 3.56% 150,115 150,115 Stanford University Series 2014A 2054 4.25% 150,000 - Other 2014-2015 Various 67,364 68,347
Variable Rate Notes:Commercial Paper 2015 0.15%/0.13% 140,715 70,656
University notes and bonds payable 2,993,406 2,914,721 Unamortized original issue premiums/discounts, net 271,230 183,712
TOTAL $ 3,264,636 $ 3,098,433
*Exclusive of interest rate exchange agreements (see Note 7).
OUTSTANDING PRINCIPAL
At August 31, 2014 and 2013, the fair value of these debt instruments was approximately $3.5 billion and $3.1 billion, respectively. All bonds held at August 31, 2014 and 2013 are considered to be Level 2 fair value measurements.
The University borrows at tax-exempt rates through the California Educational Facilities Authority (CEFA). CEFA debt is a general unsecured obligation of the University. Although CEFA is the issuer, the University is responsible for the repayment of the tax-exempt debt. The University’s long-term ratings of AAA/Aaa/AAA were affirmed in April 2014 by Standard & Poor’s, Moody’s Investors Service and Fitch Ratings, respectively.
In May 2014, CEFA Series U-5 bonds were issued in the amount of $124.1 million plus an original issue premium of $26.3 million. The bonds bear interest at a rate of 5.00% and mature on May 1, 2021. Proceeds were used to (1) refinance commercial paper notes which were previously used to refinance CEFA Series T-4 bonds which matured in March 2014; (2) finance facilities and infrastructure; and (3) pay bond issuance costs.
In May 2014, CEFA Series U-6 bonds were issued in the amount of $279.0 million plus an original issue premium of $71.0 million. The bonds bear interest at a rate of 5.00% and mature on May 1, 2045. Proceeds were used to (1) refinance commercial paper notes; and (2) finance facilities and infrastructure.
In May 2014, the University issued taxable fixed rate Series 2014 bonds in the amount of $150.0 million plus an original issue discount of $27 thousand. The bonds bear interest at a rate of 4.249% and mature on May 1, 2054. Proceeds were used to (1) refinance commercial paper notes; and (2) finance facilities and infrastructure.

42
In May 2014, the taxable Series 2009A (first tranche) in the amount of $350.0 million matured and was paid off.
In May 2013, CEFA Series U-3 bonds were issued in the amount of $261.4 million plus an original issue premium of $90.4 million. The bonds bear interest at a rate of 5.00% and mature on June 1, 2043. Proceeds were used to (1) refinance commercial paper notes; (2) finance facilities and infrastructure; and (3) pay bond issuance costs.
In May 2013, CEFA Series U-4 bonds were issued in the amount of $39.2 million plus an original issue premium of $13.6 million. The bonds bear interest at a rate of 5.00% and mature on June 1, 2043. Proceeds were used to (1) legally defease $51.3 million of CEFA Series P bonds; and (2) pay bond issuance costs.
In May 2013, CEFA Series S-2 bonds of $40.0M were converted from a commercial paper rate mode to a fixed rate bond issued in the amount of $30.2 million plus an original issue premium of $9.8 million. The bonds bear interest at a rate of 5.00% and mature on November 1, 2039.
In May 2013, the University issued taxable fixed rate Series 2013 bonds in the amount of $150.1 million. The bonds bear interest at a rate of 3.563% and mature on June 1, 2044. Proceeds were used to (1) refinance commercial paper notes; (2) finance facilities and infrastructure; and (3) pay bond issuance costs.
In December 2010, the University entered into a $50.0 million line of credit agreement to issue irrevocable standby letters of credit to support various collateral posting obligations. At August 31, 2014, irrevocable standby letters of credit of $36.5 million were outstanding in the following amounts and for the following respective purposes: (1) $15.0 million to support collateral requirements under certain interest rate exchange agreements discussed in Note 7; and (2) $21.5 million to serve as security for workers’ compensation deductible insurance arrangements. No amounts have been drawn on these letters of credit at August 31, 2014.
Stanford holds controlling interests in several investment entities which were consolidated in the financial statements in fiscal years 2014 and 2013. At August 31, 2014 and 2013, taxable debt included $66.8 million and $67.8 million, respectively, of debt where Stanford is ultimately liable for principal should the investees default.
The University’s taxable and tax-exempt commercial paper facilities and related information at August 31, 2014 and 2013, in thousands of dollars, are as follows:
2014Taxable $ 500,000 $ 140,715 34.6 0.14%Tax-exempt $ 300,000 $ 50,994 49.6 0.07%
2013Taxable $ 500,000 $ 70,656 93.1 0.22%Tax-exempt $ 300,000 $ 72,070 65.0 0.13%
WEIGHTED AVERAGE
EFFECTIVE INTEREST RATE
WEIGHTED AVERAGE DAYS TO MATURITYCOMMERCIAL PAPER
POTENTIAL BORROWINGS
OUTSTANDING BALANCE AT AUGUST 31

43
The University had $225.0 million of revenue bonds in variable rate mode outstanding in addition to commercial paper notes at August 31, 2014. CEFA Series L bonds bear interest at a weekly rate and CEFA Series S bonds bear interest at a commercial paper municipal rate and are outstanding for various interest periods of 270 days or less. In the event the University receives notice of any optional tender of these bonds, or if the bonds become subject to mandatory tender, the purchase price of the bonds will be paid from the remarketing of such bonds. However, if the remarketing proceeds are insufficient, the University will have a current obligation to purchase the bonds tendered. The University has identified several sources of funding including cash, money market funds, U.S. treasury securities and agencies’ discount notes to provide for the full and timely purchase price of any bonds tendered in the event of a failed remarketing.
The University’s interest expense, which includes amortized bond issuance costs and amortized bond premium or discount, in thousands of dollars, is as follows:
Interest expense, gross 109,360$ 101,016$ Less: Interest income earned on unspent proceeds (198) (253) Interest capitalized as a cost of construction (8,324) (3,845) Interest expense on Series 2009A bonds which is classified as an investment expense (29,602) (31,665) Interest expense, net $ 71,236 $ 65,253
2014 2013
The University uses interest rate exchange agreements to manage the interest rate exposure of its debt portfolio. Net payments on interest rate exchange agreements, which are included in “swap interest and change in value of swap agreements” in the Statements of Activities, were $3.5 million and $16.7 million for the years ended August 31, 2014 and 2013, respectively, including the loss on the termination of certain interest rate exchange agreements in 2013 (see Note 7).
At August 31, 2014, scheduled principal payments on notes and bonds, in thousands of dollars, are as follows:
PRINCIPAL PAYMENTS
2015 Commercial paper 191,709$ 225,018
2015 Other 1,334 2016 315,550 2017 - 2018 - 2019 400,000 Thereafter 1,859,795 TOTAL $ 2,993,406
2015 Variable debt subject to remarketing
YEAR ENDING AUGUST 31
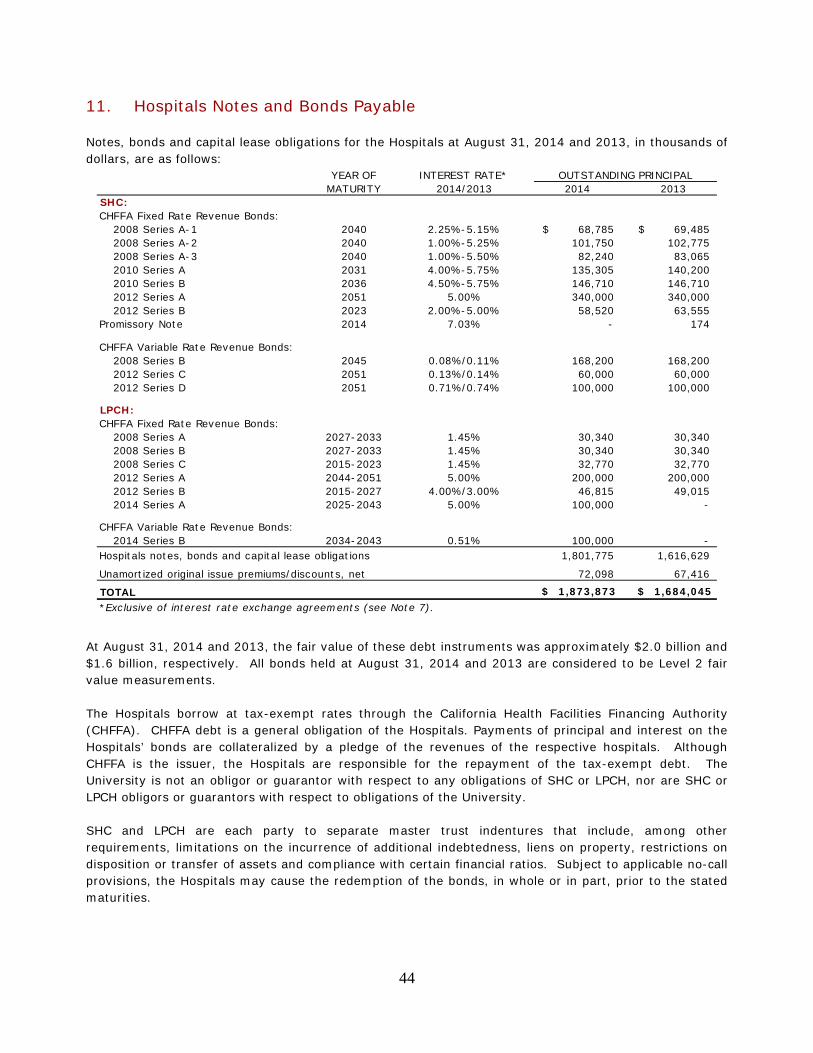
44
11. Hospitals Notes and Bonds Payable Notes, bonds and capital lease obligations for the Hospitals at August 31, 2014 and 2013, in thousands of dollars, are as follows:
YEAR OF INTEREST RATE*MATURITY 2014/2013 2014 2013
SHC:CHFFA Fixed Rate Revenue Bonds:
2008 Series A-1 2040 2.25%-5.15% 68,785$ 69,485$ 2008 Series A-2 2040 1.00%-5.25% 101,750 102,775 2008 Series A-3 2040 1.00%-5.50% 82,240 83,065 2010 Series A 2031 4.00%-5.75% 135,305 140,200 2010 Series B 2036 4.50%-5.75% 146,710 146,710 2012 Series A 2051 5.00% 340,000 340,000 2012 Series B 2023 2.00%-5.00% 58,520 63,555
Promissory Note 2014 7.03% - 174
CHFFA Variable Rate Revenue Bonds:2008 Series B 2045 0.08%/0.11% 168,200 168,200 2012 Series C 2051 0.13%/0.14% 60,000 60,000 2012 Series D 2051 0.71%/0.74% 100,000 100,000
LPCH:CHFFA Fixed Rate Revenue Bonds:
2008 Series A 2027-2033 1.45% 30,340 30,340 2008 Series B 2027-2033 1.45% 30,340 30,340 2008 Series C 2015-2023 1.45% 32,770 32,770 2012 Series A 2044-2051 5.00% 200,000 200,000 2012 Series B 2015-2027 4.00%/3.00% 46,815 49,015 2014 Series A 2025-2043 5.00% 100,000 -
CHFFA Variable Rate Revenue Bonds:2014 Series B 2034-2043 0.51% 100,000 -
Hospitals notes, bonds and capital lease obligations 1,801,775 1,616,629
Unamortized original issue premiums/discounts, net 72,098 67,416
TOTAL $ 1,873,873 $ 1,684,045 *Exclusive of interest rate exchange agreements (see Note 7).
OUTSTANDING PRINCIPAL
At August 31, 2014 and 2013, the fair value of these debt instruments was approximately $2.0 billion and $1.6 billion, respectively. All bonds held at August 31, 2014 and 2013 are considered to be Level 2 fair value measurements. The Hospitals borrow at tax-exempt rates through the California Health Facilities Financing Authority (CHFFA). CHFFA debt is a general obligation of the Hospitals. Payments of principal and interest on the Hospitals’ bonds are collateralized by a pledge of the revenues of the respective hospitals. Although CHFFA is the issuer, the Hospitals are responsible for the repayment of the tax-exempt debt. The University is not an obligor or guarantor with respect to any obligations of SHC or LPCH, nor are SHC or LPCH obligors or guarantors with respect to obligations of the University. SHC and LPCH are each party to separate master trust indentures that include, among other requirements, limitations on the incurrence of additional indebtedness, liens on property, restrictions on disposition or transfer of assets and compliance with certain financial ratios. Subject to applicable no-call provisions, the Hospitals may cause the redemption of the bonds, in whole or in part, prior to the stated maturities.

45
SHC At August 31, 2014, SHC had $328.2 million revenue bonds in variable rate mode outstanding. The 2008 Series B-1 bonds bear interest at a weekly rate, and bondholders have the option to tender their bonds on a weekly basis. The 2008 Series B-2 bonds bear interest at the commercial paper rate for each commercial paper period of 270 days or less. Bondholders in commercial paper mode have the option to tender their bonds only at the end of the commercial paper rate period. The 2012 Series C bonds are in a windows weekly floating index mode and cannot be tendered for 180 days after a 30 day notice and remarketing period. The 2012 Series D bonds are also in a floating index mode with monthly interest rate resets. The 2012 Series D bonds are not subject to remarketing or tender until May 23, 2019. In the event SHC receives notice of any optional tender of the 2008 Series B-1 bonds or the 2012 Series C bonds, or if any bonds become subject to mandatory tender, the purchase price of the bonds will be paid from the remarketing of such bonds. However, if the remarketing proceeds are insufficient, SHC will have a current obligation to purchase the bonds tendered. SHC maintains sufficient liquidity to provide for the full and timely purchase price of any bonds tendered in the event of a failed remarketing. At August 31, 2014, SHC had irrevocable standby letters of credit in the aggregate amount of $26.8 million posted with certain beneficiaries in the following amounts and for the following respective purposes: (i) $16.7 million to serve as security for the workers’ compensation self-insurance arrangement and (ii) $10.1 million to serve as security deposits for certain construction projects being undertaken by SHC including the Renewal Project. No amounts have been drawn on these letters of credit at August 31, 2014 and 2013. LPCH In May 2014, CHFFA, on behalf of LPCH, issued 2014 Series A bonds and 2014 Series B bonds in the aggregate principal amount of $200.0 million. Proceeds of the 2014 bonds will be used to finance a portion of the Renewal Project and to pay a portion of bond issuance costs. The 2014 Series A bonds were issued as fixed rate bonds with interest rates ranging from 4-5% over the life of the bonds. The 2014 Series B bonds were issued in a floating index mode with monthly interest rate resets. The 2014 Series B bonds are not subject to remarketing or tender until May 8, 2024.
At August 31, 2014, LPCH had irrevocable standby letters of credit in the aggregate amount of $13.8 million posted with certain beneficiaries in the following amounts and for the following respective purposes: (i) $7.2 million to serve as security for the workers’ compensation self-insurance arrangement and (ii) $6.6 million to serve as security deposits for certain construction projects being undertaken by LPCH including the Renewal Project. No amounts have been drawn on these letters of credit at August 31, 2014 and 2013.

46
INTEREST The Hospitals’ interest expense, which includes settlements under the interest rate exchange agreements, amortized bond issuance costs and amortized bond premium or discount, in thousands of dollars, is as follows:
Interest expense, gross, excluding settlements under the interest rate exchange agreements 60,623$ 59,614$ Settlements under the interest rate exchange agreements 16,982 19,674 Less: Interest capitalized as a cost of construction (21,648) (19,074) Interest expense, net $ 55,957 $ 60,214
2014 2013
PRINCIPAL PAYMENTS At August 31, 2014, scheduled principal payments on notes, bonds and capital lease obligations, in thousands of dollars, are as follows:
PRINCIPAL PAYMENTS
228,200$ 2015 Other 17,075 2016 18,930 2017 19,065 2018 19,395 2019 20,720 Thereafter 1,478,390 TOTAL $ 1,801,775
YEAR ENDING AUGUST 312015 Variable debt subject to remarketing

47
12. University Endowment
The University classifies a substantial portion of its financial resources as endowment, which is invested to generate income to support operating and strategic initiatives. The endowment, which includes endowed lands, is comprised of pure endowment funds, term endowment funds, and funds functioning as endowment (FFE). Depending on the nature of the donor’s stipulation, these resources are recorded as permanently restricted, temporarily restricted or unrestricted net assets. Term endowments are similar to other endowment funds except that, upon the passage of a stated period of time or the occurrence of a particular event, all or part of the principal may be expended. Accordingly, term endowments are classified as temporarily restricted net assets. FFE are University resources designated by the Board as endowment and are invested for long-term appreciation and current income. These assets, however, remain available and may be spent at the Board’s discretion. Accordingly, FFE are recorded as unrestricted net assets.
The University classifies as permanently restricted net assets (a) the original value of gifts donated to the permanent endowment and (b) accumulations to the permanent endowment made in accordance with the direction of the applicable donor gift instrument at the time the accumulation is added to the fund. The remaining portion of the donor-restricted endowment fund that is not classified in permanently restricted net assets is classified as temporarily restricted net assets until those amounts are authorized for expenditure. In the absence of donor stipulations or law to the contrary, net unrealized losses on permanently restricted endowment funds first reduce related appreciation on temporarily restricted net assets and then on unrestricted net assets, as needed, until the fair value of the fund equals or exceeds historic value. The aggregate amount by which fair value was below historic value was $4.9 million and $20.3 million at August 31, 2014 and 2013, respectively.
Endowment funds by net asset classification at August 31, 2014 and 2013, in thousands of dollars, are as follows:
UNRESTRICTEDTEMPORARILY RESTRICTED
PERMANENTLY RESTRICTED TOTAL
2014Donor-restricted endowment funds $ (4,882) 6,574,426$ 5,465,939$ 12,035,483$ Funds functioning as endowment 9,410,523 - - 9,410,523
TOTAL ENDOWMENT FUNDS $ 9,405,641 $ 6,574,426 $ 5,465,939 $ 21,446,006
2013Donor-restricted endowment funds $ (20,278) 5,528,171$ 5,174,848$ 10,682,741$ Funds functioning as endowment 8,006,127 - - 8,006,127
TOTAL ENDOWMENT FUNDS $ 7,985,849 $ 5,528,171 $ 5,174,848 $ 18,688,868
Most of the University’s endowment is invested in the MP. The return objective for the MP is to generate optimal long-term total return while maintaining an appropriate level of risk for the University. Investment returns are achieved through both capital appreciation (realized and unrealized gains) and current yield (interest and dividends). Portfolio asset allocation targets as well as expected risk, return and correlation among the asset classes are reevaluated annually by Stanford Management Company. Approximately 12% of the endowment is invested in real estate on Stanford's lands, including the Stanford Research Park. This portion of the endowment includes the present value of ground leases, and rental properties that have been developed on Stanford lands. The net operating income from these properties is distributed each year for University operations.
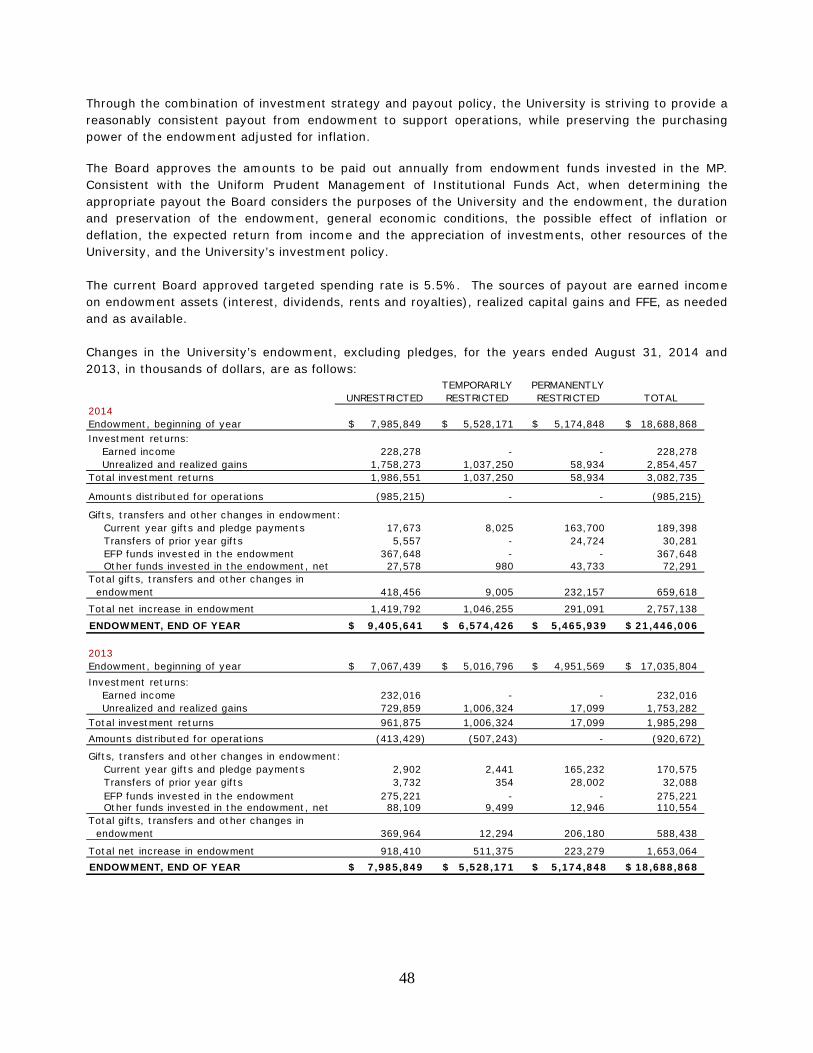
48
Through the combination of investment strategy and payout policy, the University is striving to provide a reasonably consistent payout from endowment to support operations, while preserving the purchasing power of the endowment adjusted for inflation.
The Board approves the amounts to be paid out annually from endowment funds invested in the MP. Consistent with the Uniform Prudent Management of Institutional Funds Act, when determining the appropriate payout the Board considers the purposes of the University and the endowment, the duration and preservation of the endowment, general economic conditions, the possible effect of inflation or deflation, the expected return from income and the appreciation of investments, other resources of the University, and the University’s investment policy. The current Board approved targeted spending rate is 5.5%. The sources of payout are earned income on endowment assets (interest, dividends, rents and royalties), realized capital gains and FFE, as needed and as available. Changes in the University’s endowment, excluding pledges, for the years ended August 31, 2014 and 2013, in thousands of dollars, are as follows:
UNRESTRICTEDTEMPORARILY RESTRICTED
PERMANENTLY RESTRICTED TOTAL
2014Endowment, beginning of year 7,985,849$ 5,528,171$ 5,174,848$ 18,688,868$ Investment returns:
Earned income 228,278 - - 228,278 Unrealized and realized gains 1,758,273 1,037,250 58,934 2,854,457
Total investment returns 1,986,551 1,037,250 58,934 3,082,735
Amounts distributed for operations (985,215) - - (985,215)
Gifts, transfers and other changes in endowment: Current year gifts and pledge payments 17,673 8,025 163,700 189,398 Transfers of prior year gifts 5,557 - 24,724 30,281 EFP funds invested in the endowment 367,648 - - 367,648 Other funds invested in the endowment, net 27,578 980 43,733 72,291 Total gifts, transfers and other changes in endowment 418,456 9,005 232,157 659,618
Total net increase in endowment 1,419,792 1,046,255 291,091 2,757,138 ENDOWMENT, END OF YEAR $ 9,405,641 $ 6,574,426 $ 5,465,939 $ 21,446,006
2013Endowment, beginning of year 7,067,439$ 5,016,796$ 4,951,569$ 17,035,804$ Investment returns:
Earned income 232,016 - - 232,016 Unrealized and realized gains 729,859 1,006,324 17,099 1,753,282
Total investment returns 961,875 1,006,324 17,099 1,985,298 Amounts distributed for operations (413,429) (507,243) - (920,672)
Gifts, transfers and other changes in endowment: Current year gifts and pledge payments 2,902 2,441 165,232 170,575 Transfers of prior year gifts 3,732 354 28,002 32,088 EFP funds invested in the endowment 275,221 - - 275,221 Other funds invested in the endowment, net 88,109 9,499 12,946 110,554 Total gifts, transfers and other changes in endowment 369,964 12,294 206,180 588,438
Total net increase in endowment 918,410 511,375 223,279 1,653,064 ENDOWMENT, END OF YEAR $ 7,985,849 $ 5,528,171 $ 5,174,848 $ 18,688,868

49
13. Hospitals Endowments
The endowments of SHC and LPCH are intended to generate investment income to support their current operating and strategic initiatives. The following table summarizes each hospital's share of the Hospitals endowments at August 31, 2014 and 2013, in thousands of dollars:
2014 2013LPCH 308,872$ 280,799$ SHC 17,985 16,133 TOTAL ENDOWMENT FUNDS $ 326,857 $ 296,932
The Hospitals invest the majority of their endowments in the University’s MP. Their endowments are subject to the same investment and spending strategies that the University employs as described in Note 12. The Hospitals’ Boards of Directors have approved payout policies which provide for annual amounts to be distributed for current use. “Amounts distributed for operations” in the table below represents the Hospitals’ current year endowment payout spent for designated purposes during fiscal years 2014 and 2013.
The Hospitals classify as permanently restricted net assets (a) the original value of gifts donated to the permanent endowment and (b) accumulations to the permanent endowment made in accordance with the direction of the applicable donor gift instrument at the time the accumulation is added to the fund. The remaining portion of the donor-restricted endowment fund that is not classified in permanently restricted net assets is classified as temporarily restricted net assets until those amounts are authorized for expenditure. In the absence of donor stipulations or law to the contrary, net unrealized losses on permanently restricted endowment funds first reduce related appreciation on temporarily restricted net assets and then on unrestricted net assets, as needed, until the fair value of the fund equals or exceeds historic value. The aggregate amount by which fair value was below historic value was approximately $0 and $12 thousand at August 31, 2014 and 2013, respectively.

50
Changes in Hospitals endowments, for the years ended August 31, 2014 and 2013, in thousands of dollars, are as follows:
UNRESTRICTEDTEMPORARILY RESTRICTED
PERMANENTLY RESTRICTED TOTAL
2014Endowments, beginning of year (12)$ 88,612$ 208,332$ 296,932$
Investment returns:Earned income - 14,957 - 14,957 Unrealized and realized gains 12 27,579 1,938 29,529
Total investment returns 12 42,536 1,938 44,486 Amounts distributed for operations - (14,551) - (14,551) Gifts and pledge payments - - 744 744 Other - (774) 20 (754) Total net increase in endowments 12 27,211 2,702 29,925 ENDOWMENTS, END OF YEAR $ - $ 115,823 $ 211,034 $ 326,857
2013Endowments, beginning of year (216)$ 74,081$ 207,350$ 281,215$
Investment returns:Earned income - 14,694 - 14,694 Unrealized and realized gains 204 14,812 1,364 16,380
Total investment returns 204 29,506 1,364 31,074
Amounts distributed for operations - (13,631) - (13,631) Gifts and pledge payments - - 1,185 1,185 Other - (1,344) (1,567) (2,911) Total net increase in endowments 204 14,531 982 15,717 ENDOWMENTS, END OF YEAR $ (12) $ 88,612 $ 208,332 $ 296,932
All of the Hospitals endowments are classified as donor-restricted.

51
14. University Gifts and Pledges
The University’s Office of Development (OOD) reports total gifts based on contributions received in cash or property during the fiscal year. Gifts and pledges reported for financial statement purposes are recorded on the accrual basis. The following summarizes gifts and pledges reported for the years ended August 31, 2014 and 2013, per the Statements of Activities reconciled to the cash basis reported by OOD, in thousands of dollars:
2014 2013
Current year gifts in support of operations 211,841$ 180,071$ Donor advised funds, net 29,314 1,930 Current year gifts not included in operations 17,673 2,902 Temporarily restricted gifts and pledges, net 372,875 345,526 Permanently restricted gifts and pledges, net 154,068 164,102 TOTAL PER STATEMENTS OF ACTIVITIES 785,771 694,531 Adjustments to arrive at gift total as reported by OOD:New pledges (368,759) (247,611) Payments made on pledges 269,958 282,948 Pledge discounts and other adjustments 31,842 27,225 Donor advised funds not designated for Stanford (12,003) 10,669 Non-cash gifts 11,683 2,962 Non-government grants, recorded as sponsored research support when earned 110,535 85,098 SHC gifts 87,425 73,673 Other 12,007 2,072
TOTAL AS REPORTED BY OOD $ 928,459 $ 931,567
15. Functional Expenses
Expenses for the years ended August 31, 2014 and 2013 are categorized on a functional basis as follows, in thousands of dollars:
2013UNIVERSITY HOSPITALS CONSOLIDATED CONSOLIDATED
Instruction and departmental research 1,492,360$ -$ 1,492,360$ 1,400,573$ Organized research - direct costs 1,075,577 - 1,075,577 1,040,952 Patient services - 2,753,321 2,753,321 2,593,116 Auxiliary activities 896,359 - 896,359 790,917 Administration and general 353,680 322,453 676,133 538,030 Student services 188,268 - 188,268 167,551 Libraries 160,182 - 160,182 148,334 Development 82,678 21,663 104,341 90,744 SLAC construction 42,736 - 42,736 23,527
TOTAL EXPENSES $ 4,291,840 $ 3,097,437 $ 7,389,277 $ 6,793,744
2014
Depreciation, interest, operations and maintenance expenses are allocated to program and supporting activities, except for SLAC construction. Auxiliary activities include housing and dining services, intercollegiate athletics, Stanford Alumni Association, patient care provided by the SoM faculty, and other activities.

52
16. University Retirement Plans
The University provides retirement benefits through both contributory and noncontributory retirement plans for substantially all of its employees.
DEFINED CONTRIBUTION PLAN The University offers a defined contribution plan to eligible faculty and staff through the Stanford Contributory Retirement Plan (SCRP). University and participant contributions are primarily invested in annuities and mutual funds. University contributions under the SCRP, which are vested immediately to participants, were approximately $129.0 million and $117.6 million for the years ended August 31, 2014 and 2013, respectively.
DEFINED BENEFIT PLANS The University provides retirement and postretirement medical and other benefits through three defined benefit plans: the Staff Retirement Annuity Plan, the Faculty Retirement Incentive Program, and the Postretirement Benefit Plan (the “Plans”). The obligations for the Plans, net of plan assets, are recorded in the Statements of Financial Position as “accrued pension and post retirement benefit cost”. These are described more fully below.
Staff Retirement Annuity Plan Retirement benefits for certain employees are provided through the Staff Retirement Annuity Plan (SRAP), a noncontributory plan. While the SRAP is closed to new participants, certain employees continue to accrue benefits. The University’s policy is to fund pension costs in accordance with the Employee Retirement Income Security Act (ERISA)’s requirements. Faculty Retirement Incentive Program The University also provides a retirement incentive bonus for eligible faculty through the University Faculty Retirement Incentive Program (FRIP). The University’s faculty may become eligible for the FRIP program if they commit to retire within a designated window of time. At August 31, 2014 and 2013, there were no program assets. The University funds benefit payouts as they are incurred.
Postretirement Benefit Plan The University also provides certain health care benefits for retired employees through its Postretirement Benefit Plan (PRBP). The University’s employees and their covered dependents may become eligible for the PRBP upon the employee’s retirement. Retiree health plans are paid for, in part, by retiree contributions, which are adjusted annually. Health benefits provided and the gross premiums charged (before University subsidies) to retirees under age 65 are the same as those provided to active employees. The University subsidy varies depending on whether the retiree is covered under the grandfathered design or the defined dollar benefit design. Medicare supplement options are provided for retirees over age 65.

53
The change in the Plans’ assets, the related change in benefit obligations and the amounts recognized in the financial statements, in thousands of dollars, are as follows:
STAFF RETIREMENT
ANNUITY PLAN (SRAP)
FACULTY RETIREMENT INCENTIVE PROGRAM
(FRIP)
POST RETIREMENT
BENEFIT PLAN (PRBP) TOTAL
2014Change in plan assets:Fair value of plan assets, beginning of year 276,536$ -$ 170,537$ 447,073$ Actual return on plan assets 49,934 - 29,678 79,612 Employer contributions - 3,694 18,373 22,067 Plan participants’ contributions - - 9,146 9,146 Benefits and plan expenses paid (25,156) (3,694) (24,625) * (53,475)
FAIR VALUE OF PLAN ASSETS, END OF YEAR 301,314 - 203,109 504,423
Change in projected benefit obligation:Benefit obligation, beginning of year 310,424 175,558 504,015 989,997 Service cost 3,253 10,827 15,577 29,657 Interest cost 12,798 7,373 23,606 43,777 Plan participants’ contributions - - 9,146 9,146 Actuarial loss 14,846 7,532 29,179 51,557 Benefits and plan expenses paid (25,156) (3,694) (24,625) * (53,475)
BENEFIT OBLIGATION, END OF YEAR 316,165 197,596 556,898 1,070,659
NET LIABILITY RECOGNIZED IN THESTATEMENTS OF FINANCIAL POSITION $ (14,851) $ (197,596) $ (353,789) $(566,236)
* Net of Medicare subsidy
2013Change in plan assets:Fair value of plan assets, beginning of year 290,257$ -$ 149,798$ 440,055$ Actual return on plan assets 5,082 - 18,216 23,298 Employer contributions 4,720 3,995 18,323 27,038 Plan participants’ contributions - - 7,298 7,298 Benefits and plan expenses paid (23,523) (3,995) (23,098) * (50,616)
FAIR VALUE OF PLAN ASSETS, END OF YEAR 276,536 - 170,537 447,073
Change in projected benefit obligation:Benefit obligation, beginning of year 349,126 179,669 560,578 1,089,373 Service cost 3,831 11,734 18,349 33,914 Interest cost 11,256 5,867 20,861 37,984 Plan participants’ contributions - - 7,298 7,298 Actuarial gain (30,266) (17,717) (79,973) (127,956) Benefits and plan expenses paid (23,523) (3,995) (23,098) * (50,616)
BENEFIT OBLIGATION, END OF YEAR 310,424 175,558 504,015 989,997
NET LIABILITY RECOGNIZED IN THESTATEMENTS OF FINANCIAL POSITION $ (33,888) $ (175,558) $ (333,478) $(542,924)
* Net of Medicare subsidy The accumulated benefit obligation for the SRAP was $313.9 million and $307.8 million at August 31, 2014 and 2013, respectively.

54
Net periodic benefit expense and non-operating activities related to the Plans for the years ended August 31, 2014 and 2013, in thousands of dollars, includes the following components:
STAFF RETIREMENT
ANNUITY PLAN (SRAP)
FACULTY RETIREMENT INCENTIVE PROGRAM
(FRIP)
POST RETIREMENT
BENEFIT PLAN (PRBP) TOTAL
2014Service cost 3,253$ 10,827$ 15,577$ 29,657$ Interest cost 12,798 7,373 23,606 43,777 Expected return on plan assets (18,389) - (11,938) (30,327) Amortization of:Prior service cost 540 - 2,545 3,085 Actuarial loss 349 5,679 5,111 11,139
NET PERIODIC BENEFIT EXPENSE (INCOME) (1,449) 23,879 34,901 57,331
Net actuarial gain during period (16,699) 7,532 11,439 2,272 Amortization of:Prior service cost (540) - (2,545) (3,085) Actuarial loss (349) (5,679) (5,111) (11,139)
TOTAL AMOUNTS RECOGNIZED INNON-OPERATING ACTIVITIES (17,588) 1,853 3,783 (11,952)
TOTAL AMOUNT RECOGNIZED IN NET PERIODIC BENEFIT EXPENSE AND NON-OPERATING ACTIVITIES (19,037)$ 25,732$ 38,684$ 45,379$
2013Service cost 3,831$ 11,734$ 18,349$ 33,914$ Interest cost 11,256 5,867 20,861 37,984 Expected return on plan assets (19,478) - (10,530) (30,008) Amortization of:Prior service cost 540 - 2,569 3,109 Actuarial loss 2,970 7,464 11,165 21,599
NET PERIODIC BENEFIT EXPENSE (INCOME) (881) 25,065 42,414 66,598
Net actuarial gain during period (15,870) (17,717) (87,632) (121,219) Amortization of:Prior service cost (540) - (2,569) (3,109) Actuarial loss (2,970) (7,464) (11,165) (21,599)
TOTAL AMOUNTS RECOGNIZED INNON-OPERATING ACTIVITIES (19,380) (25,181) (101,366) (145,927)
TOTAL AMOUNT RECOGNIZED IN NET PERIODIC BENEFIT EXPENSE AND NON-OPERATING ACTIVITIES $ (20,261) $ (116) $ (58,952) $ (79,329)

55
Cumulative amounts recognized in non-operating activities, but not yet recognized in net periodic benefit expense in the Statements of Activities, are presented in the following table for the years ended August 31, 2014 and 2013, in thousands of dollars:
STAFF RETIREMENT
ANNUITY PLAN (SRAP)
FACULTY RETIREMENT INCENTIVE PROGRAM
(FRIP)
POST RETIREMENT
BENEFIT PLAN (PRBP) TOTAL
2014Prior service cost 314$ -$ 3,394$ 3,708$ Net actuarial loss 21,838 98,690 135,025 255,553 ACCUMULATED PLAN BENEFIT COSTS
NOT YET RECOGNIZEDIN NET PERIODIC BENEFIT EXPENSE $ 22,152 $ 98,690 $ 138,419 $ 259,261
2013Prior service cost 854$ -$ 5,939$ 6,793$ Net actuarial loss 38,886 96,837 128,697 264,420 ACCUMULATED PLAN BENEFIT COSTS
NOT YET RECOGNIZEDIN NET PERIODIC BENEFIT EXPENSE $ 39,740 $ 96,837 $ 134,636 $ 271,213
The prior service costs and net actuarial loss expected to be amortized from non-operating activities to net periodic benefit expense in fiscal year 2015, in thousands of dollars, are as follows:
STAFF RETIREMENT
ANNUITY PLAN (SRAP)
FACULTY RETIREMENT INCENTIVE PROGRAM
(FRIP)
POST RETIREMENT
BENEFIT PLAN (PRBP) Total
Prior service cost $ 277 -$ $ 2,545 2,822$ Net actuarial loss -$ 5,570$ $ 5,192 10,762$
ACTUARIAL ASSUMPTIONS The weighted average assumptions used to determine the benefit obligations and net periodic benefit cost for the Plans are shown below:
2014 2013 2014 2013 2014 2013BENEFIT OBLIGATIONSDiscount rate 3.64% 4.31% 3.59% 4.30% 4.10% 4.77%Covered payroll growth rate 3.00% 3.50% 4.45% 4.41% N/A N/A
NET PERIODIC BENEFIT COSTDiscount rate 4.31% 3.36% 4.30% 3.33% 4.77% 3.78%Expected returns on plan assets 7.00% 7.00% N/A N/A 7.00% 7.00%Covered payroll growth rate 3.50% 3.54% 4.41% 4.42% N/A N/A
STAFF RETIREMENT ANNUITY PLAN
(SRAP)
FACULTY RETIREMENT INCENTIVE
PROGRAM (FRIP)
POST RETIREMENT BENEFIT PLAN
(PRBP)

56
The expected long-term rate of return on asset assumptions for both the SRAP and PRBP plans is 7%. Expected returns on plan assets, a component of net periodic benefit expense (income), represent the long-term return on plan assets based on the calculated market-related value of plan assets. These rates of return are developed using an arithmetic average and are tested for reasonableness against historical returns, and the future expectations for returns in each asset class, as well as the target asset allocation of the portfolios. The use of expected long-term returns on plan assets may result in income that is greater or less than the actual returns of those plan assets in any given year. Over time, however, the expected long-term returns are designed to approximate the actual long-term returns, and therefore result in a pattern of income and cost recognition that more closely matches the pattern of the services provided by the employees. Differences between actual and expected returns are recognized as a component of non-operating activities and amortized as a component of net periodic benefit expense (income) over the service life expectancy of the plan participants, depending on the plan, provided such amounts exceed the accounting standards threshold.
To determine the accumulated PRBP obligation at August 31, 2014, a 7.25% annual rate of increase in the per capita costs of covered health care was assumed for calendar year 2014, declining gradually to 4.75% by 2024 and remaining at this rate thereafter. Health care cost trend rate assumptions have a significant effect on the amounts reported for the health care plans. Increasing the health care cost trend rate by 1% in each future year would increase the accumulated PRBP obligation by $99.5 million and the aggregate annual service and interest cost by $8.3 million. Decreasing the health care cost trend rate by 1% in each future year would decrease the accumulated PRBP obligation by $78.4 million and the aggregate annual service and interest cost by $6.3 million.
EXPECTED CONTRIBUTIONS The University expects to contribute $9.5 million to the FRIP and does not expect to contribute to the SRAP or PRBP during the year ending August 31, 2015.
EXPECTED BENEFIT PAYMENTS The following benefit payments, which reflect expected future service, are expected to be paid, in thousands of dollars, for the years ending August 31:
YEAR ENDING AUGUST 31
EXCLUDING MEDICARE SUBSIDY
EXPECTED MEDICARE PART D
SUBSIDY2015 27,784$ 9,488$ 17,661$ 2,921$ 2016 23,774 12,457 18,782 3,209 2017 23,547 14,875 20,143 3,501 2018 23,375 15,007 21,599 3,810 2019 22,925 15,483 23,013 4,146 2020 - 2024 106,949 82,940 137,695 26,566
POST RETIREMENT BENEFIT PLAN (PRBP)FACULTY
RETIREMENT INCENTIVE PROGRAM
(FRIP)
STAFF RETIREMENT
ANNUITY PLAN (SRAP)

57
INVESTMENT STRATEGY The University’s Retirement Program Investment Committee, acting in a fiduciary capacity, has established formal investment policies for the assets associated with the University’s funded plans (SRAP and PRBP). The investment strategy of the plans is to preserve and enhance the value of the plans’ assets within acceptable levels of risk. Investments in the plans are diversified among asset classes, striving to achieve an optimal balance between risk and return, and income and capital appreciation. Because the liabilities of each of the plans are long-term, the investment horizon is primarily long-term, with adequate liquidity to meet short-term benefit payment obligations.
CONCENTRATION OF RISK The University manages a variety of risks, including market, credit, and liquidity risks, across its plan assets. Concentration of risk is defined as an undiversified exposure to one of the above-mentioned risks that increases the exposure of the loss of plan assets unnecessarily. Risk is minimized by predominately investing in broadly diversified index funds for public equities and fixed income. As of August 31, 2014, the University did not have concentrations of risk in any single entity, counterparty, sector, industry or country.
PLAN ASSET ALLOCATIONS Actual allocations and weighted-average target allocations by asset category at August 31, 2014 are as follows:
ASSET CATEGORY ACTUAL TARGET ACTUAL TARGET
2014Cash and cash equivalents <1% 0% 0% 0%Public equities 40% 45% 75% 75%Fixed income 60% 55% 25% 25%Private equities <1% <1% 0% 0%TOTAL PORTFOLIO 100% 100% 100% 100%
STAFF RETIREMENT ANNUITY PLAN
(SRAP)
POST RETIREMENT BENEFIT PLAN
(PRBP)

58
FAIR VALUE OF PLAN ASSETS Current U.S GAAP defines a hierarchy of valuation inputs for the determination of the fair value of plan assets as described in Note 5. The plan assets measured at fair value at August 31, 2014 and 2013, in thousands of dollars, are as follows:
AS OFAUGUST 31, 2014 LEVEL 1 LEVEL 2 LEVEL 3
SRAP:Cash and cash equivalents 1,308$ 1,308$ -$ -$ Public equities 119,908 119,908 - - Fixed income 179,842 176,061 3,781 - Private equities 256 - - 256
TOTAL 301,314 297,277 3,781 256
PRBP:Public equities 152,150 152,150 - - Fixed income 50,959 50,959 - -
TOTAL 203,109 203,109 - - TOTAL FAIR VALUE OF PLAN ASSETS $ 504,423 $ 500,386 $ 3,781 $ 256
AS OFAUGUST 31, 2013 LEVEL 1 LEVEL 2 LEVEL 3
SRAP:Cash and cash equivalents 1,156$ 1,156$ -$ -$ Public equities 119,714 119,714 - - Fixed income 155,379 151,511 3,868 - Private equities 287 - - 287 TOTAL 276,536 272,381 3,868 287 PRBP:Public equities 127,182 127,182 - - Fixed income 43,355 43,355 - -
TOTAL 170,537 170,537 - - TOTAL FAIR VALUE OF PLAN ASSETS $ 447,073 $ 442,918 $ 3,868 $ 287

59
17. Hospitals Retirement Plans
The Hospitals provide retirement benefits through defined benefit and defined contribution retirement plans covering substantially all regular employees.
DEFINED CONTRIBUTION PLAN Employer contributions to the defined contribution retirement plan are based on a percentage of participant annual compensation. Employer contributions to this plan amounted to approximately $81.3 million and $71.6 million for the years ended August 31, 2014 and 2013, respectively.
DEFINED BENEFIT PLANS Certain employees of the Hospitals are covered by the Staff Pension Plan (the “Pension Plan”), a noncontributory, defined benefit pension plan. Benefits of certain prior employees of LPCH are covered by a frozen defined benefit plan. Benefits are based on years of service and the employee’s compensation. Contributions to the plans are based on actuarially determined amounts sufficient to meet the benefits to be paid to plan participants.
POST RETIREMENT MEDICAL BENEFIT PLAN The Hospitals currently provide health insurance coverage for certain retired employees through its Post Retirement Medical Benefit Plan (PRMB). The Hospitals’ employees and their covered dependents may become eligible for the PRMB upon the employee’s retirement as early as age 55, with years of service as defined by specific criteria. Retiree health plans are paid, in part, by retiree contributions, which are adjusted annually. The Hospitals provide a subsidy which varies depending on whether the retiree is covered under the grandfathered design or the defined dollar benefit design. A Medicare supplement option is provided for retirees over age 65. The obligation for these benefits has been recorded in the Statements of Financial Position as “accrued pension and post retirement benefit cost”.

60
The change in Pension Plan and PRMB plans’ assets, the related change in benefit obligations and the amounts recognized in the financial statements, in thousands of dollars, are as follows:
TOTAL2014
Change in plan assets:Fair value of plan assets, beginning of year 187,527$ -$ 187,527$ Actual return on plan assets 37,820 - 37,820 Employer contributions 6,020 4,703 10,723 Plan participants’ contributions - 1,237 1,237 Benefits and plan expenses paid (10,939) (5,940) (16,879)
FAIR VALUE OF PLAN ASSETS, END OF YEAR 220,428 - 220,428
Change in projected benefit obligation: Benefit obligation, beginning of year 231,342 82,846 314,188 Service cost 2,324 1,839 4,163 Interest cost 10,330 3,507 13,837 Plan participants’ contributions - 1,237 1,237 Actuarial loss 20,094 1,127 21,221 Benefits and plan expenses paid (10,939) (5,940) (16,879) BENEFIT OBLIGATION, END OF YEAR 253,151 84,616 337,767 NET LIABILITY RECOGNIZED IN THE
STATEMENTS OF FINANCIAL POSITION $ (32,723) $ (84,616) $ (117,339)
2013Change in plan assets:Fair value of plan assets, beginning of year 190,704$ -$ 190,704$ Actual return on plan assets 3,772 - 3,772 Employer contributions 3,986 5,163 9,149 Plan participants’ contributions - 1,859 1,859 Benefits and plan expenses paid (10,935) (7,022) (17,957) FAIR VALUE OF PLAN ASSETS, END OF YEAR 187,527 - 187,527
Change in projected benefit obligation:Benefit obligation, beginning of year 257,781 87,150 344,931 Service cost 2,708 2,075 4,783 Interest cost 9,117 2,911 12,028 Plan participants’ contributions - 1,859 1,859 Actuarial gain (27,329) (5,751) (33,080) Benefits and plan expenses paid (10,935) (7,022) (17,957)
Plan amendments - 1,624 1,624 BENEFIT OBLIGATION, END OF YEAR 231,342 82,846 314,188
NET LIABILITY RECOGNIZED IN THESTATEMENTS OF FINANCIAL POSITION $ (43,815) $ (82,846) $ (126,661)
STAFF PENSION PLAN
POST RETIREMENT
MEDICAL BENEFIT PLAN
(PRMB)
The accumulated benefit obligation for the Pension Plan was $250.7 million and $228.7 million at August 31, 2014 and 2013, respectively.

61
Net periodic benefit expense and non-operating activities related to the plans for the years ended August 31, 2014 and 2013, in thousands of dollars, includes the following components:
TOTAL
2014Service cost 2,324$ 1,839$ 4,163$ Interest cost 10,330 3,507 13,837 Expected return on plan assets (13,471) - (13,471) Amortization of:Prior service cost - 815 815 Actuarial loss (gain) 2,245 (463) 1,782
NET PERIODIC BENEFIT EXPENSE 1,428 5,698 7,126
Net actuarial (gain) loss during period (4,255) 1,127 (3,128) Amortization of:Prior service cost - (815) (815) Actuarial (loss) gain (2,245) 463 (1,782)
TOTAL AMOUNTS RECOGNIZED INNON-OPERATING ACTIVITIES (6,500) 775 (5,725)
TOTAL AMOUNT RECOGNIZED IN NET PERIODIC BENEFIT EXPENSE AND NON-OPERATING ACTIVITIES $ (5,072) $ 6,473 $ 1,401
2013Service cost 2,708$ 2,075$ 4,783$ Interest cost 9,117 2,911 12,028 Expected return on plan assets (13,993) - (13,993) Amortization of:Prior service cost - 312 312 Actuarial loss (gain) 10,677 (71) 10,606
NET PERIODIC BENEFIT EXPENSE 8,509 5,227 13,736
Prior service cost during period - 1,624 1,624 Net actuarial gain during period (17,108) (5,751) (22,859) Amortization of:Prior service cost - (312) (312) Actuarial (loss) gain (10,677) 71 (10,606)
TOTAL AMOUNTS RECOGNIZED INNON-OPERATING ACTIVITIES (27,785) (4,368) (32,153)
TOTAL AMOUNT RECOGNIZED IN NET PERIODIC BENEFIT EXPENSE AND NON-OPERATING ACTIVITIES $ (19,276) $ 859 $ (18,417)
STAFFPENSION PLAN
POST RETIREMENT
MEDICAL BENEFIT PLAN
(PRMB)

62
Cumulative amounts recognized in non-operating activities, but not yet recognized in net periodic benefit expense in the Statements of Activities, are presented in the following table for the years ended August 31, 2014 and 2013, in thousands of dollars:
TOTAL
2014Prior service cost -$ 3,401$ 3,401$ Net actuarial loss (gain) 66,817 (5,054) 61,763 ACCUMULATED PLAN BENEFIT COSTS
NOT YET RECOGNIZEDIN NET PERIODIC BENEFIT EXPENSE $ 66,817 $ (1,653) $ 65,164
2013Prior service cost -$ 4,216$ 4,216$ Net actuarial loss (gain) 73,317 (6,644) 66,673 ACCUMULATED PLAN BENEFIT COSTS
NOT YET RECOGNIZEDIN NET PERIODIC BENEFIT EXPENSE $ 73,317 $ (2,428) $ 70,889
STAFFPENSION PLAN
POST RETIREMENT
MEDICAL BENEFIT PLAN
(PRMB)
The prior service cost and net actuarial loss expected to be amortized from non-operating activities to net periodic benefit expense in fiscal year 2015, in thousands of dollars, are as follows:
TOTALPrior service cost $ - $ 815 $ 815 Net actuarial loss (gain) $ 2,631 $ (338) $ 2,293
POST RETIREMENT
MEDICAL BENEFIT PLAN (PRMB)
STAFF PENSION PLAN
ACTUARIAL ASSUMPTIONS The weighted average assumptions used to determine the benefit obligations and net periodic benefit cost for the Pension Plan and PRMB are shown below:
2014 2013 2014 2013BENEFIT OBLIGATIONSDiscount rate 3.66% - 3.84% 4.37% - 4.59% 3.65% 4.37%Covered payroll growth rate 3.00% 3.00% N/A N/A
NET PERIODIC BENEFIT COSTDiscount rate 4.37% - 4.59% 3.42% - 3.62% 4.37% 3.43%Expected return on plan assets 6.25% - 7.50% 6.25% - 8.00% N/A N/ACovered payroll growth rate 3.00% 5.50% N/A N/A
POST RETIREMENT MEDICAL BENEFIT PLAN (PRMB)STAFF PENSION PLAN
To develop the expected long-term rate of return on assets assumptions, the Hospitals considered the historical returns and the future expectations for returns for each asset class, as well as the target asset allocation of the pension portfolio.

63
To determine the accumulated PRMB obligation at August 31, 2014, a 7.25% annual rate of increase in the per capita cost of covered health care was assumed for calendar year 2014, declining gradually to 4.75% by 2024 and remaining at this rate thereafter.
Assumed health care cost trend rates have a significant effect on the amounts reported for the health care plans. Increasing the health care cost trend rate by 1% in each future year would increase the accumulated PRMB obligation by $2.4 million and the aggregate annual service and interest cost by $156 thousand. Decreasing the health care cost trend rate by 1% in each future year would decrease the accumulated PRMB obligation by $2.3 million and the aggregate annual service and interest cost by $144 thousand.
EXPECTED CONTRIBUTIONS The Hospitals expect to contribute $0 to their Pension Plan and $4.4 million to their PRMB during the fiscal year ending August 31, 2015.
EXPECTED BENEFIT PAYMENTS The following benefit payments, which reflect expected future service, are expected to be paid for the fiscal years ending August 31, in thousands of dollars:
YEAR ENDING AUGUST 31STAFF
PENSION PLAN
EXCLUDING MEDICARE SUBSIDY
EXPECTED MEDICARE
PART D SUBSIDY
2015 13,164$ 5,464$ 314$ 2016 13,741 5,685 310 2017 14,222 5,918 304 2018 14,661 6,158 297 2019 15,046 6,418 287 2020 - 2024 78,427 34,573 1,249
POST RET IREMENT MEDICAL BENEFIT PLAN (PRMB)
INVESTMENT STRATEGY The Hospitals’ investment strategy for the Pension Plan is to maximize the total rate of return (income and appreciation) within the limits of prudent risk taking and Section 404 of the ERISA. The funds are diversified across asset classes to achieve an optimal balance between risk and return and between income and capital appreciation. Many of the pension liabilities are long-term. The investment horizon is also long-term; however, the investment plan also ensures adequate near-term liquidity to meet benefit payments.
CONCENTRATION OF RISK The Hospitals manage a variety of risks, including market, credit, and liquidity risks, across its plan assets. Concentration of risk is defined as an undiversified exposure to one of the above-mentioned risks that increases the exposure of the loss of plan assets unnecessarily. Risk is minimized by diversifying the Hospitals’ exposure to such risks across a variety of instruments, markets, and counterparties. As of August 31, 2014, the Hospitals did not have concentrations of risk in any single entity, counterparty, sector, industry or country.

64
PLAN ASSETS The Hospitals’ investment policy is to invest in assets that result in a favorable long-term rate of return from a diversified portfolio. Actual allocations and weighted-average target allocations by asset category for the Pension Plan at August 31, 2014 are as follows:
ASSET CATEGORY ACTUAL TARGET2014Cash and cash equivalents <1% 0%Public equities 49% 50%Fixed income 51% 50%TOTAL PORTFOLIO 100% 100%
FAIR VALUE OF PLAN ASSETS Current U.S. GAAP defines a hierarchy of valuation inputs for the determination of the fair value of plan assets as described in Note 5. The Pension Plan assets measured at fair value at August 31, 2014 and 2013, are all categorized as Level 1 investments and are as follows, in thousands of dollars:
2014 2013
Cash and cash equivalents 962$ 1,128$ Public equities 107,628 97,661 Fixed income 111,838 88,738
$ 220,428 $ 187,527 TOTAL FAIR VALUE OF PENSION PLAN ASSETS

65
18. Operating Leases
The University and the Hospitals lease certain equipment and facilities under operating leases expiring at various dates. Total rental expense under these leases for the years ended August 31, 2014 and 2013 was $45.3 million and $37.8 million, respectively, for the University and $80.5 million and $76.7 million, respectively, for the Hospitals.
Net minimum future operating lease payments and related present value, assuming a 4.8% discount rate for periods subsequent to August 31, 2014, in thousands of dollars, are as follows:
YEAR ENDING AUGUST 31 UNIVERSITY HOSPITALS UNIVERSITY HOSPITALS2015 29,432$ 67,622$ 28,084$ 64,525$ 2016 20,703 61,424 18,850 55,926 2017 19,883 59,866 17,274 52,011 2018 19,547 55,382 16,205 45,912 2019 15,622 51,145 12,357 40,457 Thereafter 80,799 122,808 43,250 69,967
TOTAL $ 185,986 $ 418,247 $ 136,020 $ 328,798
MINIMUM LEASE PAYMENTSPRESENT VALUE OF MINIMUM
LEASE PAYMENTS
19. Related Party Transactions
Members of the University's Board and senior management may, from time to time, be associated, either directly or indirectly, with companies doing business with the University. For senior management, the University requires annual disclosure of significant financial interests in, or employment or consulting relationships with, entities doing business with the University. These annual disclosures cover both senior management and their immediate family members. When such relationships exist, measures are taken to appropriately manage the actual or perceived conflict in the best interests of the University. The University has a written conflict of interest policy that requires, among other things, that no member of the Board can participate in any decision in which he or she (or an immediate family member) has a material financial interest. Each trustee is required to certify compliance with the conflict of interest policy on an annual basis and indicate whether the University does business with an entity in which a trustee has a material financial interest. When such relationships exist, measures are taken to mitigate any actual or perceived conflict, including requiring that such transactions be conducted at arm's length, for good and sufficient consideration, based on terms that are fair and reasonable to and for the benefit of the University, and in accordance with applicable conflict of interest laws. No such associations are considered to be significant.

66
20. Commitments and Contingencies
Management is of the opinion that none of the following commitments and contingencies will have a material adverse effect on the University’s consolidated financial position.
SPONSORED RESEARCH The University conducts substantial research for the federal government pursuant to contracts and grants from federal agencies and departments. The University records reimbursements of direct and indirect costs (facilities and administrative costs) from grants and contracts as operating revenues. The Office of Naval Research is the University’s cognizant federal agency for determining indirect cost rates charged to federally sponsored agreements. It is supported by the Defense Contract Audit Agency, which has the responsibility for auditing direct and indirect charges under those agreements. Costs recovered by the University in support of sponsored research are subject to audit and adjustment. Fringe benefit costs for the fiscal years ended August 31, 2007 to 2014 are still subject to audit. The University does not anticipate that any adjustments will be material to the consolidated financial statements.
HEALTH CARE Cost reports filed under the Medicare program for services based upon cost reimbursement are subject to audit. The estimated amounts due to or from the program are reviewed and adjusted annually based upon the status of such audits and subsequent appeals. Differences between final settlements and amounts accrued in previous years are reported as adjustments to “patient care, net” revenue in the year the examination is substantially completed. Medicare cost reports have been audited by the Medicare fiscal intermediary through August 31, 2005 for SHC and August 31, 2012 for LPCH.
The health care industry is subject to numerous laws and regulations of federal, state and local governments. Compliance with these laws and regulations can be subject to future government review and interpretation, as well as to regulatory actions unknown or unasserted at this time. Government activity with respect to investigations and allegations concerning possible violations by health care providers of regulations could result in the imposition of significant fines and penalties, as well as significant repayments for patient services previously billed. The Hospitals are subject to similar regulatory reviews, and while such reviews may result in repayments and/or civil remedies that could have a material effect on the Hospitals’ financial results of operations in a given period, each Hospital’s management believes that such repayments and/or civil remedies would not have a material effect on its financial position.
INFORMATION SECURITY AND PRIVACY As with many medical centers and universities across the country, information security and privacy is a growing risk area based on developments in the law and expanding mobile technology practices. The University and the Hospitals have policies, procedures, and training in place to safeguard protected information, but select incidents have occurred in the past and may occur in the future involving potential or actual disclosure of such information (including, for example, certain identifiable information relating to patients or research participants). In most cases, there has been no evidence of unauthorized access to, or use/disclosure of, such information, yet laws may require reporting to potentially affected individuals and federal and state governmental agencies. Governmental agencies have the authority to investigate and request further information about an incident or safeguards, to cite the University or Hospitals for a deficiency or regulatory violation, and/or require payment of fines, corrective action, or both. California law also allows a private right to sue for a breach of medical information. The cost of such possible consequences has not been material to date to the University or the Hospitals, and management does not believe that any future consequences of these incidents will be material to the consolidated financial statements.

67
LABOR AGREEMENTS Approximately 10% of the University’s, 34% of SHC’s and 42% of LPCH’s employees are covered under union contract arrangements and are, therefore, subject to labor stoppages when contracts expire. There are currently no expired contracts under these union contract arrangements. The University’s agreements with the Stanford Deputy Sheriffs’ Association and the Service Employees International Union (SEIU) will expire in 2015 and 2019, respectively. The Hospitals’ agreements with SEIU and the Committee for Recognition of Nursing Achievement (CRONA) will expire in 2017 and 2016, respectively. GUARANTEES AND INDEMNIFICATIONS The University and the Hospitals enter into indemnification agreements with third parties in the normal course of business. The impact of these agreements, individually or in the aggregate, is not expected to be material to the consolidated financial statements. As a result, no liabilities related to guarantees and indemnifications have been recorded at August 31, 2014. LITIGATION The University and the Hospitals are defendants in a number of legal actions. While the final outcome cannot be determined at this time, management is of the opinion that the liability, if any, resulting from these legal actions will not have a material adverse effect on the consolidated financial position. MEDICAL CENTER RENEWAL PROJECT In July 2011, the University and Hospitals obtained local approval for a Renewal Project to rebuild SHC and expand LPCH to assure adequate capacity and provide modern, technologically-advanced hospital facilities. The Renewal Project also includes replacement of outdated laboratory facilities at the Stanford SoM and remodeling of Hoover Pavilion.
California's Hospital Seismic Safety Act requires licensed acute care functions to be conducted only in facilities that meet specified seismic safety standards which have varying deadlines. The Renewal Project as approved is also designed to meet these standards and deadlines.
SHC’s and LPCH’s share of the estimated total cost of the Renewal Project is $2 billion and $1.2 billion, respectively. The source of funding for the Renewal Project includes operating surpluses, gifts, government grants, and bond proceeds. Through August 2014, the Hospitals have recorded $913.8 million in construction in progress related to this project. Based on current estimated schedules, management currently projects that the Renewal Project construction will be complete in 2017. CONTRACTUAL COMMITMENTS At August 31, 2014, the University had contractual obligations of approximately $278.5 million in connection with major construction projects. Remaining expenditures on construction in progress are estimated to be $631.3 million, which will be financed with certain unexpended plant funds, gifts and debt. Commitments on contracts for the construction and remodeling of Hospital facilities were approximately $1.3 billion at August 31, 2014. As described in Note 5, the University is obligated under certain alternative investment agreements to advance additional funding up to specified levels over a period of years.

68
21. Subsequent Events
The University and the Hospitals have evaluated subsequent events for the period from August 31, 2014 through December 10, 2014, the date the consolidated financial statements were available to be issued. In September 2014, ValleyCare Health System (VCHS) and SHC entered into an affiliation agreement under which SHC will become the sole corporate member of VCHS. VCHS operates inpatient and other health care facilities at three Bay Area locations in Alameda County, California. The closing of the affiliation is subject to various approvals including regulatory approvals.

69
Stanford Management Company 2014 Annual Report
The Stanford Management Company (SMC) was established in 1991 to
manage Stanford’s financial assets. SMC is a division of the University with
oversight by a Board of Directors appointed by the University Board of
Trustees. The SMC Board consists of investment professionals, the University
president, the University chief financial officer, members of the Board of
Trustees, and the SMC chief executive officer. The Board approves SMC asset
allocation targets, oversees the hiring of external asset managers, evaluates
the performance of SMC investments and professionals, and oversees
management of significant portions of endowment, trust assets and
expendable funds for the University and the Hospitals.
The majority of the University’s endowment assets are invested through the Merged Pool (MP), which is a
diversified portfolio of actively managed financial assets valued at approximately $25.0 billion as of June 30, 2014.
To facilitate the comparison of returns with other endowments and foundations, MP performance measurements
were calculated on the 12 months ending June 30, 2014. The following discussion of endowment performance
relates solely to investments in the MP. The MP realized a 16.8% investment gain for the 12 months ending June
30, 2014. Over the past 10 years, the MP achieved an annualized rate of return of 9.9%, growing from $10 billion
to $25 billion.
The MP portfolio is constructed on a foundation of modern portfolio theory and strategic asset allocation. The
portfolio is designed to optimize long‐term returns, create consistent annual payouts to the University’s
operating budget and preserve purchasing power for future generations of Stanford faculty and students.
SMC, with assistance from its Board of Directors, actively manages the MP, primarily through selecting third‐party
managers to deploy the MP’s capital. Stanford University’s brand and SMC’s reputation as a stable long‐term
source of capital enable SMC to gain access to the best third‐party managers in the world. Within each business
unit, we endeavor to place capital with a diversified set of managers across geographies and investment
strategies. SMC also seeks to add value through effective risk management, tactical portfolio rebalancing and
opportunistic investment tilts.

70
STANFORD MP ASSET ALLOCATION
Given the perpetual nature of the University, SMC’s investment horizon is long‐term. Our objective
is to generate maximum total returns for an appropriate level of risk. SMC and the Board regularly
reevaluate portfolio asset allocation targets, as well as expected risks, returns and correlations
across business units. In addition, SMC reviews positioning relative to long‐term policy targets on an
ongoing basis and adjusts the portfolio in the context of current market conditions and relative
opportunities. The strategic asset allocation targets for the MP as of June 30, 2014 are listed below:
LONG‐TERM POLICY TARGETS
Business Unit Long‐Term Policy Target
Public Equity 25%
Private Equity 23%
Absolute Return 22%
Natural Resources 12%
Real Estate 8%
Fixed Income 10%
STANFORD MP PERFORMANCE COMPARED TO INFLATION
The table below outlines annualized returns for various periods ending June 30, 2014.
Business Unit One‐Year Three‐Year Five‐Year Ten‐Year
Nominal Endowment Return 16.8% 9.8% 13.1% 9.9%
GDP Deflator 1.6% 1.6% 1.6% 2.0%
Real Endowment Return 15.2% 8.2% 11.5% 7.9%

71
STANFORD MP PERFORMANCE COMPARED TO BENCHMARKS
SMC reviews overall MP performance against the composite benchmark return, which represents a blend
of the benchmark returns for each business unit weighted by the strategic allocations above. The relative
one‐year performance of the MP versus the benchmark was 0.5%.
In the 12 months ending June 30, 2014, the Merged Pool (MP) gained 16.8%, continuing a strong recovery
since the market bottom in 2009. During the same period, the MSCI ACWI IMI Net Index returned 23.4%,
the Barclays Aggregate returned 4.4%, and a 60/40 equity/fixed income mix would have returned 15.5%.
Our performance was consistent with our long‐term strategic asset allocation which gives us significant
exposure to rising markets, while maintaining flexibility and optionality in the case of market volatility.
Diverging global macroeconomic conditions and policy responses have driven returns across the portfolio
over the past year. The US economic recovery continues and the S&P 500 returned 24.6% over the year
ending June 30, 2014. Economic growth has been weaker in Europe and Japan, but expectations of further
stimulus have supported equity markets. Sovereign bond yields across Developed Markets remain low and
credit spreads tight. US rates are expected to gradually increase, but how and when the Fed exits this
period of unconventional monetary policy is a key question facing the economy and markets.
The MP is fully invested across a range of diversified assets and positioned close to policy allocation. The
majority of our exposure is through external managers and complemented by direct positions to express
more intentional global asset tilts and idiosyncratic opportunities. Within our asset allocation, we are
actively positioning to drive alpha and maximize absolute and relative returns over the market cycle. In the
table below, actual performance, net of management fees, is compared to the composite benchmark
along with a 60% equity / 40% bond portfolio for periods ended June 30, 2014.
STANFORD MP VS. STANFORD COMPOSITE BENCHMARK
Stanford MP vs. Stanford Composite Benchmark and Passive 60% Equity / 40% Bond Composite
16.8%
9.8%
13.1%
9.9%
16.3%
10.0%11.8%
9.5%
15.5%
7.9%
11.0%
7.0%
One‐Year Three‐Year Five‐Year Ten‐Year
MP Annualized Returns Benchmark ACWI IMI Net / AGG 60/40

72
STANFORD MP VS. STANFORD COMPOSITE BENCHMARK AND PASSIVE 60% EQUITY / 40% BOND COMPOSITE
SMC’s effectiveness in implementing its investment strategies through top‐level manager selection has
resulted in consistent and long‐term outperformance versus relevant benchmarks. The cumulative return
chart below compares the growth of $100 in Stanford’s MP, a composite benchmark portfolio, and a
60% equity / 40% bond portfolio over the past 10 years:
Benchmark and Passive 60% Equity/40% Bond Composite
INDIVIDUAL BUSINESS UNIT PERFORMANCE
SMC evaluates investment manager performance by comparing manager returns to respective SMC Board
approved benchmarks. The performance of individual business units for the 12 months ended June 30,
2014, relative to each business unit benchmark, is illustrated in the graph below:
Stanford MP One‐Year Business Unit Return vs, Benchmark
20.4%
28.1%
9.1 %
17.8% 16.5%
3.3%
23.4% 23.3%
7.0%
15.6% 16.2%
4.3%
Public Equity Private Equity Absolute Return Natural Resources Real Estate Fixed Income
MP Benchmark
Stanford MP vs. Stanford Composite Benchmark and Passive 60% Equity / 40% Bond Composite
$50
$100
$150
$200
$250
$300
Jun‐04 Jun‐05 Jun‐06 Jun‐07 Jun‐08 Jun‐09 Jun‐10 Jun‐11 Jun‐12 Jun‐13 Jun‐14
MP Benchmark ACWI IMI Net/ AGG 60/40

73
STANFORD MP TEN‐YEAR BUSINESS UNIT RETURNS VS. BENCHMARK
The endowment provides valuable resources to support the University’s mission through funding financial
aid, faculty research, and innovative programs. Over the past ten years, the MP has grown from $10 billion
to $25 billion through strong investment returns and the generous support of alumni and friends. SMC is
committed to building on past success to further improve our investment performance and enhance the
University’s mission of educating current students and future generations.
Finally, I have announced that I will leave my post in 2015. It has been a privilege and an honor to support
this great university with its missions of teaching, research and service. I have decided that it is time to take
my enthusiasm for business‐building and find a new challenge, but I am mindful of the responsibility that
comes with service to Stanford. Thus I want to provide ample time for a search to be conducted for a
successor to lead the SMC team, of which I am very proud. I plan to remain CEO until my replacement can
be appointed.
JOHN F. POWERS President and Chief Executive Officer Stanford Management Company
Stanford MP Ten‐Year Business Unit Returns vs. Benchmark
8.9%
16.9%
8.2%
20.3%
5.9%7.8%8.3%
12.7%
7.3%
18.6%
10.0%
5.2%
Public Equity Private Equity Absolute Return Natural Resources Real Estate Fixed Income
MP Benchmark