motilal oswal india conference - ashok leyland 7 al/cfo/6/8/07 global investments ashok leyland...
TRANSCRIPT

3rd Annual Bear Stearns and Motilal Oswal INDIA Conference
K SridharanChief Financial Officer
August 2007

2
2
AL/CFO/6/8/07
Presentation outline
Hinduja Group profile
Economy / Commercial Vehicle Industry (CV)
Performance
Products
Plans and Priorities
12345

3
3
AL/CFO/6/8/07
Hinduja Group Profile1

4
4
AL/CFO/6/8/07
The Hinduja Group

5
5
AL/CFO/6/8/07
The Hinduja Group Profile
The Group was established in 1914 in Mumbai
Entered Middle East in 1919 to grow trading initiatives
Presence in more than 25 countries and operates across the globe
Entered India for significant business activities in 1987
Employs over 30,000 personnel worldwide

6
6
AL/CFO/6/8/07
Global InvestmentsMedia &
Entertainment
IT/ITES
AutomotiveBanking & Finance
Real Estate
Energy & Chemicals

7
7
AL/CFO/6/8/07
Global Investments
Ashok LeylandSecond Largest Commercial Vehicle manufacturer in India with turnover > USD 2 Bn.Operating in CV Truck & Bus segmentsEmploying over 12,000 peopleISO / TS 16949 certificate – representing International quality standards specific to Auto industryExports to over 30 countries in Asia, the Middle East, AfricaListed on Mumbai and National Stock Exchange and in London Stock ExchangeUnbroken profit and dividend track record
Automotive

8
8
AL/CFO/6/8/07
Economy / CV Industry2

9
9
AL/CFO/6/8/07
Commercial Vehicle (CV) Industry
FY07 growth propelled by
Buoyant Economy
Freight generating sectors register robust growth
Continued focus on Infrastructure development .
Enforcement of rated payload regime.
Growth rates for CV Industry remained healthy at over 33%
IIP : 11.5%Agriculture: 0.9%
Exports: 20.8%CMIE July’07

10
10
AL/CFO/6/8/07
M&HCV TIV: Bus and Truck
Sixth year of consecutive growth
Bus
Truck
Source: SIAM
2869216814 19970 24591 25638 28127
246857
7318595741
136804172868 179345
'01-02 '02-03 '03-04 '04-05 '05-06 '06-07
89 999
115 711
161 395
198 506207 472
275 549
CAGR 25%

11
11
AL/CFO/6/8/07
Market Segment and growth
Growing segments: > 16.2 T GVW and < 3.5 T GVW
AL has significant presence in > 16T vehicles

12
12
AL/CFO/6/8/07
Freight Rates movement

13
13
AL/CFO/6/8/07
Increase in Truck operator profitability post SC ban

14
14
AL/CFO/6/8/07
Future growth drivers
Continued Economic Growth
Impetus to Development by States through
SEZ
Industries in rural areas
All above areas not connected by railways
Logistics management by organised sector for JIT
Development of vehicles suited for long haul , hitherto dominated by railways
Increase in Railway coverage to benefit Road sector
FY08 EstimatesIIP : 9.1%
Agriculture:2.6%Exports: 28.0%
CMIE July’07

15
15
AL/CFO/6/8/07
Future growth drivers contd..
NHAI projects – extension to rural areas
Implementation of ban on overloading by all States
Ban on trucks which are > 15 year old –Phased introduction by all States
If ban on overloading extended to bus segment, minimum growth potential around 30 to 40%
Government support to infrastructure financing would maintain growth momentum
16
16
AL/CFO/6/8/07
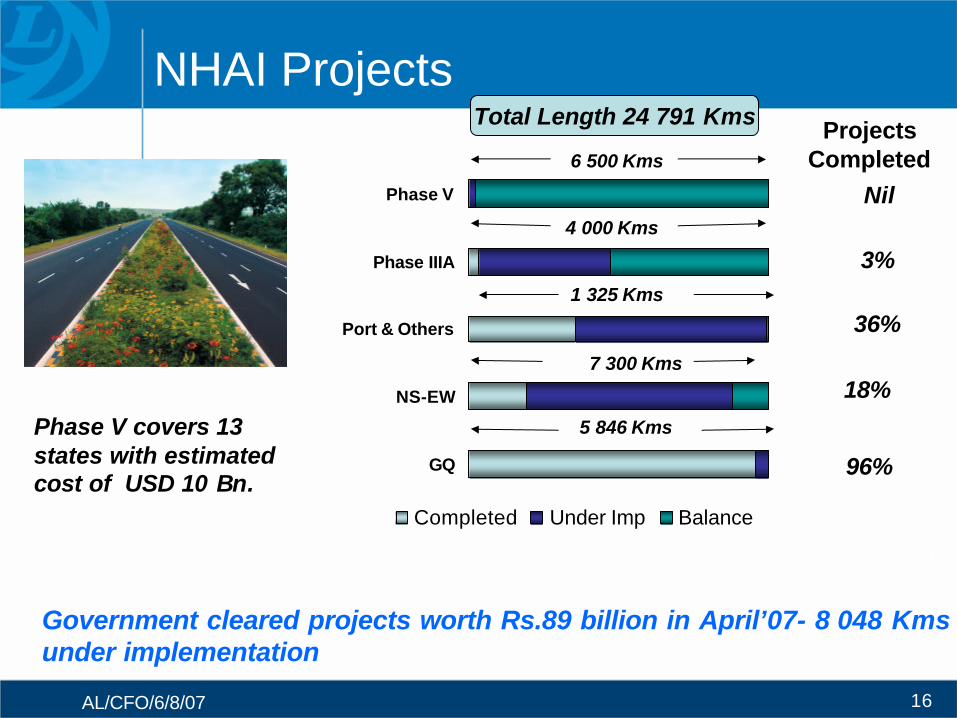
NHAI Projects
Government cleared projects worth Rs.89 billion in April’07- 8 048 Kmsunder implementation
GQ
NS-EW
Port & Others
Phase IIIA
Phase V
Completed Under Imp Balance
6 500 Kms
4 000 Kms
1 325 Kms
7 300 Kms
5 846 KmsPhase V covers 13 states with estimated cost of USD 10 Bn.
Total Length 24 791 Kms Projects Completed
3%
36%
18%
96%
Nil

17
17
AL/CFO/6/8/07
Current scenarioUncertainty in interest rates – Operators deferring purchasesContinued availability of freightRepayment track record of operators – no concern for NBFCsSecond hand vehicle market being strong. Prices are remunerativeSentiments likely to change for better beyond Oct’07Competition from other new entrants: MAN, Navistar, DCX, AMWMarket likely to be dominated by domestic players –Product offerings and price war likely to intensify

18
18
AL/CFO/6/8/07
CV Growth projection
Growth rate projections by leading research / rating agencies
CRISIL : CAGR at 6-8% (FY08-FY12)Fitch : 8 to 10 % in FY08HSBC : 6 %Motilal Oswal: > 8% in FY08UBS : Likely to increase from H2
TIV growth to be around 5% to 6% in FY08

19
19
AL/CFO/6/8/07
Performance3

20
20
AL/CFO/6/8/07
M & HCV: TIV and MS
Year Bus Truck TotalFY07TIV 28,692 246,857 275,549 AL 11,673 65,063 76,736 MS % 40.7% 26.4% 27.8%FY06TIV 28,127 179,345 207,472 AL 13,409 42,614 56,023 MS % 47.7% 23.8% 27.0%FY 05TIV 25,638 172,868 198,506 AL 10,469 37,137 47,606 MS % 40.8% 21.5% 24.0%
Source:SIAM

21
21
AL/CFO/6/8/07
Break-up of Sales
(30)5 4687 838Spares incl Defence(Rs million)
238 9047 261Engines
3583 09461 655Total vehicles
246 0254 879Exports
3677 06956 776Total
5365 06242 608Trucks
(15)12 00714 168 Buses
Domestic
% Inc (Dec)
FY07FY06

22
22
AL/CFO/6/8/07
Growth in other Business segments
Exports grew by 24% in FY 07 with a sale of 6,025 vehiclesEngines
Volumes grew 23%
Leyparts saw record sales at Rs. 3288 Mio, growing 26%Drop in overall Parts turnover due to deferral of supplies to ArmyFocus on Fully Built solutions: 10 % of sale volume
23
23
AL/CFO/6/8/07
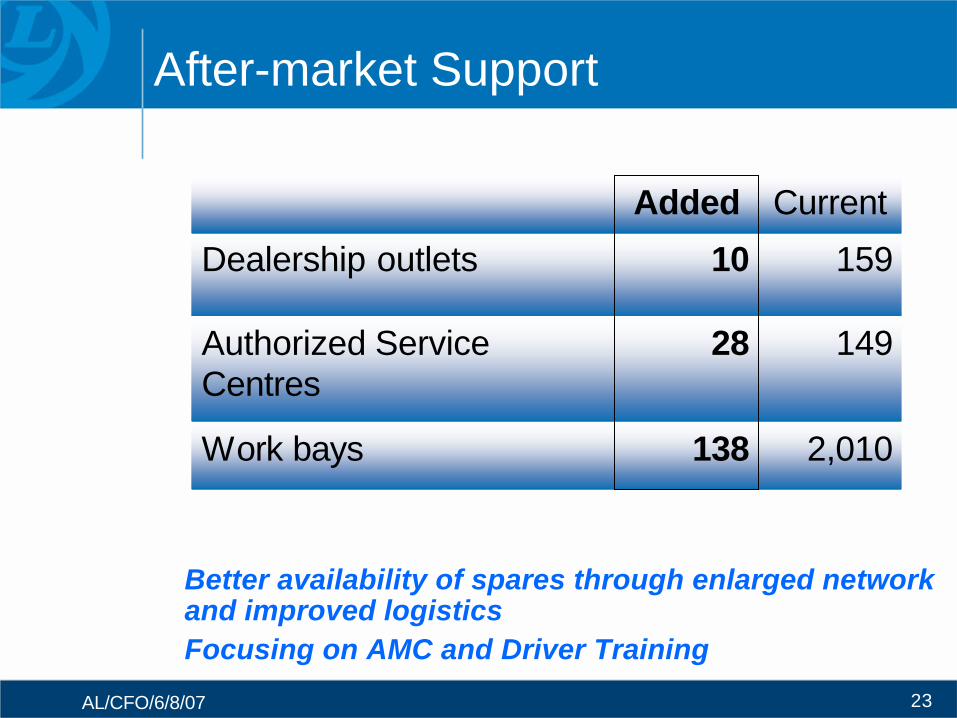
After-market Support
2,010138Work bays
15910Dealership outlets
14928Authorized Service Centres
CurrentAdded
Better availability of spares through enlarged network and improved logisticsFocusing on AMC and Driver Training

24
24
AL/CFO/6/8/07
Financial Performance in FY07Rs million
FY06 % FY07 % % GrowthNet Sales / Income from Operations 52,477 100.0 71,682 100.0 37 Expenditure
Raw Material consumption 37,690 71.8 53,391 74.5 42 Staff cost 4,039 7.7 4,807 6.7 19 Other expenditure 5,347 10.2 6,457 9.0 (163)
Gross Operating Margin 5,401 10.3 7,027 9.8 30 Depreciation 1,260 2.4 1,506 2.1 19 Net Profit after Tax 3,273 6.2 4,413 6.2 35 Basic Earnings Per Share (FV of Re1 per share)
2.74 3.38 24
Pressure on marginsImpact of Commodity prices , CMVR regulation, Emission standardsCost increase partially mitigated through:
Pricing action – April 06 : 2 %; Nov’06:1.5 % VAT benefit for last qtr (Rs.10,000 per veh)

25
25
AL/CFO/6/8/07
Performance Highlights – 5 Years
23.420.239.961.429.5EPS Growth %
2.74
0.2
18
5.3
21.2
FY06
1.63
0.5
21
5.2
17.6
FY04
2.28
0.3
14
5.7
18.6
FY05
3.38
0.3
17
5.5
24.7
FY07
1.01EPS (In Rs.)
0.8Debt : Equity
26Debtors (Days)
3.7Inventory Turns (Times)
11.7R O C E (%)
FY03
Control on Assets employedAll round improvements Y-O-Y

26
26
AL/CFO/6/8/07
Break-up of Sales in Q1FY08
461 4641 000Spares incl Defence (Rs million)
552 7041 740Engines
718 16317 040Total vehicles
151 4241 244Exports
616 73915 796Total
(15)12 22914 328Trucks
2074 5101 468Buses
Domestic
% Inc (Dec)
Q1FY08Q1FY07
Outperformed TIV growth: Volume improved by 6% against negative growth in TIV 3%

27
27
AL/CFO/6/8/07
Financials in Q1FY08
Rs million
Q1FY07 % Q1FY08 % %
Growth Net Sales / Income from operations 14,239 100.0 16,211 100.0 14 Expenditure
Raw Materials consumption 10,445 73.4 11,670 72.0 12 Staff cost 1,291 9.1 1,391 8.6 8 Other expenditure 1,316 9.2 1,408 8.7 7
Gross operating margin 1,187 8.3 1,743 10.8 47 Depreciation 328 2.3 413 2.5 26 Net profit after Tax 692 4.9 882 5.4 28 Basic earnings per share (Rs.) - not annualised
0.55 0.67 21
Margin improvement through better mix and volumes

28
28
AL/CFO/6/8/07
Products4

29
29
AL/CFO/6/8/07
DIESEL
FRONT ENGINE
REAR ENGINE
NORMAL FLOOR - 7m to 12m
SEMI LOW FLOOR
VESTIBULE BUS
DOUBLE DECKER
SINGLE STEP
NO STEP
CNG FRONT ENGINE
REAR ENGINE
NORMAL FLOOR
SINGLE STEP
NO STEP
Bus Matrix
Low Floor options available

30
30
AL/CFO/6/8/07
Trucks - Matrix
HAULAGE4 x 2
6 x 2, 6 x 4
8 x 2
TRACTORS4 x 2
6 x 4
TIPPERS4 x 2
6 x 4
8 x 4

31
31
AL/CFO/6/8/07
Engine development
AL is developing fuel efficient Euro IV compliant engine with support of AVL AustriaIndia may introduce Euro IV in 2010 in major 11 cities and extend to pan India few years thereafterAL offers Euro III compliant vehicles now even though it is mandatory only in 11 citiesCollaboration with Hino motors and ZF Germany in last two decades was successfulAL currently holds IPR for Euro II / III “H”seriesengines

32
32
AL/CFO/6/8/07
Plans and Priorities5

33
33
AL/CFO/6/8/07
Plans and Priorities
Product launches – Focus on Fully Built SolutionsEngine development – Euro IV emission standardsCapacity build upDe-risking – Focus on Engine / Defence / Export marketsCost Management initiatives through employee involvementSpreading Global footprint

34
34
AL/CFO/6/8/07
Capex / Capacity plans
50 000New plant in Uttarkhand (by Mar 2010)
50 000Expansion in existing plants by Dec’07
Capex outlay planned at Rs 40 Billion over 3 years including Product Development / Technology upgradation
1 84 000Total Capacity over next 3 years
84 000Capacity enhancement Plan over 3 years
Capacity on Board
Veh. P.a.

35
35
AL/CFO/6/8/07
Increasing Capacities
Uttarkhand
Integrated manufacturing plant for 50,000 vehicles per annum
Layouts made for lean manufacturing and automation
Production start up : phase 1 by 2nd half of FY09; Full capacity production by March FY10
Fiscal incentives will pay for cost of the project

36
36
AL/CFO/6/8/07
Defence, Exports, Engines and Spare Parts contributing 18% of revenue.Engines Business
Strategy in place to trade on enginesTrading engines to match the in-house volumes by FY 11Engine business to double to 5% of Sale Revenue
Defence – New vehicle applications to increase revenue share from Defence; Target to increase share of revenue above 10%Thrust markets identified in ASEAN, African countries using mix of European and Indian designWith availability of factory fitted cabins and vehicles with high power / weight ratio product offerings doubled to export market. Targeting to grow at 25% YoY. Volume to double in next 3 years and reach 15% of total sales
Non Cyclical business to grow
Share of non-cyclical revenue streams to reach 30%

37
37
AL/CFO/6/8/07
Cost Management Initiative Mission Gemba : A move focused on value addition in the shop floor through attitudinal alignment and process improvements resulted in through-put improvements across the company. Reflected in operating cost reduction by 100 bps
Employee productivity improvements reduce cost by 100 bps
Project YE : To bring about organizational transformation through empowering Young Executives
Improve : 1800 plus projects implemented by employee teams
Innovations: 7 Patents filed
Supply Chain Ownership Teams solved capacity constraint of suppliers and achieved 100% utilisation

38
38
AL/CFO/6/8/07
Spreading The Global FootprintAVIA in Czech Republic
Acquired AVIA TBU in FY07Vehicles are Euro IV compliant, sold in almost 17 countries in Europe; strong presence in Eastern European countries. Scope exists to improve margins through cost reduction and scale up operationsOrganisation rebuilding, alternate sourcing and value engineering programme for cost reduction on course Operations stabilised, currently at 2000 p.a. Efforts on Dealership development in existing markets being doubled
Ras Al Khaimah in UAE An integrated assembly plant with an investment of Rs. 380 Million to build 1000 buses p.a.Construction activities commenced.Operations to commence in Mar 2008

39
39
AL/CFO/6/8/07
D E F I A N C ED E F I A N C ETESTING & ENGINEERINGTESTING & ENGINEERING
Northwood Drive, Troy, USANorthwood Drive, Troy, USA
Spreading The Global Footprint contd..
40
40
AL/CFO/6/8/07
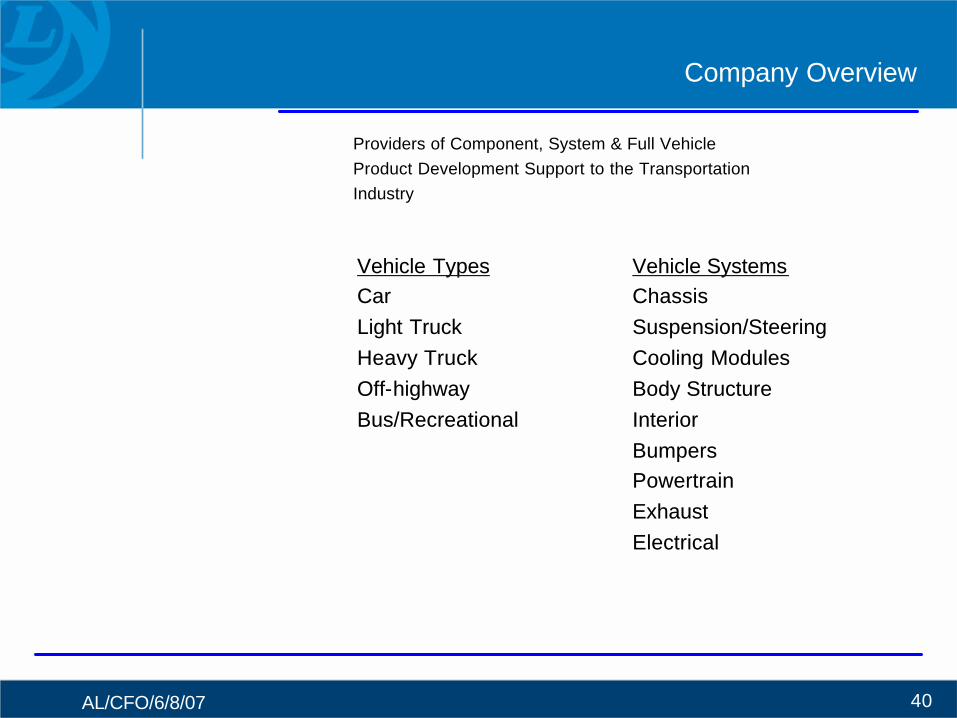
Company Overview
Providers of Component, System & Full Vehicle Product Development Support to the TransportationIndustry
Vehicle SystemsVehicle SystemsChassis Chassis Suspension/SteeringSuspension/SteeringCooling ModulesCooling ModulesBody StructureBody StructureInteriorInteriorBumpersBumpersPowertrainPowertrainExhaustExhaustElectricalElectrical
Vehicle TypesVehicle TypesCarCarLight TruckLight TruckHeavy TruckHeavy TruckOffOff--highwayhighwayBus/RecreationalBus/Recreational

41
41
AL/CFO/6/8/07
DiversificationJV with Alteams
A 50:50 JV with the Alteams Group, Finland to produce High Pressure Die Casting (HPDC) aluminum components pre-dominantly for telecommunications & automotive sectors
Target turnover of Rs. 6.5 billion in about 5 years, with total investment of Rs.3.35 billion
JV with Siemens VDOA 50:50 JV with Siemens VDO to design, develop and adapt infotronicproducts and services for the transportation sector
Through acquisitions / diversifications AL targets to:
Access new markets with new product designs manufactured cost effectively to add value to customers
Address with physical and intelligent part of future vehicles to remain at edge of technology innovations / offerings

42
42
AL/CFO/6/8/07
Value-added services for share-holders
Annual share-holders satisfaction surveyConducted for 6 years consecutively Responses are summarised and reviewed by the Share-holder/Investor Grievance Committee of the Board
Investor GuideSent to every share-holder every year since 1998
Annual ReportsDisclosures beyond mandatory requirements –contains useful information about Industry / Company

43
43
AL/CFO/6/8/07
Corporate Social ResponsibilityDisaster Management TrainingAlcohol De-addiction Centre at NamakkalComputer training to economically marginalized students in HosurSelf-Help Groups in HosurRoad Safety Road shows on Chennai Highway (GST Road)FunBus for physically challenged persons

44
44
AL/CFO/6/8/07
The Share-holding Pattern
FIIs18%
Resident Individuals / Trust / Clearing members
12%
FIs, Ins.Co, Banks,MFs
19%
LRLIH51%
45
45
AL/CFO/6/8/07
Thank you