motivation insights - tti success insights · pdf filemotivation insights june 2015...
TRANSCRIPT
! June 27, 2015
Motivation Insights
June 2015 Reliability Study
TTI Success Insights’ June 2015 Motivation Insights assessment reliability study was conducted
for the following languages:
Brazilian-Portuguese, Dutch, English-Australian, English-Canada, English UK, English US, French, German, Spanish-Americas, and Russian
The respondent data comes from TTISI’s Internet Delivery Service (IDS), which is mostly
comprised of a general business population for each of the languages. A random selection of
males and females were collected from October 2014 to June 2015. To ensure the highest
accuracy for each language, the IDS system allows selection of respondents with IP addresses
from the native country for that language. Scale reliabilities were calculated using Cronbach’s
Alpha. Cronbach Alpha is considered one of the most appropriate statistical tests for reliability
given the ranking of responses used to construct the scales. The scales are labeled as Theoretical,
Utilitarian, Aesthetic, Social, Individual and Traditional. Based on these findings of this study, one
may conclude that the Motivation Insights assessment is confirmed as a consistent and reliable
measure of the scale constructs.
Submitted by
! Delwyn L. Harnisch, Ph.D. College of Education and Human Sciences Director of Assessment, Leadership and Learning Community 125 Home Economics, Lincoln, NE 68588 USA TEL: (402) 472 – 9413 EMAIL: [email protected]
Motivation Insights
June 2015 Reliability Study
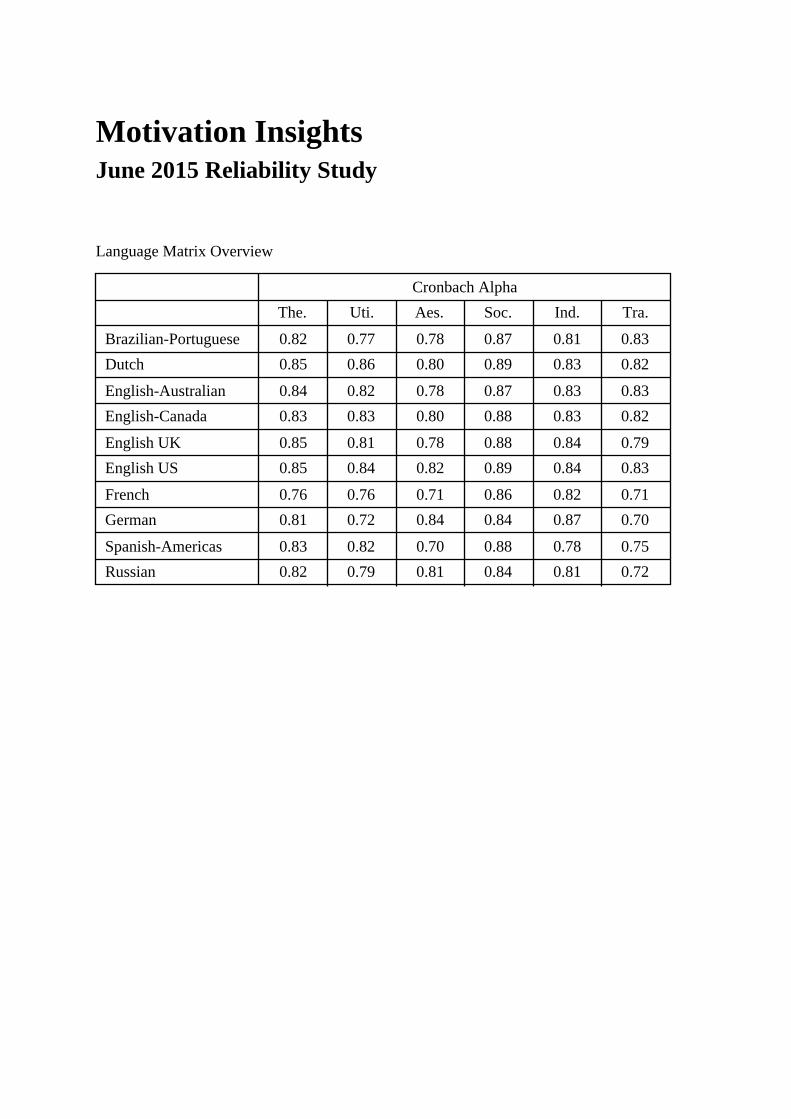
Language Matrix Overview
Cronbach Alpha
The. Uti. Aes. Soc. Ind. Tra.
Brazilian-Portuguese 0.82 0.77 0.78 0.87 0.81 0.83
Dutch 0.85 0.86 0.80 0.89 0.83 0.82
English-Australian 0.84 0.82 0.78 0.87 0.83 0.83
English-Canada 0.83 0.83 0.80 0.88 0.83 0.82
English UK 0.85 0.81 0.78 0.88 0.84 0.79
English US 0.85 0.84 0.82 0.89 0.84 0.83
French 0.76 0.76 0.71 0.86 0.82 0.71
German 0.81 0.72 0.84 0.84 0.87 0.70
Spanish-Americas 0.83 0.82 0.70 0.88 0.78 0.75
Russian 0.82 0.79 0.81 0.84 0.81 0.72

Motivation Insights - Reliability Summary
For Brazilian-Portuguese Participants (4/2015) - (6/2015); n = 920; nm = 460; nf = 460
Measures of reliability were computed for all six scales from TTI Motivation Insights survey.Cronbach’s alpha was used as a measure of the internal consistency of the scales and is based onthe average correlation among the items on a scale. Reliability tends to increase with longer scalesand heterogeneous (mixed) groups. Cronbach’s alpha is expressed as a correlation coefficient,
ranging in value from 0 to +1. An estimate of 0.70 or higher is desired for judging a scale to bereliable. This study analyzed the reliability of the scale scores measured in the TTI MotivationInsights questionnaire. Cronbach’s coefficient alpha was calculated for examining internalconsistency of each scale for the total sample and by gender groups.
Table 1. Cronbach Alpha for Motivation Insights’ Scales for Total Sample and by Gender Groups
Cronbach Alpha
Scale Total Males Females
Theoretical
Utilitarian
Aesthetic
Social
Individualistic
Traditional
0.82
0.77
0.78
0.87
0.81
0.83
0.83
0.78
0.77
0.86
0.77
0.83
0.82
0.76
0.78
0.87
0.83
0.83
Table 2. Correlations among Motivation Insights’ Scales for Total Sample
Scale Correlations
Scale Theoretical Utilitarian Aesthetic Social Individualistic Traditional
Theoretical
Utilitarian
Aesthetic
Social
Individualistic
Traditional
1.000
-0.212
-0.111
-0.115
-0.204
-0.282
1.000
-0.246
-0.520
0.325
-0.262
1.000
0.089
-0.483
-0.210
1.000
-0.405
-0.136
1.000
-0.217 1.000
Table 3. Descriptive Statistics on Motivation Insights’ Scales for Total Sample and by Gender Groups
Total Males FemalesTotal Males FemalesTotal Males Females
Scale Mean STD StErr Mean STD StErr Mean STD StErr
Theoretical 53.86 9.01 0.30 53.23 9.06 0.42 54.50 8.93 0.42
Utilitarian 45.84 9.06 0.30 46.99 8.98 0.42 44.69 9.01 0.42
Aesthetic 33.21 9.17 0.30 32.02 8.86 0.41 34.40 9.34 0.44
Social 34.90 10.28 0.34 33.58 9.96 0.46 36.23 10.43 0.49
Individualistic 48.69 9.73 0.32 50.47 8.69 0.41 46.91 10.37 0.48
Traditional 35.49 10.35 0.34 35.71 10.47 0.49 35.28 10.24 0.48

Motivation Insights - Reliability Summary
For Dutch Participants (11/2014) - (6/2015); n = 604; nm = 302; nf = 302
Measures of reliability were computed for all six scales from TTI Motivation Insights survey.Cronbach’s alpha was used as a measure of the internal consistency of the scales and is based onthe average correlation among the items on a scale. Reliability tends to increase with longer scalesand heterogeneous (mixed) groups. Cronbach’s alpha is expressed as a correlation coefficient,
ranging in value from 0 to +1. An estimate of 0.70 or higher is desired for judging a scale to bereliable. This study analyzed the reliability of the scale scores measured in the TTI MotivationInsights questionnaire. Cronbach’s coefficient alpha was calculated for examining internalconsistency of each scale for the total sample and by gender groups.
Table 1. Cronbach Alpha for Motivation Insights’ Scales for Total Sample and by Gender Groups
Cronbach Alpha
Scale Total Males Females
Theoretical
Utilitarian
Aesthetic
Social
Individualistic
Traditional
0.85
0.86
0.80
0.89
0.83
0.82
0.86
0.87
0.80
0.88
0.84
0.81
0.86
0.85
0.77
0.88
0.81
0.83
Table 2. Correlations among Motivation Insights’ Scales for Total Sample
Scale Correlations
Scale Theoretical Utilitarian Aesthetic Social Individualistic Traditional
Theoretical
Utilitarian
Aesthetic
Social
Individualistic
Traditional
1.000
-0.135
-0.125
-0.323
-0.101
-0.274
1.000
-0.423
-0.524
0.397
-0.370
1.000
0.206
-0.499
-0.077
1.000
-0.465
0.071
1.000
-0.350 1.000
Table 3. Descriptive Statistics on Motivation Insights’ Scales for Total Sample and by Gender Groups
Total Males FemalesTotal Males FemalesTotal Males Females
Scale Mean STD StErr Mean STD StErr Mean STD StErr
Theoretical 45.40 10.86 0.44 45.87 10.88 0.63 44.92 10.84 0.62
Utilitarian 39.35 11.80 0.48 41.24 12.23 0.70 37.46 11.05 0.64
Aesthetic 45.11 10.22 0.42 42.72 10.26 0.59 47.51 9.62 0.55
Social 40.39 11.90 0.48 37.45 11.72 0.67 43.33 11.35 0.65
Individualistic 45.58 10.95 0.45 47.39 11.22 0.65 43.77 10.38 0.60
Traditional 36.17 11.11 0.45 37.33 10.88 0.63 35.01 11.25 0.65

Motivation Insights - Reliability Summary
For English-Australian Participants (2/2015) - (6/2015); n = 606; nm = 303; nf = 303
Measures of reliability were computed for all six scales from TTI Motivation Insights survey.Cronbach’s alpha was used as a measure of the internal consistency of the scales and is based onthe average correlation among the items on a scale. Reliability tends to increase with longer scalesand heterogeneous (mixed) groups. Cronbach’s alpha is expressed as a correlation coefficient,
ranging in value from 0 to +1. An estimate of 0.70 or higher is desired for judging a scale to bereliable. This study analyzed the reliability of the scale scores measured in the TTI MotivationInsights questionnaire. Cronbach’s coefficient alpha was calculated for examining internalconsistency of each scale for the total sample and by gender groups.
Table 1. Cronbach Alpha for Motivation Insights’ Scales for Total Sample and by Gender Groups
Cronbach Alpha
Scale Total Males Females
Theoretical
Utilitarian
Aesthetic
Social
Individualistic
Traditional
0.84
0.82
0.78
0.87
0.83
0.83
0.82
0.83
0.73
0.87
0.81
0.83
0.86
0.81
0.80
0.87
0.84
0.83
Table 2. Correlations among Motivation Insights’ Scales for Total Sample
Scale Correlations
Scale Theoretical Utilitarian Aesthetic Social Individualistic Traditional
Theoretical
Utilitarian
Aesthetic
Social
Individualistic
Traditional
1.000
-0.185
-0.183
-0.127
-0.131
-0.318
1.000
-0.349
-0.565
0.383
-0.304
1.000
0.162
-0.515
-0.053
1.000
-0.468
-0.029
1.000
-0.315 1.000
Table 3. Descriptive Statistics on Motivation Insights’ Scales for Total Sample and by Gender Groups
Total Males FemalesTotal Males FemalesTotal Males Females
Scale Mean STD StErr Mean STD StErr Mean STD StErr
Theoretical 48.30 10.56 0.43 48.59 10.05 0.58 48.01 11.05 0.63
Utilitarian 43.55 11.25 0.46 46.23 11.08 0.64 40.87 10.79 0.62
Aesthetic 40.25 10.46 0.42 37.71 9.40 0.54 42.79 10.85 0.62
Social 34.36 11.70 0.48 31.84 11.04 0.63 36.87 11.82 0.68
Individualistic 48.30 11.47 0.47 50.52 10.42 0.60 46.08 12.04 0.69
Traditional 37.25 11.27 0.46 37.11 11.23 0.65 37.39 11.33 0.65

Motivation Insights - Reliability Summary
For English-Canada Participants (2/2015) - (6/2015); n = 1,778; nm = 889; nf = 889
Measures of reliability were computed for all six scales from TTI Motivation Insights survey.Cronbach’s alpha was used as a measure of the internal consistency of the scales and is based onthe average correlation among the items on a scale. Reliability tends to increase with longer scalesand heterogeneous (mixed) groups. Cronbach’s alpha is expressed as a correlation coefficient,
ranging in value from 0 to +1. An estimate of 0.70 or higher is desired for judging a scale to bereliable. This study analyzed the reliability of the scale scores measured in the TTI MotivationInsights questionnaire. Cronbach’s coefficient alpha was calculated for examining internalconsistency of each scale for the total sample and by gender groups.
Table 1. Cronbach Alpha for Motivation Insights’ Scales for Total Sample and by Gender Groups
Cronbach Alpha
Scale Total Males Females
Theoretical
Utilitarian
Aesthetic
Social
Individualistic
Traditional
0.83
0.83
0.80
0.88
0.83
0.82
0.85
0.84
0.77
0.87
0.79
0.81
0.83
0.79
0.81
0.87
0.84
0.82
Table 2. Correlations among Motivation Insights’ Scales for Total Sample
Scale Correlations
Scale Theoretical Utilitarian Aesthetic Social Individualistic Traditional
Theoretical
Utilitarian
Aesthetic
Social
Individualistic
Traditional
1.000
-0.141
-0.188
-0.138
-0.148
-0.298
1.000
-0.418
-0.585
0.414
-0.272
1.000
0.196
-0.522
-0.052
1.000
-0.460
-0.082
1.000
-0.302 1.000
Table 3. Descriptive Statistics on Motivation Insights’ Scales for Total Sample and by Gender Groups
Total Males FemalesTotal Males FemalesTotal Males Females
Scale Mean STD StErr Mean STD StErr Mean STD StErr
Theoretical 49.07 10.36 0.25 49.17 10.34 0.35 48.97 10.38 0.35
Utilitarian 42.51 11.40 0.27 45.67 11.43 0.38 39.35 10.46 0.35
Aesthetic 39.52 10.90 0.26 36.85 10.02 0.34 42.19 11.09 0.37
Social 36.60 12.15 0.29 33.13 11.39 0.38 40.07 11.90 0.40
Individualistic 47.12 11.47 0.27 50.77 9.85 0.33 43.48 11.82 0.40
Traditional 37.18 11.21 0.27 36.42 10.96 0.37 37.94 11.40 0.38

Motivation Insights - Reliability Summary
For English UK Participants (1/2015) - (6/2015); n = 644; nm = 322; nf = 322
Measures of reliability were computed for all six scales from TTI Motivation Insights survey.Cronbach’s alpha was used as a measure of the internal consistency of the scales and is based onthe average correlation among the items on a scale. Reliability tends to increase with longer scalesand heterogeneous (mixed) groups. Cronbach’s alpha is expressed as a correlation coefficient,
ranging in value from 0 to +1. An estimate of 0.70 or higher is desired for judging a scale to bereliable. This study analyzed the reliability of the scale scores measured in the TTI MotivationInsights questionnaire. Cronbach’s coefficient alpha was calculated for examining internalconsistency of each scale for the total sample and by gender groups.
Table 1. Cronbach Alpha for Motivation Insights’ Scales for Total Sample and by Gender Groups
Cronbach Alpha
Scale Total Males Females
Theoretical
Utilitarian
Aesthetic
Social
Individualistic
Traditional
0.85
0.81
0.78
0.88
0.84
0.79
0.86
0.82
0.75
0.86
0.82
0.78
0.84
0.79
0.78
0.88
0.84
0.80
Table 2. Correlations among Motivation Insights’ Scales for Total Sample
Scale Correlations
Scale Theoretical Utilitarian Aesthetic Social Individualistic Traditional
Theoretical
Utilitarian
Aesthetic
Social
Individualistic
Traditional
1.000
-0.168
-0.199
-0.132
-0.148
-0.358
1.000
-0.382
-0.566
0.388
-0.243
1.000
0.216
-0.535
-0.051
1.000
-0.515
-0.088
1.000
-0.211 1.000
Table 3. Descriptive Statistics on Motivation Insights’ Scales for Total Sample and by Gender Groups
Total Males FemalesTotal Males FemalesTotal Males Females
Scale Mean STD StErr Mean STD StErr Mean STD StErr
Theoretical 46.97 10.83 0.43 46.67 11.05 0.62 47.27 10.62 0.59
Utilitarian 44.89 10.68 0.42 47.38 10.48 0.58 42.39 10.31 0.57
Aesthetic 40.26 10.23 0.40 38.10 9.47 0.53 42.42 10.52 0.59
Social 33.48 12.02 0.47 30.66 10.69 0.60 36.30 12.62 0.70
Individualistic 50.27 11.32 0.45 52.81 10.49 0.58 47.72 11.56 0.64
Traditional 36.13 10.45 0.41 36.37 9.97 0.56 35.89 10.92 0.61

Motivation Insights - Reliability Summary
For English US Participants (2/2015) - (6/2015); n = 25,104; nm = 12,552; nf = 12,552
Measures of reliability were computed for all six scales from TTI Motivation Insights survey.Cronbach’s alpha was used as a measure of the internal consistency of the scales and is based onthe average correlation among the items on a scale. Reliability tends to increase with longer scalesand heterogeneous (mixed) groups. Cronbach’s alpha is expressed as a correlation coefficient,
ranging in value from 0 to +1. An estimate of 0.70 or higher is desired for judging a scale to bereliable. This study analyzed the reliability of the scale scores measured in the TTI MotivationInsights questionnaire. Cronbach’s coefficient alpha was calculated for examining internalconsistency of each scale for the total sample and by gender groups.
Table 1. Cronbach Alpha for Motivation Insights’ Scales for Total Sample and by Gender Groups
Cronbach Alpha
Scale Total Males Females
Theoretical
Utilitarian
Aesthetic
Social
Individualistic
Traditional
0.85
0.84
0.82
0.89
0.84
0.83
0.86
0.84
0.80
0.88
0.81
0.82
0.85
0.82
0.82
0.89
0.85
0.83
Table 2. Correlations among Motivation Insights’ Scales for Total Sample
Scale Correlations
Scale Theoretical Utilitarian Aesthetic Social Individualistic Traditional
Theoretical
Utilitarian
Aesthetic
Social
Individualistic
Traditional
1.000
-0.137
-0.162
-0.188
-0.135
-0.314
1.000
-0.412
-0.555
0.386
-0.257
1.000
0.178
-0.531
-0.068
1.000
-0.438
-0.086
1.000
-0.276 1.000
Table 3. Descriptive Statistics on Motivation Insights’ Scales for Total Sample and by Gender Groups
Total Males FemalesTotal Males FemalesTotal Males Females
Scale Mean STD StErr Mean STD StErr Mean STD StErr
Theoretical 47.64 10.99 0.07 47.86 10.96 0.10 47.42 11.01 0.10
Utilitarian 43.30 11.60 0.07 45.92 11.41 0.10 40.67 11.20 0.10
Aesthetic 37.66 11.33 0.07 35.26 10.52 0.09 40.05 11.59 0.10
Social 37.20 12.62 0.08 34.29 11.76 0.10 40.12 12.77 0.11
Individualistic 47.09 11.74 0.07 49.73 10.69 0.10 44.46 12.14 0.11
Traditional 39.11 11.53 0.07 38.94 11.18 0.10 39.28 11.86 0.11

Motivation Insights - Reliability Summary
For French Participants (4/2015) - (6/2015); n = 572; nm = 286; nf = 286
Measures of reliability were computed for all six scales from TTI Motivation Insights survey.Cronbach’s alpha was used as a measure of the internal consistency of the scales and is based onthe average correlation among the items on a scale. Reliability tends to increase with longer scalesand heterogeneous (mixed) groups. Cronbach’s alpha is expressed as a correlation coefficient,
ranging in value from 0 to +1. An estimate of 0.70 or higher is desired for judging a scale to bereliable. This study analyzed the reliability of the scale scores measured in the TTI MotivationInsights questionnaire. Cronbach’s coefficient alpha was calculated for examining internalconsistency of each scale for the total sample and by gender groups.
Table 1. Cronbach Alpha for Motivation Insights’ Scales for Total Sample and by Gender Groups
Cronbach Alpha
Scale Total Males Females
Theoretical
Utilitarian
Aesthetic
Social
Individualistic
Traditional
0.76
0.76
0.71
0.86
0.82
0.71
0.78
0.77
0.65
0.85
0.80
0.68
0.75
0.73
0.74
0.87
0.83
0.73
Table 2. Correlations among Motivation Insights’ Scales for Total Sample
Scale Correlations
Scale Theoretical Utilitarian Aesthetic Social Individualistic Traditional
Theoretical
Utilitarian
Aesthetic
Social
Individualistic
Traditional
1.000
-0.144
-0.074
-0.155
-0.226
-0.293
1.000
-0.400
-0.537
0.413
-0.350
1.000
0.090
-0.553
0.050
1.000
-0.480
-0.045
1.000
-0.268 1.000
Table 3. Descriptive Statistics on Motivation Insights’ Scales for Total Sample and by Gender Groups
Total Males FemalesTotal Males FemalesTotal Males Females
Scale Mean STD StErr Mean STD StErr Mean STD StErr
Theoretical 50.33 8.81 0.37 50.26 9.13 0.54 50.41 8.49 0.50
Utilitarian 45.72 9.54 0.40 47.59 9.64 0.57 43.85 9.08 0.54
Aesthetic 44.43 8.96 0.37 43.03 8.28 0.49 45.82 9.39 0.56
Social 34.61 11.25 0.47 32.84 10.57 0.63 36.37 11.64 0.69
Individualistic 42.27 10.77 0.45 44.49 10.02 0.59 40.05 11.05 0.65
Traditional 34.64 8.86 0.37 33.78 8.39 0.50 35.50 9.24 0.55
Motivation Insights - Reliability Summary
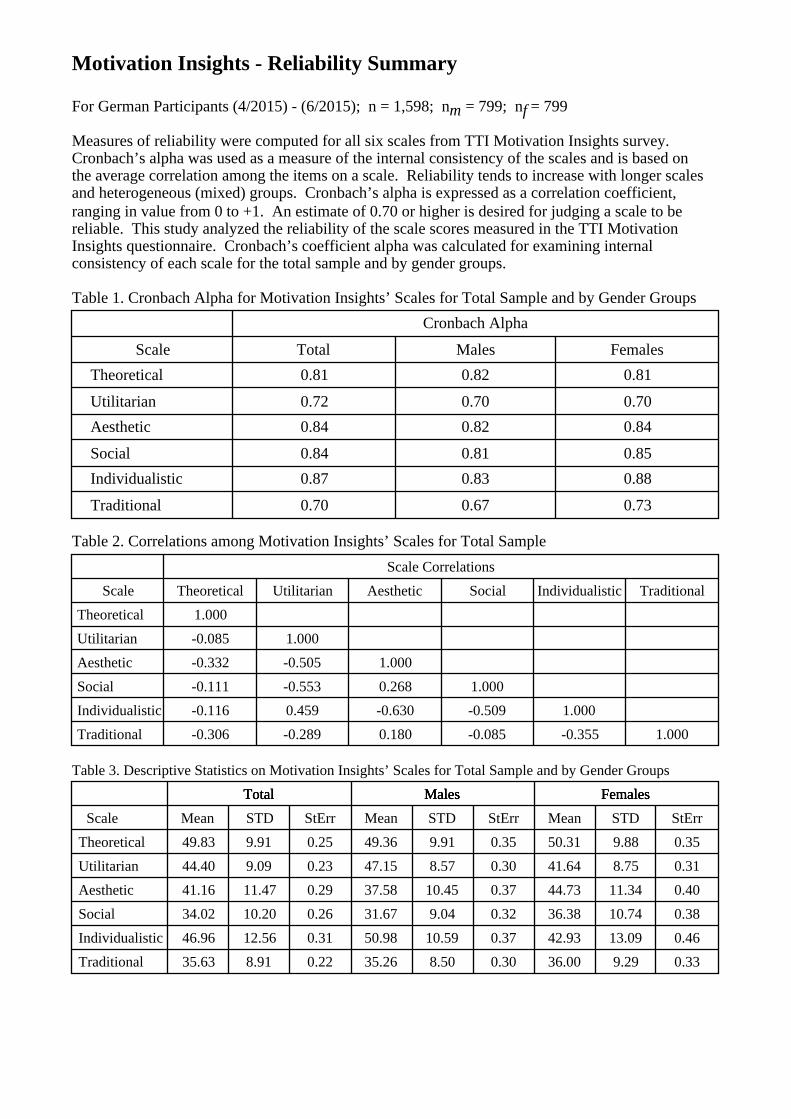
For German Participants (4/2015) - (6/2015); n = 1,598; nm = 799; nf = 799
Measures of reliability were computed for all six scales from TTI Motivation Insights survey.Cronbach’s alpha was used as a measure of the internal consistency of the scales and is based onthe average correlation among the items on a scale. Reliability tends to increase with longer scalesand heterogeneous (mixed) groups. Cronbach’s alpha is expressed as a correlation coefficient,
ranging in value from 0 to +1. An estimate of 0.70 or higher is desired for judging a scale to bereliable. This study analyzed the reliability of the scale scores measured in the TTI MotivationInsights questionnaire. Cronbach’s coefficient alpha was calculated for examining internalconsistency of each scale for the total sample and by gender groups.
Table 1. Cronbach Alpha for Motivation Insights’ Scales for Total Sample and by Gender Groups
Cronbach Alpha
Scale Total Males Females
Theoretical
Utilitarian
Aesthetic
Social
Individualistic
Traditional
0.81
0.72
0.84
0.84
0.87
0.70
0.82
0.70
0.82
0.81
0.83
0.67
0.81
0.70
0.84
0.85
0.88
0.73
Table 2. Correlations among Motivation Insights’ Scales for Total Sample
Scale Correlations
Scale Theoretical Utilitarian Aesthetic Social Individualistic Traditional
Theoretical
Utilitarian
Aesthetic
Social
Individualistic
Traditional
1.000
-0.085
-0.332
-0.111
-0.116
-0.306
1.000
-0.505
-0.553
0.459
-0.289
1.000
0.268
-0.630
0.180
1.000
-0.509
-0.085
1.000
-0.355 1.000
Table 3. Descriptive Statistics on Motivation Insights’ Scales for Total Sample and by Gender Groups
Total Males FemalesTotal Males FemalesTotal Males Females
Scale Mean STD StErr Mean STD StErr Mean STD StErr
Theoretical 49.83 9.91 0.25 49.36 9.91 0.35 50.31 9.88 0.35
Utilitarian 44.40 9.09 0.23 47.15 8.57 0.30 41.64 8.75 0.31
Aesthetic 41.16 11.47 0.29 37.58 10.45 0.37 44.73 11.34 0.40
Social 34.02 10.20 0.26 31.67 9.04 0.32 36.38 10.74 0.38
Individualistic 46.96 12.56 0.31 50.98 10.59 0.37 42.93 13.09 0.46
Traditional 35.63 8.91 0.22 35.26 8.50 0.30 36.00 9.29 0.33

Motivation Insights - Reliability Summary
For Spanish-Americas Participants (3/2015) - (6/2015); n = 548; nm = 274; nf = 274
Measures of reliability were computed for all six scales from TTI Motivation Insights survey.Cronbach’s alpha was used as a measure of the internal consistency of the scales and is based onthe average correlation among the items on a scale. Reliability tends to increase with longer scalesand heterogeneous (mixed) groups. Cronbach’s alpha is expressed as a correlation coefficient,
ranging in value from 0 to +1. An estimate of 0.70 or higher is desired for judging a scale to bereliable. This study analyzed the reliability of the scale scores measured in the TTI MotivationInsights questionnaire. Cronbach’s coefficient alpha was calculated for examining internalconsistency of each scale for the total sample and by gender groups.
Table 1. Cronbach Alpha for Motivation Insights’ Scales for Total Sample and by Gender Groups
Cronbach Alpha
Scale Total Males Females
Theoretical
Utilitarian
Aesthetic
Social
Individualistic
Traditional
0.83
0.82
0.70
0.88
0.78
0.75
0.82
0.82
0.66
0.87
0.76
0.73
0.84
0.83
0.73
0.89
0.80
0.77
Table 2. Correlations among Motivation Insights’ Scales for Total Sample
Scale Correlations
Scale Theoretical Utilitarian Aesthetic Social Individualistic Traditional
Theoretical
Utilitarian
Aesthetic
Social
Individualistic
Traditional
1.000
-0.172
-0.188
-0.283
-0.182
-0.155
1.000
-0.327
-0.542
0.310
-0.344
1.000
0.148
-0.395
-0.094
1.000
-0.420
0.010
1.000
-0.341 1.000
Table 3. Descriptive Statistics on Motivation Insights’ Scales for Total Sample and by Gender Groups
Total Males FemalesTotal Males FemalesTotal Males Females
Scale Mean STD StErr Mean STD StErr Mean STD StErr
Theoretical 49.56 10.22 0.44 49.71 9.74 0.59 49.42 10.69 0.65
Utilitarian 43.86 11.18 0.48 44.95 11.02 0.67 42.77 11.24 0.68
Aesthetic 36.95 8.70 0.37 35.85 8.11 0.49 38.04 9.13 0.55
Social 36.60 11.79 0.50 35.41 11.37 0.69 37.80 12.10 0.73
Individualistic 49.50 10.05 0.43 51.10 9.43 0.57 47.91 10.41 0.63
Traditional 35.52 9.55 0.41 34.97 9.03 0.55 36.07 10.04 0.61
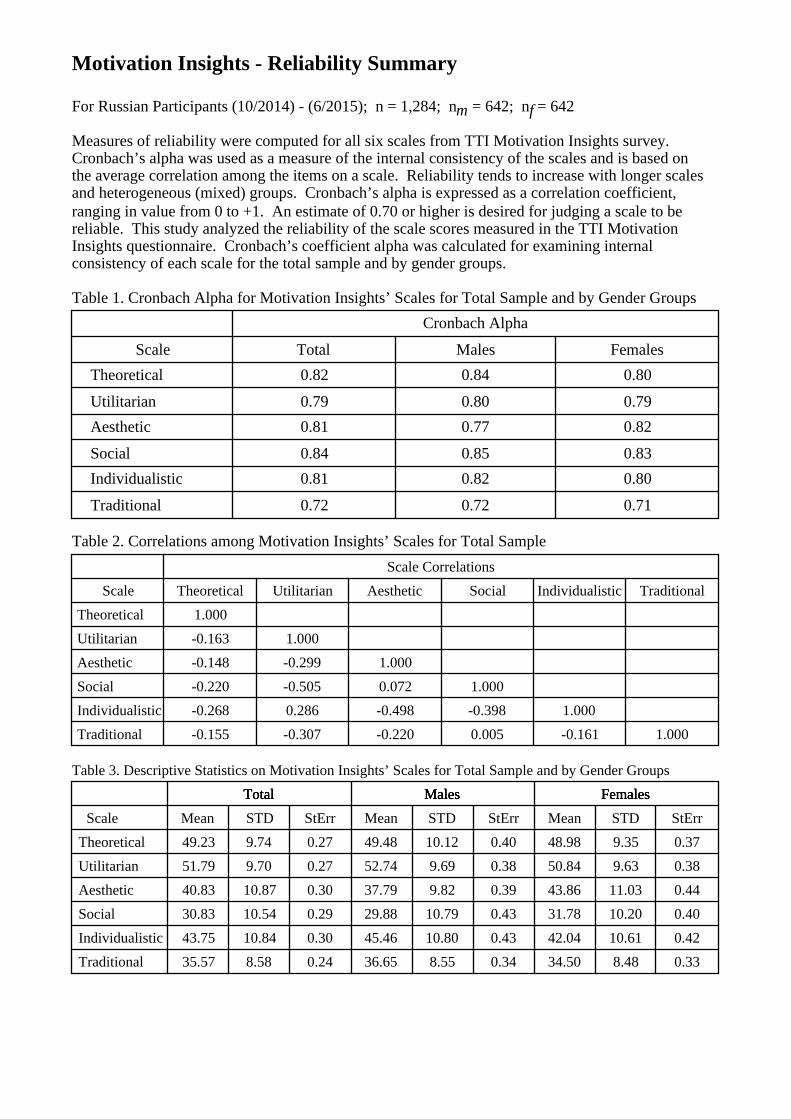
Motivation Insights - Reliability Summary
For Russian Participants (10/2014) - (6/2015); n = 1,284; nm = 642; nf = 642
Measures of reliability were computed for all six scales from TTI Motivation Insights survey.Cronbach’s alpha was used as a measure of the internal consistency of the scales and is based onthe average correlation among the items on a scale. Reliability tends to increase with longer scalesand heterogeneous (mixed) groups. Cronbach’s alpha is expressed as a correlation coefficient,
ranging in value from 0 to +1. An estimate of 0.70 or higher is desired for judging a scale to bereliable. This study analyzed the reliability of the scale scores measured in the TTI MotivationInsights questionnaire. Cronbach’s coefficient alpha was calculated for examining internalconsistency of each scale for the total sample and by gender groups.
Table 1. Cronbach Alpha for Motivation Insights’ Scales for Total Sample and by Gender Groups
Cronbach Alpha
Scale Total Males Females
Theoretical
Utilitarian
Aesthetic
Social
Individualistic
Traditional
0.82
0.79
0.81
0.84
0.81
0.72
0.84
0.80
0.77
0.85
0.82
0.72
0.80
0.79
0.82
0.83
0.80
0.71
Table 2. Correlations among Motivation Insights’ Scales for Total Sample
Scale Correlations
Scale Theoretical Utilitarian Aesthetic Social Individualistic Traditional
Theoretical
Utilitarian
Aesthetic
Social
Individualistic
Traditional
1.000
-0.163
-0.148
-0.220
-0.268
-0.155
1.000
-0.299
-0.505
0.286
-0.307
1.000
0.072
-0.498
-0.220
1.000
-0.398
0.005
1.000
-0.161 1.000
Table 3. Descriptive Statistics on Motivation Insights’ Scales for Total Sample and by Gender Groups
Total Males FemalesTotal Males FemalesTotal Males Females
Scale Mean STD StErr Mean STD StErr Mean STD StErr
Theoretical 49.23 9.74 0.27 49.48 10.12 0.40 48.98 9.35 0.37
Utilitarian 51.79 9.70 0.27 52.74 9.69 0.38 50.84 9.63 0.38
Aesthetic 40.83 10.87 0.30 37.79 9.82 0.39 43.86 11.03 0.44
Social 30.83 10.54 0.29 29.88 10.79 0.43 31.78 10.20 0.40
Individualistic 43.75 10.84 0.30 45.46 10.80 0.43 42.04 10.61 0.42
Traditional 35.57 8.58 0.24 36.65 8.55 0.34 34.50 8.48 0.33