motivation of public participation at citizens advisory board … · 2016-04-09 · cab). the srs...
TRANSCRIPT
WM2016 Conference, March 6 – 10, 2016, Phoenix, AZ, USA
1
Motivation of Public Participation at Citizens Advisory Board Meetings Public Participation at the Savannah River Site Citizen Advisory Board
Meetings-16343
Nina Spinelli, Citizen Advisory Board – SRS
ABSTRACT The objective of this paper is to interview public participants who attended both full-board and committee meetings for a pre-determined two-month period to understand their motivation in attending Savannah River Site Citizens Advisory Board (SRS CAB) meetings. In addition, the research aimed to learn what impact they believe their attendance had on Savannah River Site Citizens Advisory Board (SRS CAB) recommendations and discussion, as well as how their input is utilized by the Savannah River Site. Perhaps in learning these community members attend meetings, the CAB can capitalize on that knowledge to motivate additional public participation.
Research for this report includes a literature review of public participation and analysis of interviews and surveys conducted with members of the general public in October and November 2015.
INTRODUCTION
The Department of Energy utilizes various approaches to engage the community, including speaking at local organizations and clubs, hosting public hearings, providing free site tours, and offering the Citizens Advisory Board (CAB or SRS CAB).
The SRS CAB is the Savannah River Site (SRS) Citizens Advisory Board (CAB) is one of eight Environmental Management Site-Specific Advisory Boards (EMSSABs) funded by the U.S. Department of Energy (DOE), and located in Aiken, SC. These Boards provide advice and recommendations to DOE at its request on environmental remediation, waste management and related issues. Agency Liaisons from DOE, the U.S. Environmental Protection Agency-Region IV and the South Carolina Department of Health and Environmental Control participate at the table during Board meetings.
Meetings of the CAB are held bi-monthly in a combined committees’ session usually beginning at 1 p.m. on the fourth Monday of the month, with meetings of the full

WM2016 Conference, March 6 – 10, 2016, Phoenix, AZ, USA
2
board beginning at 8:30 a.m. on the following day. All general meetings are open to the public and direct public participation is encouraged during Monday meetings during the combined committee session. On Tuesdays, members of the public may provide comments during several Public Comment Periods offered at various times throughout the meeting.
Part of the CAB’s mission is to act as a conduit between the public and the Department of Energy. Understanding public motivation to attend SRS CAB meetings, the information they hope to share with the SRS CAB, and likewise, what they hope to gain from meeting attendance is crucial for a thriving site-specific advisory board.
Evaluating public participation faces a host of practical and theoretical challenges, including deciding the beginning and end point of the evaluation (Abelson & Gauvin, 2006). The second challenge is the practicality of understanding the policy influences of public participation in relation to participation spikes during particular events that are of interest to the local community. The final challenge is in relation to measurement criteria and interpretation. Some authors of public participation focus on the public policy process, while other’s focus on the individual’s participations, while still another group hones in on the outcome evaluation of both. Taking the time beforehand to determine the form of measurement is key to truly understand the outcome. With the push for greater transparency in understanding the decisions of policymakers, there is increased need in involving citizens in participation. In the last several decades, the growth of public participation has grown, with the advent of CSPAN, televised townhall meetings, and online access to scores of information.
This research is structured in three components: literature review of public participation, methodology, and a review of the survey findings. Evaluating public participation is critical to ensure accountability of resources, to include citizens’ time and effort (Weiss, 1998). Along with accountability, evaluation presents the chance to learn what is working and what changes can be made to improve the program. In addition, ethical and moral reasons exist for evaluating public participation (Abelson & Gauvin, 2006). Reviewing the evaluation of public participation helps establish whether the process of working to obtain viewpoints was fair, and if the views of citizen participants were fairly represented in future decision processes.

WM2016 Conference, March 6 – 10, 2016, Phoenix, AZ, USA
3
LITERATURE REVIEW
The last several decades have seen an upward rise in public participation concerning environmental input conducted by governmental agencies (Charnley & Engelbert, pg. 165). The rise in participation has been motivated by communities who desire a larger, and more direct role in molding future decisions that impact their health, environment, and life quality. Simultaneously government agencies acknowledge the benefits of incorporating individuals into the decision-making process (Charnley & Engelbert, pg. 165). Scores of research indicate that the community should take an active role in decision making, and the recent decades have put forward regulations and policies that incorporate public participation into the decision-making process for environmental issues. According to Beierle and Cayford, over the past 30 years, public participation has yielded decisions that were responsive to community interests and input, and worked to build trust and educate the public about the environment (Beirele & Cayford, 2002).
As the public grows more interested in environmental issues and their role in public participation, there remains a deficit in how their participation impacts public policy, how to further engage the public, and how to improve the policy. A report from the National Research Council in 1996, indicated the lack of knowledge about what works well in public participation. The lack of cohesive information is challenging for environmental managers and policy makers who wish to engage the public and need peer-reviewed evidence to back-up their desire to include the public. Charnley and Englebert make reference to a 1979 observation by Sewell and Phillps that “although government agencies have spent hundreds of thousands of dollars on participation programs, they have generally been unwilling to allocate any funds to the evaluation of the effectiveness of such ventures (Charnley and Englebert, pg. 166).”
For this research paper, the definition of public participation will be the definition provided by Rowe and Frewer (2004, pg. 512) in that “public participation may be defined at a general level as the practice of consulting and involving members of the public in the agenda-setting, decision-making, and policy-forming activities of organization or institutions responsible for policy development.” In some instances, citizens may participate by “being the passive recipients of information from the regulators or governing bodies concerned (Rowe & Frewer, 2004, pg. 514).” In other instances, like the Savannah River Site Citizen Advisory Board, the public’s input is sought out and utilized as direct input into the decision-making process. Various forms of public participation have surfaced over the years, including the traditional public meeting to public surveys, focus groups and advisory boards.
Engaging the public in participation is deemed as critical by much of the prevailing literature, however, evaluation is still evasive. Evaluating participation results may
WM2016 Conference, March 6 – 10, 2016, Phoenix, AZ, USA
4
be critical to secure funding, ensuring fair representation, and working to make sure that the public’s information is being utilized and implemented. Policy-makers, government officials, civic leaders and elected officers have long understood the importance of public participation in decision-making and crafting long-standing policy (Moynihan, Bryson & Quick, 2005).
Public participation has been researched, discussed and analyzed for decades and yet remains a “context-driven, social and political process (Tedford-Gold, Abelson and Charles, 2005).” One motive for evaluating public participation is to ensure accountability, in that the use of the citizen’s time in giving their input is being accurately portrayed and used in the proper context of decision-making. In addition, it is critical to understand how citizens feel during participation to get better a gauge of what is working and what is not. Success in public participation has varied meaning, and in scores of public participation results, much variability has been found based upon varying terms and definitions (Abelson & Gauvin, 2006). Rowe and Frewer provided a process evaluation criteria for public participation studies. Their criteria included: representativness, inclusivity, process fairness and flexibility, transparency, independence, fairness, and competences. These factors have been taken into account during the Savannah River Site Citizen Advisory Board public participation survey.
While much of the current literature and research is focused on what is working and what is not working in the field of public participation, this paper does not set out to provide an evaluation of what methods words best. Instead, this paper seeks to discuss the findings of evaluating a snapshot of citizen participation during the Savannah River Site Citizen Advisory Board Meeting, report evaluation results, and provide the results to continue to raise the critical issue of public participation. The aim of this research is to encourage continued evaluation of public participation programs to help policy-makers understand how well they are involving the public, what the public is gaining from their participation, and how to grow the process into the most efficient and effective mode possible.
METHODOLOGY To better understand the public’s feelings about the public participation quality of the Citizen Advisory Board meetings, qualitative and quantitve paper surveys were fielded during the full board meeting of the SRS CAB in New Ellenton, SC in October-November 2015. The study was comprised of 15 questions, with several questions having multiple parts. The inclusion of open-ended questions in this survey permitted CAB members to share their thoughts concerning online meetings in an in-depth manner.

WM2016 Conference, March 6 – 10, 2016, Phoenix, AZ, USA
5
The approach to this public participation study is focused on the process evaluation, rather than an outcome evaluation. Process evaluations focus on the study of what goes on while a program is in process, such as the ongoing program of the Citizen Advisory Board (Abelson & Gauvin, 2006). Their counterpart, outcome evaluations work to assess whether the program achieved the intended results. This would be a challenge for the SRS CAB, as the board is still active, but may be a better fit for an advisory board whose mission area has been completed.
Population and Sampling
The survey population consisted of all members of the public during the October and November 2015 committee meetings and full-board meetings. In this public participation study, a control group does not exist.
Participant Recruitment
The potential respondents were invited to complete the paper surveys via several announcements during the board meeting. The meetings from the Savannah River Site Citizen Advisory Board are advertised in a host of ways, including social media sites, e-mails blasts to individuals who may have attended a meeting or event in the past and provided an e-mail address, and a newspaper advertisement. In addition, the meeting is published in the federal register.
Instrument Development
The survey was developed using a variety questions, including: open-ended questions, “yes and no” questions, and scaling questions to assess viewpoints of public participation. In questions that required respondents to indicate a degree to which they agreed with a given statement, the statements were anchored with a 6-point Likert-type scale with anchors of “Not Concerned” and “Very Concerned.” The order of the questions was determined by intermittently using open-answered questions, yes and no questions and degree questions to avoid having question-type redundancy.
Several questions fell into the category of “Perceived Usefulness,” which according to F.D. Davis, is the “degree to which a person believes that using a particular system would be free effort” (Davis 1989, P. 320-322). The second question type fell into “Behavioral Intention,” or how much effort people will use in order to perform a behavior (Azjen 1991, P. 182). The remaining questions fell into the category of usage and demographic collection.
Data Collection
The survey was presented in a two-page, back-and-front format. Surveys were passed out during the board meetings, and collected after an hour time frame.

WM2016 Conference, March 6 – 10, 2016, Phoenix, AZ, USA
6
Given that this survey was not being used to gauge people’s responses over a period of extended time, user identification was not created. Each respondent on the board completed the survey. Data was exported into Microsoft Excel for analysis.
Findings and Discussion
Surveys were disturbed to the public in the months of October and November 2015 during full-board and committee meetings. A complete response rate is unavailable, as the surveys were given to members of the public during the meetings to complete without identification markers. Members of the public were invited to voluntarily participate in the survey. Overall, 24 surveys were received. Generally, SRS CAB meetings attract 5-15 members of the public during each meeting, based upon the community sign-in sheets. However, not all members of the public choose to sign-in and become accounted for in the totals.
Reliability is “the degree to which an assessment tool produces stable and consistent results” (Phelan and Wren, 2005). For this survey, internal consistency reliability was utilized to understand the degree to which different test items that review the same construct will produce similar results. Several questions focusing on responsiveness and clean-up were compared to assess reliability, and the survey was found reliable.
Validity refers to “how well a test measures what is purported to measure” (Phelan and Wren, 2005). The survey underwent construct validity, whereas the SRS CAB Support Team, who administers the program, reviewed the survey before distribution.
Graph 1: SRS CAB Meeting Attendance as Reported by Survey Participants
1 2
4
18
02468
101214161820
1-3 Meetings 4-6 Meetings 7-10 Meetings Over 10Meetings
Meeting Attendance
Meeting Attendance

WM2016 Conference, March 6 – 10, 2016, Phoenix, AZ, USA
7
Respondents were asked to report the number of SRS CAB meetings they have attended. The question response provided four possible answers: a) 1-3, b) 4-6, c) 7-10 and, d) over 10.
Of the 24 survey respondents, all 24 answered the question providing a 100% response rate. The findings show that 4% of respondents indicate attending between 1-3 meetings, 4% indicate attending between 4-6 meetings, 17% indicate attending between 7-10 meetings, and 75% indicate attending over 10 meetings.
Graph 2: Age Demographic as Reported by Survey Participants
Respondents were asked to report their age on the survey. The question response provided five possible answers: a) 18-30, b) 31-45, c) 46-60, d) 60-70, and e) 71 and over. Of the 24 survey respondents, all 24 answered the question providing a 100% response rate. The findings indicate that 0% of respondents fell into the 18-30 age range, 17% of respondents fell into the 31-45 age range, 20% of respondents fell into the 46-60 age range, 46% of respondents fell into the 60-70 age range, and finally, 17% of respondents fell into the 71 and over age-range.
Scores of research studies have been conducted concerning public participation and age correlation, along with reasons as to why younger generations shy away from public involvement. This survey does not broach that subject, however, the survey results are consistent with volunteer findings that Baby Boomers and the Silent Generation continue to trend higher with volunteer efforts and public participation,
0
4 5
11
4
0
2
4
6
8
10
12
18-30 YearsOld
31-45 YearsOld
46-60 YearsOld
60-70 YearsOld
71 and Over
Age of Particpant Responses
Age of Particpant Responses
WM2016 Conference, March 6 – 10, 2016, Phoenix, AZ, USA
8
according to the Bureau of Labor Statics and the Corporation for National and Community Service.
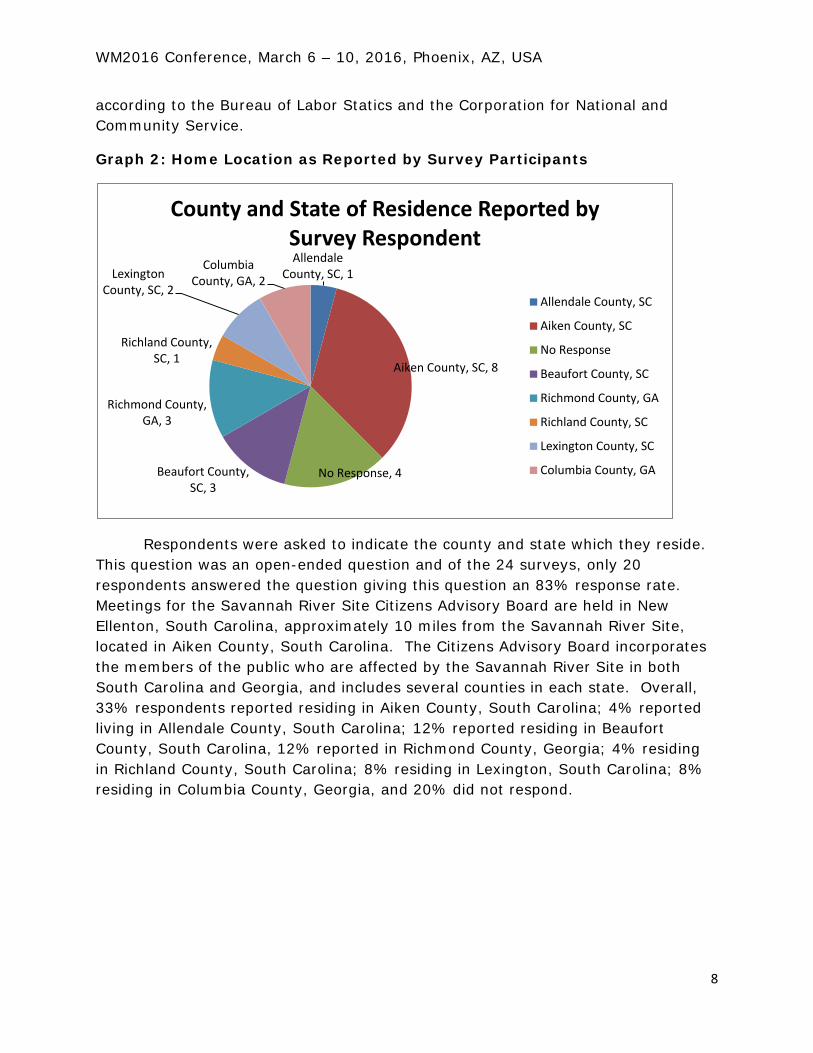
Graph 2: Home Location as Reported by Survey Participants
Respondents were asked to indicate the county and state which they reside. This question was an open-ended question and of the 24 surveys, only 20 respondents answered the question giving this question an 83% response rate. Meetings for the Savannah River Site Citizens Advisory Board are held in New Ellenton, South Carolina, approximately 10 miles from the Savannah River Site, located in Aiken County, South Carolina. The Citizens Advisory Board incorporates the members of the public who are affected by the Savannah River Site in both South Carolina and Georgia, and includes several counties in each state. Overall, 33% respondents reported residing in Aiken County, South Carolina; 4% reported living in Allendale County, South Carolina; 12% reported residing in Beaufort County, South Carolina, 12% reported in Richmond County, Georgia; 4% residing in Richland County, South Carolina; 8% residing in Lexington, South Carolina; 8% residing in Columbia County, Georgia, and 20% did not respond.
Allendale County, SC, 1
Aiken County, SC, 8
No Response, 4 Beaufort County, SC, 3
Richmond County, GA, 3
Richland County, SC, 1
Lexington County, SC, 2
Columbia County, GA, 2
County and State of Residence Reported by Survey Respondent
Allendale County, SC
Aiken County, SC
No Response
Beaufort County, SC
Richmond County, GA
Richland County, SC
Lexington County, SC
Columbia County, GA
WM2016 Conference, March 6 – 10, 2016, Phoenix, AZ, USA
9
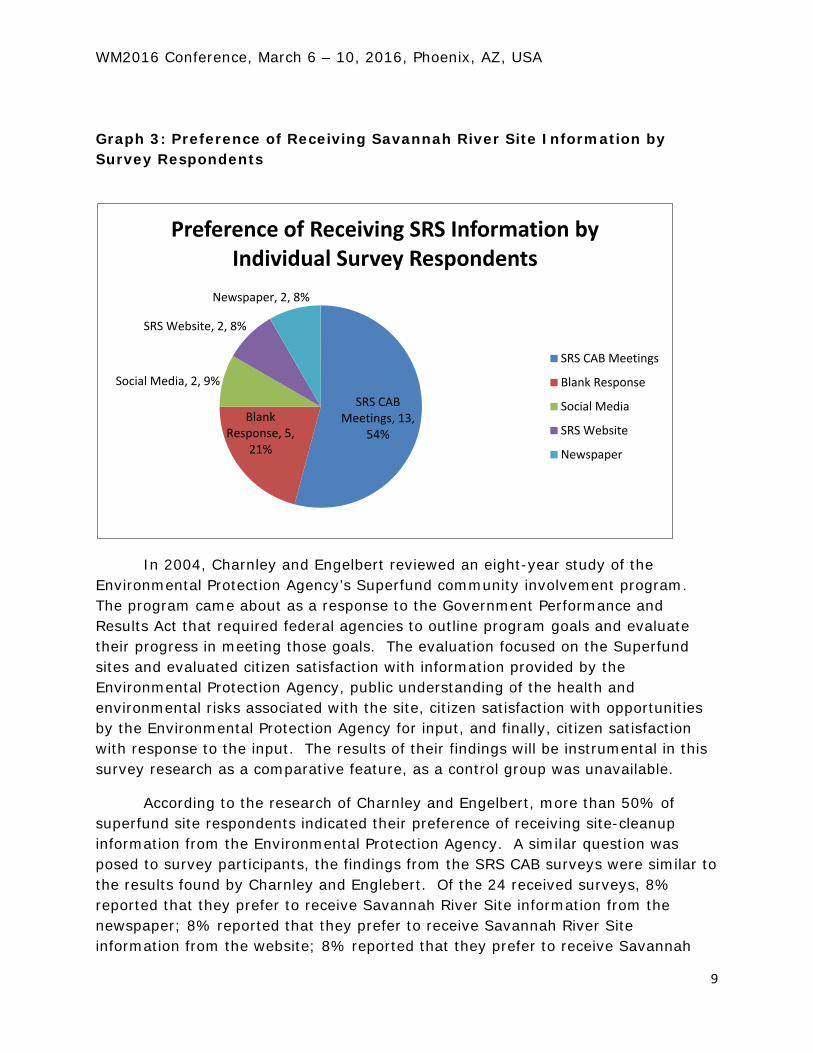
Graph 3: Preference of Receiving Savannah River Site Information by Survey Respondents
In 2004, Charnley and Engelbert reviewed an eight-year study of the Environmental Protection Agency’s Superfund community involvement program. The program came about as a response to the Government Performance and Results Act that required federal agencies to outline program goals and evaluate their progress in meeting those goals. The evaluation focused on the Superfund sites and evaluated citizen satisfaction with information provided by the Environmental Protection Agency, public understanding of the health and environmental risks associated with the site, citizen satisfaction with opportunities by the Environmental Protection Agency for input, and finally, citizen satisfaction with response to the input. The results of their findings will be instrumental in this survey research as a comparative feature, as a control group was unavailable.
According to the research of Charnley and Engelbert, more than 50% of superfund site respondents indicated their preference of receiving site-cleanup information from the Environmental Protection Agency. A similar question was posed to survey participants, the findings from the SRS CAB surveys were similar to the results found by Charnley and Englebert. Of the 24 received surveys, 8% reported that they prefer to receive Savannah River Site information from the newspaper; 8% reported that they prefer to receive Savannah River Site information from the website; 8% reported that they prefer to receive Savannah
SRS CAB Meetings, 13,
54% Blank
Response, 5, 21%
Social Media, 2, 9%
SRS Website, 2, 8%
Newspaper, 2, 8%
Preference of Receiving SRS Information by Individual Survey Respondents
SRS CAB Meetings
Blank Response
Social Media
SRS Website
Newspaper
WM2016 Conference, March 6 – 10, 2016, Phoenix, AZ, USA
10
River Site information from social media; 21% were blank; and, 55% reported that they prefer to receive Savannah River Site information from the SRS CAB meetings.
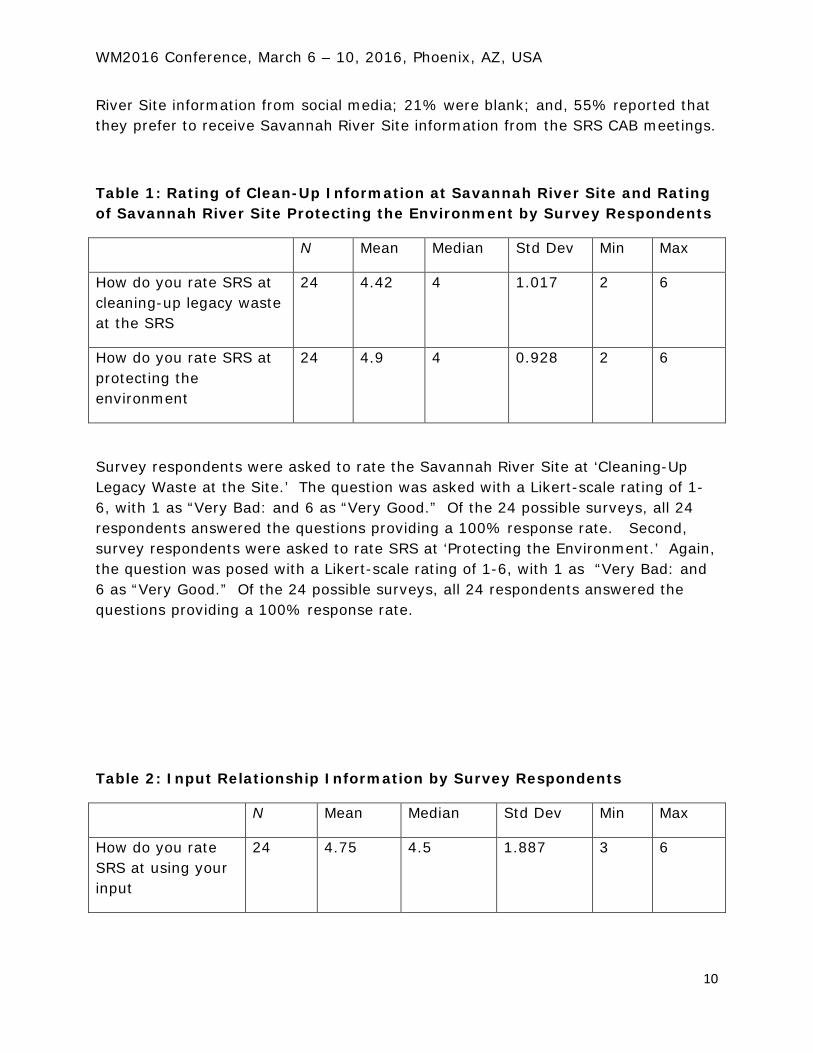
Table 1: Rating of Clean-Up Information at Savannah River Site and Rating of Savannah River Site Protecting the Environment by Survey Respondents
N Mean Median Std Dev Min Max
How do you rate SRS at cleaning-up legacy waste at the SRS
24 4.42 4 1.017 2 6
How do you rate SRS at protecting the environment
24 4.9 4 0.928 2 6
Survey respondents were asked to rate the Savannah River Site at ‘Cleaning-Up Legacy Waste at the Site.’ The question was asked with a Likert-scale rating of 1-6, with 1 as “Very Bad: and 6 as “Very Good.” Of the 24 possible surveys, all 24 respondents answered the questions providing a 100% response rate. Second, survey respondents were asked to rate SRS at ‘Protecting the Environment.’ Again, the question was posed with a Likert-scale rating of 1-6, with 1 as “Very Bad: and 6 as “Very Good.” Of the 24 possible surveys, all 24 respondents answered the questions providing a 100% response rate.
Table 2: Input Relationship Information by Survey Respondents
N Mean Median Std Dev Min Max
How do you rate SRS at using your input
24 4.75 4.5 1.887 3 6
WM2016 Conference, March 6 – 10, 2016, Phoenix, AZ, USA
11
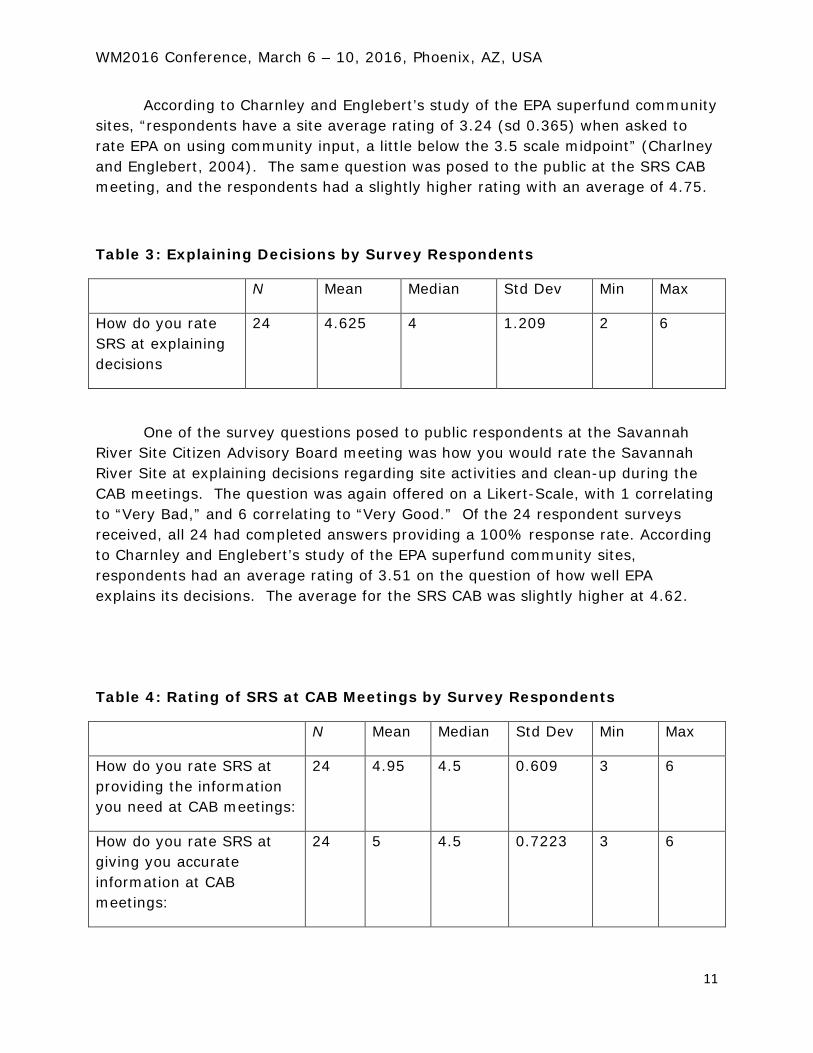
According to Charnley and Englebert’s study of the EPA superfund community sites, “respondents have a site average rating of 3.24 (sd 0.365) when asked to rate EPA on using community input, a little below the 3.5 scale midpoint” (Charlney and Englebert, 2004). The same question was posed to the public at the SRS CAB meeting, and the respondents had a slightly higher rating with an average of 4.75.
Table 3: Explaining Decisions by Survey Respondents
N Mean Median Std Dev Min Max
How do you rate SRS at explaining decisions
24 4.625 4 1.209 2 6
One of the survey questions posed to public respondents at the Savannah River Site Citizen Advisory Board meeting was how you would rate the Savannah River Site at explaining decisions regarding site activities and clean-up during the CAB meetings. The question was again offered on a Likert-Scale, with 1 correlating to “Very Bad,” and 6 correlating to “Very Good.” Of the 24 respondent surveys received, all 24 had completed answers providing a 100% response rate. According to Charnley and Englebert’s study of the EPA superfund community sites, respondents had an average rating of 3.51 on the question of how well EPA explains its decisions. The average for the SRS CAB was slightly higher at 4.62.
Table 4: Rating of SRS at CAB Meetings by Survey Respondents
N Mean Median Std Dev Min Max
How do you rate SRS at providing the information you need at CAB meetings:
24 4.95 4.5 0.609 3 6
How do you rate SRS at giving you accurate information at CAB meetings:
24 5 4.5 0.7223 3 6
WM2016 Conference, March 6 – 10, 2016, Phoenix, AZ, USA
12
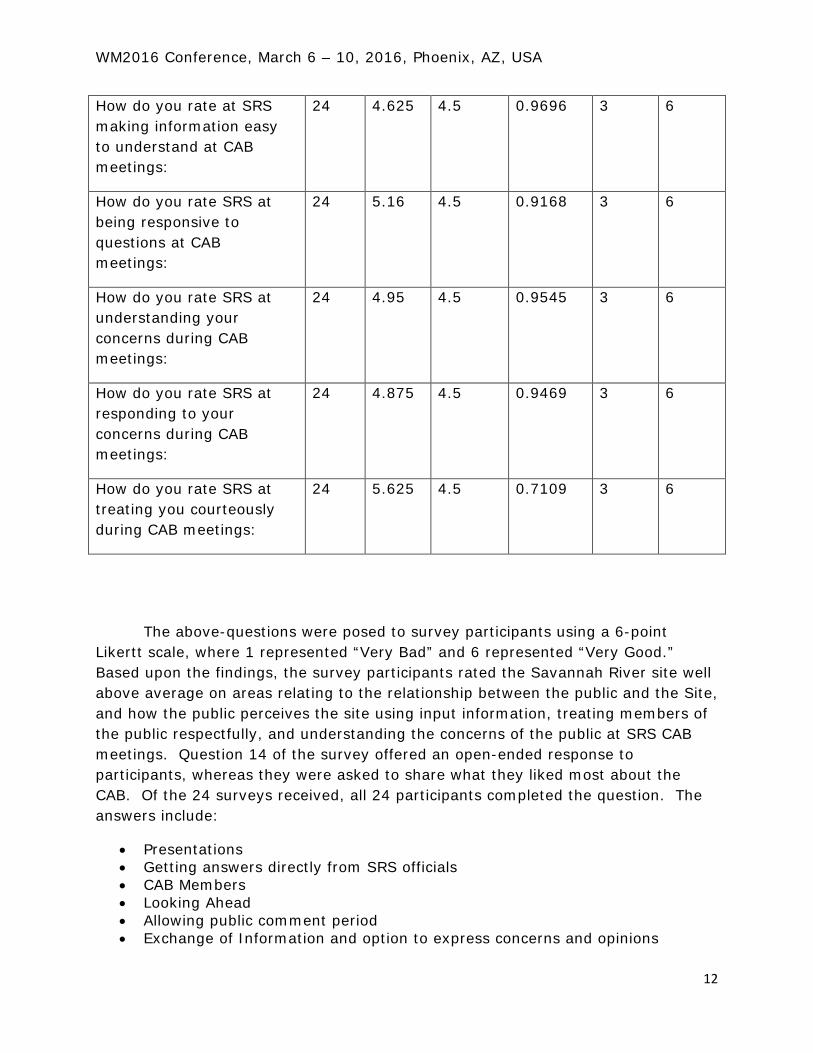
How do you rate at SRS making information easy to understand at CAB meetings:
24 4.625 4.5 0.9696 3 6
How do you rate SRS at being responsive to questions at CAB meetings:
24 5.16 4.5 0.9168 3 6
How do you rate SRS at understanding your concerns during CAB meetings:
24 4.95 4.5 0.9545 3 6
How do you rate SRS at responding to your concerns during CAB meetings:
24 4.875 4.5 0.9469 3 6
How do you rate SRS at treating you courteously during CAB meetings:
24 5.625 4.5 0.7109 3 6
The above-questions were posed to survey participants using a 6-point Likertt scale, where 1 represented “Very Bad” and 6 represented “Very Good.” Based upon the findings, the survey participants rated the Savannah River site well above average on areas relating to the relationship between the public and the Site, and how the public perceives the site using input information, treating members of the public respectfully, and understanding the concerns of the public at SRS CAB meetings. Question 14 of the survey offered an open-ended response to participants, whereas they were asked to share what they liked most about the CAB. Of the 24 surveys received, all 24 participants completed the question. The answers include:
• Presentations • Getting answers directly from SRS officials • CAB Members • Looking Ahead • Allowing public comment period • Exchange of Information and option to express concerns and opinions
WM2016 Conference, March 6 – 10, 2016, Phoenix, AZ, USA
13
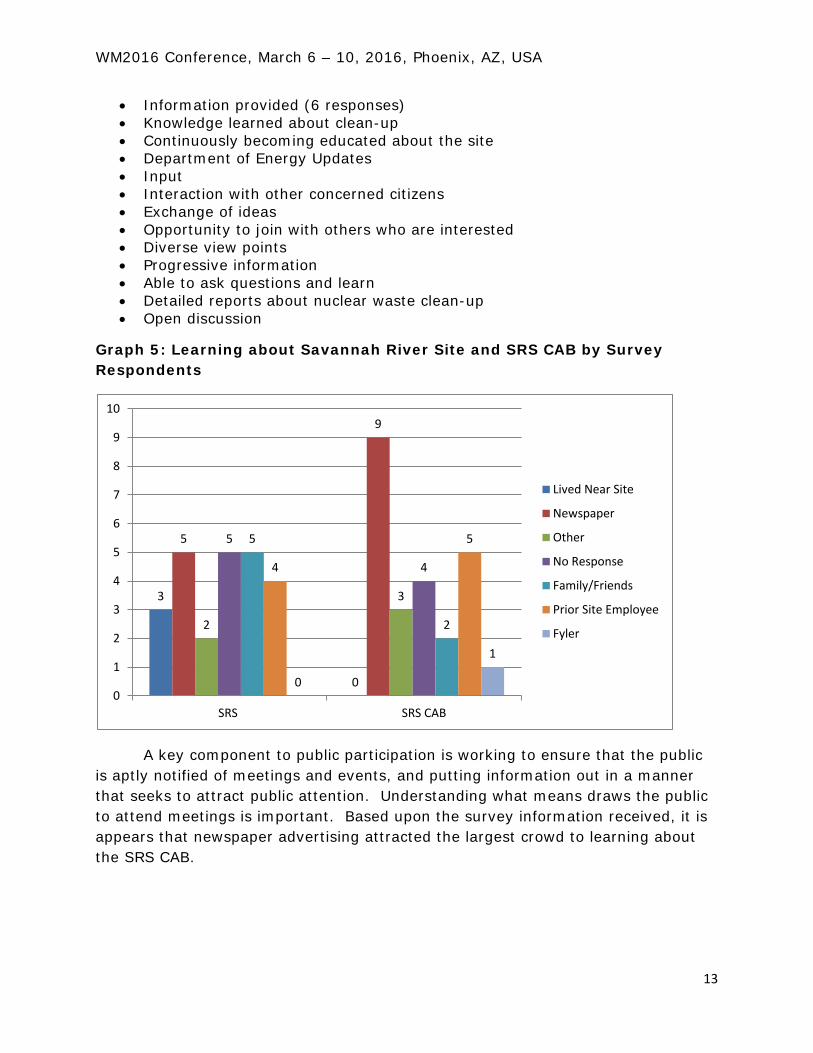
• Information provided (6 responses) • Knowledge learned about clean-up • Continuously becoming educated about the site • Department of Energy Updates • Input • Interaction with other concerned citizens • Exchange of ideas • Opportunity to join with others who are interested • Diverse view points • Progressive information • Able to ask questions and learn • Detailed reports about nuclear waste clean-up • Open discussion
Graph 5: Learning about Savannah River Site and SRS CAB by Survey Respondents
A key component to public participation is working to ensure that the public is aptly notified of meetings and events, and putting information out in a manner that seeks to attract public attention. Understanding what means draws the public to attend meetings is important. Based upon the survey information received, it is appears that newspaper advertising attracted the largest crowd to learning about the SRS CAB.
3
0
5
9
2
3
5
4
5
2
4
5
0
1
0
1
2
3
4
5
6
7
8
9
10
SRS SRS CAB
Lived Near Site
Newspaper
Other
No Response
Family/Friends
Prior Site Employee
Fyler
WM2016 Conference, March 6 – 10, 2016, Phoenix, AZ, USA
14
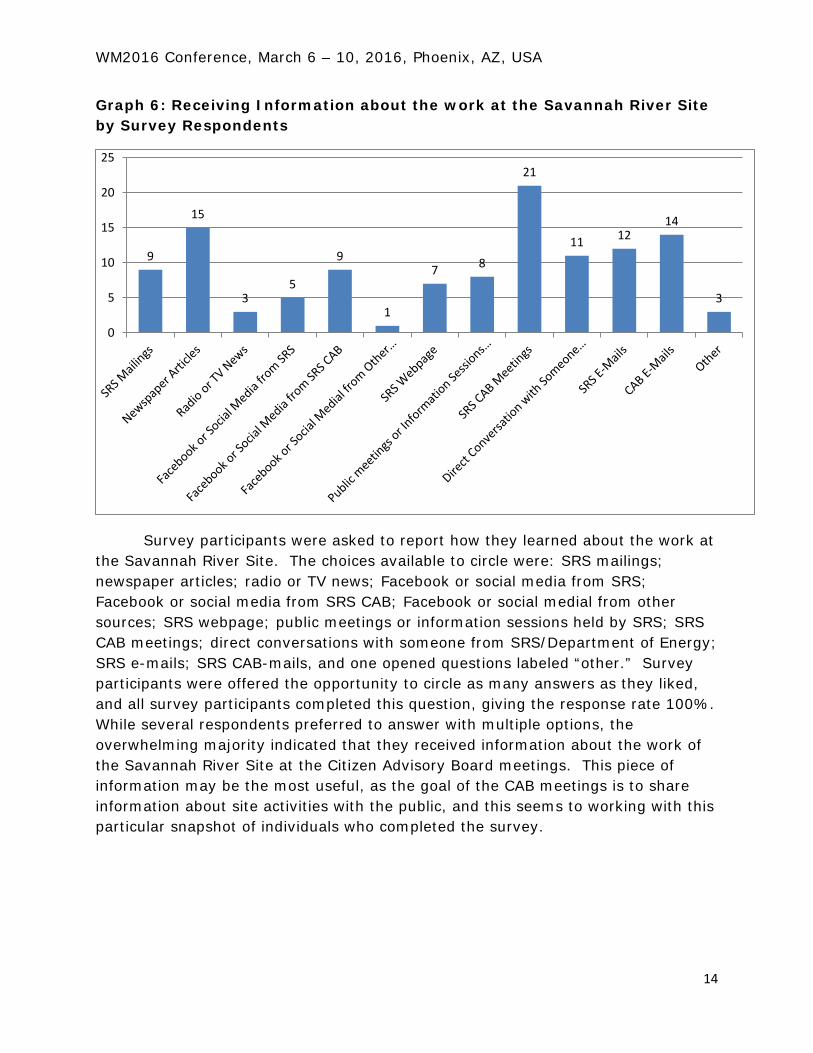
Graph 6: Receiving Information about the work at the Savannah River Site by Survey Respondents
Survey participants were asked to report how they learned about the work at the Savannah River Site. The choices available to circle were: SRS mailings; newspaper articles; radio or TV news; Facebook or social media from SRS; Facebook or social media from SRS CAB; Facebook or social medial from other sources; SRS webpage; public meetings or information sessions held by SRS; SRS CAB meetings; direct conversations with someone from SRS/Department of Energy; SRS e-mails; SRS CAB-mails, and one opened questions labeled “other.” Survey participants were offered the opportunity to circle as many answers as they liked, and all survey participants completed this question, giving the response rate 100%. While several respondents preferred to answer with multiple options, the overwhelming majority indicated that they received information about the work of the Savannah River Site at the Citizen Advisory Board meetings. This piece of information may be the most useful, as the goal of the CAB meetings is to share information about site activities with the public, and this seems to working with this particular snapshot of individuals who completed the survey.
9
15
3 5
9
1
7 8
21
11 12 14
3
0
5
10
15
20
25
WM2016 Conference, March 6 – 10, 2016, Phoenix, AZ, USA
15
Graph 7: Receiving Information about the work at the Savannah River Site by Survey Respondents
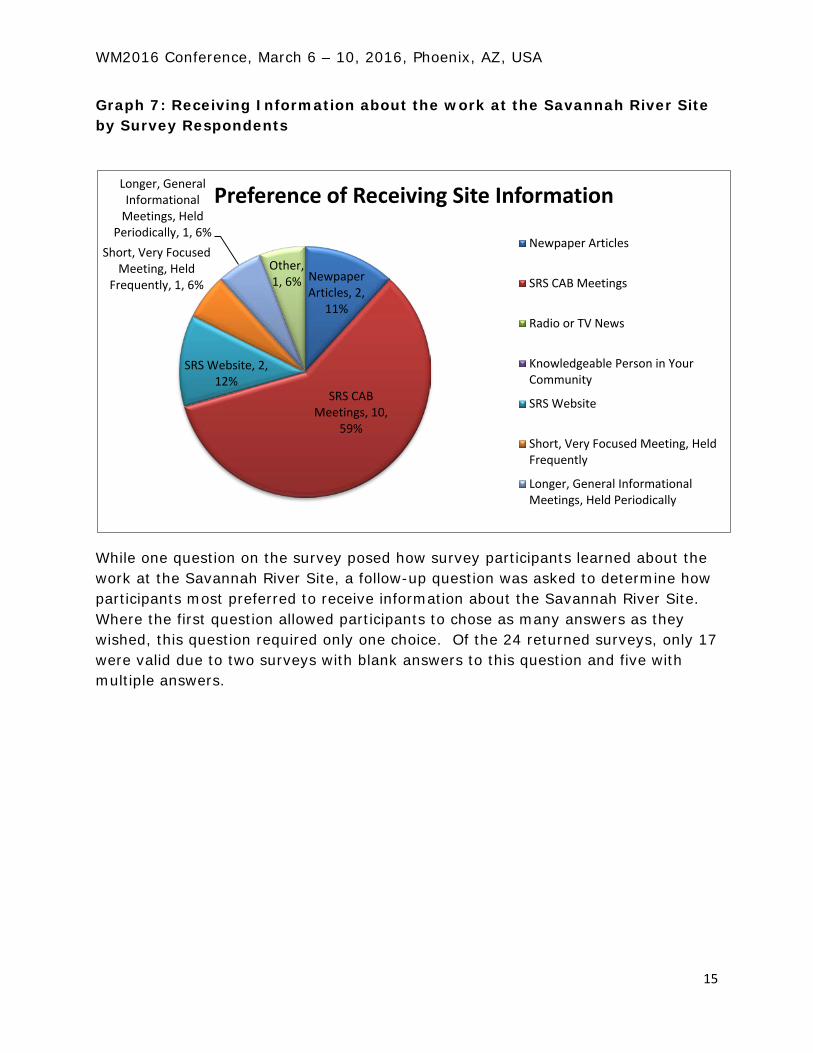
While one question on the survey posed how survey participants learned about the work at the Savannah River Site, a follow-up question was asked to determine how participants most preferred to receive information about the Savannah River Site. Where the first question allowed participants to chose as many answers as they wished, this question required only one choice. Of the 24 returned surveys, only 17 were valid due to two surveys with blank answers to this question and five with multiple answers.
Newpaper Articles, 2,
11%
SRS CAB Meetings, 10,
59%
SRS Website, 2, 12%
Short, Very Focused Meeting, Held
Frequently, 1, 6%
Longer, General Informational
Meetings, Held Periodically, 1, 6%
Other, 1, 6%
Preference of Receiving Site Information
Newpaper Articles
SRS CAB Meetings
Radio or TV News
Knowledgeable Person in YourCommunity
SRS Website
Short, Very Focused Meeting, HeldFrequently
Longer, General InformationalMeetings, Held Periodically
WM2016 Conference, March 6 – 10, 2016, Phoenix, AZ, USA
16
Graph 8: Rating SRS at Cleaning-Up Legacy Waste and Protecting the Environment
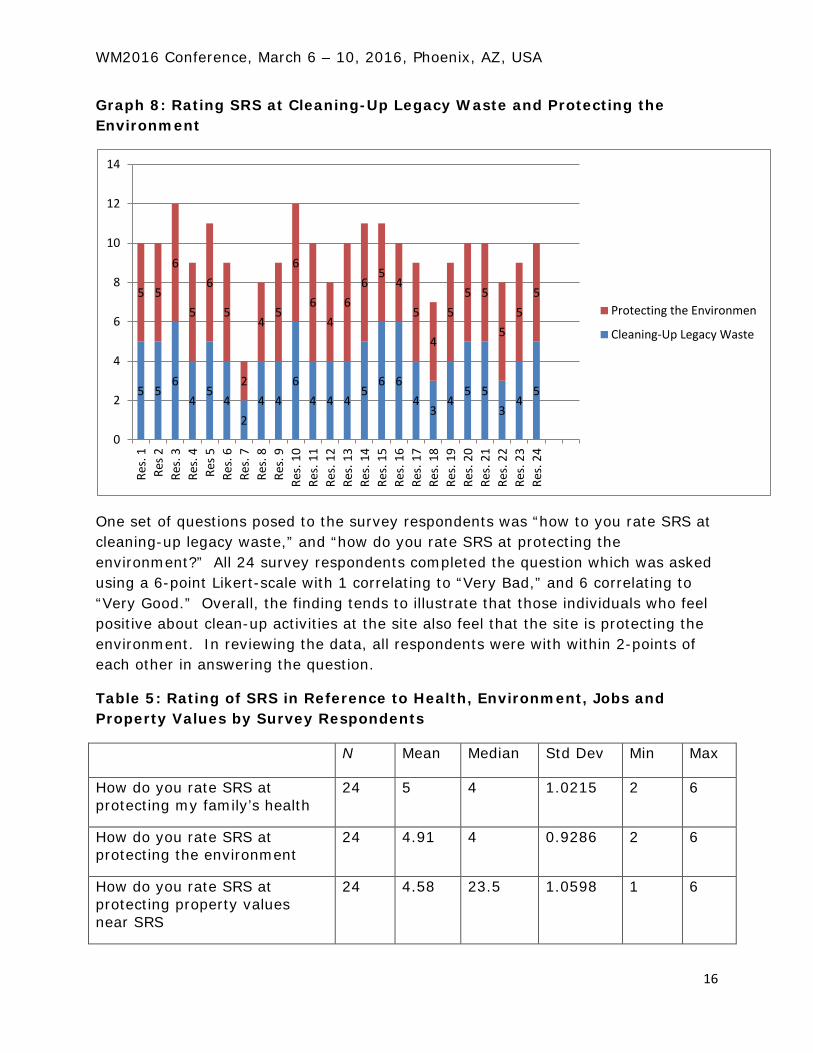
One set of questions posed to the survey respondents was “how to you rate SRS at cleaning-up legacy waste,” and “how do you rate SRS at protecting the environment?” All 24 survey respondents completed the question which was asked using a 6-point Likert-scale with 1 correlating to “Very Bad,” and 6 correlating to “Very Good.” Overall, the finding tends to illustrate that those individuals who feel positive about clean-up activities at the site also feel that the site is protecting the environment. In reviewing the data, all respondents were with within 2-points of each other in answering the question.
Table 5: Rating of SRS in Reference to Health, Environment, Jobs and Property Values by Survey Respondents
N Mean Median Std Dev Min Max
How do you rate SRS at protecting my family’s health
24 5 4 1.0215 2 6
How do you rate SRS at protecting the environment
24 4.91 4 0.9286 2 6
How do you rate SRS at protecting property values near SRS
24 4.58 23.5 1.0598 1 6
5 5 6
4 5
4 2
4 4 6
4 4 4 5
6 6 4
3 4
5 5 3
4 5
5 5
6
5
6
5
2
4 5
6
6 4
6 6
5 4
5
4
5 5 5
5 5
5
0
2
4
6
8
10
12
14
Res.
1Re
s 2Re
s. 3
Res.
4Re
s 5Re
s. 6
Res.
7Re
s. 8
Res.
9Re
s. 1
0Re
s. 1
1Re
s. 1
2Re
s. 1
3Re
s. 1
4Re
s. 1
5Re
s. 1
6Re
s. 1
7Re
s. 1
8Re
s. 1
9Re
s. 2
0Re
s. 2
1Re
s. 2
2Re
s. 2
3Re
s. 2
4
Protecting the Environmen
Cleaning-Up Legacy Waste

WM2016 Conference, March 6 – 10, 2016, Phoenix, AZ, USA
17
How do you rate SRS at providing jobs in the community
24 4.95 3.5 1.2328 1 6
One set of questions posed on the survey were for respondents to rate the Savannah River Site on a level of perceived usefulness on how respondents believed that the site is protecting the health of the respondent’s family, how the site is protecting the environment, how the site is protecting property values near the site complex, and how the site it providing jobs in the community. This questions of usefulness were posed on a 6-point Likert scale with 1 correlating to “Very Bad,” and 6 correlating to “Very Good.” Of all received 24 surveys, all 24 had been completed providing a 100% response rate. The average of the Likert-scale rating is 3, and the mean for each of the questions posed for the site are well above the mean.
CONCLUSION
Multiple challenges were present in constructing this participation evaluation survey. For one, in order to feasibly conduct the survey, a stringent scientific approach was not taken. Survey participants were not randomly sampled, and instead, all members of the public who attend Citizen Advisory Board meetings during the months of October and November 2015 were offered a survey. That said, another issue lies with the surveys being voluntary, which may have prevented some people from completing surveys for fear that their survey may have been identified and that they could be construed as having negative feedback. Another challenge came with the cost, as this survey was conducted without a budget. Another factor is the time frame, as this survey was conducted during a closed period but could easily have spanned a year or longer to gain further results.
General snapshots of the study can provide information about public participation and may be useful as a preliminary foundation to continue looking at the subject. Of the 24 received responses, 18 responses (75%) indicated that they have attended 10+ SRS CAB meetings. In looking at the number, it may be a safe assessment to conclude that that the SRS CAB does well to maintain members of the public once they begin to attend meetings. That appears to indicate that once an individual learns about the meeting, they seem more apt to return. This is also relates to the question posed on how individuals like to learn about the site activities, and 54% responded with their preference of attending SRS CAB meetings.

WM2016 Conference, March 6 – 10, 2016, Phoenix, AZ, USA
18
One of the features of the current mission of the site is to clean-up legacy waste, and multiple presentations are provided to the SRS CAB throughout the year focusing on that topic. On a Likert scale of 1-6, with 1 correlating to “Very Bad” and 6 correlating to “Very Good,” survey recipients provided a mean response of 4.42 in indicating their ratification towards clean-up and 4.9 on protecting the environment. While much speculation can be discussed to explain why survey respondents indicated those findings, that may be best left to additional research that delves into that question deeper. Looking at the open-ended survey responses, as well as similar questions, it appear that the responding public indicating that that they believe that the site is earning the public’s trust, using input, and responding to concerns, and that may help increase the favorable perception of site clean-up activities and environmental protection.
This evaluation provided a snapshot in time of public participation at the Savannah River Site Citizen Advisory Board meeting. Continued public participation surveys are vital to understanding what is working well and what can be improved. Though public participation has been studied for decades, much of the research and practice remains in the early-stages. Working on educating the public for the need of research, securing funding to provide and assess evaluation, and developing frameworks that provide consistent and reliable data remains a challenge.
REFERENCES
Ajzen, I. (1991). The theory of planned behavior. Organizational Behavior and Human Decision Processes, 50, 179-211.
Beierle, T.C. and Cayford, J (2002). Democracy in practice: Public participation in environmental decisions. Resources for the Future; Washington, DC.
Charnley, Susan and Englebert, Bruce (2004). Evaluating public participation in environmental decision-making: EPA’s superfund community involvement program. Journal of Environmental Management, 77(2005), 165-182.
Davis, F. D. (1989). Perceived Usefulness, Perceived Ease of Use, and User Acceptance of Information Technology. MIS Quarterly, 13(3), 319-340.
Moynihan, Donald P., Bryson, John M. and Quick, Kathryn S (2012). Designing public participation process. Public Administration Review, 2(2), 1-9.
Phelan, Colin and Julie Wren (2005). Exploring reliability in academic assessment. Office of Academic Assessment.
WM2016 Conference, March 6 – 10, 2016, Phoenix, AZ, USA
19
Rowe, Gene and Frewer, Lynn J (2004). Evaluting public participation exercise: A research agenda. Science, Technology & Human Values, 29(4), 512-556.
Tedford-Gold, S., Abelson J. and Charles C. (2005). From rhetoric to reality: representing public and patient voices in supportive cancer care planning. Health expectation, (8):195-209.
Weiss, C.H. Evaluation. 2nd edition, Upper Saddle River: Prentice Hall, 1998.