motivational drivers behind gamification: the role of
TRANSCRIPT

A Work Project, presented as part of the requirements for the Award of a Masters Degree in
Management from the NOVA – School of Business and Economics
MOTIVATIONAL DRIVERS BEHIND GAMIFICATION: THE ROLE OF UTILITARIAN, HEDONIC AND SOCIAL ASPECTS
ANDREA CERUTTI
2849
A Project carried out on the Marketing Direct Research – Consumer Behaviour with the supervision of:
Professor Luís F. Martinez
January 2017

2
Abstract
The purpose of this paper is to investigate the motivational drivers behind gamification,
adding new findings to the limited understanding of this phenomenon related to the use of game
design elements in non game context, with the scope of affecting the user’s behaviour. Several
elements related to possible motivational drivers have been identified (characteristic of
utilitarian, hedonic and social aspects) and analysed aiming to assess their impact over the
intention to use and recommend a gamified service. The study presents multiple regression
analysis conducted on data collected through an online survey (n = 208) related to the
gamification e-learning experience of Duolingo. The results indicate that utilitarian, hedonic
and social aspects present a statistically significant impact on the intention to use and to
recommend the service. However, the various elements analysed assume different roles as
predictors, implying specific approaches depending on the objective pursued.
Keywords: Gamification, Consumer Behaviour, Game elements, Motivations
Acknowledgment
During the development of this project was very demanding, but in the process, I was
able to count on the support of various people that I would like to thank. Firstly, I would like
to thank my supervisor Luis Martinez, whose support, patience and feedbacks have made this
project possible. I would also like to thank Luisa Martinez for the help given and proven
availability. Finally, I would like to thank my mother Alessandra, my father Luca, my brother
Matteo and Bárbara, whose support made this thesis and this Master an unforgettable
experience.

3
1. Introduction
A new phenomenon emerging from the many technology-based solutions that aim to
effect consumer behaviour is the adoption of game-design elements in non game contexts, the
so called “gamification” (Conejo, 2014). Raising increasing attention from companies and
researchers (Hamari et al., 2014), gamification aims to attract and engage the consumers or
employees by creating a higher perceived value of the products or activities of a company
(Bunchball, 2010; Hamari et al., 2014; Morschheuser et al., 2016). In order to do so, elements,
such as points, levels, leaderboards and badges, are adopted in situations other than those for
which they were originally created, games. Furthermore, gamification, incorporating fun and
progression elements (Sridharan et al., 2012), permits to find new and creative paths regarding
the creation and implementation of solutions, going beyond the traditional processes (Palmer
& Hugo, 2013).
In the recent past, companies have used this technique in many different contexts such
as user engagement, organisational productivity, learning, physical exercise and recruitment.
Among the many examples of successful gamification implementation we can find some of the
main brands worldwide: Nike thanks to its social running app, Nike+, that enables to track and
share training achievements with other users, gaining points and possible rewards, the Brand
has been able to attract a user base of 28 million people since its launch (Mittal, 2015); Samsung
has decided to implement game mechanisms in its online community, Samsung Nation, with
important results such as an increase of 500% of product reviews and 66% more visitors on the
website (Swallow, 2012; Liyakasa, 2013); other companies such as Microsoft, IBM and Oracle
have decided to gamify their internal application (Badgeville, 2012), in order to face the
problem of increasing engagement with employees and to improve efficiency (Burke, 2012).
However, even if this new phenomenon appears very promising (Bunchball 2010;
Gartner, 2011), gamification should not be implemented without careful planning, and previous

4
analysis predict that almost 80% of gamified applications will fail to achieve their scope in the
near future (Burke, 2012), this, mainly due to poor design and understanding of motivational
aspects. A deep comprehension of the elements and mechanism related to gamification is
considered necessary in order to create profitable gamification solutions, and for this reason, a
higher expertise about the topic is required (Brigham, 2015).
This research, moving from previous studies regarding motivations and benefits behind
gamification (e.g. Bittner & Schipper, 2014; Hamari & Koivisto, 2015), aims to further analyse
the topic, combining and implementing the earlier findings with different variables. The first
part of this paper aims to assess the state of the art regarding the topic, highlighting the different
aspects that define gamification. In the second part, the data collected through an online survey
for this scope related to one of the most successful gamification example, the e-learning
experience of Duolingo, are used for multiple regression analysis. The findings of this research
intend to contribute to a better understanding of the phenomenon.
2. Gamification
2.1 Definition of gamification
Even if the word “gamification” was firstly used at the beginning of the new millennium
(Pelling, 2011), this term started to assume the current meaning only at the end of the past
decade, when Bret Terrill and James Currier used it on their blogs, referring to it as: “taking
game mechanics and applying them to other web properties to increase engagement.” (Terrill,
2008). It is only in the second half of the past decade that the term saw widespread adoption
obtaining both industrial and academic attention.
The most used and cited definition of “gamification” is: “the use of game design
elements in non-game contexts” (Deterding et al., 2011; p. 9). As further described by the
authors, this definition tries to clarify the peculiarities that characterise the phenomena and that

5
enable us to distinguish it from precursors and parallels such as “serious games”, games
designed for serious purposes that go beyond mere entertainment, and “pervasive games”, new
game genres that go beyond the traditional boundaries of games, adapting games into new
contexts, situations and spaces (e.g. location-based games, augmented reality games).
Huotari and Hamari proposed an alternative definition of gamification, that is defined
as: “A process of enhancing a service with affordances for gameful experiences in order to
support user's overall value creation” (Huotari & Hamari, 2012; p. 19). The authors are more
focused on the goal of the gamified experience than on the elements that distinguish it. With
this in mind, gamification can be considered positively implemented only in the case that
supports the core-service, making it gameful in a way that does not distract the user from the
main purpose.
The common idea, that is highlighted throughout the literature review over the topic, is
the willingness to create a valuable experience that is able, through game elements, to engage
the customers and affect positively their behaviour (Hamari, 2013).
2.2 Gamification elements
Having provided the main definitions of gamification, the analysis will now focus on
the elements that characterize a gamified experience: the gamification mechanics, dynamics
and emotions (Robson et al., 2015). Those elements were developed in the literature review
adapting the MDA framework (Hunicke, LeBlanc, & Zubek, 2004) to the new phenomena.
Common examples of gamification mechanics include levels, badges, points systems or
rankings. Overall, three main kinds of mechanics can be identified and they characterize
respectively setup, rules and progression in the experience. Through those mechanics, the
designers, i.e. “those who try to gamify a non game context” (Robson et al., 2015), are able to
determine the rules, the context, the different interactions and the goals of the gamified
6
experience. However, those elements alone, even if fundamental for the experience, are not
able to guarantee the success of a gamification process.
The gamification dynamics are related to the impact that the above-mentioned
mechanics produce on each user and their approach and response to them (Huotari & Hamari,
2012). Since those dynamics can not be previously set, it is very important to focus on which
kind of behaviours each mechanism can generate, and try to predict the results in order to
develop the gamified experience in the most appropriate way. Taking into consideration the
different goals, the designers can aim, for example, for a more cooperative or more competitive
dynamics, trying to avoid inappropriate and negative actions from the users, like trying to break
the rules (Elverdam & Aarseth, 2007; McCarthy et al., 2014).
The gamification emotions are the affective psychological states that are generated by
the way the user feels while following the mechanics and then generating the dynamics (Robson
et al., 2015). The emotions can be both positive or negative, so it is important to create a
gamification process that results in a fun and enjoyable experience for the user (Sweetser &
Wyeth, 2005).
3. Theoretical background
A literature review was conducted aiming to assess the state of the art regarding the
topic, and to identify the models and variables developed related to it.
In order to identify the different kinds of motivation that can have an impact on the users
of a gamified experience, the research was structured combining the technology acceptance
model (TAM) (Davis, 1989) and relative implementation from other authors (Van der Heijden,
2004; Venkatesh & Davis, 2000), an implemented model from Hamari and Koivisto (2013) that
developed the theory of planned behaviour (TPB) (Ajzen, 1991) adding social factors, and other
research applying the human motivation theories to online consumer behaviour and technology
7
acceptance (Webster & Martocchio, 1992; Deci & Ryan, 2000; Kim & Son, 2009; Hernandez
et al, 2011).
Three are the types of benefits identified as possible predictors of the behaviours related
to gamification: utility, hedonism, and social benefit. In this research, using survey collected
data, their impact was analysed on the intention to use and recommend a gamified experience
(WOM).
As described by the self-determination theory (Deci & Ryan, 1985), the motivations
that can affect human behaviour, can have two different types of sources: the extrinsic
motivations are invoked when the goal and conditions are related to external sources, such as
an economic benefit for completing a task; on the other hand, intrinsic motivations are the one
that brings a person to engage in a behaviour being driven by an internal reward, and can be
related to factors such as interest, enjoyment or control (Deci & Ryan, 2000).
This theory is useful in order to evaluate the differences between gamification and
loyalty programs, even if the usage of point-based systems and rewards can be similar, and both
are customer oriented. Offering economic benefits and being focused on behavioural rewards,
loyalty programs likely elicit extrinsic motivations (Deci, Koestner, & Ryan, 1999). The
gamification process, instead, is able to increase the perceived value of the service, by affecting
the users’ intrinsic motivations by the implementation of game mechanics and therefore
creating a gameful experience (Huotari & Hamari, 2012; Hamari et al, 2014). Moreover,
gamification adds a competition’s element that is not present in the others’ engagement
strategy, and the specific challenge impacts the behavioural and emotional responses (Harwood
& Garry, 2015).
Another possible distinction that characterizes the technology adoption literature is
related to the difference between utilitarian and hedonic systems: while the first system is
related to the fulfilment of goals different from the service use itself, aiming to make those
8
goals more easily or effectively reachable, the second, related to intrinsic motivations, has the
purpose of making the experience itself more entertaining and enjoyable (Davis, 1989; Van der
Heijden 2004). Gamification is considered capable of providing both benefits since it attempts
to motivate the user in obtaining utilitarian outcomes while invoking hedonic aspects,
intrinsically motivated (Hamari & Koivisto, 2015).
Lastly, it is necessary to consider the impact of social features in the systems. Taking
into consideration the social nature of human beings, when social aspects are integrated into
utilitarian or hedonic systems, motivations can be generated from aspects such as recognition
and mutual benefits, generating social interaction, and then supporting and adding value to the
core service (Hamari & Koivisto, 2013).
3.1 Utilitarian Aspects
Analysing the utilitarian benefits that have an impact on a particular technology or
system, the perceived usefulness is considered as a predictor of intention to use (Davis, 1989;
Venkatesh, 2000). Defined as the range of the belief that a particular system improves the
performance of a task (Davis, 1989), this factor is considered to be more effective in case of
utilitarian purposes, than in the presence of hedonic objectives (Van der Heijden, 2004); still,
considering, as previously mentioned, the dual nature of gamification that is characterized by
both dimension, it is possible to assume that usefulness is fundamental for the user experience.
The willingness to use a system can be positively influenced by the perception that the
gamified experience is easy to use. Regarding technology acceptance research, previous studies
(Davis, 1989; Venkatesh, 2000) have demonstrated that the easiness of use can be considered
a predictor of more efficiency in case of utilitarian systems, improving the interaction between
the user and the system. Moreover, considering that gamification, as previously explained, also
presents elements of hedonistic experiences, ease-of-use was shown to be positively related
9
also to the use intentions in the case of hedonistic experiences, with the consequent benefit of
being more enjoyable (Van der Heijden, 2004).
3.2 Hedonic Aspects
As previously analysed (Hamari & Koivisto, 2015), the perceived enjoyment has a
positive influence on the intention to use a gamified experience. This aspect, the fact that the
system is perceived as enjoyable on its own (Davis, 1989), is characteristic of hedonic
experiences and is a common element that influence games, game-like systems and other
entertainment systems (Venkatesh, 1999; Van der Heijden, 2004). Another aspect to take into
consideration is the playfulness of the gamified system. Defined as “the tendency to interact
spontaneously, inventively and imaginatively” with a system (Webster & Martocchio, 1992),
playfulness can be an important element for gamification, since this process enables to
implement an original and creative way to approach the task.
3.3 Social Aspects
Considering the theory of planned behaviour (Ajzen, 1991), social influence is defined
as the individual’s perception of how other users judge a specific behaviour as relevant, and if
they expect him to accomplish it. In the case of gamification, this element can be important to
predict the use intention. Considering the human desire for relatedness and acceptance (Deci &
Ryan, 2000), the sense of recognition, related to the feedbacks that users obtain from others for
their behaviour (Hernandez et al., 2011), can positively affect the use of a service, promoting
social interaction and increasing the perceived benefits related to the use.

10
4. Method
4.1 Research Questions and Conceptual Models
This study aims to investigate the relations between utilitarian, hedonic and social
motivations and the intention to use or to recommend (World-of-mouth) toward gamification.
The decision to investigate the intention to WOM is related to the importance that this
aspect can assume as an influencer in human behaviour (Day, 1971; Sundaram et al., 1998). In
this research, world-of-mouth was defined as the intention to recommend a particular product
or service, and previous studies have shown that it can be assumed as an indicator of user’s
satisfaction and willingness to use (Bhattacherjee, 2001; Kim & Son, 2009).
Combining the theoretical background, six different independent variables were
identified as predictors, two for each kind of motivation: Usefulness, Easy-to-use, Enjoyment,
Playfulness, Recognition and Social Influence.
The research questions of this study are related to the different possible interactions
between each exogenous variable and the endogenous variables. For this purpose, the data
collected through an online survey had been used to analyse if a positive association between
the items can be statistically supported and, hence, stated.

11
Figure 1: Conceptual Model for Intention to Use and to WOM
Source: Own development based on Conceptual Background structure
4.2 Procedure
In order to gather the data necessary to test the research hypothesis, an online structured
questionnaire was developed and sent via Facebook chat or email during the months of October
and November 2016.
Different authors (e.g. Bittner & Schipper, 2014; Hamari & Koivisto, 2015) have
investigated the topic, highlighting the necessity for further analysis using different context of
gamification. Considering the previous research and basing the structure and development of
the survey on the literature review, it was necessary to identify a context of gamification not
previously analysed.
The e-learning experience offered from the free language-learning platform of Duolingo
appeared as the most appropriate tool for doing it, hence it was used as an example of

12
gamification in the survey conducted. Duolingo includes a language-learning website and app,
offering free of charge language courses over 23 different languages, reaching a worldwide
base of more than 150 million users from its launch five years ago (Guliani, 2016; Hern, 2016).
The learning service presents many elements peculiar to gamification: badges, points, levels,
leaderboard, flow and the possibility to have social interactions through the chat and comment
option.
The questionnaire encompassed 39 questions, it was organised in three parts and started
with 3 simple multiple choice questions: the first regarding the knowledge of gamification, and
the subsequent related to Duolingo and the use of the service.
The questionnaire was pre-tested with the contribution of 25 people, with distinct levels
of education, age and gender. The pre-test was conducted in order to validate people’s aptitude
to comprehend and recognise each question and its general relevance to the study. This phase
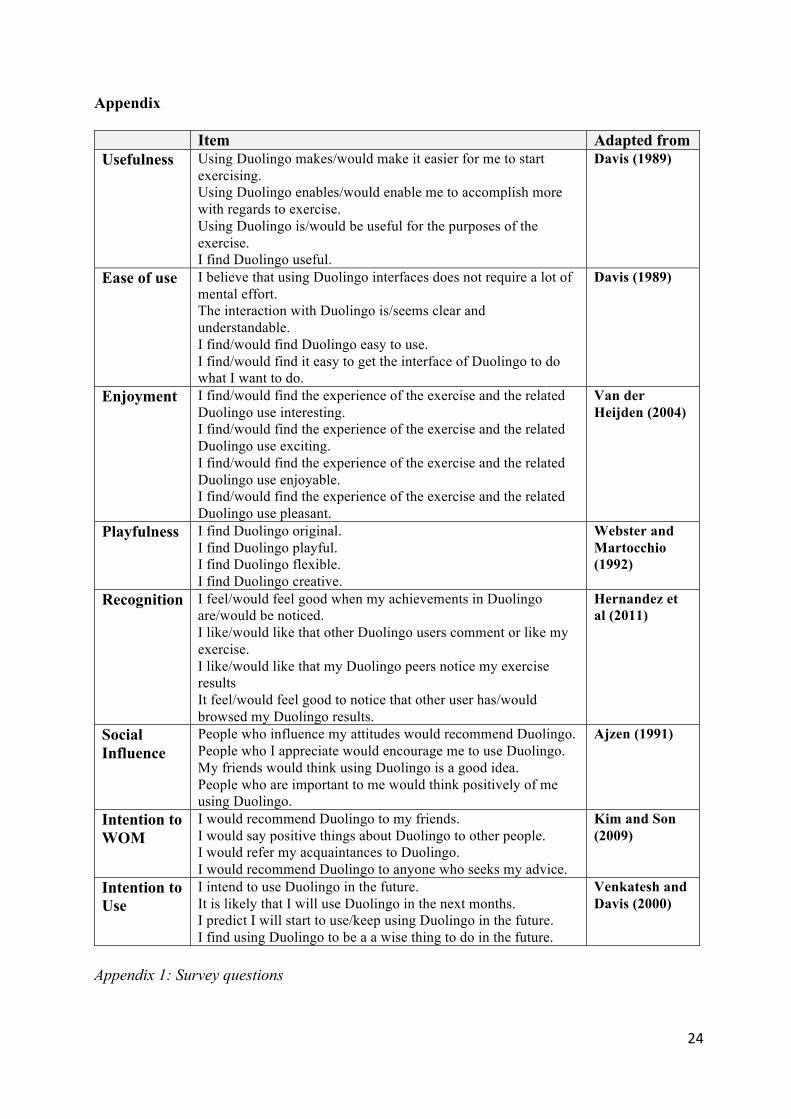
helped to reform the questions (that are adapted from previous researches, Appendix 1) and
make them more appropriate for the research purpose.
4.3 Sample
Considering the necessity to interpret the data collected using methodology
characteristic of Principal Component Analysis, the sample size had to fulfil the specific
minimum requirement, characteristic also of factor analysis, of size given by the ratio 5:1 of
respondents to items (Gorusch, 1983; Hatcher, 1994). One of the most well-know criteria for
quantitative research is the number of 100 subjects as minimum size (MacCallum et al., 1999).
The survey was sent to more than 400 people, reaching a total number of respondents of 223.
Since some of the answers can not be considered complete, the number of valid responses is
208. Those features allow to satisfy the requirement of sample size peculiar to the conditions
13
of representativeness (Yamane, 1967; Singh & Masuku, 2014), resulting in a sample that
contains an appropriate collection of data to conduct a study.
Among the respondents, 103 are men (45,5%) and 108 women (55,5%), so the two
genders are almost equally represented. The most represented age group is between 18 and 24
years, counting for 38% of the total, the second is the one of 24-29 years old (26,9%), while
only 8 individuals under the age of 18 answered the questionnaire. 148 are the respondents that
hold a university degree (Bachelor and Masters are respectively 31,3% and 39,9% of the total).
4.4 Measures
The questionnaire was developed combining past studies, using scales that were
previously validated by other researchers (Appendix 1). All the variables present four items that
are measured with a seven-point Likert Scale (Likert, 1932). The decision to use a seven-point
scale is supported by prior research that suggests an increase in reliability and validity
(compared to the more popular five-point scale), without affecting the factor analysis, important
aspect since a Principal Component Analysis (PCA), was necessary during the research
(Churchill & Peter, 1984; Barnes et al., 1994; Colman et al., 1997; Harzing et al., 2009). In
order to increase the accuracy of the answers (Malhotra & Birks, 2007), all Likert-scale scores
had been categorised from 1 to 7 (1=Strongly Disagree, 4=Neither Agree or Disagree,
7=Strongly Agree). The question order was randomised, aiming to limitate the possibility for
the respondents to identify patterns between the items and prevent common method bias (Cook
et al., 1979).
In addition, a Cronbach Alpha test was run with the scope to assess the internal
consistency reliability of the questionnaire (Cronbach, 1951). The results of the analysis fulfil
the requirement for acceptance of .70 (Nunnally, 1978), and indicate an excellent level ( > .90)
of internal consistency for the constructed test (George & Mallery, 2003).
14
Since every variable contained 4 items, a Principal Component Analysis, that identify a
linear combination of optimally weighted observed variables, using an orthogonal rotation
technique, was run. This statistical procedure is considered appropriate as data reduction
technique for predictive models and both the 5:1 ratio previously mentioned (Gorsuch, 1983;
Hatcher, 1994) and the sample size bigger than 100 allows its application (Mundfrom et al.,
2005). Considering the Eigenvalue and Scree Plot results it was possible to extract one
component for each variable that reflects the different items (Bobko & Schemmer, 1984;
Stevens, 1986). The requirement of >.60 for Kaiser-Meyer-Olkin (KMO) measure of sampling
adequacy is satisfied from all the Principal Components Analysis (Cerny & Kaiser, 1977)., with
values very close to > .80, considered good or excellent (Hutcheson & Sofroniu, 1999). Those
component were, hence, used in the multiple regression analysis.
5. Results
In order to assess the effects of the independent variables over respectively Intention to
use and to WOM, two distinct multiple regression analysis were conducted (Appendix 2 and
3).
The first construct could account for 79,6% of the variance of the intention to use. Both
the utilitarian motivations present a positive relationship with the intention (β = .326, p < .01
for Usefulness, β = .177, p < .01 for Easy of use). With regard to the hedonic benefits,
enjoyment is positively associated with the endogenous variable (β = .194, p <0.05), while
playfulness did not significantly predict the variable (p > .05). Social influence is a significant
predictor for the dependent variable (β = .258, p < .01). Recognition too can not be considered
as statistically significant for the analysis (p > .05).

15
Regarding the intention to recommend the service, the construct is able to predict 84.3%
of the variance. Differently from the previous analysis, the usefulness does not present a direct
relationship with the dependant variable (p > .05). Easy-of-use still has a positive relationship
with the Intention to WOM (β = .246, p < .01). Passing now to the hedonic aspects, enjoyment
is a significant predictor for intention to WOM (β = .193, p < .05), while Playfulness can not
be considered so (p > .05). Lastly, social influence presents the highest significant associations
with the endogenous variable (β = .402, p < .01). Recognition, once more, is not statistically
significant for the construct (p > .05).
Table 1: Research hypothesis
H# Description Supported
H1.1 Usefulness is positively associated with intention to use. Yes
H1.2 Usefulness is positively associated with intention to WOM. No
H2.1 Easy-of-use is positively associated with intention to use. Yes
H2.2 Easy-of-use is positively associated with intention to WOM. Yes
H3.1 Enjoyment is positively associated with intention to use. Yes
H3.2 Enjoyment is positively associated with intention to WOM. Yes
H4.1 Playfulness is positively associated with intention to use. No
H4.2 Playfulness is positively associated with intention to WOM. No
H5.1 Recognition is positively associated with intention to use. No
H5.2 Recognition is positively associated with intention to WOM. No
H6.1 Social Influence is positively associated with intention to use. Yes
H6.2 Social Influence is positively associated with intention to WOM. Yes

16
6. Discussion and Conclusion
In this paper, I investigated how different kinds of motivations (utilitarian, hedonic and
social) are associated with the intention to use and to recommend gamification. The findings
that emerge from this research present similarities but also some interesting differences in the
roles that the predictors assume over the dependent variables, and these results imply particular
approaches in the implementation of gamification depending on the companies’ specific goals.
With regard to the intention to use, gamification provides benefits characteristic of
utilitarian systems, confirming the assumptions relative to the technology acceptance theories
(Davis, 1989; Venkatesh, 2000). This conclusion is an important aspect that companies that are
willing to increase their user base and retention rate have to consider: they should focus on
creating a gamification experience that satisfies the aspects related to usefulness and easiness
to use, developing a new solution that is efficient and that meets a precise objective. The
hedonic aspect of enjoyment has to be considered as a crucial factor when designing a gamified
product. The research finding is supported by other studies which suggest that the attractiveness
of gamification is surely related to the people’s positive response in terms of engagement and
participation when facing sources of entertainment (Meloni & Gruener, 2012). This aspect, that
is a direct consequence of the use of game design elements, also enables to differentiate this
new phenomenon from other persuasive solutions, hence, the creation of an enjoyable
experience has to be taken carefully into consideration (Sweetser & Wyeth 2005; Hamari &
Koivisto 2015). Finally, the results related to the social aspects indicate on one hand, that
recognition is not a significant predictor for the intention to use the gamified service, on the
other hand, the social influence present a positive relation with the endogenous variable. The
rejection of the hypothesis regarding recognition can be explained by the fact that this aspect is
not able to increase how the service value is perceived, while the result related to social
influence confirm what has previously found (Hamari & Koivisto, 2013).
17
Regarding the intention to recommend the service, an interesting finding, that appears
from the analysis of the collected data, is that no direct relationship between the variable and
the utilitarian aspect of usefulness can be detected as statistically significant. This result can be
interesting for companies that want to increase the brand awareness, through a gamification,
since it suggests that it would be necessary to focus more on other aspects rather than the
usefulness of the experience. While the hedonic element of enjoyment has a similar role as
predictor than in the case previously analysed related to the intention to use the service, an
unexpected result regards the social element of recognition. The fact that this element does not
present a statistically significant relation with the endogenous variable is a result that differs
with other research finding (Hamari & Koivisto, 2013). A possible reason for this result is
related to the different context used for collecting data (in this case Duolingo) and for this
reason future studies should analyse the relation between the two variables, using different
contexts of gamification. The results related to social influence indicate that this aspect assumes
a pre-eminent role as predictor of intention to WOM. This finding can be explained by the fact
that a person would prefer to recommend a particular service, as Duolingo, only in the case that
the attitudes of another person about the service are positive and he or she thus assumes to meet
their expectations. The fact that the social aspect assumes such a weight over the intention to
WOM is a crucial aspect to consider in order to maximise the effort of increasing the awareness
and, consequently, enhance the existing user base. In fact, in order to increase the potential
sharing rate of a gamification experience through suggestion, the companies should implement
all those elements that facilitate social interaction, giving the possibility to the user to share
their results and receive feedbacks (Hamari & Koivisto, 2013).
From the analysis emerges, as first result, that while the hedonic benefits have similar
relations with the Intention to use and to WOM, the utilitarian aspects are better predictors of
18
the first intention, while the social motivations present a stronger positive relation with the
willingness to recommend gamification.
The intention to also investigate the element of world-of-mouth in this research is
related to the fact that in the literature review is not possible to find a study related to the
different types of benefit that affect this particular behaviour toward gamification. WOM can
assume a relevant role as an influencer of behaviour, being considered often more effective than
other marketer-controlled sources (Buttle, 1998), such as print sources (Herr et al., 1991).
Moreover, it is considered effective to raise awareness about an innovation and to secure the
decision to try it (Sheth, 1971). This can be a particularly relevant aspect for a procedure such
as gamification, which is still establishing itself as a new method for marketing and customer
engagement (Hamari et al., 2014).
The success of gamification could be affected by a low level of comprehension of how
to implement the correct aspects (Gartner, 2012). Previous studies highlight that a possible
reason for this difficulty to implement opportunely game elements is related to the fact that,
since gamification involves motivation systems, aiming to affect behaviours (Hamari &
Koivisto, 2015), a better understanding of those aspects has to be reached (Morschheuser et al.,
2016). Considering the relative novelty of the topic and the knowledge level achieved, this
research aims to bring further insights that can improve the comprehension regarding the topic,
using primary data collected from one of the most successful examples of utilisation of
gamification. A better understanding of a motivational tool such as gamification can help for a
more appropriate development of such tools, resulting in a possible reduction in the high failure
rate estimated (Burke, 2012).

19
7. Limitations and future research
Some limitations have influenced the present study, such as bias in the form of social
desirability bias, which may have risen during the study, caused by the use of self-reported
measures and the subjectivity of the answer given; another possible limitation is given by the
sample used, that even if it satisfies the requirements of representativeness previously
mentioned, could be expanded while focusing more on population segments such as people
under 18 one that was not enough represented from the sample of this research and that will
assume, in the near future, a focal role being constituted by digital native individuals that are
going to occupy a critical role as future consumers.
Considering the present analysis, further research could focus on a deeper analysis of
the roles of usefulness and recognition as predictors of intention to recommend a gamified
service, more in specific to test if the fact that those elements are not considered a significant
predictor is related to the specific context of this study. Furthermore, future works should
investigate if the intentions described, indicator of willingness to perform a particular
behaviour, will result in a concrete execution of the same. Another aspect that would be an
interesting field of study is the different effect that the new platform and technologies such as
augmented reality can have over the successful implementation of gamification.

20
References
Ajzen, I. (1991). The theory of planned behavior. Organizational Behavior and Human Decision Processes, 50(2), 179-211.
Badgeville. (2012). Gamification of Enterprise. Retrived from: http://badgeville.com/wiki/enterprise.
Barnes, J. H., Daar, A. K. & Gilbert, F. W. (1994). Number of Factors Obtained by Chance: A Situation Study. Developments In Marketing Science, 17.
Bhattacherjee, A. (2001). Understanding Information Systems Continuance An Expectation-Confirmation Model. MIS Quarterly.
Bittner, J.V. & Schipper, J. (2014). Motivational effects and age differences of gamification in product advertising. Journal of Consumer Marketing, 31(5), 391-400.
Bobko, P. & Schemmer; F. M. (1984). Eigen value shrinkage in principal component based factor analysis. Psychological Measurement, 8, 439-451.
Brigham, T.J. (2015). An Introduction to Gamification: Adding Game Elements for Engagement. Medical Reference Services Quarterly, 471-480.
Bunchball. (2010). Gamification 101: An introduction to the Use of Game Dynamics to Influence Behavior. White Paper.
Burke, B. (2012). Gamification 2020: What Is the Future of Gamification? Retrived from: https://www.gartner.com/doc/2226015/gamification--future-gamification.
Buttle, F. A. (1998). Word-of-Mouth: Understanding and Managing Referral Marketing. Journal of Strategic Marketing, 6, 241-254.
Cerny, C. A. & Kaiser, H. F. (1997). A study of a measure of sampling adequacy for factor-analytic correlation matrices. Multivariate Behavioral Research, 12(1), 43-47.
Churchill, G. A. & Peter., J. P. (1984). Research design effects on the reliability of rating scales: A meta-analysis. Journal of Marketing Research, 21(4), 360-375.
Colman, A. M., Norris, C. E & Preston, C. C. (1997). Comparing rating scales of different lenghts: Equivalence of scores from 5-point and 7-point scales. Psychological Reports, 8, 355-362.
Conejo, F. (2014). Loyalty 3.0: how to revolutionize customer and employee engagement with big data and gamification? Journal of Consumer Marketing, 31(1), 86-87.
Cook, T. D., Campbell, D. T. & Day, A. (1979). Quasi-experimentation: Design and analysis issues for field settings. Boston: Houghton Mifflin.
Cronbach, L. J. (1951). Coefficcient alpha and the itnernal structure of tests. Psychometrika, 16(3), 297-334.
Davis, F. D. (1989). Perceived usefulness, perceived ease of use, and user acceptance of information technology. MIS Quarterly, 319-340.
Day, G. S. (1971). Attitude change, media and word of mouth. Journal of Advertising Research, 11(6), 31-40.
Deci, E. L., Koestner, R., & Ryan, R. M. (1999). A meta-analytic review of experiments examining the effects of extrinsic rewards on intrinsic motivation. Psychological Bulletin, 125, 627-668.

21
Deci, E. L., & Ryan, R. M. (1985). Intrinsic motivation and self-deter-mination in human behavior. New York: Plenum.
Deci, E. L & Ryan, R. M. (2000). The "what" and "why" of goal pursuits: Human needs and the self-determination of behavior. Psychological Inquiry, 11(4), 227-268.
Deterding, S., Dixon, D., Khaled, R. & Nacke, L. (2011). From Game Design Elements to Gamefulness. Edited by New York: ACM Press. 15th International Academic MindTreck Conference. Tampere, Finland: Envisioning Future Media Environments.
Elverdam, C. & Aarseth, E. (2007). Game classification and game design construction through critical analysis. Games and Culture, 2(1), 3-22.
Gartner. (2011). Gartner says by 2015, more than 50 percent of organizations that manage innovation processes will gamify those processes. Retrived from: http://www.gartner.com/it/page.jsp?id=1629214.
George, D. & Mallery, P. (2003). SPSS for windows step by step: A sample Guide and Reference. Boston: Allyn and Bacon.
Gorusch, R.L. (1983). Factor Analysis. Hillsdale, NJ: Lawrence Erlbaum Associates.
Guliani, P. (2016). Duolingo Looks To Dominate The Mobile Education Market With New Flashcard App TinyCards. Retrived from: http://www.forbes.com/sites/parulguliani/2016/07/22/duolingo-looks-to-dominate-the-mobile-education-market-with-new-flashcard-app/#3833a81963ff.
Hamari,J.&Koivisto,J.(2013).SocialMotivationsToUseGamification:AnEmpiricalStudyOfGamifyingExercise.21stEuropeanConferenceonInformationSystemsECIS.
Hamari, J. & Koivisto, J. (2015). Why do people use gamification services? International Journal of Information Management, 35(4), 419-431.
Hamari, J. (2013). Transforming Homo Economicus into Homo Ludens: A Field Experiment on Gamification in a Utilitarian Peer-To-Peer Trading Service. Electronic Commerce Research and Applications: 12.
Hamari, J., Koivisto, J. & Sarsa, H. (2014). Does gamification work? A literature review of empirical studies on gamification. 47th Hawaii International Conference on System Sciences. Waikoloa, HI: IEEE: 3025-3034.
Harwood, T., & Garry, T. (2015). An investigation into gamification as a customer engagement experience environment", Journal of Services Marketing, Vol. 29 Iss 6/7 pp. 533 – 546.
Harzing, A. W. K & 26 collaborators. (2009). Rating versus ranking: what is the best way to reduce response and language bias in cross-national research? International Business Review, 18(4), 417-432.
Hatcher, L. A. (1994). Step-by-Step Approach to Using the SAS System for Factor Analysis and Structural Equation Modeling. Cary, N.C.: SAS Institutte, Inc.
Hern, A. (2016). Can Duolingo's chatbot teach you a foreign language? Retrived from: https://www.theguardian.com/technology/2016/oct/06/duolingo-chatbots-learning-language.
Hernandez, B., Montaner, T., Sese, F. J., & Urquizu, P. (2011). The role of social motivations in e-learning: How do they affect usage usage and success of ICT interactive tools? Computers in Human Behavior, 27(6), 2224-2232.
22
Herr, P. M., Kardes, F. R., & Kim, J. (1991). Effects of word-of-mouth and product attribute information on persuasion: an accessibility-diagnosticity perspective. Journal of Consumer Research, 17, 454-462.
Hunicke, R., LeBlanc, M., & Zubek, R. (2004). MDA: A formal approach to game design and game research. AAAI Workshop on Challenges in Game. San Jose, CA.
Huotari, K. & Hamari, J. (2012). Define Gamification-A Service Marketing Perspective. 16th International Academic MindTrek Conference. Tampere, Finland: Envisioning Future Media Environments.
Hutcheson, G. D. & Sofroniou, N. (1999). The Multivariate Social Scientist: an introduction to generalized models. Sage Publications.
Kim, S. S. & Son, J. (2009). Out of Dedication or Constraint? A Dual Model of Post-Adoption Phenomena and its Empirical test in the Context of Onlibe Services. MIS Quarterly: 49-70.
Likert, R. (1932). A technique for the measurement of attitudes. Psychology, 140, 1-55. Liyakasa, K. (2012). Game On: Gamification Strategies Motivate Customer and Employee
Behaviors - CRM Magazine .Retrived from: http://www.destinationcrm.com/Articles/Editorial/Magazine-Features/Game-On-Gamification-Strategies-Motivate-Customer-and-Employee-Behaviors-81866.aspx.
MacCallum, R. C., Widaman, K. F., Zhang, S., & Hong, S. (1999). Sample size in factor analysis. Psychological Methods, 4(1), 84-99.
Malhotra, N. & Birks, D. (2007). Marketing Research: an applied approach. London: Prentice Hall.
McCarthy, I., Kietzmann, J., Robson, K., Plangger, K., & Pitt, L. (2014). Understanding Gamification of Consumer Experiences. NA-Advances in Consumer Research, 42, 352-356.
Meloni, W. & Greuner, W. (2012). Gamification in 2012. Market Update Consumer and Enterprise Market Trends, M2 Research.
Mittal, S. (2015). Run with data on NIke+. Retrived from: https://openforum.hbs.org/challenge/understand-digital-trasformation-of-business/data/run-with-data-on-nike.
Morschheuser, B., Werder, K., Hamari, J., & Abe, J. (2016). How to gamify? A method for designing gamification. 50th Annual Hawaii International Conference on System Sciences (HICSS), Hawaii, USA, January 4-7, 2016.
Mundfrom, D. J., Shaw, D. G., & Ke, T. L. (2005). Minimum sample size recommendations for conducting factor analyses. International Journal of Testing, 5(2), 159-168.
Nunnally, J. C. (1978). Psychometric theory. New York: McGraw-Hill. Palmer, D. & Hugo, A. (2013). Tapping the strategic potential of gamification. Retrived from:
http://deloitte.wsj.com/cio/2013/05/30/tapping-the-strategic-potential-of-gamification/. Pelling, N. (2011). The (short) prehistory of "gamification". Retrived from:
https://nanodome.wordpress.com/2011/08/09/the-short-prehistory-of-gamification/. Robson, K., Plangger, K., Kietzmann, J., McCarthy, I., & Pitt, L. (2015). Is it all a game?
Understanding the principle of gamification. Business Horizons, 58,(4), 411-420.

23
Sheth, J. N. (1971). Word of mouth in low risch innovations. Journal of Advertising Research: 15-18.
Singh, S. A. & Masuku, B. M. (2014). Assumption and testing of normality for statistical analysis. American Journal of Mathematics and Mathematical Sciences, 3(1), 169-175.
Sridharan, M., Hrishikesh, A. & Raj, L. S. (2012). An academic analysis of Gamification. UX Magazine: 1-13.
Stevens, J. (1986). Applied multivariate statistics for the social sciences. Hillsdale, NJ: Lawrence Erlbaum Associates.
Sundaram, D. S., Mitra, K. & Webster, C. (1998). Word-of-Mouth Communications: a Motivational Analysis. NA-Advances in Consumer Research, 25, 527-531.
Swallow, E. (2012). How Badgeville is Gamifying the Internet. Retrived from: http://www.entrepreneur.com/article/222657.
Sweetser, P. & Wyeth, P. (2005). Gameflow: A model for evaluating player enjoyment in games. Computers in Entertainment: 1-24.
Terrill B. (2008). My Coverage of Lobby of the Social Gaming Summit. Retrived from: http://www.bretterrill.com/2008/06/my-coverage-of-lobby-of-social-gaming.html.
Van der Heijden, H. (2004). User acceptance of hedonic information systems. MIS Quarterly: 695-704.
Venkatesh, V. (1999). Creating favorable user perceptions: Exploring the role of intrinsic motivation. MIS Quarterly, 23(2), 239-260.
Venkatesh, V. (2000). Determinants of perceived easy of use: Integrating control, intrinsic motivation, and emotion into the technology acceptance mode. Information Systems Research, 11(4), 342-365.
Venkatesh, V., & Davis, F. D. (2000). A theoretical extension of the technology acceptance model: Four longitudinal field studies. Management Science, 46(2).
Webster, J. & Martocchio, J. J. (1992). Microcomputers playfulness: Development a measure with workplace implications. MIS Quarterly, 201-226.
Yamane, T. (1967). Elementary sampling theory. London: Prentice-Hall.
24
Appendix Item Adapted from Usefulness Using Duolingo makes/would make it easier for me to start
exercising. Using Duolingo enables/would enable me to accomplish more with regards to exercise. Using Duolingo is/would be useful for the purposes of the exercise. I find Duolingo useful.
Davis (1989)
Ease of use I believe that using Duolingo interfaces does not require a lot of mental effort. The interaction with Duolingo is/seems clear and understandable. I find/would find Duolingo easy to use. I find/would find it easy to get the interface of Duolingo to do what I want to do.
Davis (1989)
Enjoyment I find/would find the experience of the exercise and the related Duolingo use interesting. I find/would find the experience of the exercise and the related Duolingo use exciting. I find/would find the experience of the exercise and the related Duolingo use enjoyable. I find/would find the experience of the exercise and the related Duolingo use pleasant.
Van der Heijden (2004)
Playfulness
I find Duolingo original. I find Duolingo playful. I find Duolingo flexible. I find Duolingo creative.
Webster and Martocchio (1992)
Recognition I feel/would feel good when my achievements in Duolingo are/would be noticed. I like/would like that other Duolingo users comment or like my exercise. I like/would like that my Duolingo peers notice my exercise results It feel/would feel good to notice that other user has/would browsed my Duolingo results.
Hernandez et al (2011)
Social Influence
People who influence my attitudes would recommend Duolingo. People who I appreciate would encourage me to use Duolingo. My friends would think using Duolingo is a good idea. People who are important to me would think positively of me using Duolingo.
Ajzen (1991)
Intention to WOM
I would recommend Duolingo to my friends. I would say positive things about Duolingo to other people. I would refer my acquaintances to Duolingo. I would recommend Duolingo to anyone who seeks my advice.
Kim and Son (2009)
Intention to Use
I intend to use Duolingo in the future. It is likely that I will use Duolingo in the next months. I predict I will start to use/keep using Duolingo in the future. I find using Duolingo to be a a wise thing to do in the future.
Venkatesh and Davis (2000)
Appendix 1: Survey questions

25
Predictors β SD t p
Usefulness .326 .077 4.218 .000*Easy-of-Use .177 .065 2.732 .007*Enjoyment .194 .089 2.175 .031*Playfulness -.009 .073 -.118 .906SocialInfluence .258 .069 3.751 .000*Recognition .024 .055 .428 .699
Note:*Significanteffectwithp<.05 Appendix 2. Multiple Regression Analysis, source: IBM SPSS Statistic Predictors β SD t p
Usefulness .052 .068 .761 .448Easy-of-Use .249 .057 4.365 .000*Enjoyment .193 .078 2.467 .014*Playfulness .032 .064 .504 .615SocialInfluence .402 .060 6.661 .000*Recognition .069 .049 1.417 .158
Note:*Significanteffectwithp<.05 Appendix 3. Multiple Regression Analysis, source: IBM SPSS Statistic