motivational factors and their prioritization for gmp in nordic...
TRANSCRIPT

Motivational Factors and their Prioritization for GMP in Nordic SMEs
BACHELOR THESIS
THESIS WITHIN: Business Administration
NUMBER OF CREDITS: 15
PROGRAMME OF STUDY: International Management
AUTHORs:
Simonsson, Filip, 960110, [email protected]
Roos, Johan, 960513, [email protected]
Cuadra Azucar, Eduardo, 960912, [email protected]
TUTOR: Edwards Mark
JÖNKÖPING May 2018
i
Bachelor Thesis in Business Administration
Title: Motivational Factors and their Prioritization for GMP in Nordic SMEs
Authors: Simonsson, Filip; Roos, Johan; and Cuadra Azucar, Eduardo, Group 20
Tutor: Mark Edwards
Date: May 2018
Key terms: Green Management, SME, CSR, Green Score
Abstract
Purpose - The subject of green management and its connection to motivational factors is
relatively unexplored in existing literature, especially regarding SMEs in the Nordic Countries.
The paper aims to investigate frequencies of motivational factors as SMEs present them,
suggest the theoretical prioritization of motivational factors for green management practices,
and factors impact on different levels of green management. The reason for this is to help SMEs
to better understand what motivational factors to prioritize to further their green management
development.
Design/Method - The chosen research method of this paper is quantitative, and the empirical
data is collected through questionnaires distributed using business networks in the Nordic
Countries. Furthermore, the research takes an abductive approach, with a positivist paradigm,
and a mixture of ontological, epistemological, and method research assumption.
Findings - This paper has found that at different levels of green management practices specific
factors of motivation should theoretically be prioritized based on a regression model.
Furthermore, the suggested prioritization is different from presented by the sample of this paper.
Research Implications - Theoretically, the thesis suggests a conceptual map of existing
frameworks and the motivational factors presented. Practically, SMEs can draw from this study
to see if their prioritised motivation for implementation of green management is effective or if
they can further improve it.

ii
Acknowledgements
We would like to pay special thanks to Mark Edwards who gave us continuous support for the
development and shaping of this thesis through his expertise and knowledge of several scholars
in the field. Further, we would also like to thank Toni Duras and Oskar Eng for their
consultation and critical support regarding problematization, clarification, and interpretation of
data. Finally, we would like to extend our gratitude to Jönköping University that provided late
night access and coffee for an affordable price that got us through this challenging experience.
___________________ ___________________ ___________________
Filip Simonsson Johan Roos Eduardo Caudra Azucar
May 2018, Jönköping

iii
Abbreviations
Relevant Abbreviations Full Name
CSR Corporate Social Responsibility
SME Small- to Medium-sized Enterprises
GM Green Management
GMP Green Management Practices
GMD Green Management Development
GS Green Score
HGS High Green Score
MGS Medium Green Score
LGS Low Green Score
RBV Resource Based View
KBV Knowledge Based View
ISO
International Organisation for
Standardization

iv
Table of Contents
1 Introduction ................................................................................ 1
1.1 Problem ........................................................................................................... 3
1.2 Purpose ........................................................................................................... 4
1.3 Delimitation ..................................................................................................... 5
2. Frame of Reference ................................................................... 6
2.1 Small and Medium Sized Enterprises ......................................................... 6
2.1.1 Micro Company ............................................................................................. 6
2.1.2 Small and Medium Companies .................................................................... 7
2.2 Literature review ............................................................................................ 7
2.3 Motivational Factors .................................................................................... 10
2.3.1 Internal ........................................................................................................ 10
2.3.2 External ....................................................................................................... 11
2.4 Rational for Motivators and SMEs ............................................................. 11
2.5 Frameworks .................................................................................................. 13
2.5.1 Generic Competitive Environmental Framework ....................................... 14
2.5.2 Model of Corporate Social Responsibility Development ........................... 15
2.6 Hypothesis .................................................................................................... 17
3. Method & Methodology ........................................................... 18
3.1 Research Purpose ....................................................................................... 18
3.2 Research Approach ..................................................................................... 18
3.3 Methodology ................................................................................................. 19
3.3.1 Other Considered Methodologies............................................................... 20
3.4 Method ........................................................................................................... 21
3.4.1 Procedure .................................................................................................... 21
3.4.2 Green Score ................................................................................................ 23
3.4.3 Ethical Considerations ................................................................................ 23
3.4.4 Primary Data ............................................................................................... 23
3.4.5 Secondary Data .......................................................................................... 25
3.4.6 Credibility..................................................................................................... 25
3.4.7 Chosen Company Type to Explore in this Study ....................................... 26

v
3.4.8 Data Collection ............................................................................................ 26
3.4.9 Data and Further Analysis .......................................................................... 27
4. Empirical Findings and Analysis ............................................ 29
4.1 Descriptive Results of the Questionnaire ................................................. 29
4.2 Specific Internal and External Factors ...................................................... 33
4.2.1 Specific Internal Factors - Q.4.1 & Q.4.2 ................................................... 34
4.2.2 Specific External Factors - Q.5.1 & Q.5.2 .................................................. 37
4.2.3 No Limitations - Q.7 .................................................................................... 40
4.2.4 Summarisation of grouped answers ........................................................... 40
4.3 Inferential Results of the Questionnaire ................................................... 41
4.4 Discussion of Analysis ............................................................................... 46
5. Conclusion ............................................................................... 50
6. Discussion ............................................................................... 52
6.1 Practical Implications .................................................................................. 52
6.2 Theoretical Implications.............................................................................. 52
6.3 Critique of method ....................................................................................... 53
6.4 Limitations .................................................................................................... 53
6.5 Further research suggestions .................................................................... 53
List of References ....................................................................... 55
Appendices .................................................................................. 62

vi
Figures
Figure 1: Orsato's (2006) generic competitive environmental framework ..... 14
Figure 2: Suggested hypothesis based on the uncovered literature ............. 17
Figure 3: Distribution amongst external/internal factors of entire sample ..... 30
Figure 4: Internal factors frequency distribution ............................................. 33
Figure 5: External factors frequency distribution ............................................ 33
Figure 6: Frequency of answers where no financial limitation was implied .. 40
Figure 7: Conceptual map of theory – 7-stage model, environmental strategies,
eco-innovation, and internal/external motivational factors of GS ..... 49
Figure 8: Suggested map of the 7-stage model, environmental CSR, and social
CSR. ................................................................................................... 54
Tables
Table 1: Mean and Standard Deviation for Internal and External factors ..... 29
Table 2: Distribution of Internal and External factors across groups ............. 30
Table 3: Frequency and relative frequency of Number of Factors chosen ... 32
Table 4: Frequency of Goal Orientation across HGS, MGS, & LGS ............. 34
Table 5: Frequency of Managerial Expectation across HGS, MGS, & LGS . 35
Table 6: Frequency of Financial across HGS, MGS, & LGS ......................... 35
Table 7: Frequency of EMS across HGS, MGS, & LGS ................................ 36
Table 8: Frequency of Employee Expectation across HGS, MGS, & LGS ... 36
Table 9: Frequency of OtherIn across HGS, MGS, & LGS ........................... 37
Table 10: Frequency of Customer Demand across HGS, MGS, & LGS ....... 37
Table 11: Frequency of Supplier Relationship across HGS, MGS, & LGS ... 38
Table 12: Frequency of Legal Obligation across HGS, MGS, & LGS ........... 38
Table 13: Frequency of Shareholder Pressure across HGS, MGS, & LGS .. 39
Table 14: Frequency of Competition across HGS, MGS, & LGS .................. 39
Table 15: Frequency of OtherEx across HGS, MGS, & LGS ........................ 40
Table 16: Frequency of answers where no financial limitation was implied.. 41
Table 17: Summerized Regression model of entire sample .......................... 42
Table 18: Functions as derived from the summerized regression models .... 43
Table 19: Summerized Regression model across all groups ........................ 44

1
1 Introduction
--------------------------------------------------------------------------------------------------------------------
In this section, the background to the topic green management and its motivations among SMEs
is presented. We also identify the central problem that the research addresses. The purpose of
the thesis is presented along with the research question and delimitations.
--------------------------------------------------------------------------------------------------------------------
Green management (GM) is a concept that builds on the foundation of Corporate Social
Sustainability, more specifically the environmental sustainability aspects of Corporate Social
Responsibility (CSR). GM is a developing topic which in this thesis is defined as: The
continuous advancement and development of internal green activities within the organisation
(Toshiba, 2018; Russo & Tencati, 2008). Based on the existing literature there lacks a focus on
what motivates companies to go green, the focus has instead been put on companies that have
already achieved high levels of GM Practises (GMP). But, given the importance the Nordic
market has placed on environmental development, GM, and the high level of environmental
friendliness in the market, it is important to understand what motivates companies to go in this
direction (Greenan et al., 1997; Francisco et al., 2016). This thesis will, thus, aim to explore the
motivations for small to medium sized enterprises (SMEs) in the Nordic market to work with
GM. The focus on SMEs will be explained later, but first a summarization of the history of CSR
leading to GM.
Bowen stated the first recognized theoretical definition of corporate social responsibility back in
1953 as “the obligations of businessmen to pursue policies, to make decisions, or to follow lines
of action that are desirable in terms of the objectives and values of our society”, which can be
called the barebones of modern CSR theory. Furthermore, the concept of CSR is important to
cover since it gives the background of GMP. Therefore, this will be covered since much of the
literature tackles the same challenges in both CSR and GMP. After Bowen, the following
decades saw new definitions and additions emerging, one such came from Carroll (1999) who
analysed Bowen’s work and another from Milton Friedman who in his book Capitalism and
Freedom (1962) argues that companies should focus on their own needs and that in the long-run
this would solve the problems of society. He claimed that new needs emerging could only be
fixed by the market’s pursuit of firm goals, thus, connecting CSR to profit and the free
movement in the market. Another important part of CSR is “Stakeholder Theory” which gained
widespread acceptance in the field of research by Donaldson (1983) and Kashyap et al., (2004).
After this, economic, social and, environmental sustainability got recognized as responsibilities

2
to companies and are acknowledged as a fourth branch of CSR called philanthropy (Perrini
2006; Porter & Kramer 2006). These factors are what Friedman argued would fix themselves if
the market was set free. However, as current legislation does not cover these items they are part
of the voluntary extension of business ethics (Fassin et al. 2011; Vázquez-carrasco, & López-
pérez, 2013). Vázquez-carrasco and López-pérez (2013) also stated that Drucker’ work from
1984 found a significant correlation between CSR and opportunities in the market, productivity,
and human resources, which is perhaps one of the most modern interpretations of CSR. Another
modern view of CSR is Sustainable development which is often defined as “... to meet the needs
of the present without compromising the ability of future generations to meet their own needs”
(Keeble, 1988).
The research area of environmentally sustainable practices has caught the interest of consumers
and governments alike making it important for corporations to adapt towards environmentally
friendly practices, or as it will be referred to in this paper Green Management, to lower
corporations’ ecological footprint (Vázquez-carrasco & López-pérez, 2013). New concepts
around GM, such as corporate responsibility (Bos Brouwers, 2010; Atle Midttun, 2012), and
environmental management (Lannelongue & Gonzalez-Benito, 2013; von & Shankar, 2011) has
caused different views on the benefits of GMP. One such view is that it should cause increased
profitability due to its innovative properties (Bansal & Roth, 2000; Hosseini, 2007), another
claims its main importance is the handling of stakeholder pressure and resource management
(Alfred & Adam, 2009; Bos Brouwers, 2010; Dhull & Narwal, 2016).
GM represent one of three pillars of CSR and focuses on the environment (Kadłubek et al,.
2016). The main separation between GM and other social development concepts within
sustainability is its focus on only what enterprises do to reduce their environmental impact
(Kadłubek et al,. 2016; Lam. et al., 2011). Standards as the ISO 14001 exists to assist
companies to estimate, evaluate and improve how corporate practices affect the environment
(Poksinska, Jörn Dahlgaard, & Eklund, 2003; Dhull & Narwal, 2016). This is also an
environmental management system (EMS) which acts as guidelines on how to operate and
achieve environmental competitive advantage. “An EMS is a system designed to express goals,
the gathering of information, the measurement of progress, and the improvement of that
progress” (Florida & Davison, 2001). Many companies have seen direct increase in awareness
regarding their environmental impact by adapting this type of ISO standard (Pawliczek &
Piszczur, 2013). Observing some changes over the last 18 years it is clear that more companies
adopt the ISO 14001 approach, resulting in an 800 percent increase from the year 2000
(certifiering.nu, 2018). This shows that SMEs have moved towards a more environmental
friendly state, however what motivates this change is not known.

3
The study by Oliver Cronstam and Jacob Grönberg’s (2017) explores the relationship between
the main motivations for implementing GM in SMEs in Sweden, coming up with 6 factors of
motivation. These factors are not the only ones that will be tested, instead serving as a starting
point for the research, but further existing literature/frameworks will also be reviewed to find
further motivational factors. Additionally, even though herd behaviour exists which refers to the
“... tendency for individuals to mimic the actions (rational or irrational) of a larger group.”
(Investopedia.com, 2018) this is a different thing to saying that individuals always act in
alignment with this behaviour or make the same choices. However, it does imply that one
companies factor of motivation can and perhaps should affect another ones’ (Wilczek, 2016).
Especially between companies in regions with similar cultures, laws, and economies. Thus, the
selected location to research will be the Nordic countries as it would be more interesting than
focusing on any one country. As the Nordics countries are similar both culturally, politically,
economically, geographically, and have similar levels of sustainable practises (Robecosam,
2017) hence, they are comparable enough to be studied together. This was also the reason for
why these countries were the focus of the study. The Nordic countries are defined in this paper
as Sweden, Denmark, Norway, and Finland. Additionally, the Nordic countries is known for
having a high level of CSR (Robecosam, 2017) which suggests that findings in this area
provides a thorough understanding of how different motivational factors affect levels of GM.
1.1 Problem
Recent academic publications show a relatively small amount of literature focusing on the
connection between GM and SMEs, compared to large companies (Russo & Tencati, 2008;
Jenkins, 2004). However, this is not to say that there has been none, for example Lee (2009),
Vázquez-carrasco and López-pérez (2013), Kadłubek et al, (2016) and Hosseini (2007) are a
few publications about the connection between GM and SMEs from the last decade.
Nevertheless, there lacks a substantial focus on the relation between the two (Kadłubek et al,.
2016; Dhull & Narwal, 2016; del Brio & Junquera, 2003; Halme & Korpela, 2013; Aykol &
Leonidou, 2014). In an interview with Jordan Peterson (2017), he revealed that Thomas Huxley
once stated, “Oceans are so plentiful it was not a chance we could ever put a dent in them”.
However, he continues with “well it turns out that we did have an impact, and we were a lot
better at disrupting the oceans than we thought”. A sentiment perhaps felt by many corporations
today who are investing considerable resources in research and development to lessen their
impact on the environment. This shows the urgency of the matter but does not explain or
identify the different motivational factors to why SMEs would implement GM practices.
Besides, SMEs makes up approximately 99% percent of the European economy (See Appendix
I) (Susman, 2007; Eurostat, 2016), and understanding what makes them more environmentally

4
focused could have significant impact on the development of sustainable practices and an
overall lessened environmental impact from SMEs. A view shared by, for example, Jenkins
(2004), Lee (2009), Kerr (2006) and Juan Felipe et al. (2014). Furthermore, motivational factors
for implementing GMP for SMEs presented are often both internal and external. The internal
referring to aspects of the company such as managerial engagement, financial motives, and
employee expectation. While external are aspects outside the company as customer pressure,
supplier relationship, and laws. The problem is therefore; there is not a clear understanding of
which factors motivates the SMEs to apply GM.
1.2 Purpose
The aim is to analyse SMEs in Nordic countries that follows the ISO 14001 guidelines to gain a
better understanding to what extent different motivational factors affect them. It is important to
look at the prioritisation of factors because, i) SME’s have limited resources (Babiak &
Trendafilova, 2011; Lee, 2009) thus they could benefit from pursuing factors in a clear order
with clear priority, ii) GMP consists of different level and therefore prioritisation of
motivational factors within these stages needs to be clear to invoke development, and iii)
managers generally need to ensure economic success (Orsato, 2006), because different factors
can have varied impacts on profit.
The understanding of why and how GM can be implemented could also benefit further research
within the area of study. Since the bulk of the economy is made up of SMEs the potential
impact of identifying what makes this type of corporation interact with GM could prove useful
for decreasing the amount of environmental damage in the Nordic countries and perhaps help
further research which could be implemented globally. While this thesis does not aim at
exploring any new motivational factor(s), it will attempt to show how often different factors
occur in SMEs in the Nordic and how this can be connected to, and explained, through existing
frameworks. Further, which effect these factors may have on different levels of GM.
Consequently, our central research question is: How should different motivational factors be
prioritised in Nordic SMEs, and what effect are they suggested to have on different levels of
green management?
Answering the research question will provide an understanding of the prioritization of
motivational factors that are present for GM in SMEs in the research area. Further, a suggested
effect of these factors on Green Management Development (GMD) can be used to evaluate what
impact they may have at different levels of GM. This information can assist further research in

5
the field of SMEs and GM regarding how to transition between different levels of GM based on
the motivational factors established.
1.3 Delimitation
This paper does not conduct a quantitative study that aims to establish motivational factors for
GMP in SMEs in the Nordic countries, instead focusing on already established factors. Further,
a generalization of answers provided by the sample will be presented to represent the entire
population of SMEs in the Nordic area that the will be searched. Also, as this thesis looks at
SMEs and will exclude all other types of companies. The type of industry was not taken into
consideration, which means that companies working with oil can be measured against
consultancy businesses who do most of their work online. The reason for this is that
motivational factors established in the literature is general enough to be establish to all
industries. Another delimitation selected was to exclude Iceland even though it is usually
considered to be a part of the Nordic countries, mostly due to its distance geographically.

6
2. Frame of Reference
--------------------------------------------------------------------------------------------------------------------
This section presents the frame of reference for the thesis. The frame of reference includes
existing research within the field, for example green management theory, environmental
management systems, corporate green sustainability, and relevant frameworks. From this
information, the motivational factors will be established.
--------------------------------------------------------------------------------------------------------------------
To understand the findings of this thesis one needs to understand certain concepts which will be
explained in this section. Some frameworks such as the stakeholder theory (Donaldson &
Preston, 1995) the Generic competitive environmental framework (Orsato, 2006), and the 7-
stage model (Maon, Lindgreen and Swaen’s, 2010) will also be discussed in this section. This
section will also go over the existing and influence literature which was used to build the
theoretical framework, explaining patterns, different views, and important concepts. Also, going
over the selection criteria for articles in this thesis. But first, a short summary of how a SME is
defined.
2.1 Small and Medium Sized Enterprises
In Sweden, approximately 99% of all companies are SMEs (Svenska Näringsliv, 2018; Eurostat,
2012). In Denmark SMEs make up 99.7 percent, in Norway 99.8, and Finland 99.7 (Eurostat,
2012). The European commission defines SMEs as an enterprise with fewer than 250
employees, whose turnover does not exceed €50 million annually, and does not have access to a
balance sheet which totals a greater amount than €43 million (Official Journal L 124, 2016).
This generalization of SMEs covers a couple of different types of companies under the same
definition. The three different types of companies are; micro companies, small companies, and
medium sized companies which will be distinguished below.
2.1.1 Micro Company
If a company has an employee’s less than 10 people, and has a turnover that do not exceed €2
million, than it is a micro company (Eurostat, 2018). Micro companies will not be considered
for this thesis, as the number of employees set for this research was more than 10 employees.
This number was set to exclude the smallest of companies while still allowing small firms to be
discussed and researched. Furthermore, it makes sense that micro companies probably would
not carry out GMPs to the same extent as big companies, which also makes micro companies
less relevant.

7
2.1.2 Small and Medium Companies
A small company consists of a workforce between 11 and 50 employees, and a reported balance
sheet not exceeding €10 million (European commission, 2015). While a Medium sized company
is a corporation that per the European Union consists of a workforce between 51 and 250
employees, with a turnover not exceeding €50 million, and has a balance sheet of less than €43
million (European commission, 2015).
2.2 Literature review
The knowledge of human environmental harm is nothing new and has seen its fair share of
research. Still, it is not always clear from were certain concepts, theories, and ideas originate.
Green Management is one such concept which is difficult to pinpoint for a few reasons, as it is a
rather new concept, it does not yet have an agreed upon definition, and is being inwrought with
different concepts like corporate environmentalism, environmental management, or corporate
sustainability (Pane Haden, Oyler, & Humphreys, 2009). With this in mind there are a few
different definitions of this concept, for example; Peng and Lin (2007) defined it as
“…producing environmental friendly products and minimizing the impact through 3 constructs;
Production, RnD, and Marketing”; Shu et al. (2014) defined it as “…a firm’s systematic
managerial practices for addressing environmental issues through environmental protection and
minimizing the negative environmental impact of the firm’s products throughout their life
cycle”; and finally Pane Haden, Oyler and Humphreys (2009) defined GM as “…organization-
wide process of applying innovation to achieve sustainability, waste reduction, social
responsibility, and a competitive advantage via continuous learning and development and by
embracing environmental goals and strategies that are fully integrated with the goals and
strategies of the organization.” The last definition given was created as a comprehensive
definition which was aimed at the whole concept and not just created for a specific
interpretation for a research paper. This definition aligns with the purpose of this thesis since it
takes up both innovation, and environmental strategies that is further expanded on in the
analysis. Hence, it was considered the definition for GM in this paper.
Due to the lack of a common definition, various historical frameworks exist that can be used to
interpret and explain GM. Nattrass and Altomare (1999) divided environmental practises and
research into 4 eras from 1970 to the new millennium. The eras were called compliance, beyond
compliance, eco-efficiency, and sustainable development. Around the third era (1980) and
forward is when environmental research started to pick up with many important pieces of
literature and contribution were created in this period, like The Brundtland report: 'Our common

8
future' (Keeble, 1988), Carroll’s pyramid” (Carroll, 1991) and the “Triple bottom line” (also
known as the 3 pillars of CSR) (Elkington, 1994). While none of these discuss GM specifically
it is literature like these that paved the way for more environmental research which lead to GM.
The first time the term GM was specifically established in literature was in “Green
management: the next competitive weapon” by Stuart R. Taylor (1992). The term was used to
describe companies that go beyond regulatory requirement and have the environment as a fully
integrated part of its organization and goes on to argue the benefits of it. Articles after the turn
of the millennium quite universally use the 3 pillars of sustainability to explain GM and
sustainability, like Alfred and Adam (2009); Williamson, Lynch-Wood, and Ramsay (2006);
Sáez-Martínez, Díaz-García, and González-Moreno (2016); and Babiak and Trendafilova
(2011). GM is, thus, related with the environmental pillar of CRS and therefore CSR is relevant
for discussion. Today there are many articles discussing GM but none of which have been
particularly influential or cited which could explain how relatively unknown the concept is, and
why CSR focused research is used for certain concepts.
As the research is about the motivational factors influencing GM and it is important to look at
these factors and their themes present in the literature. The factors defined from the literature
will be covered later, instead first looking over some central themes. One theme on why
companies “go green” is stakeholder theory (Donaldson & Preston, 1995), which focuses on
keeping stakeholders content and comply with regulations (Aykol & Leonidou, 2014; Maon,
Lindgreen & Swaen, 2010; Bansal & Roth, 2000; Lee, 2009; Strand, Freeman, & Hockerts,
2014). Aykol and Leonidou (2015) looked at green practices between 1992 and 2012 and found
that Stakeholder Theory was quite prominent in comparison to other theories such as
institutional theory or the resource-based view (RBV). (Donaldson 1983; Kashyap et al., 2004).
However, working for ones’ stakeholder is not always enough for a company to be successful in
going “green”, it is also important to look at the financial side. Many companies, thus, try to
pursue environmental sustainability to achieve a competitive advantage, usually through
differentiation or better use of resources. Differentiation can be to acquire environmental
certifications or provide better and greener products or using environmental sustainability to
distinguish oneself from competitors. The better use of resources focuses on reducing waste,
unnecessary usage of resources, and being able to do more than competitors with the same
resources (Orsato, 2006; Lee, 2009; Florida & Davison, 2001). Both aforementioned themes are
grounded in the so called “Business case for CSR” which means that companies benefit from
investing in GM, though gaining or keeping customer by environmental certifications (or
Environmental Management Systems) like ISO 9001 and 14001 (Poksinska, Jörn Dahlgaard, &
Eklund, 2003), implementing an environmental management system to increase quality control
lower production cost (Kerr, 2005), and increase Public Relations (PR) and goodwill with the

9
public by strategic environmental investments and marketing (Babiak & Trendafilova, 2011).
However, there are also corporations that engage in CSR voluntarily without assuming any
benefits, nevertheless benefits are generally expected to be generated from this type of
behaviour. These initiatives can have the benefit of improving PR, employee motivation, and
attracting new customers, as in companies applying the business case for CSR. However, some
companies do not have a strategic objective in mind when engaging with CSR, like specifically
trying to increase profits instead doing it because it is the “right thing” to do (Williamson,
Lynch-Wood, & Ramsay, 2006; Metaxas & Tsavdaridou, 2010). These organizational
initiatives are usually tied to manager or owner values (Murillo & Lozano, 2006) and are much
less frequent, especially for SMEs as they tend to lack the human and financial resources that
are required for such investments (Jenkins, 2004; Arend, 2013; Babiak & Trendafilova, 2011;
Alfred & Adam, 2009; Lee, 2009; del Brío & Junquera, 2003; Halme & Korpela, 2013).
Focusing on the theme of competitive advantage through GM, literatures focus has often been
on acquiring resources and knowledge which is essential for GM and can have an extensive
impact on the competitive position of the company (Hörisch, Johnson & Schaltegger, 2014).
Much literature that addresses the implementation of GM and sustainable management do so
using the RBV (Hart, 1995; Darnall & Edwards, 2006; Zhu et al., 2008; Chakrabarty & Wang,
2012; Falkenberg & Brunsæl, 2011; Uhlaner et al., 2011; Galani et al., 2012; Torugsa et al.,
2013; cited in Hörisch, Johnson & Schaltegger, 2014). The RBV focuses on the efficient usage
of resources and argues that companies do not gain competitive advantages through important
resources and differentiation, instead through effective and efficient resource usage. The
company which can do the most with the least (Wernerfelt, 1984) has a competitive advantage
per the RBV (Barney, 1991). Further it is argued that effective resource usage is based on
innovation. The definition of innovation being carried in this paper is “the process of putting an
idea or invention into a good or service, which creates value to the consumer”
(BusinessDictionary, 2018). To be acknowledged as innovation, the idea must satisfy a need.
Innovation is an important factor for SMEs, as it can be the main difference between SMEs and
large firms in obtaining competitive advantage as the Knowledge Based View (KBV)
demonstrates (Hörisch, Johnson & Schaltegger, 2014). Meanwhile, ‘eco-innovation’ is stated as
any form of innovation aiming at significant and demonstrable progress towards the goal of
sustainable development. This is accomplished by reducing environmental impact or reaching a
more efficient and responsible use of resources (European Commission, 2015). The difference is
that innovation is focused solely on consumer value and the company economy, while eco-
innovation is the overall effect on the environment, sustainability, consumer, and other external
parties as well. Realizing the impacts of eco-innovation, the European commission created the
“Eco-innovation Action Plan” for Europe 2020 strategy, with the goal to reduce the pressure on

10
the environment through innovation (EuropeanComission, 2011 as cited in Triguero, Moreno-
Mondéjar, & Davia, 2014). The innovation triangle model (van Dijken et al. 1999) illustrates
business competencies, environmental orientation, and network involvement as main
determinants of eco-innovation. Therefore, eco-innovation and the KBV is an important part of
developing green strategies. Companies with green strategies can go through different factors
aiming for competitive advantage (Beaver & Prince, 2002), however, they should combine all
the company’s approaches in relation to the environment. The strategic planning process must
be able to address factors such as environmental risk, customers, the environment, regulation,
etc.
2.3 Motivational Factors
The terminology describing these factors are not always the same as the terminology chosen
from the original source, for instance “customer demand” can be denoted as “customer wants”,
“need of customers” etc. For example, Stuart R. Taylor (1992) mentioned “market opportunity”
as an argument for GM, here this is a mix between goal orientation and competition. Those are
different from market opportunity; however, this was the only time this specific motivational
factor was used, and its contents is arguably aligned with goal orientation and to a certain extent
competition. There are too many different motivators mentioned in the literature to use
everyone, however the following list of motivators were the ones used and selected. There were
five internal factors Goal Orientation, Managerial Expectation, Financial, EMS, and Employee
Expectation, followed by five external factors Customer Demand, Supplier Relationship, Legal
Obligations, Shareholder Pressure, and Competition.
2.3.1 Internal
Goal Orientation (H1): The primary goals of the company are related to lower the
environmental impact. Sometimes these can come to be involved with the mission/vision of the
company, and hence being a part of the corporate culture (Cronstam & Grönberg, 2017; Strand,
Freeman, & Hockerts, 2014; Gjølberg, 2010; Reyes-Rodríguez, Ulhøi, & Madsen, 2014;
Robecosam, 2017).
Managerial Expectation (H2): The value that managers put on a lowered environmental impact.
As a stakeholder in the company managers has an interest in how standards such as GM should
be upheld (Nulkar, 2014).
Financial (H3): The focus on improving green practices to increase profits. Usually done
through either differentiation or striving for lower costs through better resources usage and less
waste. The company is motivated to strive for better sustainably because of financial reasons.

11
(Orsato, 2006; Jenkins, 2004; Arend, 2013; Babiak & Trendafilova, 2011; Alfred & Adam,
2009; Lee, 2009; del Brío & Junquera, 2003; Halme & Korpela, 2013).
EMS (H4): Increase performance by utilising practices that protect both the employees and the
environment. The motivator is aimed at implementing GM standards (Triguero, Moreno-
Mondéjar, & Davia, 2014; Nulkar, 2014).
Employee Expectation (H5): The value that employees put on a company when it comes to
lowered environmental impact. Employee pressuring the company to become “greener” and be
less harmful for the environment. (Donaldson & Preston, 1995; Nulkar, 2014; Aykol &
Leonidou, 2014; Maon, Lindgreen and Swaen’s, 2010; Bansal & Roth, 2000; Lee, 2009; Strand,
Freeman, & Hockerts, 2014)
2.3.2 External
Customer Demand (H7): The performance that customers demand of a company when it comes
to lowered environmental impact. (Donaldson & Preston, 1995; Nulkar, 2014; Aykol &
Leonidou, 2014; Maon, Lindgreen & Swaen, 2010; Bansal & Roth, 2000; Lee, 2009; Strand,
Freeman, & Hockerts, 2014)
Supplier Relationship (H8): The performance that suppliers demand of a company when it
comes to lowered environmental impact, to keep doing business with set SME. (Donaldson &
Preston, 1995; (Aykol & Leonidou, 2014; Maon, Lindgreen & Swaen, 2010; Bansal & Roth,
2000; Lee, 2009; Strand, Freeman, & Hockerts, 2014)
Legal Obligations (H9): Regulation changes are the main reason for why the company engages
with environmental-friendly practices. (Donaldson & Preston, 1995; Nulkar, 2014; Aykol &
Leonidou, 2014; Maon, Lindgreen & Swaen, 2010; Bansal && Roth, 2000; Lee, 2009; Strand,
Freeman, & Hockerts, 2014)
Shareholder Pressure (H10): The performance that shareholders demand of a company when it
comes to lowered environmental impact. (Nulkar, 2014; Donaldson & Preston, 1995; Aykol &
Leonidou, 2014; Maon, Lindgreen & Swaen, 2010; Bansal & Roth, 2000; Lee, 2009; Strand,
Freeman, & Hockerts, 2014)
Competition (H11): Engaging with GMP because the competition is doing so. Trying to make
sure that another firm does not gain a competitive advantage. (Barney, 1991)
2.4 Rational for Motivators and SMEs
These motivational factors are often brought up in the literature, yet, it is not common for
articles to discuss which is most important or how they believe facts should be prioritised.
Certain authors have theories of different levels of environmental friendliness like Osrato (2006)

12
but it is not discussed what specifically motivates companies beyond cost savings and
differentiation. Therefore, it is interesting to look at the prioritisation of the factors and how
companies “should” prioritise their motivation.
Research on SMEs in contrast to large corporations is not as common as, for instance, RBV or
stakeholder theory in the reviewed literature, but it is still important to discuss due to the larger
impact that SMEs have on the environment. There is a consensus between researchers that most
of research on CSR and environmental sustainability focus on large companies and overlook
SMEs (Reyes-Rodríguez, Ulhøi, & Madsen, 2014; Jenkins, 2004; Jamali, Zanhour &
Keshishian, 2008). A surprising fact considering that micro and small firms account for 93% of
companies in Europe (Russo & Tencati, 2008) and SMEs in total represent 99,8% of European
corporations, accounting for 70% of worldwide production (Kerr, 2005). So, while individual
SMEs are smaller than large corporation the sum of these firms holds a massive majority on the
market and are still a minority in research. Heledd Jenkins (2004) stated “Conventional CSR
theory is based on the myth that large companies are the norm […] that SMEs are ‘little big
companies’ and that conventional CSR theory can simply be scaled down to ‘fit’ SMEs.”
Jenkins goes on explaining that this is not always the case (SMEs for example often receives
less public pressure as they are less visible, usually operate in B2B markets and tend not have
images and brands to protect) and that SMEs could benefit from having their own research and
theories, a view that Preuss and Perschke (2009) agrees with. This sentiment enhanced by the
fact that 86% of UK SME managers said “... they were not harming the environment ...” while
SMEs in the UK caused 60% of commercial waste, 70% of pollution, 60% of carbon dioxide
emissions and 80% of pollution incidents (Williamson, Lynch-Wood, & Ramsay, 2006). Thus,
while there has been research on CSR and GM it might not always be adaptable to SMEs and it
could be beneficial for research to focus on SMEs in conjunction with GM in the future.
The effects of environmental regulations also show contrasting views in studied literature.
Environmental regulations are laws and standards for how corporations work with regards to the
environment (e.g pollution laws and material bans). Although just about all the reviewed articles
agree that laws and regulation make corporations more environmentally friendly and are a
useful tool for moving companies in the “right direction” there were different views on the
impact of these regulations. Some argued that regulations can be good for SMEs as they force
innovation, promote beyond compliance (to better deal with future regulation), and can help
create first mover advantages and competitive advantages (von Weltzien, Høivik, & Shankar,
2011; Triguero, Moreno-Mondéjar, & Davia, 2014; del Brío & Junquera, 2003). Others argue
the damaging effect regulations can have on SMEs, forcing them to spend resources on
technology, certifications or similar that could have instead been spent on operations and

13
creating profit. Thus, putting them in a worse position compared to large companies which have
more resources to spend complying with the regulations (Williamson, Lynch-Wood, & Ramsay,
2006; Jenkins, 2004; Kerr, 2005). These articles believe that regulations promote CSR but feel
that governments should incentivise becoming more environmentally friendly rather than
forcing it (e.g favourable taxes and government grants).
The Nordic countries are, obviously, also important when discussing Nordic GMP. This is not
present in all literature studied but it is critical to the subject and specific searched was made to
gain extra knowledge on the Nordic CSR. All reviewed articles discussing Nordic countries
agreed that corporations in this area have a high base level of CSR and GM performance in
comparison to the rest of Europe (Strand, Freeman, & Hockerts, 2014; Gjølberg, 2010; Reyes-
Rodríguez, Ulhøi, & Madsen, 2014; Strand, Freeman, & Hockerts, 2014; Robecosam, 2017)
with different idea as to how this high level of CSR came about. Strand, Freeman, & Hockerts
(2013) stated that stakeholder engagement was the biggest contributor to CSR and that through
this, the focus on creating shared value gave these companies what they refer to as
“Scandinavian cooperative advantage’’. This follows the idea of the business case for CSR, but
with the twist of the focus being on cooperation rather than the more common: competition.
Gjølberg (2010) instead believing that the largest influence for CSR was governmental
regulations and the political system of the more socialistic countries of northern Europe. The
‘real’ reason for why Nordic CSR is prominent is probably based on an immeasurable number
of different factors playing a role.
2.5 Frameworks
The following frameworks were selected as they focus on green and sustainability management.
Orsato’s (2006) framework is the main theoretical position in this thesis as it identifies the
company’s position and strategy on GMP and help analyse their actions: Orstato’s Generic
competitive environmental framework influenced by Porter’s (1980;1985;1996) generic
strategies. The company chooses a strategy based on their goals and values. Through the
findings of the questionnaire it can be possible to see where the respondents are situated in their
strategies. The second framework used is Maon, Lindgreen and Swaen’s (2010) Consolidative
Model of CSR Development framework. The reason for including the framework was that it
brought managerial perspective, contributed a descriptive basis which managers and stakeholder
may use to assess where their company stands in the CSR development process, and help to
better understand the findings from the questionnaire, as it illustrates the different stages of
reaching CSR, GM stance from the respondents. Also, the model notably acknowledges the
strategic nature of CSR development and brings up that a stakeholder culture that naturally
conditions the company’s responsiveness to social concerns and prompts or limits CSR

14
development (Maon, Lindgreen and Swaen’s, 2010). It provides an understanding for CSR
development and highlights the importance of the company’s growth from an unsupportive, to
supportive, CSR culture through applying policies and programmes.
2.5.1 Generic Competitive Environmental Framework
Companies constantly consider how to achieve competitive advantage through different means,
and Porter (1980;1985;1996) proposed three generic strategies (i.e cost leadership,
differentiation, and focus). A company can choose one of the strategies that best relate to their
company’s value and industry structure. Esty and Winston (2009) argue based on their internal
and external analysis that a strategic position should be selected for the company. Thus, a
company can apply either a lower cost compared to their competitors through environmental
enhanced processes or, to differentiate on environmental objectives and performance. The
differentiation and focus strategy aim with determining consumers that the company wishes to
serve and acknowledge the value proposition that the company can offer based on green
differentiation. If there is not a growing or large consumer segment, these strategies can be hard
to implement. Thus, SMEs can choose based on two principles, the certainty of the outcomes
and the tangibility of results (Nulkar, 2014). Orsato (2006) proposed that cross tabulating the
strategy of differentiation and cost leadership with Internal processes or products could bring up
in four strategies (Figure 1).
Figure 1: Orsato's (2006) generic competitive environmental framework
To explain the strategy SMEs can go for eco-efficiency as a strategy. This will serve to handle
their priorities and focus on the desired change (e.g lowering process costs). There are different
ways for SMEs to advance organizational processes. Such ways are, hire services of
environment consulting, or EMS implementation. The competitive advantage, in this case, can

15
stem from a system of extended and regular improvements in this area, assisting companies to
stay ahead of their competitors. In short, this should lower costs. SMEs find it difficult to
implement the strategy of differentiation through ‘Beyond compliance leadership’ and Eco-
Branding (Osrato 2006 cited in Nulkar, 2014). As this requires an innovative approach towards
products and processes, along with rethinking the company’s value chain. After SMEs, have
gone through eco-efficiency and the other stages, they can go on adapting environmental cost
leadership. For this strategy, SMEs want to design new products for the environment, in
addition to modify current products, achieving this strategy can keep competitive advantage.
This framework assists to better understand where the respondents currently stand with their
green strategies and management and was used to analyse the findings.
2.5.2 Model of Corporate Social Responsibility Development
The seven-stage model of CSR development by Maon, Lindgreen and Swaen’s (2010) revolves
around three cultural phases (i.e reluctance, grasp, and embedment) and it focuses mainly on
underlying rationales for key dimensions in CSR development. Also, it openly emphasizes the
connection between the CSR development stages and Clarkson’s (1995) conceptualization of
corporate postures towards social responsiveness, hence explicitly acknowledges the strategic
nature of CSR development (Maon, Lindgreen and Swaen’s, 2010). Additionally, this model
highlight that CSR development involve a profound integration and comprehension of the moral
and cultural evolution, which CSR demands. This assumption branches from the idea of
organizational culture, where the context within which companies operationalize and design
their strategies and policies and strive considerable importance on the company’s CSR
development (Berger et al. 2007). Thus, this model varies notably from current CSR
development models. It highlights the importance of the company’s growth from an
unsupportive to supportive CSR culture through applying CSR policies and programmes (Maon,
Lindgreen and Swaen’s, 2010). Furthermore, by addressing the continuous integration and
recognition of social concern, conveyed by both external and internal stakeholders, into the
company’s strategy and decision-making processes; the model in a way connects the degree to
which a company understands and considers stakeholders demands. That is, the morally based
stakeholder culture of the company Jones, Felps and Bigley (2007) and Clarkson’s (1995)
conceptualization of corporate strategies of social responsiveness. At a moral and cultural
stance, Maon, Lindgreen and Swaen’s (2010) argue that the CSR developmental path moves
through three main phases: CSR cultural reluctance phase, when CSR gets ignored or
considered only in terms of constraints; CSR cultural grasp phase, during which organizations
become familiar with CSR principles; and CSR cultural embedment phase, when the
organizational culture fully embraces morally based CSR. The three broad CSR cultural phases

16
further encompass distinct phase (i.e 7 stages in total), which are characterized by distinctive
strategic and organizational features (See Appendix II).
Firstly, in relation to the consolidative model, the reluctance phase, where the company neglect
its own social and environmental impact and contests stakeholders’ demands that might
constrain its activities, despite strong criticisms from its external environment and encompasses
only the (1) dismissing stage. At this stage, the company adopts a black-box posture towards its
external environment, and relationships with stakeholders are purely contractual.
Secondly, the cultural grasp phase, where the awareness to CSR issues grow, and
acknowledgement of CSR concepts and rationale progressively develop. Therefore, CSR over
time appears more as a value protector and this includes stages 2, 3 and 4. The (2) self-
protecting, means there is no real CSR objective and companies do not actually take CSR issues
into account other than as a constraint on their usual business processes or as extra activities,
such as philanthropic initiatives. The (3) compliance-seeking stage, when the company focuses
on compliance with growing regulatory frameworks, while also striving to meet minimum
industry standards, mainly related to the employment and production sides of its activities.
Lastly, the (4) capability-seeking stage; this implies that the company has developed some skills
in managing CSR fundamentals, derived from its practice and familiarity with CSR-related
issues. Awareness of CSR issues and the reputational risks associated with neglecting these
issues increase.
Thirdly, the cultural embedment phase, where companies expand their CSR-related knowledge,
deepen their key stakeholders’ relationships, and prepare their internal resources to address CSR
related demands from their environment proactively; and CSR is a possible value creator. This
phase consists of the following stages: The (5) caring stage, when CSR initiatives go above
conformity and short-term profit-driven aspirations, top management acknowledges that CSR
issues establish a long-term challenge that the company cannot handle just through compliance,
public relations strategies, or isolated profitable opportunities. Top management instead
becomes refined to the potential for long-term improvements, business-wide opportunities, and
benefits of coherent CSR programmes. The (6) strategizing stage, when the company actions
goes above community expectations and finds opportunities to achieve social, environmental,
and economic benefits at the same time; thus, its quest for CSR becomes value driven. In this
sustainability mindset, CSR is the predominant objective of all corporate activities. Lastly, the
(7) transforming stage, when the company goes beyond its traditional business model and fully
integrates CSR principles into every aspect of the company and its activities. The company
adopts fully transparent postures and aims to diffuse its CSR management expertise (Maon,
Lindgreen and Swaen’s, 2010)

17
2.6 Hypothesis
From this literature, the 12 hypotheses were developed to be tested by the study as presented by
Figure 2 given a set level of GM. Since the motivators are generally seen as something
generating a positive development towards GM, the null hypothesis will be stating that all the
factors should yield positive results given any level of current GMP as presented by the
literature.
Figure 2: Suggested hypothesis based on the uncovered literature

18
3. Method & Methodology
--------------------------------------------------------------------------------------------------------------------
This section explains the choice of research philosophy and approach. The process of gathering
data and analysing empirical findings will also be outlined.
--------------------------------------------------------------------------------------------------------------------
3.1 Research Purpose
This research was carried out to find the main motivational factors for why SMEs should apply
GMP. Since SMEs makes up more than 99% of the economies in the Nordic countries and stand
for approximately 70% of the pollution nationally, these factors can become crucial in the
minimization of environmental damage in the future. Variety in performance of SMEs, research
approach, and technological advancement affects the outcome of these factors greatly. The
method was presented in such a way that it aimed to be replicable, and presented rationale for
why questions, structures, and assumptions was made, together with collection process and
approach of analysis. The method presents how the questionnaire was formed, executed, and
supposed to be analysed. This study followed a positivist paradigm, to allow an evaluation of
the validity and reliability of the research given an epistemological assumption, to gain an
understanding of truth in the conclusions. Furthermore, given an ontological research
assumption a statistical analysis based on coding due to method research assumption was
applied (Collis & Hussey, 2014). Subjectivism and critical paradigms can be argued to be
applicable to the research since it observes socially perceived factors. However, whilst this issue
was recognized, a positivist paradigm was used to gain a satisfactory conclusion that did not
change as much through changing circumstance. Nevertheless, a rhetorical research assumption
was deemed to be unavoidable to uphold, due to personal bias in distribution, collection, and
interpretation of data. To combat this notion, SMEs from different business/event networks
were chosen, but inevitably there was a form of bias whilst researching (e.g CSR Småland
contains mainly Swedish SMEs). Hence, the method was carried out with a positivist paradigm
and a mixture of ontological, epistemological, and methodological based assumptions to
compliment the purpose of the research.
3.2 Research Approach
The study started off with a deductive approach, observing frequencies of factors to test the
theory assumptions regarding how often factors occur and thus how they are prioritised.
Furthermore, 12 hypotheses were generated for testing the suggested correlation of the factors
and levels of GMP to see if there were a significant deviate from existing theory. However, the

19
relationship between different frameworks and the factors were estimated beforehand based on
the literature. Therefore, a deductive approach was most appropriate for the study, but an
inductive approach was also utilized to suggest a combination of the deductive findings with
existing theory. Therefore, the questionnaire was conducted with a focus on deductive approach
but utilized inductive elements in the interpretations of the findings. However, this does not
mean that the deducted hypotheses were ‘set in stone’ before starting the data collection, but
rather it granted the freedom of retrospectively formulating interpretations of the data. Such a
mixture of inductive and deductive approach is called an abductive approach. It implies a
pragmatic perspective on data, tackling the weaknesses of inductive (lack of empirical support),
and deductive (lack of clarity in interpretation of theory) (Saunders, Lewis, & Thornhill, 2014;
Bryman & Bell, 2003).
3.3 Methodology
A quantitative study was chosen as it best reflected the type of answers that were searched for.
Examples of answers that were hard to compile in a quantitative manner were “If there were no
financial limitations, what would you like to implement to improve the Green Management
practices of the company?”, and “What are the main external motivators for implementation of
Green Management practices in your company? (You can choose several)”. Therefore, such
questions were grouped and coded to be interpreted by “Statistical Package for the Social
Sciences” (SPSS) and Excel. Control questions were added, to get an estimation about the GMP
from the responding SMEs, such as “Where would you place your company’s impact on the
environment?” where a scale from 1-7 was presented. The platform used for the quantitative
study was “Google Forms”. The website lets you send out questionnaires’ through an URL
which intended to increase the reply frequencies, simultaneously as it lets the user compile and
analyse the data directly through Google Forms. Also, as the site allowed for instant access to
the data, in real time, to be analysed.
The methodology chosen was survey method through a questionnaire. This quantitative
approach aimed to get an understanding of what the motivational factors for SMEs in the Nordic
countries that operate in accordance with the ISO 14001 standards are, and how these may be
prioritised. Since ‘motivational factors’ can be a relatively sensitive subject, the participant was
kept anonymous so that they were not directly relate to their answers of motivation and
ambition. They were kept anonymous for the safeguarding of their opinion and answers, this
was also the case to increase answer frequency. This structured and semi-broad method was
done with just SMEs in the Nordic countries that follows the ISO standards as criteria. The
downside with this approach was that the generated point-estimators could over- or
underestimate their representative population parameters (different countries might provide

20
more answers when estimating an average for the entire Nordic area), and thus a specific
country may be a larger influencer than others. However, the greater the number of participants,
the lesser the over- or underestimation by the point-estimators becomes (Collis & Hussey,
2014). To consider “normal distribution” the assumption of normality (David et al., 2015;
Mordkoff, 2016) was applied. Therefore, to uphold statistical significance, more than 100
answers were aimed at (Mordkoff, 2016). A self-selected method based on networks were
pursued giving the overall population of SMEs in the Nordic countries being ‘n’ and the
selected population being ‘N’ which make up a fair representation of the sampled population
(Dacid R. Andersson et al., 2015). However, it must be recognised that a bias of selecting
Swedish SMEs had a high probability of being applied due to the team being stationed in
Sweden and using Swedish business networks, even if the intent was to select a diverse sample.
Furthermore, precautions such as finding lists of SMEs online instead of regionally was applied
to try and reduce the influencing biased on the selection. Therefore, due to the utilization of
different business networks it was impossible to establish a “true” population for the study.
The nature of questions followed the four criteria for parametric analyses tests: Measured on a
ratio/interval scale, the data gathered was normally distributed, with homogeneity of variance
and independent data values in the variables. Every question could be treated as a variable and
due to the central limit theorem, the data was normally distributed with a large enough amount
of observations. This gave the data gathered the desired characteristics to easily convert it into
usable information.
3.3.1 Other Considered Methodologies
Interviews: To cover the research needed interviews were also considered. Semi-structured,
open-ended questions would have been used, since it was believed to produce the best outcome.
Qualitative data, such as interviews, provide an interpretivist paradigm, which allows for
analysing the data gathered through a hypothetical construct approach (due to feelings and bias
approaches by the interviewees’). The interviews would have a fixed focus given the individual
face-to-face nature and could give research debt (Collis & Hussey, 2014). However, the
problem with this approach would be the ‘slow’ nature of acquiring the data. After
consideration, interviews were deemed undesirable as the target interviewee being managers in
different countries and companies, which increased the difficulty of identification (of specific
EMS restricted companies), contact (language barriers), and their availability (after email
contact with potential interviewees). This methodology started off as a complementary approach
to the questionnaire but dismissed it due to the reasons mentioned.
Diary method: A considerable amount of time would be needed to get the participants to
understand what to write to give a good empirical base for the research, and to get results of

21
significance. Questionnaires could be argued to fill the same need but being able to be
conducted during a shorter period. Whilst data might not be as in-depth, frequencies of factors
were still able to be measured.
Focus groups: The utilization of focus groups was not desirable in this case. Whilst, groups
could have helped to shape an understanding of what was meant by different individuals
answers it would also give rise to conformity biased behaviour of a group as mentioned by
Linda Tuhiwai Smith (2012) “... people always live in some form of social organization
[...] Western forms of research also draw on cultural ideas about the human 'self and the
relationship between the individual and the groups to which he or she may belong.” which
refers to the idea of belonging and hence increased confirmation biased behaviour, which is
avoided by an individual survey approach. In addition, it is implausible to ask the targeted
managers to all make time for a focus group, due to their schedules potentially not aligning,
creating further restraint for exercising this methodology. Therefore, questionnaires were
preferred, since they handle a ‘delicate’ and ‘sensitive’ matter and helped to guide the
participant through it individually.
The survey method provided a wide range of perspectives on motivation which strengthen the
analysis of the collected data. Hence, it can be understood that (1) if there were any factors of
motivation that occurred more often in relation to different levels of GM, and (2) extrapolate the
necessary regression information for establish functions to observe the suggested relationship
between internal/external factors and different levels of GM.
3.4 Method
During this part, the exact creation, distribution, and intended analysis for the questionnaire is
presented. The aim of this part is to make sure that the study can be replicated, following the
reasoning carried over from methodology given the chosen research approach.
3.4.1 Procedure
The method that was conducted was a survey. The survey consisted of a questionnaire. The
questionnaire was developed by looking at the established research assumptions (ontological,
epistemology, and method), to ensure that questions were formulated in alignment with the
purpose. Drafts of different questions were made in a brainstorming session, selected, and
applied to the questionnaire. Approximately 900 questionnaires were sent out, and the response
rate was 13%. To gain an understanding of how to formulate the questions, and what questions
to ask, pervious questionnaires and literature in the field was reviewed. Since the motivational
factors identified by the previous researchers were ‘general’ it was decided to expand the
population to all the Nordic countries (Sweden, Denmark, Norway, and Finland). The rationale

22
for why expand to all of the Nordic countries instead of restricting the research to Sweden when
conducting the questionnaire was due to several reasons that reduces generalization: (1) Similar
technological, culture and political levels/views (Halme & Korpela, 2013), (2) Potentially
gaining a broader perspective based on geographical difference, (3) The opportunity for a
greater spread of the sample representing a greater final population (Anderson, et al., 2015), and
(4) all of the countries share similar representations of the proportions of SMEs in their
economies approximately 99.7% - 99.8% (Eurostat, 2012). “... all the Nordic governments
consistently use the traditional tripartite structure in their CSR initiatives [...] all Nordic
governments have chosen tripartite representation in their National Contact Points for the
OECD guidelines, a structure that few other governments have chosen. Furthermore, bodies like
MONIKA, KOMpakt, and Globalt Ansvar have tripartite representation, and [...] refer to the
extensive consultation with trade unions and employers’ associations as being vital to their CSR
policy processes” (Midttun, A. et al., 2015). As Midttun et al. (2015), Halme and Korpela
(2013), Anderson et al. (2015), and Eurostat (2012) mentions the unified perspective on CSR,
together with similar social structures, and an almost identical representation of SMEs in the
economies, makes for a natural extension of the physical area research, hence increasing the
population. However, to find the target population given the restraints of SMEs which applied
ISO 14001 standards and operated in the Nordic countries “certifiering.nu” which contains
company status on several standards, as the ISO 14001, and localised company and SME
networks, such as Science Park, was utilized. With the population identified the questionnaire
were distributed through Google Forms. The distribution was made with unproportionate
systematic distribution as the greater amount was distributed at an earlier time, and later
decreased in distribution size over the course of two months. The first questionnaires were sent
February 15th, 2018 and around 450 were sent out at this point, here there was an equal split
among SMEs from the four chosen countries. However, during the continuous distribution the
amount and frequency decreased when satisfactory amounts of answers were obtained. The last
Questionnaires was sent out April 5th, 2018, at which point there had been over 100 replies
(114 answers were obtained in total, presented in Empirical Findings). Another application that
was utilized, to help implementation in SPSS and Excel, when analysing and displaying the
empirical findings was the “Create spreadsheet” function on “Google Form” which displays
quantitative answers as charts and lists of qualitative answers (‘other’ category of
questionnaire). Since the spreadsheet function worked in conjunction with Excel there were a
smooth transition at gaining an understanding of the scale of data collected and helped with
setting up the data for coding.

23
3.4.2 Green Score
During the study the participants answered questions 1, 2, 3, and 6 which indicated, based on
each question, the SMEs GMP. These answers could not be directly correlated to the SMEs
GMP, since that would mean one individuals answer represent the entire company creating
generalization issues of an established concept, and hence the research the term Green Score
(GS) was created. GS is meant to represent the indication of GMP. Question 1, 2, 3, and 6 were
delegated a score from 0 (low perceived GMP) to 5 (high perceived GMP) based on
interpretation of GMP indication of the answer (See Appendix X). This score was then summed
for each case, establishing a score for each SME (or “case” as it will be referred to in the
analysis) of minimum 0 and maximum 20. Based on this scoring system the respondents were
grouped: 20-16 was “High Green Score” (HGS), 15-11 was “Middle Green Score” (MGS), and
10-0 was “Low Green Score” (LGS). This term established the dependent variable as GS in
relation to the motivational factors for the multiple regression tests to suggest a relationship
between factors, and their prioritization at different levels of GMP. The main limitation of this
term is that it cannot indicate the maximum or minimum GMP, but rather a suggestion to if the
GMP is high or low, based on aggregated GS for a given SME of the study. GS was used to test
how frequencies of different motivational factors (independent variables) affected GS at
different levels of GM, to establish which factors to prioritize.
3.4.3 Ethical Considerations
During the collection of data, the distinction was made to conduct the questionnaire
anonymously. It was explicitly said in the introduction of the questionnaire that all information
would “be treated confidentially”, and that “This survey is for research purposes only”.
Furthermore, to protect participants from feeling like they needed to provide sensitive
information, even though confidentiality was implied, the alternative “I do not want to disclose
this information” was then added as protection of sensitive data (Appendix IX). This discretion
towards the partaker also had a second purpose of making them fulfil the entire questionnaire
instead of dropping it half way due to insecurity of informatorily distribution.
3.4.4 Primary Data
The handling of primary data followed the definition of Collis and Hussey, “Data generated
from an original source [Questionnaires]” (2014). The conducted anonymous questionnaires
consisted of seven questions providing both multiple choice answers, and short-, to long-text
answers. Below the questions will be presented in conjunction with the motivation as to why it
was included in the questionnaire, the purpose it filled, and how this information was utilized
proceeding to the analysis and conclusion.
24
The information (questions and answers) that will be presented in this paragraph can be found in
Appendix IX. Q.1 was asked to gain an estimation of a company’s GS. Similarly, Q.2 was
created to see consistency in the participant's response behaviour. If in Q.1 they had answered
‘Regularly’ and in Q.2 a ‘4’ that would provide context in how this company was responding.
Q.3 had the purpose of providing the mind-set of how SMEs tackled long-term vs. Short-term
perspectives of CSR since this could influence what motivators were chosen. Q.4 and Q.5 were
split into two different sections since a short motivational text for the alternative ‘other’ was
provided in a sub-question following the main question. Q.4.1 where the internal factors as
proposed were presented together with ‘other’ if participants did not believe that their motivator
was represented. Similarly, Q.5.1 displays the external motivational factors, together with
‘other’ for the same reason. These were presented both as variables of interest to see if the
‘established’ motivators gained favour, and the literature reviews support these motivators. In
both Q.4.2 and Q.5.2 a short text alternative was presented to (1) make the participant able to
write down a short text for the motivator(s), and (2) to give additional context to what
perspective the participant had on GM. For instance, if an additional motivator was ‘faster cars’
then that person had perhaps misunderstood the questionnaire, whilst if the participant wrote
‘more eco-friendly cars’ then the purpose of the question was understood. Q.6 this question was
posed later in the survey but serves the same purpose as Q.1 and Q.2 in the sense that it is the
participants understanding of GMPs in the company, in comparison to what they might have
stated previously. The last question, Q.7 had the purpose of ‘tricking’ the participant to present
(an) additional motivator(s). The free text structure, and the imaginative gesture of ‘no strings
attached’, provided the actor with the freedom of stating their optimal green implementation.
The answer given was treated as a motivator that would be appreciated to be obtained.
In short Q.1, Q.2, Q.3, and Q.6 presented useful information providing context to how the actor
viewed GMP and set company relation, and an estimation of GS aggregation, whilst easing in
the participant with convergent and personal ‘light’ questions that relied on their opinion rather
than facts. On the other hand, Q.4, Q.5, and Q.7 provided the partaker with factual, evaluate,
and divergent questions that can seem ‘heavy’ for some participants, but provided the necessary
information on which the study relied on. Due to the ‘light’ and ‘heavy’ types of questions, and
their distribution, the aim was to keep actors alert and focused during the entire questionnaire.
Q.1, Q.2, Q.3, Q.4.1, Q.5.1, and Q.6 were required to answer to submit the questionnaire, whilst
Q.4.2, Q.5.2, and Q.7 were optional. The latter group of questions being the ones where
personal motivation on behalf of the partaker was needed.
The questions were coded and applied in the statistical analysis of multiple regression analysis
by the utilization of the program SPSS. Due to the pre-emptive grouping of the different

25
questions, it was easier to deduct an understanding of the context regarding answers given by
people of different interpretation of GMP. For instance, if a tendency was shown towards the
‘Financial’ factor, then was it equally represented by the people who believed that they had a
rather low impact on the environment or based on the ones that believed that they had a rather
high impact. Since this research is based on the methodological research approach, the results
were based on their validity and reliability. Hence, this step was deemed necessary to support
that reasoning, as well as the ontological research assumption of one true conclusion and
representation of the population.
3.4.5 Secondary Data
The handling of secondary data followed the definition of Collis and Hussey, “Data collected
from an existing source [Articles]” (2014). Different governmental bodies were primarily
accessed to find stored data on SMEs, but also to gain insight in what types of environmental
standards the different Nordic countries publicly supported. An example of this is Eurostat that
is governed by the European Union and keeps track on EMSs such as ISO 14001, definitions of
company sizes such as micro-, small-, and medium-sized enterprises, and national statistics of
SME proportions of the economy. Some webpages were used to confirm that the SMEs did
apply to the standards looked for, such as Certifiering.nu. Secondary data in this field was
scares to come by, and hence most of the strengthening of the primary data were based on the
literature review rather than additional secondary data.
3.4.6 Credibility
The argument can be made that the subject is partially ethnography due to social connection to
CSR. However, this notion was disregarded by the fact that the empirical findings provides new
validation for the field and hence does not fall under assumed social knowledge, and that the
focus of the methodology was to gain an understanding of the company and not the managers.
Nevertheless, the connection to ethnography was still present due to the observation of the
participant’s perception of GMP during the study. Whilst a positivist paradigm was used to the
quantitative method, the team understands the interpretivist paradigm under an ontological
assumption meaning the idea of “multiple realities” and hence different outcomes was
prominent in the study due to the spread of the sample answers. Even though avoided, by
applying a quantitative method and gain as broad a picture as possible, it cannot be helped
seeing the possible change of the results if another sample was chosen due to the answer spread
as suggested by the R-square in empirical findings. If the amount was increased with a factor of
ten with equal or similar results, then the positivist paradigm under ontological assumption
would not be an issue. The way data was collected to make sure that it fulfils its purpose, and
what evaluates its reliability, is through distributing the questionnaire amongst a wide array of

26
SMEs and industries. This it to make sure that a wide sample was selected. Hence, different
diverse business networks were utilized to make sure that the reach was as extensive as
possible.
To ensure the that the research method was presented and utilized in a valid manner, three
precautions were made: (1) The questionnaire was presented to, and criticized by, both the
supervisor of the thesis, and peer researchers as a pilot before distribution to SMEs began.
Based on this pilot technical terminology were exchanged to ensure that the purpose of the
questions was clear. (2) The entirety of the thesis was thoroughly examined, with focus on the
introduction, analysis, and conclusion, before completion to ensure that there were a cohesive
and connected rational. This notion also included the proofing of key calculations presented in
empirical findings and analysis. This was done to make sure that the research made sense for
SMEs with the accuracy of motivational factors. (3) Articles were taken from two different
databases to try and avoid personal confirmation bias by the nature of the researcher’s searches.
3.4.7 Chosen Company Type to Explore in this Study
Small and Medium types of companies will be the focus for this thesis for a few reasons. The
first is that they are numerous enough to provide useful data but also large enough that they
could have some form of environmental plan implemented already, which would make their
answers more relevant. Another reason for this focus is that there is a lack of research on SMEs
compared to larger companies when it comes to GM, which makes looking at SMEs more
interesting. Apart from size and location, the type of company is not important for this research,
which means that both companies working with oil and other industries that are perceived to be
environmentally harming will be paired with, for example, consultancy firms who do all their
business online. Excluding or selecting specific industries seemed insufficient since a lowered
pool of companies (restrictions to an industry) would do a worse job of explaining the whole
market, than the selected sample. What should be mentioned, is that during the selection and
finding process databases like “Allabolag”, “Business Source Premier” and “Retriever business”
was used which may have certain restrictions and biases that is unknown to the research team.
Yet, without such databases finding different businesses would have been almost impossible
with the resources and time allocated for conducting this study.
3.4.8 Data Collection
The data collection was made in stages. First, for finding the literature the website Google
Scholar was used for most of the searches, in combination with the Jönköping University Online
Library. There were originally a few main limitations used, an article would need to be from
after 2000, be focusing on SMEs and/or CSR/GM and be focused on Nordic. However, this did

27
not yield all the theoretically backing that was looked for, and thus the search requirements were
expanded to exclude less literature which could be relevant. However, these restrictions were
loosened to, for example, allow the inclusion of older influential articles, e.i “Carrol’s pyramid”
and “Stakeholder theory”, and articles discussing GM for SMEs in other geographic location.
Using criteria and search terms as Implementation of green management, CSR, SME, Green
management, and, Nordic SMEs and CSR, more relevant literature were revealed. The selection
process then used a combination of subject “relevance” and “amount of citations”, however,
these factors were most often occurred mutually exclusively of one another in the literature. One
reason for this is perhaps that CSR research has been primarily focused on lager companies
(Jenkins, 2004) so finding influential articles that were not focused just on CSR but also on
SMEs were difficult, still 14 years after the publication of the article. Thus, while citations
played a role in the selection and evaluation of the articles the contents relevance was ultimately
deemed the deciding factor. Most articles reviewed ranged from around 300 to 500 citations,
except for the older articles which usually had a few thousand. Another exception is “Why
companies go green: A model of ecological responsiveness” by Bansal and Roth (2000) which
was increasingly relevant to the subject of motivating factors for GM and had been cited more
than 3000 times. However, the focus of this article was not explicitly on Nordic countries. A
few other reviewed articles like Murillo and Lozano (2006), Babiak and Trendafilova (2011),
and Orsato (2006) also lacked focus on the Nordic countries, however the content was
significant enough to be included. On the other hand, there are articles like “Corporate
environmental sustainability in Danish SMEs…” by Reyes-Rodríguez, Ulhøi, and Madsen
(2014) which ticks all the boxes except amount of citations, having only 16, but is relevant
enough. While an article like Lee (2009) had far more citations and a similar subject it focused
on Korean SMEs and are thus less relevant and less “good” than Reyes-Rodríguez, Ulhøi, and
Madsen (2014). Similarly, Gjølberg (2010) is also relevant, but to a lesser extent as it does not
discuss SMEs. In short, to evaluate how good different articles were subject relevance was by
far the most important, with citations as a second priority.
3.4.9 Data and Further Analysis
The collected data was compiled in stages. Firstly, the Google Forms automatically summarized
the data into either lists, or charts. After this initial summarisation, the data was processed in
Excel to double check the charts validity. With the charts validated, a systematic comparison
between the uncovered theory presented by the frameworks (Orsato, and Maon), the
presentation of identified motivators from the literature review (internal and external), and the
empirical findings of the questionnaire was conducted. The program SPSS was used to interpret
the findings though computing multiple regression analysis. Therefore, the questionnaire

28
answers were quantified by coding for SPSS to interpret both the quantitative and qualitative
answers produced (Collis & Hussey, 2014). Important to mention is that the questionnaire was
made without pre-coding. This was due to qualitative answers needed to be quantified manually
before processing. This would lead to a categorization of the codes relating to motivators and
their factors, as identified from the collected data. Since this was the case, coding of the entire
questionnaire was done post collection. Furthermore, Google Forms keeps track of quantitative
answers through charts, decreasing the error of post coding. This aligns with the positivist
paradigm and the methodological research assumption, due to the deductive approach and the
generalisation of the population that is believed to lead to conclusions, further understanding,
and a comprehensive interpretation/discussion of the findings. Furthermore, several multiple
regression analyses on the data were conducted to estimate theoretical prioritization of factors.
Interpretations were based on the relation that independent variables had with the dependent
variable in form of a function derived from the coefficient table (See Appendix XI-XVIII).
Functions followed the mathematical structure of Y = C + ß1X1 + ß 2X2 … + ß NXN, where Y is
the dependant variable (GS), ß is the correlation between the independent variable (motivational
factor) and GS, and C is the intercept of the y-axis. This presented the ability to observe the
proposed correlation between factors frequencies and how green a company was. This was used
to illustrate which factors of motivation should be prioritized at different levels of GM, and to
check if these were the same as in the sample (if established frequencies based on the sample,
follows the theoretical prioritization suggested by the regression).

29
4. Empirical Findings and Analysis
--------------------------------------------------------------------------------------------------------------------
In this section, the collected empirical data is presented. The empirical findings start with the
descriptive findings of the questionnaire, and then moves on to the inferential findings. This
section will also analyse how the presented factors affect green management. Furthermore, the
frequency of these factors is analysed in relation to SMEs. The analysis is based on the
empirical findings and supported by the frame of reference.
--------------------------------------------------------------------------------------------------------------------
4.1 Descriptive Results of the Questionnaire
Here different frequencies of internal and external factors will be presented in relation to levels
of GS (HGS/MGS/LGS) that represents generalized GMP. The scoring interval of GS is 20-0
with 20-16 being HGS, 15-11 MGS, and 10-0 LGS. HGS contained 67 companies, MGS 26,
and LGS 21 with a total of 114 responses. The GS had a mean of 14.94, with a standard
deviation of 4.553 when viewing the entire sample (Table 1). Breaking up the sample, the mean
and standard deviation for HGS were 17.96 and 1.32, for MGS were 13.92 and 1.16, and LGS
were 6.65 and 2.11 respectively. Observing the mean of the internal and external factors the
entire sample scored similarly, with LGS having a lower mean in both. This means that the
average number of factors chosen were lower in this groups. Hence, there is a relationship
between LGS and a low number of motivational factors, in comparison to the other groups.
Further, HGS had a slightly higher representation of internal factors, contra MGS that had a
slightly higher representation of external factors.
Table 1: Mean and Standard Deviation for Internal and External factors

30
Since the research question is related to the prioritisation and frequency of which the
motivational factors appear in SMEs, it is important to see the overall distribution of internal
versus external factors of the sample. 243 internal factors were selected, and 228 external
factors in total (Figure 3). The 4% difference between the two shows a suggested preference for
internal. However, the difference is not deemed to be insignificant, and hence the sample is
going to be interpreted to be evenly split amongst internal/external factors.
Figure 3: Distribution amongst external/internal factors of entire sample
There were a similar distribution of internal and external factors following the groupings in
HGS, MGS, and LGS. Non-of the groups displayed a significant difference comparison to one
another (Table 2). However, as will be presented later, the factors chosen within internal and
external differs among the groups.
Table 2: Distribution of Internal and External factors across groups
Furthermore, from Table 1, the internal and external factors were mainly chosen in pairs as
presented in the mean for both factors across all 3 groups and shows a similar distribution. The
relationship between factors chosen and the allocated GS seems indecisive from this
observation, as will be discussed further later. LGS had the lowest frequency of total factors
with the greatest spread (standard deviation), which suggests that a lower count of factors
amounts for a lower GS (Table 3). Turning the focus to how many factors were chosen per

31
questionnaire it can be observed that the dominant frequency is 2, 4, & 5 making up
approximately 3/4 (72.81%) of all the answers (Table 2). Which further confirms the standard
deviation observation, that most participants selected approximately 2 factors for each, internal
and external. In the table, at least one factor is placed in each of the categories, and then the
further factors are distributed. Hence, it is important to look at the internal and external factors’
frequencies separately. The most frequent combination of internal motivational factors was 2,
with a relative frequency of 37.72% (Figure 4). The most frequent combination of external
motivational factors was also 2, with a relative frequency of 36.84% (Figure 5). Since 73.68%
of the total responses had more than one external and one internal motivator selected, this
suggests that SMEs GM focus is made up of at least two different internal/external factors of
motivation at any given level of GS. From a Pearson correlation between GS of the answers of
each group, and the number of factors chosen by these participants, HGS got -0.065, MGS got
0.004, and LGS got -0.186. There was no statistically significant correlation between the
number of factors chosen and the GS for any given group. The numbers suggest that, for
example, if an SME with a HGS choose any given factor at random this they would decrease
their GS. Hence, it is important to look at prioritization of factors for specific levels of GM,
rather than motivational factors in general and just their frequency. This will be further
elaborated in the regression analysis.

32
Table 3: Frequency and relative frequency of Number of Factors chosen
For internal factors “Financial” was the most frequently chosen motivator (27%). Disregarding
the “Other” alternative which needed further motivation on the partakers part, the rest of the
internal factors seems to be similar in their frequencies (Figure 4). Hence, “Financial” should
have a greater effect on the GS than for instance EMS when observing the sample, as it is
chosen more often. This is further discussed in the discussion of the analysis. What is interesting
to see at this stage, is that Gurudas Nulkar (2014) argues that EMS should have a greater impact
on Green Strategies than financial. It could be the case that participants assumed financial
efficiency to be part of EMS explaining this shift. Because SMEs tend to not have as much
resources and thus feel that they need to focus on financial rather than another factor, explaining
the prioritization of “Financial”.

33
Figure 4: Internal factors frequency distribution
When looking at the total amounts of external factors chosen Customer Demand (25%),
Supplier Relationship (22%), and Legal (22%) are close in proximity to each other with all
standing for roughly ¼ of the selected factors respectively. Disregarding the “Other” alternative
again, Competition was the lowest in representation with 8% (Figure 5). Since customers and
suppliers are arguably two of the most important stakeholders for a business, in accordance with
the stakeholder theory (Donaldson & Preston, 1995) Furthermore, as Legal is being interpret as
unions or governmental bodies, it makes sense that these 3 are the main movers for
implementation of green practices. This is in accordance with stakeholder theory since these are
also all-important stakeholders for SMEs. Moreover, satisfied stakeholders be intangible assets
(since they are not the company’s property), which can lead to the development of a competitive
advantage for the SME if they indulge in green practices. This could be why “competition” has
the lowest representation, because Customer Demand, Supplier Relationship, and Legal
Obligations are connected to the stakeholders and hence competitive advantage by the RBV
(Barney, 1991).
Figure 5: External factors frequency distribution
4.2 Specific Internal and External Factors
To evaluate the relationship between specific factors and groups, the compiled data for the
external and internal factors are presented in the following two sections based on how many of

34
the participants chose a certain factor. This is important to analyse, to see how frequency of
individual factors occur in different groups, and to which extent they are prioritised. For the
specific Internal factors see Appendix III and IV, and for External factors see Appendix V and
VI for further information.
4.2.1 Specific Internal Factors - Q.4.1 & Q.4.2
Goal Orientation: Of the 114 participants, 40 (35,09%) chose goal orientation. When observing
the groups, HGS had the greatest representation of the factor, and it was more than twice as
represented to LGS that had the lowest amount of goal orientation (Table 4). This can be related
to the fact that SMEs which deems themselves to be highly green combine GM goals with their
company’s mission/vision to gain “Beyond compliance leadership” and “Eco-branding”
(Orsato, 2006).
Table 4: Frequency of Goal Orientation across HGS, MGS, & LGS
Managerial Engagement: In total 36 (31,58%) of the participants chose Managerial
Engagement. When observing the groups, LGS together with MGS had the greatest
representation of the factor whilst retaining a similar rate of representation, and HGS had the
lowest (Table 5). This distribution of responsibility can be argued to be caused due to the lack
of a centralized vision incorporating GM. Hence, companies that were aggregated a low score,
might leave the GM aspect to individual managers, while HGS should already have
implemented it as part of the business vision (Preuss & Perschke, 2009; Williamson, Lynch-
Wood, and Ramsay, 2006). Furthermore, the low representation at HGS could be due to the
company internalizing managerial motivation for green behaviour. Furthermore, it is not viewed
as a separate motivator, but rather as a part of their sustainable goal orientation for all
employees.

35
Table 5: Frequency of Managerial Expectation across HGS, MGS, & LGS
Financial: The frequency of which “Financial” were prioritised was the highest both
considering amount, and representation, of the different groups in comparison to the other
internal factors. In total 61 (53,51%) choose financial. When observing the groups, HGS had the
greatest representation of the factor (58,21%), and MGS and LGS had a similar representation
only differing 1,47% in relation to each other (Table 6). Due to the, generally, competitive
environment that SMEs face because of resource scarcity and small size, it seems logical that
financial is the natural focus of why a GMP should be pursued: Profit, and Competitive
Advantage. This can further be connected to goal orientation as well, since the profitability
aspect is a large influencer on the different environmental strategies and efficiency (Orsato,
2006).
Table 6: Frequency of Financial across HGS, MGS, & LGS
EMS: 32 (28,07%) in total selected EMS. When observing the groups, HGS had the greatest
representation of the factor, and LGS had the lowest (Table 7). The skewed relationship towards
a higher GS suggests that to get a higher GS SMEs needs to focus on this motivational factor in
relation to their GM. However, since less than ⅓ of HGS chose it this finding is not conclusive.
The low representation of EMS could be due to that managers sees EMS as a financial
incentive, rather than a green incentive, and selected “Financial” instead of EMS. This would
also suggest the high representation of “Financial”. This would align with Orsato’s (2006)

36
framework that argues that profitability and green strategies are intertwined. It could also be
because some view adopting an EMS as a large investment, hence discouraging them from
adopting it.
Table 7: Frequency of EMS across HGS, MGS, & LGS
Employee Expectation: Of the 114 participants 39 (34,21%) stated Employee Expectation.
When observing the groups, MGS had the greatest representation of the factor, HGS and LGS
had a similar representation (Table 8). This increased focus on the factor during the transition
between MGS and HGS is most likely based on changing the employee’s perception and green
expectation of the company. Since the factors aims to improve GMD, and it occurs most often
at MGS, the prioritization of employee expectation at this stage therefore could mean that the
company ‘push’ to become an HGS SME.
Table 8: Frequency of Employee Expectation across HGS, MGS, & LGS
Other Internal Factors: This category had the lowest amount of answers 20 (17,54%), probably
due to the responder needing to motivate the answer. HGS had the greatest representation of the
factor (13), and LGS and MGS had similar representation. Of the choices 10 (50%) were
grouped as innovation, 4 (20%) as technology, and 5 (25%) as ‘other choices’ (Table 9). Further
discussed in Summarisation of Grouped Answers.

37
Table 9: Frequency of OtherIn across HGS, MGS, & LGS
4.2.2 Specific External Factors - Q.5.1 & Q.5.2
Customer: Customer Demand had the highest amount of representation in comparison to the
other external factors 61 (53,51%). The group with the highest interest in this factor was HGS
and MGS separated by a 5% representation, but both having a qualified majority of its
representation based on this factor. LGS had the lowest representation of less than ⅓ of the
representation of HGS (Table 10). This distribution shows that a LGS SME has no intention of
catering to customer’s perception of how important GM is. However, (1) to implement other
factors for increased GM betters the customer perception (Nulkar, 2014), and (2) it becomes
more important for a company to keep this bettered customer perception to keep their
competitive advantage at higher levels of GMP if a satisfied customer is an intangible asset to
the company (Barney, 1991).
Table 10: Frequency of Customer Demand across HGS, MGS, & LGS
Supplier: In total 54 (47,37%) chose supplier, with MGS being the highest representation, and
HGS and LGS on similar levels (Table 11). What this distribution presents, is that supplier is a
stronger motivator when a company is deeming themselves to be in a transition period between
LGS to HGS. The reason for this, could be to prove to suppliers that they uphold a certain green
sustainability standard, or that more green suppliers are being considered as partners.
Nevertheless, all groups have a high representation of this factor, which shows that it is an

38
important factor no matter the level of GS. Since suppliers is one of the stakeholders, it follows
the same reasoning as consumer demand and employee expectation.
Table 11: Frequency of Supplier Relationship across HGS, MGS, & LGS
Legal: 53 (46,49%) stated this aspect as important. This factor was, somewhat unsurprisingly,
the one with the largest LGS amount (11) and representation (52,38%). However, both HGS and
MGS follows closely within a 10% deviation (Table 12). Since LGS occupies the highest
frequency it can be argued that companies with a LGS are motivated to peruse in green
behaviour based on laws and regulations. Whilst, HGS are more proactive rather than reactive to
governmental regulations. Hence, it is argued that HGS view GM to obtain benefit, while LGS
try to avoid punishment (Nulkar, 2014; Donaldson & Preston, 1995). Furthermore, since SMEs
stands for up to 75% of the Nordic economies pollution, it is argued that all SMEs no matter
score, should incorporate this factor as a pre-emptive GM motivator in anticipation of future
regulations.
Table 12: Frequency of Legal Obligation across HGS, MGS, & LGS
Shareholder: 31 (27,19%) of the sample chose Shareholder. The highest representation was
MGS near HGS (Table 13). It is observed that the low total representation of this factor suggests
that the shareholder theory by Milton Friedman (1962) does not hold since it is not the greatest
represented factor. However, shareholders do get more important the greener a company is. This
is probably due to potential shareholder activism, and empirical trends showing that GM should

39
be kept in business development focus (Aykol & Leonidou, 2014; Maon, Lindgreen & Swaen,
2010; Bansal & Roth, 2000; Lee, 2009; Strand, Freeman, & Hockerts, 2014).
Table 13: Frequency of Shareholder Pressure across HGS, MGS, & LGS
Competition: When viewing different groups, they had a similar representation to the entire
sample 30 (26,32%), with HGS 26,87% and MGS 26,92% being within a 0,6% of the
representation, with only a marginal difference for LGS at 23,81% (Table 14). Hence, the
frequency of Competition, in isolation, has a low effect on sustainability on different levels of
GM. The reason for this distribution could be that no matter the level of GM (Orsato, 2006),
competition is similarly constant and determined by other factors in the company’s
environment.
Table 14: Frequency of Competition across HGS, MGS, & LGS
Other External: Other were the least represented factor with a total amount of 14, LGS had 3
(14,29%) and HGS had 9 (13,43%) which provided the greatest representation, and MGS had 2
(7,69%), being the lowest (Table 15). This was probably due to that the partaker needed to
motivate why the answer was chosen, as in Q.4.2. Of those who chose this option, 6 (42,86%)
were grouped as innovation based, 3 (20%) as political, and 2 (25%) as other choices (Table
15). Further discussed in Summarisation of Grouped Answers.

40
Table 15: Frequency of OtherEx across HGS, MGS, & LGS
4.2.3 No Limitations - Q.7
Total amount of answers for Q.7 were 22 (19.30%). All answers provided were motivated in
text by the responder and then grouped by the team. The answers were grouped as “Innovation”,
“Technology”, or “Other Choices” e.g. Innovation: less waste in the supply chain process,
Technology: electric cars, recyclable cranes, lamps that never run out, Other Choices: we would
like to relocate to an eco-friendlier local. Of the answered, 8 were grouped as innovation, 10 as
technology, and 4 as other. Of the answers to this question HGS provided 12 answers, MGS 8,
and LGS 0 (Figure 6; See Appendix VII). Further discussed in Summarisation of Grouped
Answers.
Figure 6: Frequency of answers where no financial limitation was implied
4.2.4 Summarisation of grouped answers
Compiling all the grouped alternatives provided by Q.4.2, Q.5.2, and Q.7 a great frequency of
innovation as a motivator for GM implementation was observed. In innovation HGS had the
greatest representation across all questions. Hence, the HGS frequency of innovation shows that
it influences the GM level. If a company states that they use innovation as a motivator for GM,
they are almost 3 times as likely to be a HGS then MGS/LGS. However, Technology, Political,
and Other Choices does not show the same relationship in their frequencies. Hence, the priority

41
of those motivational factors cannot be deemed to indicate GM levels based on the sample
(Table 16).
Table 16: Frequency of answers where no financial limitation was implied
The findings present that the frequency of motivational factors is 52% internal and 48%
external. The relative frequency of internal factors was 27% Financial, 17% Employee
Expectation, 17% Goal Orientation, 16% Managerial Engagement, 14% EMS, and 9% Other.
The relative frequency of external factors was 25% Customer Demand, 22% Supplier
Relationship, 22% Legal Obligations, 13% Shareholder Pressure, 12% Competition, and 6%
Other. This would suggest that there is no clear prioritization between internal and external
factors. However, Financial is prioritised based on the entire sample for the internal factors, and
Customer Demand, closely followed by Supplier Relationship and Legal Obligations for
external factors. HGS follows this suggested prioritization of factors for both Internal and
external whilst MGS and LGS follows it for internal, but only Customer Demand and Supplier
Relationship for external.
4.3 Inferential Results of the Questionnaire
A series of regression analysis will be presented in this section. The main purpose of this
regression analysis is to observe the proposed relationship between the motivational factors
priority and the aggregated GS. A multiple regression analysis has been conducted to illustrate a
suggested effect that a factor may have on GS based on the entire sample, and specific
groupings, in relation to other factors. This approach can help to identify the prioritization of
factors, based on which factors are most relevant to pursue at a certain stage of GM. In the
following table (17) the data has been presented in such a way that the positive effect has a
negative relationship to the independent variables. Hence, the closer a variable moves the
dependent variable to 1, and away from 3, the greater its effect on GS. Since, the HGS is
denoted as a 1, MGS as 2, and LGS as 3. For specific information regarding the SPSS output
see Appendices XI-XVIII.

42
Table 17: Summerized Regression model of entire sample
The first test estimated the relationship between the three groups and the internal factors. By
this method the correlation R-Square became 0.057. This R-Square should mean that there is
almost no correlation between the motivational factors and GS, however this is due to the lack
of control variables in the test and that all independent variables are of interest in the test.
However, this approach presents a relationship between all the internal factors individually in
relation to the groups as can be seen in Table 18. When applying the same method to the
external factors, it provided a R-square of 0.101 which is higher, and a relationship between the
three groups and the external factors as can be seen in Table 18.

43
Table 18: Functions as derived from the summerized regression models
The table above suggests that no matter what level of GS proficiency, a SME in the Nordic
countries should favour Goal Orientation and EMS as internal factors of motivation, and
Customer Demand as external factor of motivation in relation to the pursuit of a higher level of
GM, when observing the entire sample. Nevertheless, due to the lack of control variables it is
uncertain if there exists any significant correlation. However, to answer the RQ these factors
must be observed in their respective groups.
To gain an understanding of the relationship between internal and external factors within the
different groups, regressions was made for each individual group. In these tests the data was
presented in such a way, that the positive effect has a positive relationship to the independent
variables. Hence, the closer a variable moves the dependent variable to 20/15/10, and away
from 16/11/0, the higher the GS. Since, the HGS is denoted as 20-16, MGS as 15-11, and LGS
as 10-0. These factors show the effect they have on GS at different levels of GM.
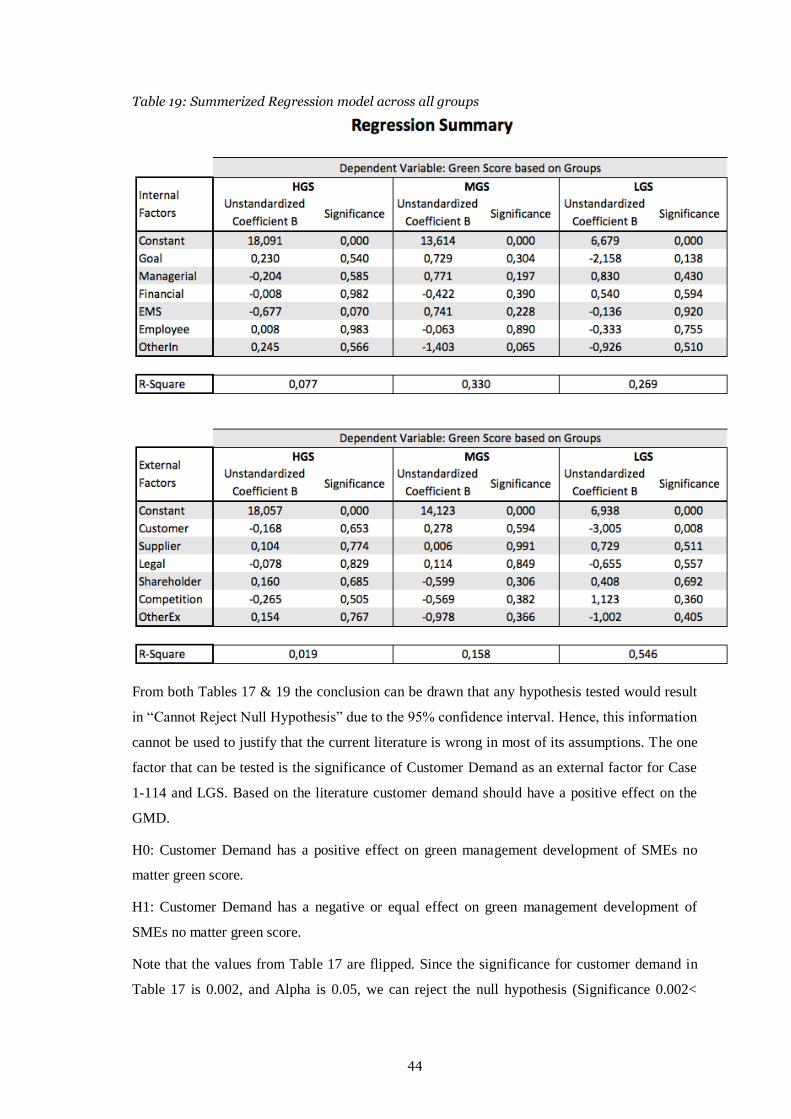
44
Table 19: Summerized Regression model across all groups
From both Tables 17 & 19 the conclusion can be drawn that any hypothesis tested would result
in “Cannot Reject Null Hypothesis” due to the 95% confidence interval. Hence, this information
cannot be used to justify that the current literature is wrong in most of its assumptions. The one
factor that can be tested is the significance of Customer Demand as an external factor for Case
1-114 and LGS. Based on the literature customer demand should have a positive effect on the
GMD.
H0: Customer Demand has a positive effect on green management development of SMEs no
matter green score.
H1: Customer Demand has a negative or equal effect on green management development of
SMEs no matter green score.
Note that the values from Table 17 are flipped. Since the significance for customer demand in
Table 17 is 0.002, and Alpha is 0.05, we can reject the null hypothesis (Significance 0.002<
45
Alpha 0.05). Testing for LGS (Significance 0.008< Alpha 0.05) shows that Customer Demand
has a negative or equal relationship on GMD of SMEs with a GS of 10-0. For MGS
(Significance 0.595> Alpha 0.05) it has a positive relationship. For HGS (Significance 0.653 >
Alpha 0.05) the null hypothesis cannot be rejected, however the coefficient -0.168 can be
observed suggesting that this hypothesis should not hold for HGS based on the study. Since the
study had only a marginal impact on the hypothesis testing it will not be the focus of the
analysis, instead the summarized hypothesis testing is provided in Appendix VIII and the
further analysis will be based on the suggested correlation of factors to GS. Since the hypothesis
yielded low impact results, we will instead focus on the suggested theoretical correlation
between the motivational factors and established GS as presented by the multiple regression
analysis.
Further functions of motional factors can be extract from the table, based on specific GS groups.
The Unstandardized Coefficient B represents the impact a motivational factor has on the GS.
These slopes suggest what motivational factors to focus on, at different level of GS, to
increase/decrease GS. For instance, to increase from LGS to MGS it is proposed that
Competition should drive the external motivation, and Managerial the internal. Whilst to go
from MGS to HGS, focus should be on Customer for external, and a mixture of Goal
Orientation, Managerial, and EMS for internal. Further, to increase within the HGS group a
company should focus on Supplier and Shareholder for external, and Goal Orientation for
internal. Another factor that is presented with a high impact within the HGS group is OtherIn,
and OtherEx. What can be seen by this, is that the ‘conventional’ factors for why to pursue GM
as presented by the literature should already be implemented at HGS, and that other motivators
such as innovation, new technology, or in general new initiatives becomes more important. This
behaviour is partially supported by the innovation triangle (van Dijken K. et al., 1999) which
states that the market leader should be the one that focuses the most on eco-innovation in
comparison to competition. If Orsato (2006) is combined with this assumption it can be said that
the market leaders and follower positions are also the ones that has achieved the beyond
compliance leadership and eco-branding of the competitive environmental framework since they
are based on differentiation. Hence, what makes a company transcend the later stages of Orsatos
framework (dictated by differentiation) is suggested to be based on a factor of eco-innovation.
Another observation that can be made is that the external factors effect on the GS gets lower as
a company transcend the groups. Whilst on the other hand, internal factors affect gets greater.
This aligns with Maon, Lindgreen and Swaen’s (2010) that presents a seven-step model on
organisations CSR stages. According to this model external factors are the most influential
during stages (1) dismissing, (2) self-protecting, and (3) compliance-seeking. The behaviour of

46
these stages corresponds to the LGS group from the sample, where external factors had the
greatest effect on GS. Furthermore, MGS are defined as fitting for (4) capability-seeking and (5)
caring even though these are not within the same cultural phase. In MGS internal factors takes
prominence over the external factors, a trend that follows in HGS that corresponds to (6)
strategizing and (7) transforming according to the study. Previously mentioned “Other” had the
greatest impact whilst in HGS which corresponds to the innovative nature of both going beyond
community expectations and transforming the company’s business model towards a sustainable
one, which is also the second and third stage of the competitive environmental framework
(Orsato, 2006). This is with the interpretation that the seven-step model is presented as different
levels of sustainability along all its steps, and non-being unsustainable, and that Orsato’s
frameworks differentiation variable is based on eco-innovation as presented by Dijken.
4.4 Discussion of Analysis
The suggested effect of the factors for the entire sample (Case 1-114) were presented in relation
to a scale from 1-3, with 1 being high GM, and 3 being low GM. However, observing specific
the different groups the factors were presented in relation to a scale from 0-20, with 20 being
HGS, and 0 being LGS. The effect of the internal and external factors is presented in Table 18.
Further, external factors of motivation were found at lower levels of GS and internal factor of
motivation at higher levels of GS. This supports other scholars’ interpretation of the field such
as Moan (2010), and Orsato (2006).
When observing the sample, the frequency of factors does not seem to have any correlation to
the effect on GM (neither positive nor negative). For instance, for the internal factors, Goal
Orientation, showed a larger correlation on determining GM (-0.286) than Financial (-0.178).
Even though, Financial occurred at greater frequency (61), in comparison to all the other
internal factors (40-20). Similarly, for the external factors, Shareholder had a greater correlation
(-0.121), in comparison to Legal (-0.027). Even though, Legal occurred at a frequency of 53, in
comparison to the Shareholder frequency of 31. However, Customer Demand had the largest
impact on GS, and the largest representation of external factors. This would suggest, that there
is no clear relationship between how often motivational factors were selected in relation GS, but
instead factors should be weighted differently. Hence, on a general level the Shareholder factor
is suggested to be worth more in comparison to legal, despite this factor being chosen more
often since Shareholder is more correlated to GS. This is further observed in the specific GS
groups, for example, in HGS the internal factor Managerial Engagement (-0.204) was chosen
less often, 19 times, than employee expectation (0.008) that was chosen 22 times; however,
Managerial Engagement still had a greater impact on GS. For the external factors Legal (-
0.078), that was chosen 31 times, and Supplier Relationship (0.104), that was chosen 29 times,

47
had a similar representation but different impacts, one being positive and the other negative.
This can be observed in all the groups, based on the sample. There was no relation between
factor frequencies and its correlation on GM. However, a prioritization is suggested from the
regression analysis based on specific levels of GM. Factors with a high correlation based on a
specific group should be prioritized to increase GS. Nevertheless, this prioritization is based on
the correlation to GS, and not the frequencies to how they were selected. For example, EMS has
a high correlation with MGS, and thus should have been prioritized by SMEs, but it was not
when observing frequencies from the sample. A suggested effect is presented in the regression
analysis, but how this would vary based on different factor amounts are indecisive.
Observed in descriptive information (frequencies) SMEs have at least two different
internal/external factors of motivation at any given level of GS. This is supported by the
inferential information that suggests that focus for (1) HGS is [Internal] Goal Orientation and
OtherIn, and [External] Supplier Relationship, Shareholder Pressure, and OtherEx; (2) MGS is
[Internal] Goal Orientation, Managerial Engagement, and EMS, and [External] Customer
Demand, and Legal; (3) LGS is [Internal] Managerial Engagement, and Financial, and
[External] Supplier Relationship, Shareholder Pressure, and Competition. These factors are
suggested to have the greatest impact on GS based on which group a SME is in. LGS groups
prioritise external factors, since they are suggested to weigh more in comparison to internal. The
opposite is true for HGS that prioritise internal factors, since they are suggested to weigh more
based on the sample. This information, together with information previously presented, claims
that factors affecting the GS of a SME is based on its current level. External factors are
priorities first and then internal factors when moving from LGS to MGS to HGS, this is also
shown in Maon, Lindgreen and Swaen’s 7 stage framework. It is argued that Orsato’s first
strategy eco-efficiency exists somewhere between Maon, Lindgreen and Swaen’s stage 1-5 and
that the following two stages (6-7) corresponds to Orsato’s following two stages, and with Koos
van Dijken et al.’s assumption of eco-innovation. The transition between strategies two and
three in Orstato’s framework occur due to “differentiation”, which is derived from innovation,
Pane Haden, Oyler, and Humphreys (2009), also argue this. Which would show that eco-
innovation, that is argued in this thesis to move Orsato’s framework between stages, would also
be an indicator for how a SME moves between the different stages of Maon, Lindgreen and
Swaen’s framework. This phenomenon is further supported by the descriptive information that
shows a slightly greater mean for internal factors in the HGS contra MGS, slightly higher mean
for external factors for MGS contra HGS, and LGS having the overall lowest amount of
motivational representation. With LGS favouring external factors in comparison to internal
factors.

48
It can further be argued, that Maon, Lindgreen and Swaen’s 7-steps can be assigned a
motivational factor(s) for each step. It is assumed if a step in this model is reached, that all the
previous steps have already been achieved. [Stage - Factor]: (1) Dismissing - Legal Obligation,
(2) Self Protecting - Competition, (3) Compliance-seeking - Supplier Relationship, (4)
Capability-seeking - Customer Demand, Financial, (5) Caring - Managerial Expectation,
Employee Expectation, Shareholder Pressure, (6) Strategizing - EMS, and (7) Transforming -
Goal Orientation, OtherIn, OtherEx.With this proposed combination, it can be seen how
external factors are preferred at a lower level of GM, and that internal factors increase in
important at higher levels of GM. This follows Maon, Lindgreen and theory of external pressure
in the earlier stages, to internal transformation in the latter. With OtherIn and OtherEx being
represented at the last stage due to innovative approaches to further development.
The summarization of the connection between Maon, Lindgreen and Swaen’s stages and
Orsato’s strategies linked with Dijken’s eco-innovation, and the studied factors of motivation
are presented in the conceptual map below (Figure 7). The model’s application demonstrates the
relationship. This means that if an SME wishes to improve their GS they can do so by moving
along either Orsato’s strategies, or Maon, Lindgreen and Swaen’s 7 stages. This change will be
based on Dijken’s eco-innovation. Hence, a SME can achieve HGS by prioritizing certain
factors, moving from Capability-seeking to Strategizing, or by applying a new environmental
strategy. The map’s main objective is to further the theoretical understanding of the existing
frameworks and the presented factors. This approach combines environmental strategies of
Orsato with the different company views on CSR from the 7-stage model and shows how these
views are connected to their environmental strategies. Further, how motivational factors
represented should affect the company’s GM position and help/harm their GMD. For example,
if a SMEs view on CSR is based on compliance-seeking, and they want to advance to Caring, it
makes sense to try to achieve eco-efficiency instead of eco-branding, to advance their GMD.
This is due to eco-branding assumes that previous strategies have already been fulfilled, just like
Moans, Lindgreen and Swaen model. Figure 7 shows that by focusing on eco-efficiency a SME
can proceed to higher levels of GS up to Caring. However, we cannot suggest any practical
implications since this model has not been tested.

49
Figure 7: Conceptual map of theory – 7-stage model, environmental strategies, eco-innovation, and internal/external motivational factors of GS

50
5. Conclusion
--------------------------------------------------------------------------------------------------------------------
This section provides a conclusion of the analysed empirical data as well as an answer to the
research question.
--------------------------------------------------------------------------------------------------------------------
This paper states that the motivational factors, Financial (Internal) and Customer Demand
(External), are the main prioritized factors by SMEs in the Nordic countries based on the study.
Further, it states that at different levels of GS, which represents GMP, SMEs in the Nordic
countries should prioritize different factors to pursue higher levels of GM. LGS SMEs should
therefore, theoretically, not focus on the same factors as MGS and HGS SMEs.
Additionally, HGS SMEs should have already fulfilled factors prioritised at MGS and LGS
levels, and that if they currently focused on these factors their overall GM development may be
hindered.
The thesis also observed that external factors are favoured for lower levels of GM, and that
internal factors are favoured for higher levels of GM. This is aligned with the 7-stage model of
Maon, Lindgreen and Swaen’s (2010). Hence, it is suggested that if a company wants to
increase their GMD they can pursue this through several means. To reach a higher level of GM
a SME can either: (1) prioritize different motivational factors, since it can be detrimental to
prioritize the wrong ones, (2) move along Maon, Lindgreen and Swaen’s 7-stages, or (3) move
along Orsato’s framework, based on the conceptual map (Figure 7). These should be viewed
indifferently, because the proposed relationship between the 3 are interconnected. For example,
if one tried to increase its level of GM by moving from beyond compliance leadership to eco-
branding, this could also be achieved by moving from strategizing to transforming, or by
fulfilling all company integrations with EMS, and move the motivational factors to, for
instance, goal orientation. This is due to that certain factors should have already been focused
on and been integrated in the company. To move between different stages of the two models,
and the presented factors, is based on eco-innovation.
Nordic SMEs should have a least a duel focus on both internal and external factors of
motivation for green management. We state that at different levels of green management SMEs
should prioritise different factors. At lower levels of green management Managerial
Expectation, Financial, Supplier Relationship, Shareholder Pressure, and Competition should be
prioritised, at medium levels of green management Goal Orientation, Managerial Expectation,
EMS, Customer Demand, and Legal Obligations should be prioritised, and at higher levels of

51
green management Goal Orientation, Employee Expectation, OtherIn, Supplier Relationship,
Shareholder pressure, and OtherEx should be prioritised. The factors effect on SMEs is
dependent on its current level of green management as presented by the study.

52
6. Discussion
--------------------------------------------------------------------------------------------------------------------
This section discusses the outcomes of the study. Thus, its theoretical implications, practical
implications, critique of method, and future research suggestions.
--------------------------------------------------------------------------------------------------------------------
6.1 Practical Implications
As been established in the literature, SMEs make up approximately 99% of the Nordic
economies, and stands for 75% of pollution in this area. Knowing what effect different
motivators have, and at what frequency they are occurring at, would make governments, non-
governmental organisations, or managers themselves able to help SMEs in the Nordic countries
to focus on the factors that are of higher relevance to them when it comes to developing their
GM based on what stage of GM they are currently at. This would aim to lower the amount of
pollution through making more SMEs able to be greener faster, since they would be advised to
focus on the factors with the highest effect based on their current level of GM.
6.2 Theoretical Implications
A suggested implication on existing theory, proposes how to deal with the Maon, Lindgreen and
Swaen’s 7 Step Model and Orsato’s green strategies. Through analysing how factors were
combined with each model, a parallel between the two was made. It can be argued that the same
thing that inspires/drives change in Orsato’s framework (eco-innovation, related to Dijken’s
innovation triangle, as a determinant of differentiation), is the same that drives change in the
seven-step model. Different levels of eco-innovation, and different levels of GM, is represented
by a factor which is the most relevant at that stage, based on suggested effect derived from the
study. This is presented in the conceptual map of the theories (figure 7). The conceptual map
was able to be created, given the assumption that SMEs in the Nordic countries generally have a
higher standard of CSR. Hence, even if Legal Obligations were the only motivating factor at
low levels of GM this still means a SME is sustainable at some level, allowing for interpret of
Maon, Lindgreen & Swaen’s framework as sustainable to different degrees, including the first
steps of the model that generally are considered to be unsustainable.
The literature reviewed, generally states that motivational factors should have a positive
relationship towards GMD no matter level of GM. However, as presented by the suggested
relationship between factors and GS, this was not the case given the studied sample. Dependent

53
on which levels of GM a Nordic SME is at, some factors should already have been focused on,
hence creating a decrease in development if focused on at latter stages.
6.3 Critique of method
Important to keep in mind, is that this study was not created with the intention of applying
regression, hence there is a lack of control variables that inevitably skew the results. This
method of analysing the data has nevertheless been included due to the proposed relationship
between frequency of factors and total GS that the regression presents. Furthermore, the lack of
control variables leads to a potentially unproportionate R-square and adjusted R-square, that
does not display the real observed correlation. Therefore, any hypothesis testing done based on
this study should be observant of two restrictions: (1) A sample rather than the entire population
is researched, which leads to a generalization of the entire population, and (2) the study lacks
control variables which leads to a low amount of presented correlation, and unproportionate p-
values. Hence, the proposed cause and effect between factors and GM holds for the sample, but
a representation of the entire population might be problematic. Furthermore, based on databases
from where SMEs were retrieved, there might have existed a bias towards Swedish SMEs that
compromised the findings. This factor has been worked intentionally against by selected SMEs
from a wide array of different business networks.
6.4 Limitations
(1) The SMEs to whom the questionnaire was sent were identified by various online databases
which could have had bias implications on the study. For example, “Allabolag.se” is made up
mostly of Swedish firms, and perhaps created a biased sample in representation of the different
countries. (2) The questionnaire created was subject to common method bias as the responder
was asked to report both the dependent and independent variable. This may have caused a bias
correlation between different factors and how environmentally friendly the company was, thus
affect the validity of the findings of the report. (3) Since the questionnaire had no control
variables, given that the initial purpose of the study did not include hypothesis testing, some of
the results found was presented as observed relationships and were stated as such. Therefore, the
thesis is limited to suggested relationships between factors and levels of GM and cannot
convincingly test different hypothesis based on the sample due to issues of significance and R-
square.
6.5 Further research suggestions
(1): Frequency of motivational factor occurrence, their prioritization, and a suggested effect
these motivators have on green management have been presented. However, an explicitly

54
explanation of the weighted relationship between different motivational factors, and their effect
on green management practices is discussed but not concluded. To realize if there is a link
between these, and what that potential link would look like, the research team suggests a
quantitative study that asks a significant portion of the population with specific questions
relating to weighting different factors against each other. This weighted relationship would
complement the findings of this paper, in the sense that SMEs would not only know at what
frequency factors occur in the industry and their effect on green management, but also the
weighted relationship between them to know which factors to be more important. To avoid
some of the limitations of the research, control variables and connection to country should be
included in the future study.
(2): In this paper a conceptual map has been presented combining Maon, Lindgreen and
Swaen’s, Orsato’s, and Djiken’s frameworks with the factors from the established literature.
The map is reliant on green management as its indicator for a ‘good’ result. However, it would
be of interest to test the relationship between green CSR and social CSR in conjunction with the
conceptual map of factors, since Maon, Lindgreen and Swaen’s model includes social CSR. We
suggest the following map for testing the relationship, indicating SMEs in four different
quadrants (Figure8). Since the 7-stage model is connected to Orsato and the factors of
motivation but have a component of Social CSR, this is the only framework presented as a
trajectory in the model with stages following 1-7 from the “Economic Focused” quadrant to the
“Optimal CSR Focus” quadrant. Does high green CSR SMEs tend to move towards high green,
high social, and does high social SMEs tend to move towards high green, high social? What
could be the cause of these changes, and why do they change as they do.
Figure 8: Suggested map of the 7-stage model, environmental CSR, and social CSR.

55
List of References
Alfred, A. and Adam, R. (2009). Green Management Matters Regardless. Academy of
Management Perspectives, 23(3), pp.17-26.
Anderson, D., Sweeney, D., Williams, T., Freeman, J. and Shoesmith, E. (2015). Statistics for
business and economics. Mason, OH: Thomson South-Western.
Arend, R. (2013). Social and Environmental Performance at SMEs: Considering Motivations,
Capabilities, and Instrumentalism. Journal of Business Ethics, 125(4), pp.541-561.
Aykol, B. and Leonidou, L. (2014). Researching the Green Practices of Smaller Service Firms:
A Theoretical, Methodological, and Empirical Assessment. Journal of Small Business
Management, 53(4), pp.1264-1288.
Babiak, K. and Trendafilova, S. (2011). CSR and environmental responsibility: motives and
pressures to adopt green management practices. Corporate Social Responsibility and
Environmental Management, 18(1), pp.11-24.
Bansal, P. and Roth, K. (2000). Why Companies Go Green: A Model of Ecological
Responsiveness. Academy of Management Journal, 43(4), pp.717-736.
Barney, J. (1991). Firm Resources and Sustained Competitive Advantage. Journal of
Management, 17(1), pp.99-120.
Beaver, G. and Prince, C. (2002). Innovation, entrepreneurship and competitive advantage in
the entrepreneurial venture. Journal of Small Business and Enterprise Development, 9(1),
pp.28-37.
Berger, I., Cunningham, P. and Drumwright, M. (2007). Mainstreaming Corporate Social
Responsibility: Developing Markets for Virtue. California Management Review, 49(4),
pp.132-157.
Bryman, A. and Bell, E. (2003). Business research methods. 4th ed. Oxford, UK: Oxford
University Press.
Carroll, A. (1991). The pyramid of corporate social responsibility: Toward the moral
management of organizational stakeholders. Business Horizons, 34(4), pp.39-48.
Carroll, A. (1999). Corporate Social Responsibility. Business & Society, 38(3), pp.268-295.

56
Clarkson, M. (1995). A Stakeholder Framework for Analyzing and Evaluating Corporate Social
Performance. Academy of Management Review, 20(1), pp.92-117.
Collis, J. and Hussey, R. (2014). Business research. 4th ed. London: Pan Macmillan, Chapter
7,8,9,10.
Cronstam, O. and Grönberg, J. (2017). nfluencing Factors in the Implementation of Green
Management Practices: A Qualitative Study regarding Swedish SMEs in Logistics.
[online] Available at: http://www.diva-
portal.org/smash/get/diva2:1116776/FULLTEXT01.pdf.
del Brío, J. and Junquera, B. (2003). A review of the literature on environmental innovation
management in SMEs: implications for public policies. Technovation, 23(12), pp.939-948.
Dhull, S. and Narwal, M. (2016). Drivers and barriers in green supply chain management
adaptation: A state-of-art review. Uncertain Supply Chain Management, pp.61-76.
Donaldson, T. and Preston, L. (1995). The Stakeholder Theory of the Corporation: Concepts,
Evidence, and Implications. Academy of Management Review, 20(1), pp.65-91.
Drucker, P. (1984). Converting Social Problems into Business Opportunities: The New
Meaning of Corporate Social Responsibility. California Management Review, 26(2),
pp.53-63.
Elkington, J. (1994). Towards the Sustainable Corporation: Win-Win-Win Business Strategies
for Sustainable Development. California Management Review, 36(2), pp.90-100.
European Commission (2015). Eco-innovation - European Commission. [online] Ec.europa.eu.
Available at: http://ec.europa.eu/environment/eco-innovation/faq/index_en.htm.
Eurostat (2016). File:Number of enterprises, persons employed and gross value added (GVA)
and the share of SMEs, 2012.png - Statistics Explained. [online] Ec.europa.eu. Available
at: http://ec.europa.eu/eurostat/statistics-
explained/index.php?title=File%3ANumber_of_enterprises%2C_persons_employed_and_
gross_value_added_(GVA)_and_the_share_of_SMEs%2C_2012.png.
Eurostat (2018). Annual enterprise statistics by size class for special aggregates of activities.
[online] Appsso.eurostat.ec.europa.eu. Available at:
http://appsso.eurostat.ec.europa.eu/nui/show.do?dataset=sbs_sc_sca_r2&lang=en.

57
Eurostat (2018). Statistics on small and medium-sized enterprises - Statistics Explained.
[online] Ec.europa.eu. Available at: http://ec.europa.eu/eurostat/statistics-
explained/index.php/Statistics_on_small_and_medium-sized_enterprises.
Florida, R. and Davison, D. (2001). Gaining from Green Management: Environmental
Management Systems inside and outside the Factory. California Management Review,
43(3), pp.64-84.
Friedman, M. and Friedman, R. (1962). Capitalism and freedom. Chicago: University of
Chicago Press.
Gjølberg, M. (2010). Varieties of corporate social responsibility (CSR): CSR meets the “Nordic
Model”. Regulation & Governance, 4(2), pp.203-229.
Greenan, K., Humphreys, P. and McIvor, R. (1997). The green initiative: improving quality and
competitiveness for European SMEs. European Business Review, 97(5), pp.208-214.
Halme, M. and Korpela, M. (2013). Responsible Innovation Toward Sustainable Development
in Small and Medium-Sized Enterprises: a Resource Perspective. Business Strategy and
the Environment, 23(8), pp.547-566.
Hörisch, J., Johnson, M. and Schaltegger, S. (2014). Implementation of Sustainability
Management and Company Size: A Knowledge-Based View. Business Strategy and the
Environment, 24(8), pp.765-779.
Hosseini, A. (2007). Identification of green management system’s factors: A conceptualized
model. International Journal of Management Science and Engineering Management,
[online] 2(3), pp.221-228. Available at:
https://www.tandfonline.com/doi/citedby/10.1080/17509653.2007.10671022?scroll=top&
needAccess=true.
Jamali, D., Zanhour, M. and Keshishian, T. (2008). Peculiar Strengths and Relational Attributes
of SMEs in the Context of CSR. Journal of Business Ethics, 87(3), pp.355-377.
Jenkins, H. (2004). A Critique of Conventional CSR Theory: An SME Perspective. Journal of
General Management, 29(4), pp.37-57.
Jones, T., Felps, W. and Bigley, G. (2007). Ethical Theory and Stakeholder-Related Decisions:
The Role of Stakeholder Culture. Academy of Management Review, 32(1), pp.137-155.

58
Kadłubek, M., Kott, I., Skibińska, W. and Szczepanik, T. (2016). SUSTAINABLE
DEVELOPMENT CONNECTIONS WITH TRANSPORT LOGISTICS
MANAGEMENT. Czestochowa University of Technology.
Kashyap, R., Mir, R. and Mir, A., 2004. Corporate social responsibility: a call for
multidisciplinary inquiry. Journal of Business & Economics Research, 2(7), pp.51-58.
Keeble, B. (1988). The Brundtland report: ‘Our common future’. Medicine and War, 4(1),
pp.17-25.
Kerr, I. (2005). Leadership strategies for sustainable SME operation. Business Strategy and the
Environment, 15(1), pp.30-39.
Lannelongue, G., Gonzalez-Benito, O. and Gonzalez-Benito, J. (2013). Environmental
Motivations: The Pathway to Complete Environmental Management. Journal of Business
Ethics, 124(1), pp.135-147.
Lee, K. (2009). Why and how to adopt green management into business organizations?.
Management Decision, 47(7), pp.1101-1121.
Maon, F., Lindgreen, A. and Swaen, V. (2010). Organizational Stages and Cultural Phases: A
Critical Review and a Consolidative Model of Corporate Social Responsibility
Development. International Journal of Management Reviews, 12(1), pp.20-38.
Metaxas, T. and Tsavdaridou, M. (2010). Corporate Social Responsibility in Europe: Denmark,
Hungary and Greece. Journal of Contemporary European Studies, 18(1), pp.25-46.
Mintzberg, H. (1978). Patterns in Strategy Formation. Management Science, 24(9), pp.934-948.
Mordkoff, J. (2016). The Assumption(s) of Normality - PDF. [online] Docplayer.net. Available
at: http://docplayer.net/18801659-The-assumption-s-of-normality.html.
Murillo, D. and Lozano, J. (2006). SMEs and CSR: An Approach to CSR in their Own Words.
Journal of Business Ethics, 67(3), pp.227-240.
Nattrass, B. and Altomare, M. (1999). The natural step for business. Gabriola Island, BC: New
Society Publishers, pp.9-31.
Nulkar, G. (2014). SMEs and Environmental Performance – A Framework for Green Business
Strategies. Procedia - Social and Behavioral Sciences, 133, pp.130-140.

59
Official Journal L 124 (2018). EUR-Lex - 32003H0361 - EN - EUR-Lex. [online] Eur-
lex.europa.eu. Available at: https://eur-lex.europa.eu/legal-
content/EN/TXT/?uri=CELEX%3A32003H0361.
Orsato, R. (2006). Competitive Environmental Strategies: When Does it Pay to Be Green?.
California Management Review, 48(2), pp.127-143.
Pane Haden, S., Oyler, J. and Humphreys, J. (2009). Historical, practical, and theoretical
perspectives on green management. Management Decision, 47(7), pp.1041-1055.
Pawliczek, A. and Piszczur, R. (2013). Effect of management systems ISO 9000 and ISO 14000
on enterprises' awareness of sustainability priorities. Ekonomie a management, [online]
16(2), pp.66-80. Available at: https://search-proquest-
com.proxy.library.ju.se/docview/1418119928?accountid=11754.
Peng, Y. and Lin, S. (2007). Local Responsiveness Pressure, Subsidiary Resources, Green
Management Adoption and Subsidiary’s Performance: Evidence from Taiwanese
Manufactures. Journal of Business Ethics, 79(1-2), pp.199-212.
Poksinska, B., Jörn Dahlgaard, J. and Eklund, J. (2003). Implementing ISO 14000 in Sweden:
motives, benefits and comparisons with ISO 9000. International Journal of Quality &
Reliability Management, 20(5), pp.585-606.
Porter, M. (1980). Competitive strategy. New York: Free Press.
Porter, M. (1985). Competitive advantage. New York: Free Press.
Porter, M. (1996). What Is Strategy?. Harvard Business Review, 74(6), pp.61-78.
Preuss, L. and Perschke, J. (2009). Slipstreaming the Larger Boats: Social Responsibility in
Medium-Sized Businesses. Journal of Business Ethics, 92(4), pp.531-551.
Reyes-Rodríguez, J., Ulhøi, J. and Madsen, H. (2014). Corporate Environmental Sustainability
in Danish SMEs: A Longitudinal Study of Motivators, Initiatives, and Strategic Effects.
Corporate Social Responsibility and Environmental Management, 23(4), pp.193-212.
Robecosam (2017). Country Sustainability Ranking | RobecoSAM. [online] Robecosam.com.
Available at: http://www.robecosam.com/en/sustainability-insights/about-
sustainability/country-sustainability-ranking/#.
60
Russo, A. and Tencati, A. (2008). Formal vs. Informal CSR Strategies: Evidence from Italian
Micro, Small, Medium-sized, and Large Firms. Journal of Business Ethics, 85(S2),
pp.339-353.
Sáez-Martínez, F., Díaz-García, C. and González-Moreno, Á. (2016). Factors Promoting
Environmental Responsibility in European SMEs: The Effect on Performance.
Sustainability, 8(9), p.898.
Saunders, M., Lewis, P. and Thornhill, A. (2014). Research methods for business students.
Harlow, Essex, England: Pearson Education Limited.
Shu, C., Zhou, K., Xiao, Y. and Gao, S. (2014). How Green Management Influences Product
Innovation in China: The Role of Institutional Benefits. Journal of Business Ethics, 133(3),
pp.471-485.
Smith, L. (2012). Decolonizing methodologies. London: Zed Books.
Strand, R., Freeman, R. and Hockerts, K. (2014). Corporate Social Responsibility and
Sustainability in Scandinavia: An Overview. Journal of Business Ethics, 127(1), pp.1-15.
Susman, G. (2007). Small and medium-sized enterprises and the global economy. Edward Elgar
Publishing Ltd., pp.46-48.
Svenskt Näringsliv (2018). Småföretag dominerar näringslivet. [online] Svenskt Näringsliv.
Available at: https://www.svensktnaringsliv.se/fragor/nyforetagande/smaforetag-
dominerar-naringslivet_548189.html.
Svenskt näringsliv (2018). Smått om små företag. [online] Svenskt Näringsliv. Available at:
https://www.svensktnaringsliv.se/migration_catalog/Rapporter_och_opinionsmaterial/Rap
porters/smatt-om-sma
foretag_529762.html/BINARY/Sm%C3%A5tt%20om%20sm%C3%A5%20f%C3%B6ret
ag.
Taylor, S. (1992). Green management: The next competitive weapon. Futures, 24(7), pp.669-
680.
Toshiba (2018). Toshiba: CSR Management - Corporate Social Responsibility. [online]
Toshiba.co.jp. Available at:
http://www.toshiba.co.jp/csr/en/csr_management/management.htm.

61
Triguero, A., Moreno-Mondéjar, L. and Davia, M. (2014). Leaders and Laggards in
Environmental Innovation: An Empirical Analysis of SMEs in Europe. Business Strategy
and the Environment, 25(1), pp.28-39.
Vázquez-Carrasco, R. and López-Pérez, M. (2012). Small & medium-sized enterprises and
Corporate Social Responsibility: a systematic review of the literature. Quality & Quantity,
47(6), pp.3205-3218.
von Weltzien Høivik, H. and Shankar, D. (2011). How Can SMEs in a Cluster Respond to
Global Demands for Corporate Responsibility?. Journal of Business Ethics, 101(2),
pp.175-195.
Wernerfelt, B. (1984). A resource-based view of the firm. Strategic Management Journal, 5(2),
pp.171-180.
Wilczek, B. (2016). Herd Behaviour and Path Dependence in News Markets: Towards an
Economic Theory of Scandal Formation. Journal of Interdisciplinary Economics, 28(2),
pp.137-167.
Williamson, D., Lynch-Wood, G. and Ramsay, J. (2006). Drivers of Environmental Behaviour
in Manufacturing SMEs and the Implications for CSR. Journal of Business Ethics, 67(3),
pp.317-330.

62
Appendices
Appendix I

63
Appendix II

64
Appendix III

65
Appendix IV
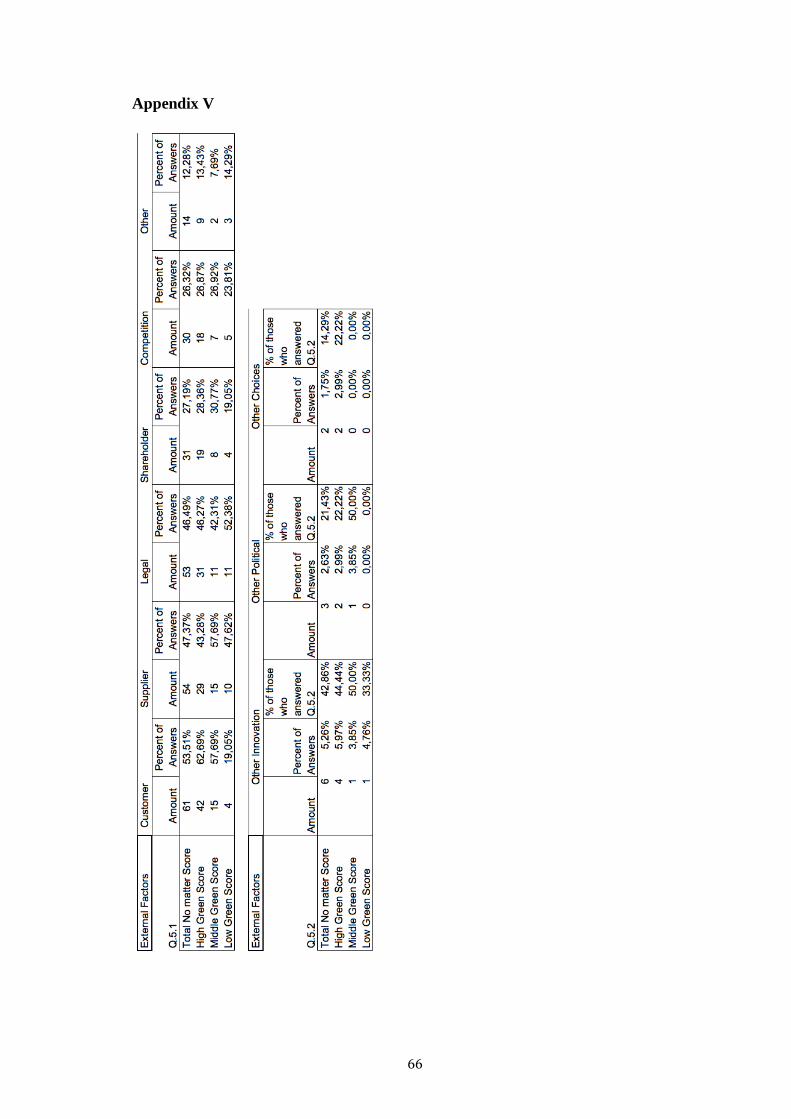
66
Appendix V

67
Appendix VI

68
Appendix VII

69
Appendix VIII

70
Appendix IX

71

72

73
Appendix X

74
Appendix XI

75
Appendix XII

76
Appendix XIII

77
Appendix XIV

78
Appendix XV

79
Appendix XVI

80
Appendix XVII

81
Appendix XVIII