motivational factors of visiting india passenger survey,...
TRANSCRIPT

Motivational Factors of visiting India –
A study based on International
Passenger Survey, 2009-10
Study Commissioned by the
Ministry of Tourism, Government of India
National Council of Applied Economic Research
11, I. P. Estate, New Delhi, 110002

Motivational Factors of visiting India -
A study based on International Passenger Survey
i National Council of Applied Economic Research
STUDY TEAM
Project Leader
Poonam Munjal
Senior Advisor
Ramesh Kolli
Core Research Team
Rachna Sharma
Amit Sharma
Monisha Grover
Praveen Kumar
Shashi Singh

Motivational Factors of visiting India -
A study based on International Passenger Survey
ii National Council of Applied Economic Research

Motivational Factors of visiting India -
A study based on International Passenger Survey
iii National Council of Applied Economic Research
ACKNOWLEDGEMENT
We would like to thank the officials of The Ministry of Tourism (MoT) for
their valuable inputs during the project review meetings and presentations. In
particular, we are immensely grateful to Dr. R.K. Bhatnagar (ADG, Market Research,
MoT) and Shailesh Kumar (Deputy Director, Market Research, MoT). The study also
benefited immensely from the important inputs from Shri Parvez Dewan (Secretary,
MoT) and Shri Girish Shankar (Addl. Secretary, MoT) apart from the other officials
of State Tourism Departments.

Motivational Factors of visiting India -
A study based on International Passenger Survey
iv National Council of Applied Economic Research

Motivational Factors of visiting India -
A study based on International Passenger Survey
v National Council of Applied Economic Research
ABBREVIATIONS AND ACRONYMS
DTS Domestic Tourism Survey
IPS International Passenger Survey
ISI Indian Statistical Institute
NCAER National Council of Applied Economic Research
NRI Non-Resident Indian
NSSO National Sample Survey Office
PIO Persons of Indian Origin
TSA Tourism Satellite Account

Motivational Factors of visiting India -
A study based on International Passenger Survey
vi National Council of Applied Economic Research

Motivational Factors of visiting India -
A study based on International Passenger Survey
vii National Council of Applied Economic Research
CONTENTS
Study Team i
Acknowledgement iii
Abbreviations v
List of Tables viii
List of Figures ix
1. Introduction 1
Context of the study 1
Objectives of the study 3
Structure of the report 4
2. Review of literature 5
3. Data source 9
International Passenger Survey 9
Profile of Inbound tourists 10
4. Survey findings 15
Methodology for deriving “composite value of importance” 18
Methodology for deriving “composite value of satisfaction level” 32
References 41
Appendix tables 43

Motivational Factors of visiting India -
A study based on International Passenger Survey
viii National Council of Applied Economic Research
LIST OF TABLES
Table 1: Estimated number of International Tourists by Regions and Category 10
Table 2:
Percentage distribution of foreign tourists by gender 11
Table 3:
Per cent distribution of foreigner tourists by category and by purpose of travel 13
Table 4: Per cent distribution of tourists giving ranks by motivational factors 16
Table 5: Per cent distribution of tourists by different ranks 17
Table 6: Composite value of importance for “Monuments, Forts, Palaces and Museums” by countries of
residence
23
Table 7: Composite value of importance for “Hill stations, mountains, beaches, scenic places” by
countries of nationality
24
Table 8: Composite value of importance for “Religious places” by countries of nationality 25
Table 9: Composite value of importance for “Medical treatment, yoga, meditation & spiritual healing”
by countries of nationality
26
Table 10: Composite value of importance for “Other Motivational factors” by countries of nationality 27
Table 11: Per cent distribution of tourists responding to level of satisfaction by motivational factors 29
Table 12: Per cent distribution of tourists by different responses of satisfaction level 31
Table 13: Composite value of satisfaction level for “Monuments, Forts, Palaces and Museums” by
countries of residence
35
Table 14: Composite value of satisfaction level for “Hill stations, mountains, beaches, scenic places” by
countries of nationality
36
Table 15: Composite value of satisfaction level for “Religious places” by countries of nationality 37
Table 16: Composite value of satisfaction level for “Medical treatment, yoga, meditation & spiritual
healing” by countries of nationality
38
Table 17: Composite value of satisfaction level for “Other Motivational factors” by countries of
nationality
39
Table A1: Number of tourists responding to each rank by motivational factors 45
Table A2: Number of tourists responding to each level of satisfaction by motivational factors 46

Motivational Factors of visiting India -
A study based on International Passenger Survey
ix National Council of Applied Economic Research
LIST OF FIGURES
Figure 1: Percentage distribution of foreign tourists by age-group 12
Figure 2: Composite value of importance for “Monuments, Forts, Palaces and Museums” by age-groups 19
Figure 3: Composite value of importance for “Hill stations, mountains, beaches, scenic places” by age-
groups
19
Figure 4: Composite value of importance for “Religious places” by age-groups 20
Figure 5: Composite value of importance for “Medical treatment, yoga, meditation & spiritual healing”
by age-groups
20
Figure 6: Composite value of importance for “Other Motivational Factors” by age-groups 21
Figure 7: Composite value of satisfaction level for “Monuments, Forts, Palaces and Museums” by age-
groups
32
Figure 8: Composite value of satisfaction level for “Hill stations, mountains, beaches, scenic places” by
age-groups
33
Figure 9: Composite value of satisfaction level for “Religious places” by age-groups 33
Figure 10: Composite value of satisfaction level for “Medical treatment, yoga, meditation & spiritual
healing” by age-groups
34
Figure 11: Composite value of satisfaction level for “Other Motivational Factors” by age-groups 34

Motivational Factors of visiting India -
A study based on International Passenger Survey
x National Council of Applied Economic Research

Motivational Factors of visiting India -
A study based on International Passenger Survey
1 National Council of Applied Economic Research
1. INTRODUCTION
Context of the study
1.1 “Crompton (1979) notes it is possible to describe the who, when, where and how of
tourism, together with the social and economic characteristics of tourist, but not to answer
the question “why”, the most interesting question of all tourist behaviour.” (Fodness, 1994, p.
556)
1.2 In the recent times, not only has the Tourism Industry changed but the consumers
for this industry or the tourists have also evolved. Today a decision to go on a trip is not
merely based on social or professional obligations but to have a fun trip or a holiday with
friends or an adventurous trip or even just a way to spend time with the family. What
makes an individual to decide this idea of trip? Or what motivates them to go where they
go? The motivation or the driving force influencing any decision on the matter of a tourist
is a very important factor for the developers to know. It is very important to understand
the behaviour of a tourist and the motivational factors influencing their decision to
understand the behaviour pattern of the consumers of tourism industry. In the rest of the
report, a consumer and a tourist are synonyms.
1.3 Especially in a very competitive world, it is very important to understand what
works or what makes a product more desirable than the other. Tourism is a very important
industry today and tourist destinations are the products. Just like any other product,
marketing of tourism is not possible without the understanding the reasons or the
motivational factors encouraging one to buy or use that product. Unfortunately in context
to tourism, motivation is not a very well researched area in the Indian context. Worldwide
this has been a research topic for quite a number of years, with studies having a specific
focus on the motivational factors leading to tourism.
Motivational Factors of visiting India -
A study based on International Passenger Survey
2 National Council of Applied Economic Research
1.4 Tourism in India, especially domestic tourism has remained enigmatic, partly due to
inadequate collection of data related to the sector and also due to the absence of any
systematic framework for analysing the sector. Although statistics related to international
visitors have been collected occasionally, data on domestic tourists have been generated
only sporadically, specific to an area and generally by non-government bodies. After more
than fifty years of independence, National Sample Survey Office (NSSO) in its 54th round
survey (Jan-June 1998), based on a thin sample contained a tourism module along with
other modules focusing on daily commuters and the use of mass media by households. The
definition of a tourist underlying the survey was inconsistent with the current international
definition and the survey did not include tourist expenditures except for travel costs. The
other earlier surveys were typically small and were isolated attempts by state governments
or business associations or researchers with specific focus relevant to either their state or
business interest.
1.5 In the recent years, with growing recognition of tourism as an important source of
employment and in contributing to the growth of the country, it became imperative to
understand what tourism is. The Tourism Satellite Account (TSA) is a framework adopted
by United Nations Statistical Commission which provides an important platform towards
forging improved understanding of the structure and role of tourism in the economy. With
this background, Ministry of Tourism (MoT) commissioned National Council of Applied
Economic Research (NCAER) to undertake the Domestic Tourism survey in 2002. NCAER
for the first time in the country undertook a comprehensive all-India Domestic Tourism
Survey (DTS). The data collected from the survey as well as from an International
Passenger Survey (IPS) and other official sources were used to develop the TSA for India,
thereby providing internationally comparable and credible estimates of tourism in the
Indian economy. The development of the TSA further strengthens the national statistical
system for better capturing tourism.
1.6 Following this and with the need of updating the TSA every five years, the MoT,
assigned the NSSO to undertake the 2nd DTS during July 2008 to June 2009. The all-India
Motivational Factors of visiting India -
A study based on International Passenger Survey
3 National Council of Applied Economic Research
household survey on domestic tourism was carried out by the NSSO as part of its 65th
round.
1.7 Apart from the inputs from domestic tourism survey, the inputs or information from
the Inbound tourist (Non-residents visiting the country) and Outbound tourist (residents
travelling outside the country) were also required for the computation of the TSA, both of
which were covered in the IPS (2010-11). The MoT commissioned the Indian Statistical
Institute (ISI), Kolkata to conduct the IPS for year 2009-10. The survey targeted the
following three categories of International tourists, namely foreign nationals visiting India,
Non-resident Indians visiting India and Indian Residents travelling abroad. The
information collected from the IPS included a number of parameters; Demographic and
Social Profile of the travelers, Duration of the stay, Motivational factors responsible for
attracting tourist in India, Detailed expenditure patterns of the foreign as well as the NRIs
and persons of Indian origin (PIOs) on various tourism products such as the
accommodation, food and beverages, transport, cultural services, entertainment etc.
Objectives of the study
1.8 There are various factors that affect the travel decisions, an important among them
being the motivational factors. Other factors, of course, are finances and time that can be
taken out from work schedule etc. This study attempts to answer the question on the
motivational factors influencing the decision of potential tourist visiting India, using the
data from IPS, 2010-11. However it should be noted that since this survey was designed
specifically to provide the inputs to the construction of TSA and barely provides inputs that
can be used to analyse the motivational factors of visiting India, this study suffers from data
limitations and provides only that information which could be extracted from the survey
data.
1.9 The keen interest of the Ministry MoT to analyse the motivational factors of tourists’
visiting India prompted them to commission NCAER to prepare a report on Motivational
factors of visiting India using the data collected in the IPS, 2010-11. This is part of the “3-

Motivational Factors of visiting India -
A study based on International Passenger Survey
4 National Council of Applied Economic Research
year integrated plan for preparation of regional TSAs for all states and UTs of India and two
research topics for each year” that was commissioned to NCAER by MoT in October 2013.
1.10 The present study attempts to provide the data on motivational factors in terms of
the ranks given by the respondents to each motivational factor. We have derived these data
across the various age-groups of the respondents and across the countries of their usual
residence. Also we have analysed the data on importance and satisfaction level of factors,
again across age-groups and countries. The essence of the study is to identify the most
important motivational factor of visiting India by computing the composite rank for each
factor.
Structure of the report
1.11 This report is presented in four chapters. The brief outline of the study, its
objectives and the chapterisation scheme are discussed in the present chapter. Chapter 2
reviews the literature on the motivational factors and consumer behaviour of the tourist.
Chapter 3 describes the data source and Chapter 4 provides the results of the IPS
pertaining to Motivational Factors resulting in tourism activity.

Motivational Factors of visiting India -
A study based on International Passenger Survey
5 National Council of Applied Economic Research
2. REVIEW OF LITERATURE
1.12 Motivation has long been an important topic in tourism research. Gee, Choy and
Makens (1984) pointed out that the marketers of Tourism must understand the motivating
factors that lead to travel decisions and consumption behaviour. Motivation is one of many
variables such as perceptions, cultural conditioning, and learning that contribute to
explaining tourist behaviour, but motivation is a critical variable because it is the driving
force behind all behaviour. The basic motivation theory describes a dynamic process of
internal psychological factors (needs, wants, and goals) within individuals' minds and
bodies. And from a marketing perspective, tourism products can be designed and
marketed as solutions to tourists' needs.
1.13 One of the most popular typology of tourist motivation is the Crompton’s (1979)
push and pull model which emphasizes that tourist’s choice of a travel destination is
influenced by two forces. Push factors that push individuals from home, and pull factors
that pull individuals toward a destination. In other words, people are travelling because
they are pushed by their internal motives and pulled by external forces of a travel
destination (Lam and Hsu, 2006). Andreu et al (2005) and Kassean et al (2013) find that
rest and relaxation is the biggest push factor for the travellers. A few other push factors are
nostalgia, escape, novelty, social interaction which motivates people to make trips to places
out of their usual environment.
1.14 Alexandra (2013) argues that decision-making of a tourist is influenced directly by
three major criteria viz. motivators, determinants and segmentation. Segmentation is a
process to divide the population into similar subgroups in terms of purchase
characteristics. Furthermore, demographic (age, sex, religion, family status), geographical
(region, countries, population), psychographic (lifestyle, personality), behaviouristic
(customer’s expectations towards advantages he/she can receive from the product)
Motivational Factors of visiting India -
A study based on International Passenger Survey
6 National Council of Applied Economic Research
variables influence the decision of every individual from the same segment. As far as the
present study is concerned, since no data are available related to psychographic and
behaviouristic characteristics, analysis based on these two criteria is not possible in Indian
context.
1.15 Also, in line with the findings of Jonsson et al (2008) and Guha (2009), we did not
find any significant difference in influence of push factors with respect to gender and same
is the case with religion-based analysis. Jonsson et al (2008) also find that nationality and
age are important variables and must be considered in predicting variability in tourism
motivations. So, owing to the lack of data on psychographics, behaviourism and
insignificance of results of gender and religion-based analysis, we have tried mapping the
motivation levels of the tourists by age groups, their countries of residence in this paper.
1.16 Similarities in various studies conducted in various countries indicate that there
exist the motivations for travellers and motivation levels vary significantly across
subgroups of population based on age groups, countries of residence etc. It is much needed
to extend the scope of research on motivation of the tourists visiting India on a continuous
basis in order to determine tourists’ travel behaviour.
1.17 Data gap on psychographics and behaviourism must be fulfilled in order to better
understand the needs of the tourists and to formulate focussed marketing strategies. Such
strategies are quintessential to develop products according to the needs of the travellers
and so to attract more and more of the foreigner tourists to India.
1.18 By knowing what motivates the tourists to make a visit, not only certain forms of
tourism can be encouraged in particular regions, but also the revenue from tourism can be
increased by providing additional services to the tourists according to their needs.
1.19 Tourism industry’s sustainability and growth is solely dependent on the travel
decisions of the tourists which are reflected in travel behaviour (Vuuren et al, 2011). The
push factors are beyond control of those involved in making marketing strategies, but the

Motivational Factors of visiting India -
A study based on International Passenger Survey
7 National Council of Applied Economic Research
pull factors are very much dependent on how well any country understands the needs of
tourists and as a result of which how the strategies are formulated to attract tourists. So, in
order to grow the Indian tourism sector, MoT must understand the needs and motivational
factors of tourists for which focussed and intense data collection and research is much
required.

Motivational Factors of visiting India -
A study based on International Passenger Survey
8 National Council of Applied Economic Research

Motivational Factors of visiting India -
A study based on International Passenger Survey
9 National Council of Applied Economic Research
3. DATA SOURCE
International Passenger Survey (IPS)
1.21 The Indian Statistical Institute (ISI), Kolkata conducted the IPS for the year 2010-11,
targeting foreign nationals visiting India, NRIs visiting India and Indian residents travelling
abroad. The principal objectives of the survey were to identify the foreign tourists visiting
India as foreign tourists –PIOs and other foreigners – and NRIs; to estimate the total
number of tourist arrivals in India and the number of outbound tourists to various
countries; to assess the detailed expenditure pattern of the foreign tourists visiting the
country; to evaluate the performance of existing tourist facilities in India and to estimate
the average duration of stay of foreign tourists in India including country-wise details.
1.22 In addition to this, demographic, economic and social profiles of foreign tourist
visiting India, the leading purposes for which the trips were undertaken and the
motivational factors responsible for attracting them to India can also be obtained from the
IPS.
1.23 The ISI adopted stratified sampling methodology for selecting ports (exit points) at
which the passengers going out of India were interviewed face-to-face. Two different
questionnaires were developed, one for collecting information on the foreign residents
(NRIs, PIOs and others) and the other one for surveying outbound Indian residents.
1.24 Foreign Resident/NRI Survey covered 13 ports, namely four international airports –
Chennai, Delhi, Kolkata and Mumbai; 4 other airports - Ahmedabad, Bangalore, Cochin,
Hyderabad and 5 land check-posts – Attari, Haridaspur, Ghojdanga, Munabao and Sonauli.
Outbound Indian Resident Survey was conducted for 11 ports out of which four are
international airports – Chennai, Delhi, Kolkata and Mumbai, 4 other airports - Ahmedabad,

Motivational Factors of visiting India -
A study based on International Passenger Survey
10 National Council of Applied Economic Research
Bangalore, Cochin, Hyderabad and three land check-posts – Haridaspur, Ghojadanga and
Munabao.
1.25 Stratified random sampling was adopted for the selection of passengers at each of
the selected ports for the survey. A total of 40,672 foreign resident passengers and 9,139
outbound Indians were surveyed at the aforementioned exit points across the country.
Profile of Inbound tourists
1.26 According to the survey, a total of 66.04 lakh foreign tourists visited India during
2010-11. Of these, only 17.4 per cent were NRIs, 13.9 per cent were PIOs and the rest 68.7
per cent were foreign nationals.
1.27 The region-wise distribution of foreign tourists to India (Table 1) reveals that India
received the maximum number of tourists from Asia (57.2 per cent), followed by Europe
(19.6 per cent) followed by Europe (19.6 per cent), North America (15.3 per cent).
Australia (4.4 per cent), Africa (2.5 per cent) and South America (0.8 per cent) accounted
for less than ten per cent of the foreign tourists coming to India.
Table 1: Estimated number of International Tourists by Regions and Category
Continent of nationality NRIs Foreigner
PIOs Foreigner
Others All
Foreigners
Asia 823169 547456 2406636 3777262
Europe 38064 173035 1085061 1296160
Africa 17683 5156 144888 167727
North America 246849 124769 638557 1010175
South America 3212 3029 49435 55676
Australia 18206 62721 208199 289126
Other Continents 1050 1110 5610 7770
Estimated Numbers 1148234 917277 4538387 6603897
Source: NCAER’s computations using IPS data

Motivational Factors of visiting India -
A study based on International Passenger Survey
11 National Council of Applied Economic Research
1.28 Gender analysis of the foreign tourists reveals a pre-dominance of males with males
having a share of nearly 69 per cent of all tourists visiting India. The table below presents
the percentage distribution of foreign tourists visiting India from various continents by
their gender.
Table 2: Percentage distribution of foreign tourists by gender
Country of residence NRIs Foreigner PIOs Others foreigner All foreigners
Male Female Male Female Male Female Male Female
Asia 79.4 20.6 76.0 24.0 73.4 26.6 75.1 24.9
Europe 81.6 18.4 43.4 56.6 56.4 43.6 55.4 44.6
Africa 32.1 67.9 71.1 28.9 68.4 31.6 64.7 35.3
North America 66.5 33.5 85.3 14.7 65.6 34.4 68.3 31.7
South America 66.4 33.6 75.3 24.7 65.6 34.4 66.1 33.9
Australia 53.3 46.7 7.6 92.4 61.2 38.8 49.1 50.9
Other Continents 82.0 18.0 89.2 10.8 71.5 28.5 75.4 24.6
Source: NCAER’s computations using IPS data
1.29 In 2010-11, maximum foreign tourist arrivals in India (about 31 per cent) were
from 35-44 years age group followed by the age groups of 25-34 years (29.3 per cent),45-
54 years (21.5 per cent), 18-24 years (8 per cent) and 55-64 years (7.5 per cent). Minimum
were in the age group of 65 & above years (2.8 per cent).There were no responses in the
age group below 18 years.

Motivational Factors of visiting India -
A study based on International Passenger Survey
12 National Council of Applied Economic Research
Figure 1: Percentage distribution of foreign tourists by age-group
Source: NCAER’s computations using IPS data
1.30 The per cent distribution of different types of foreign tourists by purposes of
travel is presented in Table 3. The most number of trips were undertaken for leisure
(36.8 per cent). Among NRIs visiting India, a significant proportion of tourists (41.2 per
cent) visited India for social purpose. This is closely followed by number of tourists
visiting for leisure, at 37.3 per cent. Among both PIOs and other foreigner tourists,
leisure was the most popular purpose of travel, with their share in total being 36.0 per
cent and 36.8 per cent, respectively. For both types of tourists, this was followed by
tourists travelling for business purposes. In all, one-fourth of the foreign tourists
visited India for business purpose.
18-24 yrs, 8.0
25-34 yrs, 29.3
35-44 yrs, 30.9
45-54 yrs, 21.5
55-64 yrs, 7.5
65+ yrs, 2.8

Motivational Factors of visiting India -
A study based on International Passenger Survey
13 National Council of Applied Economic Research
Table 3: Per cent distribution of foreigner tourists by category and by purpose of
travel
NRIs PIOs
Other
foreigners
All
foreigners
Business 9.1 17.5 31.1 25.4
Leisure 37.3 36.0 36.8 36.8
Social 41.2 9.9 13.7 17.9
Religious 2.4 3.3 3.7 3.4
Education & training 1.8 13.2 3.8 4.8
Health & medical 1.3 2.4 6.2 4.8
Shopping 0.1 0.2 0.2 0.2
Games & sports 0.5 0.4 0.3 0.4
Jobs on foreign deputation 0.8 0.7 1.7 1.4
Invited by India on specific assignment 3.9 15.7 1.2 3.7
Others 1.5 0.6 1.3 1.2
Total 100.0 100.0 100.0 100.0
Source: NCAER’s computation using IPS data

Motivational Factors of visiting India -
A study based on International Passenger Survey
14 National Council of Applied Economic Research

Motivational Factors of visiting India -
A study based on International Passenger Survey
15 National Council of Applied Economic Research
4. SURVEY FINDINGS
1.31 With regard to motivational factors, the IPS identifies ten factors and asks the
respondent tourists to rank five of them in descending order such that the most
important motivational factor is ranked first and the least important is ranked fifth.
Also, each factor was to be ranked in descending order of its level of satisfaction. These
factors are listed below:
- Monuments, forts, palaces, museum
- Hill stations
- Religious places
- Medical treatment, yoga, meditation
- Wildlife
- Fairs & festivals, theme parks
- Adventure places
- Shopping
- Visiting relatives
- Others (to be specified)
1.32 According to the data, by and large, only first four factors were predominant.
Hence, for this study, we have clubbed all the rest of the factors into one and called it
“Others”. The key findings present the number of tourists, by type of tourists, who
ranked each factor as 1, 2, 3, 4 and 5. The results have also been extracted for such
number of tourists across various age-groups and countries of normal residence.
1.33 The following table (Table 4) presents the per cent distribution of number of
tourists giving each rank to each of the factor of motivation. This is presented by type of
tourists. The absolute numbers for this table are given in Appendix Table A1.

Motivational Factors of visiting India -
A study based on International Passenger Survey
16 National Council of Applied Economic Research
Table 4: Per cent distribution of tourists giving ranks by motivational factors
Motivational factors / Attractions
Rank
1 2 3 4 5
NRIs
Monuments, forts, palaces, museum 81.3 60.4 64.3 65.3 70.4
Hill stations, mountains, beaches, scenic places
10.3 14.5 5.9 19.8 20.0
Religious places 3.9 18.2 27.8 8.8 7.9
Medical treatment, yoga, meditation & spiritual healing
0.5 2.3 0.5 6.2 1.5
Others 4.0 4.6 1.6 0.0 0.1
Total 100.0 100.0 100.0 100.0 100.0
PIOs
Monuments, forts, palaces, museum 79.6 86.4 84.8 68.2 64.9
Hill stations, mountains, beaches, scenic places
13.7 5.0 5.0 20.4 27.1
Religious places 3.9 5.3 8.3 10.9 7.9
Medical treatment, yoga, meditation & spiritual healing
1.3 0.9 1.1 0.6 0.0
Others 1.5 2.3 0.8 0.0 0.0
Total 100.0 100.0 100.0 100.0 100.0
Other foreigners
Monuments, forts, palaces, museum 70.8 77.1 72.0 79.5 76.5
Hill stations, mountains, beaches, scenic places
7.5 12.0 11.2 10.9 14.9
Religious places 7.9 5.7 11.4 7.9 4.6
Medical treatment, yoga, meditation & spiritual healing
3.7 0.5 1.9 0.3 2.4
Others 10.1 4.7 3.5 1.4 1.6
Total 100.0 100.0 100.0 100.0 100.0
All foreigners
Monuments, forts, palaces, museum 74.1 76.5 71.3 75.1 73.8
Hill stations, mountains, beaches, scenic places
9.1 11.5 9.1 13.8 17.4
Religious places 6.5 6.8 15.5 8.4 5.9
Medical treatment, yoga, meditation & spiritual healing
2.7 0.7 1.4 1.7 2.0
Others 7.5 4.4 2.7 0.9 1.0
Total 100.0 100.0 100.0 100.0 100.0
Source: NCAER’s computation using IPS data
1.34 Among all the motivational factors, “monuments, forts, palaces and
museums” turned out to be the biggest motivational factor for tourists visiting India,
across all types of tourists. This is evident from the column distribution of number of

Motivational Factors of visiting India -
A study based on International Passenger Survey
17 National Council of Applied Economic Research
tourists. However, row distribution is also meaningful as it gives the proportion of
tourists giving rank 1 or 2 amongst all the tourists who gave rank to each factor. This is
presented in the table below:
Table 5: Per cent distribution of tourists by different ranks
Motivational factors / Attractions
Rank
1 2 3 4 5
NRIs
Monuments, forts, palaces, museum 52.5 8.2 17.9 9.4 11.9
Hill stations, mountains, beaches, scenic places
40.3 12.0 10.0 17.2 20.6
Religious places 16.4 16.1 50.4 8.3 8.8
Medical treatment, yoga, meditation & spiritual healing
15.9 16.7 6.9 47.1 13.5
Others 70.5 17.2 11.8 0.0 0.4
Total 47.0 9.9 20.3 10.5 12.3
PIOs
Monuments, forts, palaces, museum 65.1 15.6 11.1 5.0 3.3
Hill stations, mountains, beaches, scenic places
71.8 5.8 4.2 9.5 8.7
Religious places 49.5 15.0 16.9 12.4 6.2
Medical treatment, yoga, meditation & spiritual healing
75.6 11.1 10.3 3.1 0.0
Others 69.2 24.5 6.4 0.0 0.0
Total 65.3 14.4 10.5 5.8 4.0
Other foreigners
Monuments, forts, palaces, museum 47.2 24.4 12.3 9.0 7.2
Hill stations, mountains, beaches, scenic places
37.6 28.4 14.3 9.2 10.4
Religious places 50.8 17.6 18.8 8.7 4.2
Medical treatment, yoga, meditation & spiritual healing
76.5 5.3 10.0 1.1 7.1
Others 73.9 16.2 6.6 1.7 1.6
Total 49.0 23.3 12.6 8.3 6.9
All foreigners
Monuments, forts, palaces, museum 50.8 20.2 13.1 8.5 7.4
Hill stations, mountains, beaches, scenic places
43.7 21.3 11.8 10.9 12.3
Religious places 41.8 17.0 26.8 8.9 5.5
Medical treatment, yoga, meditation & spiritual healing
68.8 7.2 9.6 7.0 7.3
Others 73.4 16.6 7.1 1.5 1.5
Total 50.9 19.6 13.7 8.4 7.5
Source: NCAER’s computation using IPS data
Motivational Factors of visiting India -
A study based on International Passenger Survey
18 National Council of Applied Economic Research
1.35 These tables suggest that of all the cases where response is rank 1, 74.1 per
cent chose “monuments, forts, palaces and museums” as their most motivational factor,
but of all the cases where “monuments, forts, palaces and museums” was ranked, only
50.8 per cent gave first rank to it. Hence, both column and row distributions, though
meaningful, are incomplete presentation of the required analysis.
1.36 It is for this reason that we have derived a composite value of importance for
each factor which gives weightage to responses against not just first rank but also the
second, third, fourth and fifth ranks. The methodology for deriving this composite value
is as follows:
Methodology for deriving “composite value of importance”
1.37 Ranks 1, 2, 3, 4 and 5 are assigned values 5, 4, 3, 2 and 1 respectively so that
highest value (that is, 5) is given to rank 1, lesser to rank 2 and so on.
1.38 Weighted average of ranks, termed as composite value of importance, is
calculated where weights are the number of responses against each rank. The
interpretation of these composite values of importance is that higher its value, more
important motivational factor it was for the tourists, belonging to a specific category.
Hence, a value of 5 for a factor would mean that all the tourists giving response to that
factor gave first rank to it or identified it as the most important factor. Similarly, a value
of 1 would mean that all the tourists giving response to a factor gave fifth rank to that
factor or identified it as the least important factor.
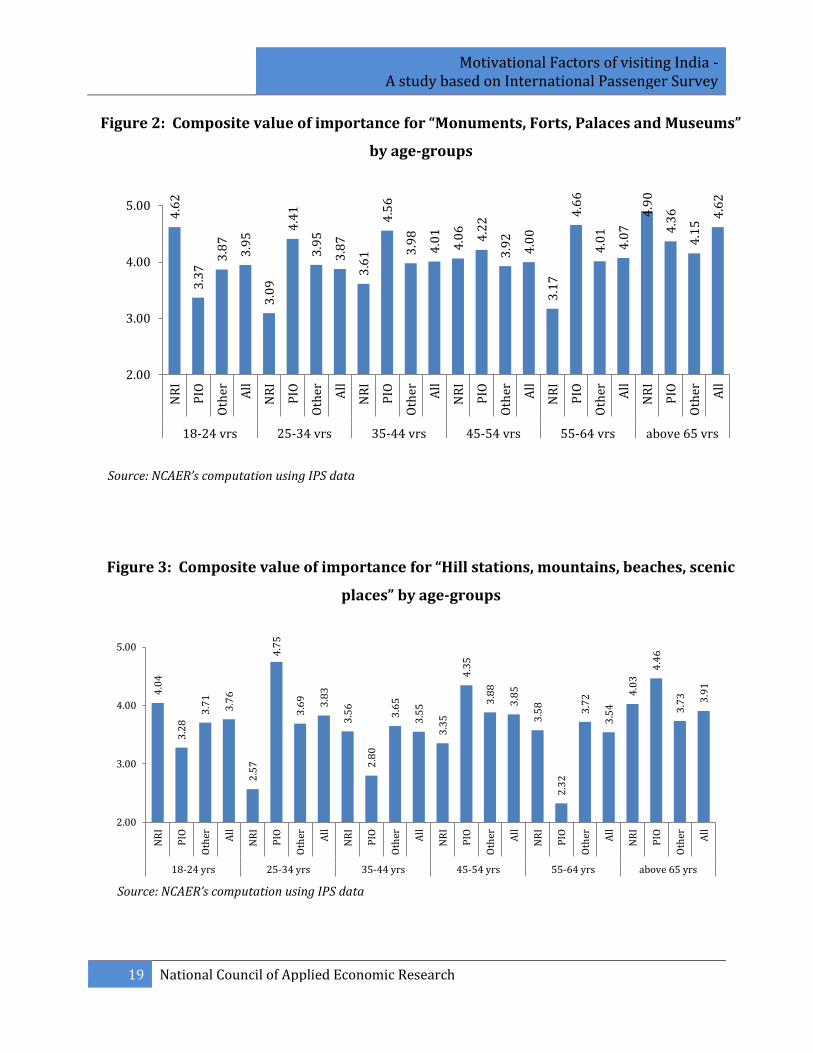
1.39 The following figures present the composite values of importance for each
motivational factor by different age-groups.
Motivational Factors of visiting India -
A study based on International Passenger Survey
19 National Council of Applied Economic Research
Figure 2: Composite value of importance for “Monuments, Forts, Palaces and Museums”
by age-groups
Source: NCAER’s computation using IPS data
Figure 3: Composite value of importance for “Hill stations, mountains, beaches, scenic
places” by age-groups
Source: NCAER’s computation using IPS data
4.6
2
3.3
7 3
.87
3.9
5
3.0
9
4.4
1
3.9
5
3.8
7
3.6
1
4.5
6
3.9
8
4.0
1
4.0
6
4.2
2
3.9
2
4.0
0
3.1
7
4.6
6
4.0
1
4.0
7
4.9
0
4.3
6
4.1
5 4
.62
2.00
3.00
4.00
5.00
NR
I
PIO
Oth
er All
NR
I
PIO
Oth
er All
NR
I
PIO
Oth
er All
NR
I
PIO
Oth
er All
NR
I
PIO
Oth
er All
NR
I
PIO
Oth
er All
18-24 yrs 25-34 yrs 35-44 yrs 45-54 yrs 55-64 yrs above 65 yrs
4.0
4
3.2
8 3
.71
3.7
6
2.5
7
4.7
5
3.6
9
3.8
3
3.5
6
2.8
0
3.6
5
3.5
5
3.3
5
4.3
5
3.8
8
3.8
5
3.5
8
2.3
2
3.7
2
3.5
4
4.0
3
4.4
6
3.7
3
3.9
1
2.00
3.00
4.00
5.00
NR
I
PIO
Oth
er All
NR
I
PIO
Oth
er All
NR
I
PIO
Oth
er All
NR
I
PIO
Oth
er All
NR
I
PIO
Oth
er All
NR
I
PIO
Oth
er All
18-24 yrs 25-34 yrs 35-44 yrs 45-54 yrs 55-64 yrs above 65 yrs

Motivational Factors of visiting India -
A study based on International Passenger Survey
20 National Council of Applied Economic Research
Figure 4: Composite value of importance for “Religious places” by age-groups
Source: NCAER’s computation using IPS data
Figure 5: Composite value of importance for “Medical treatment, yoga, meditation &
spiritual healing” by age-groups
Source: NCAER’s computation using IPS data
3.3
4
4.7
6
4.4
5
4.3
3
2.9
8 3
.35
3.8
8
3.6
6
3.5
2
3.7
1 4.0
2
3.8
7
3.1
6
4.2
0
4.0
4
3.6
8
3.3
3
3.8
9
3.8
8
3.7
9
2.6
4
4.9
2
4.7
7
4.7
2
2.00
3.00
4.00
5.00N
RI
PIO
Oth
er All
NR
I
PIO
Oth
er All
NR
I
PIO
Oth
er All
NR
I
PIO
Oth
er All
NR
I
PIO
Oth
er All
NR
I
PIO
Oth
er All
18-24 yrs 25-34 yrs 35-44 yrs 45-54 yrs 55-64 yrs above 65 yrs
1.0
0
0.0
0
3.7
9
3.4
8
2.5
7
4.8
0
3.9
5
3.9
8
2.6
3
4.9
2
4.7
5
4.2
2
3.6
9
3.4
0
4.8
4
4.7
2
3.0
0
4.0
2
3.9
6
3.9
3
0.0
0
3.2
1
4.9
8
4.7
5
0.00
1.00
2.00
3.00
4.00
5.00
6.00
NR
I
PIO
Oth
er All
NR
I
PIO
Oth
er All
NR
I
PIO
Oth
er All
NR
I
PIO
Oth
er All
NR
I
PIO
Oth
er All
NR
I
PIO
Oth
er All
18-24 yrs 25-34 yrs 35-44 yrs 45-54 yrs 55-64 yrs above 65 yrs

Motivational Factors of visiting India -
A study based on International Passenger Survey
21 National Council of Applied Economic Research
Figure 6: Composite value of importance for “Other Motivational Factors” by age-
groups
Source: NCAER’s computation using IPS data
1.40 According to this exercise, and as given in figures above, the following key
findings emerge:
The overall composite value for “monuments, forts, palaces and museums”
among tourists of age-group 18-24 years is 3.95. Across type of tourists, the
highest value was observed in the case of NRIs (4.62) and the lowest among PIOs
(3.37).
Across all the age groups, highest composite value (4.90) for “monuments, forts,
palaces and museums” was observed among NRIs of age above 65 years. The
lowest value was given by NRIs of age group 25 to 34 years.
With respect to “Hill stations, mountains, beaches, scenic places”, the highest
value of importance was observed in the case of PIOs of age-group 25 to 34 years
3.9
3
4.1
1
4.2
4
4.2
2 4
.58
4.6
9
4.6
6
4.6
5
4.7
8
4.5
8
4.7
8
4.7
7
4.3
0
4.5
5
4.6
7
4.6
4
4.4
8 5
.00
3.9
4
4.0
3
5.0
0
4.0
7
4.0
7
2.00
3.00
4.00
5.00
NR
I
PIO
Oth
er All
NR
I
PIO
Oth
er All
NR
I
PIO
Oth
er All
NR
I
PIO
Oth
er All
NR
I
PIO
Oth
er All
NR
I
PIO
Oth
er All
18-24 yrs 25-34 yrs 35-44 yrs 45-54 yrs 55-64 yrs above 65 yrs

Motivational Factors of visiting India -
A study based on International Passenger Survey
22 National Council of Applied Economic Research
(4.75) and the lowest was observed in the case of PIOs of age-group 55 to 64
years (2.32).
“Religious places” was the most important motivational factor for PIOs of age
above 65 years. In this age-group, other foreigners also gave high importance to
this motivational factor but NRIs found it the least driving factor for visiting
India.
“Medical treatment, yoga, meditation and spiritual healing” was the most
important motivational factor for other foreigners of age above 65 years. There
were no responses against this factor by NRIs of age above 65 years and PIOs of
age 18 to 24 years. NRIS, by and large, identified this factor as less important
factor across all the age-groups except 45 to 54 years.
Although responses against “Other motivational factors” were not very
significant in number, but the highest proportion of tourists who chose this
factor as one of the five motivational factors gave first rank to it. This resulted in
fairly high composite value for this factor, across all age-groups and all types of
tourists.
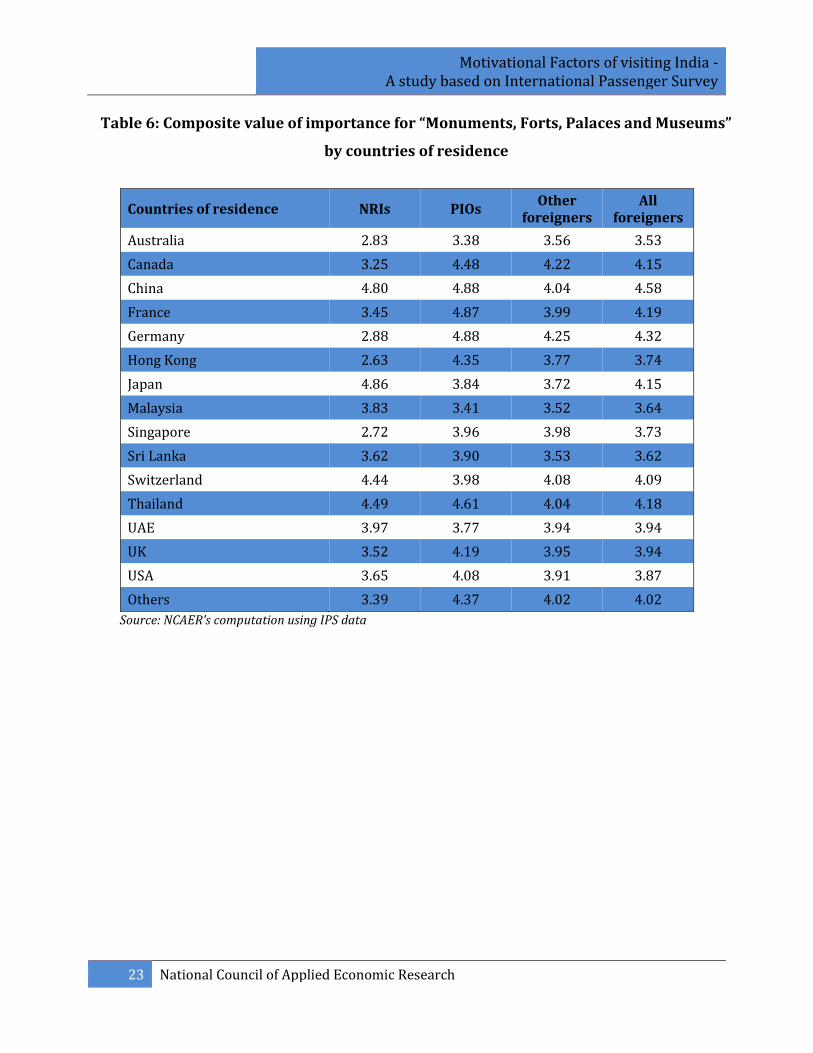
1.41 The similar composite values of importance for each factor are worked out
for tourists of various countries of residence too. These values are given in the tables
below. The countries listed are the top 15 countries in terms of tourists arrivals in India.
Motivational Factors of visiting India -
A study based on International Passenger Survey
23 National Council of Applied Economic Research
Table 6: Composite value of importance for “Monuments, Forts, Palaces and Museums”
by countries of residence
Countries of residence NRIs PIOs Other
foreigners All
foreigners
Australia 2.83 3.38 3.56 3.53
Canada 3.25 4.48 4.22 4.15
China 4.80 4.88 4.04 4.58
France 3.45 4.87 3.99 4.19
Germany 2.88 4.88 4.25 4.32
Hong Kong 2.63 4.35 3.77 3.74
Japan 4.86 3.84 3.72 4.15
Malaysia 3.83 3.41 3.52 3.64
Singapore 2.72 3.96 3.98 3.73
Sri Lanka 3.62 3.90 3.53 3.62
Switzerland 4.44 3.98 4.08 4.09
Thailand 4.49 4.61 4.04 4.18
UAE 3.97 3.77 3.94 3.94
UK 3.52 4.19 3.95 3.94
USA 3.65 4.08 3.91 3.87
Others 3.39 4.37 4.02 4.02
Source: NCAER’s computation using IPS data

Motivational Factors of visiting India -
A study based on International Passenger Survey
24 National Council of Applied Economic Research
Table 7: Composite value of importance for “Hill stations, mountains, beaches, scenic
places” by countries of nationality
Countries of residence NRIs PIOs Other
foreigners All
foreigners
Australia 2.18 3.00 3.66 3.36
Canada 2.45 3.15 3.11 2.99
China 4.96 4.52 3.61 4.39
France 2.99 3.87 3.54 3.50
Germany 2.28 2.69 3.68 3.61
Hong Kong 3.55 - 2.91 3.11
Japan 3.15 3.77 3.36 3.39
Malaysia 4.49 2.23 3.67 3.51
Singapore 2.44 1.99 3.78 3.18
Sri Lanka 3.27 4.85 3.11 4.26
Switzerland 4.41 5.00 3.40 3.45
Thailand 3.26 4.41 4.49 4.46
UAE 2.41 2.76 3.70 3.15
UK 4.10 3.31 3.82 3.85
USA 2.54 3.33 3.47 3.17
Others 3.69 4.77 3.89 4.04
Source: NCAER’s computation using IPS data

Motivational Factors of visiting India -
A study based on International Passenger Survey
25 National Council of Applied Economic Research
Table 8: Composite value of importance for “Religious places” by countries of
nationality
Countries of residence NRIs PIOs Other
foreigners All
foreigners
Australia 2.83 5.00 3.84 3.56
Canada 4.32 3.00 4.16 4.23
China 4.53 3.54 3.96 3.94
France 2.97 1.82 4.39 3.96
Germany 2.52 5.00 4.38 4.36
Hong Kong 4.00 4.21 2.98 3.15
Japan 4.60 3.00 4.13 4.07
Malaysia 3.10 3.11 3.63 3.20
Singapore 3.07 4.82 4.27 3.63
Sri Lanka 3.30 3.74 4.11 3.95
Switzerland 4.61 4.59 4.72 4.68
Thailand 3.16 4.30 4.35 4.30
UAE 3.19 4.25 3.58 3.48
UK 2.85 2.35 3.42 3.31
USA 3.24 3.62 4.29 3.87
Others 3.70 4.47 4.13 4.12
Source: NCAER’s computation using IPS data

Motivational Factors of visiting India -
A study based on International Passenger Survey
26 National Council of Applied Economic Research
Table 9: Composite value of importance for “Medical treatment, yoga, meditation &
spiritual healing” by countries of nationality
Countries of residence NRIs PIOs Other
foreigners All
foreigners
Australia 4.19 4.00 1.76 2.29
Canada - 5.00 1.71 1.77
China 1.84 - 3.90 3.59
France - - 3.64 3.64
Germany 4.00 - 4.14 4.14
Hong Kong 1.00 - 2.99 1.87
Japan - - 3.56 3.56
Malaysia 3.29 5.00 3.97 3.77
Singapore 2.35 - 4.80 4.52
Sri Lanka 2.00 - 2.87 2.59
Switzerland - - 3.95 3.95
Thailand 4.00 4.00 3.72 3.84
UAE 3.20 3.19 4.40 3.94
UK 1.66 2.52 4.17 3.76
USA 3.56 3.99 3.48 3.54
Others 2.44 4.94 4.87 4.62
Source: NCAER’s computation using IPS data

Motivational Factors of visiting India -
A study based on International Passenger Survey
27 National Council of Applied Economic Research
Table 10: Composite value of importance for “Other Motivational factors” by
countries of nationality
Countries of residence NRIs PIOs Other
foreigners All
foreigners
Australia - - 4.26 4.26
Canada 4.69 - 4.70 4.70
China 5.00 5.00 4.79 4.82
France 4.00 4.14 4.42 4.40
Germany - 5.00 4.81 4.81
Hong Kong - 5.00 4.37 4.39
Japan 5.00 5.00 4.81 4.83
Malaysia 4.31 4.05 4.71 4.52
Singapore 4.89 5.00 4.85 4.87
Sri Lanka 4.83 4.00 4.66 4.52
Switzerland - - 4.76 4.76
Thailand - 5.00 4.85 4.86
UAE 4.78 4.88 4.75 4.77
UK 4.84 4.89 4.89 4.88
USA 4.03 4.69 4.85 4.75
Others 4.49 4.67 4.48 4.49
Source: NCAER’s computation using IPS data
1.42 The key findings from the above tables are:
The overall composite value for “monuments, forts, palaces and museums”
among NRIs is the highest (4.86) for tourists coming from Japan followed by
those coming from China. Among PIOs, highest value (4.88) is for tourists
coming from China and Germany followed by France (4.87). Among “Other
foreigners”, tourists from Canada gave the highest value to this factor.

Motivational Factors of visiting India -
A study based on International Passenger Survey
28 National Council of Applied Economic Research
Among those who chose “hill stations, mountains, beaches, scenic places” as one
of the five motivational factors, highest importance was given by NRIs from
China (4.96), PIOs from Switzerland (5.00) and ‘other foreigners’ from Thailand
(4.49).
“Religious places” was a less important motivational factor for NRIs, with its
composite value of importance ranging from 2.52 to 4.61. However, all the PIOs
from Australia who chose this factor as one of the five motivational factors, gave
the first rank to this factor, so that the composite value is 5.00.
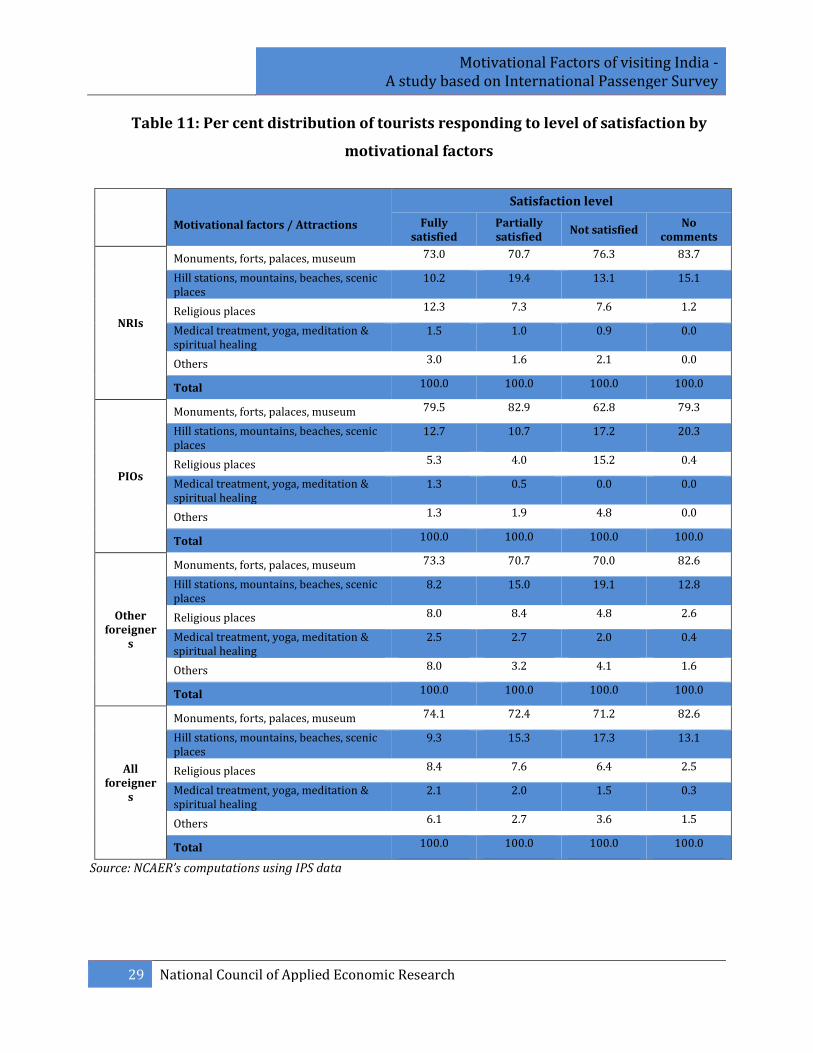
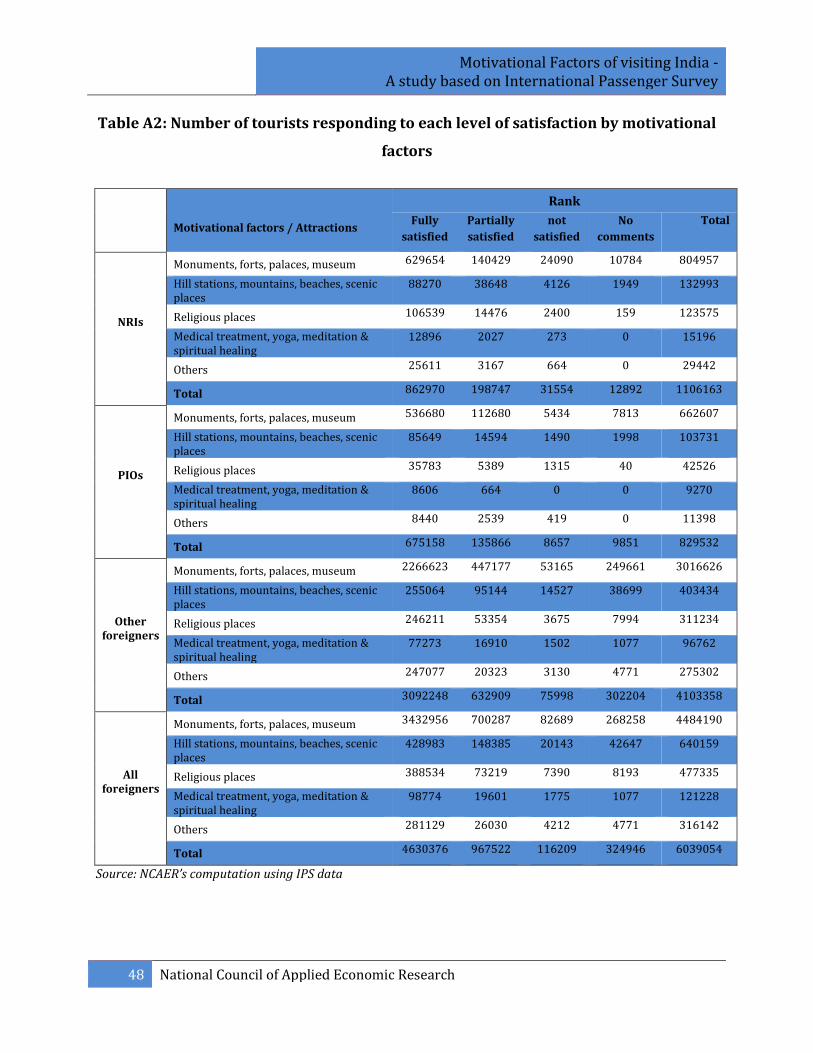
1.43 Apart from the rank, the respondents were also asked to indicate their level
of satisfaction pertaining to these factors by giving responses ranging from “Fully
satisfied”, “Satisfied”, “Not satisfied” to “No comments”. The following table presents the
per cent distribution of number of tourists giving their responses on level of satisfaction
for each factor of motivation. The absolute numbers for this table are given in Appendix
Table A2.
Motivational Factors of visiting India -
A study based on International Passenger Survey
29 National Council of Applied Economic Research
Table 11: Per cent distribution of tourists responding to level of satisfaction by
motivational factors
Motivational factors / Attractions
Satisfaction level
Fully satisfied
Partially satisfied
Not satisfied No
comments
NRIs
Monuments, forts, palaces, museum 73.0 70.7 76.3 83.7
Hill stations, mountains, beaches, scenic places
10.2 19.4 13.1 15.1
Religious places 12.3 7.3 7.6 1.2
Medical treatment, yoga, meditation & spiritual healing
1.5 1.0 0.9 0.0
Others 3.0 1.6 2.1 0.0
Total 100.0 100.0 100.0 100.0
PIOs
Monuments, forts, palaces, museum 79.5 82.9 62.8 79.3
Hill stations, mountains, beaches, scenic places
12.7 10.7 17.2 20.3
Religious places 5.3 4.0 15.2 0.4
Medical treatment, yoga, meditation & spiritual healing
1.3 0.5 0.0 0.0
Others 1.3 1.9 4.8 0.0
Total 100.0 100.0 100.0 100.0
Other foreigner
s
Monuments, forts, palaces, museum 73.3 70.7 70.0 82.6
Hill stations, mountains, beaches, scenic places
8.2 15.0 19.1 12.8
Religious places 8.0 8.4 4.8 2.6
Medical treatment, yoga, meditation & spiritual healing
2.5 2.7 2.0 0.4
Others 8.0 3.2 4.1 1.6
Total 100.0 100.0 100.0 100.0
All foreigner
s
Monuments, forts, palaces, museum 74.1 72.4 71.2 82.6
Hill stations, mountains, beaches, scenic places
9.3 15.3 17.3 13.1
Religious places 8.4 7.6 6.4 2.5
Medical treatment, yoga, meditation & spiritual healing
2.1 2.0 1.5 0.3
Others 6.1 2.7 3.6 1.5
Total 100.0 100.0 100.0 100.0
Source: NCAER’s computations using IPS data
Motivational Factors of visiting India -
A study based on International Passenger Survey
30 National Council of Applied Economic Research
1.44 Similarly, row distribution gives the proportion of tourists responding to
each response of level of satisfaction amongst all the tourists who responded for each
factor. The row distribution is given in Table 12:

Motivational Factors of visiting India -
A study based on International Passenger Survey
31 National Council of Applied Economic Research
Table 12: Per cent distribution of tourists by different responses of satisfaction
level
Motivational factors / Attractions
Satisfaction level
Fully satisfied
Partially satisfied
Not satisfied No
comments
NRIs
Monuments, forts, palaces, museum 78.2 17.4 3.0 1.3
Hill stations, mountains, beaches, scenic places
66.4 29.1 3.1 1.5
Religious places 86.2 11.7 1.9 0.1
Medical treatment, yoga, meditation & spiritual healing
84.9 13.3 1.8 0.0
Others 87.0 10.8 2.3 0.0
Total 78.0 18.0 2.9 1.2
PIOs
Monuments, forts, palaces, museum 81.0 17.0 0.8 1.2
Hill stations, mountains, beaches, scenic places
82.6 14.1 1.4 1.9
Religious places 84.1 12.7 3.1 0.1
Medical treatment, yoga, meditation & spiritual healing
92.8 7.2 0.0 0.0
Others 74.1 22.3 3.7 0.0
Total 81.4 16.4 1.0 1.2
Other foreigner
s
Monuments, forts, palaces, museum 75.1 14.8 1.8 8.3
Hill stations, mountains, beaches, scenic places
63.2 23.6 3.6 9.6
Religious places 79.1 17.1 1.2 2.6
Medical treatment, yoga, meditation & spiritual healing
79.9 17.5 1.6 1.1
Others 89.7 7.4 1.1 1.7
Total 75.4 15.4 1.9 7.4
All foreigner
s
Monuments, forts, palaces, museum 76.6 15.6 1.8 6.0
Hill stations, mountains, beaches, scenic places
67.0 23.2 3.1 6.7
Religious places 81.4 15.3 1.5 1.7
Medical treatment, yoga, meditation & spiritual healing
81.5 16.2 1.5 0.9
Others 88.9 8.2 1.3 1.5
Total 76.7 16.0 1.9 5.4
Source: NCAER’s computations using IPS data

Motivational Factors of visiting India -
A study based on International Passenger Survey
32 National Council of Applied Economic Research
1.45 As done before, “composite value of satisfaction level” has also been
computed and is described below.
Methodology for deriving “composite value of satisfaction level”
1.46 The responses - “Fully satisfied”, “Satisfied”, “Not satisfied” and “No
comments” are assigned values 3, 1, -1 and 0 respectively. A negative value, -1, is chosen
for “Not satisfied” so that the overall value is deflated by the adverse level of
satisfaction.
1.47 The weighted average of these values is calculated using the number of
responses as weights. This is called the composite value of satisfaction level. The
interpretation of these composite values of satisfaction level is that higher its value,
higher the level of satisfaction for respective motivational factor ranked by tourists,
belonging to a specific category. The following figures present the composite values of
satisfaction level for each motivational factor by different age-groups.
Figure 7: Composite value of satisfaction level for “Monuments, Forts, Palaces and
Museums” by age-groups
Source: NCAER’s computations using IPS data
2.6
6
2.8
0
2.5
2
2.5
9
1.9
2
2.6
5
2.4
6
2.4
0 2.5
7
2.3
1
2.3
0
2.3
5
2.6
7
2.7
7
2.3
5
2.4
7
2.8
3
2.8
5
2.4
7
2.5
7 2
.97
2.4
6
1.8
8
2.5
7
1.00
2.00
3.00
NR
I
PIO
Oth
er All
NR
I
PIO
Oth
er All
NR
I
PIO
Oth
er All
NR
I
PIO
Oth
er All
NR
I
PIO
Oth
er All
NR
I
PIO
Oth
er All
18-24 yrs 25-34 yrs 35-44 yrs 45-54 yrs 55-64 yrs above 65 yrs

Motivational Factors of visiting India -
A study based on International Passenger Survey
33 National Council of Applied Economic Research
Figure 8: Composite value of satisfaction level for “Hill stations, mountains, beaches,
scenic places” by age-groups
Source: NCAER’s computations using IPS data
Figure 9: Composite value of satisfaction level for “Religious places” by age-groups
Source: NCAER’s computations using IPS data
2.8
6
2.2
6
2.2
2
2.3
8
2.1
2
2.7
6
1.9
5
2.2
4
1.8
8
2.0
1
2.0
9
2.0
3
2.3
7 2.5
5
2.1
2
2.2
1
2.8
7
2.8
1
2.3
3 2.5
0
2.3
9
2.5
4
2.1
1
2.2
7
1.00
2.00
3.00
NR
I
PIO
Oth
er All
NR
I
PIO
Oth
er All
NR
I
PIO
Oth
er All
NR
I
PIO
Oth
er All
NR
I
PIO
Oth
er All
NR
I
PIO
Oth
er All
18-24 yrs 25-34 yrs 35-44 yrs 45-54 yrs 55-64 yrs above 65 yrs
2.7
1
2.7
3
2.7
7
2.7
6
2.1
2 2
.36
2.4
3
2.3
7
2.6
6
2.5
9
2.6
0
2.6
2 2.8
7
2.7
1
2.5
8
2.7
2
2.9
4
2.9
6
2.4
3
2.5
5
2.3
2
3.0
0
2.4
2
2.5
6
1.00
2.00
3.00
NR
I
PIO
Oth
er All
NR
I
PIO
Oth
er All
NR
I
PIO
Oth
er All
NR
I
PIO
Oth
er All
NR
I
PIO
Oth
er All
NR
I
PIO
Oth
er All
18-24 yrs 25-34 yrs 35-44 yrs 45-54 yrs 55-64 yrs above 65 yrs

Motivational Factors of visiting India -
A study based on International Passenger Survey
34 National Council of Applied Economic Research
Figure 10: Composite value of satisfaction level for “Medical treatment, yoga,
meditation & spiritual healing” by age-groups
Source: NCAER’s computations using IPS data
Figure 11: Composite value of satisfaction level for “Other Motivational Factors” by
age-groups
Source: NCAER’s computations using IPS data
3.0
0
0.0
0
2.2
8
2.3
6
2.0
2
2.8
3
2.4
7
2.5
0 2
.87
2.8
1
2.6
5
2.7
1
2.9
7
3.0
0
2.8
5
2.8
6
1.5
8
3.0
0
1.9
0
1.9
4
0.0
0
3.0
0
2.7
8
2.8
1
0.00
1.00
2.00
3.00
NR
I
PIO
Oth
er All
NR
I
PIO
Oth
er All
NR
I
PIO
Oth
er All
NR
I
PIO
Oth
er All
NR
I
PIO
Oth
er All
NR
I
PIO
Oth
er All
18-24 yrs 25-34 yrs 35-44 yrs 45-54 yrs 55-64 yrs above 65 yrs
1.6
5
2.8
6
2.9
1
2.8
9
2.8
6
2.9
2
2.6
0
2.7
0
2.8
5
2.2
3
2.7
4
2.7
1
2.4
5
2.6
3
2.8
4
2.8
1
1.9
6
2.5
8
2.5
6
2.5
4
0.0
0
3.0
0
2.9
2
2.9
2
0.00
1.00
2.00
3.00
NR
I
PIO
Oth
er All
NR
I
PIO
Oth
er All
NR
I
PIO
Oth
er All
NR
I
PIO
Oth
er All
NR
I
PIO
Oth
er All
NR
I
PIO
Oth
er All
18-24 yrs 25-34 yrs 35-44 yrs 45-54 yrs 55-64 yrs above 65 yrs
Motivational Factors of visiting India -
A study based on International Passenger Survey
35 National Council of Applied Economic Research
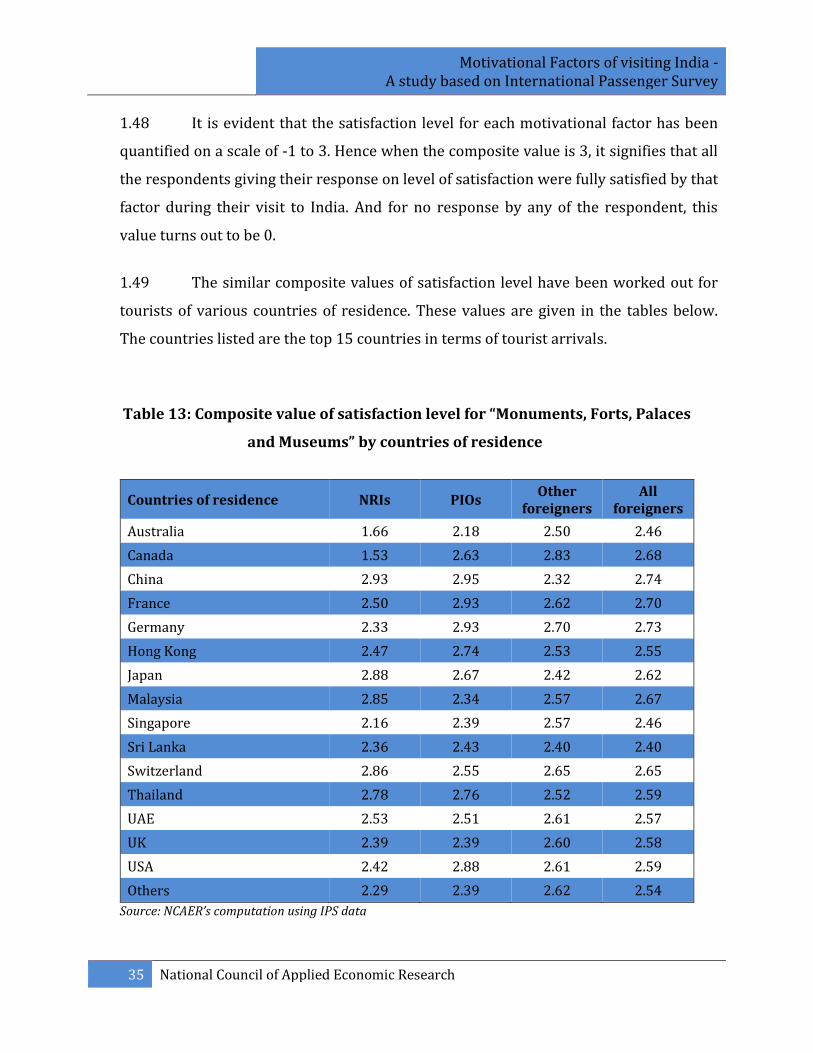
1.48 It is evident that the satisfaction level for each motivational factor has been
quantified on a scale of -1 to 3. Hence when the composite value is 3, it signifies that all
the respondents giving their response on level of satisfaction were fully satisfied by that
factor during their visit to India. And for no response by any of the respondent, this
value turns out to be 0.
1.49 The similar composite values of satisfaction level have been worked out for
tourists of various countries of residence. These values are given in the tables below.
The countries listed are the top 15 countries in terms of tourist arrivals.
Table 13: Composite value of satisfaction level for “Monuments, Forts, Palaces
and Museums” by countries of residence
Countries of residence NRIs PIOs Other
foreigners All
foreigners
Australia 1.66 2.18 2.50 2.46
Canada 1.53 2.63 2.83 2.68
China 2.93 2.95 2.32 2.74
France 2.50 2.93 2.62 2.70
Germany 2.33 2.93 2.70 2.73
Hong Kong 2.47 2.74 2.53 2.55
Japan 2.88 2.67 2.42 2.62
Malaysia 2.85 2.34 2.57 2.67
Singapore 2.16 2.39 2.57 2.46
Sri Lanka 2.36 2.43 2.40 2.40
Switzerland 2.86 2.55 2.65 2.65
Thailand 2.78 2.76 2.52 2.59
UAE 2.53 2.51 2.61 2.57
UK 2.39 2.39 2.60 2.58
USA 2.42 2.88 2.61 2.59
Others 2.29 2.39 2.62 2.54
Source: NCAER’s computation using IPS data
Motivational Factors of visiting India -
A study based on International Passenger Survey
36 National Council of Applied Economic Research
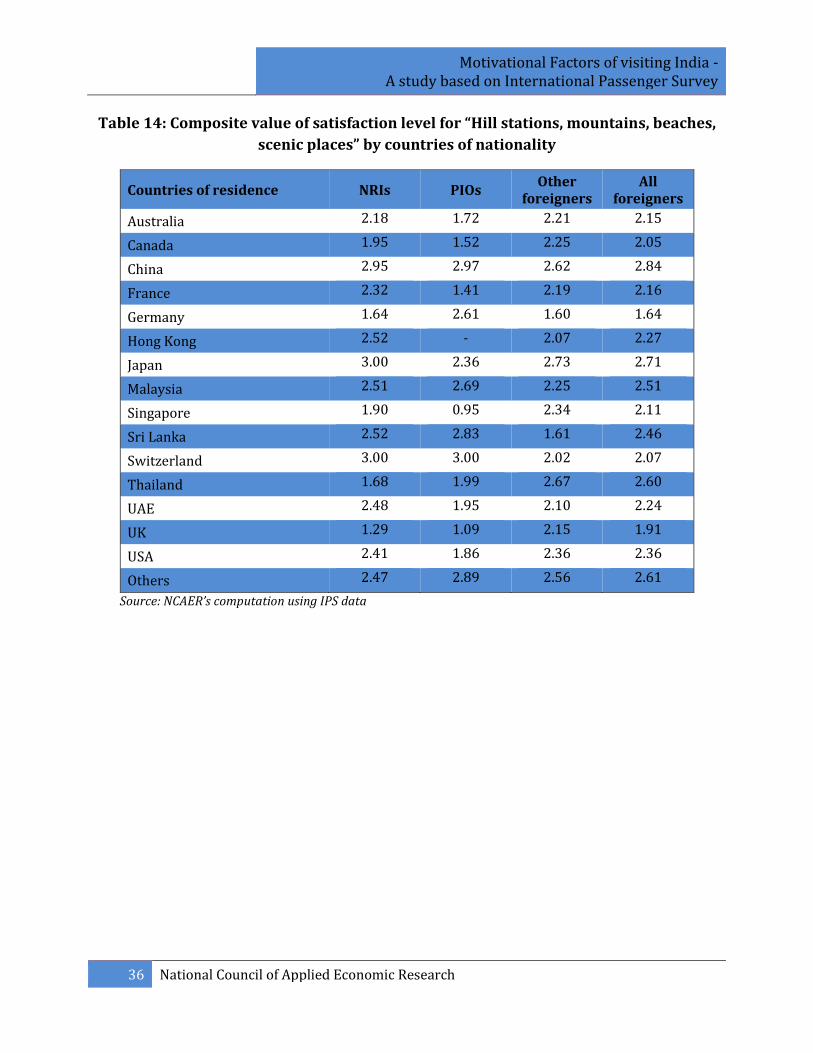
Table 14: Composite value of satisfaction level for “Hill stations, mountains, beaches,
scenic places” by countries of nationality
Countries of residence NRIs PIOs Other
foreigners All
foreigners
Australia 2.18 1.72 2.21 2.15
Canada 1.95 1.52 2.25 2.05
China 2.95 2.97 2.62 2.84
France 2.32 1.41 2.19 2.16
Germany 1.64 2.61 1.60 1.64
Hong Kong 2.52 - 2.07 2.27
Japan 3.00 2.36 2.73 2.71
Malaysia 2.51 2.69 2.25 2.51
Singapore 1.90 0.95 2.34 2.11
Sri Lanka 2.52 2.83 1.61 2.46
Switzerland 3.00 3.00 2.02 2.07
Thailand 1.68 1.99 2.67 2.60
UAE 2.48 1.95 2.10 2.24
UK 1.29 1.09 2.15 1.91
USA 2.41 1.86 2.36 2.36
Others 2.47 2.89 2.56 2.61
Source: NCAER’s computation using IPS data

Motivational Factors of visiting India -
A study based on International Passenger Survey
37 National Council of Applied Economic Research
Table 15: Composite value of satisfaction level for “Religious places” by countries of
nationality
Countries of residence NRIs PIOs Other
foreigners All
foreigners
Australia 3.00 3.00 2.63 2.80
Canada 1.93 3.00 1.94 1.94
China 2.05 3.00 2.68 2.69
France 1.91 1.33 2.25 2.12
Germany 2.05 3.00 2.18 2.23
Hong Kong 3.00 2.21 2.31 2.36
Japan 3.00 3.00 2.97 2.98
Malaysia 2.90 2.97 2.70 2.87
Singapore 2.63 3.00 2.73 2.68
Sri Lanka 1.72 2.11 2.59 2.40
Switzerland 2.23 2.18 2.23 2.22
Thailand 3.00 2.27 2.65 2.65
UAE 2.63 2.79 2.22 2.44
UK 2.31 0.03 2.35 2.20
USA 2.50 2.72 2.43 2.48
Others 2.48 2.85 2.71 2.70
Source: NCAER’s computation using IPS data
Motivational Factors of visiting India -
A study based on International Passenger Survey
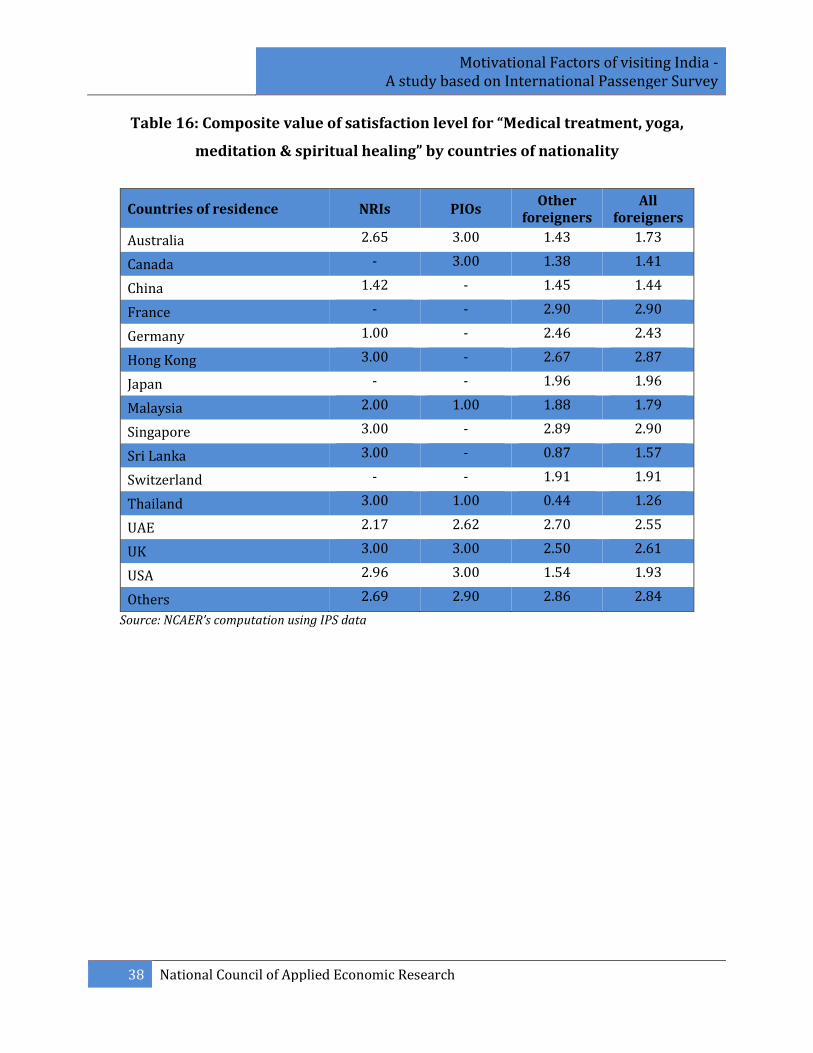
38 National Council of Applied Economic Research
Table 16: Composite value of satisfaction level for “Medical treatment, yoga,
meditation & spiritual healing” by countries of nationality
Countries of residence NRIs PIOs Other
foreigners All
foreigners
Australia 2.65 3.00 1.43 1.73
Canada - 3.00 1.38 1.41
China 1.42 - 1.45 1.44
France - - 2.90 2.90
Germany 1.00 - 2.46 2.43
Hong Kong 3.00 - 2.67 2.87
Japan - - 1.96 1.96
Malaysia 2.00 1.00 1.88 1.79
Singapore 3.00 - 2.89 2.90
Sri Lanka 3.00 - 0.87 1.57
Switzerland - - 1.91 1.91
Thailand 3.00 1.00 0.44 1.26
UAE 2.17 2.62 2.70 2.55
UK 3.00 3.00 2.50 2.61
USA 2.96 3.00 1.54 1.93
Others 2.69 2.90 2.86 2.84
Source: NCAER’s computation using IPS data

Motivational Factors of visiting India -
A study based on International Passenger Survey
39 National Council of Applied Economic Research
Table 17: Composite value of satisfaction level for “Other Motivational factors” by
countries of nationality
Countries of residence NRIs PIOs Other
foreigners All
foreigners
Australia - - 2.06 2.06
Canada 2.76 - 2.99 2.95
China 3.00 1.93 2.89 2.82
France 1.00 1.28 2.72 2.63
Germany - 2.12 2.92 2.91
Hong Kong - 1.00 2.82 2.76
Japan 2.19 2.18 2.53 2.49
Malaysia 2.06 0.39 2.74 2.29
Singapore 3.00 1.25 2.74 2.77
Sri Lanka 3.00 2.23 0.34 2.02
Switzerland - - 2.84 2.84
Thailand - 3.00 2.80 2.80
UAE 2.87 2.29 2.52 2.58
UK 3.00 1.54 2.86 2.89
USA 2.50 2.78 2.80 2.77
Others 2.59 2.76 2.85 2.83
Source: NCAER’s computation using IPS data
1.50 The key findings from the above exhibits are:
The overall composite value of satisfaction level for “monuments, forts, palaces
and museums” is the highest (2.97) among NRIs of age above 65 years. However,
the lowest value (1.88) is observed among “other foreigners” in the same age-
group.
For “religious places”, the composite value for all types of tourists and of all the
age groups is above 2.0 and is the highest (3.0) among PIOs of age above 65
years.

Motivational Factors of visiting India -
A study based on International Passenger Survey
40 National Council of Applied Economic Research
For three categories like NRIs of age-group 18 to 24 years, PIOs of age-group 55
to 64 years and PIOs of age-group above 65 years, , although the number of
respondents for “medical treatment, yoga, meditation & spiritual healing” is very
low, but all of them were fully satisfied. Hence the composite value is 3.0 for all
of these three categories.
The overall composite value of satisfaction for “monuments, forts, palaces and
museums” among NRIs is the highest (2.93) for tourists coming from China
closely followed by those coming from Japan (2.88), Switzerland (2.86) and
Malaysia (2.85). Among PIOs, highest value (2.95) is for tourists coming from
China followed by France and Germany (2.93 for each country). Among “Other
foreigners”, tourists from Canada gave the highest value (2.83) to this factor.
Among those who chose “hill stations, mountains, beaches, scenic places” as one
of the five motivational factors, most satisfied were the NRIs from Japan (3.00),
PIOs from Switzerland (3.00) and ‘other foreigners’ from Japan (2.73).
“Religious places” was very satisfactory motivational factor for NRIs from
Australia, Hong Kong, Japan, and Thailand with its composite value of
satisfaction being 3.00 which means all the NRIs from these countries who chose
this factor as one of the five motivational factors, were fully satisfied by this
factor, so that the composite value is 3.00. Similarly, satisfaction index value for
PIOs from Australia, Canada, China, Germany, Japan and Singapore is also 3.00
which indicate the full satisfaction of PIOs coming from these countries with
“Religious Places” as their motivational factor. However, other foreigners were
less satisfied with “Religious Places” and value of satisfaction index score ranges
from 1.94 to 2.97.

Motivational Factors of visiting India -
A study based on International Passenger Survey
41 National Council of Applied Economic Research
Concluding Remarks
1.51 The purpose of this study was to determine the main reasons that motivate
the foreign tourists to visit India. India is one of the few countries that offers a wide
range of destinations for potential tourists. People visit India for various reasons - to
spectacle the miraculous beauty of monuments, forts and palaces which reflect India’s
ancient culture and heritage; to admire the bounties of scenic beauty offered by ranges
of mountains, hills; to stretch out on the serene sands of Indian beaches; to explore the
panorama of wildlife; to seek spiritual solace at many holy places; to practice yoga and
attain eternal peace and so on.
1.52 This study is meant to give inputs to tourism marketers on what are the most
driving factors that motivate the tourists to visit India. The results indicate that a
significant number of tourists chose “monuments, forts, palaces and museums” as one
of the five motivational factors to visit India, hence can be considered as the most
sought after destination but this is not the most important motivational factor as the
proportion of tourists giving first rank to this factor is only 50 per cent.
1.53 To get a better understanding of this, composite values of importance and
satisfaction are computed for each type of tourists across both age-groups and
countries of residence. These values are the weighted average of responses against each
rank.
1.54 The study infers that the importance of each factor varies across age-groups
and countries of residence. While “monuments, forts, palaces and museums” are the
most popular destinations, other destinations like hill stations, beaches, religious
places, etc should also be promoted and developed to match with other Asian countries
that offer similar destinations.

Motivational Factors of visiting India -
A study based on International Passenger Survey
42 National Council of Applied Economic Research

Motivational Factors of visiting India -
A study based on International Passenger Survey
43 National Council of Applied Economic Research
References
Alexandra, V. (2013). “Consumer behavior in tourism and the influencing factors of the
decision making process”, Revista Economica, 65(2), 186-198
Andreu, L., Kozac, M., Avci, N., and Cifter, N. (2005). “Market segmentation by motivations
to travel: British tourists visiting Turkey”’ Journal of Travel and Tourism Marketing, 19(1),
1-14.
Crompton, John L. (1979). “Motivations for Pleasure Vacation”, Annals of Tourism Research,
6, 408-424.
Gee, C., Choy, D., and Makins, J. (1984). The Travel Industry, second edition, New York, Van
Nostrand Reinhold.
Guha, S. (2009). "Motivational push factors for visiting reenactment sites”, Master's Theses.
Paper 3704.
Johnsson, C. and Dwayne Devonish (2008). “Does nationality, gender, and age Affect travel
motivation? A case of Visitors to the Caribbean island of Barbados”, Journal of Travel &
Tourism Marketing, 25(3–4), 398-408.
Kassean, H. and Rhaalib Gassita (2013).” Exploring tourists push and pull motivations to
visit Mauritius as a tourist destination”, African Journal of Hospitality, Tourism and Leisure,
2 (3), 1-13.
Lam, T., and Hsu, C. H. C. (2006), “Predicting Behavioral Intention of Choosing a Travel
Destination”, Tourism Management, 27(4), 589-599.
Vuuren, C. V. and Slabbert, E. (2011). “Travel motivations and behaviour of tourists to a
south african resort”, Book of proceedings– International conference on tourism &
management studies – Algarve, 1, 295-304

Motivational Factors of visiting India -
A study based on International Passenger Survey
44 National Council of Applied Economic Research

Motivational Factors of visiting India -
A study based on International Passenger Survey
45 National Council of Applied Economic Research
APPENDIX TABLES

Motivational Factors of visiting India -
A study based on International Passenger Survey
46 National Council of Applied Economic Research

Motivational Factors of visiting India -
A study based on International Passenger Survey
47 National Council of Applied Economic Research
Table A1: Number of tourists responding to each rank by motivational factors
Motivational factors / Attractions
Rank
1 2 3 4 5
NRIs
Monuments, forts, palaces, museum 422481 66152 144285 75749 96122
Hill stations, mountains, beaches, scenic places
53583 15908 13236 22935 27331
Religious places 20319 19920 62301 10212 10823
Medical treatment, yoga, meditation & spiritual healing
2418 2538 1044 7150 2046
Others 20763 5069 3486 0 125
Total 519564 109586 224352 116047 136446
PIOs
Monuments, forts, palaces, museum 431360 103235 73647 32932 21673
Hill stations, mountains, beaches, scenic places
74450 6016 4361 9848 9057
Religious places 21063 6368 7189 5252 2654
Medical treatment, yoga, meditation & spiritual healing
7009 1027 950 283 0
Others 7883 2791 724 0 0
Total 541765 119437 86872 48315 33384
Other foreigners
Monuments, forts, palaces, museum 1423316 735455 371175 271229 216030
Hill stations, mountains, beaches, scenic places
151743 114656 57829 37080 42126
Religious places 158183 54693 58513 27100 13000
Medical treatment, yoga, meditation & spiritual healing
74025 5147 9706 1074 6859
Others 203277 44517 18160 4741 4534
Total 2010544 954468 515382 341224 282548
All foreigners
Monuments, forts, palaces, museum 2277156 904841 589107 379910 333825
Hill stations, mountains, beaches, scenic places
279776 136580 75426 69863 78514
Religious places 199565 80981 128003 42564 26477
Medical treatment, yoga, meditation & spiritual healing
83452 8712 11700 8508 8905
Others 231923 52377 22370 4741 4658
Total 3071872 1183490 826606 505586 452378
Source: NCAER’s computation using IPS data
Motivational Factors of visiting India -
A study based on International Passenger Survey
48 National Council of Applied Economic Research
Table A2: Number of tourists responding to each level of satisfaction by motivational
factors
Motivational factors / Attractions
Rank
Fully
satisfied
Partially
satisfied
not
satisfied
No
comments
Total
NRIs
Monuments, forts, palaces, museum 629654 140429 24090 10784 804957
Hill stations, mountains, beaches, scenic places
88270 38648 4126 1949 132993
Religious places 106539 14476 2400 159 123575
Medical treatment, yoga, meditation & spiritual healing
12896 2027 273 0 15196
Others 25611 3167 664 0 29442
Total 862970 198747 31554 12892 1106163
PIOs
Monuments, forts, palaces, museum 536680 112680 5434 7813 662607
Hill stations, mountains, beaches, scenic places
85649 14594 1490 1998 103731
Religious places 35783 5389 1315 40 42526
Medical treatment, yoga, meditation & spiritual healing
8606 664 0 0 9270
Others 8440 2539 419 0 11398
Total 675158 135866 8657 9851 829532
Other foreigners
Monuments, forts, palaces, museum 2266623 447177 53165 249661 3016626
Hill stations, mountains, beaches, scenic places
255064 95144 14527 38699 403434
Religious places 246211 53354 3675 7994 311234
Medical treatment, yoga, meditation & spiritual healing
77273 16910 1502 1077 96762
Others 247077 20323 3130 4771 275302
Total 3092248 632909 75998 302204 4103358
All foreigners
Monuments, forts, palaces, museum 3432956 700287 82689 268258 4484190
Hill stations, mountains, beaches, scenic places
428983 148385 20143 42647 640159
Religious places 388534 73219 7390 8193 477335
Medical treatment, yoga, meditation & spiritual healing
98774 19601 1775 1077 121228
Others 281129 26030 4212 4771 316142
Total 4630376 967522 116209 324946 6039054
Source: NCAER’s computation using IPS data
